Cognition of Graphical Notation for Processing Data in ERDAS IMAGINE
Abstract
:1. Introduction
- The graphical form of the design translates information more efficiently and faster for non-technical users than descriptive text [4].
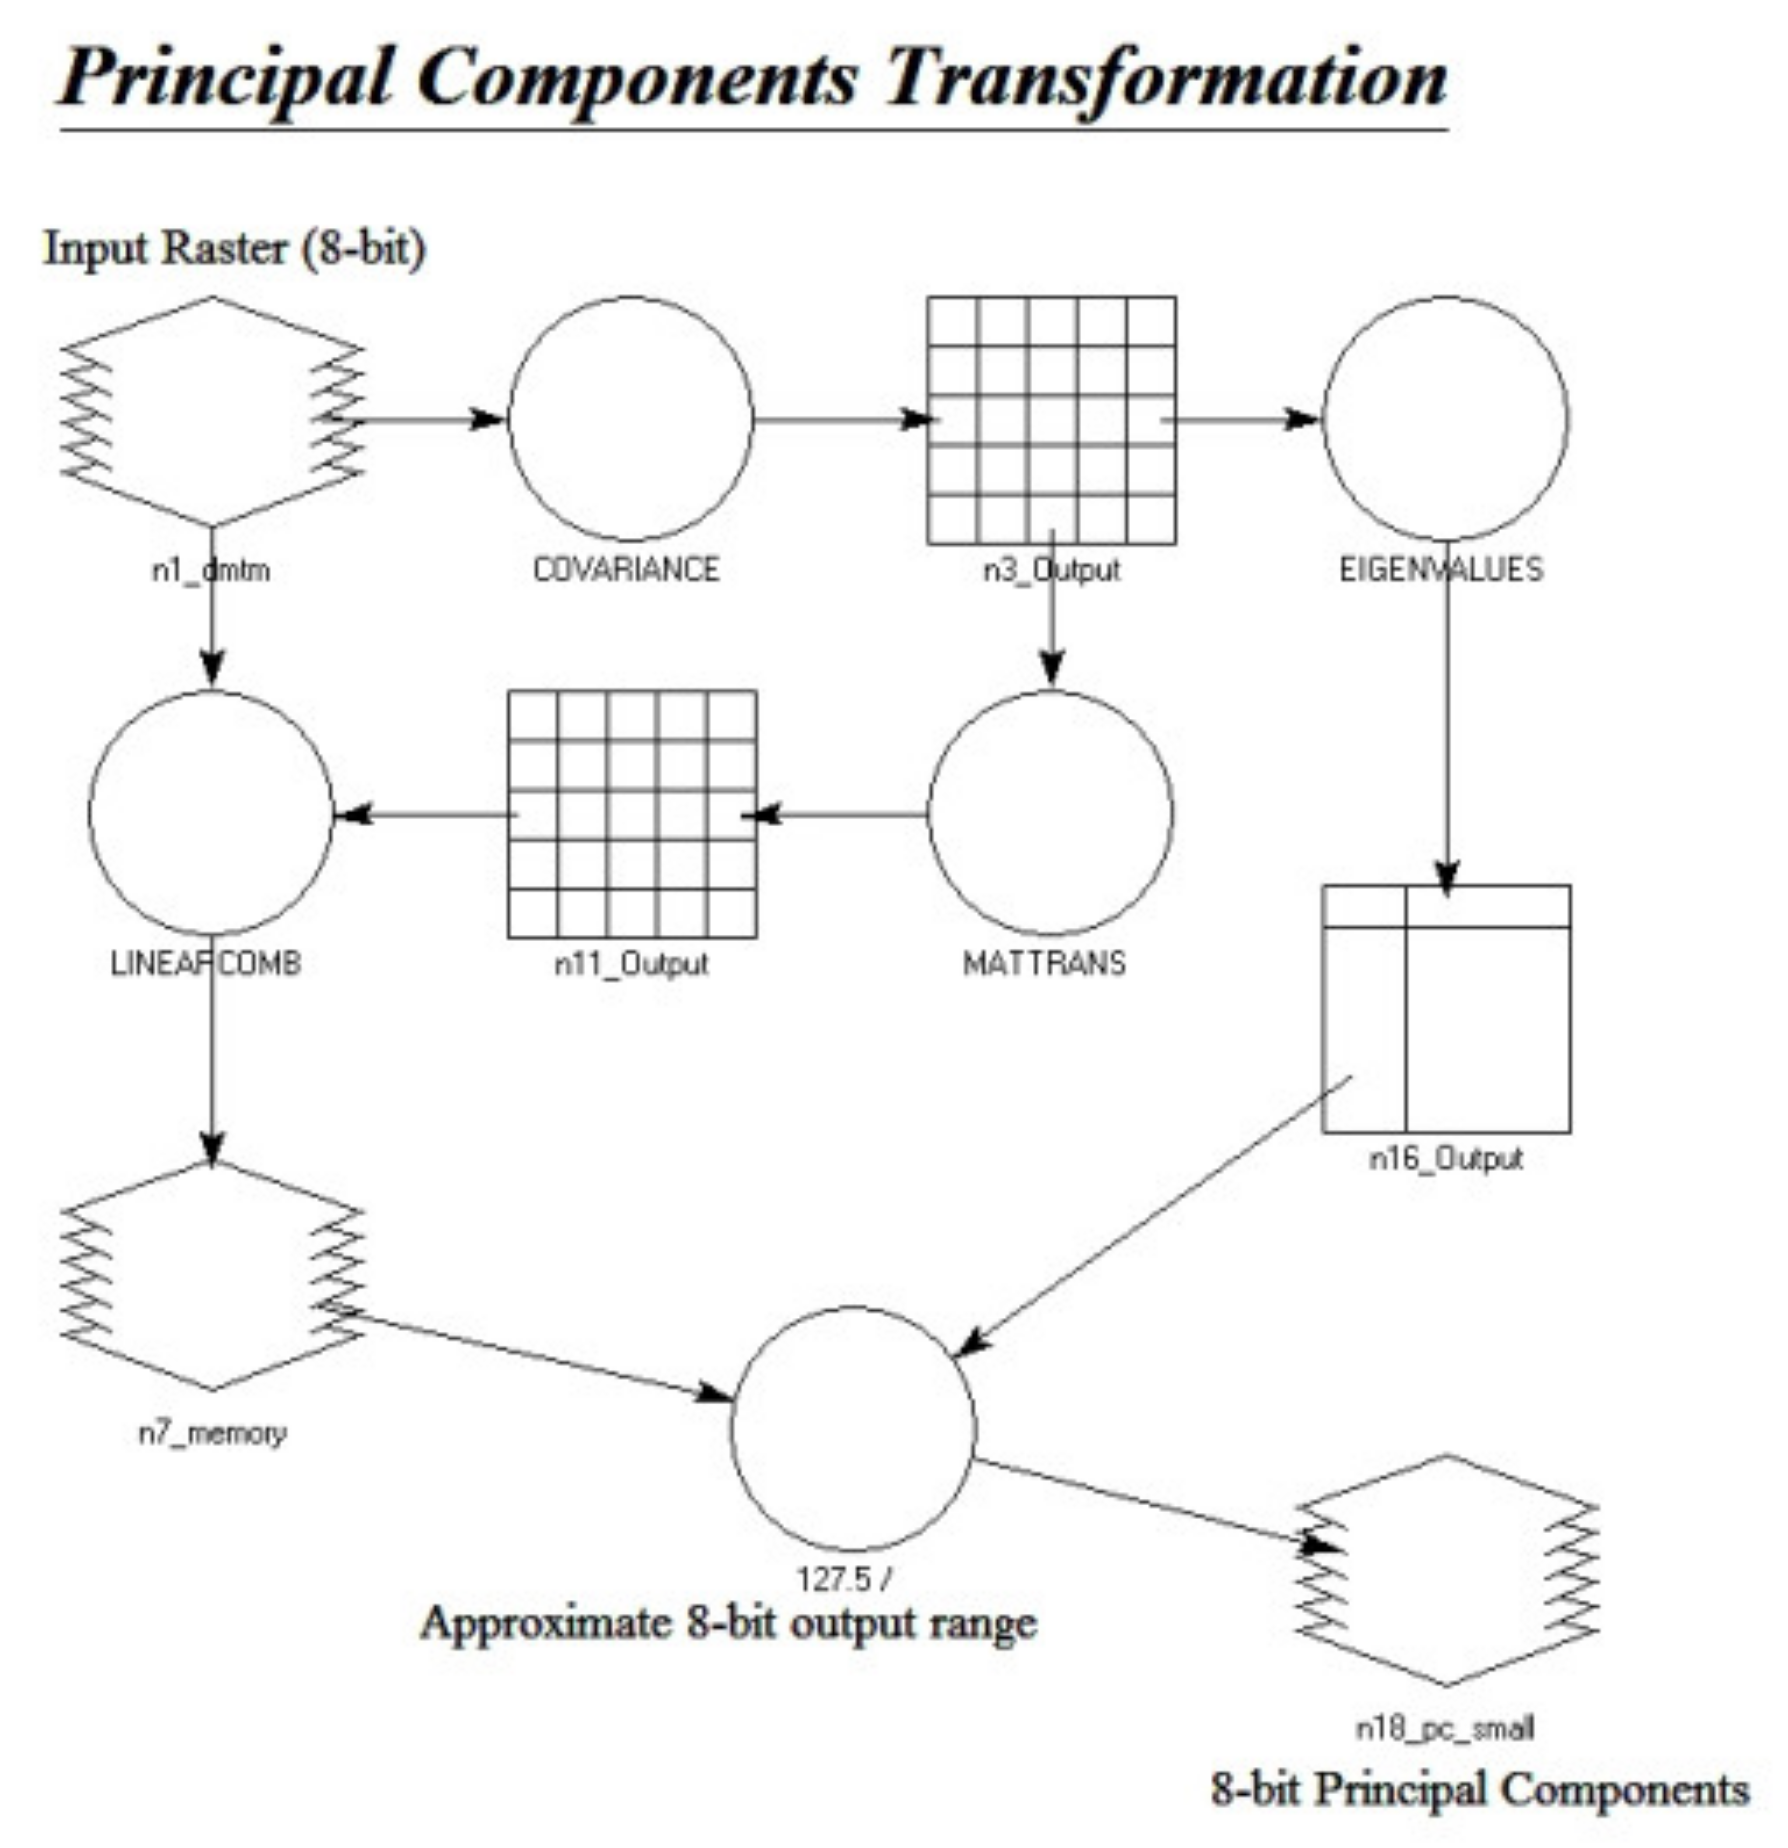
- Textual programming languages encode information as a sequence of characters, while visual languages encode information using the spatial layout of graphic (or text) elements. Text information is linear one-dimensional. Visual representation is two-dimensional (spatial).
- Visual representation is treated differently to textual information, according to the dual channel theory [5], which states that the human brain has a separate part for processing image information and another part for processing verbal information. The visual representation is processed in parallel in one part, while the text is processed serially in another part of the brain [6].
- Image information is better remembered as the so-called picture superiority effect, which states that an image is more easily symbolically encoded in the brain and can be searched for faster than text [7]. This effect was based on the work of psychologist Paivio, the author of the dual coding theory [8].
1.1. History of Model Maker and Spatial Model Editor in ERDAS IMAGINE
1.2. The Utilization of Models in Practice
- Experts create the process once, and other users can utilize it repetitively;
- The models could be distributed to non-experts;
- Prepared models save time, money and resources;
- Processing data using the same models introduce standardization and consistency.
2. Materials and Methods
2.1. Terminology of Visual Programming Languages
2.2. Physics of Notations Theory
- Principle of Semiotic Clarity,
- Principle of Perceptual Discriminability,
- Principle of Visual Expressiveness,
- Principle of Dual Coding,
- Principle of Semantic Transparency,
- Principle of Graphic Economy,
- Principle of Complexity Management,
- Principle of Cognitive Integration,
- Principle of Cognitive Fit.
2.3. Eye-Tracking Testing
3. Results of Evaluation of Spatial Model Editor
3.1. Evaluation Based on the Physics of Notations Theory
3.1.1. Principle of Semiotic Clarity
3.1.2. Principle of Perceptual Discriminability
3.1.3. Principle of Visual Expressiveness
3.1.4. Principle of Graphic Economy
3.1.5. Principle of Dual Coding
3.1.6. Principle of Semantic Transparency
3.1.7. Principle of Complexity Management
3.1.8. Principle of Cognitive Interaction
3.1.9. Principle of Cognitive Fit
3.2. Eye-Tracking Testing of Models
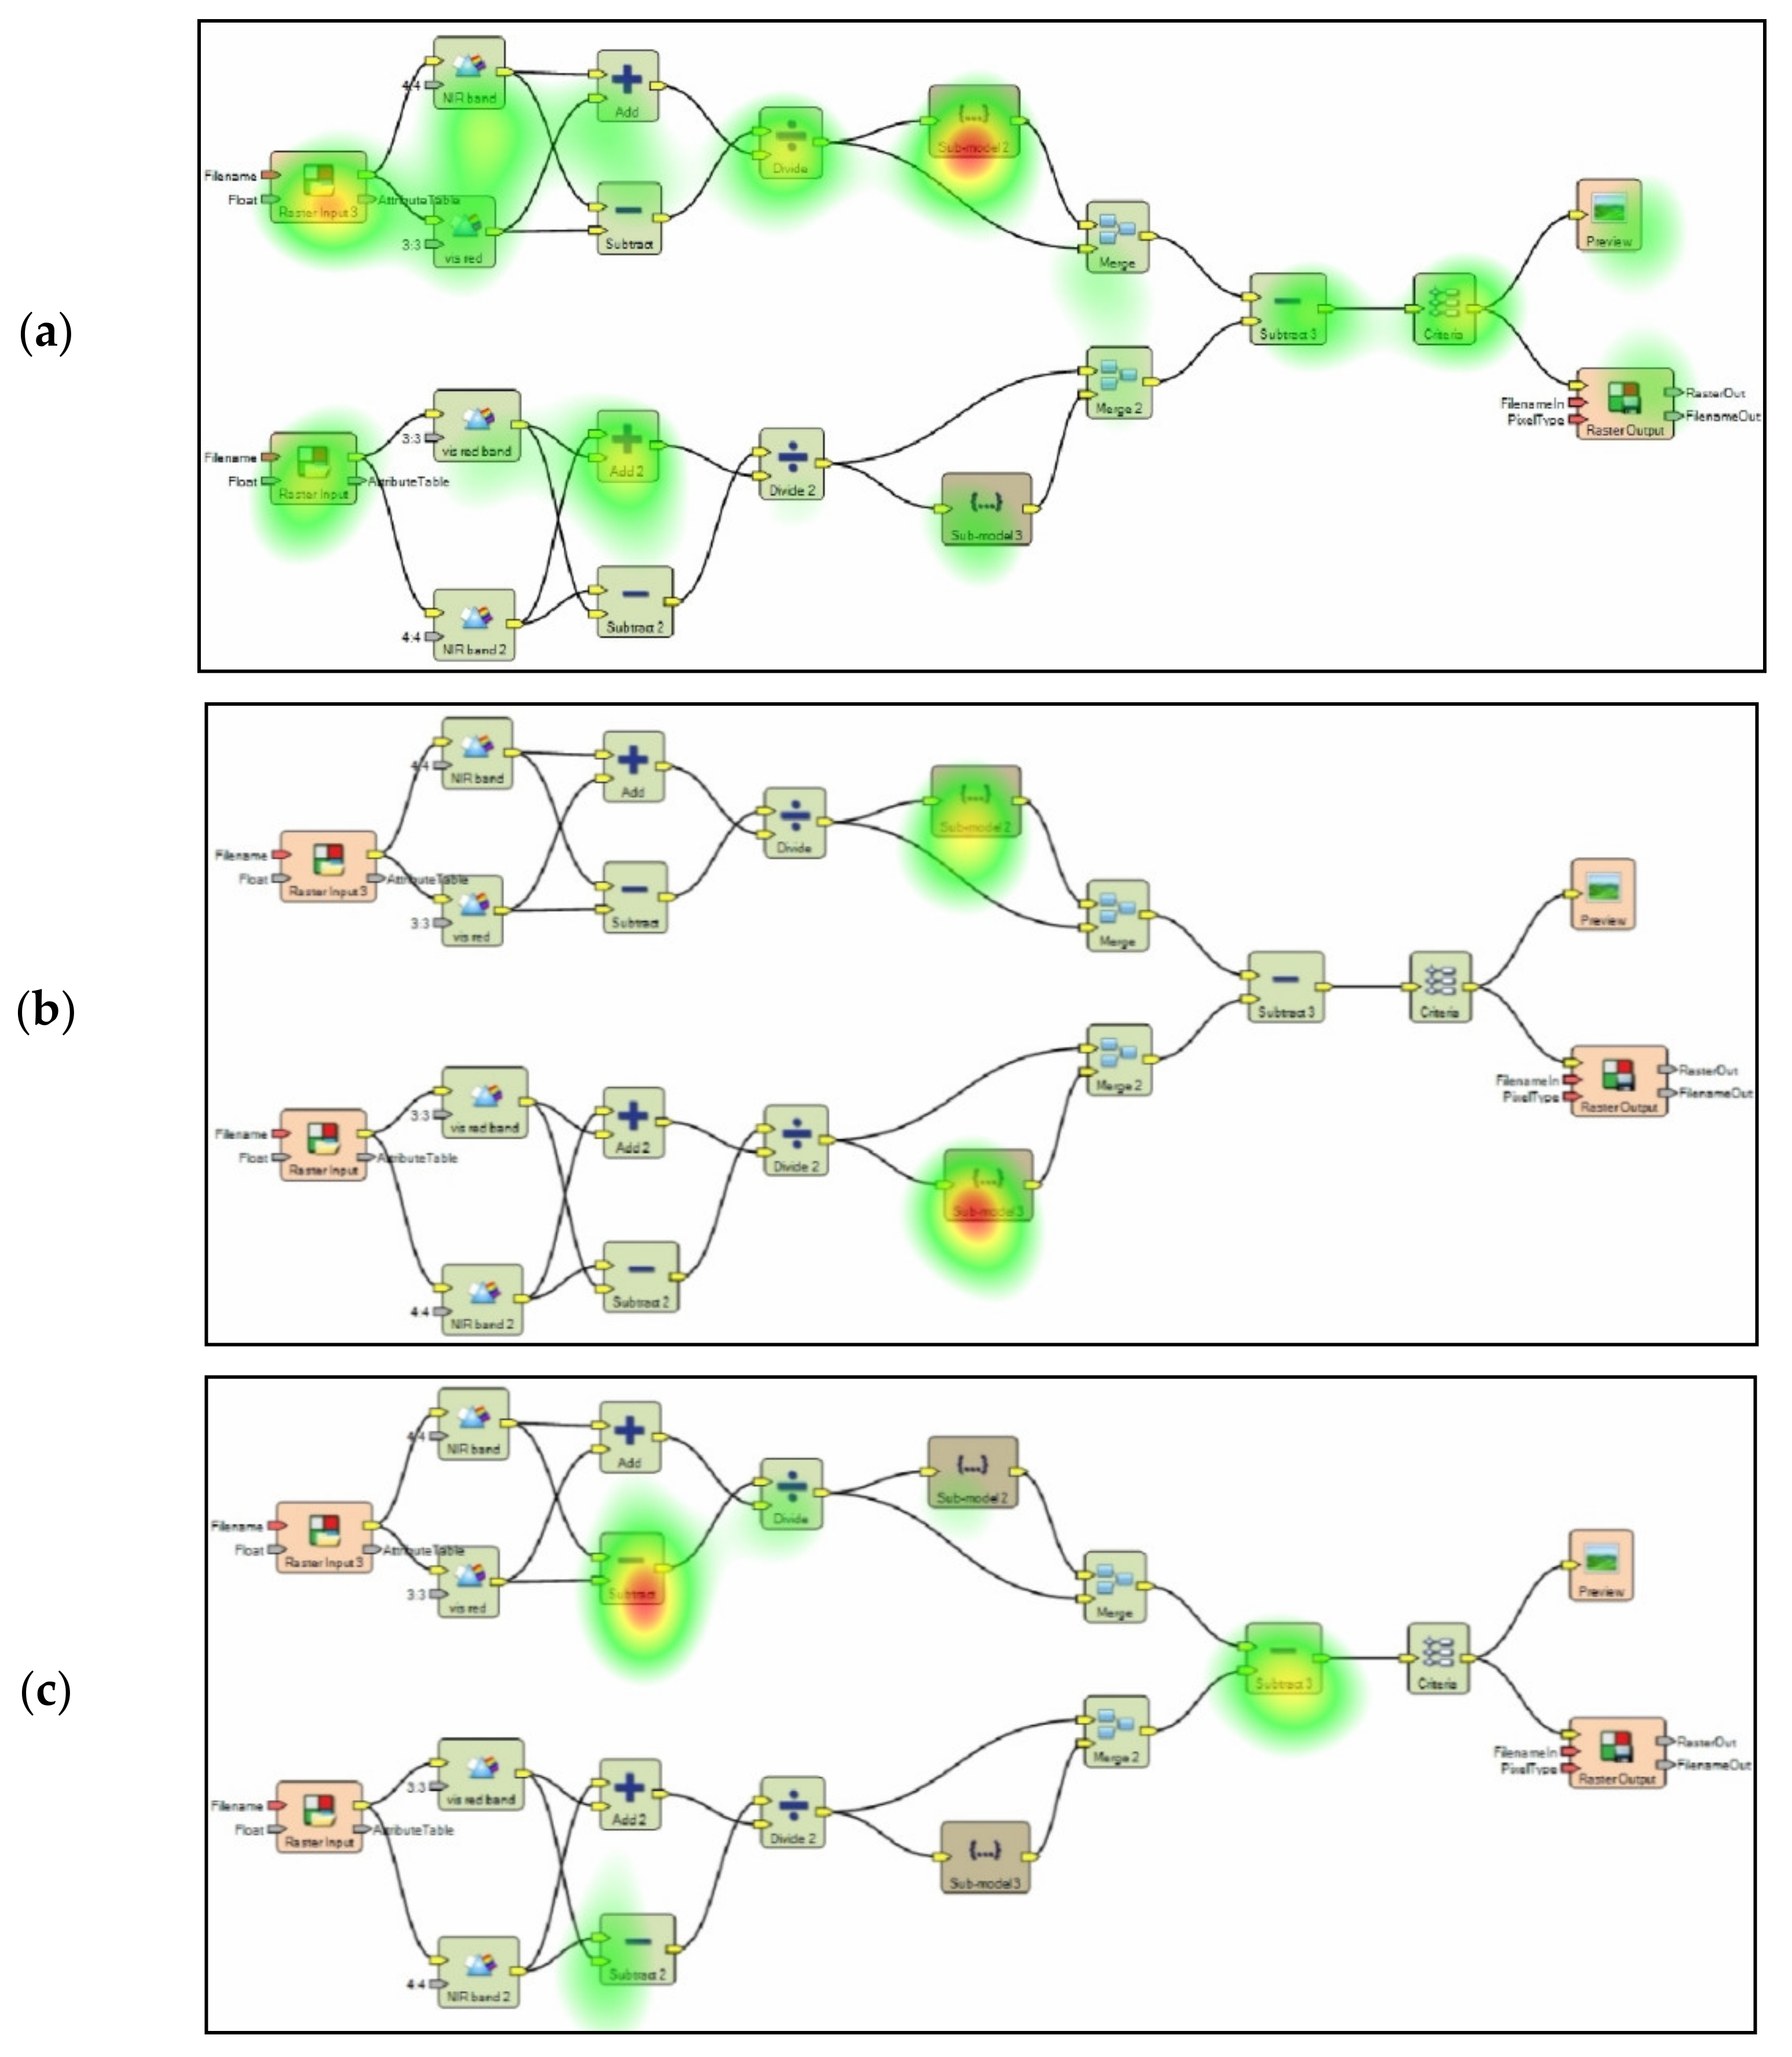
3.2.1. Testing of Symbols
3.2.2. Testing Functional Icons
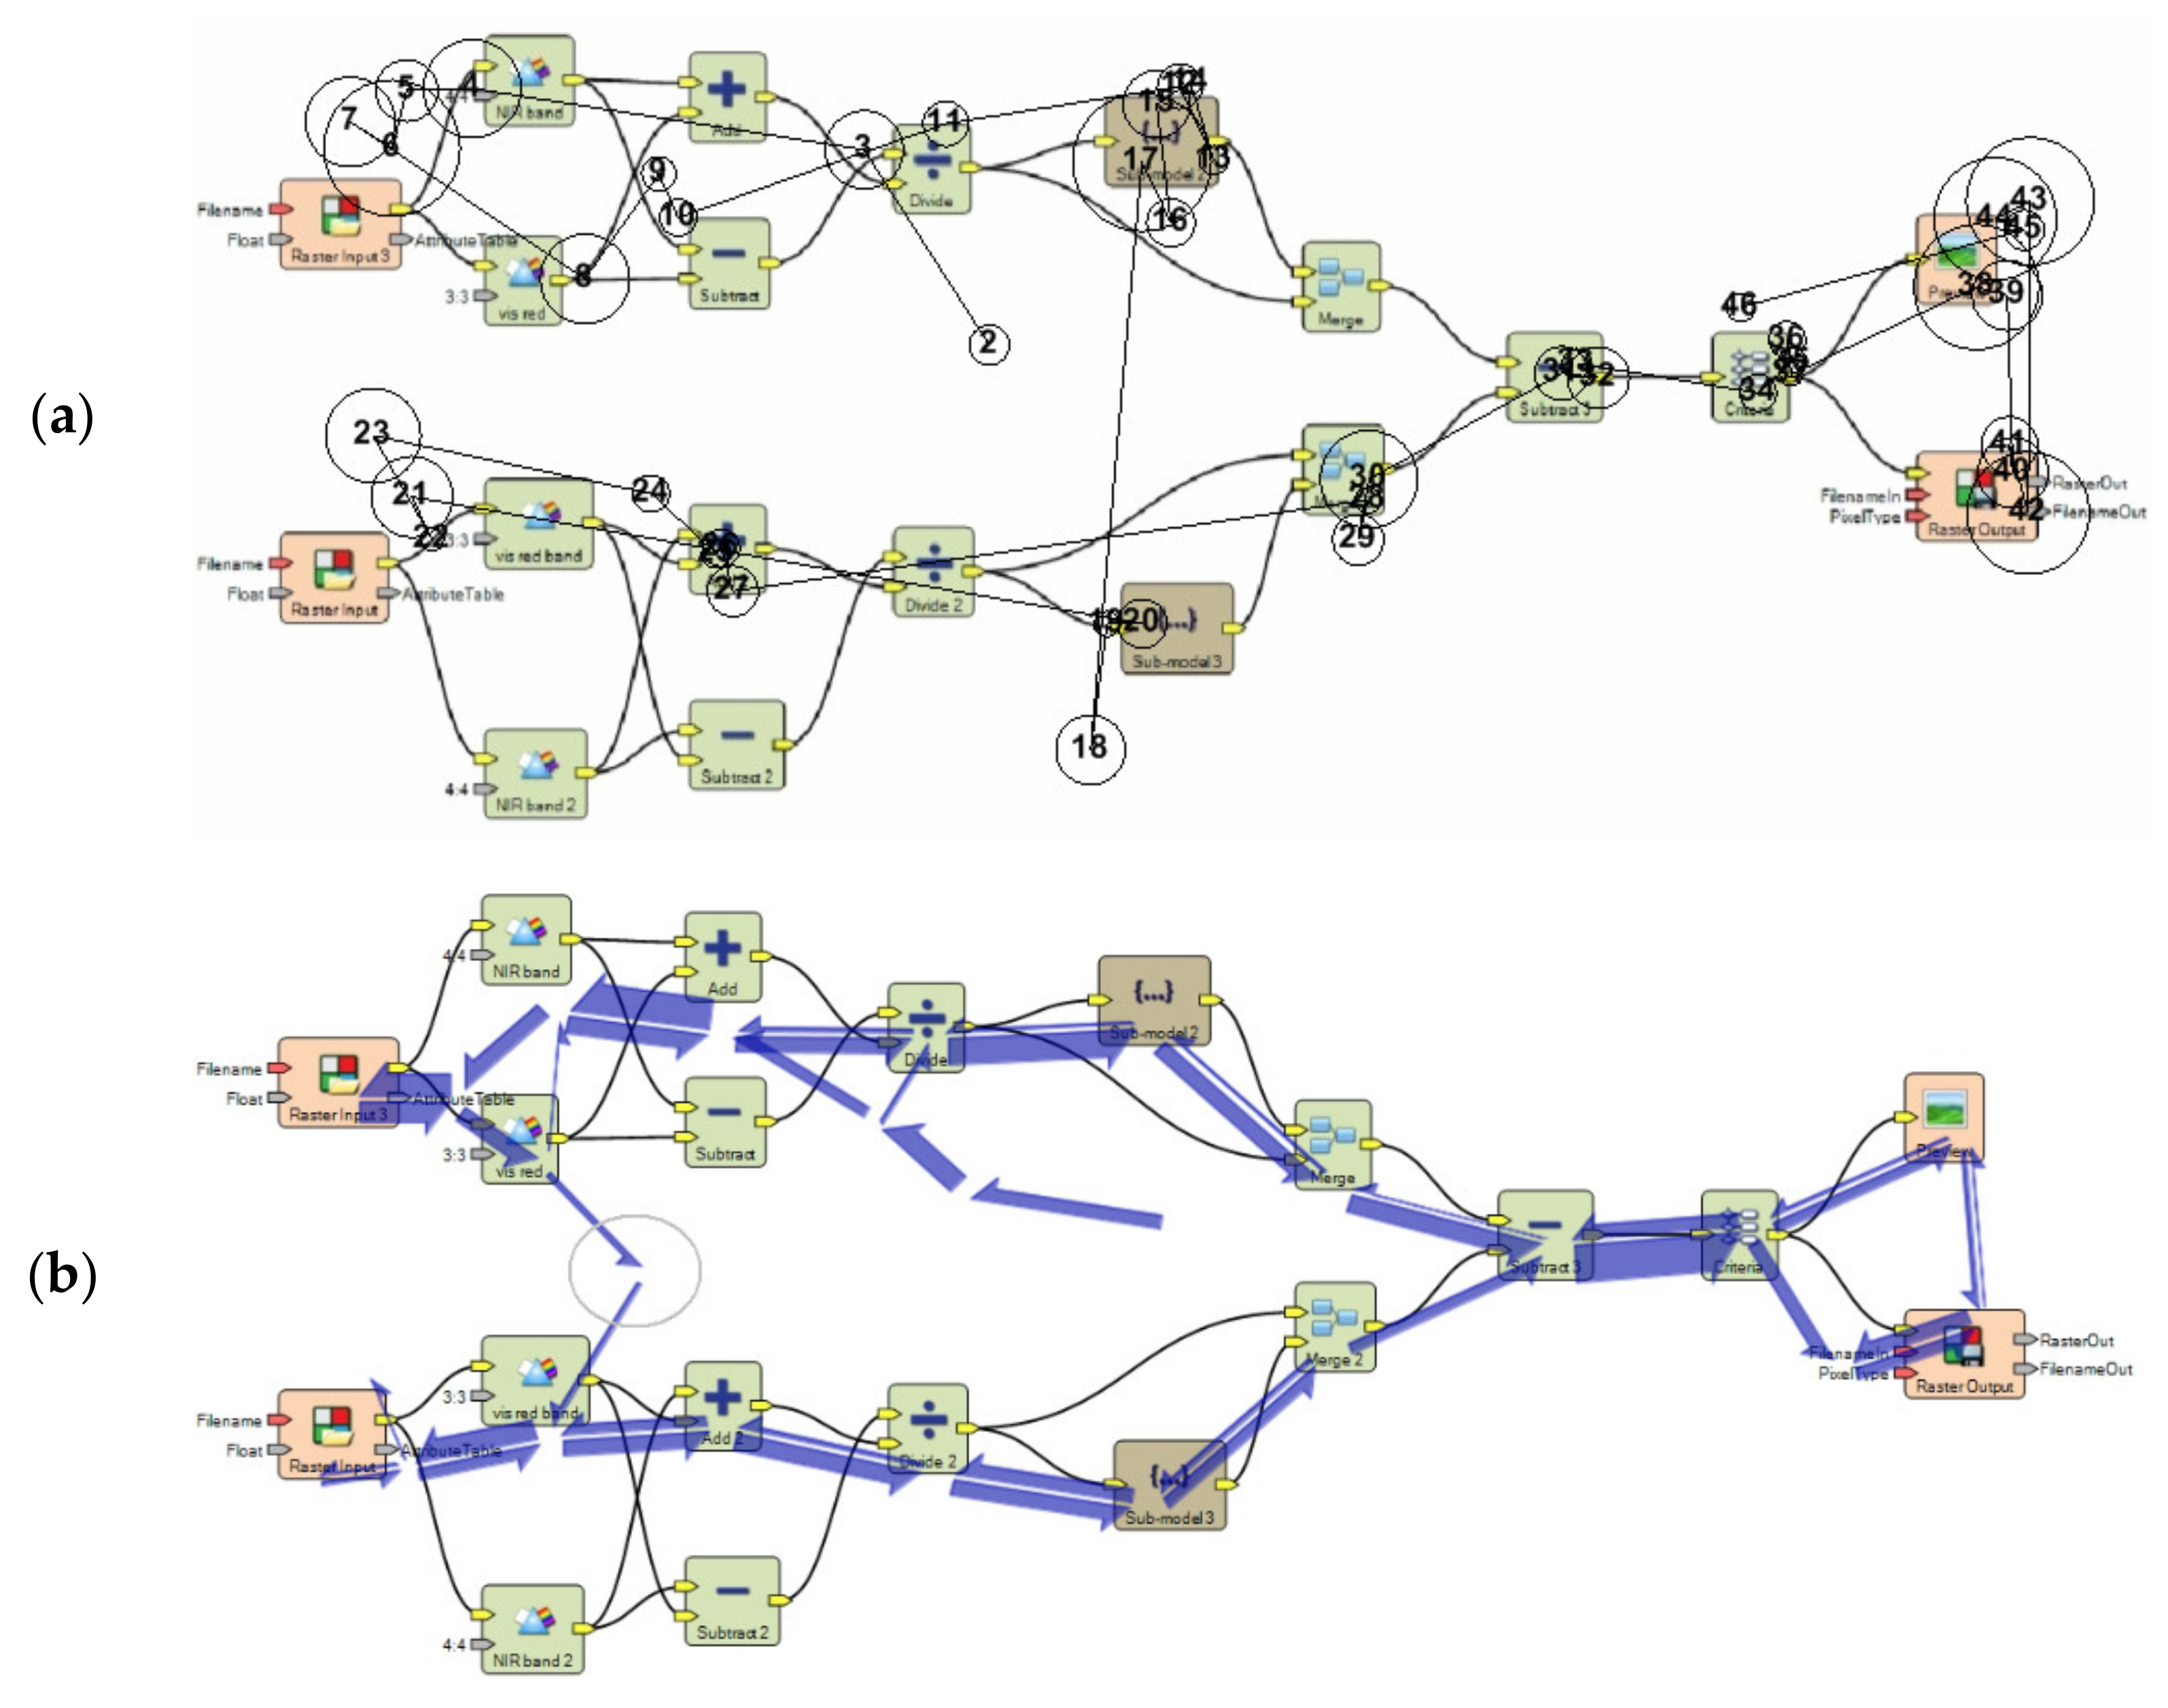
3.2.3. Testing of the Connecting Lines—Crossing and Orientation
3.2.4. Comparison of Reading in Free Viewing and the Part with Tasks
4. Discussion
- Use the automatic alignment function of the symbols on the grid.
- Prevent crossing connector lines
- Do not extend symbol with long labels
- Rename symbol in some cases to be accurate as possible
- Choose a short name for the data for labelling the ports
- Frequently use Sub-models to increase modularity.
Funding
Acknowledgments
Conflicts of Interest
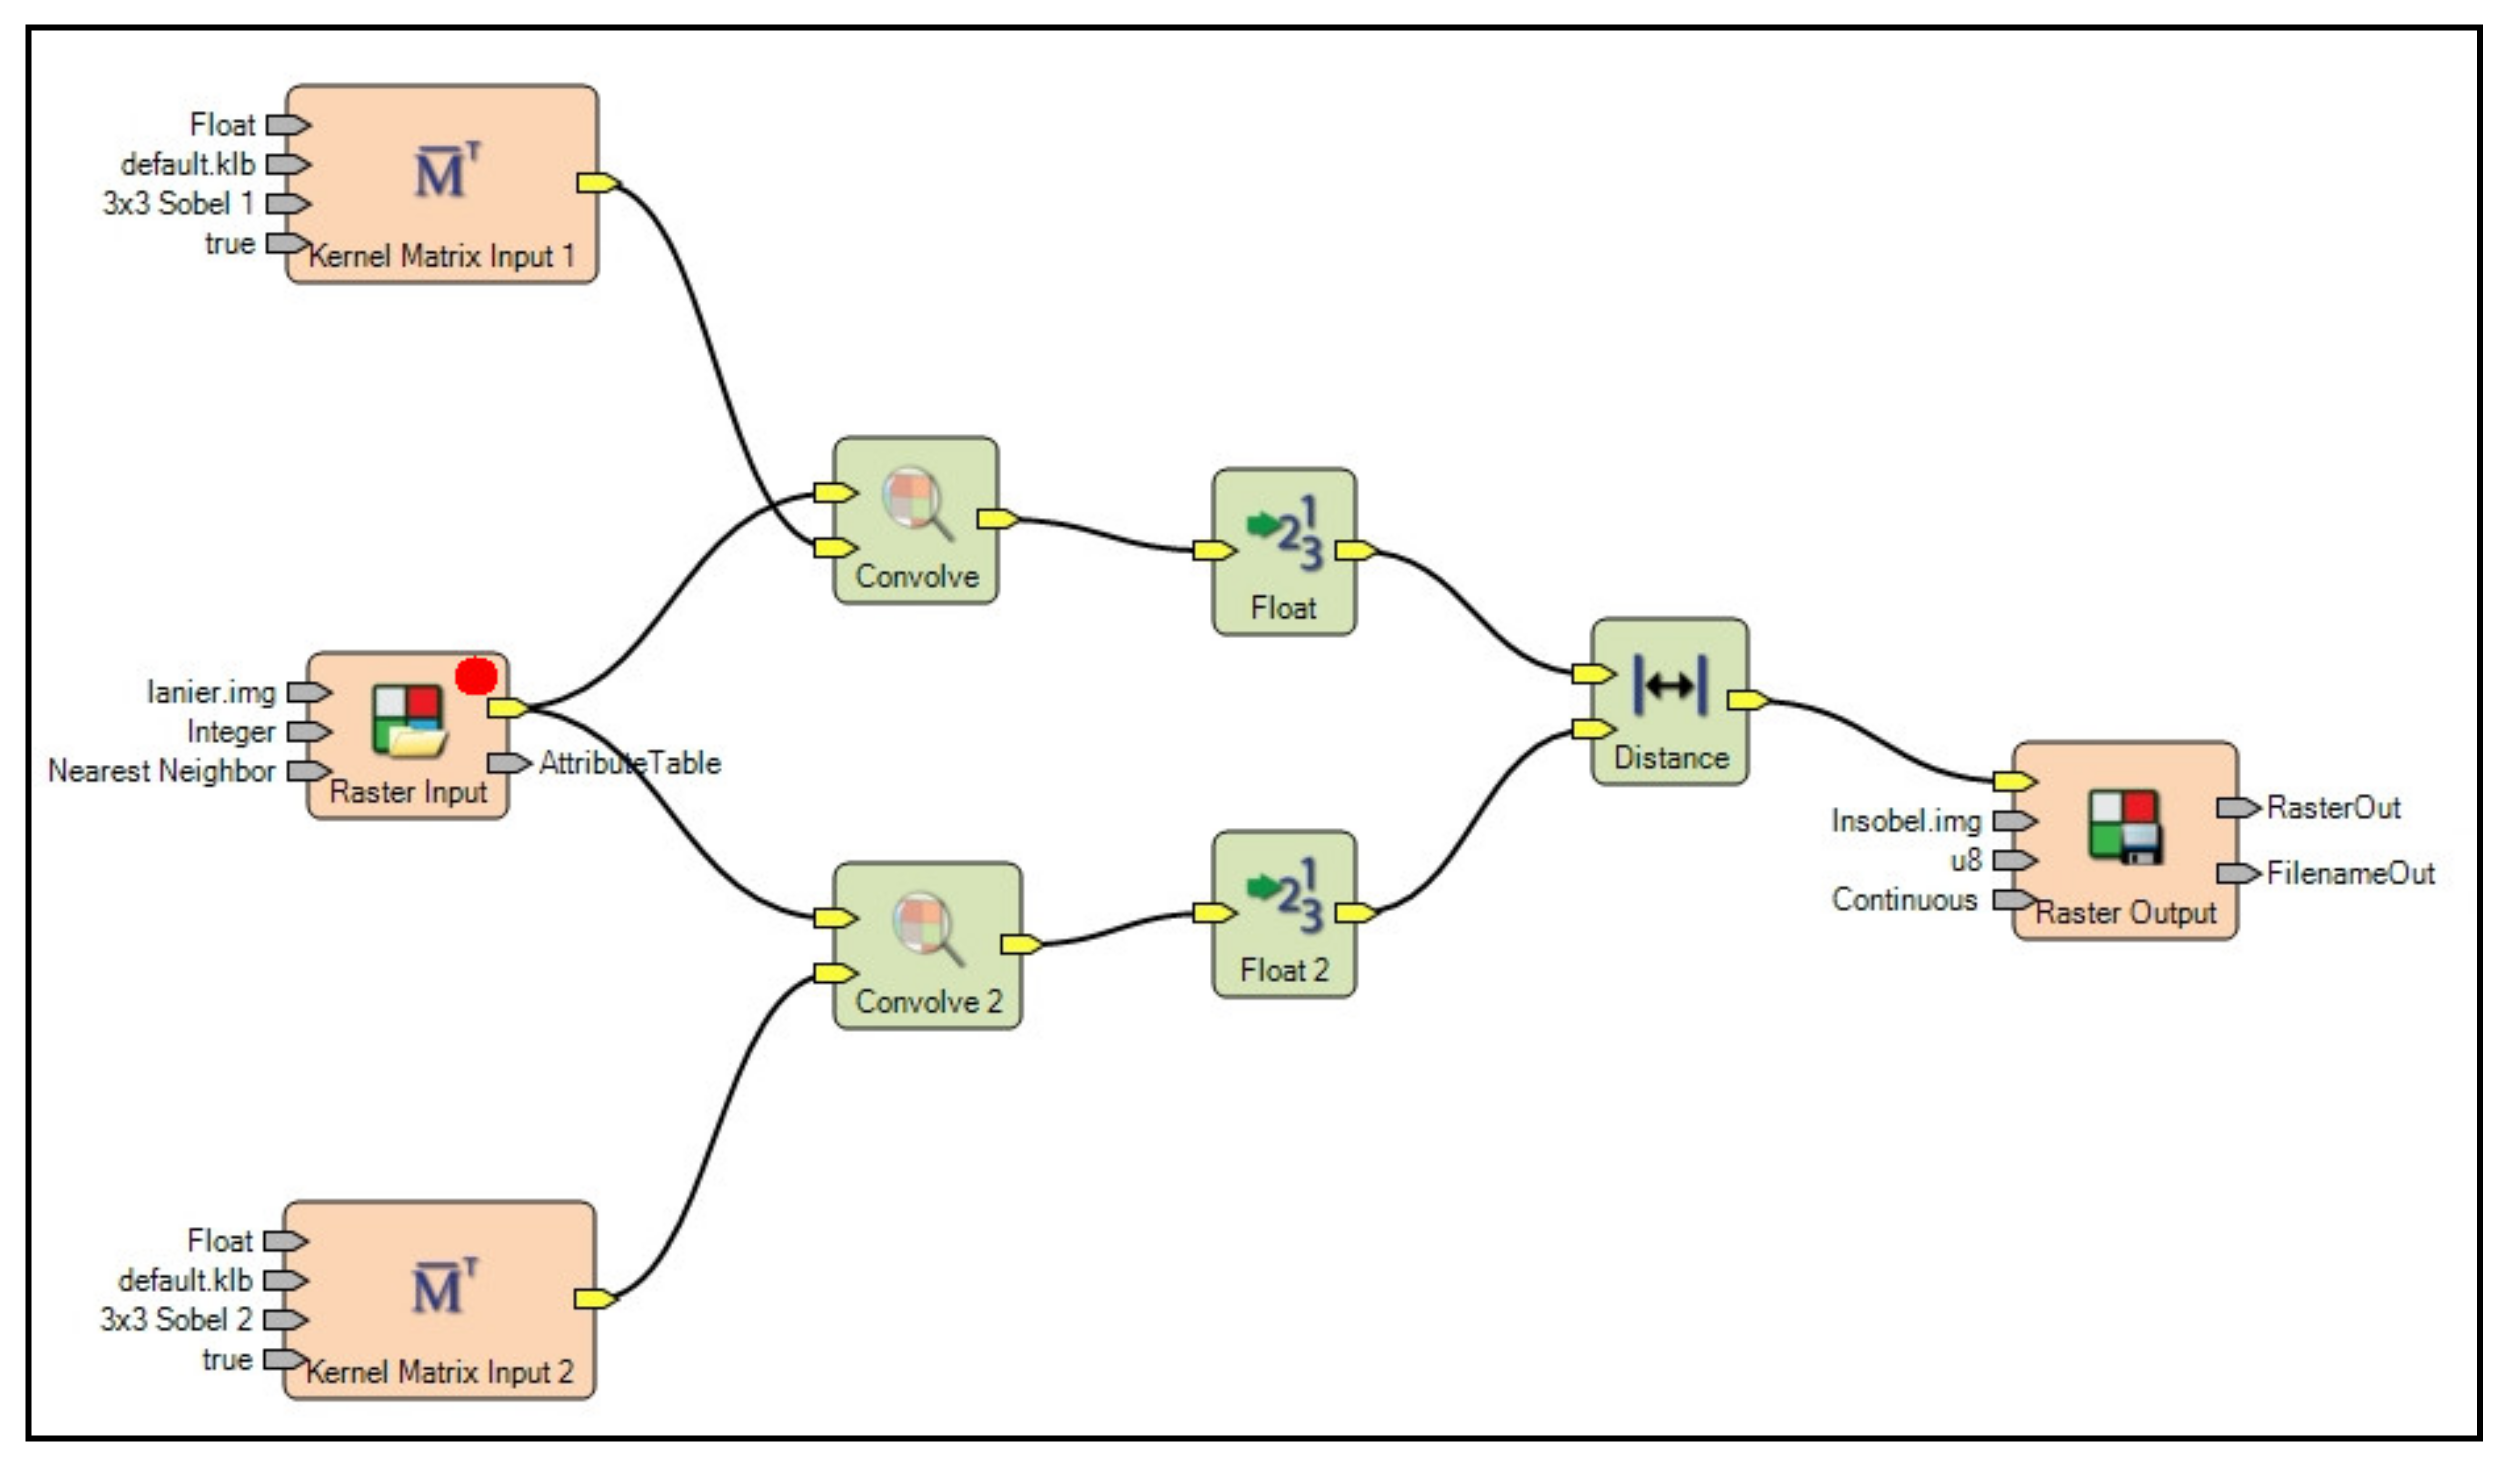
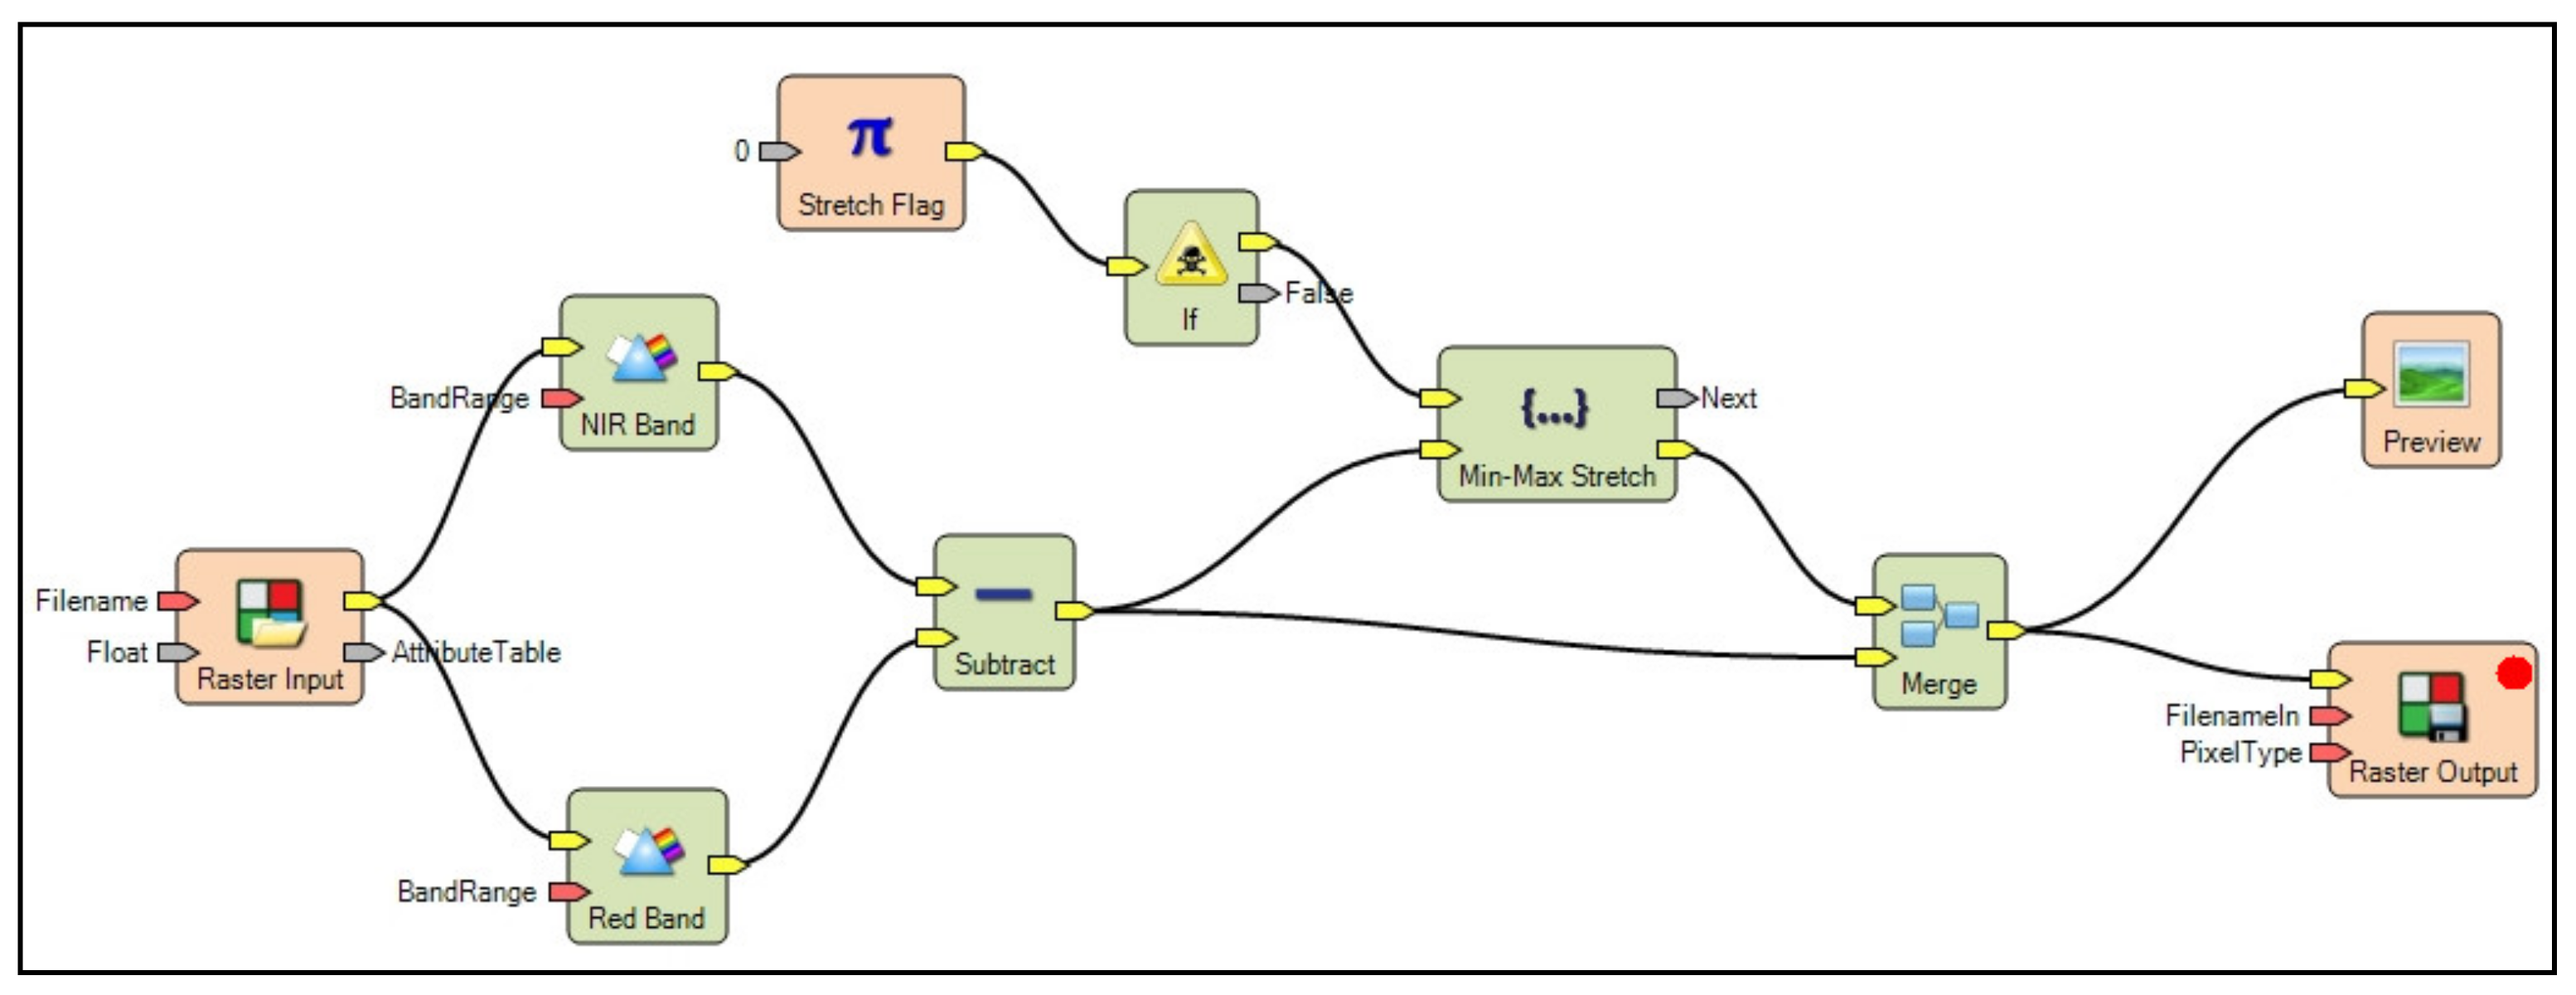
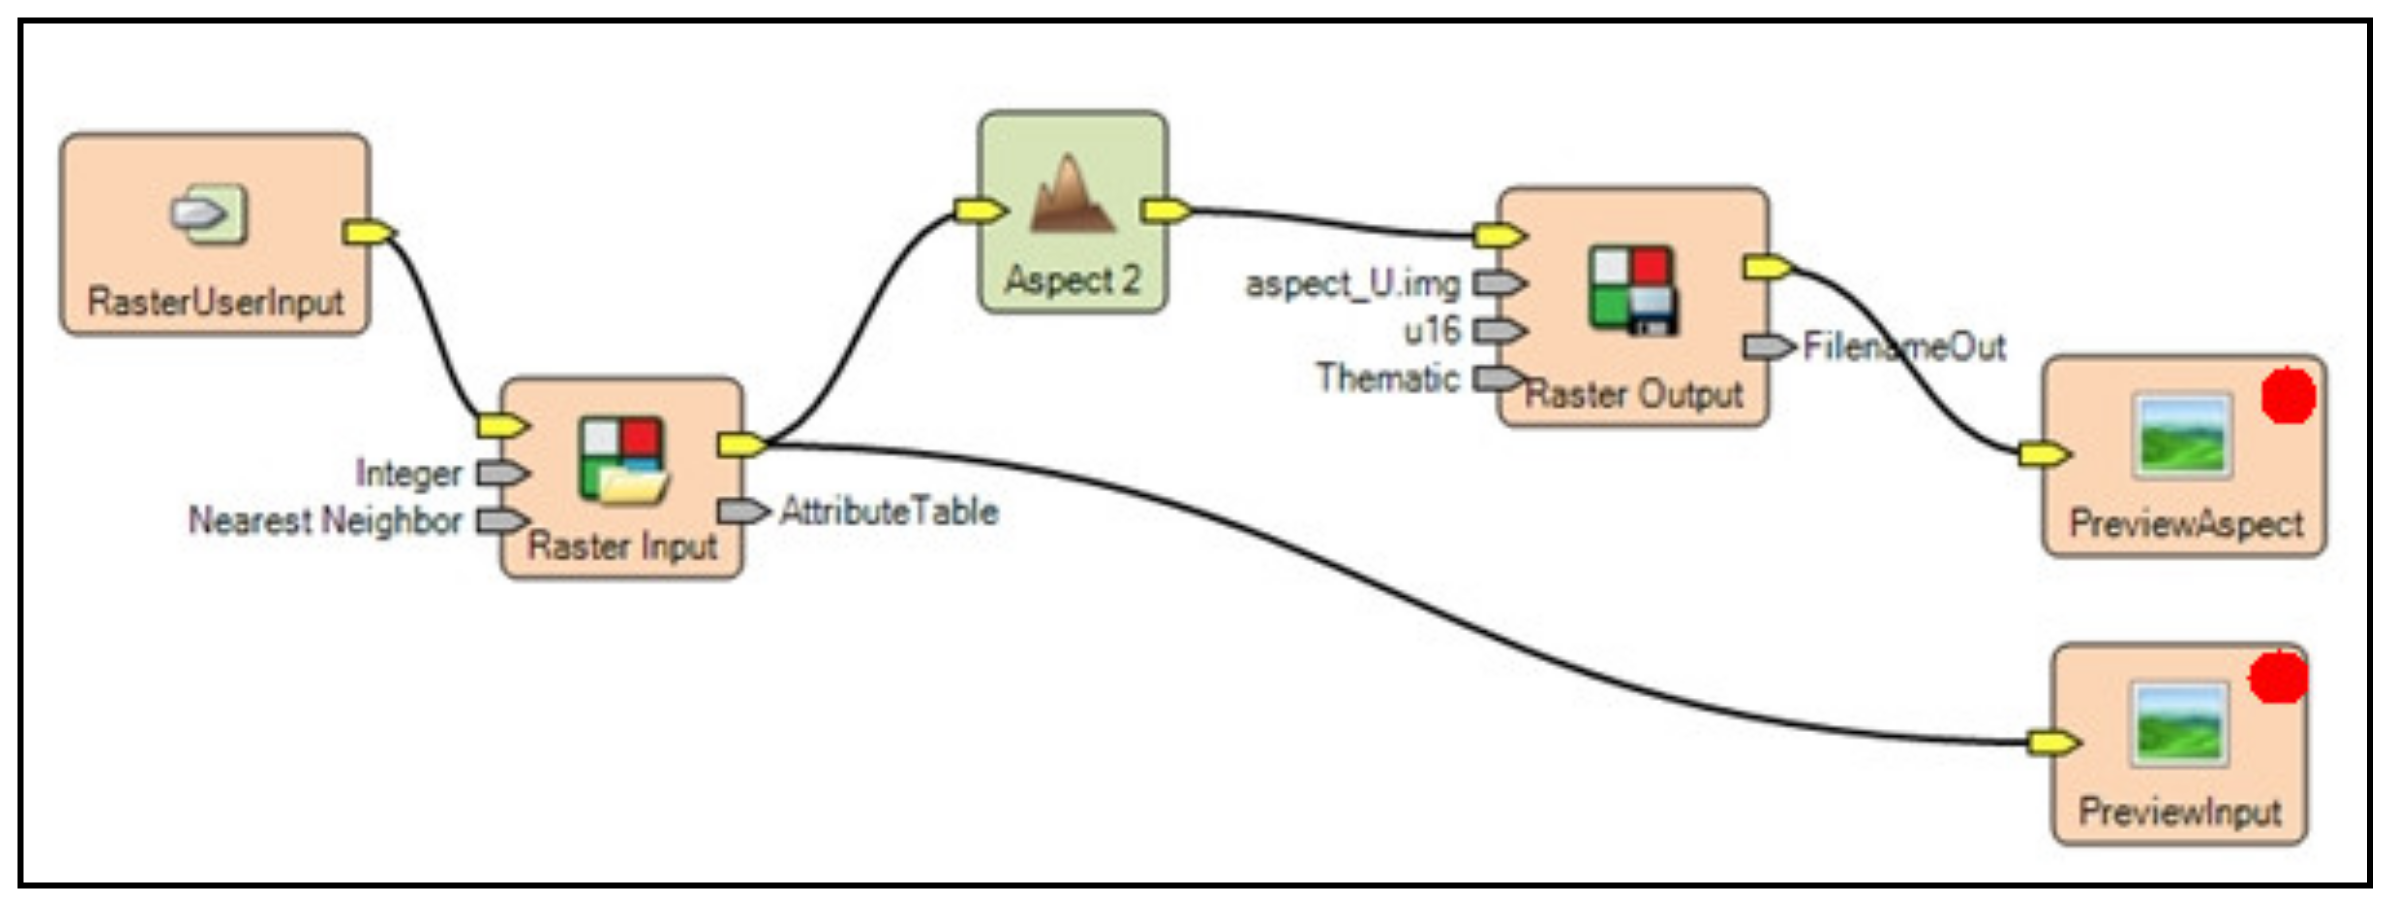
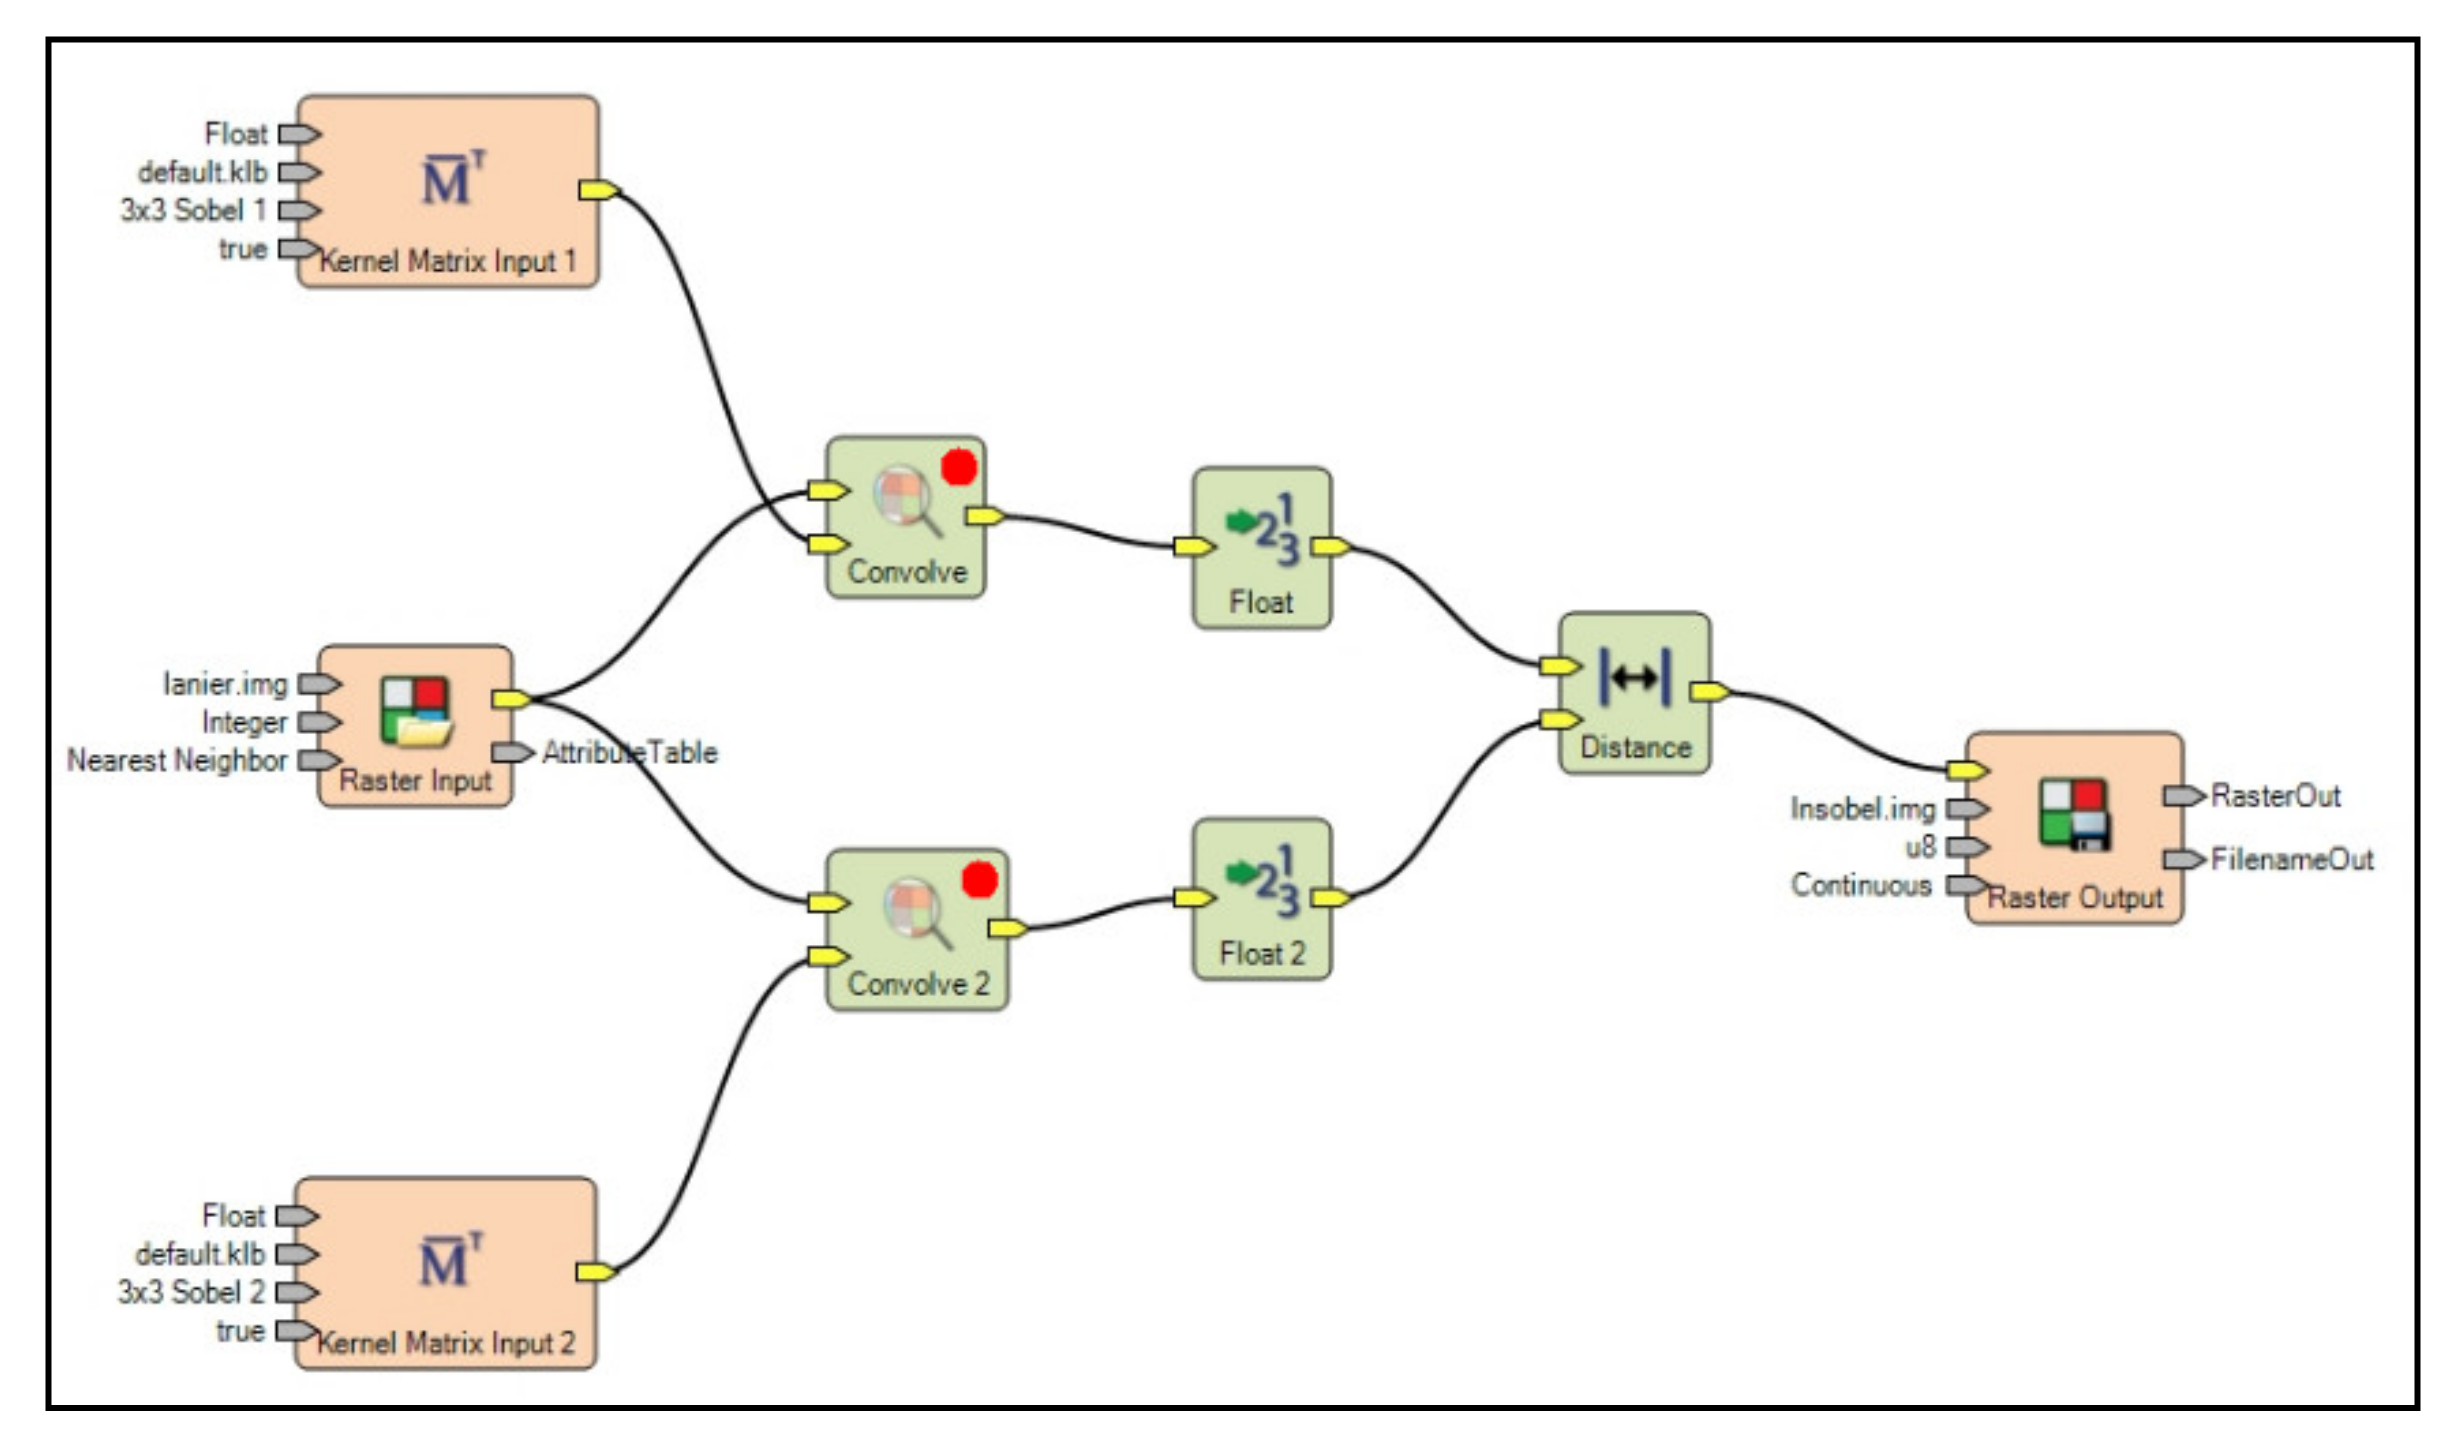
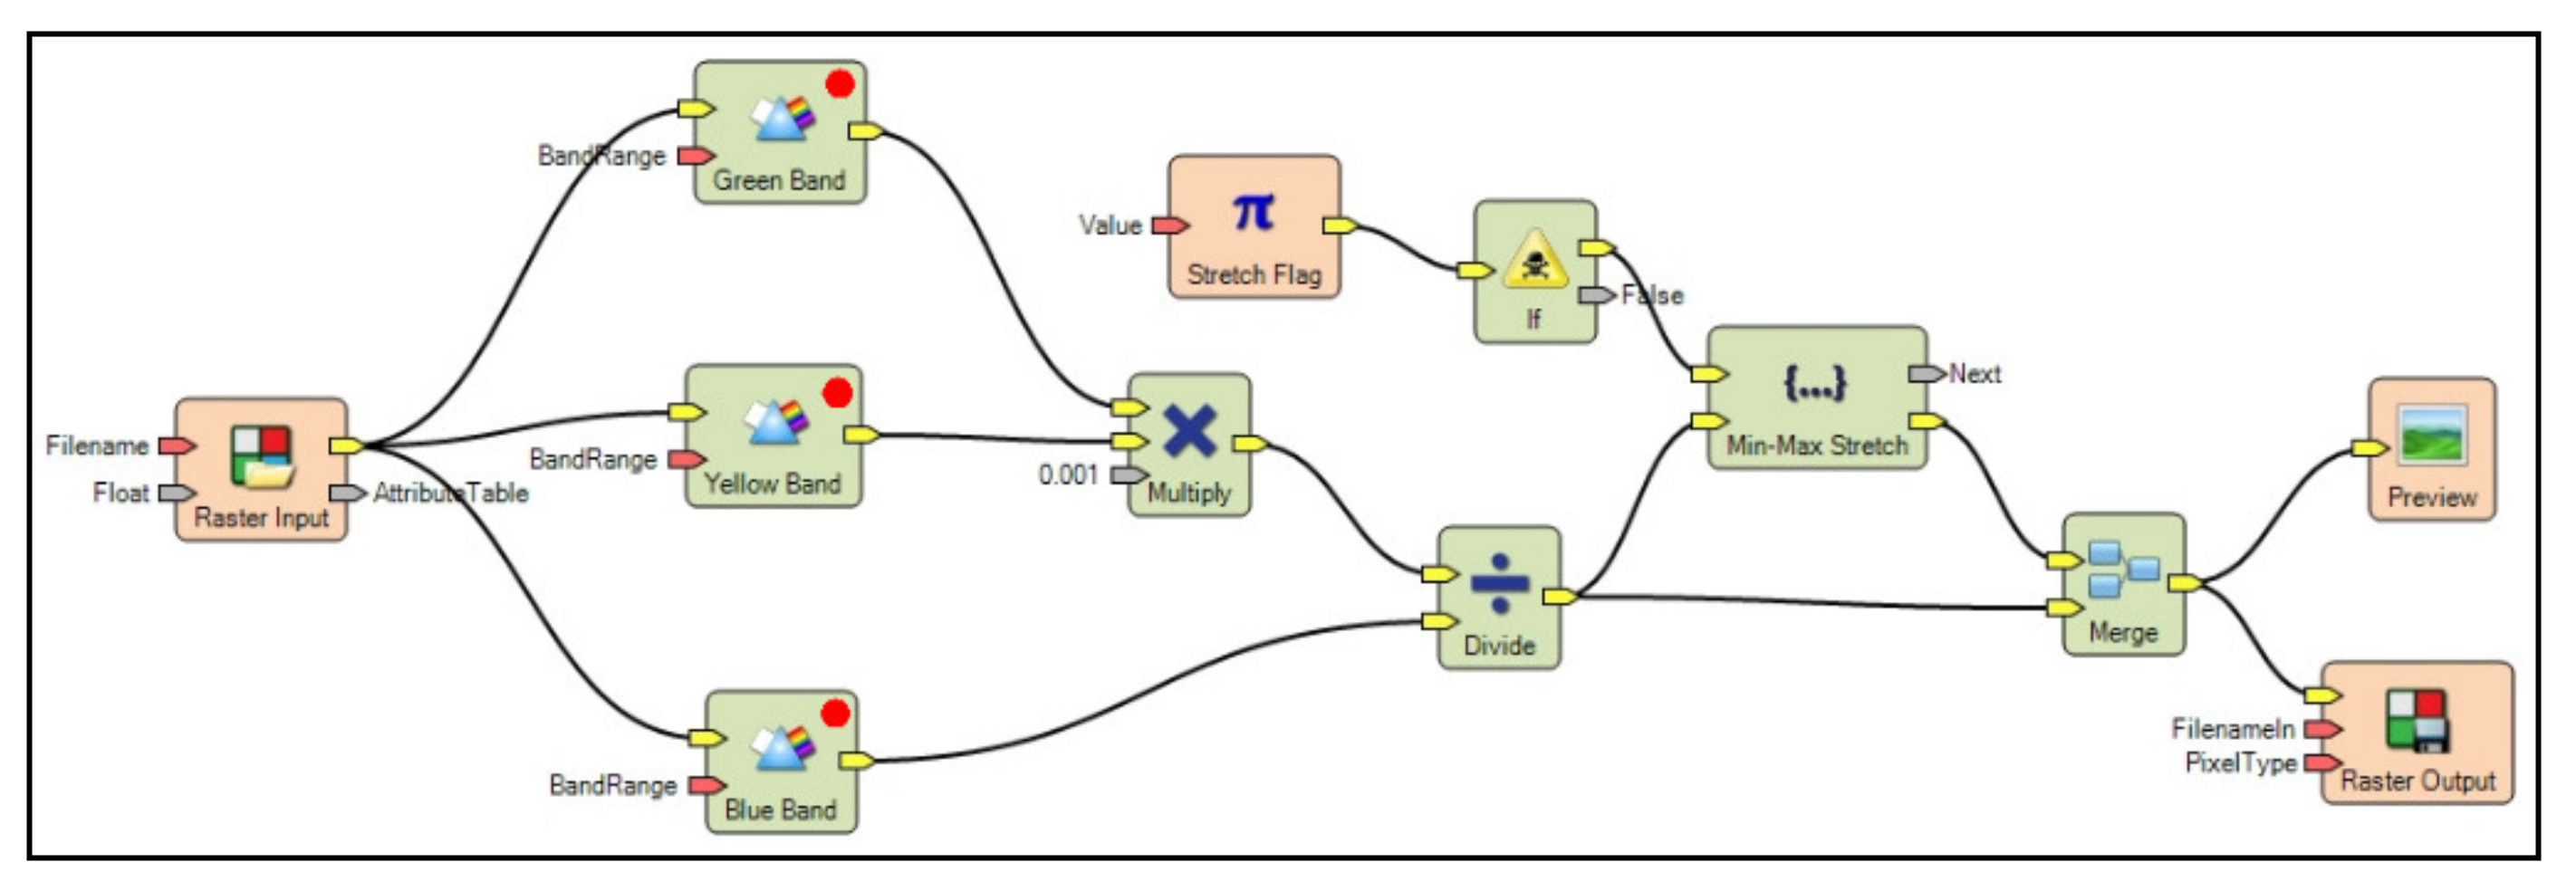
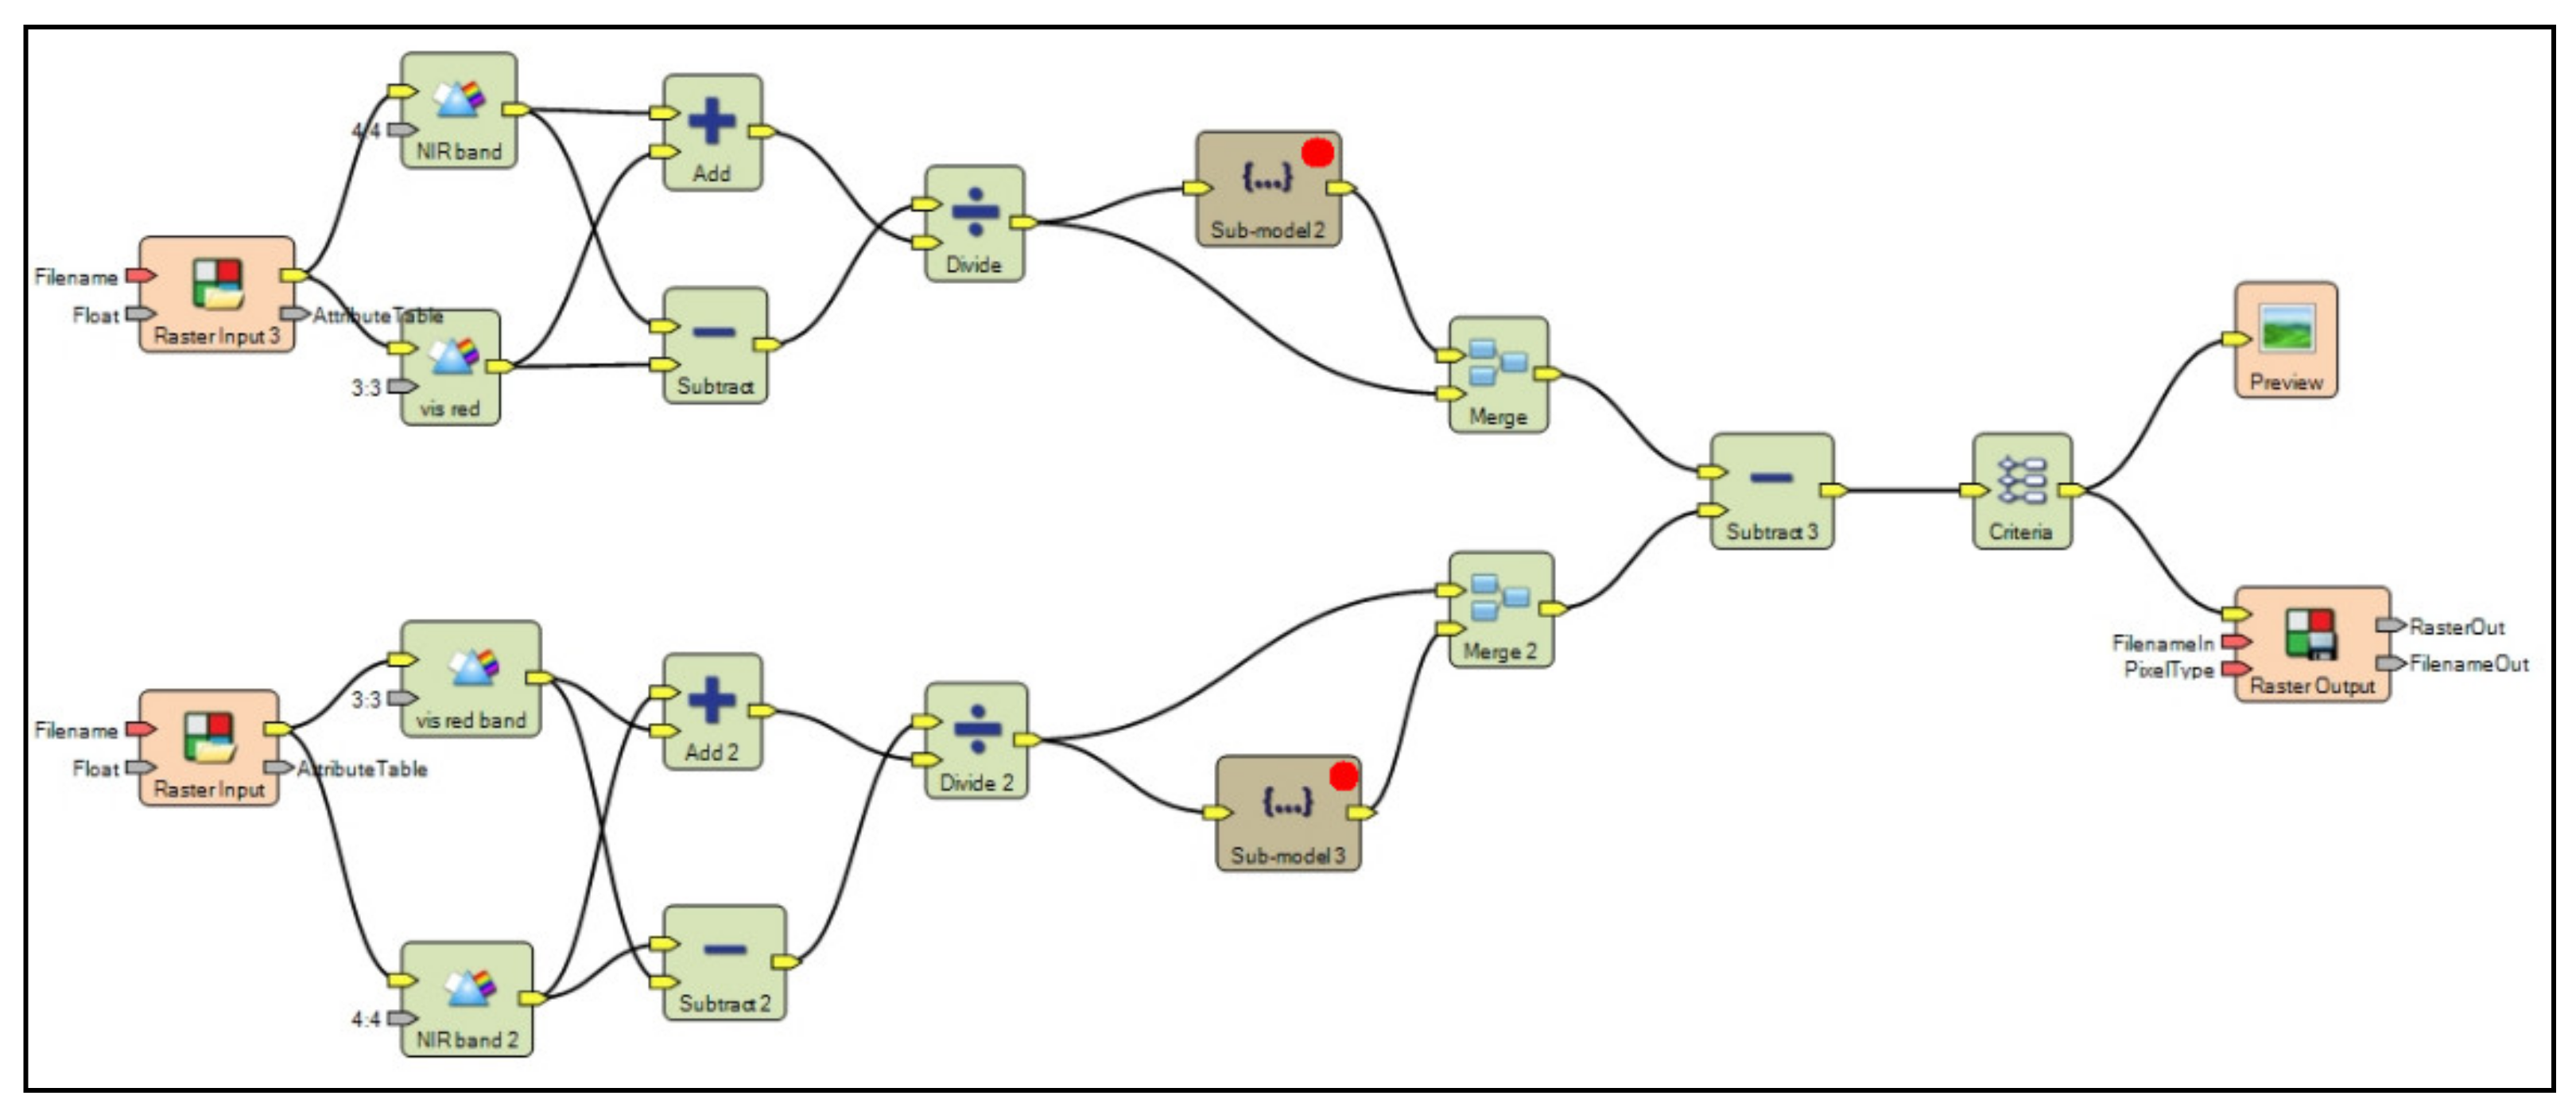
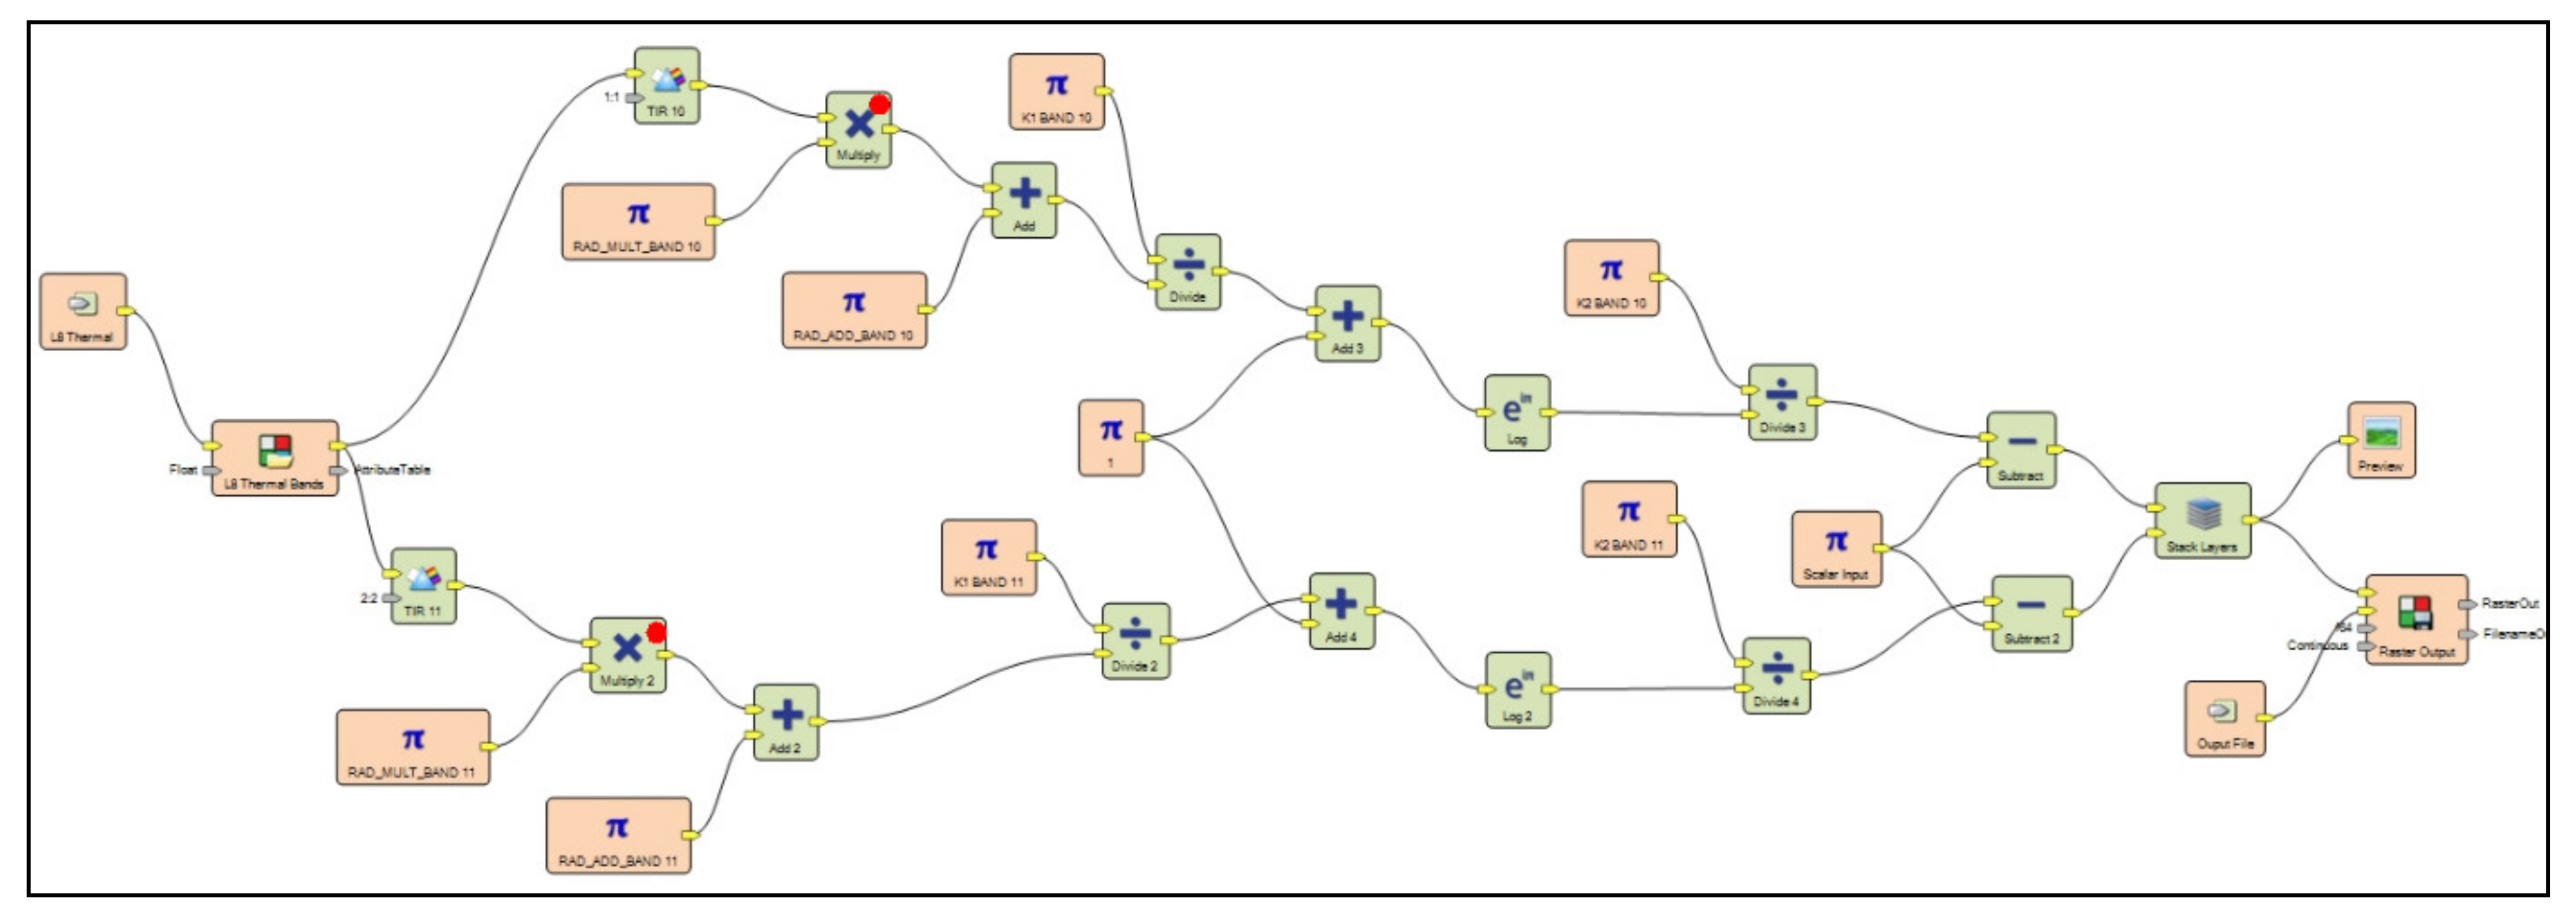
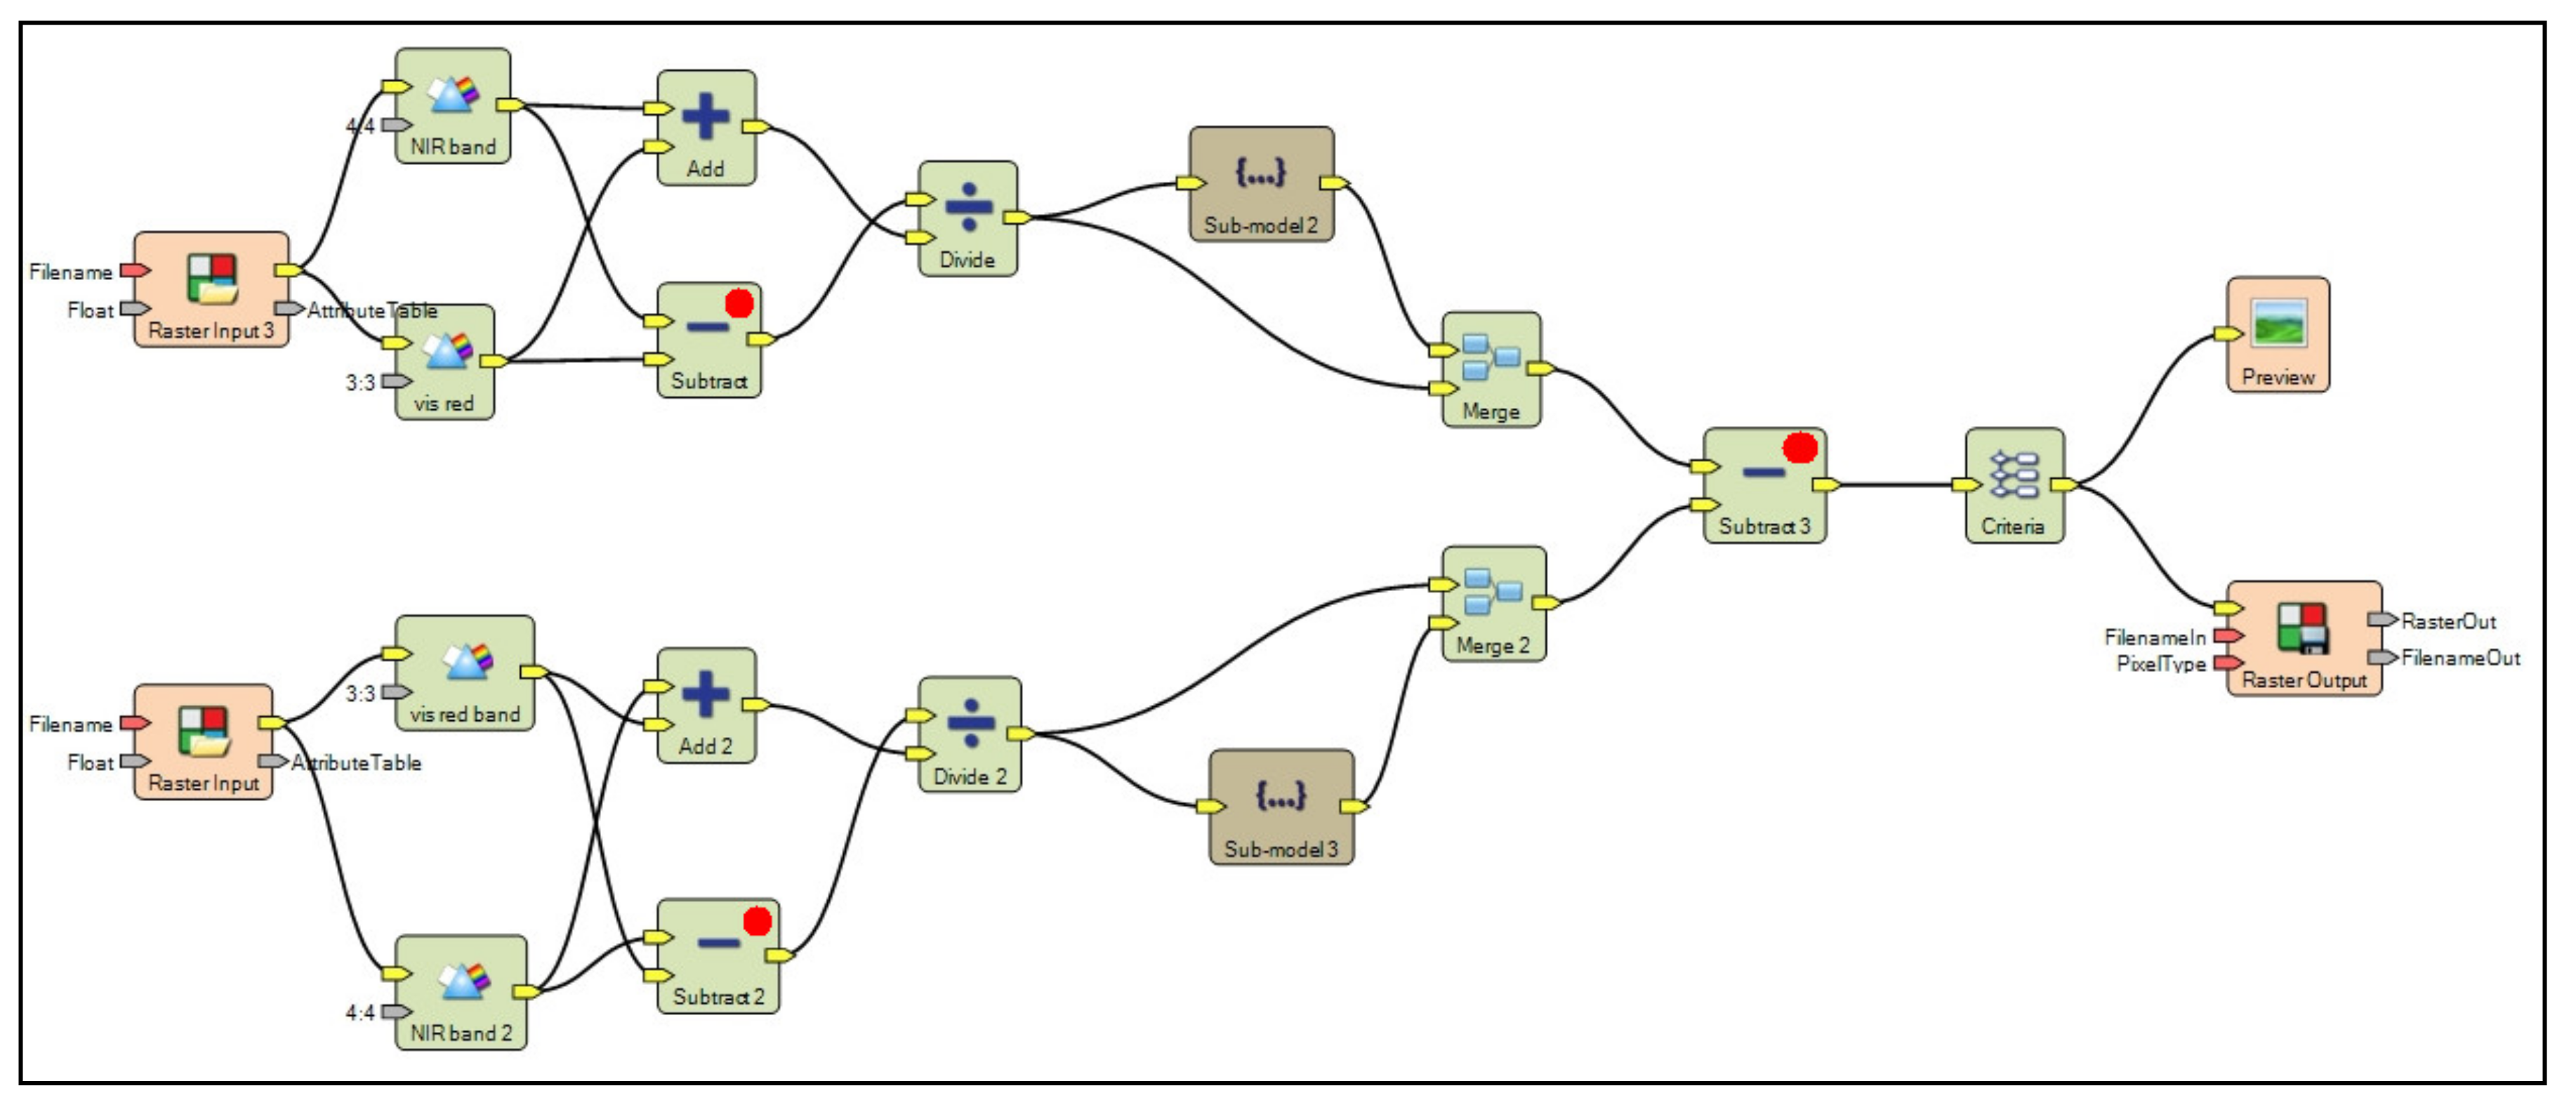
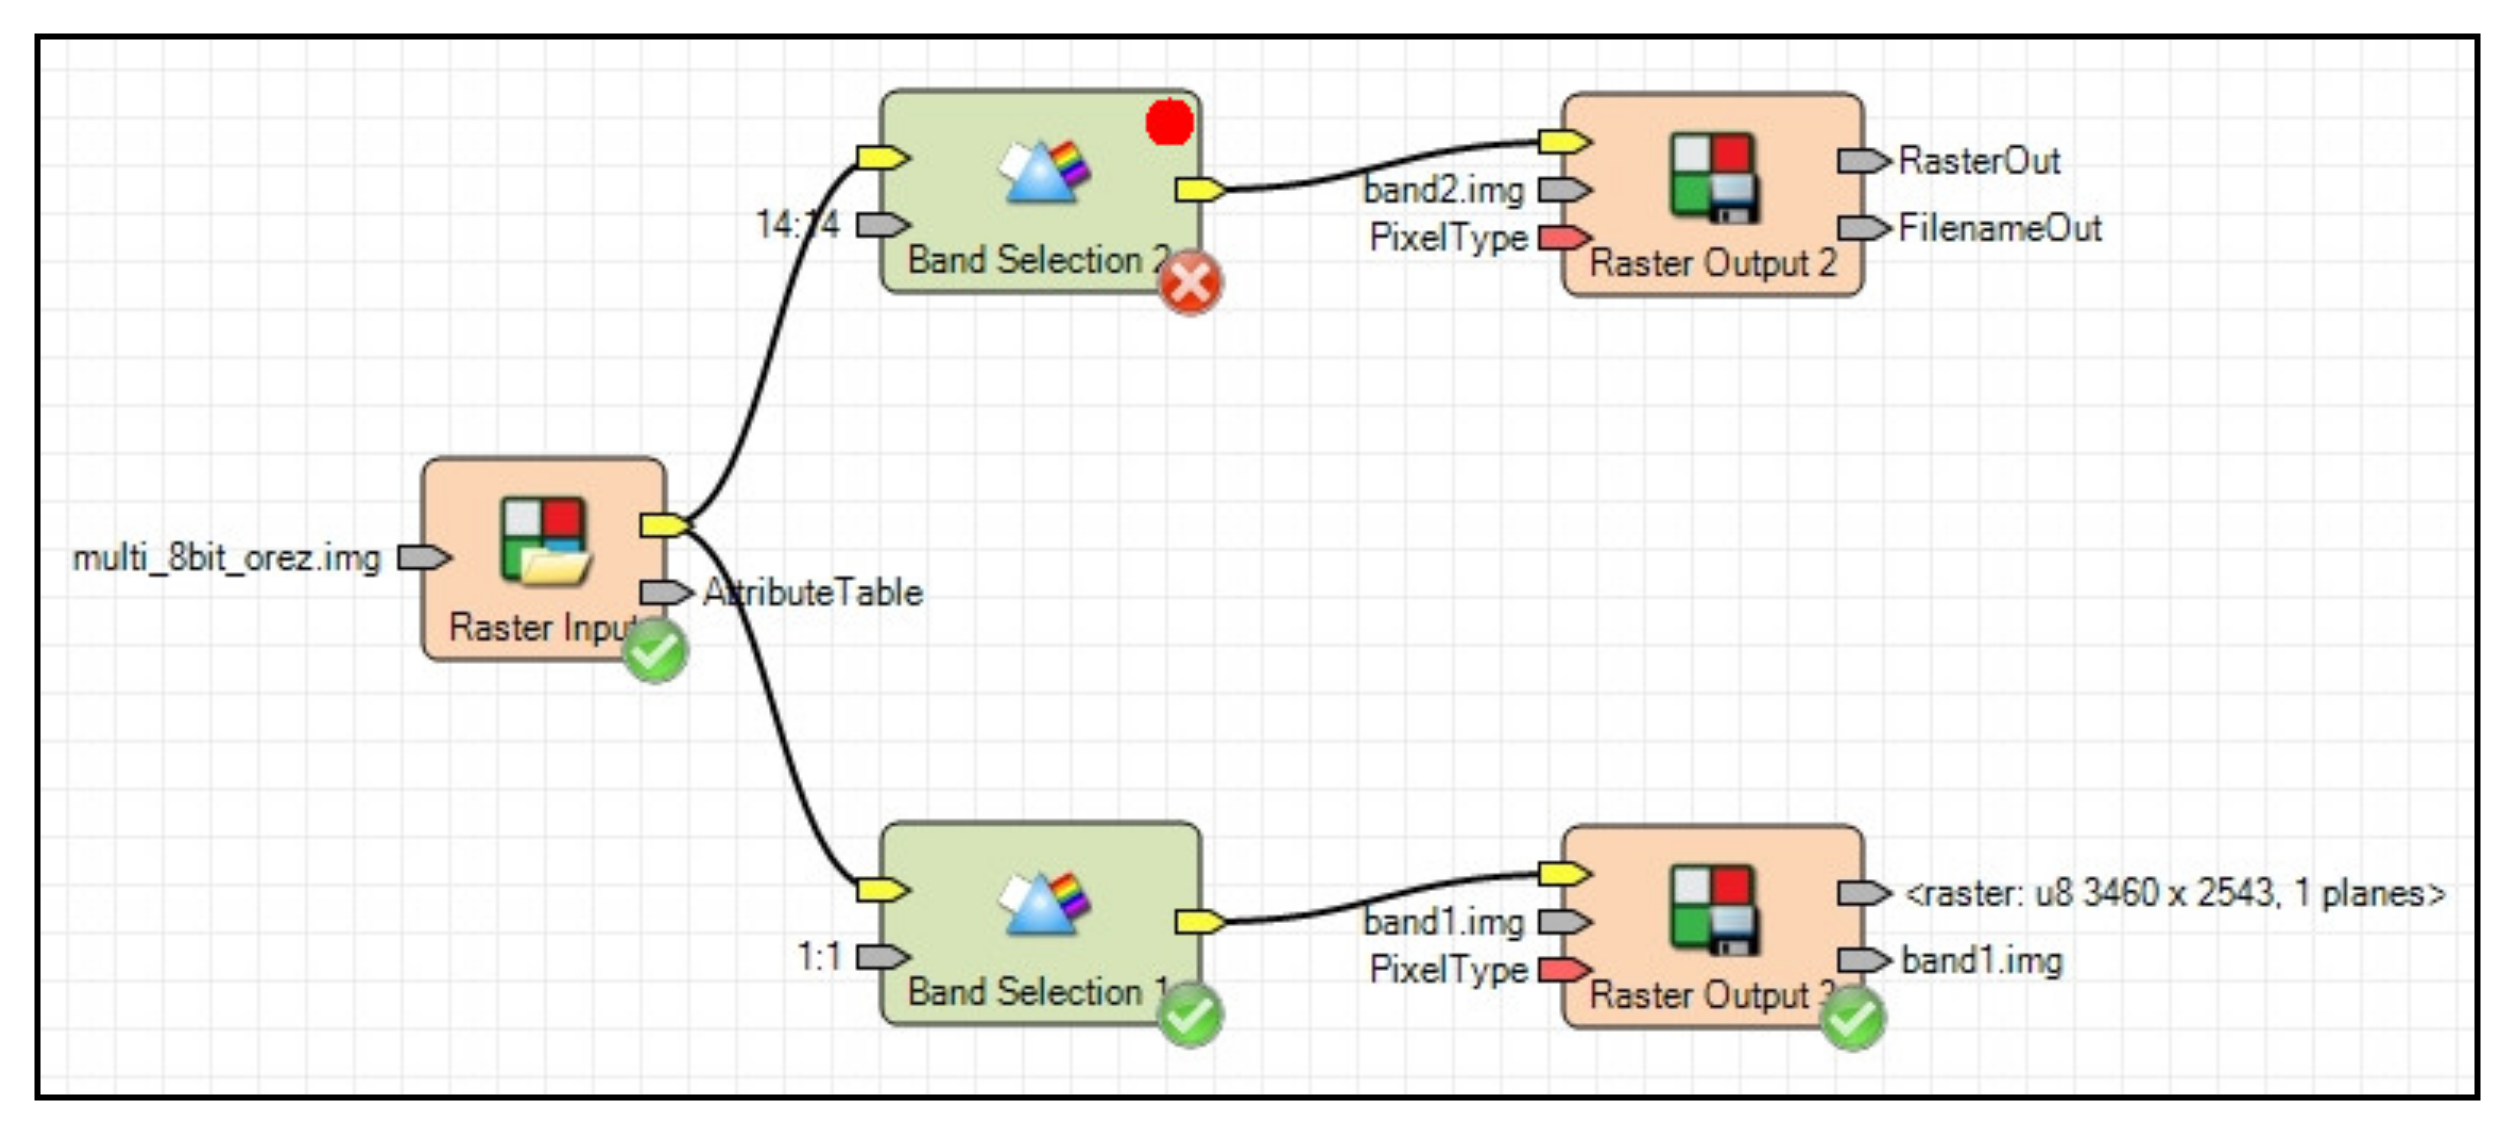
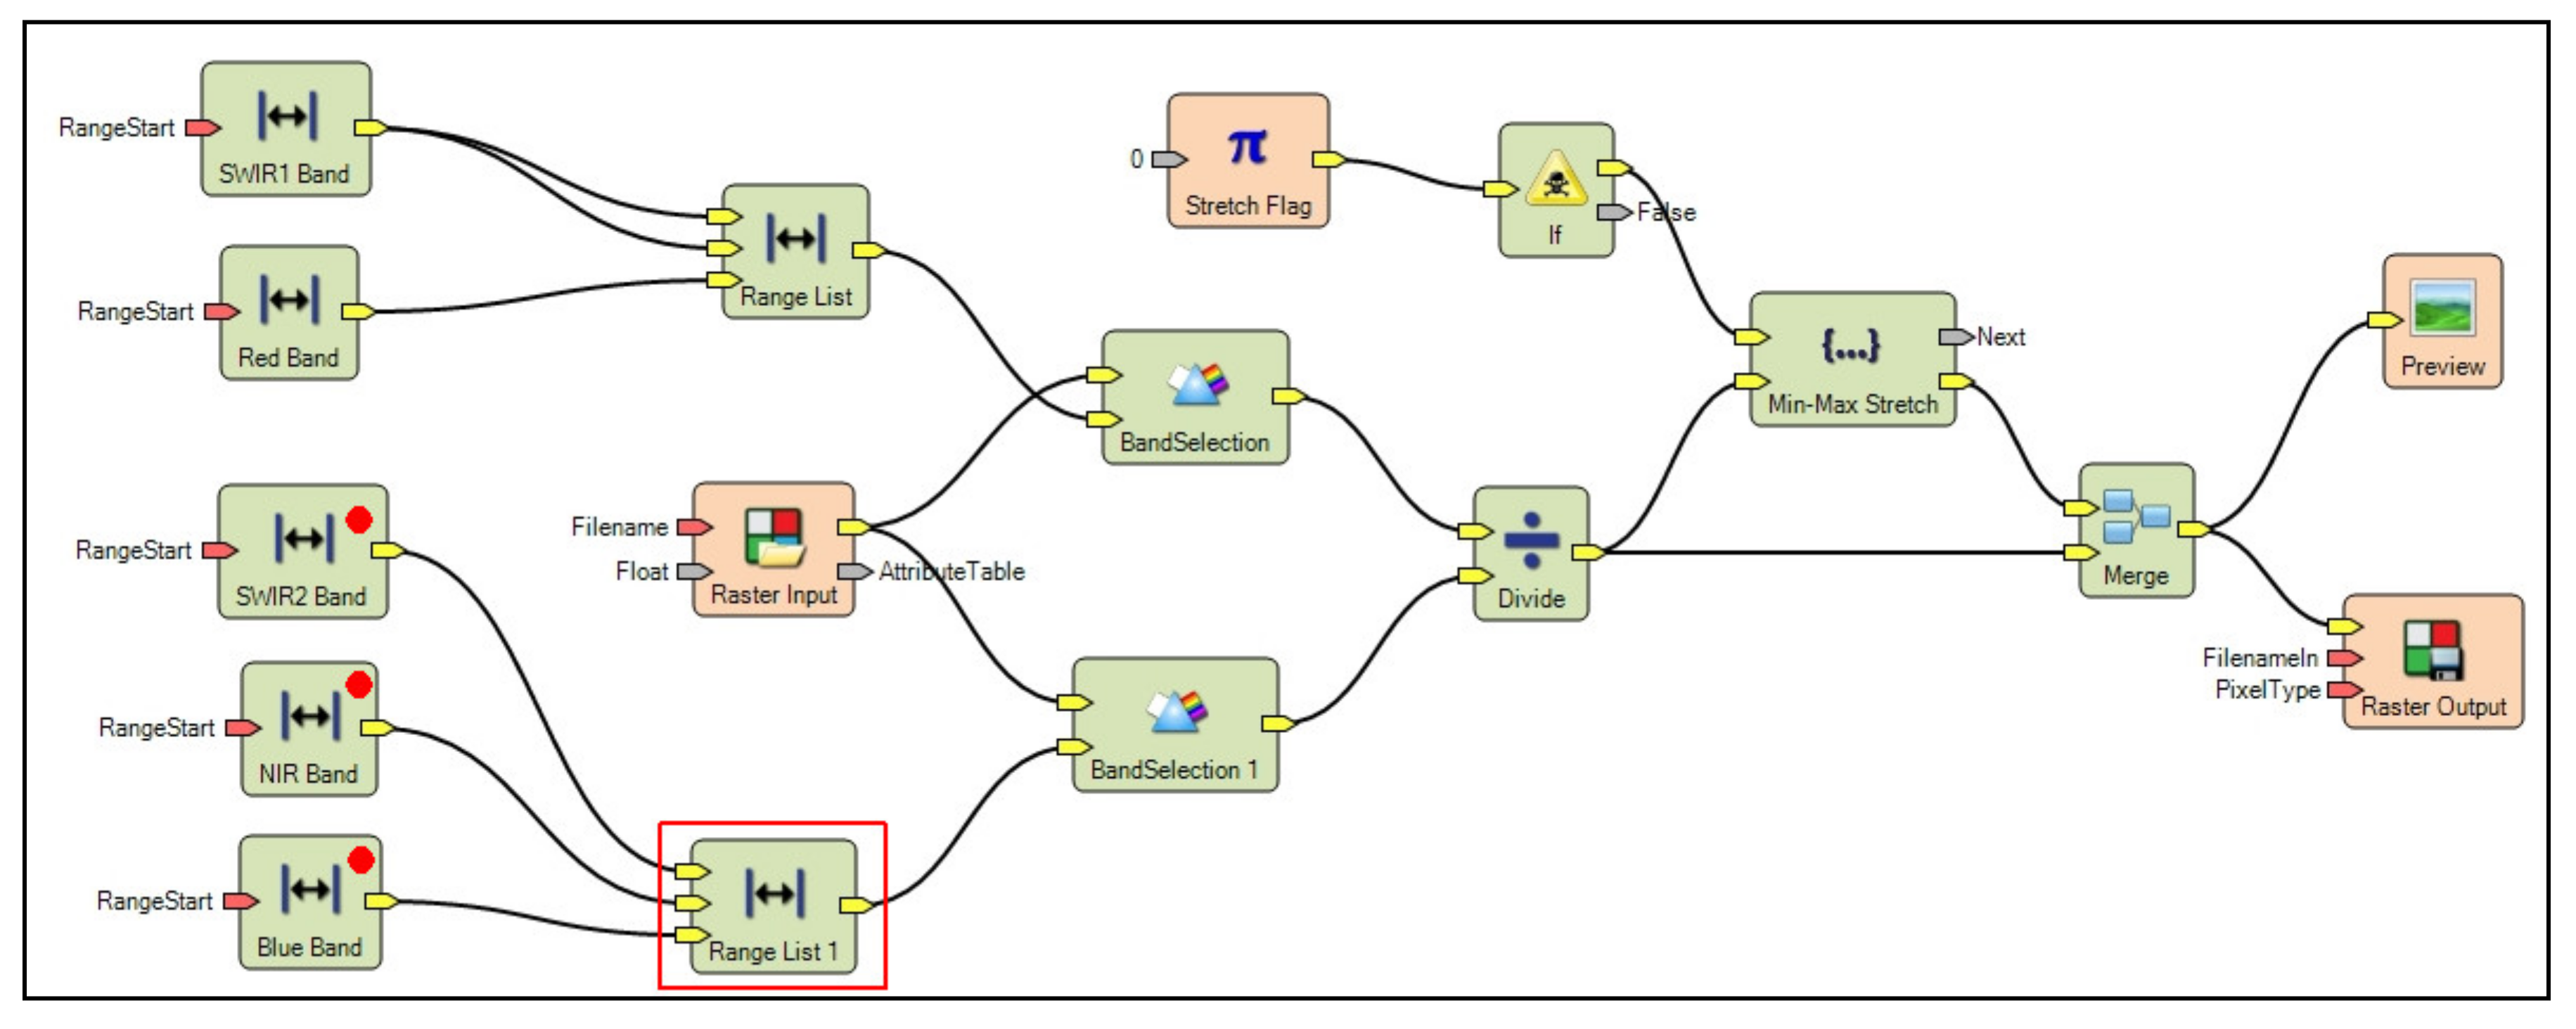
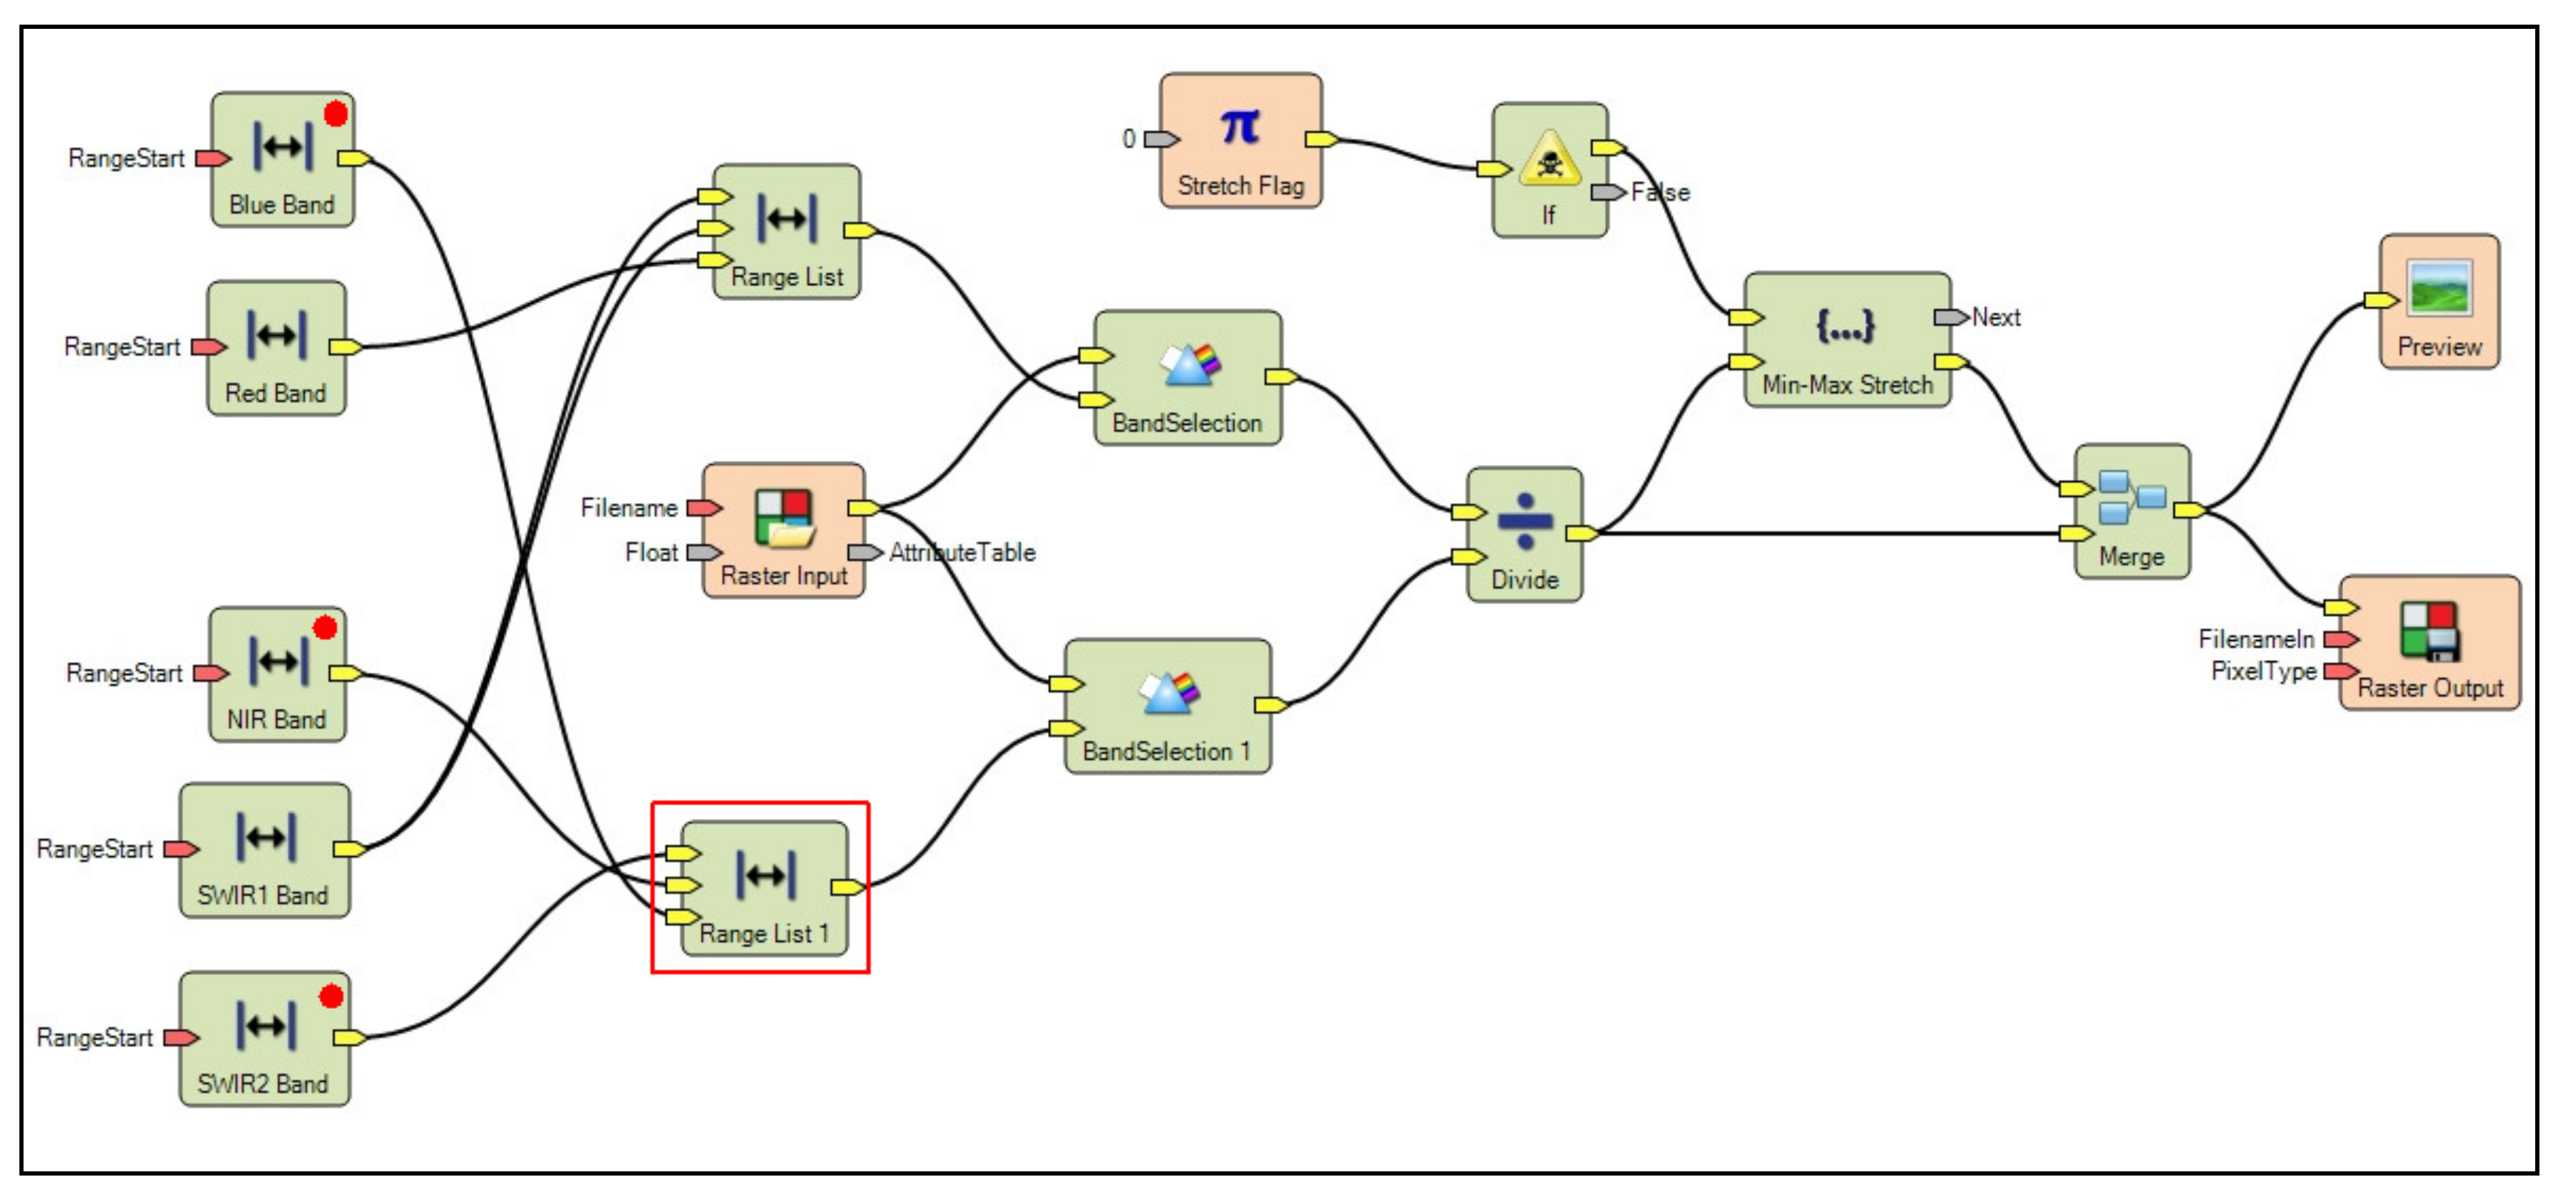
Appendix A. Eye-Tracking Experiment: List of Tasks and Models from ERDAS IMAGINE Spatial Model Editor



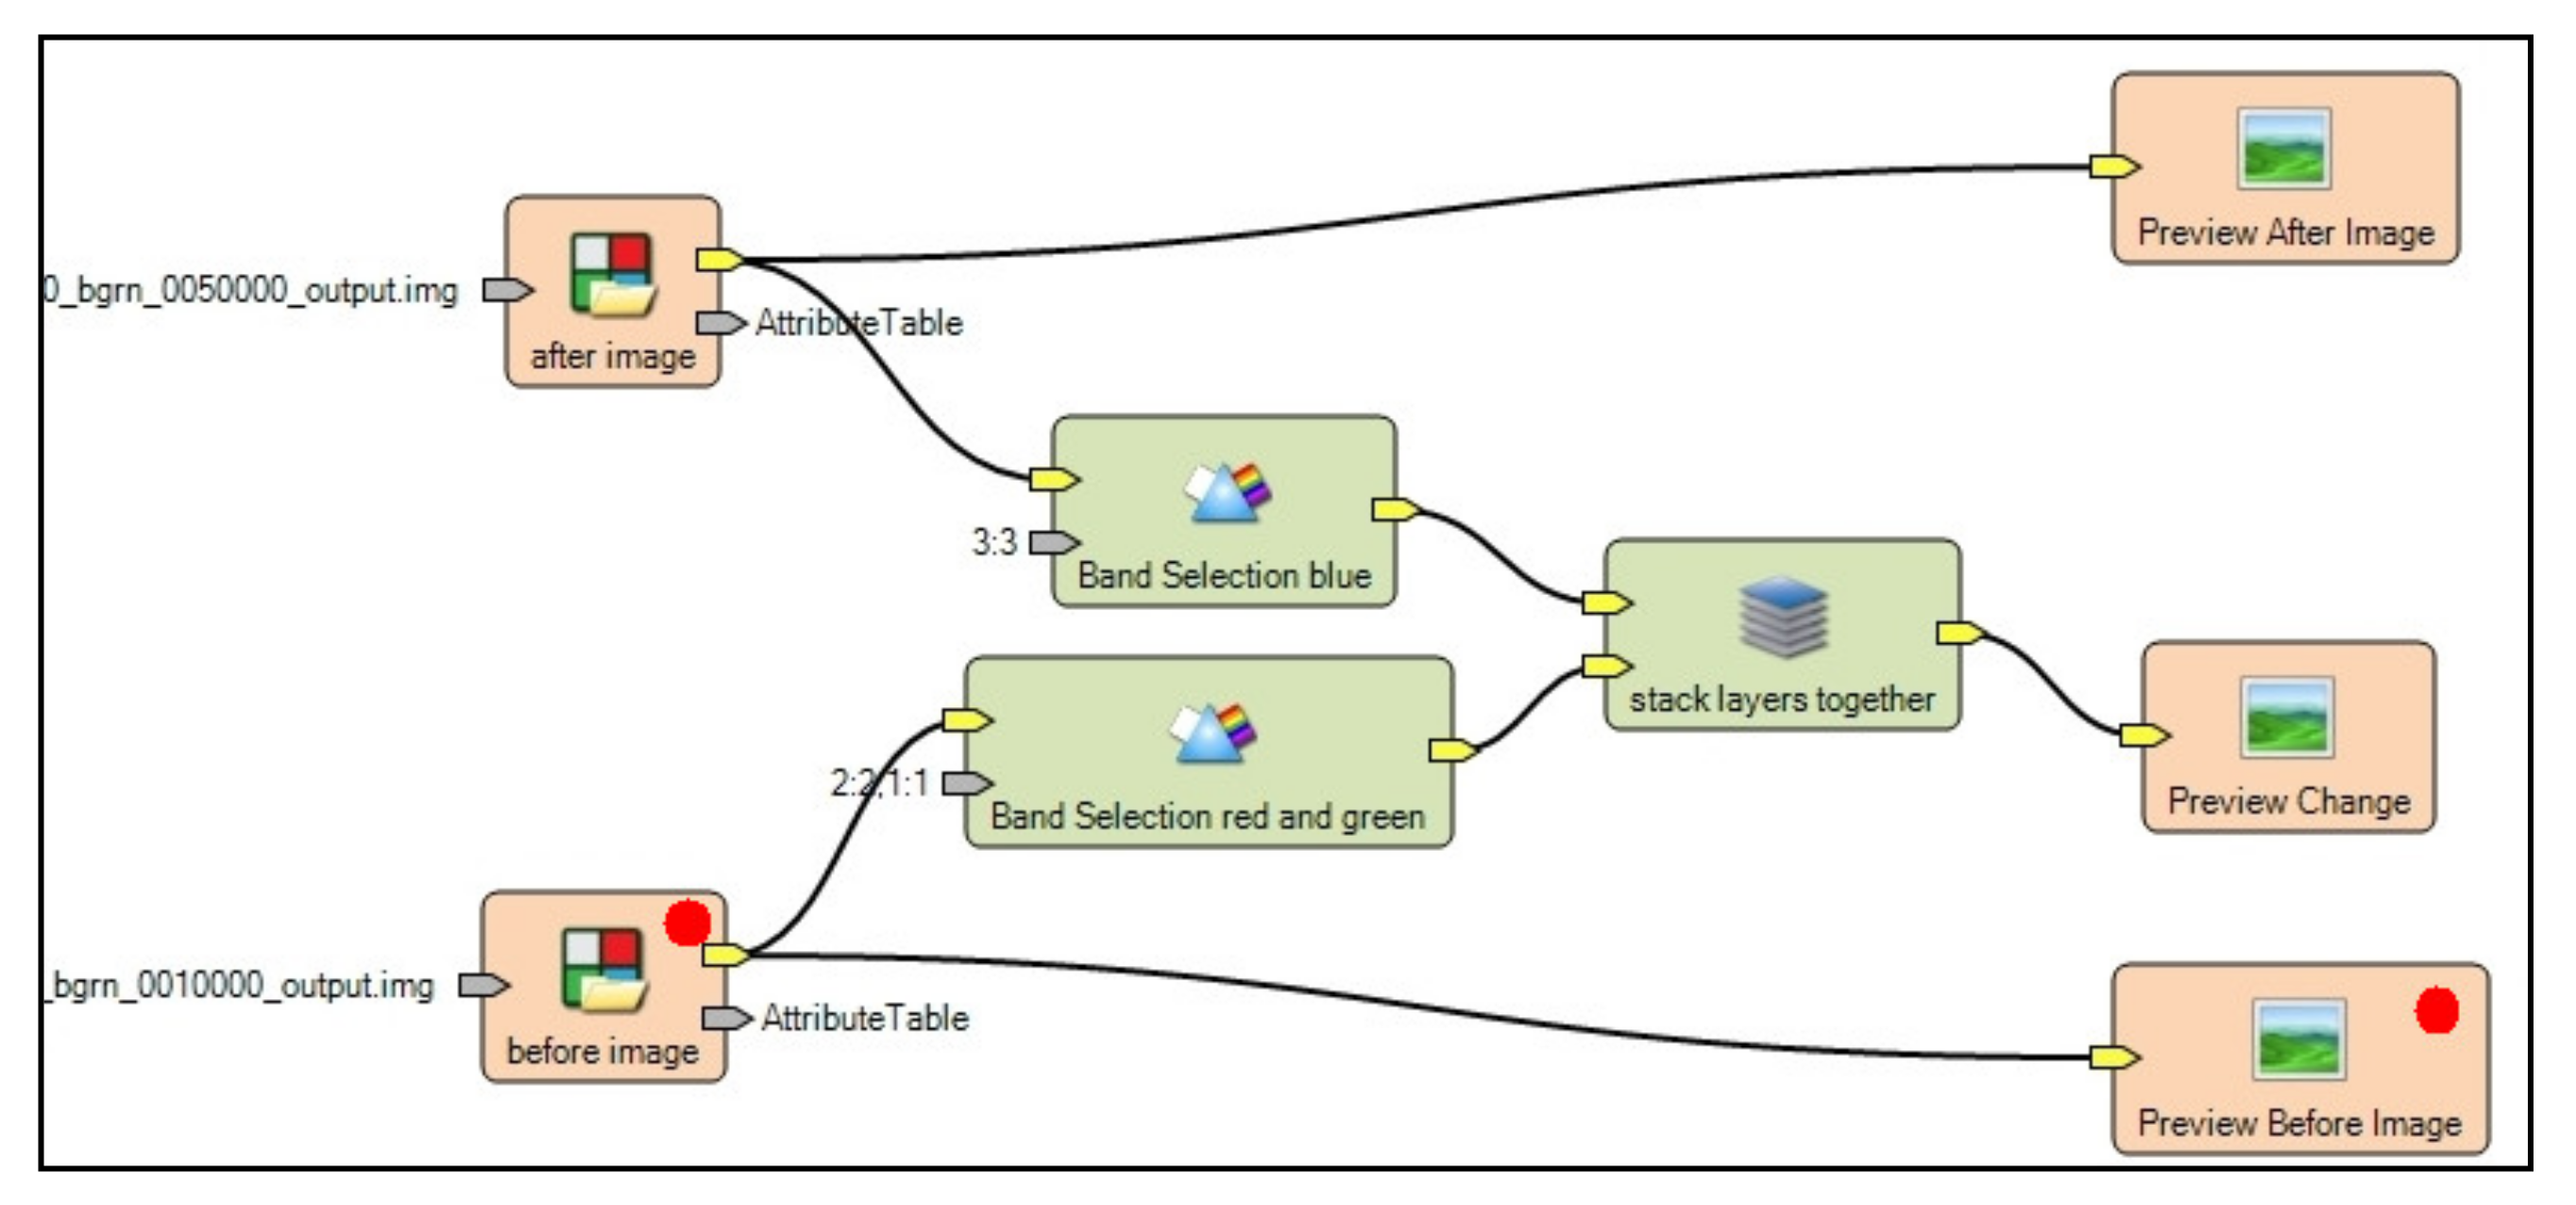
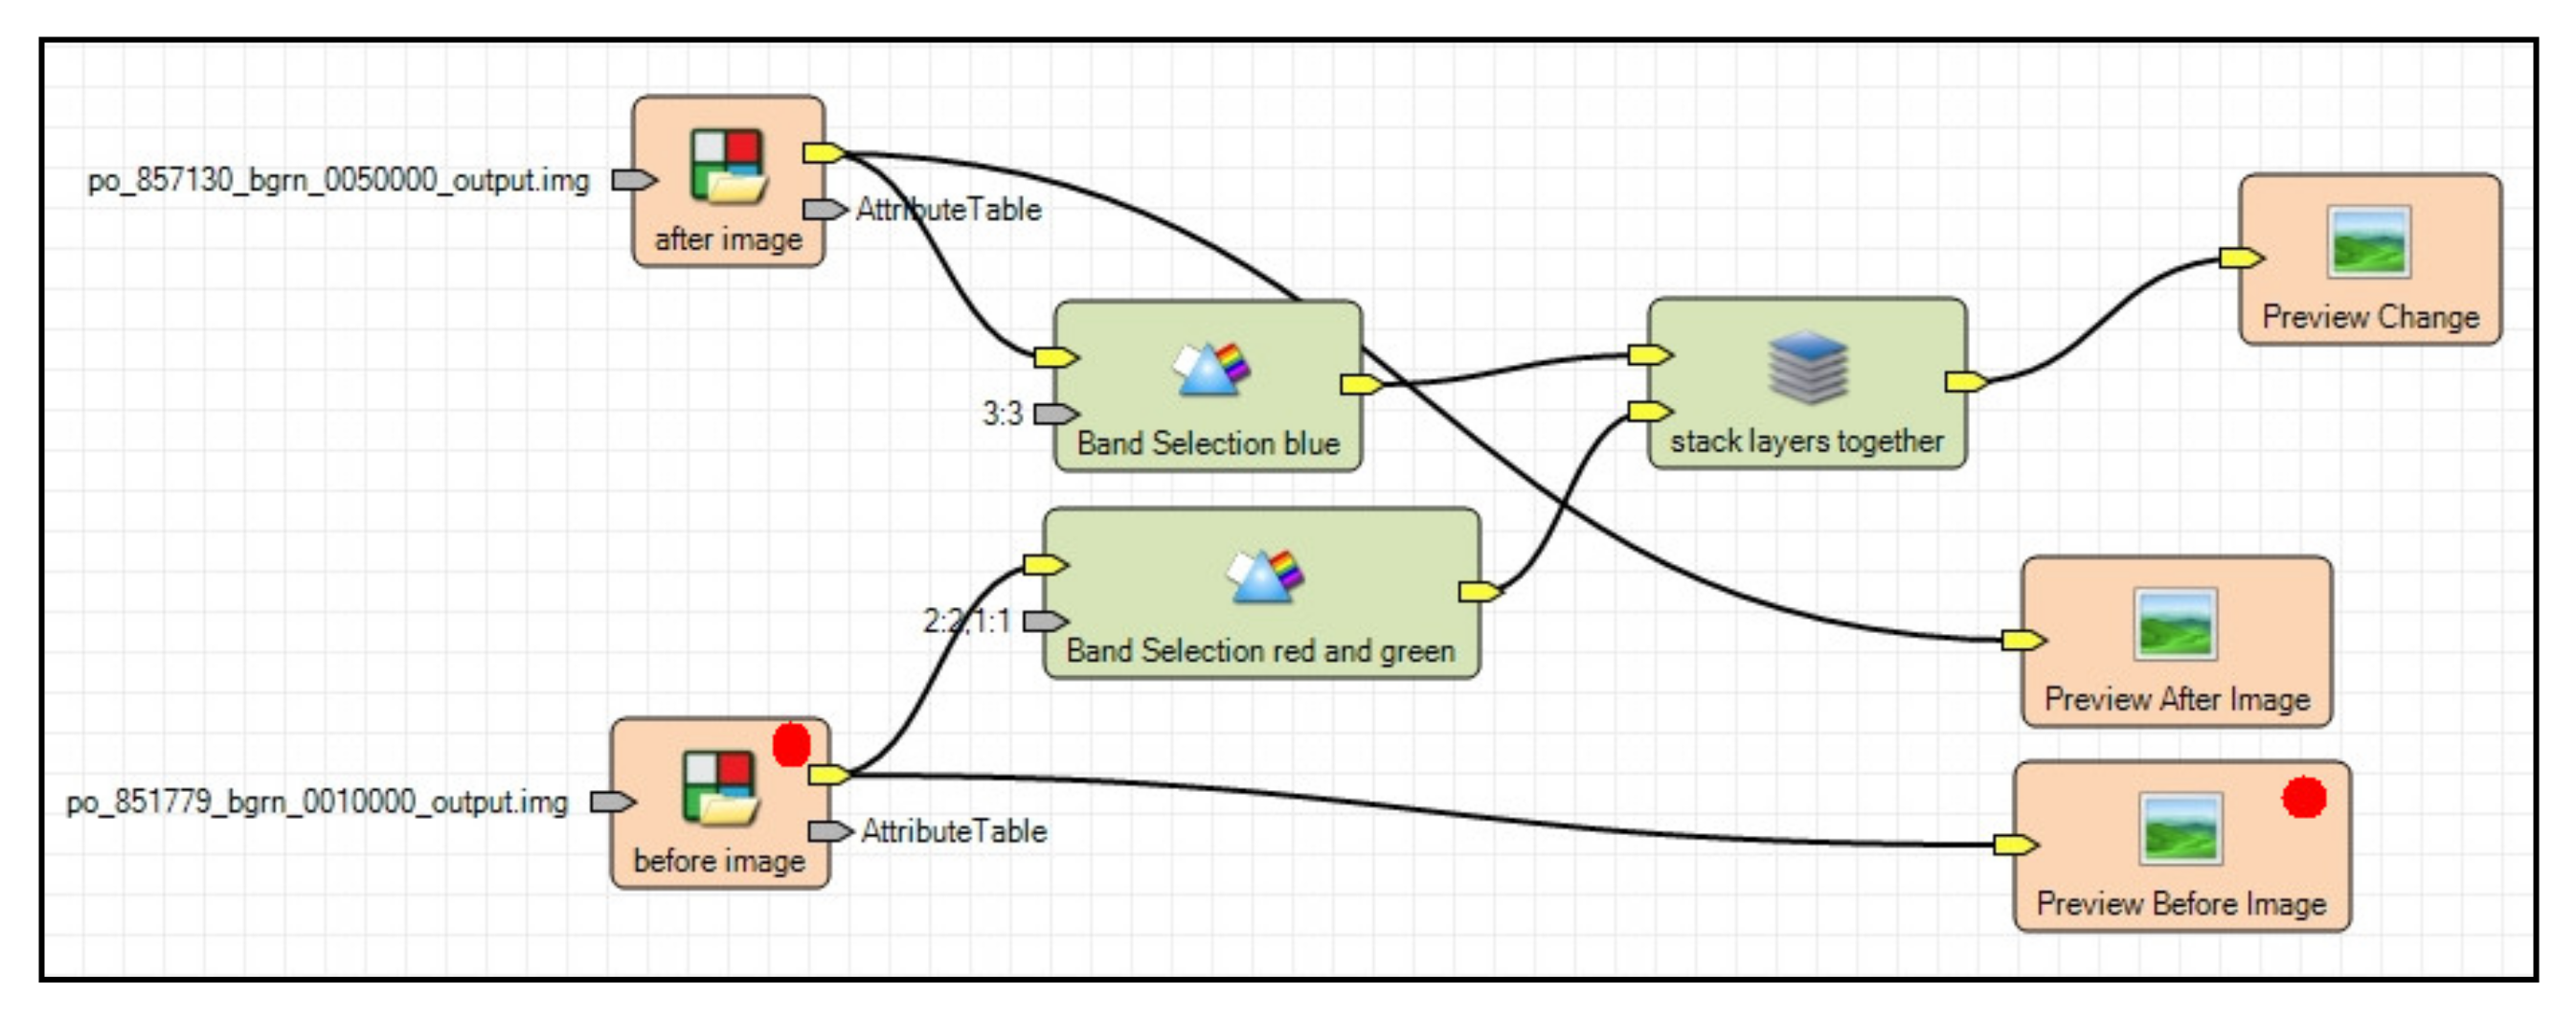
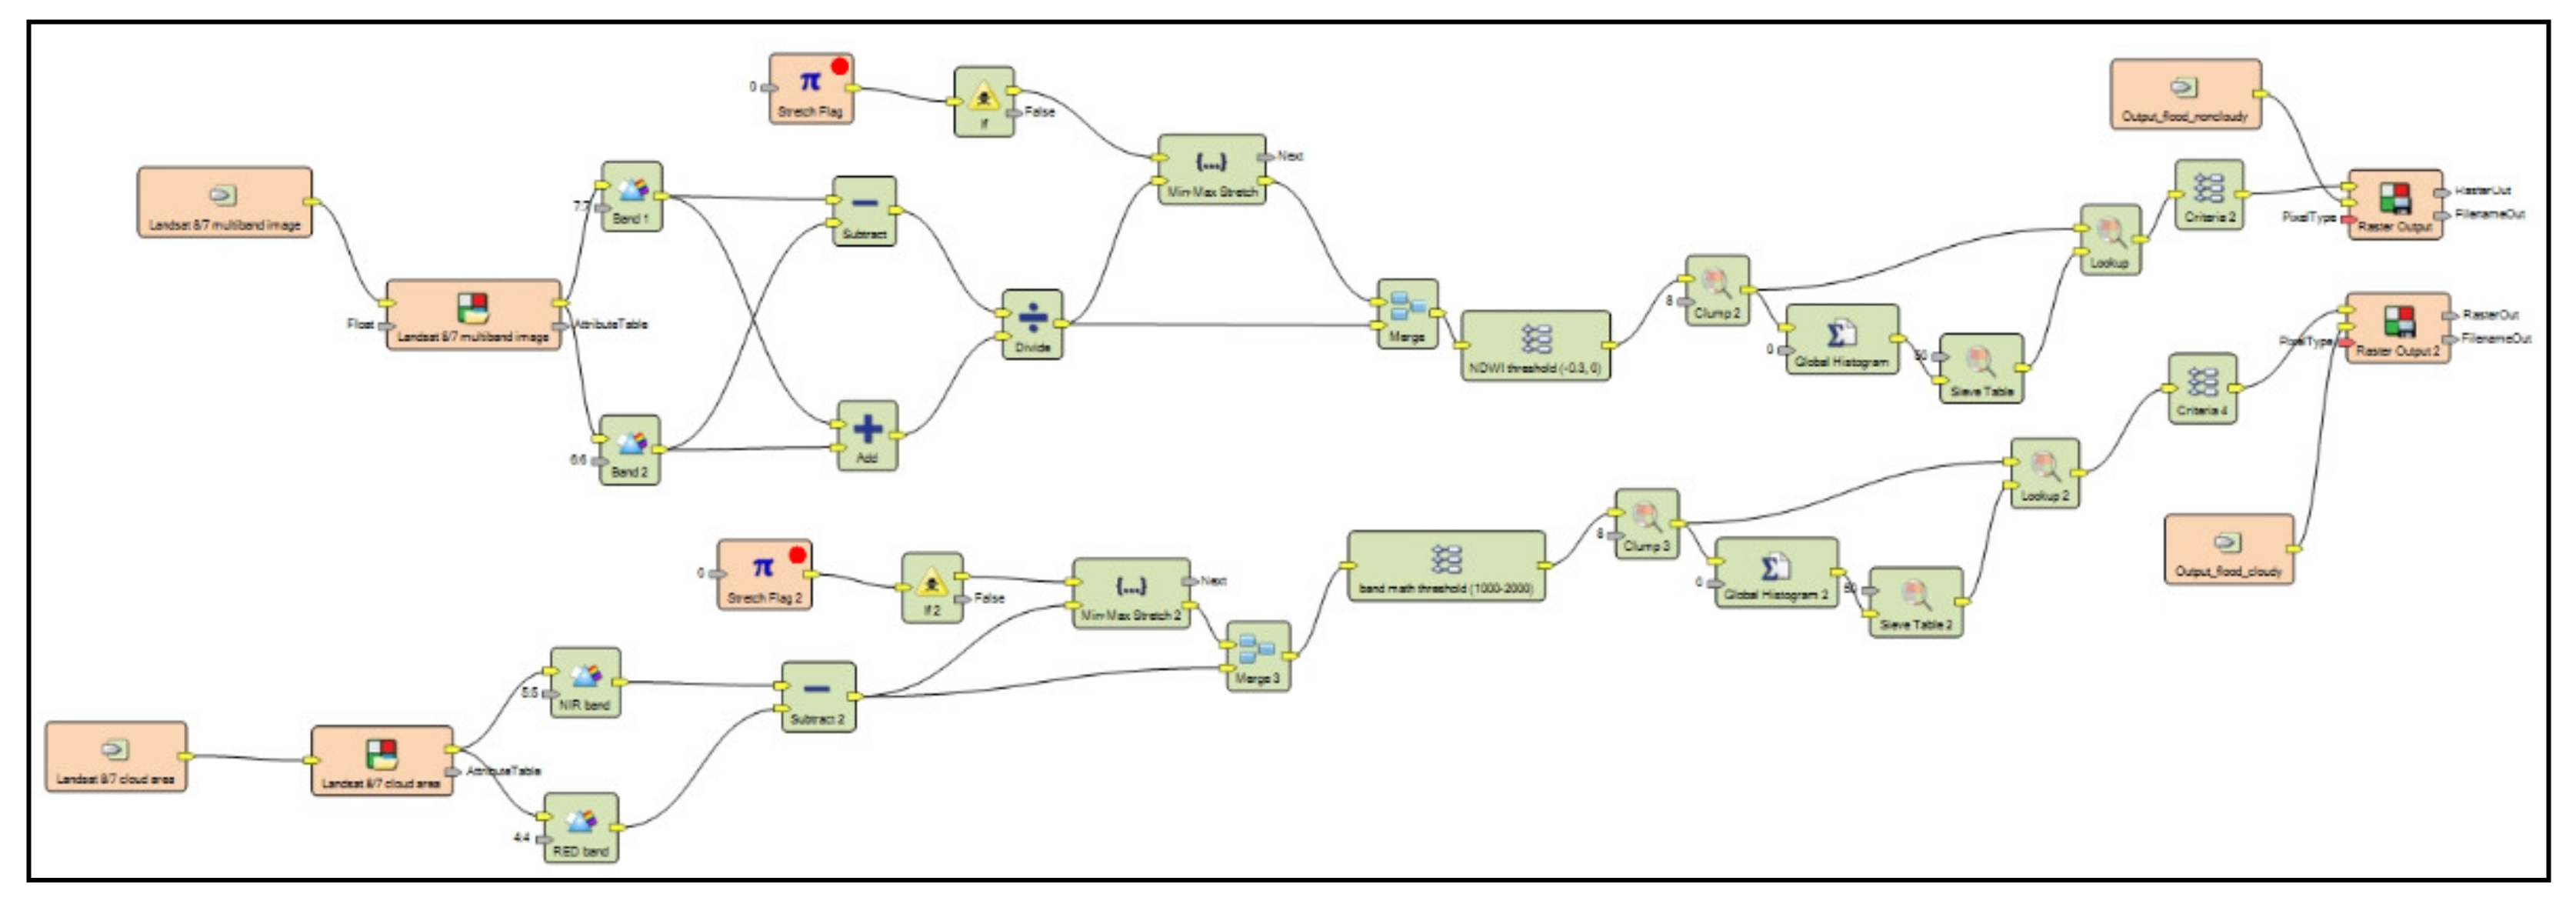


Appendix B. Descriptive Statistics and Tests of Eye-Tracking Measurement
| Statistics | Raster Input | Raster Output | Preview | Matrix | Parameter | Scalar |
|---|---|---|---|---|---|---|
| Number of correct answers | 16 | 15 | 16 | 14 | 4 | 14 |
| Mean | 3.1318 | 3.801 | 4.0584 | 6.4166 | 14.5652 | 9.4279 |
| Median | 2.7976 | 3.6409 | 3.4024 | 6.2623 | 14.7526 | 8.586 |
| Std. Deviation | 1.5018 | 1.5742 | 2.0472 | 2.2053 | 6.7681 | 4.6763 |
| Statistics | Value |
|---|---|
| H Chi-Square | 39.4804 |
| df (degrees of freedom) | 5 |
| p-value | 1.901e-7 |
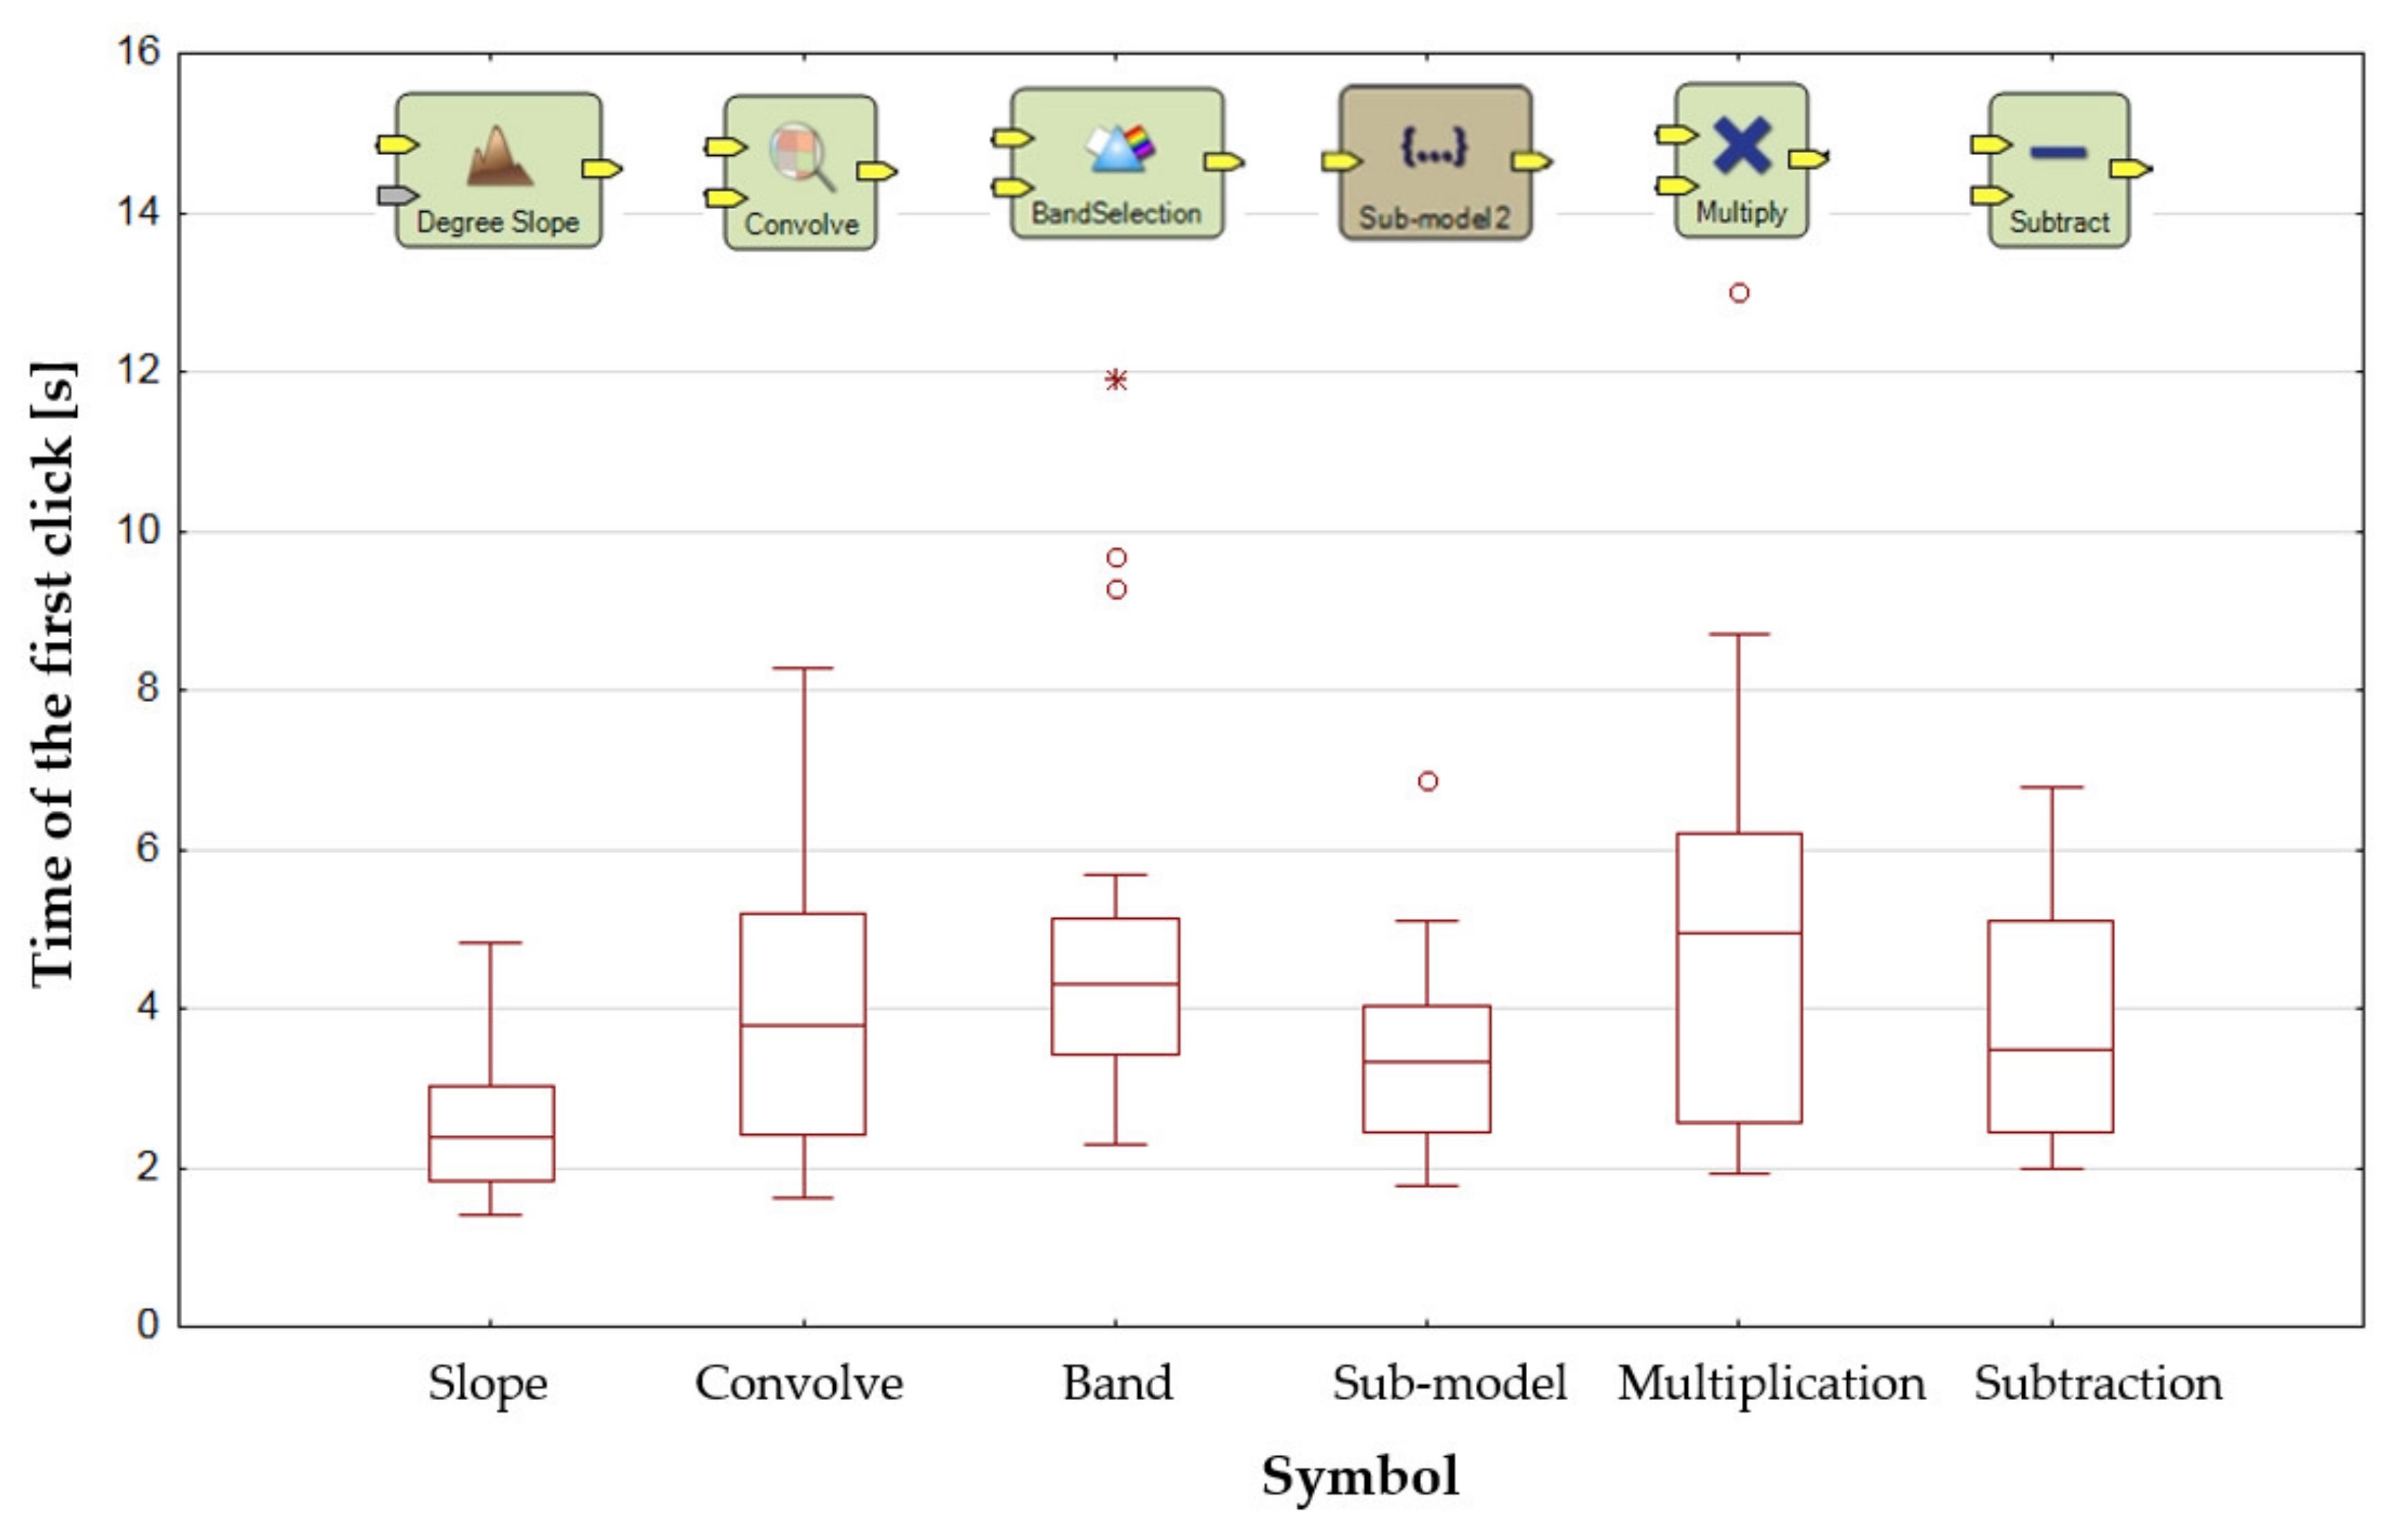
| Statistics | Slope | Convolve | Band | Sub-Model | Multiplay | Subtract |
|---|---|---|---|---|---|---|
| Number of correct answers | 16 | 16 | 16 | 16 | 16 | 15 |
| Mean | 2.4983 | 4.0359 | 5.0733 | 5.5453 | 3.7873 | |
| Median | 2.3987 | 3.7736 | 4.3135 | 3.3326 | 4.9461 | 3.4942 |
| Std. Deviation | 0.9356 | 1.9825 | 2.7733 | 1.3042 | 3.7396 | 1.5152 |
| Statistics | Value |
|---|---|
| H Chi-Square | 18.7128 |
| df (degrees of freedom) | 5 |
| p-value | 0.002174 |
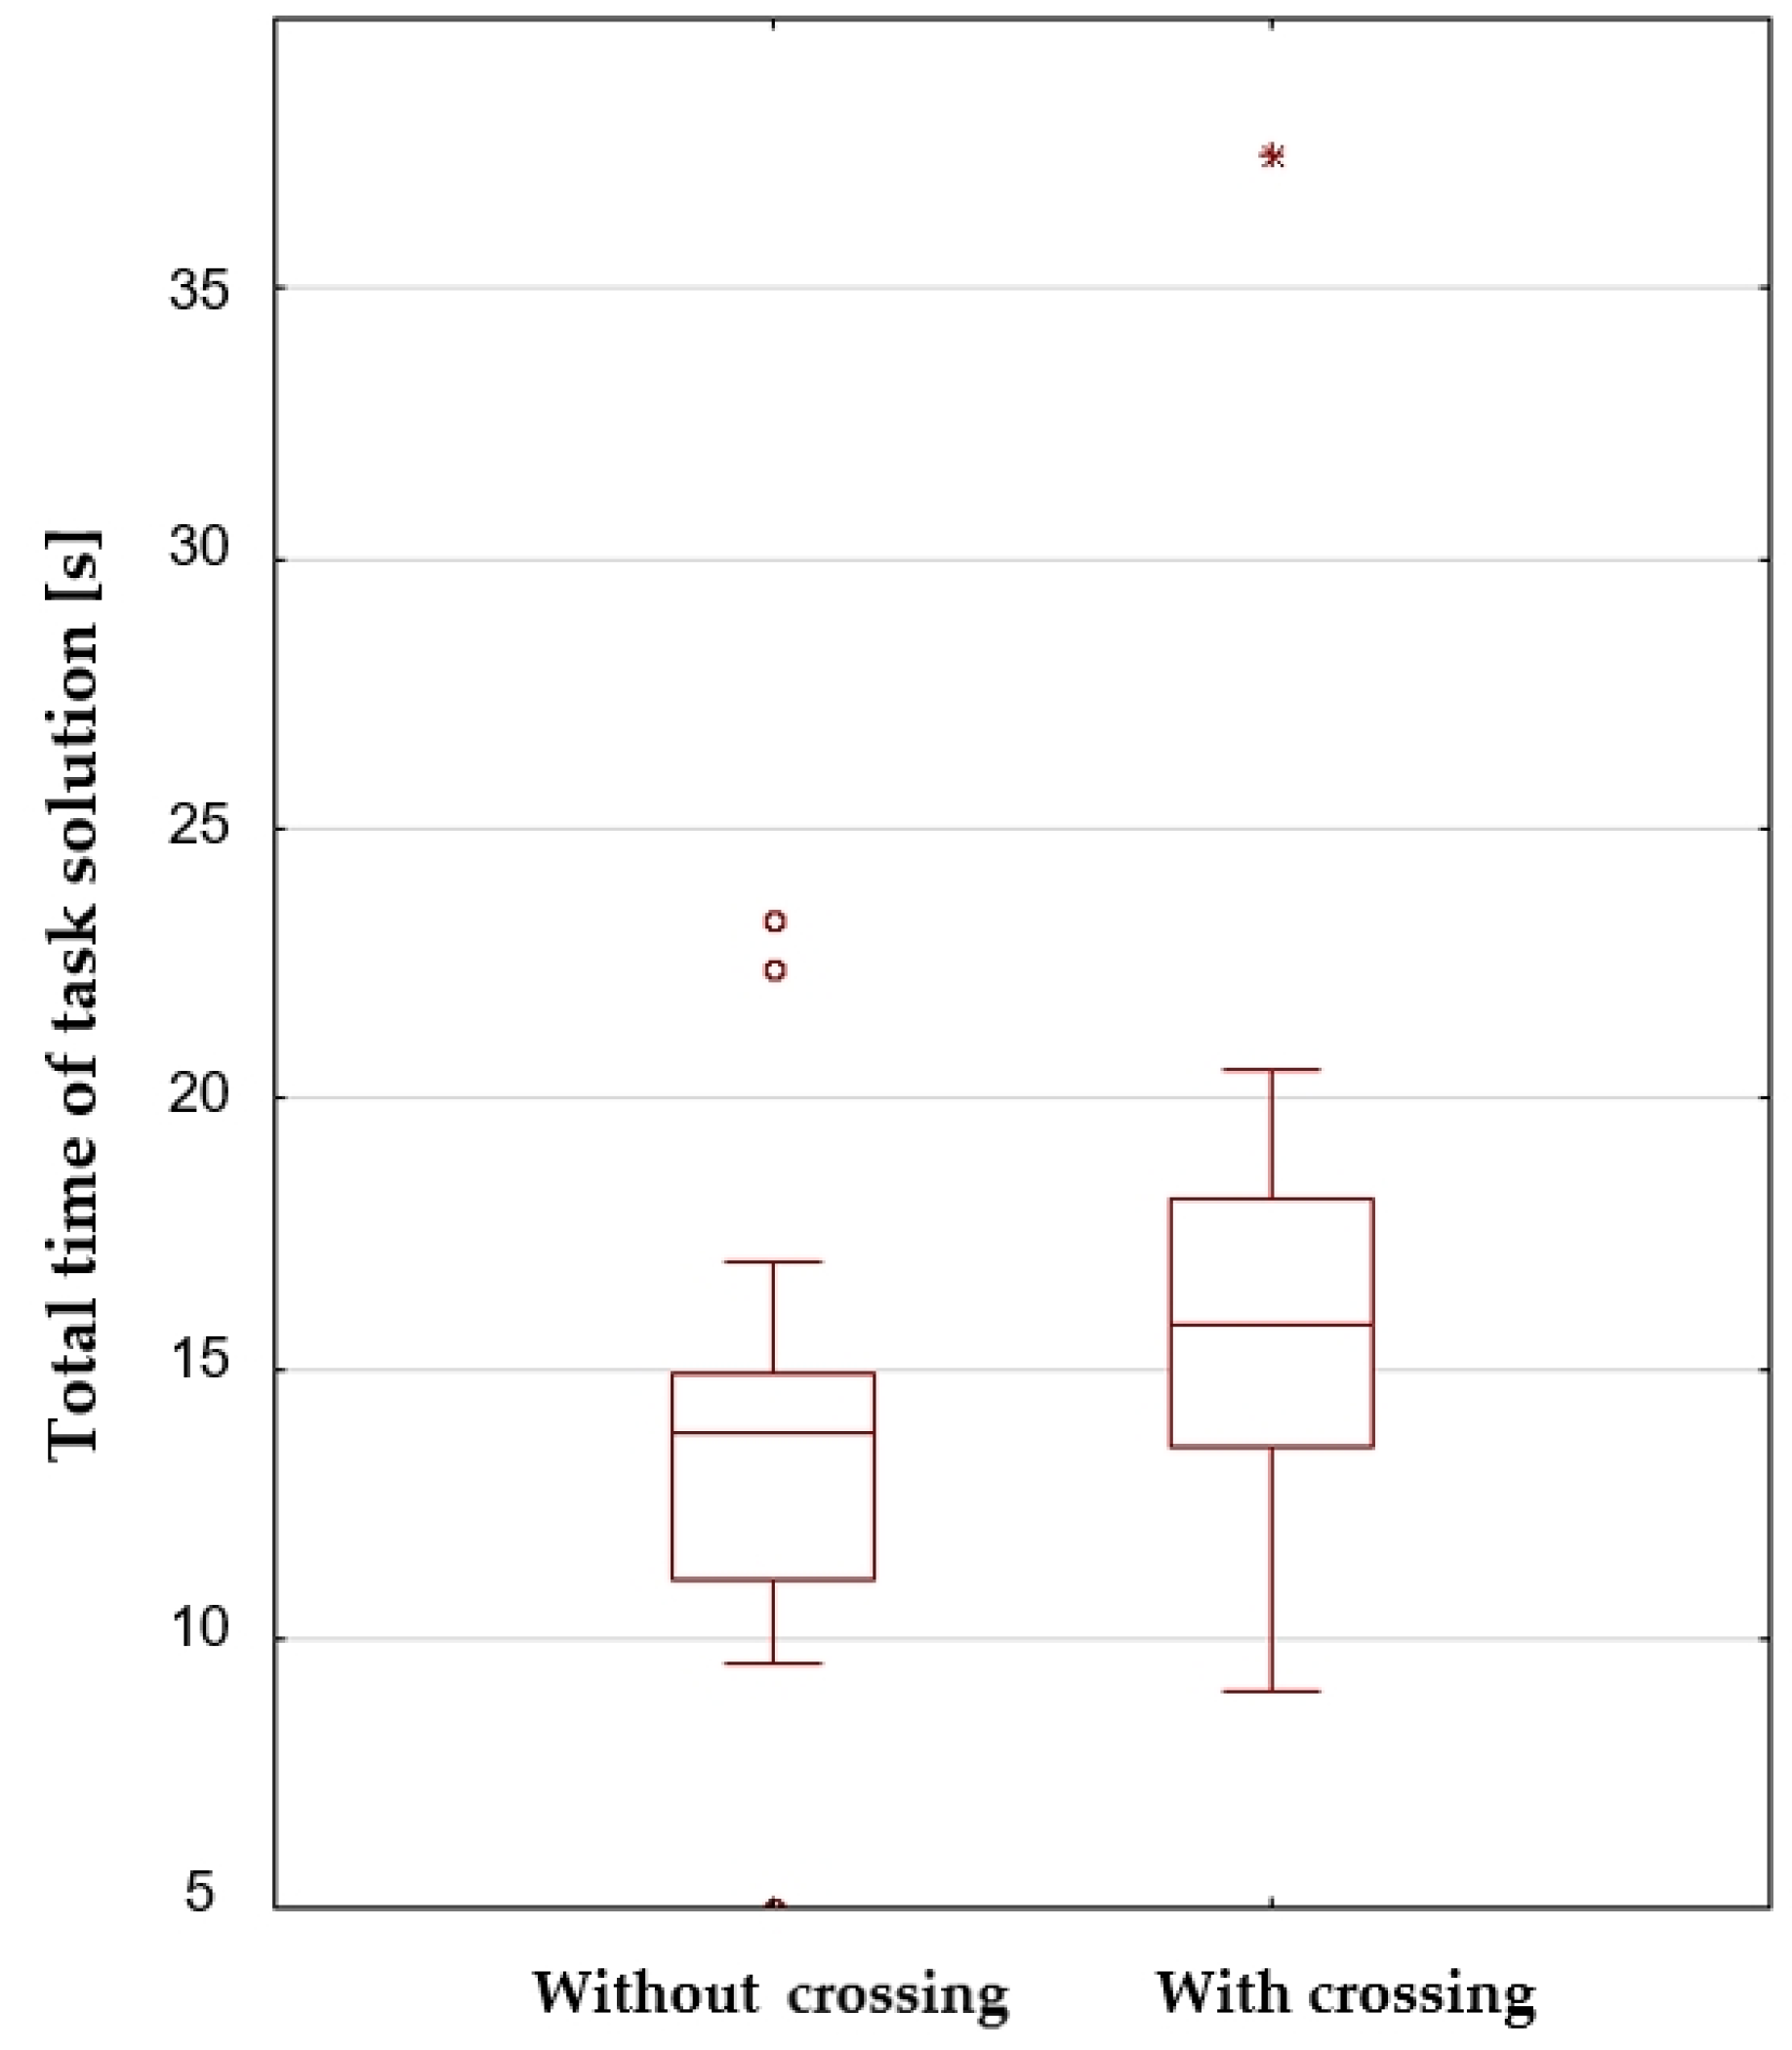
| Statistics | Task A15 without Crossing Lines | Task A16 with Crossing Lines |
|---|---|---|
| Number | 16 | 16 |
| Mean | 14.4449 | 18.1678 |
| Median | 13.0630 | 15.9491 |
| Std. Deviation | 5.3479 | 4.2089 |
| Statistics | Value |
|---|---|
| Z | −4.169569 |
| p-value | 0.00003052 |
References
- Dobesova, Z. Strengths and weaknesses in data flow diagrams in GIS. In Proceedings of the Computer Sciences and Applications (CSA), 2013 International Conference, Wuhan, China, 14–15 December 2013; pp. 803–807. [Google Scholar]
- Dobesova, Z. Data flow diagrams in geographic information systems: A survey. In Proceedings of the 14th SGEM GeoConference on Informatics, Geoinformatics and Remote Sensing, Albena, Bulgaria, 17–26 2014; STEF92 Technology Ltd.: Sofia, Bulgaria, 2014; Volume 1, pp. 705–712. [Google Scholar]
- Dobesova, Z. Visual Programming for GIS Applications. Geogr. Inf. Sci. Technol. Body Knowl. 2020, 2020. [Google Scholar] [CrossRef]
- Avison, D.E.; Fitzgerald, G. Information Systems Development: Methodologies, Techniques and Tools, 4th ed.; McGraw-Hill: New York, NY, USA, 2006. [Google Scholar]
- Mayer, R.E.; Moreno, R. Nine ways to reduce cognitive load in multimedia learning. Educ. Psychol. 2003, 38, 43–52. [Google Scholar] [CrossRef] [Green Version]
- Bertin, J. Semiology of Graphics; University of Wisconsin Press: Madison, WI, USA, 1983; ISBN 0299090604. [Google Scholar]
- Goolkasian, P. Pictures, words, and sounds: From which format are we best able to reason? J. Gen. Psychol. 2000, 127, 439–459. [Google Scholar] [CrossRef] [PubMed]
- Paivio, A. Mental Representations: A Dual Coding Approach; Oxford University Press: London, UK, 2008; ISBN 9780199894086. [Google Scholar]
- Beaty, P. A Brief History of ERDAS IMAGINE. Available online: http://field-guide.blogspot.com/2009/04/brief-history-of-erdas-imagine.html (accessed on 19 May 2021).
- ERDAS IMAGINE® 2015, Product Features and Comparisons, Product Description; Hexagon Geospatial: Madison, AL, USA, 2015.
- Intergraph ERDAS IMAGINE® 2013 Features Next-Generation Spatial Modeler. Available online: www.intergraph.com/assets/pressreleases/2012/10-23-2012b.aspx (accessed on 8 August 2020).
- Hexagon ERDAS Imagine Help, Introduction to Model Maker. Available online: https://hexagongeospatial.fluidtopics.net/r/Yld0EVQ2C9WQmlvERK2BHg/SaZ4fP63NvEw5Tjs2uBP_w (accessed on 18 May 2021).
- Holms, D.; Obusek, F. Automating Remote Sensing Workflows with Spatial Modeler. Available online: https://p.widencdn.net/im6mzj (accessed on 12 January 2020).
- Connell, J.O.; Connolly, J.; Holden, N.M. A multispectral multiplatform based change detection tool for vegetation disturbance on Irish peatlands. In Proceedings of the SPIE—The International Society for Optical Engineering, Prague, Czech Republic, 6 October 2011; Volume 8174. [Google Scholar]
- Ma, J.; Wu, T.Y.; Zhu, L.J.; Bi, Q.; Cheng, C.Q.; Zhou, H.M. Processing practice of remote sensing image based on spatial modeler. In Proceedings of the 2012 2nd International Conference on Remote Sensing, Environment and Transportation Engineering, RSETE 2012, Nanjing, China, 1–3 June 2012. [Google Scholar]
- Laosuwan, T.; Pattanasethanon, S.; Sa-Ngiamvibool, W. Automated cloud detection of satellite imagery using spatial modeler language and ERDAS macro language. IETE Tech. Rev. (Inst. Electron. Telecommun. Eng. India) 2013, 30, 183–190. [Google Scholar] [CrossRef]
- Chen, X.; Yuan, Z.; Li, Y.; Wai, O. Spatial and temporal dynamics of suspended sediment concentration in the pearl river estuary based on remote sensing. Geomatics Inf. Sci. Wuhan Univ. 2005, 30, 677–681. [Google Scholar]
- Park, J.K.; Na, S.I.; Park, J.H. Evaluation of surface heat flux based on satellite remote sensing and field measurement data. In Proceedings of the International Geoscience and Remote Sensing Symposium (IGARSS), Munich, Germany, 22–27 July 2012; pp. 1108–1111. [Google Scholar]
- Pechanec, V.; Vavra, A.; Hovorkova, M.; Brus, J.; Kilianova, H. Analyses of moisture parameters and biomass of vegetation cover in southeast Moravia. Int. J. Remote Sens. 2014, 35, 967–987. [Google Scholar] [CrossRef]
- Miřijovský, J.; Langhammer, J. Multitemporal Monitoring of the Morphodynamics of a Mid-Mountain Stream Using UAS Photogrammetry. Remote Sens. 2015, 7, 8586–8609. [Google Scholar] [CrossRef] [Green Version]
- Chen, B.B.; Gong, H.L.; Li, X.J.; Lei, K.C.; Zhu, L.; Wang, Y.B. The Impact of Load Density Differences on Land Subsidence Based on Build-Up Index and PS-InSAR Technology. Spectrosc. Spectr. Anal. 2013, 33, 2198–2202. [Google Scholar] [CrossRef]
- Liu, Z.; Zhan, C.; Sun, J.; Wei, Y. The extraction of snow cover information based on MODIS data and spatial modeler tool. In Proceedings of the 2008 International Workshop on Education Technology and Training and 2008 International Workshop on Geoscience and Remote Sensing, ETT and GRS 2008, Shanghai, China, 21–22 December 2008; Volume 1, pp. 836–839. [Google Scholar]
- Komarkova, J.; Machova, R.; Bednarcikova, I. Users requirements on quality of Web pages of municipal authority. E M Ekon. A Manag. 2008, 11, 116–126. [Google Scholar]
- Reeves, B.S. What Is the Relationship Between HCI Research and UX Practice? UX Matters 2014. Available online: https://www.uxmatters.com/mt/archives/2014/08/what-is-the-relationship-between-hci-research-and-ux-practice.php (accessed on 10 January 2021).
- Sedlák, P.; Komárková, J.; Hub, M.; Struška, S.; Pásler, M. Usability evaluation methods for spatial information visualisation case study: Evaluation of tourist maps. In Proceedings of the ICSOFT-EA 2015—10th International Conference on Software Engineering and Applications, Proceedings; Part of 10th International Joint Conference on Software Technologies, ICSOFT, Colmar, France, 20–22 July 2015; pp. 419–425. [Google Scholar]
- Komárková, J. Quality of Web Geographical Information Systems; University of Pardubice: Pardubice, Czech Republic, 2008; ISBN 978-80-7395-056-9. [Google Scholar]
- Moody, D. The physics of notations: Toward a scientific basis for constructing visual notations in software engineering. IEEE Trans. Softw. Eng. 2009, 35, 756–779. [Google Scholar] [CrossRef]
- Moody, D. Theory development in visual language research: Beyond the cognitive dimensions of notations. In Proceedings of the 2009 IEEE Symposium on Visual Languages and Human-Centric Computing, VL/HCC 2009, Corvallis, OR, USA, 20–24 September 2009; pp. 151–154. [Google Scholar]
- Moody, D.L. The “physics” of notations: A scientific approach to designing visual notations in software engineering. In Proceedings of the International Conference on Software Engineering, Cape Town, South Africa, 2–8 May 2010; ACM: Cape Town, South Africa, 2010; Volume 2, pp. 485–486. [Google Scholar]
- Mackinlay, J. Automating the Design of Graphical Presentations of Relational Information. ACM Trans. Graph. 1986, 5, 110–141. [Google Scholar] [CrossRef]
- Popelka, S.; Štrubl, O.; Brychtová, A. Smi2ogama. Available online: http://eyetracking.upol.cz/smi2ogama/ (accessed on 10 January 2021).
- Holmqvist, K.; Nyström, M.; Andersson, R.; Dewhurst, R.; Jarodzka, H.; Van de Weijer, J. Eye Tracking: A Comprehensive Guide to Methods and Measures; Oxford University Press: Oxford, UK, 2011; ISBN 9780199697083. [Google Scholar]
- Sterling Sterling Geo’s Spatial Modeler Library. Available online: http://www.sterlinggeo.com/spatial-modeler-library-index/ (accessed on 15 August 2016).
- Dobesova, Z. Evaluation of effective cognition for the QGIS processing modeler. Appl. Sci. 2020, 10, 1446. [Google Scholar] [CrossRef] [Green Version]
- Dobesova, Z. Testing of Perceptual Discriminability in Workflow Diagrams by Eye-Tracking Method. Adv. Intell. Syst. Comput. 2018, 661, 328–335. [Google Scholar]
- Dobesova, Z. Empirical testing of bends in workflow diagrams by eye-tracking method. Adv. Intell. Syst. Comput. 2017, 575, 158–167. [Google Scholar]
- Martin, D.W. Doing Psychology Experiments; Wadsworth Cengage Learning: Belmont, CA, USA, 2008; ISBN 0495115770. [Google Scholar]
- Jan, H. Overview of Statistical Methods: Data Analysis and Meta Analysis; Portal: Prague, Czech Republic, 2009. [Google Scholar]
- Jošt, J. Eye Movements, Reading and Dyslexia; Fortuna: Praha, Czech Republic, 2009; ISBN 978-80-7373-055-0. [Google Scholar]
- Dobesova, Z. Teaching database systems using a practical example. Earth Sci. Inform. 2016, 9. [Google Scholar] [CrossRef]





| Symbol 1 | Symbol 2 | Visual Distance | Discriminability |
|---|---|---|---|
 |  | 1–colour | good |
 |  | 1–colour | good |
 |  | 1–colour | good |
| Principle | Physics of Notations Evaluation | Eye-Tracking Results | Recommendations |
|---|---|---|---|
| Semiotic Clarity | The one-to-one correspondence is nearly fulfilled. Only some overloads exist in using the same icons for different operations from the same group. | Zero wrong answers indicate the fulfilment of principle in the case of symbols for data. | In the case of the same icons (overload symbols), do not change the label of the symbol because only this discriminates against them. |
| Perceptual Discriminability | Visual distance is 1. | Discriminability is without problems, thanks to inner icons. | No recommendation. |
| Visual Expressiveness | Level 1, the only colour is used as visual variables. | Some wrong answers indicate weak expressiveness by one visual variable. | No recommendation. |
| Graphic Economy | Basically, 3 symbols fulfil the graphic economy. | Some wrong answers in the case of Parameter symbol indicate the very high number of symbols considering icons. | No recommendation. |
| Dual Coding | Good automatic labelling of symbols. The possibility to change the text. | The text helps users find the proper symbols. | Seldom careful renaming of symbols. Do not use long text that prolongs the width of the rectangle symbol. |
| Semantic Transparency | High, symbols are semantically immediate thanks to big inner icons. | It is verified by short times to click and a high number of correct answers. | No recommendation. |
| Complexity Management | The creation of Sub-models is possible. Impossible to design more levels of the hierarchy than one. | Not tested. | Use sub-model in whenever possible in big models. |
| Cognitive Interaction | Unmanageable crossing and concurrence of curved lines. | The crossing lines take more time for comprehensibility and produce errors. | Use the automatic alignment of a model to the grid. Prevent crossing of lines in model designing by shifting the symbols. |
| Cognitive Fit | Dialects are missing | Not tested. | No recommendation. |
Publisher’s Note: MDPI stays neutral with regard to jurisdictional claims in published maps and institutional affiliations. |
© 2021 by the author. Licensee MDPI, Basel, Switzerland. This article is an open access article distributed under the terms and conditions of the Creative Commons Attribution (CC BY) license (https://creativecommons.org/licenses/by/4.0/).
Share and Cite
Dobesova, Z. Cognition of Graphical Notation for Processing Data in ERDAS IMAGINE. ISPRS Int. J. Geo-Inf. 2021, 10, 486. https://doi.org/10.3390/ijgi10070486
Dobesova Z. Cognition of Graphical Notation for Processing Data in ERDAS IMAGINE. ISPRS International Journal of Geo-Information. 2021; 10(7):486. https://doi.org/10.3390/ijgi10070486
Chicago/Turabian StyleDobesova, Zdena. 2021. "Cognition of Graphical Notation for Processing Data in ERDAS IMAGINE" ISPRS International Journal of Geo-Information 10, no. 7: 486. https://doi.org/10.3390/ijgi10070486
APA StyleDobesova, Z. (2021). Cognition of Graphical Notation for Processing Data in ERDAS IMAGINE. ISPRS International Journal of Geo-Information, 10(7), 486. https://doi.org/10.3390/ijgi10070486


