
Socio-Ecological Vulnerability in Aba Prefecture, Western Sichuan Plateau: Evaluation, Driving Forces and Scenario Simulation


 ,
, 


Abstract
:1. Introduction
2. Data Sources
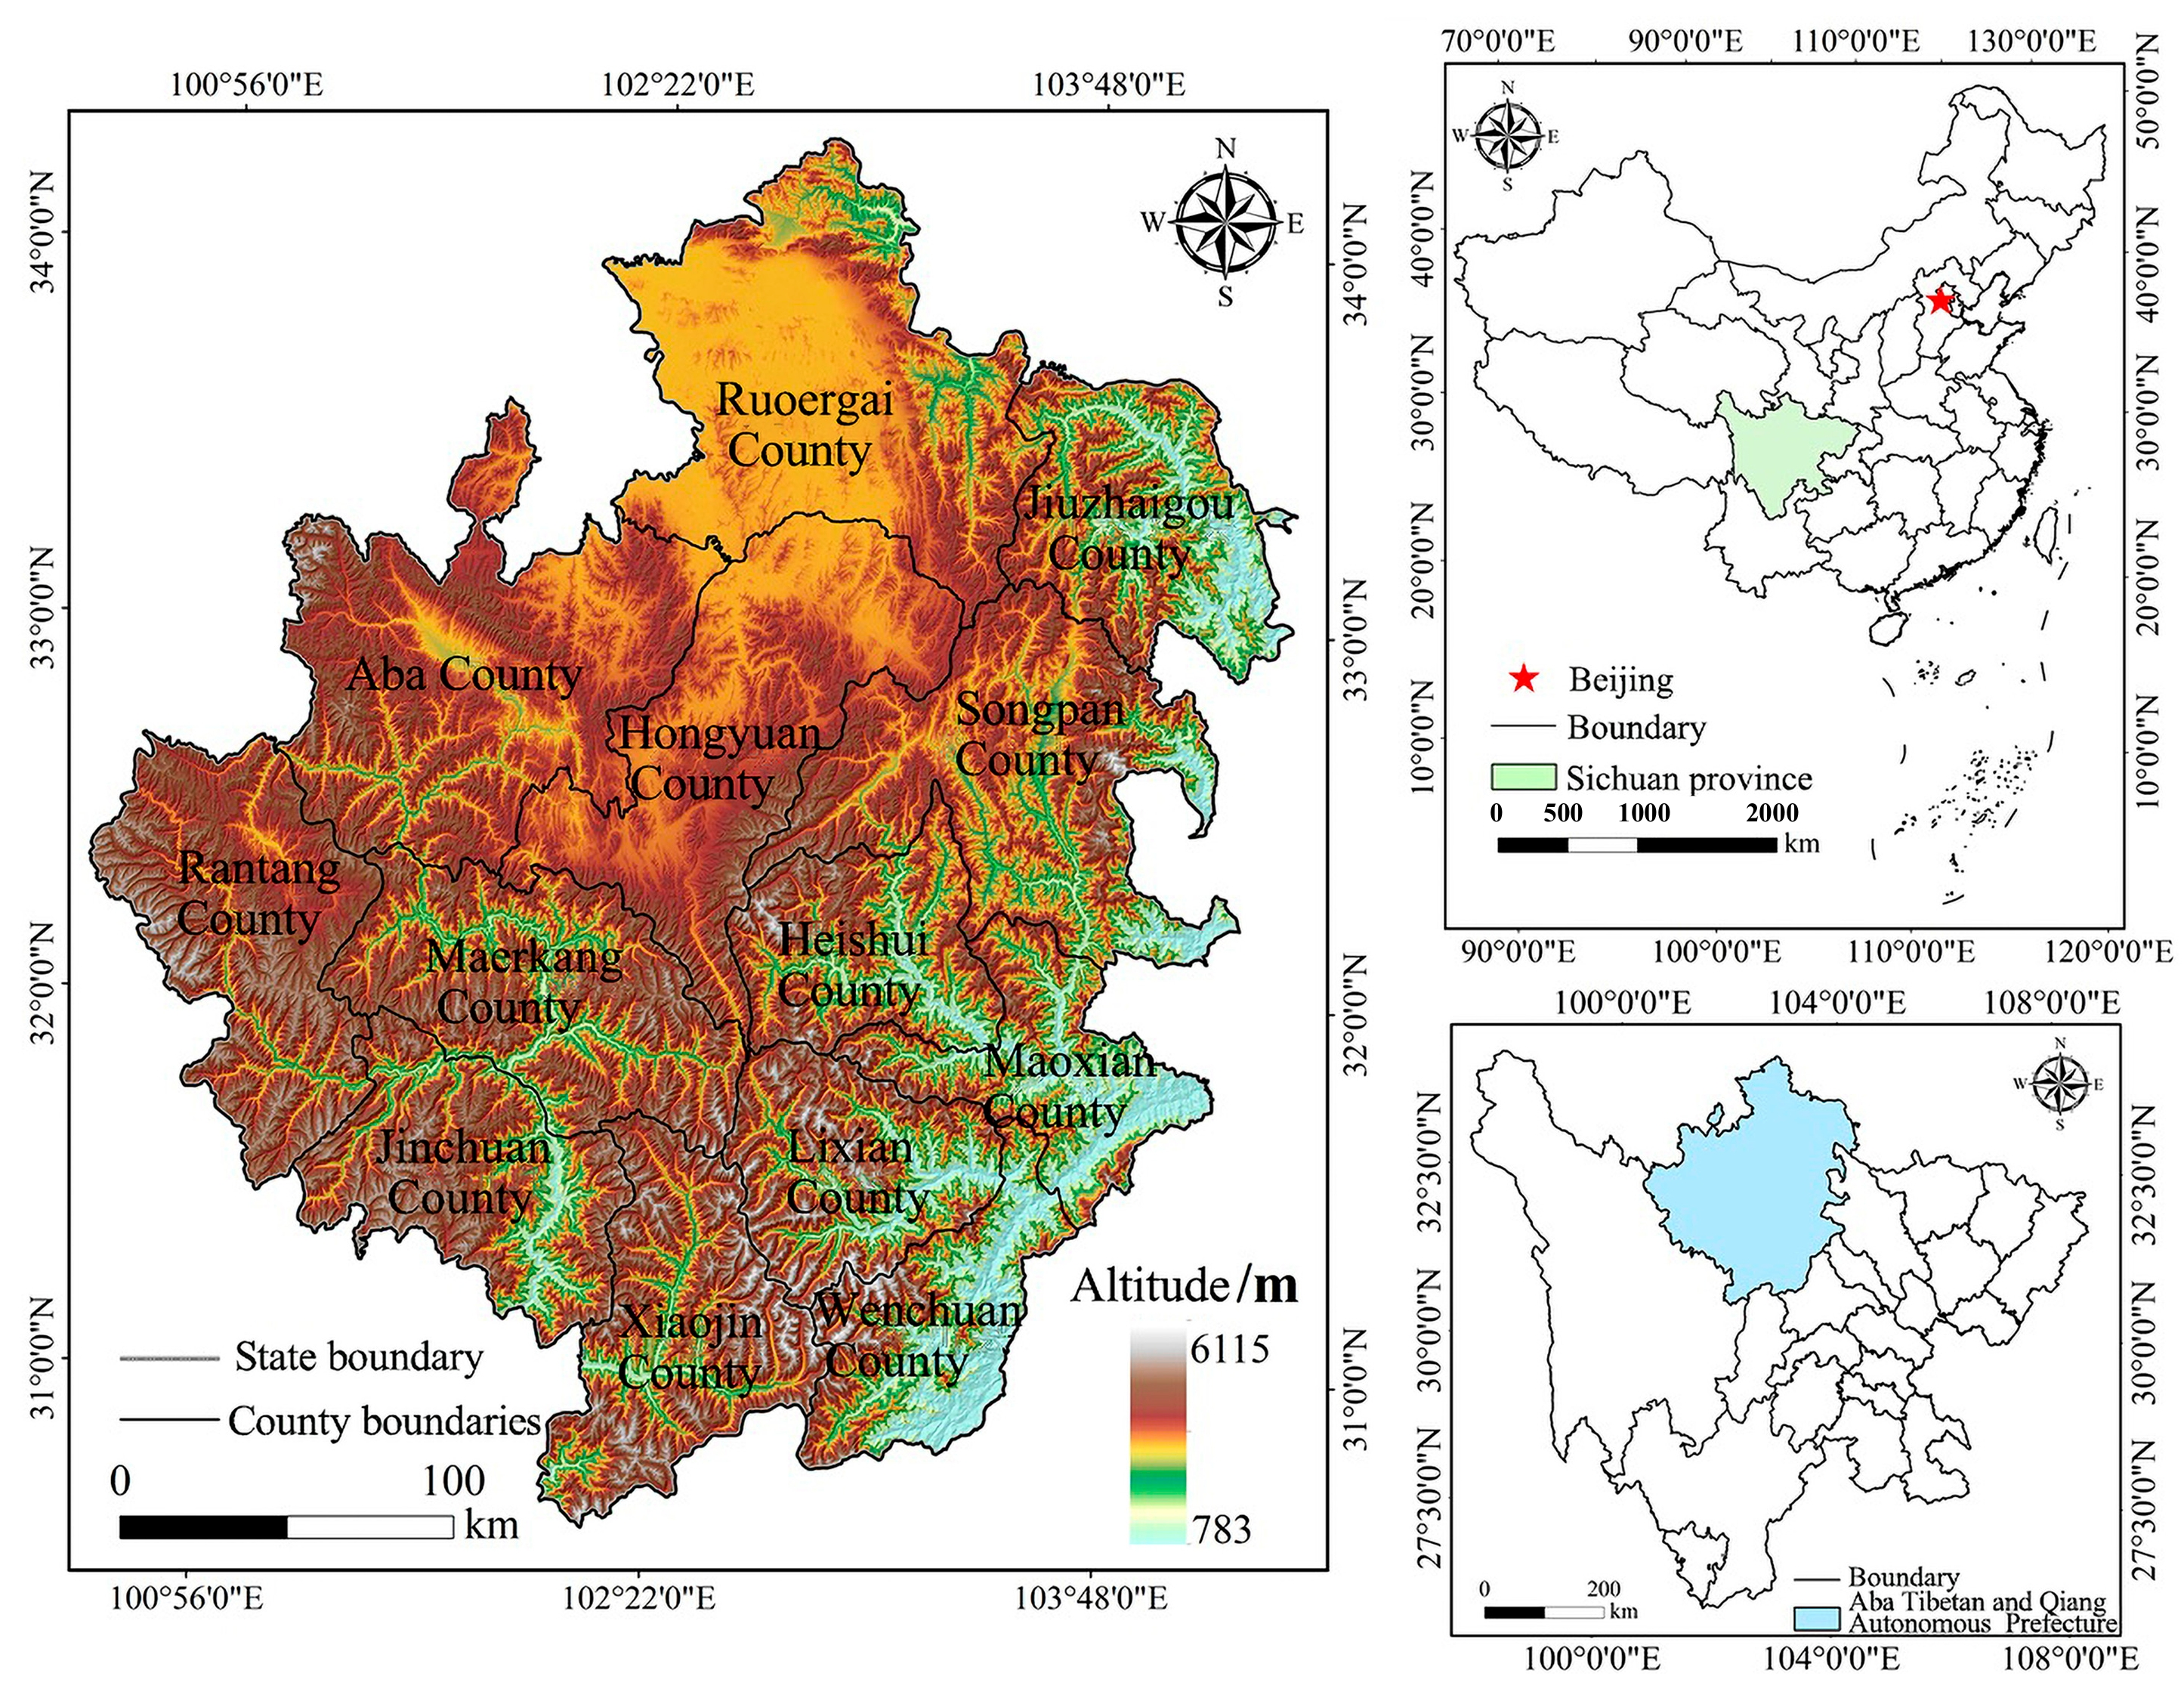
2.1. Overview of Study Area
2.2. Data Sources
3. Methods
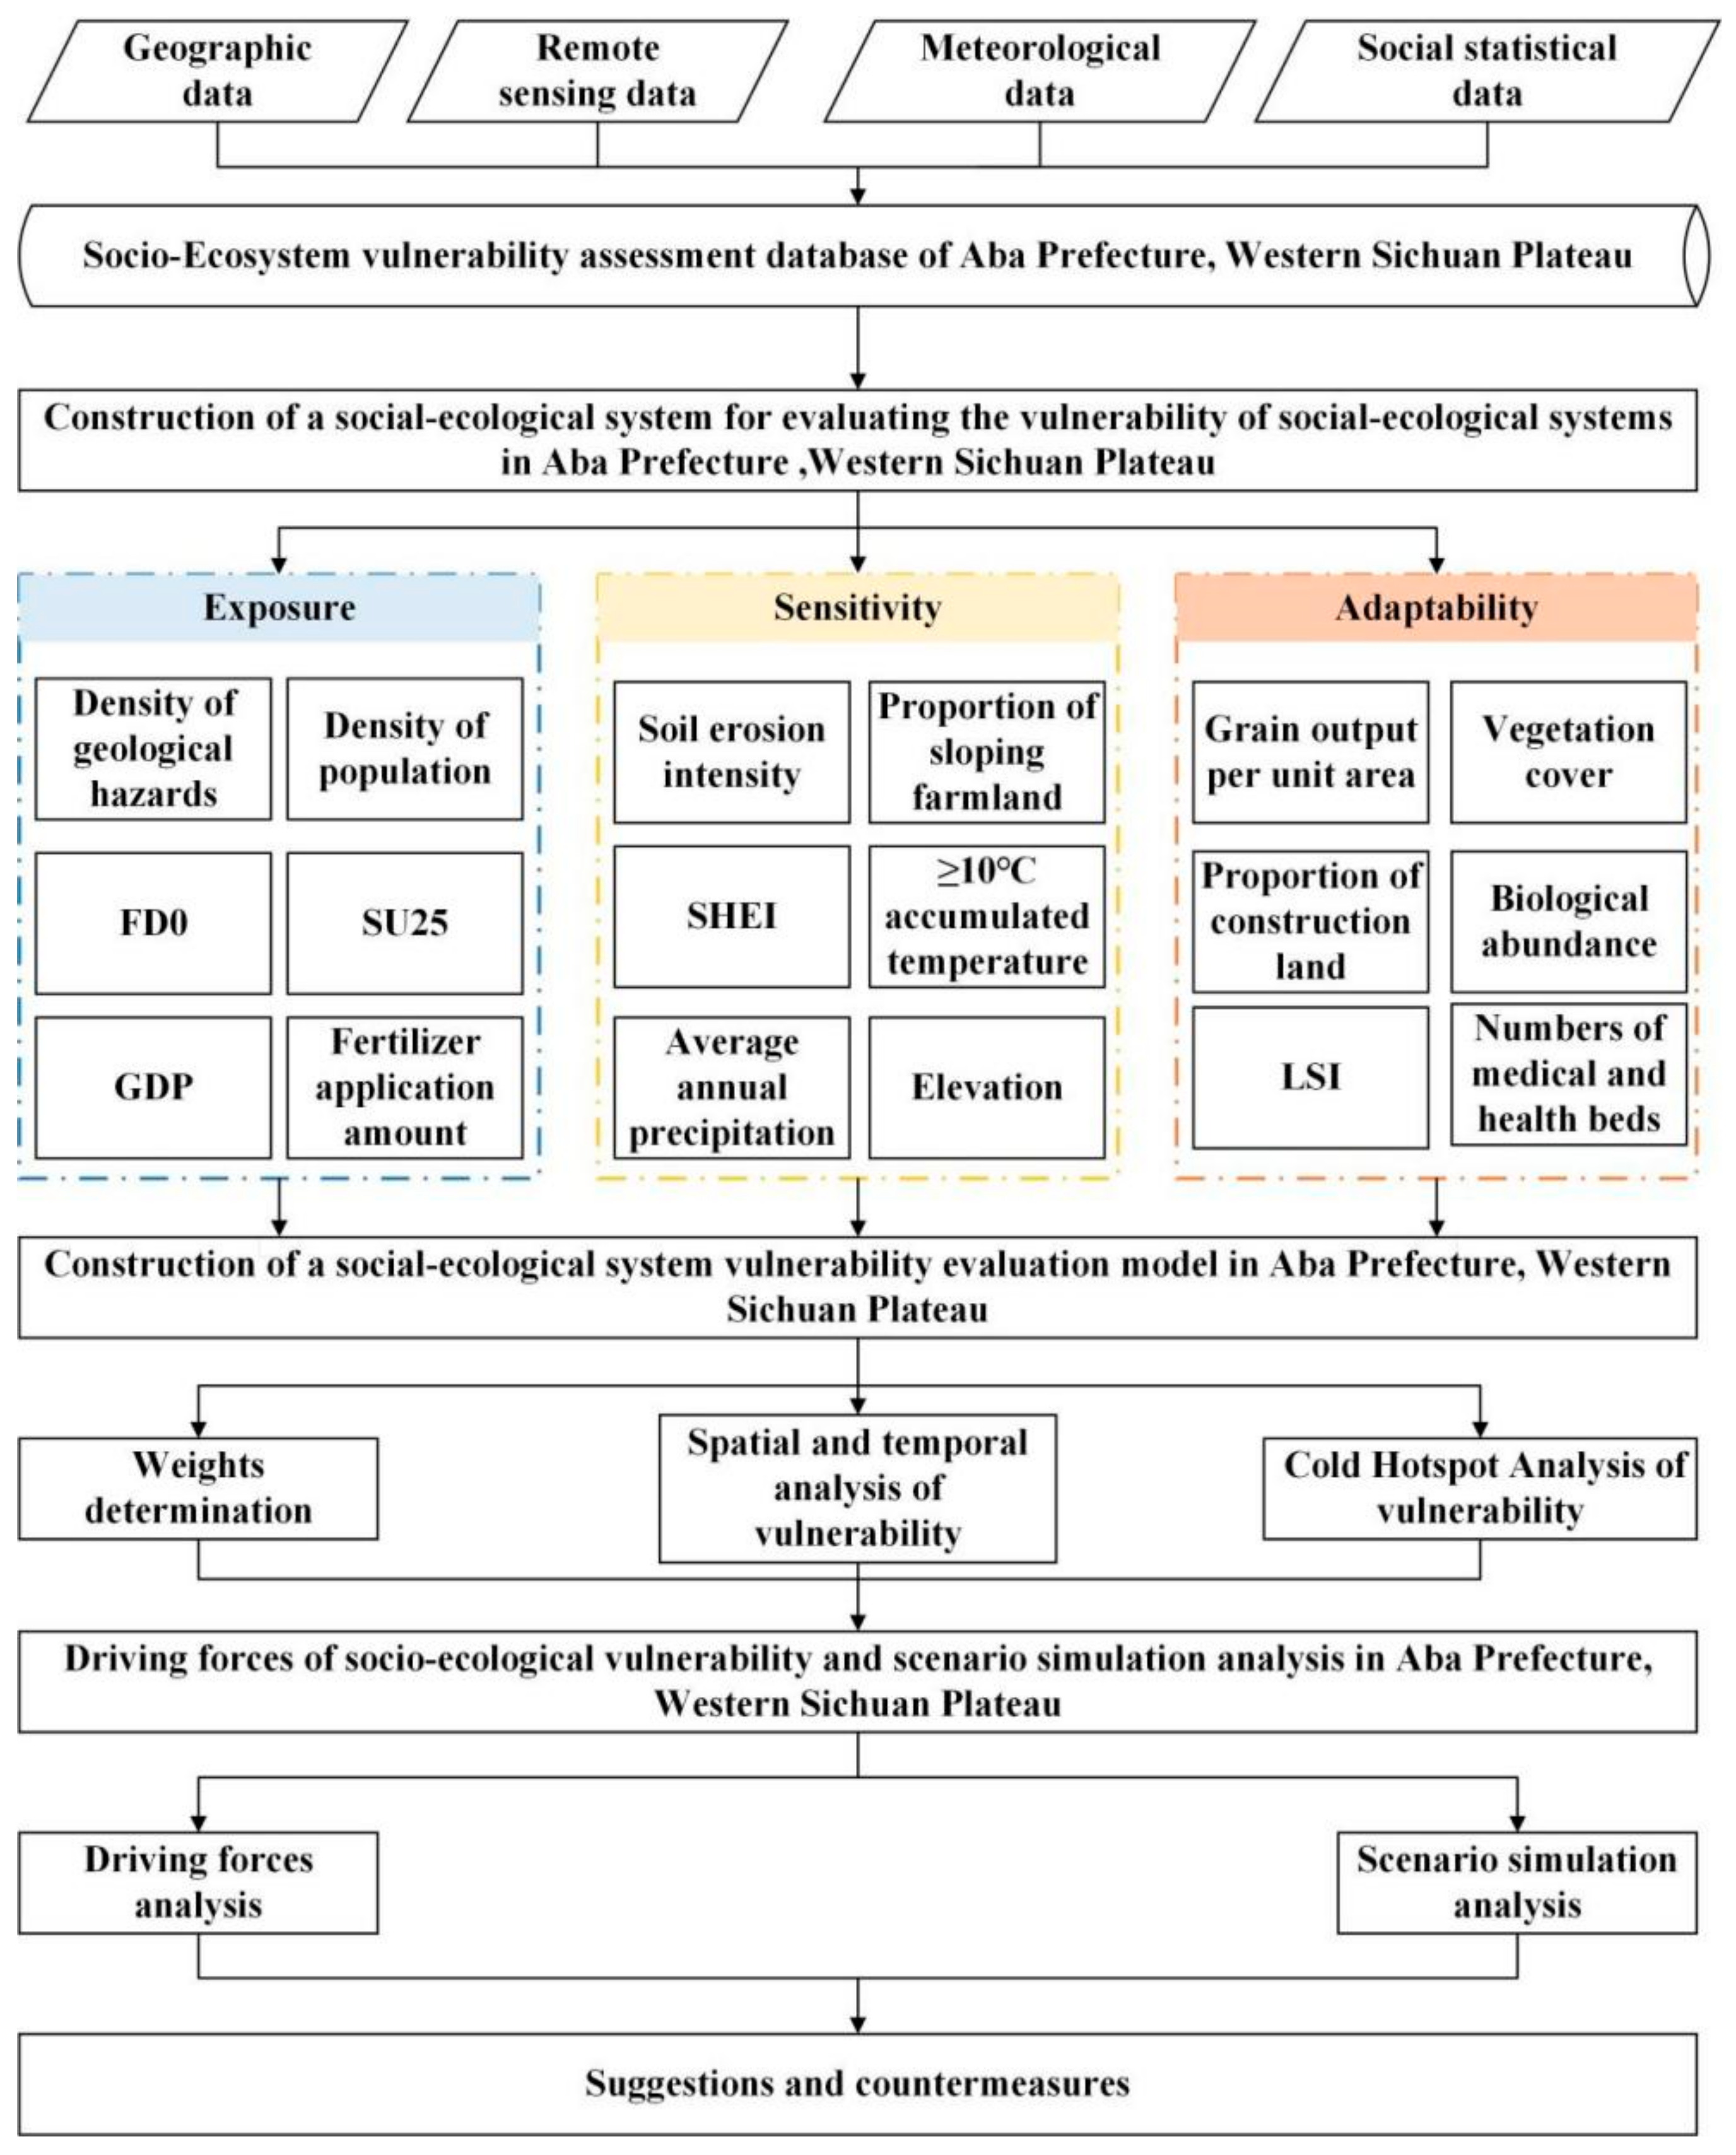
3.1. VSD Framework and Evaluation Indexes
3.1.1. Exposure Indexes
3.1.2. Sensitivity Indexes
3.1.3. Adaptability Indexes
3.2. Evaluation Indexes Weight Assignment
3.2.1. Normalization of Evaluation Indexes
3.2.2. Indexes Weight Assignment
3.3. Vulnerability Index Model
3.4. Geodetector
3.5. Scenario Simulation
3.5.1. Ordered Weighted Average Method
3.5.2. Scenario Indicator Setting
4. Results
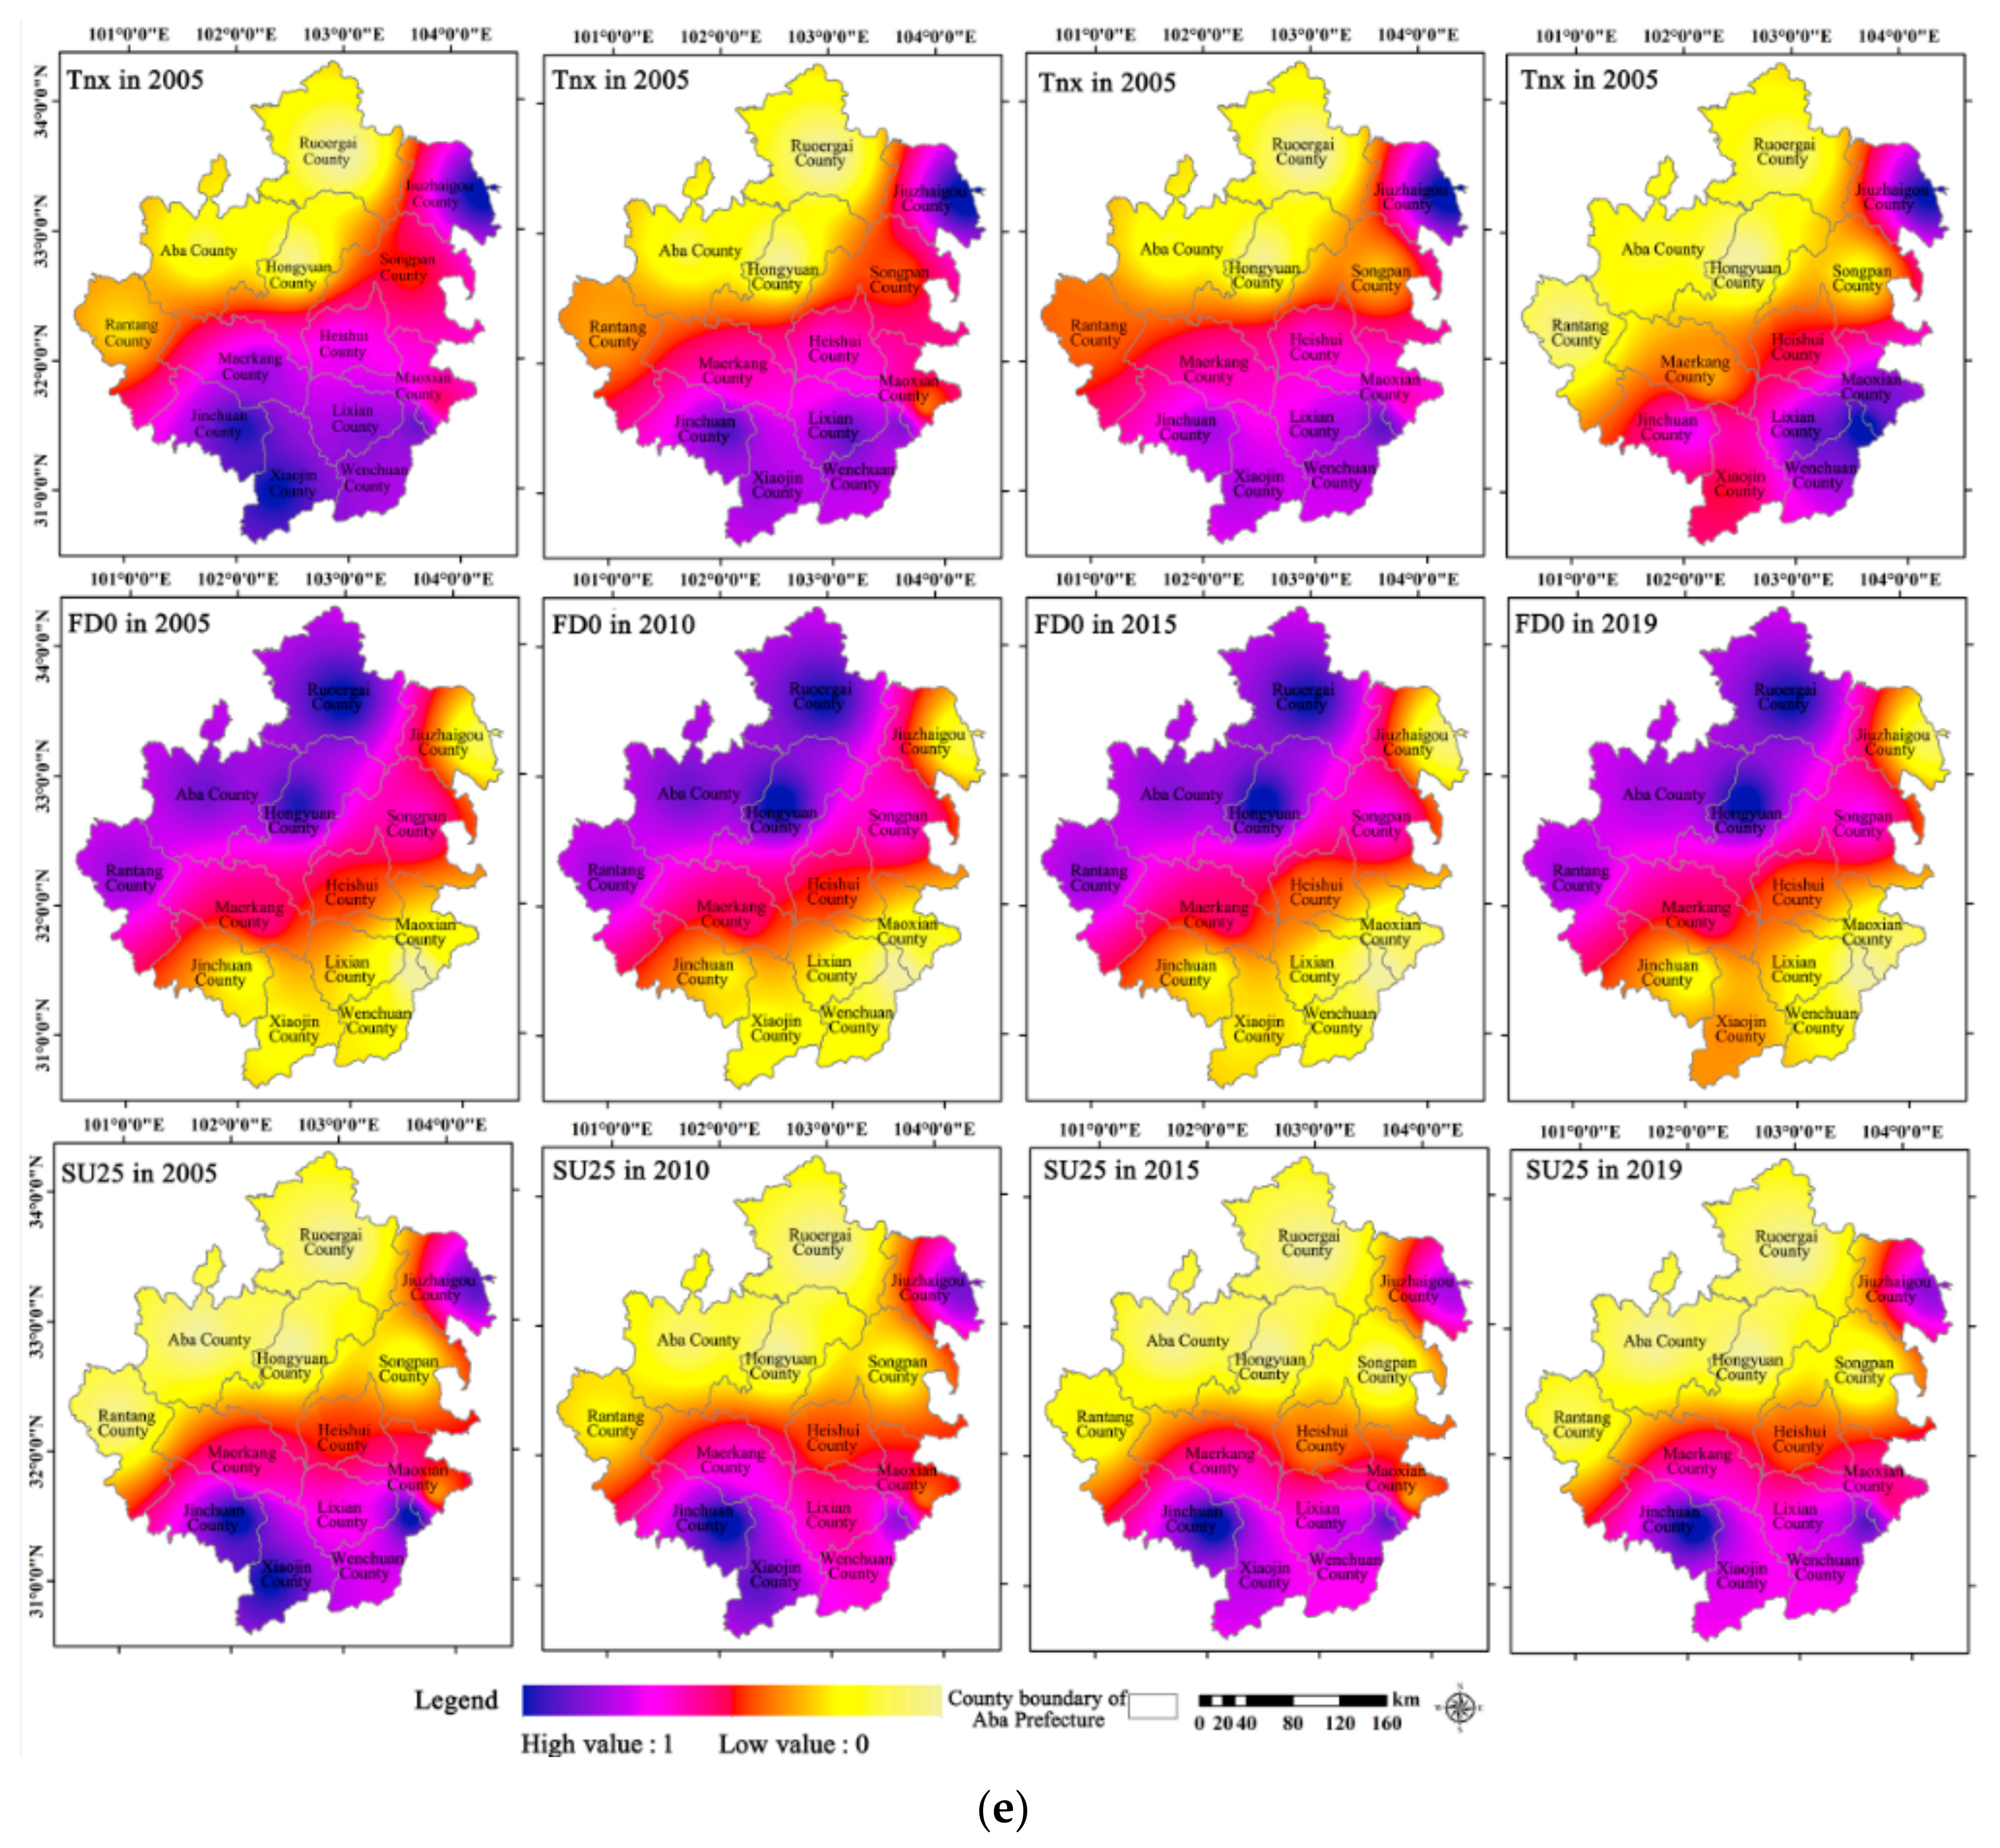
4.1. Index Factor Extraction
4.2. Spatial-Temporal Analysis of Socio-Ecological Vulnerability in Aba Prefecture
4.2.1. Analysis of Spatial-Temporal Change in Socio-Ecological Vulnerability in Aba Prefecture
4.2.2. Analysis of Socio-Ecological Vulnerability in Major Counties/City in Aba Prefecture
- Analysis of socio-ecological vulnerability results in Wenchuan County
- 2.
- Analysis of socio-ecological vulnerability results in Maerkang City
- 3.
- Analysis on socio-ecological vulnerability results in Ruoergai County
4.3. Analysis of Driving Forces
4.4. Analysis of Scenario Simulation Results
5. Discussion
- (1)
- Proper evaluation factors should be used. Evaluation factors are mainly selected according to the experience and knowledge of researchers presently. It is difficult to establish a set of selection standards applicable to different regions and on different spatial scales. In this paper, on the basis of multi-source data types with the VSD, and following the evaluation index selection principles, 20 impact factors, including soil erosion intensity, extreme climate index, vegetation cover, biological abundance and health care level, are selected on three dimensions: exposure, sensitivity and adaptability. Thus the index system for socio-ecological vulnerability evaluation in the researched area is built. When selecting evaluation factors, we should consider related principles of ecology, climatology and geology to select impact factors with a contribution to local socio-ecological systems. Notably, the spatial scale of evaluation factors selected in this paper is county level. It could improve the spatial resolution of socio-ecological vulnerability if more specific data at the county level could be obtained.
- (2)
- The changing trends of climate with elevation in Aba Prefecture are not the same. Strong wind is common in spring and winter, but it is dry and extreme meteorological events like droughts, frost, snow, low temperature and heavy snow are often seen. The climate types in this prefecture could be classified by elevation. It is the alpine climate at higher elevations, highland climate at the junction between mountains and highland, and the alpine valley climate in valleys, the three typical plateau monsoon climates. As pointed out in the Sixth Assessment Report by the UN Intergovernmental Panel on Climate Change, with global warming speeding up, the intensity and frequency of extreme weather events such as high-temperature weather, floods, agro-ecological droughts and strong typhoons will increase [64]. The World Meteorological Organization has defined 27 extreme climate indexes, including 16 temperature indexes and 11 precipitation indexes [70]. Considering the data representativeness and completeness of all meteorological stations in Aba Prefecture, the researched area, we have selected six index factors for the extreme climate to analyze the extreme climate features in the area. This research adopts Sen’s Slope Estimation method to work out the inter-annual variance of extreme climate indexes in Aba Prefecture [71]. Three extreme climate indexes with greater inter-annual variance are selected. The abrupt change test method of Mann–Kendall is used to analyze the abrupt change features over 20 years in the researched area. Given the significance test results, three indexes are selected as the follow-up vulnerability evaluation factors for the researched area.
- (3)
- The spatial distribution of socio-ecological vulnerability is not determined by individual geographic, climate or human factors but by the interaction of various factors. Factors having a greater contribution will determine the actual spatial distribution rule. When analyzing driving factors, we should first compare different driving factor analysis methods to assess their applicability to the researched area. Thus we could select the most applicable method and avoid the uncertainty arising from wrong analysis method selection. The Geodetector method works for both numeric data and qualitative descriptions. When analyzing different types of data, it could work out the actual contribution of individual impact factors to socio-ecological vulnerability, and identify the common effect of two factors with interactive effect on the vulnerability, to analyze the contribution of the interaction to ecological vulnerability. Yet, the Geodetector method can’t identify the more specific interaction between factors. Therefore, this method should be improved and further developed in the future, to make it able to unveil the relation between impact factors and socio-ecological systems more accurately and at more levels.
6. Conclusions
- (1)
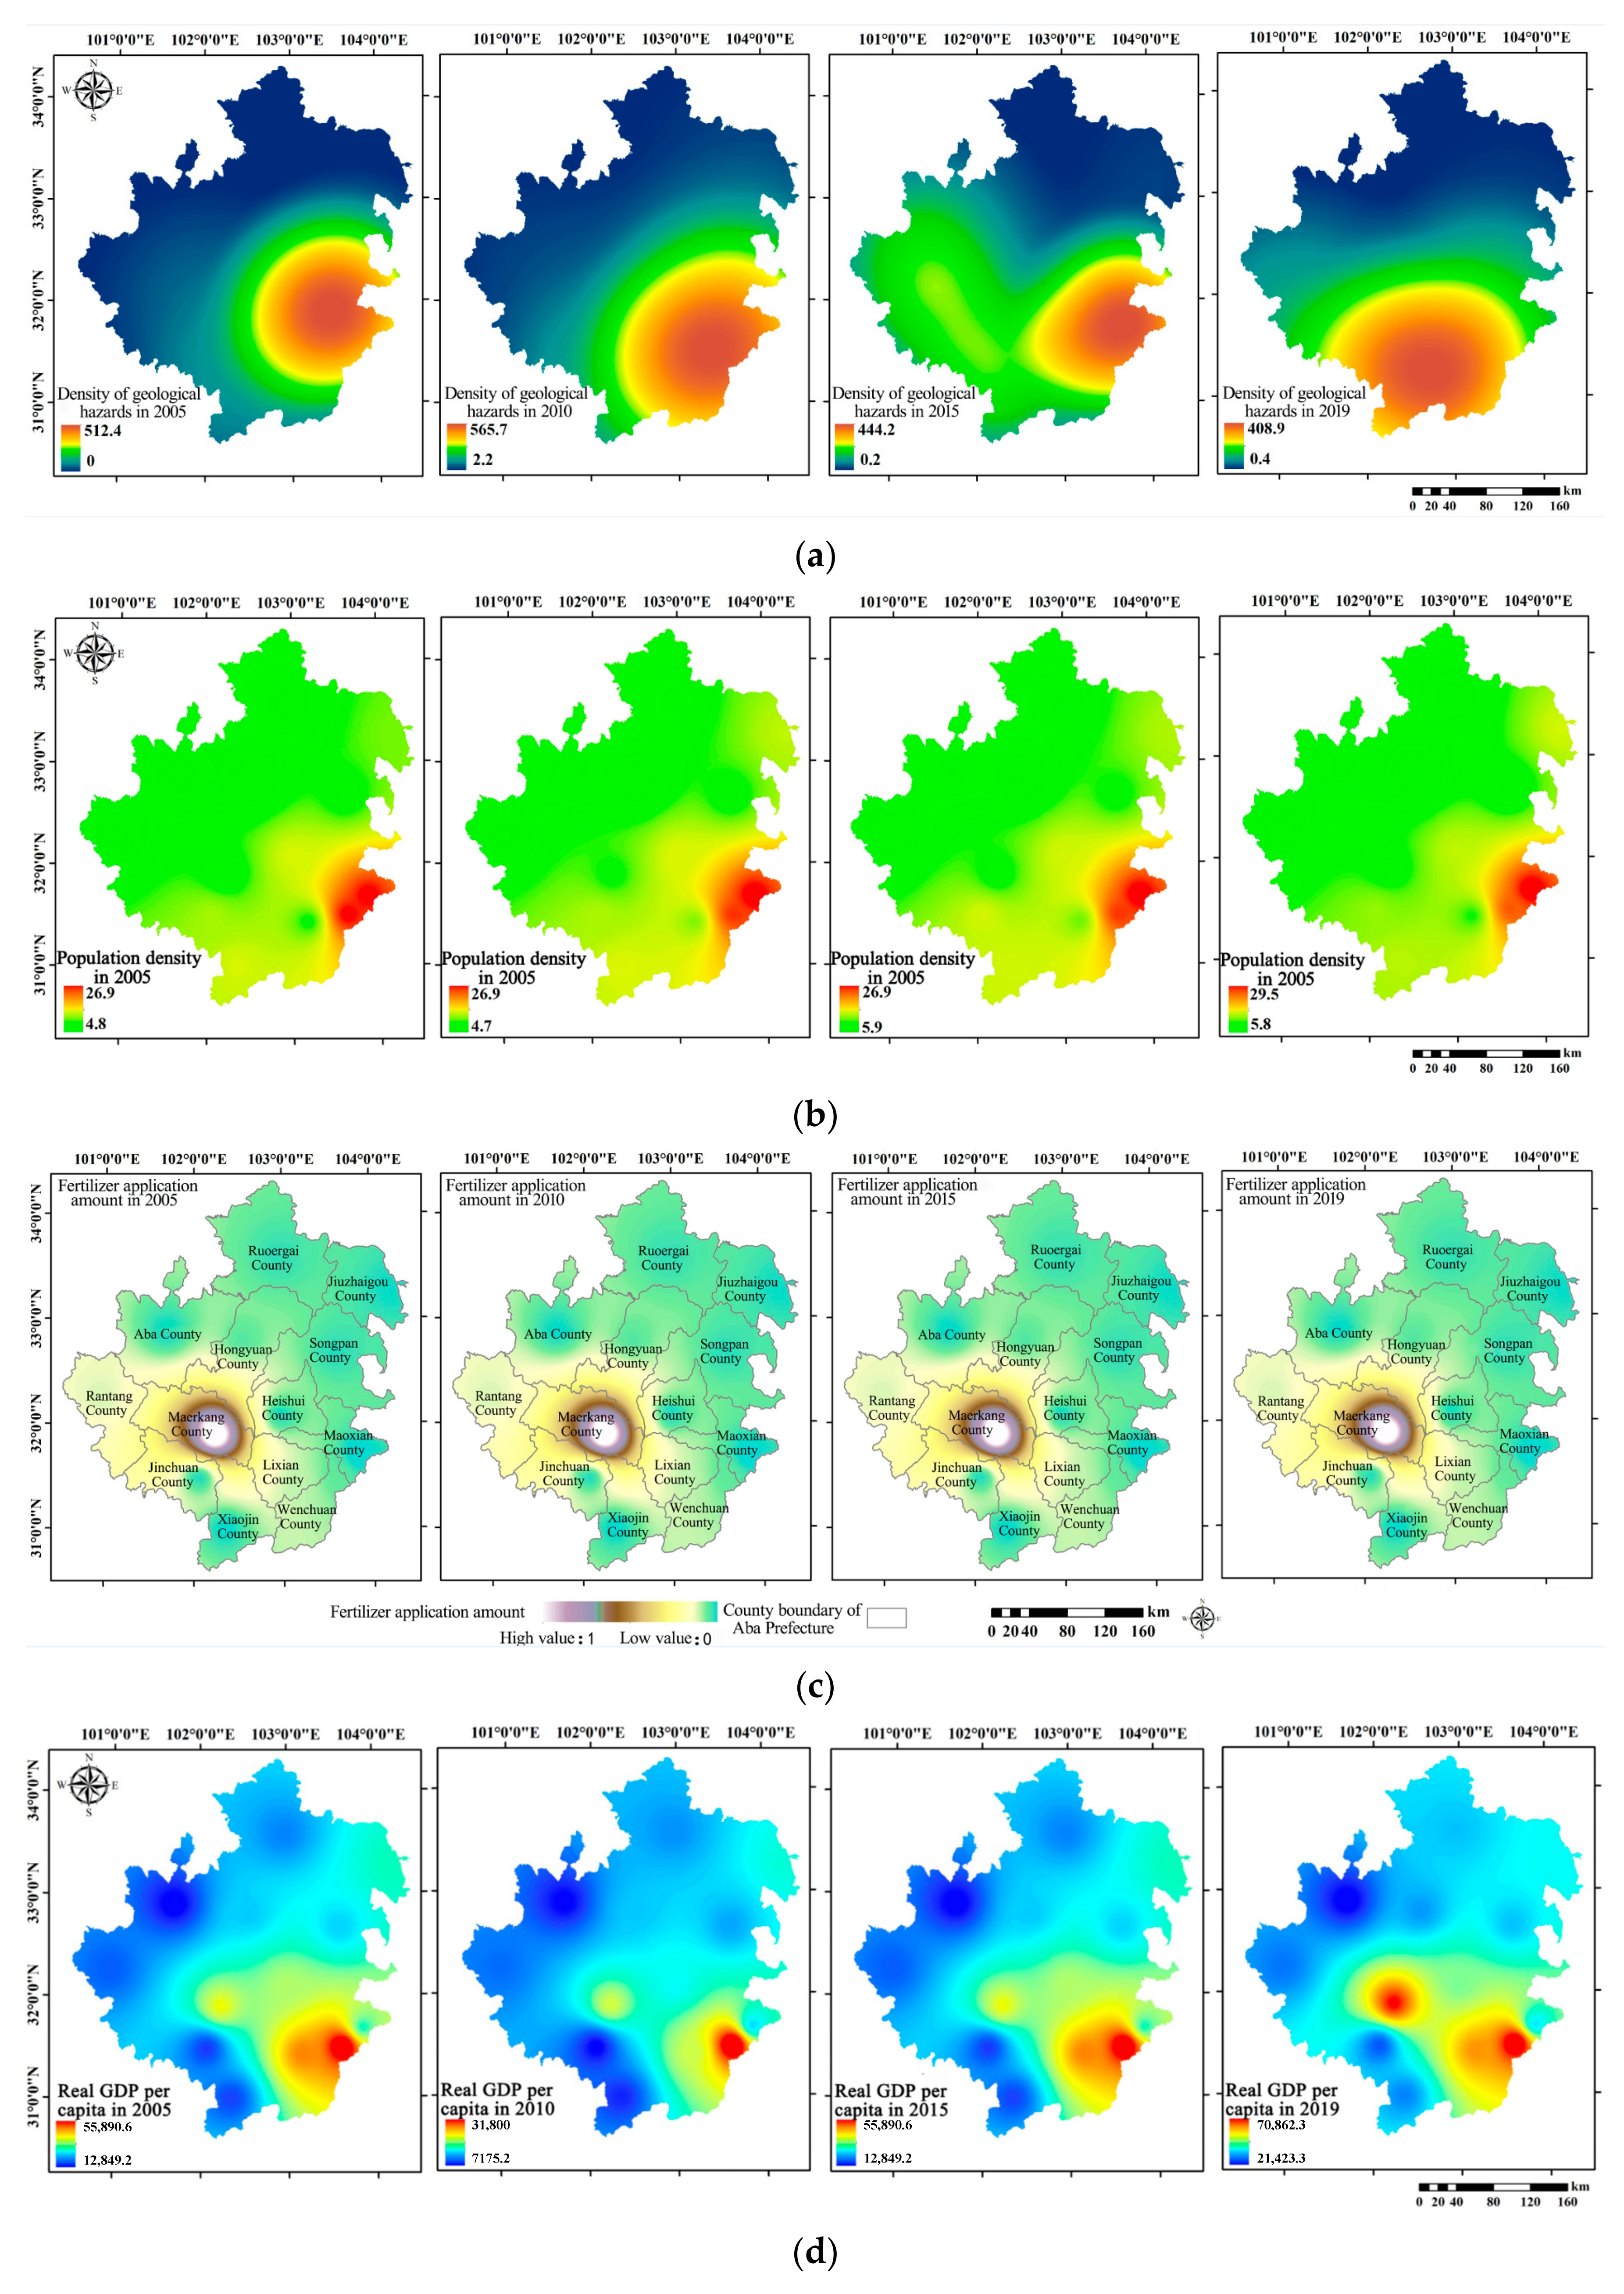
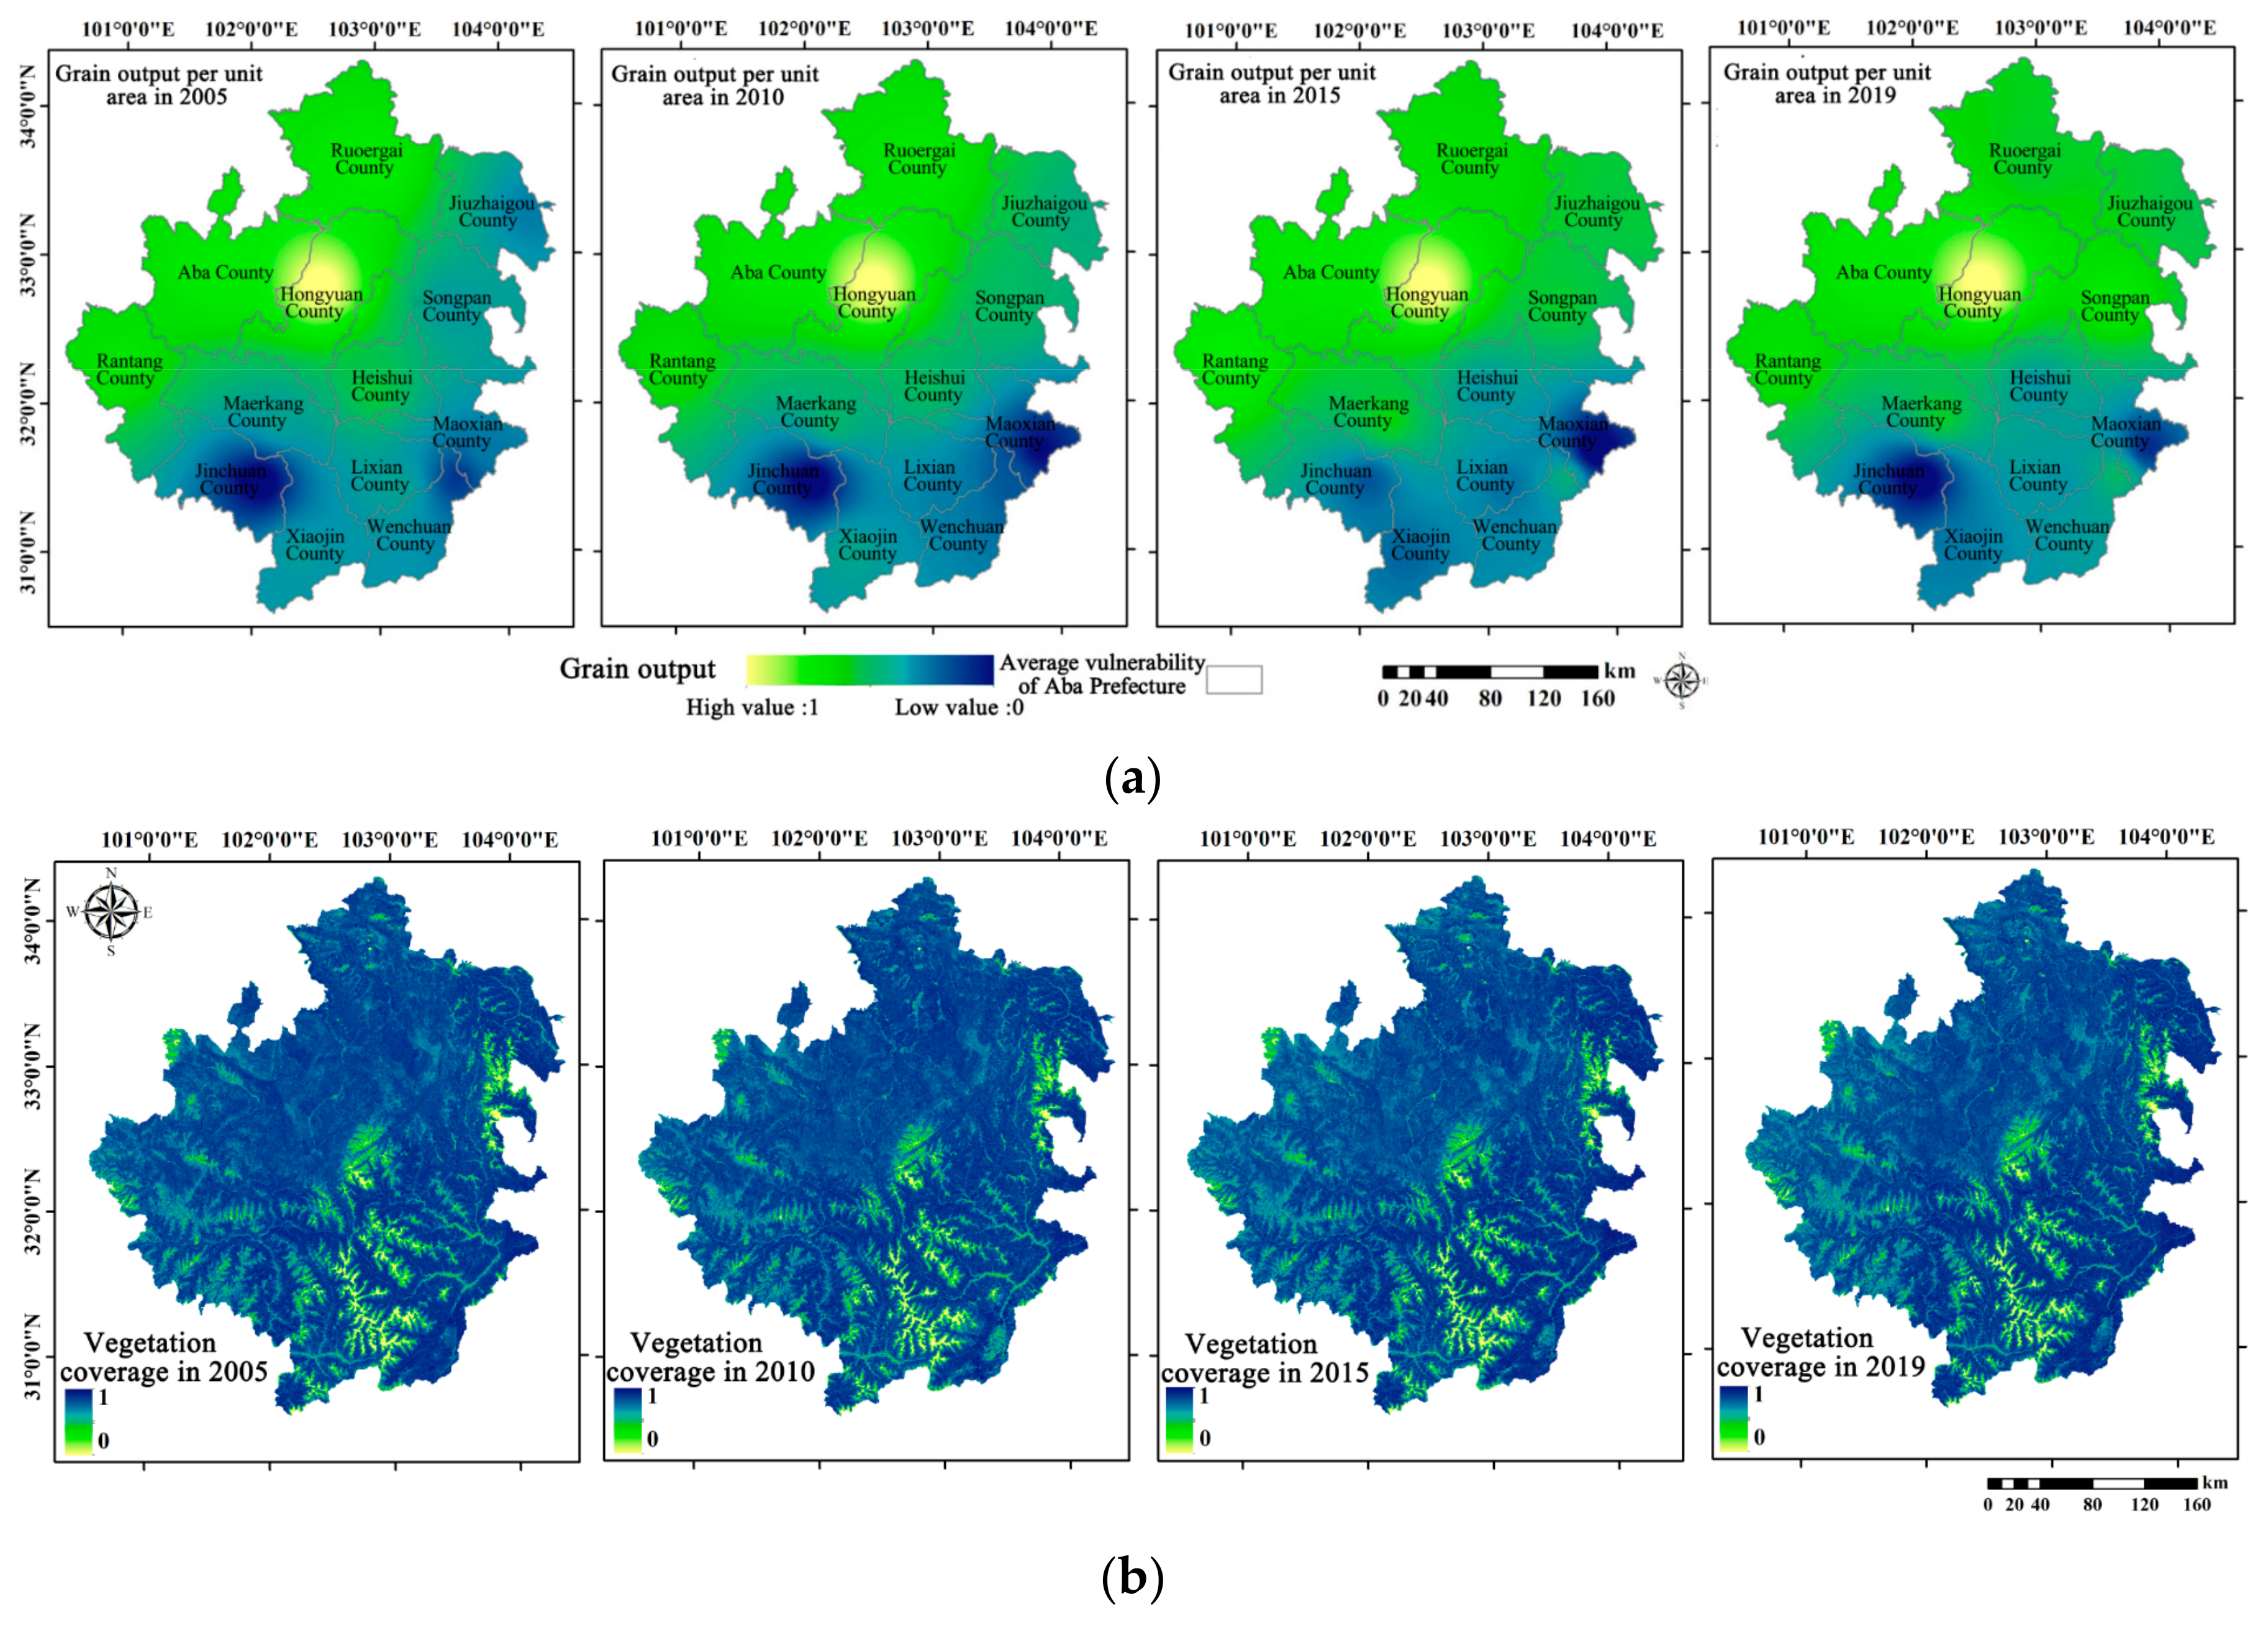
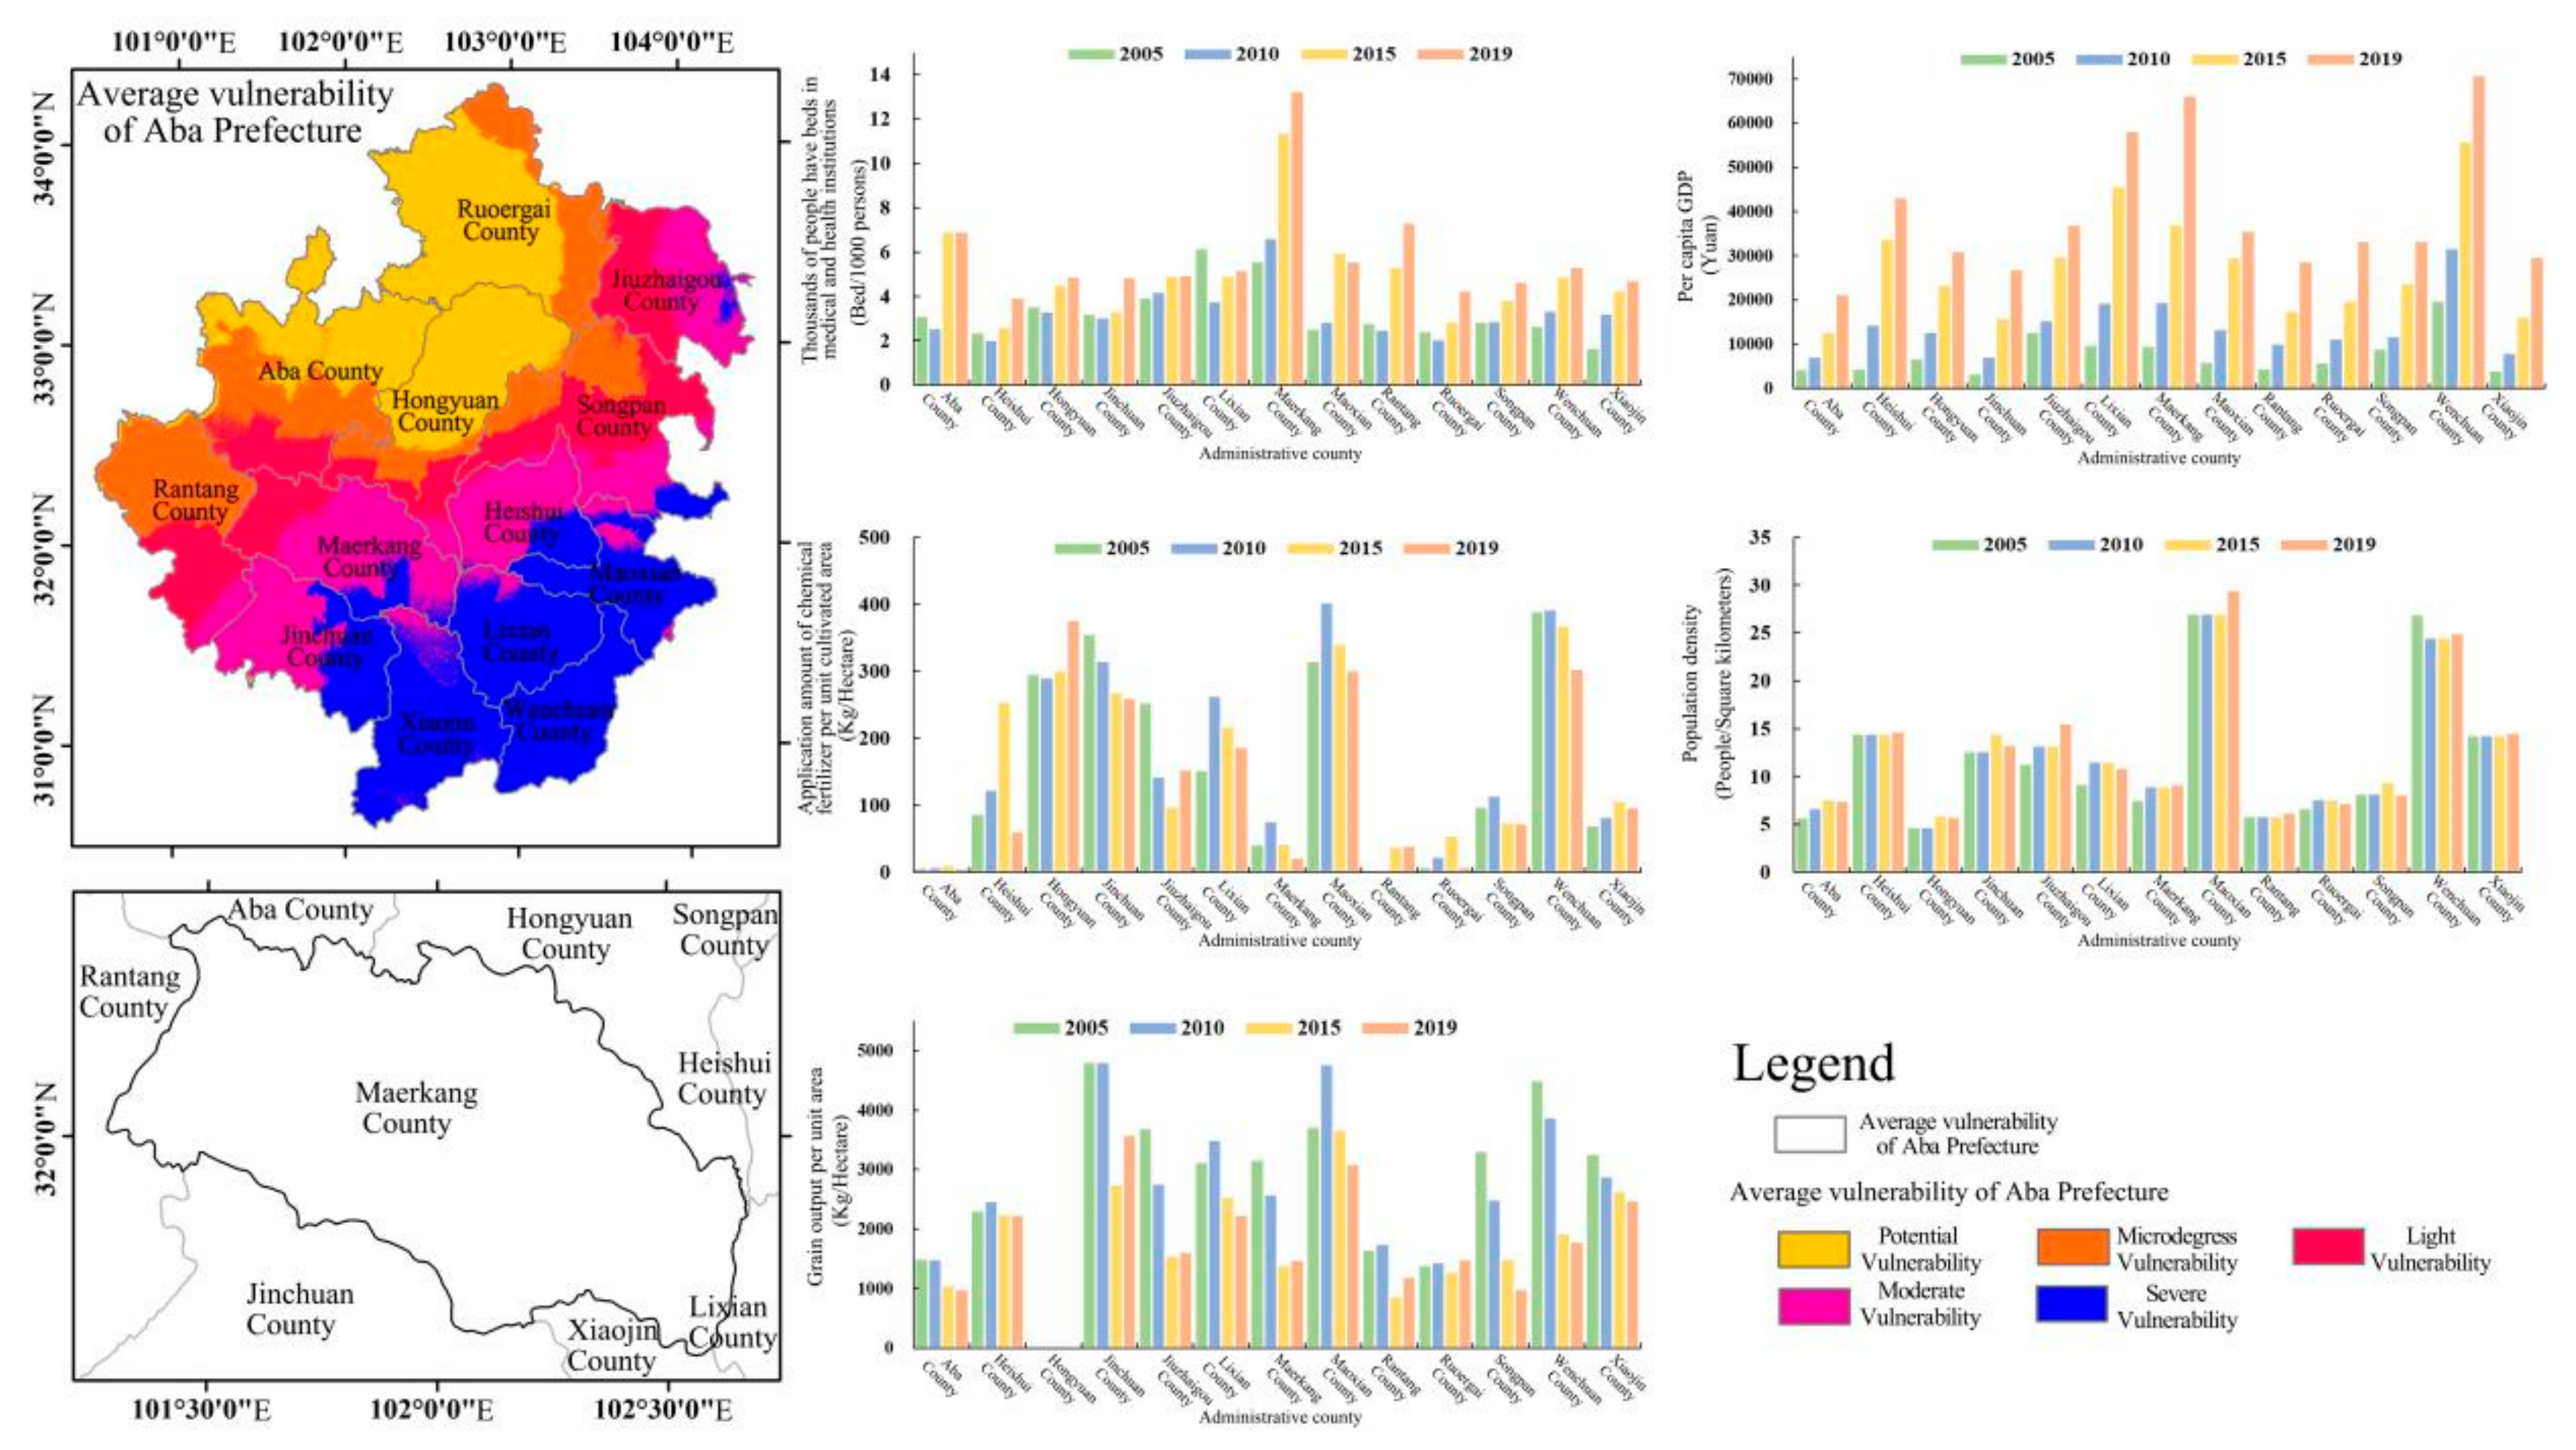
- The spatial distribution feature of exposure and sensitivity in Aba Prefecture from 2005 to 2019: high in the southeast and low in the northwest. To be specific, Wenchuan, Maoxian, Lixian, Xiaojin and Heishui counties had higher indexes. These counties are high in population density, the density of geological hazards, the proportion of sloping farmland, SHEI, and soil erosion intensity. The spatial distribution feature of the adaptability index is high in the northwest and low in the south. Ruoergai, Aba and Hongyuan counties had higher adaptability indexes. These counties are high in vegetation cover, biological abundance and landscape shape indexes. The changing trend of exposure and adaptability: dropping first and then rising. The changing trend of sensitivity: rising first and then dropping. Among them, the exposure index changed the most from 2005 to 2010 (dropping by 4.27%); the sensitivity index changed the most over the 2015–2019 period (dropping by 9.04%); the adaptability index changed the most over the 2015–2019 period (up 9.25%).
- (2)
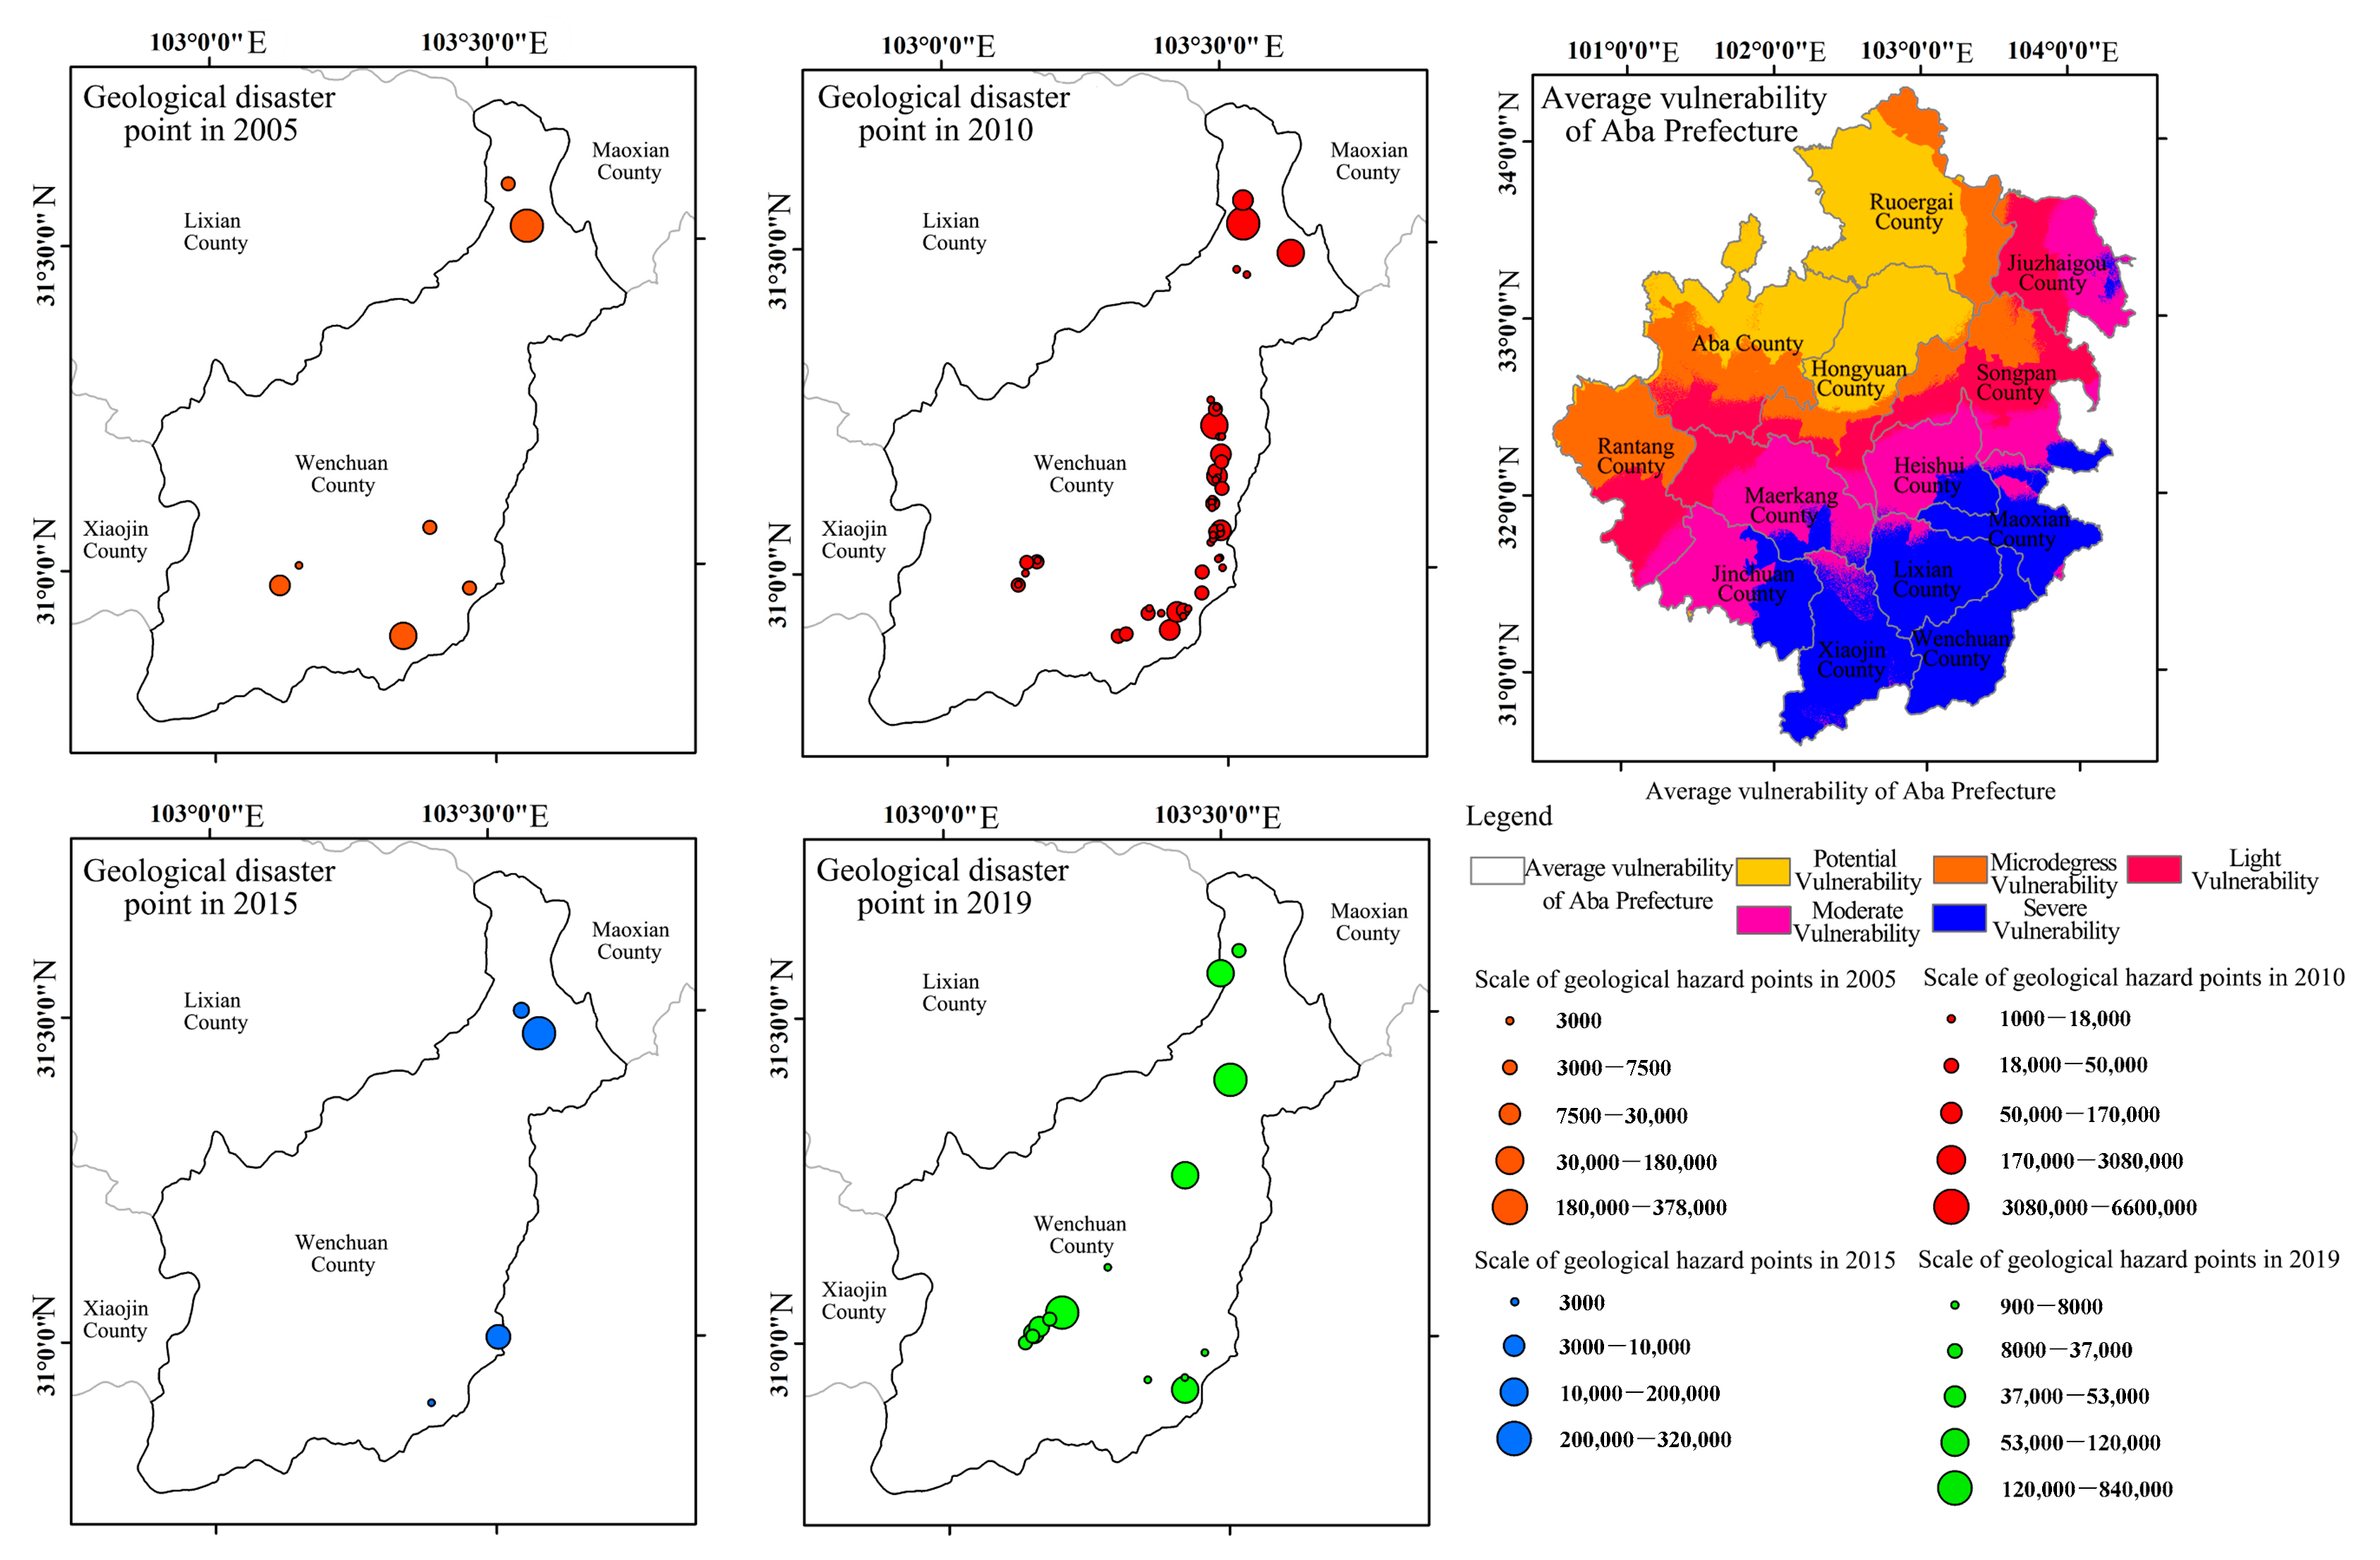
- Features of the general spatial distribution of socio-ecological vulnerability in Aba Prefecture from 2005 to 2019: worsening from the north to the southeast. The area proportion of severe vulnerability rose, dropped and rose again over the 2005–2010, 2010–2015 and 2015–2019 periods. It rose to 21.27% in 2019, the largest proportion ever. Behind this change, the 2008 Wenchuan Earthquake was a major cause of the variation in socio-ecological vulnerability in the southeast of Aba Prefecture in that period. From 2015 to 2019, the rising population density and worsening soil erosion there also drove the socio-ecological vulnerability to go up quickly.
- (3)
- According to the driving force analysis, extreme natural climate conditions are the dominant factors impacting the socio-ecological vulnerability in Aba Prefecture. Then it is human activities and geological hazards. Among individual factors, ≥10 °C accumulated temperature, per capita grain availability, FD0, SU25, TNx, population density, the proportion of sloping farmland and density of geological hazards have a greater driving effect on the socio-ecological vulnerability in Aba Prefecture. After the pairwise interaction among them, all factors see growing driving effects, especially the grain output per unit area interacted with the average annual precipitation, proportion of sloping farmland, biological abundance, ≥10 °C accumulated temperature and density of geological hazards. In addition, ≥10 °C accumulated temperature is the factor with the strongest effect after interaction with other impact factors. Therefore, it is very important for maintaining socio-ecological stability to take cold-resistant measures.
- (4)
- According to the scenario simulation results, as the decision-making risk factor rises, the socio-ecological vulnerability in Aba Prefecture worsens. In the status quo type scenario, the socio-ecological vulnerability is similar to the results in 2010 and 2019, indicating that the selected evaluation factors could reflect the actual socio-ecological vulnerability. In the sustainable guide and unsustainable guide scenarios, the area proportions of severe vulnerability are the smallest and largest, respectively. The simulation results could be a reference for decision makers, but they should also consider local conditions when making decisions. Different social and ecological environment development strategies should be used based on the different development needs of local places in different time periods.
Author Contributions
Funding
Data Availability Statement
Conflicts of Interest
References
- Hagenlocher, M.; Renaud, F.G.; Haas, S.; Sebesvari, Z. Vulnerability and risk of deltaic social-ecological systems exposed to multiple hazards. Sci. Total Environ. 2018, 631–632, 71–80. [Google Scholar] [CrossRef] [PubMed] [Green Version]
- Kang, H.; Tao, W.; Chang, Y.; Zhang, Y.; Xuxiang, L.; Chen, P. A feasible method for the division of ecological vulnerability and its driving forces in Southern Shaanxi. J. Clean. Prod. 2018, 205, 619–628. [Google Scholar] [CrossRef]
- Liu, Y.; Cao, X.; Li, T. Identifying Driving Forces of Built-Up Land Expansion Based on the Geographical Detector: A Case Study of Pearl River Delta Urban Agglomeration. Int. J. Environ. Res. Public Health 2020, 17, 1759. [Google Scholar] [CrossRef] [Green Version]
- Tang, Q.; Wang, J.; Jing, Z.; Yan, Y.; Niu, H. Response of ecological vulnerability to land use change in a resource-based city, China. Resour. Policy 2021, 74, 102324. [Google Scholar] [CrossRef]
- Yang, Z.; Yang, Z.; Shang, M.; Deng, M.; Shi, L.; Yang, M. The analysis on the implementation status and policy suggestions of ecological compensation in Aba prefecture. Sichuan Environ. 2020, 39, 107–112. [Google Scholar] [CrossRef]
- Cao, Q.; Zhang, X.; Lei, D.; Guo, L.; Sun, X.; Wu, J. Multi-scenario simulation of landscape ecological risk probability to facilitate different decision-making preferences. J. Clean. Prod. 2019, 227, 325–335. [Google Scholar] [CrossRef]
- Berrouet, L.M.; Machado, J.; Villegas-Palacio, C. Vulnerability of socio—Ecological systems: A conceptual Framework. Ecol. Indic. 2018, 84, 632–647. [Google Scholar] [CrossRef]
- Badreddine, A.; Saab, M.A.-A.; Gianni, F.; Ballesteros, E.; Mangialajo, L. First assessment of the ecological status in the Levant Basin: Application of the CARLIT index along the Lebanese coastline. Ecol. Indic. 2018, 85, 37–47. [Google Scholar] [CrossRef]
- Tai, X.; Xiao, W.; Tang, Y. A quantitative assessment of vulnerability using social-economic-natural compound ecosystem framework in coal mining cities. J. Clean. Prod. 2020, 258, 120969. [Google Scholar] [CrossRef]
- Zhang, F.; Liu, X.; Zhang, J.; Wu, R.; Ma, Q.; Chen, Y. Ecological vulnerability assessment based on multi-sources data and SD model in Yinma River Basin, China. Ecol. Model. 2017, 349, 41–50. [Google Scholar] [CrossRef]
- Zang, Z.; Zou, X.; Zuo, P.; Song, Q.; Wang, C.; Wang, J. Impact of landscape patterns on ecological vulnerability and ecosystem service values: An empirical analysis of Yancheng Nature Reserve in China. Ecol. Indic. 2017, 72, 142–152. [Google Scholar] [CrossRef]
- Mafi-Gholami, D.; Pirasteh, S.; Ellison, J.C.; Jaafari, A. Fuzzy-based vulnerability assessment of coupled social-ecological systems to multiple environmental hazards and climate change. J. Environ. Manag. 2021, 299, 113573. [Google Scholar] [CrossRef] [PubMed]
- Chang, H.; Pallathadka, A.; Sauer, J.; Grimm, N.B.; Zimmerman, R.; Cheng, C.; Iwaniec, D.M.; Kim, Y.; Lloyd, R.; McPhearson, T. Assessment of urban flood vulnerability using the social-ecological-technological systems framework in six US cities. Sustain. Cities Soc. 2021, 68, 102786. [Google Scholar] [CrossRef]
- Wu, H.; Guo, B.; Fan, J.; Yang, F.; Han, B.; Wei, C.; Lu, Y.; Zang, W.; Zhen, X.; Meng, C. A novel remote sensing ecological vulnerability index on large scale: A case study of the China-Pakistan Economic Corridor region. Ecol. Indic. 2021, 129, 107955. [Google Scholar] [CrossRef]
- Jiang, Y.; Shi, B.; Su, G.; Lu, Y.; Li, Q.; Meng, J.; Ding, Y.; Song, S.; Dai, L. Spatiotemporal analysis of ecological vulnerability in the Tibet Autonomous Region based on a pressure-state-response-management framework. Ecol. Indic. 2021, 130, 108054. [Google Scholar] [CrossRef]
- Yuan, J.; Ainong, L.; Jinhu, B.; Xi, N.; Guangbin, L.; Kamran, M. Spatiotemporal analysis of ecological vulnerability along Bangladesh-China-India-Myanmar economic corridor through a grid level prototype model. Ecol. Indic. 2021, 120, 106933. [Google Scholar]
- Yao, J.; Ding, J.; Ai, N. Assessment of ecological vulnerability in upper reaches of Minjiang River. Resour. Environ. Yangtze Basin 2004, 13, 380–383. [Google Scholar]
- Zhang, X.; Liu, K.; Li, X.; Wang, S.; Wang, J. Vulnerability assessment and its driving forces in terms of NDVI and GPP over the Loess Plateau, China. Phys. Chem. Earth Parts A/B/C 2022, 125, 103106. [Google Scholar] [CrossRef]
- Xia, M.; Jia, K.; Zhao, W.; Liu, S.; Wei, X.; Wang, B. Spatio-temporal changes of ecological vulnerability across the Qinghai-Tibetan Plateau. Ecol. Indic. 2021, 123, 107274. [Google Scholar] [CrossRef]
- Honghua, S.; Jingfang, L.; Wei, Z.; Jingkuan, S.; Jie, L.; Zhen, G.; Jiantao, H.; Shuting, Y.; Liting, Y.; Yongzhi, W.; et al. Evaluation system of coastal wetland ecological vulnerability under the synergetic influence of land and sea: A case study in the Yellow River Delta, China. Mar. Pollut. Bull. 2020, 161, 111735. [Google Scholar]
- Yang, X.; Liu, S.; Jia, C.; Liu, Y.; Yu, C. Vulnerability assessment and management planning for the ecological environment in urban wetlands. J. Environ. Manag. 2021, 298, 113540. [Google Scholar] [CrossRef] [PubMed]
- Shi, P.; Wang, M.; Hu, X.; Ye, T. Integrated risk governance consilience mode of social-ecological systems. Acta Geogr. Sin. 2014, 69, 863–876. [Google Scholar]
- Geng, Y.; Chen, W.; Zhang, J.; Wang, K.; Zhang, F.; Ma, Y. Evolution characteristics and scienario simulation of social-ecologicial-productional landscape resilience in areas along mainstream of Yellow River in He’nan Province. Bull. Soil Water Conserv. 2021, 41, 181–190. [Google Scholar] [CrossRef]
- Jiang, L.; Huang, X.; Wang, F.; Liu, Y.; An, P. Method for evaluating ecological vulnerability under climate change based on remote sensing: A case study. Ecol. Indic. 2018, 85, 479–486. [Google Scholar] [CrossRef]
- An, M.; Xie, P.; He, W.; Wang, B.; Huang, J.; Khanal, R. Spatiotemporal change of ecologic environment quality and human interaction factors in three gorges ecologic economic corridor, based on RSEI. Ecol. Indic. 2022, 141, 109090. [Google Scholar] [CrossRef]
- Pan, Z.; Gao, G.; Fu, B. Spatiotemporal changes and driving forces of ecosystem vulnerability in the Yangtze River Basin, China: Quantification using habitat-structure-function framework. Sci. Total Environ. 2022, 835, 155494. [Google Scholar] [CrossRef] [PubMed]
- Xue, L.; Wang, J.; Zhang, L.; Wei, G.; Zhu, B. Spatiotemporal analysis of ecological vulnerability and management in the Tarim River Basin, China. Sci. Total Environ. 2019, 649, 876–888. [Google Scholar] [CrossRef] [PubMed]
- Polsky, C.; Neff, R.; Yarnal, B. Building comparable global change vulnerability assessments: The vulnerability scoping diagram. Glob. Environ. Chang. 2007, 17, 472–485. [Google Scholar] [CrossRef]
- Jia, C.; Xinjun, Y.; Sha, Y.; Kongsen, W.; Mengqi, D.; Xin, W. The vulnerability evolution and simulation of social-ecological systems in a semi-arid area: A case study of Yulin City, China. J. Geogr. Sci. 2018, 28, 152–174. [Google Scholar]
- Li, P.; Fan, J. Regional ecological vulnerability assessment of the Guangxi Xijiang River Economic Belt in Southwest China with VSD Model. J. Resour. Ecol. 2014, 29, 779–788. [Google Scholar]
- Huo, T.; Zhang, X.; Zhou, Y.; Chen, W. Evaluation and correlation analysis of spatio-temporal changes of ecologicial vulnerability based on VSD model: A case in Suzhou section, Grand Canal of China. Acta Ecol. Sin. 2022, 42, 1–13. [Google Scholar]
- Lu, H.; Sun, G.; Li, H.; Li, L.; Lu, H.; Bai, Y. Ecological Vulnerability Assessment in Xinjiang Based on VSD Model. Xinjiang Agric. Sci. 2020, 57, 292–302. [Google Scholar]
- Zhang, Q.; Li, M. Regional ecological vulnerability assessment based on VSD Model--The case of Yanbian Korean Autonomous Prefecture. Agric. Sci. J. Yanbian Univ. 2018, 40, 7–15. [Google Scholar] [CrossRef]
- Hu, X.; Ma, C.; Huang, P.; Guo, X. Ecological vulnerability assessment based on AHP-PSR method and analysis of its single parameter sensitivity and spatial autocorrelation for ecological protection–A case of Weifang City, China. Ecol. Indic. 2021, 125, 107464. [Google Scholar] [CrossRef]
- Ba, R.; Deng, Q.; Liu, Y.; Yang, R.; Zhang, H. Multi-hazard disaster scenario method and emergency management for urban resilience by integrating experiment–simulation–field data. J. Saf. Sci. Resil. 2021, 2, 77–89. [Google Scholar] [CrossRef]
- Jun, T.; Shiwei, L.; Yongfeng, Y.; Puyan, Q.; Pengwei, Q.; Qiaoqiao, L. Spatiotemporal Evolution and the Influencing Factors of Tourism-Based Social-Ecological System Vulnerability in the Three Gorges Reservoir Area, China. Sustainability 2021, 13, 4008. [Google Scholar]
- Wu, X.; Tang, S. Comprehensive evaluation of ecological vulnerability based on the AHP-CV method and SOM model: A case study of Badong County, China. Ecol. Indic. 2022, 137, 108758. [Google Scholar] [CrossRef]
- Cai, X.; Li, Z.; Liang, Y. Tempo-spatial changes of ecological vulnerability in the arid area based on ordered weighted average model. Ecol. Indic. 2021, 133, 108398. [Google Scholar] [CrossRef]
- Zhang, F. Ecological Vulnerability Assessment of Yinna River Basin Based on SD and DPSIRM Model. Ph.D. Thesis, Northeast Normal University, Changchun, China, 2019. [Google Scholar]
- Boori, M.S.; Choudhary, K.; Paringer, R.; Kupriyanov, A. Using RS/GIS for spatiotemporal ecological vulnerability analysis based on DPSIR framework in the Republic of Tatarstan, Russia. Ecol. Inform. 2022, 67, 101490. [Google Scholar] [CrossRef]
- Li, C.; Wu, Y.; Cao, B. Multi-scenario simulation of ecosystem service value for optimization of land use in the Sichuan-Yunnan ecological barrier, China. Ecol. Indic. 2021, 132, 108328. [Google Scholar] [CrossRef]
- Chazal, J.; Quétier, F.; Lavorel, S.; Van Doorn, A. Including multiple differing stakeholder values into vulnerability assessments of socio-ecological systems. Glob. Environ. Chang. 2008, 18, 508–520. [Google Scholar] [CrossRef]
- Domingo, D.; Palka, G.; Hersperger, A.M. Effect of zoning plans on urban land-use change: A multi-scenario simulation for supporting sustainable urban growth. Sustain. Cities Soc. 2021, 69, 102833. [Google Scholar] [CrossRef]
- Zhang, L.; Nie, Q.; Chen, B.; Chai, J.; Zhao, Z. Multi-scale evaluation and multi-scenario simulation analysis of regional energy carrying capacity—Case study: China. Sci. Total Environ. 2020, 734, 139440. [Google Scholar] [CrossRef]
- Chen, J.; Chen, W.; Huang, G. Urban Waterlogging Risk Assessment Based on Scenario Simulation and Multi-source Data. Water Resour. Power 2021, 39, 55–59. [Google Scholar]
- Deng, C.; Peng, Y.; Li, K.; Li, Z. Simulation of watershed land use transition and eco-environment effects under multiple scenarios based on production-ecology-living space. Chin. J. Ecol. 2021, 40, 2506–2516. [Google Scholar] [CrossRef]
- Zhang, Z.; Li, J. Spatial suitability and multi-scenarios for land use: Simulation and policy insights from the production-living-ecological perspective. Land Use Policy 2022, 119, 106219. [Google Scholar] [CrossRef]
- Xiong, J.; Yue, W.; Chen, Y.; Liao, R.; Fang, K. Multi-scenario urban expansion simulation for SDGs: Taking the Central Asian region along the Belt and Road as an example. J. Nat. Resour. 2021, 36, 841–853. [Google Scholar] [CrossRef]
- Kang, L.; Jia, Y.; Zhang, S. Spatiotemporal distribution and driving forces of ecological service value in the Chinese section of the “Silk Road Economic Belt”. Ecol. Indic. 2022, 141, 109074. [Google Scholar] [CrossRef]
- He, X. Eco-construction in tourism-based poverty alleviation in ethnic minority areas againstthe background of rural revitalization: A case study of Aba Tibetan and Qiang Autonomous Prefecture. J. Yunnan Minzu Univ. (Soc. Sci.) 2019, 36, 73–79. [Google Scholar] [CrossRef]
- Jiang, J.; Wen, T. The origin of Qiang plant culture in Aba Prefecture. J. Sichuan Minzu Coll. 2020, 29, 41–46. [Google Scholar] [CrossRef]
- Zhou, J.; Huang, X. A Review on the assessment methods of ecological vulnerability. Yunan Geogr. Environ. Res. 2008, 1, 55–59+71. [Google Scholar]
- McNeeley, S.M. A “toad’s eye” view of drought: Regional socio-natural vulnerability and responses in 2002 in Northwest Colorado. Reg. Environ. Chang. 2014, 14, 1451–1461. [Google Scholar] [CrossRef]
- Lazzari, N.; Becerro, M.A.; Sanabria-Fernandez, J.A.; Martín-López, B. Assessing social-ecological vulnerability of coastal systems to fishing and tourism. Sci. Total Environ. 2021, 784, 147078. [Google Scholar] [CrossRef] [PubMed]
- Naylor, L.A.; Brady, U.; Quinn, T.; Brown, K.; Anderies, J.M. A multiscale analysis of social-ecological system robustness and vulnerability in Cornwall, UK. Reg. Environ. Chang. 2019, 19, 1835–1848. [Google Scholar] [CrossRef] [Green Version]
- Noble, M.M.; Harasti, D.; Pittock, J.; Doran, B. Using GIS fuzzy-set modelling to integrate social-ecological data to support overall resilience in marine protected area spatial planning: A case study. Ocean Coast. Manag. 2021, 212, 105745. [Google Scholar] [CrossRef]
- Pandey, R.; Bardsley, D.K. Social-ecological vulnerability to climate change in the Nepali Himalaya. Appl. Geogr. 2015, 64, 74–86. [Google Scholar] [CrossRef] [Green Version]
- Jha, S.K.; Negi, A.K.; Alatalo, J.M.; Negi, R.S. Socio-ecological vulnerability and resilience of mountain communities residing in capital-constrained environments. Mitig. Adapt. Strateg. Glob. Chang. 2021, 26, 38. [Google Scholar] [CrossRef]
- Sufia, R.; Ul, H.M.S.; Kumar, R.A.; Ram, A.; Haroon, S. Assessing flood-induced ecological vulnerability and risk using GIS-based in situ measurements in Bhagirathi sub-basin, India. Arab. J. Geosci. 2021, 14, 1520. [Google Scholar]
- Hou, K.; Tao, W.; Wang, L.; Li, X. Study on hierarchical transformation mechanisms of regional ecological vulnerability and its applicability. Ecol. Indic. 2020, 114, 106343. [Google Scholar] [CrossRef]
- Liu, Q.; Shi, T. Spatiotemporal Differentiation and the Factors of Ecological Vulnerability in the Toutun River Basin Based on Remote Sensing Data. Sustainability 2019, 11, 4160. [Google Scholar] [CrossRef] [Green Version]
- Tianjun, Z.; Ziming, C.; Xiaolong, C.; Meng, Z.; Jie, J.; Shuai, H. Interpreting IPCC AR6: Future global climate based on projection under scenarios and on near-term information. Adv. Clim. Chang. Res. 2021, 17, 652–663. [Google Scholar]
- Ogbonna, C.E.; Ike, F.; Okwu-Delunzu, V.U. Spatial Assessment of Flood Vulnerability in Aba Urban Using Geographic Information System Technology and Rainfall Information. Int. J. Geosci. 2015, 6, 191. [Google Scholar] [CrossRef] [Green Version]
- Zhou, B.; Qian, J. Changes of weather and climate extremes in the IPCC AR6. Clim. Chang. Res. 2021, 17, 713–718. [Google Scholar]
- Teng, Y.; Zhan, J.; Liu, S.; Agyemanga, F.B.; Li, Z.; Wang, C.; Liu, W. Integrating ecological and social vulnerability assessment in Qinghai Province, China. Phys. Chem. Earth Parts A/B/C 2022, 126, 103115. [Google Scholar] [CrossRef]
- Zhou, Y.; Yuyang, Z.; Guofu, Z.; Qifen, H.; Li, Y. Evaluation of Ecological Vulnerability of County Areas in Karst Mountain Area Based on VSD Model-A Case Study of Duyun City. IOP Conf. Ser. Earth Environ. Sci. 2020, 513, 012026. [Google Scholar] [CrossRef]
- Yi, D.; Dongqin, Y.; Xiang, L.; Jianxi, H.; Wei, S.; Xuecao, L.; Hongshuo, W. Spatial–Temporal Evolution of Vegetation NDVI in Association with Climatic, Environmental and Anthropogenic Factors in the Loess Plateau, China during 2000–2015: Quantitative Analysis Based on Geographical Detector Model. Remote Sens. 2021, 13, 4380. [Google Scholar]
- Yager, R.R. On ordered weighted averaging aggregation operators in multicriteria decisionmaking. IEEE Trans. Syst. Man Cybern. 1988, 18, 183–190. [Google Scholar] [CrossRef]
- Yager, R.R. Quantifier guided aggregation using OWA operators. Int. J. Intell. Syst. 1996, 11, 49–73. [Google Scholar] [CrossRef]
- Wu, L.; Cheng, P.; Dong, L.; Cheng, X.; Gong, H.; Ma, Y.; Wei, A. Variation characteristics of extreme temperature and precipitation events of Lijiang from 1951 to 2017. J. Nanjing Univ. Inf. Sci. Technol. (Nat. Sci. Ed.) 2020, 3, 1–22. [Google Scholar]
- Sen, P.K. Estimates of the regression coefficient based on Kendall’s tau. J. Am. Stat. Assoc. 1968, 63, 1379–1389. [Google Scholar] [CrossRef]


| Item | Type | Spatial Resolution | Time | Source |
|---|---|---|---|---|
| DEM | Raster | 30m | / | Geospatial Data Cloud (http://www.gscloud.cn, accessed on 10 January 2021) |
| Administrative division | Vector | / | 2019 | Resource and Environment Science and Data Center, Chinese Academy of Sciences (http://www.resdc.cn, accessed on 10 January 2021) |
| Landform | Raster | 30 m | 2019 | National Geomatics Center of China (http://www.globallandcover.com, accessed on 10 January 2021) |
| Geological hazard location | / | / | 2005–2019 | Sichuan Research Institute for Ecological Restoration of Territorial Space and Geological hazard Prevention and Control |
| Soil erodibility factor | Raster | 30 m | / | National Science and Technology Infrastructure—National Earth System Science Data Center (http://www.geodata.cn, accessed on 10 January 2021) |
| Daily precipitation and temperature | / | / | 2000–2019 | National Meteorological Science Data Center(http://data.cma.cn, accessed on 15 January 2021) |
| Vegetation coverage | Raster | 250 m | 2005–2019 | Resource and Environment Science and Data Center, Chinese Academy of Sciences (http://www.resdc.cn, accessed on 15 January 2021) |
| Socioeconomic statistics | / | / | 2005–2019 | Statistics Bureau of Aba Tibetan and Qiang Autonomous Prefecture(http://tjj.abazhou.gov.cn, accessed on 10 January 2021) |
| Exposure Indexes | |
|---|---|
| Name of Index | Calculation Method |
| Density of geological hazards (A1) | Based on the statistical data of geological disaster points in Aba Prefecture over the years, the density of geological disasters per unit area was obtained by using ArcGIS kernel density tool |
| Density of population (A2) | A2 = N/S, where N is the total population at the end of the year, S is the land area of the administrative region |
| Fertilizer application amount (A3) | A3 = Q/T, where Q is the amount of fertilizer applied, and T is the actual cultivated land area at the end of the year |
| Per capita gross domestic product (A4) | A4 = P/N, where P is gross domestic product, N is total population |
| Extreme climate index (A5, A6 and A7) | In this study, SU25 (A5), FD0 (A6), and TNx (A7) were selected as the subsequent assessment indexes of socio-ecological vulnerability based on the significance detection results of extreme climate assessment indicators |
| Sensitivity Indexes | |
|---|---|
| Name of Index | Calculation Method |
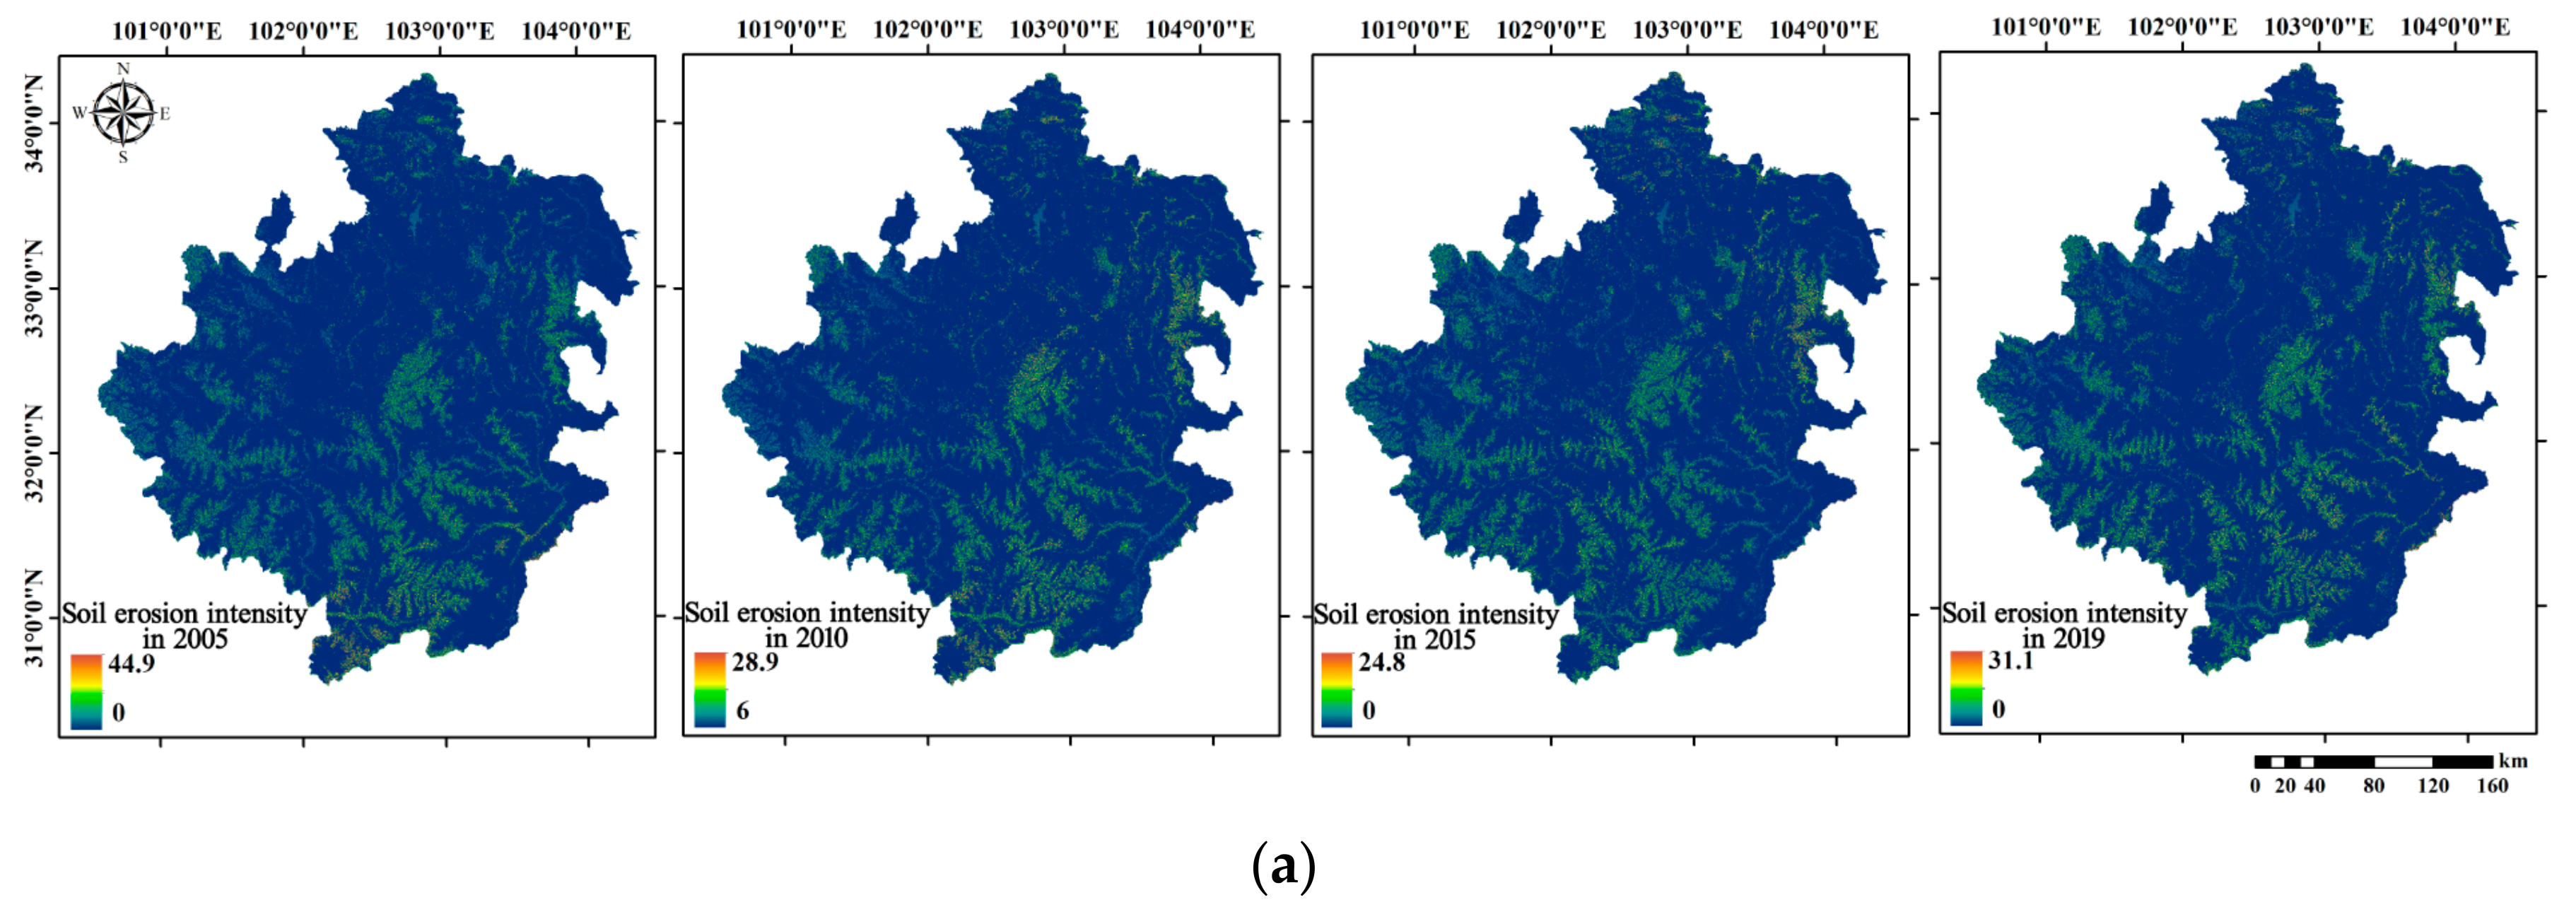
| Soil erosion intensity (B1) | B1 = R * K * L * S * F, where B1 is soil erosion intensity, R is rainfall factor, K is soil erodibility factor, L is slope length factor, S is slope factor, and F is vegetation coverage. |
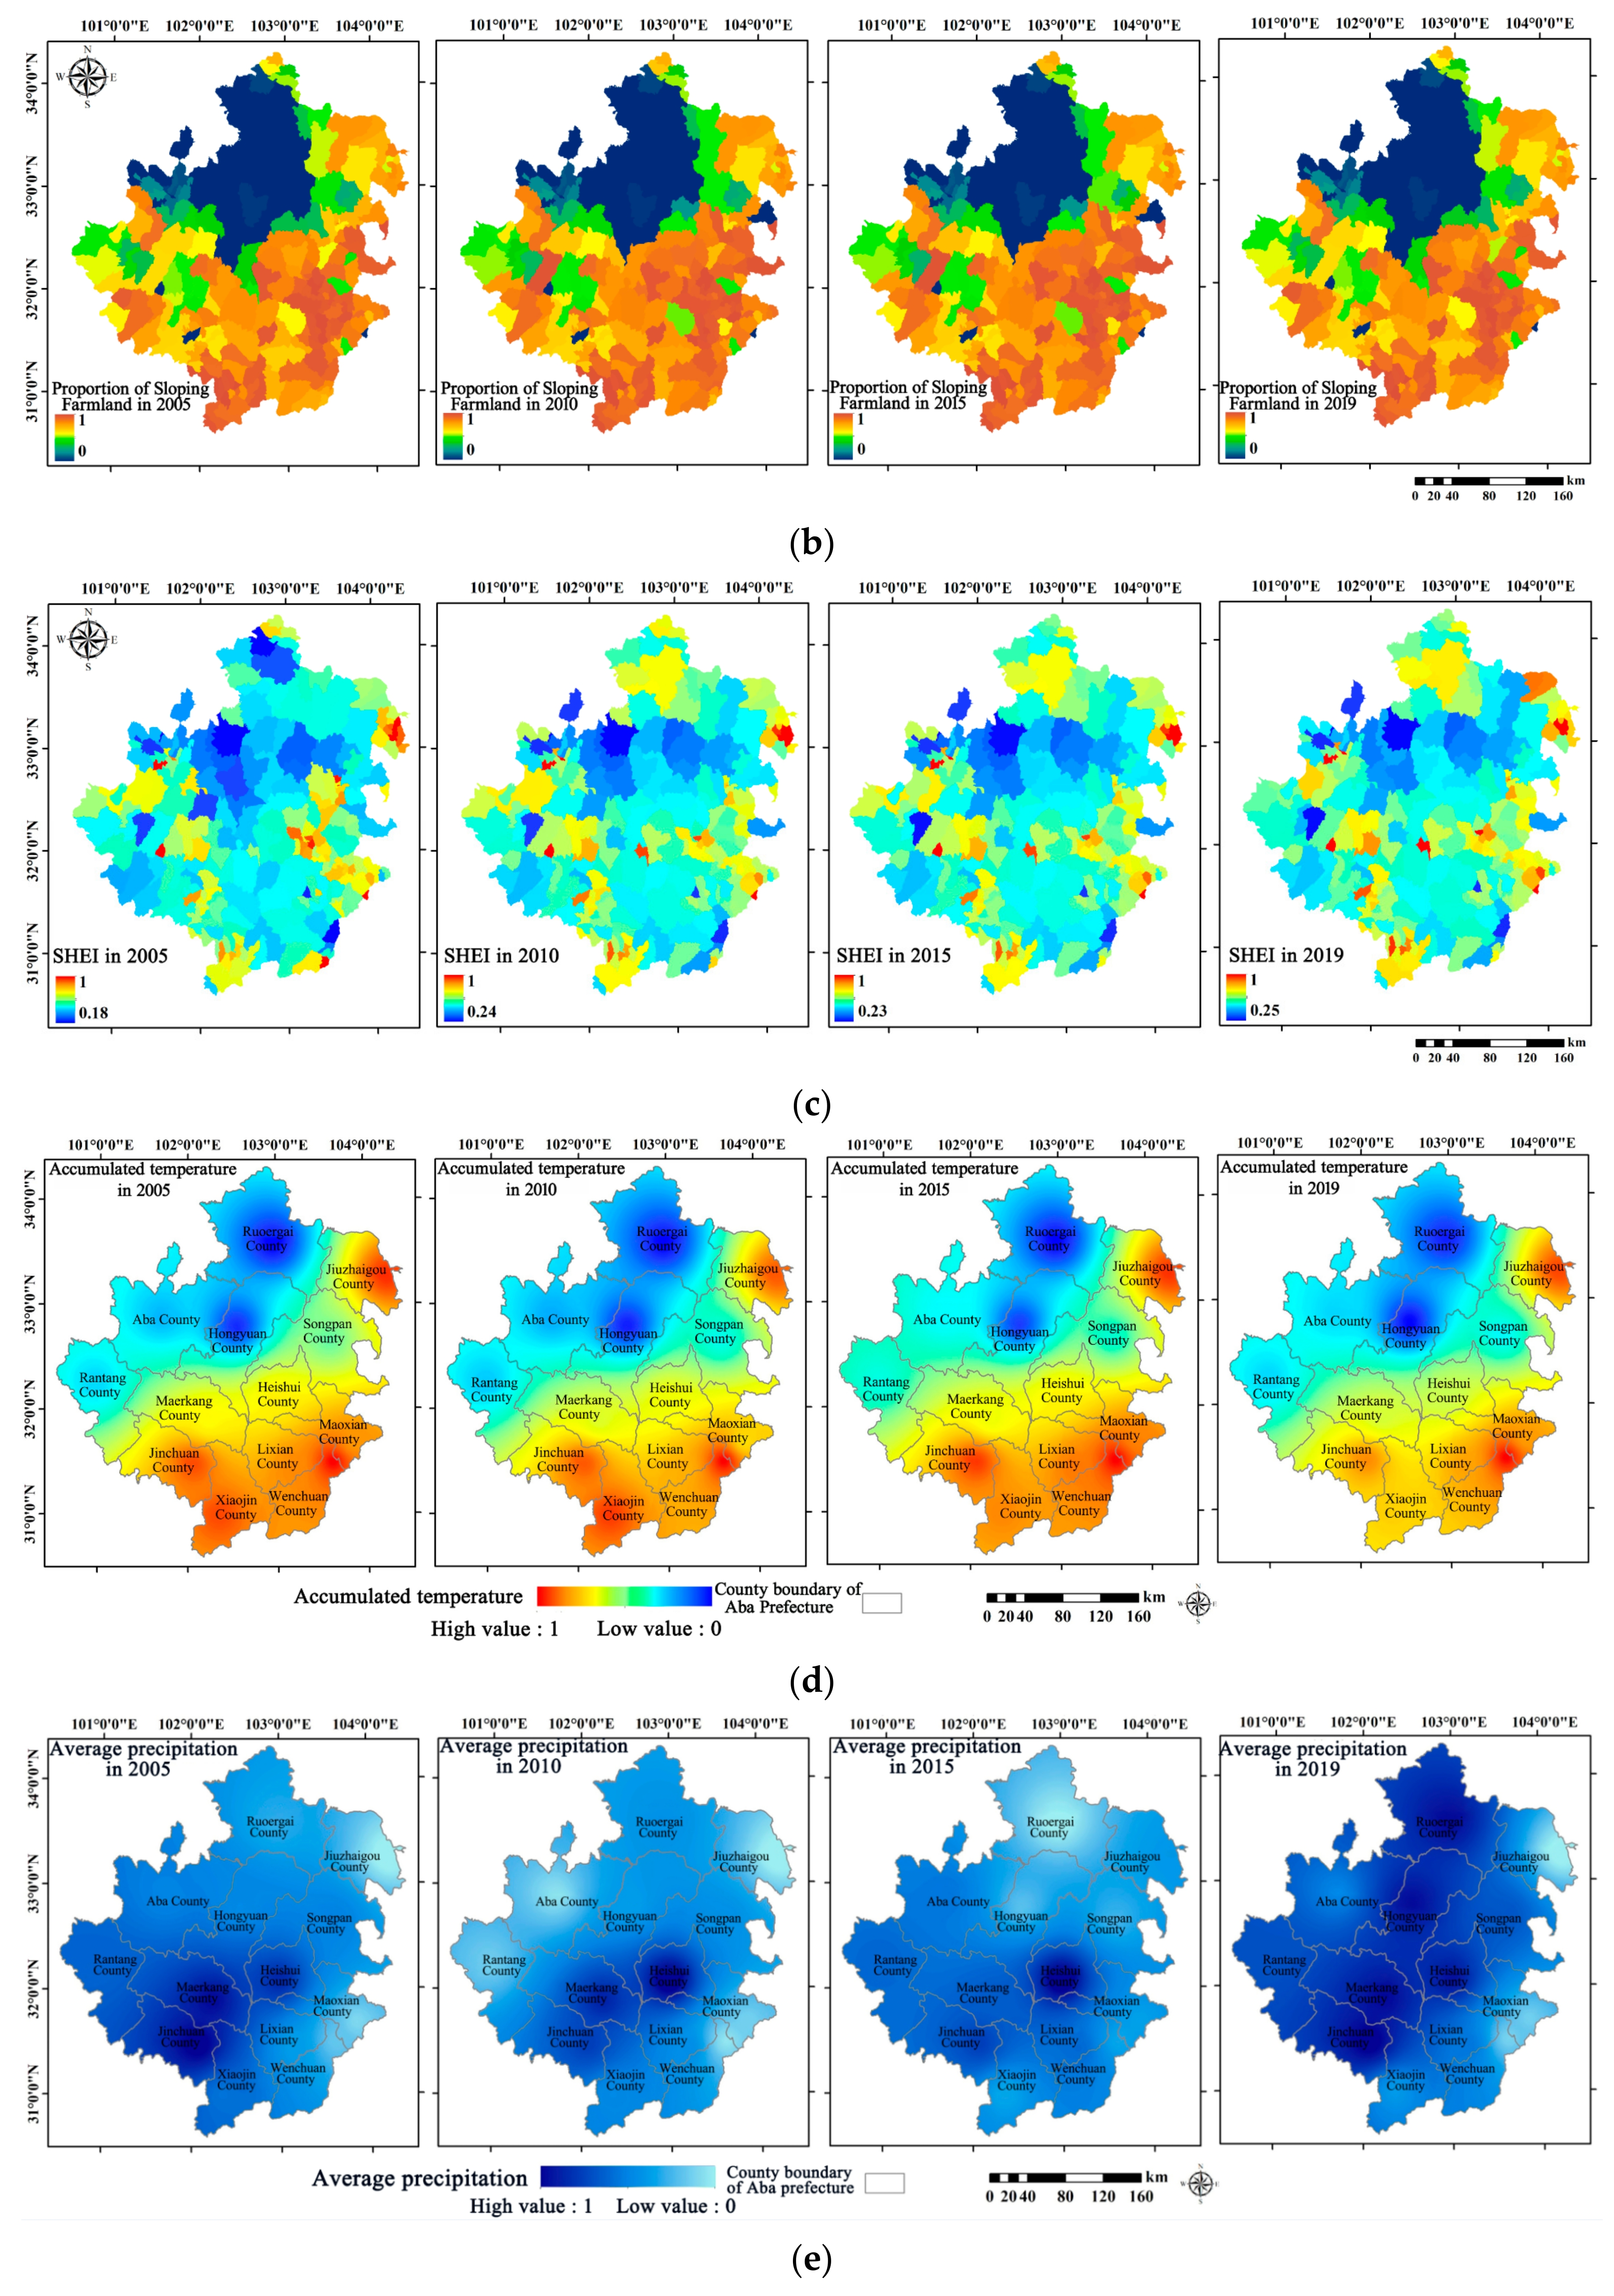
| Proportion of sloping farmland (B2) | B2 = S1/S2, S1 is the area of sloping farmland greater than 15°, S2 is the total area of cultivated land in the region |
| Shannon’s Evenness Index, SHEI (B3) | , where Pi is the proportion of landscape occupied by patch type (category) i, m is the number of patches in the landscape type, and the range is 0 ≤ SHEI ≤ 1 |
| The accumulated temperature is greater than or equal to 10 degrees (B4) | Based on the temperature data of the study area, interpolation in the ArcGIS |
| Average annual precipitation (B5) | Based on meteorological station data in the study area, interpolation in the ArcGIS |
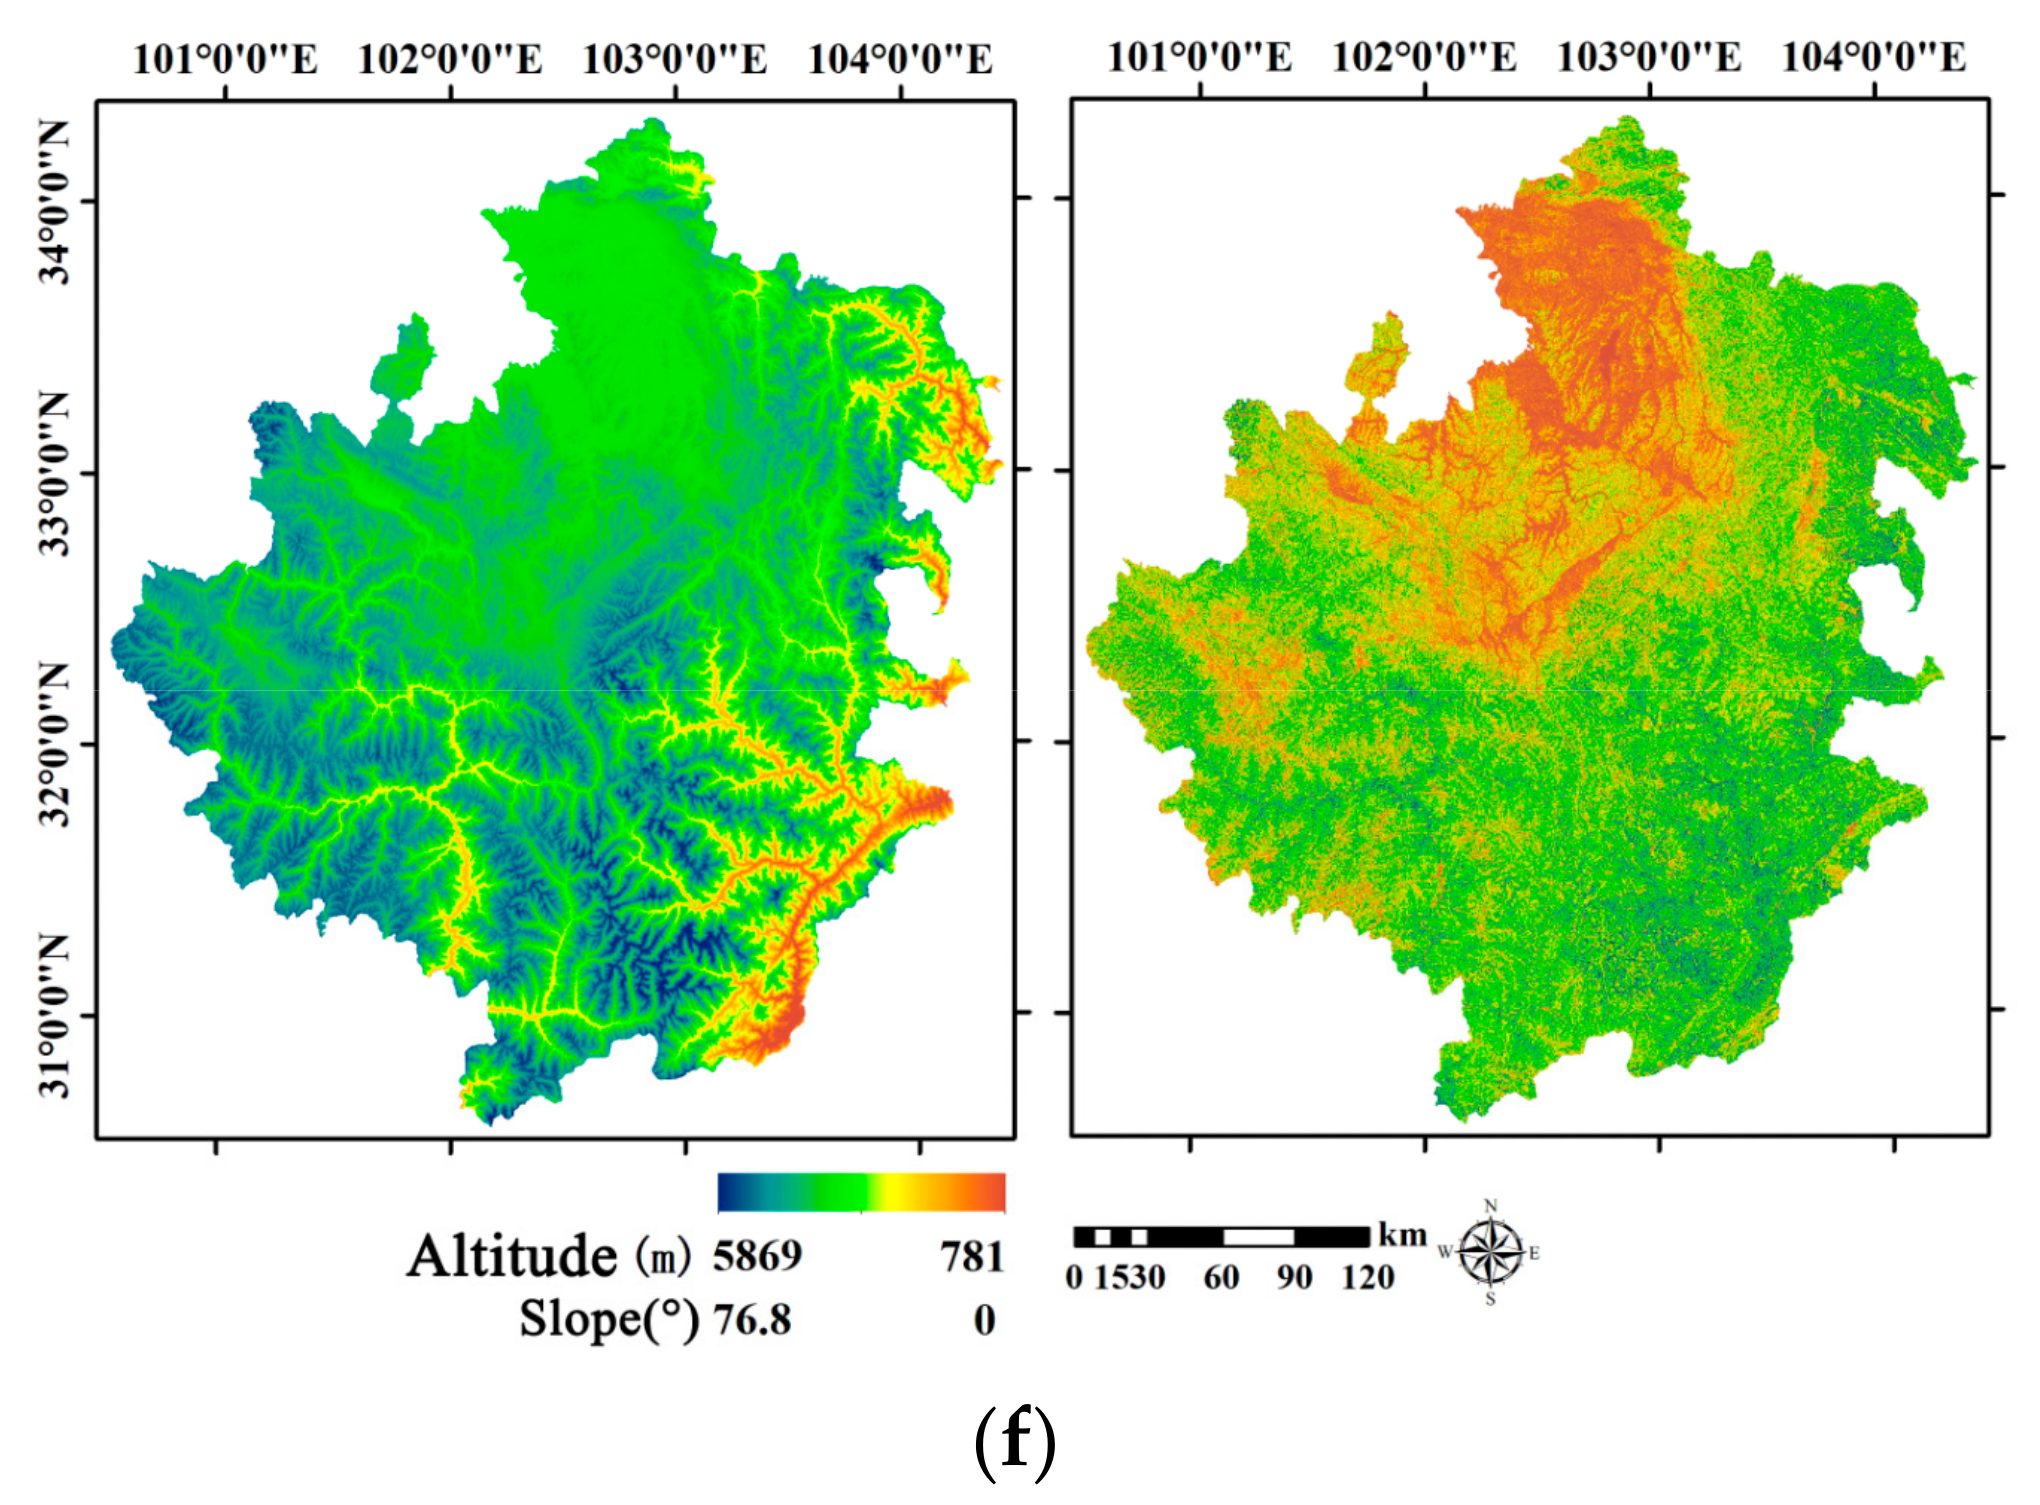
| Topographical factor (B6 and B7) | Generated based on DEM data in the study area |
| Adaptability Indexes | |
|---|---|
| Name of Index | Calculation Method |
| Grain output per unit area (C1) | C1 = N/S, where N is the total grain output of the region, and S is the area of cultivated land at the end of the year |
| Fractional vegetation cover, FVC (C2) | C2 = (NDVI − NDVIsoil)/(NDVIveg − NDVIsoil), where NDVIsoil is the NDVI value of raster cells with uncovered vegetation. NDVIveg is the NDVI value of raster cells completely covered with vegetation |
| The proportion of construction land (C3) | C3 = S1/S2, where S1 is the construction land area of the township, S2 is the total area of the township |
| Number of beds in medical and health institutions per 1000 people (C4) | Based on the statistics of medical and health institutions in the study area, interpolation in the ArcGIS |
| Biological abundance index (C5) | , where A is the total area of the township area, Aforest is the area of woodland, Agrassland is the area of grassland, Awater is the area of water, Aplough is the area of cultivated land, Abuild is the area of building land and Aunused is the area of unused land |
| Landscape shapei, LSI (C6) | , where E is the total length of all patch boundaries in the landscape, and A is the total landscape area |
| B4 | A6 | C1 | A5 | A7 | A2 | B2 | A1 | C5 | A4 | ||
|---|---|---|---|---|---|---|---|---|---|---|---|
| No preference | w (a = 1) | 0.10 | 0.10 | 0.10 | 0.10 | 0.10 | 0.10 | 0.10 | 0.10 | 0.10 | 0.10 |
| Be optimistic about | w (a = 0.1) | 0.79 | 0.06 | 0.04 | 0.03 | 0.02 | 0.02 | 0.02 | 0.01 | 0.01 | 0.01 |
| Optimism | w (a = 0.5) | 0.32 | 0.13 | 0.10 | 0.09 | 0.08 | 0.07 | 0.06 | 0.06 | 0.05 | 0.05 |
| The most optimistic | w (a = 0.0001) | 1 | 0 | 0 | 0 | 0 | 0 | 0 | 0 | 0 | 0 |
| Be pessimism about | w (a = 2) | 0.01 | 0.03 | 0.05 | 0.07 | 0.09 | 0.11 | 0.13 | 0.15 | 0.17 | 0.19 |
| Pessimism | w (a = 10) | 0 | 0 | 0 | 0 | 0.01 | 0.01 | 0.02 | 0.08 | 0.24 | 0.65 |
| The most pessimism | w (a = 1000) | 0 | 0 | 0 | 0 | 0 | 0 | 0 | 0 | 0 | 1 |
| Year | Principal Component | Exposure | Sensitivity | Adaptability | |||
|---|---|---|---|---|---|---|---|
| Weight Coefficient | Accumulated Contribution Rate (%) | Weight Coefficient | Accumulated Contribution Rate (%) | Weight Coefficient | Accumulated Contribution Rate (%) | ||
| 2005 | PC1 | 0.72 | 72.35 | 0.71 | 70.58 | 0.45 | 44.89 |
| PC2 | 0.19 | 90.89 | 0.15 | 85.35 | 0.27 | 71.76 | |
| PC3 | \ | \ | \ | \ | 0.15 | 86.49 | |
| 2010 | PC1 | 0.76 | 76.17 | 0.71 | 71.18 | 0.56 | 56.39 |
| PC2 | 0.14 | 90.53 | 0.12 | 83.32 | 0.22 | 78.37 | |
| PC3 | \ | \ | 0.09 | 92.43 | 0.12 | 89.96 | |
| 2015 | PC1 | 0.74 | 74.13 | 0.74 | 74.36 | 0.51 | 51.38 |
| PC2 | 0.12 | 85.97 | 0.10 | 83.96 | 0.22 | 73.01 | |
| PC3 | \ | \ | 0.09 | 92.86 | 0.15 | 88.16 | |
| 2019 | PC1 | 0.78 | 78.00 | 0.72 | 71.58 | 0.52 | 52.31 |
| PC2 | 0.12 | 90.35 | 0.14 | 85.30 | 0.22 | 74.12 | |
| PC3 | \ | \ | \ | \ | 0.14 | 88.29 | |
| Grade | Potential Vulnerability | Micro-Degree Vulnerability | Light Vulnerability | Moderate Vulnerability | Severe Vulnerability |
|---|---|---|---|---|---|
| Range | [0, 0.248] | (0.248, 0.428] | (0.428, 0.602] | (0.602, 0.758] | (0.758, 1] |
| Vulnerability Grade | 2005 | 2010 | 2015 | 2019 | ||||
|---|---|---|---|---|---|---|---|---|
| Area km2 | Proportion (%) | Area km2 | Proportion (%) | Area km2 | Proportion (%) | Areakm2 | Proportion (%) | |
| Potential vulnerability | 18,059.3 | 21.76 | 17,187.6 | 20.71 | 14,034.0 | 16.91 | 18,524.2 | 22.32 |
| Micro-degree vulnerability | 14,103.1 | 16.99 | 14,132.6 | 17.03 | 14,885.8 | 17.93 | 16,681.3 | 20.10 |
| Light vulnerability | 13,299.4 | 16.02 | 14,056.8 | 16.93 | 16,283.7 | 19.62 | 13,754.6 | 16.57 |
| Moderate vulnerability | 23,599.5 | 28.43 | 17,546.4 | 21.14 | 24,620.8 | 29.66 | 16,394.8 | 19.75 |
| Severe vulnerability | 13,945.8 | 16.80 | 20,083.8 | 24.20 | 13,184.6 | 15.88 | 17,654.2 | 21.27 |
| Administrative Region | Potential Vulnerability | Micro-Degree Vulnerability | Light Vulnerability | Moderate Vulnerability | Severe Vulnerability | |||||
|---|---|---|---|---|---|---|---|---|---|---|
| Area km2 | Proportion (%) | Area km2 | Proportion (%) | Area km2 | Proportion (%) | Area km2 | Proportion (%) | Area km2 | Proportion (%) | |
| Jinchuan County | 6.6 | 0.1 | 18.4 | 0.3 | 94.1 | 1.8 | 3499.2 | 65.2 | 1752.7 | 32.6 |
| Hongyuan County | 5018.9 | 60.2 | 1675.1 | 20.1 | 1299.5 | 15.6 | 348.9 | 4.2 | 0 | 0 |
| Heishui County | 0.1 | 0.1 | 2.2 | 0.1 | 347.6 | 8.4 | 3027.5 | 73.5 | 743.7 | 18.1 |
| Aba County | 4282.1 | 42.3 | 4332.3 | 42.8 | 1506.0 | 14.9 | 0 | 0 | 0 | 0 |
| Maerkang City | 0.1 | 0.1 | 9.9 | 0.2 | 1668.5 | 25.2 | 4530.0 | 68.5 | 406.5 | 6.2 |
| Ruoergai County | 7336.9 | 71.0 | 2960.5 | 28.7 | 36.2 | 0.4 | 0 | 0 | 0 | 0 |
| Wenchuan County | 1.9 | 0.1 | 6.5 | 0.2 | 0 | 0 | 364.1 | 8.9 | 3708.7 | 90.9 |
| Jiuzhaigou County | 8.5 | 0.2 | 163.1 | 3.1 | 2570.4 | 48.7 | 2389.2 | 45.3 | 147.1 | 2.8 |
| Lixian County | 0.2 | 0.1 | 0.5 | 0.1 | 0 | 0 | 725.9 | 16.7 | 3615.1 | 83.3 |
| Songpan County | 27.9 | 0.3 | 1978.1 | 23.8 | 4153.5 | 49.9 | 1768.8 | 21.3 | 396.3 | 4.8 |
| Maoxian County | 2.9 | 0.1 | 9.6 | 0.3 | 0.2 | 0.1 | 662.7 | 17.1 | 3206.6 | 82.6 |
| Xiaojin County | 5.1 | 0.1 | 13.7 | 0.3 | 0 | 0 | 2682.3 | 48.3 | 2857.0 | 51.4 |
| Rangtang County | 35.0 | 0.5 | 3471.0 | 52.3 | 2641.7 | 39.8 | 491.7 | 7.4 | 0 | 0 |
| Impact Factor | A1 | A2 | A3 | A4 | A5 | A6 | A7 | B1 | B2 | B3 |
|---|---|---|---|---|---|---|---|---|---|---|
| Q value | 0.716 | 0.750 | 0.063 | 0.444 | 0.840 | 0.871 | 0.780 | 0.009 | 0.727 | 0.147 |
| Impact value | B4 | B5 | B6 | B7 | C1 | C2 | C3 | C4 | C5 | C6 |
| Q vale | 0.888 | 0.257 | 0.246 | 0.286 | 0.846 | 0.066 | 0.084 | 0.081 | 0.581 | 0.227 |
| Q Value of Interaction | C3 | C1 | B5 | B7 | B2 | A2 | C5 | B4 | B1 | C4 |
|---|---|---|---|---|---|---|---|---|---|---|
| C3 | 0.084 | |||||||||
| C1 | 0.858 | 0.846 | ||||||||
| B5 | 0.330 | 0.904 | 0.257 | |||||||
| B7 | 0.319 | 0.865 | 0.469 | 0.286 | ||||||
| B2 | 0.739 | 0.921 | 0.814 | 0.739 | 0.727 | |||||
| A2 | 0.765 | 0.873 | 0.848 | 0.785 | 0.875 | 0.750 | ||||
| C5 | 0.599 | 0.904 | 0.669 | 0.607 | 0.764 | 0.850 | 0.581 | |||
| B4 | 0.892 | 0.907 | 0.900 | 0.898 | 0.941 | 0.895 | 0.928 | 0.888 | ||
| B1 | 0.092 | 0.847 | 0.271 | 0.299 | 0.729 | 0.751 | 0.586 | 0.888 | 0.009 | |
| C4 | 0.159 | 0.873 | 0.340 | 0.333 | 0.772 | 0.831 | 0.612 | 0.891 | 0.092 | 0.081 |
| A6 | 0.879 | 0.898 | 0.902 | 0.887 | 0.935 | 0.874 | 0.925 | 0.896 | 0.872 | 0.888 |
| C2 | 0.145 | 0.850 | 0.313 | 0.333 | 0.738 | 0.755 | 0.606 | 0.888 | 0.073 | 0.151 |
| A4 | 0.505 | 0.893 | 0.642 | 0.566 | 0.816 | 0.809 | 0.721 | 0.903 | 0.456 | 0.615 |
| C6 | 0.311 | 0.855 | 0.550 | 0.407 | 0.818 | 0.774 | 0.676 | 0.905 | 0.237 | 0.376 |
| B3 | 0.299 | 0.875 | 0.393 | 0.375 | 0.765 | 0.787 | 0.645 | 0.910 | 0.154 | 0.326 |
| A5 | 0.846 | 0.897 | 0.864 | 0.857 | 0.921 | 0.880 | 0.896 | 0.898 | 0.841 | 0.855 |
| A7 | 0.794 | 0.861 | 0.866 | 0.805 | 0.887 | 0.803 | 0.870 | 0.890 | 0.781 | 0.825 |
| A1 | 0.742 | 0.904 | 0.853 | 0.775 | 0.878 | 0.872 | 0.832 | 0.929 | 0.717 | 0.762 |
| B6 | 0.307 | 0.866 | 0.471 | 0.458 | 0.755 | 0.779 | 0.640 | 0.893 | 0.254 | 0.332 |
| A3 | 0.135 | 0.890 | 0.266 | 0.348 | 0.771 | 0.843 | 0.617 | 0.902 | 0.073 | 0.108 |
| Q Value of Interaction | A6 | C2 | A4 | C6 | B3 | A5 | A7 | A1 | B6 | A3 |
| A6 | 0.871 | |||||||||
| C2 | 0.873 | 0.066 | ||||||||
| A4 | 0.896 | 0.477 | 0.444 | |||||||
| C6 | 0.886 | 0.283 | 0.544 | 0.227 | ||||||
| B3 | 0.892 | 0.200 | 0.536 | 0.394 | 0.147 | |||||
| A5 | 0.895 | 0.842 | 0.880 | 0.865 | 0.867 | 0.840 | ||||
| A7 | 0.875 | 0.784 | 0.841 | 0.806 | 0.820 | 0.871 | 0.780 | |||
| A1 | 0.921 | 0.724 | 0.833 | 0.761 | 0.772 | 0.924 | 0.892 | 0.716 | ||
| B6 | 0.882 | 0.294 | 0.568 | 0.395 | 0.352 | 0.856 | 0.802 | 0.787 | 0.246 | |
| A3 | 0.900 | 0.131 | 0.549 | 0.352 | 0.214 | 0.860 | 0.848 | 0.742 | 0.328 | 0.063 |
| Grade | Status Quo Type | Sustainable Guide | Unsustainable Guide | |||
|---|---|---|---|---|---|---|
| Area/km2 | Proportion/% | Area/km2 | Proportion/% | Area/km2 | Proportion/% | |
| Potential vulnerability | 15,337.38 | 18.48 | 20,428.90 | 24.61 | 16,993.62 | 20.47 |
| Micro-degree vulnerability | 16,040.39 | 19.32 | 23,247.50 | 28.01 | 13,365.42 | 16.10 |
| Light vulnerability | 13,709.80 | 16.52 | 18,040.81 | 21.73 | 11,973.05 | 14.42 |
| Moderate vulnerability | 16,504.21 | 19.88 | 17,382.44 | 20.94 | 16,916.79 | 20.38 |
| Severe vulnerability | 21,414.96 | 25.80 | 3907.09 | 4.71 | 23,757.87 | 28.62 |
Publisher’s Note: MDPI stays neutral with regard to jurisdictional claims in published maps and institutional affiliations. |
© 2022 by the authors. Licensee MDPI, Basel, Switzerland. This article is an open access article distributed under the terms and conditions of the Creative Commons Attribution (CC BY) license (https://creativecommons.org/licenses/by/4.0/).
Share and Cite
Yang, X.; Dai, X.; Li, W.; Lu, H.; Liu, C.; Li, N.; Yang, Z.; He, Y.; Li, W.; Fu, X.; et al. Socio-Ecological Vulnerability in Aba Prefecture, Western Sichuan Plateau: Evaluation, Driving Forces and Scenario Simulation. ISPRS Int. J. Geo-Inf. 2022, 11, 524. https://doi.org/10.3390/ijgi11100524
Yang X, Dai X, Li W, Lu H, Liu C, Li N, Yang Z, He Y, Li W, Fu X, et al. Socio-Ecological Vulnerability in Aba Prefecture, Western Sichuan Plateau: Evaluation, Driving Forces and Scenario Simulation. ISPRS International Journal of Geo-Information. 2022; 11(10):524. https://doi.org/10.3390/ijgi11100524
Chicago/Turabian StyleYang, Xingping, Xiaoai Dai, Wenyu Li, Heng Lu, Chao Liu, Naiwen Li, Zhengli Yang, Yuxin He, Weile Li, Xiao Fu, and et al. 2022. "Socio-Ecological Vulnerability in Aba Prefecture, Western Sichuan Plateau: Evaluation, Driving Forces and Scenario Simulation" ISPRS International Journal of Geo-Information 11, no. 10: 524. https://doi.org/10.3390/ijgi11100524
APA StyleYang, X., Dai, X., Li, W., Lu, H., Liu, C., Li, N., Yang, Z., He, Y., Li, W., Fu, X., Ma, L., Shan, Y., & Wang, Y. (2022). Socio-Ecological Vulnerability in Aba Prefecture, Western Sichuan Plateau: Evaluation, Driving Forces and Scenario Simulation. ISPRS International Journal of Geo-Information, 11(10), 524. https://doi.org/10.3390/ijgi11100524