Abstract
Invasive species are an important and growing issue of concern for land managers, and the ability to collect and visualize species coverage data is vital to the management of invasive and native species. This is particularly true of spatial data, which provides invaluable information on location, establishment rates, and spread rates necessary for managing habitats. However, current methods of collection are rarely integrated into a full management tool, making it difficult to quickly collect and visualize multiple years of data for multiple species. We created the Geospatial Meadow Management Tool (GMMT) to provide a complete framework from geospatial data collection to web visualization. We demonstrate the utility of our approach using Valley Forge National Historical Park meadow survey data. The GMMT was created through the ArcGIS suite of software, taking advantage of the modularity of multiple processes, and incorporating an online visualization dashboard that allows for quick and efficient data analysis. Using Valley Forge National Historical Park as a case study, the GMMT provides a wide range of useful species coverage data and visualizations that provide simple yet insightful ways to understand species distribution. This tool highlights the ability of a web-based visualization tool to be modified to incorporate the needs of users, providing powerful visuals for non-GIS experts. Future avenues for this work include highlighted open-data and community engagement, such as citizen science, to address the increasing threat of invasive species both on and off public lands.
1. Introduction
National parks are vital public resources for the conservation of valued ecosystems and species, protecting many of the United States’ preeminent natural, cultural, and recreational resources [1]. With a legislated mandate to preserve park resources so they remain unimpaired for the enjoyment of future generations, US National Parks face new challenges in this era of rapid global environmental change [2,3,4]. In addition to climate and land-use change [5], biological invasions pose a serious threat to the National Park Service’s ability to maintain healthy and productive parks [6,7]. Invasive species are a serious challenge for both urban and natural areas, with far-reaching impacts on ecosystems [7,8]. Invasives displace native species [9], disrupt native ecosystems and ecological processes [10], threaten cultural resources and recreational opportunities [11], and can impact the visitor experience [12].
Invasives can also intensify other threats to parks, exacerbating management challenges. For example, invasive grasses, like the highly flammable cheat grass, fuel more intense wildfires [13], which are already increasing in frequency and intensity from climate change [14]. Prevention, early detection, and immediate eradication are preferred strategies for effective management [15]. Once established, coordinated management efforts are key to preventing spread [13]. However, funding and resource constraints within the National Parks System challenge effective management, and funding has been consistently inadequate for the last 20 years [16,17]. Further, external academic research is not consistent across parks, meaning resources for park-specific landscapes and species are not the same across habitats [18]. This means fewer resources may be devoted overall to invasives, and particularly to NPS units that are biologically unique, but less research-oriented.
Location information, establishment rates, and spread rates are critical for understanding biological invasions and can help inform invasive species management [19,20,21]. Invasive species spread over time and affect increasingly large areas, with impacts accruing over long time horizons [22]. Knowing where and when to manage for invasives is thus highly dependent upon quantifying spatiotemporal patterns. Geospatial technologies and Geographic Information Systems (GIS) are powerful tools, well suited for spatially explicit invasive species management applications. Maps in particular are important when managing heterogeneous landscapes with complex spatiotemporal phenomena [23] and can be used to proactively manage protected landscapes from invasive species. Spatial data visualization can be vital to coalescing complex spatiotemporal data on species coverage changes over time [24]. GIS has been used to create potential distribution maps of invasive species, map reintroduction risk, detect and rapidly assess invasions, visualize field data collection, and more [25,26,27,28]. For example, Lookingbill et al. [27] developed spatially explicit reinvasion risk maps for Antietam National Battlefield Park to help prioritize areas where management would be most successful.
Visualizations via static and interactive maps can help land managers draw insightful connections between management strategies and landscape changes, connecting on-the-ground surveys to broader trends. The use of interactive web apps, now easily accessible via widely used software such as ArcGIS Online allow end users to navigate visualizations and query them based on specific research or management concerns.
Further, GIS provides a way to quickly and effectively integrate fieldwork into a spatial platform. Vegetation data is often captured by in-person surveys, a long-standing method of observation of collection for many land managers [29]. However, these can be cumbersome to translate into spatial, web-based visualizations, especially for government agencies with limited personnel and resources. Pen-and-paper surveys require time-consuming data entry, limiting land managers’ ability to keep databases up to date. They can also be prone to sampling error [29]. This can be rectified by geo-locating these surveys into a GIS to both capture spatial patterns and easily identify, store and validate data as needed.
There are, however, shortcomings with simply digitizing surveys into geospatial data in a GIS format for use with invasive species. First, it is difficult for non-experts to access and use. This is especially true in areas where volunteers and interns are performing field surveys, or where biology professionals not trained in GIS are using these systems. Mobile-friendly data collection tools, such as Survey123, are designed to streamline this process allowing users to enter data directly into a spatial database for use with cloud-based GIS software such as ArcGIS Online. Extensive knowledge of GIS systems is often needed to prepare, calculate and visualize spatial data. In some cases, there is enough institutional and subject knowledge that there is little need to perform an extensive and drawn-out analysis to understand and derive meaningful information from the data. For example, field managers familiar with a park know what data to look for and how to understand changes year-to-year. A single workflow that allows ease of collection, access, and visualization provides a lower barrier to entry for non-GIS professionals and a much higher value in information gained.
The second concern with geolocating pen-and-paper survey results is the lack of data sharing capabilities, within both database management and visualization. A fully functional web-enabled geospatial workflow alleviates some of these concerns. A web-enabled platform allows for previous years’ data to be stored and presented as a field survey is occurring, providing easily accessible, relevant information. Furthermore, fully visualized data in an online platform can be presented and shared within the larger organization, or with other organizations [30]. For example, presenting fire data in tandem with invasive species data illuminates decision-making paths that would not be available without an integrated web-enabled geospatial workflow.
Land managers balancing invasive species monitoring with other natural resource concerns need seamless integration of field surveys, database management, analysis, and interactive web maps to make data-driven decisions with limited resources in the face of increased human-environment interactions. Opportunities exist to incorporate web-based mapping applications as synthesis tools to analyze and visualize opportunities for invasive species management. Combining ease of access to tools with simple data collection lends itself to public-based science programs such as citizen science [31]. Integrative tools can allow citizen science projects to access and create specific visualizations on-demand without the need for expert geospatial skills.
To address these needs in a single workflow, we introduce a geospatial toolkit called the Geospatial Meadow Management Tool (GMMT), a system for collecting, analyzing, visualizing, and publishing plant species coverage data powered by Survey123 and ArcGIS Online (AGOL). The resulting toolkit integrates invasive species monitoring tasks from field collection to analysis to visualization and web publishing in order to ease the data management burden on managers monitoring invasive species. It can be further adapted for the creation and sharing of spatial data for any need, particularly for those who are not GIS professionals. We demonstrate the toolkit on plant species survey data from the US National Park unit, Valley Forge National Historical Park (VAFO).
Valley Forge National Historical Park is a 3500-acre park just outside Philadelphia, Pennsylvania (Figure 1). A winter encampment site during the Revolutionary War, Valley Forge is managed to preserve historic and cultural value. The park includes the largest area of uncultivated but maintained upland, herbaceous plant cover in the Upper Mid-Atlantic region, with tallgrass meadow covering 42% (1340 acres) of the park [32]. These ecosystems are critical to native plant populations and provide valuable ecosystem services such as wildlife habitat and connectivity, nutrient cycling, carbon sequestration, and aesthetic and cultural value. However, invasive grass species like Kentucky bluegrass, vernal grass, stiltgrass, and meadow fescue in Valley Forge’s meadows and grasslands [32] threaten the viability of native ecosystems. Park managers aim to restore native plant populations to 80% of park cover to support wildlife habitat and connectivity, increase biodiversity, commemorate historic landscapes, prevent erosion and increase resilience to climate change [32]. Within the last 10 years, Valley Forge has implemented a meadow management program with detailed benchmarks (i.e., standards or metrics) for desired conditions. Park managers use mechanical treatments, herbicides, and prescribed fires for the restoration of native plants. Researchers monitor progress with annual visual surveys at over 100 sites around the park, recording coverage of both native and invasive plant species.
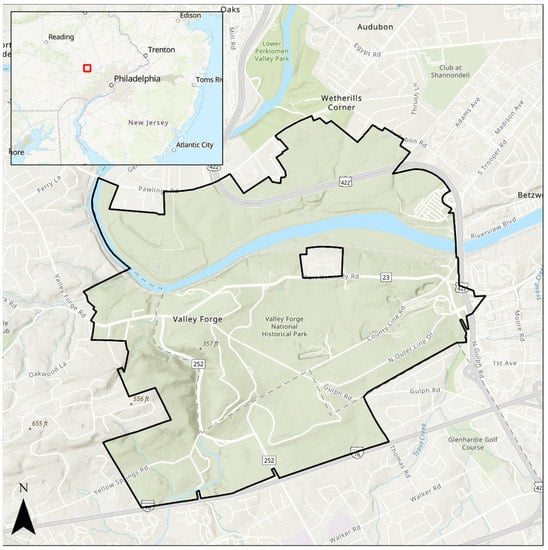
Figure 1.
The 3500-acre Valley Forge National Historical Park (black outline) is located near Philadelphia, Pennsylvania, USA.
Valley Forge’s unique historical value, management plan for meadow restoration, ecological sensitivity to invasive plant species, and proximity to dense population centers (increase in landscape disturbance) make it an exemplary testing ground for GMMT. VAFO has a preexisting meadow management program, including spatial components and historical data, upon which a full workflow can be altered to fit as needed. The Valley Forge GMMT allows surveys of field assessments to measure coverage of 27 native and invasive plant species at existing study sites. A user can then update the database to visualize trends over time, compare native species coverage to established benchmarks and publish the data to an AGOL web map for communication within the agency and the public. The tool provides a streamlined workflow for quickly and consistently integrating field survey data into existing databases that can inform real-time responses to the threat of invasive species for ecological management plans in parks and protected areas.
The following paper outlines the comprehensive GMMT method, from field survey development to data cleaning to visualization and communication. We then explore the unique use cases of the GMMT and its use in VAFO, and finally investigate lessons and next steps for a use of a spatial data workflow for invasive management.
2. Materials and Methods
The Geospatial Meadow Management Tool (GMMT) was developed within the ArcGIS ecosystem produced by Environmental Systems Research Institute (ESRI). The GMMT workflow consists of three main components: field collection, data processing, and web visualization (Figure 2). The GMMT tool was co-developed through an iterative process with National Park Service staff at Valley Forge. Park staff provided feedback on preferred platforms, helped fine-tune interfaces and visualizations, and selected field data collection metrics/benchmarks. NPS staff had varying familiarity with ArcGIS as product users, which allowed us to ensure that the GMMT tool meets the needs of both novice and more experienced users. The field collection was built and performed in Survey123, the data preparation and analysis were performed in ArcPro, and the data visualization was performed in ArcGIS Online. The workflow is built modularly to allow for interventions or customization as needed by users. Field observations are a major component of species monitoring, and because observations typically occur at a specific time interval this workflow also assumes an additive approach to data collection, where data is incrementally added over a number of years.
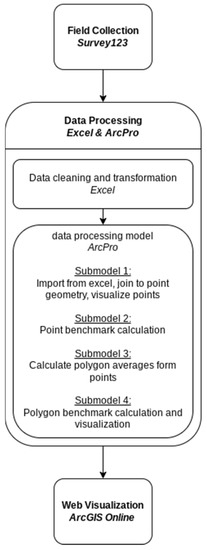
Figure 2.
The workflow and software used in the GMMT. The data processing model and submodels were created in ModelBuilder within ArcPro.
The utility of the GMMT lies in its ability to show the effectiveness of invasive/non-native species management and to monitor conditions of native species of interest. The main field observation metric used to accomplish these objectives is species coverage. Species coverage is a simple measure of the relative area covered by a given species in a specified plot (such as a 4ft-by-4ft area) and is often reported as a percentage. The effectiveness of management actions is determined by the user and can take the form of positive change, meeting a threshold or benchmark, or presence/absence. Further, by collecting the same data from the same standardized plot over multiple years, comparisons can be made on the effectiveness of interventions.
2.1. Field Collection
The data collection structure of the GMMT was created in Survey123 (Figure 3). Survey123 is a cross-platform survey data collection software where a user can both create and specify the behavior of the survey. In contrast to other field collection tools such as ArcGIS Collector, ArcGIS Survey123 is an aspatial collection tool that can be tied to geometry if desired. For field collections, this can be advantageous as every collection is at the same field plot, allowing for collection location to be standardized and reducing human error. The use of this product also facilitates easy access to the survey in the ArcGIS Online (AGOL) ecosystem. The survey was created in Survey123 Connect, the desktop version of Survey123, and saved to an AGOL portal. The survey can be loaded to a mobile device for field collection. Users can scroll through each species indicating coverage of the species in question. When observation is complete, the survey is saved in the AGOL portal. It can then be downloaded and edited in any format. For this work, data was exported to Microsoft Excel.
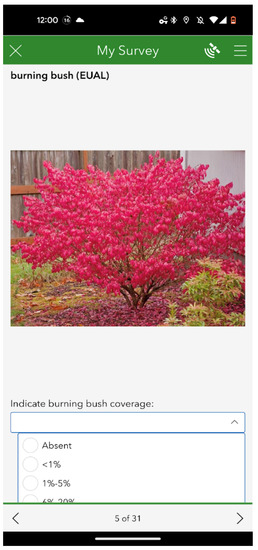
Figure 3.
Survey123 entry for burning bush (EUAL). The page shows the name and image of the species and a dropdown option for species coverage at a specific point. The image was captured from a mobile phone Survey123 application.
The GMMT survey includes a list of species of interest and predetermined survey plot collection points. The survey is completed at each collection point, which is numbered and later associated with the point geometry location of the survey plot. At each point, the survey prompts the user for the name of the collector and data. Other information can be added as needed, such as details about the person collecting data (e.g., permanent staff member, seasonal worker, or volunteer) or site conditions (e.g., informal trails, trash). The survey iterates through each species, requiring user input for coverage of the species at the given plot. To simplify the collection of data, species coverage data can be collected as a predetermined coverage class (e.g., 1–10%) or an exact coverage, depending on the need of the specific species. Coverage categories allow for standardization of answers, and a drop-down selection tool was used for specifying the selections. For species that require an exact coverage calculation, a text box with a bounded entry of 0–100% is used. Images of species are also embedded in the survey for context.
2.2. Data Processing
The platform ArcGIS Pro is used to manage existing data, calculate new data, and link to spatial references. ArcPro is a GIS software that allows for automation of many data management needs, and serves as a staging portal for using AGOL. Further, ArcPro can incorporate modular automation and Python scripting as part of workflow creation, allowing for customization as needed. ArcPro can visualize spatial data before it is uploaded to AGOL, which can also be automated.
After the field survey was exported from Survey123 to Excel, it was organized to be properly imported into ArcPro. The data exported from Survey123 is “wide” —each observation has a set of multiple attributes associated with it, including date and coverage. To successfully filter and map multiple years and species within ArcGIS, it must first be transformed into a “long” data format, where each combination of year, species, and plot point is in separate rows. This transformation is done in Excel, after which the output is imported into ArcPro through a geospatial toolbox. The toolbox contains a full data processing model consisting of four submodels, built through ModelBuilder—a modular geoprocessing tool builder within ArcGIS Pro (Figure 4).
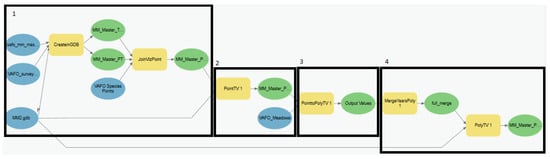
Figure 4.
The ArcPro modelbuilder contains the four major submodels. Submodel 1 designates the import of observation data and joining the data to point geometry; submodel 2 designates the calculation of species benchmarks for points; submodel 3 designates the averaging of point values by meadow; and submodel 4 designates the calculation of species benchmarks for meadows.
The first submodel imports the data in the Excel format and joins it to each observation’s point geometry using point id numbers. Because each observation was transformed into long data, there are multiple observations per point. To match multiple instances of observations at a given location, a one-to-many join is used. The first submodel also visualizes each point based on a predetermined symbology scheme based on the coverage. The second submodel calculates benchmarks for each species of interest. These benchmarks can be changed as needed. An attribute field calculation was used in the model to create a new field that designated each observation to three categories; they are defined as specific target ranges for a species separated into “good”, “fair”, and “poor”. The designations are created as a separate feature class, as the symbology is separate and based on a target value. This further allows comparison between coverages and benchmarks. Because data also needs to be generalized by meadow, the third submodel averages the point values based on the meadow polygon the point is located in. The observations for each point are averaged by year and by species. Only species for which a continuous coverage of 0–100% was collected are included in this step due to the limitations of averaging categorical coverage values. The fourth submodel repeats the benchmark calculator for the polygons and also visualizes them based on the “good”, “fair”, and “poor” symbology scheme.
The tool creates three separate feature class layers as outputs: a point file of all the coverage classes, a point feature class with the benchmark designations, and a polygon feature class of the benchmark designations. Each feature class contains all years and species for each polygon or point.
2.3. Mapping
Once the data are processed, the feature class outputs can be uploaded to an ArcGIS web feature class, allowing for continual updates. ArcPro can upload and overwrite Web feature layers to ArcGIS Online (Figure 5). As more data are collected, they can be added to the feature classes, which overwrites the matching feature layers while retaining connections to the services using those layers. Once uploaded, the online maps were imported into a WebApp, which used spatial data combined with a set of out-of-the-box visualizations and customizable interactive elements. The ArcGIS Online portal can be readily shared through a web link, while still protecting source data. It also has the capability for management-related spatial data sources to be added.
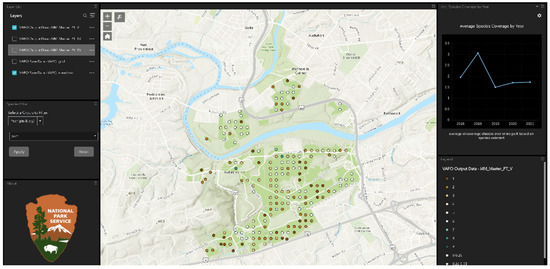
Figure 5.
The Valley Forge Geospatial Meadow Management Tool (GMMT) ArcGIS Online Map Application. The map is displaying the coverage for the invasive species oriental bittersweet. Top left contains the layer list; the middle left contains the filter options. Top right contains the average coverage per year collected, and the bottom right contains the legend for all layers turned on.
3. Results
Using Valley Forge National Historical Park as a case study, the GMMT provides a wide range of useful species coverage data and visualizations that provide simple yet insightful ways to understand species distribution. There are three specific ways the GMMT meets the main objective of highlighting benchmarks and species change. The first is the visualization of benchmarks to understand if management actions are resulting in changing outcomes. The second is visualizing differences between geographies of scale for benchmarks. The third is understanding trends of non-benchmarked species, where coverage classification visualization is a vital component of management.
We initiated the meadow management tool by establishing a database of plant species of concern and incorporated five years of past survey results into the existing database and web map. The protocol above was used with 27 species, 21 of which were invasive plant species and three native non-invasive species. Two other broad categories were collected: grassland and forb coverage. Data were also acquired for the previous five years to calculate benchmarks in an online spatial format and enable temporal analysis. Additionally, five benchmarks were calculated as part of the VAFO implementation of the meadow management tool.
The resulting GMMT application addressed the needs of VAFO through three main applications included with the online map. The first was simplified layer management, where layers can be turned on or off as needed. This also allows for the comparison of polygon and point values. The second was a set of filters for specifying year and species coverage or benchmark. Last was a set of line graphs responsive to the year and species selected. The line graphs provide a temporal visualization of the changes between the years collected.
Within the VAFO framework of the GMMT, four species were benchmarked: violet, thistle, milkweed, native grass coverage, and the fifth benchmark looking at total native species coverage [32]. Each benchmark had corresponding “good”, “fair” and “poor” categories providing easy-to-understand outcomes. Each point was visualized through a green, yellow, and red color respectively. While there were >180 total plot locations that could have been used any given year in the park, data was not collected every year at every location. These are filtered based on year, and overall, five years of data were included in the visualization.
Ready visualization of the benchmarks allows users to see changes each year and compare counts of each benchmark in the top right corner. The purpose is to provide an easily decipherable visualization to facilitate rapid management decisions. In the case of VAFO, this means understanding the change in specific plots based on larger-scale management action. The inclusion of multiple benchmarks facilitates easy comparison of the same intervention across multiple species. For example, does a prescribed burn cause change between thistle and milkweed over 1 to 3 years in the same location? The Valley Forge Meadow Management Plan calls for a certain coverage of forb within the park. Calculating this at every point, the tool can visualize this benchmark for every year. In 2021, (Figure 6) there was a relatively even balance of “good” and “bad” forb coverage across the park. The application can visualize the locations of those plots and how many fall into each category for a year.
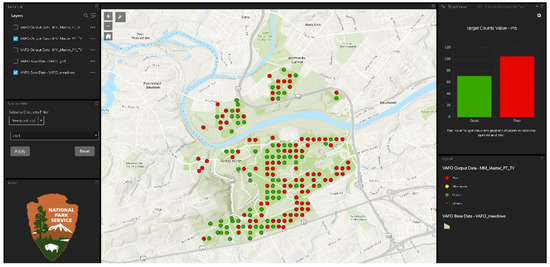
Figure 6.
The GMMT online tool shows a representation of forb coverage benchmarks. The green represents points indicating “good” benchmarks, while the red indicates “poor” benchmarks. Top right shows the total count of points for each benchmark.
The second visualization result is the use of polygons and points in the same benchmark visualizations. The above five benchmarks were transformed to a polygon-wide average to compare two scales. Some benchmarks are identified as meadow-wide benchmarks while others might be point based, depending on the scale of the process being analyzed. For example, park-wide native species coverage may be a useful metric than coverage at a specific plot for leveraging funding or resources for management. The multiscale visualization provides a tool for understanding why and how meadow outcomes are spatially distributed and areas to focus interventions. They may also highlight areas of success and hot/cold spots. This would occur where a meadow was calculated as “poor”, but many individual points were calculated as “good”. This scale contrast is an easy way to point at overall success while still highlighting areas for further observation. For example, meadow-wide interventions may be more useful in the case of native species coverage. To analyze the small-scale changes and the meadow-wide changes the two benchmarks can be overlaid (Figure 7). In this case, in 2019 the collected areas showed overall good native species coverage based on meadow benchmarks. The overlay analysis allows for managers to highlight moderate and poor areas in otherwise well-performing meadows to understand where and why disparities are occurring.
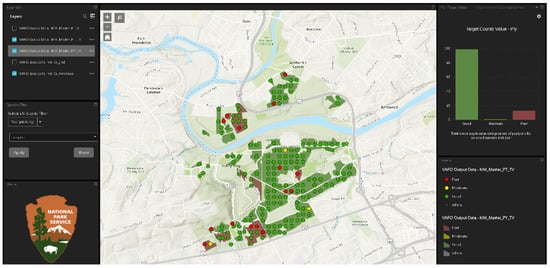
Figure 7.
The GMMT online tool shows a representation of native species coverage benchmarks in point and meadow layers. The green represents points indicating “good” coverage/presence, while the red indicates “poor” coverage/presence. Benchmarks are user-defined (customizable) and vary by species or community. Top right shows the total count of points for each benchmark.
Last, the GMMT tool provides comprehensive coverage visualizations for a variety of non-benchmarked species. Each non-benchmark species is represented in nine coverage classes, providing an easily discernible but sufficiently complex representation of coverage. Not every species was collected at every point every year, but each species was represented in all five years. The GMMT tool provides filtering for year and species, allowing for easily comparable outcomes across either spectrum. A line graph represents the average change in coverage over time for each species. If needed, these point visualizations can be overlaid with the benchmark points or meadow polygons to compare values. These tools can help decipher if the intended outcomes are being met year by year, or if certain areas in the park need to be studied more or replicated in other areas. Using the invasive species Oriental Bittersweet as an example, the online GMMT tool has an option to quickly filter to the year 2021 and use the USDA code for Oriental Bittersweet “CEOR7” to highlight the species coverage for the given year (Figure 5). The GMMT web application shows a decrease in CEOR7 coverage from 2018 to 2019 and relatively even coverage for the remaining years. This could indicate effective interventions, however further exploration of the data can shed more light. In this case, 2018 to 2019 shows average change, but a look at the maps from each of those years shows that data was collected in different areas of the park. Individual points may be examined directly through the interface if further analysis is required.
4. Discussion
In this study, we detail the function, design, and application of the Geospatial Meadow Management Tool (GMMT), a geospatial toolkit that establishes an end-to-end workflow for invasive species monitoring, integrating field surveys to a database and web map. This tool combines the power of enterprise-scale GIS tools with the value of on-the-ground surveys, providing an integrated tool for tracking progress against established benchmarks. We piloted the toolkit on Valley Forge National Historical Park’s Meadow Management program, demonstrating the tool’s capability to analyze and display complex spatial and temporal species cover data, and eliminate cumbersome data entry and management steps for resource-strapped government land management agencies. Localizing the meadow management tool for Valley Forge’s meadow management needs gives park staff insight into past patterns of invasive and native plant species cover, and the ability to conduct future surveys from mobile devices and seamlessly integrate them into the database and web visualization to monitor the impacts of their Meadow Management Program.
The unique spatial component of the GMMT provides two major insights for management data. First, it provides easily comparable temporal visualization of species, a vital component for comparing management over multiple years. The web application provides an easily comparable average coverage through the utilization of a line graph based on the selected species. This creates a quick way to analyze the temporal dynamics of a specific species without needing complex functions to change layer visibility for five individual years. To compare individual plots, the point pop-ups can easily be scrolled to identify changes.
Second, the spatial component of the outputs provide the opportunity to compare multiple spatial scales at the same time. The tool provides a benchmark calculation based on the average cover of the specified species in the meadows, and these meadows can be used in comparison with any of the point data available. This provides a simple but powerful visualization to identify areas of success or needed improvement, as multi-scale visualization is an important outcome of species interventions, assisting in appropriately scaled management decisions [33]. This is useful for highlighting areas of possible intervention at a plot level when benchmarks are cited for the meadow level. The comparison is particularly important for understanding the success of intervention strategies at multiple levels, as some interventions may be focused on a plot level, while others at a meadow level. However, multi-scalar mapping can provide insight into intervention effectiveness and the scales of influence of each intervention.
Beyond these specific examples, there are multiple advantages of the GMMT over non-digital data collection. First is the ability to integrate field observations directly into the GMMT workflow. The use of Survey123 means that data collected are saved in AGOL where they can be analyzed and mapped directly and are available for integration into the workflow. This also means that any device that can install the Survey123 application can be used in the field for collection without an internet connection.
Because the survey is self-contained, non-GIS users can use Survey123 without having to learn the software or the technical attributes of a GPS collection device. This is a major benefit to collecting data as non-technically trained staff, such as summer interns or volunteers, can accomplish this. Further, the use of digital collection as part of the meadow management tool produces better integration into the chosen digital ecosystem. This iteration of the tool uses ArcGIS, promoting inclusion of collected data in all phases of the tool. For example, past data can be accessed as technicians are remotely collecting field data. Beyond the use of the data collected within the tool, the tool allows for quick access to cloud-based data and applications on mobile devices.
Another benefit of the tool is the ability to visualize data quickly and efficiently from multiple survey years. Because the data are collected and stored in one database, data can be visualized as needed and multiple years can be analyzed at once. Multi-year data collection creates a robust database that generates comprehensive tracking of species changes. More data means a better ability to make decisions and see impacts of multi-year efforts. One of the major benefits of integrating data at VAFO—and within the National Park Service in general—is that management actions are inherently spatial and are recorded in the form of spatial data. These include wildfire and prescribed fire layers, infrastructure, vegetation removal, maintenance, and more. While the main objective is to assess the effectiveness of management actions, other layers provide context for changes that would otherwise not be recognizable in examining a single year of fieldwork. The ability to toggle between benchmarks and species while visualizing multiple scales at once makes both reporting and decision-making a more effective process. Detailed databases need to start somewhere and even first-time data collection efforts with the GMMT allow users to integrate field data with other spatial layers and compare multiple spatial scales. Further, early iterations of the tool allowed for visualization “gut checks” for data managers both in terms of what data to present and what data to validate [30].
4.1. Future Research/Additions to the Tool
4.1.1. Complete Automation
The primary potential improvement for the tool would be complete automation of the three main processes. Automatically calculating benchmarks as data is collected provides in-field and visualization benefits over both paper and GMMT collections. In particular, the ability to understand the change against previous years, and collect other data as needed based on real-time results has proven beneficial. Still, one major advantage to the GMMT in its current iteration is the modularity of the structure, which allows for troubleshooting as well as easily customized scaled workflows of the model as needed [34]. A fully automated system must address the ability to use each section independently or together as needed. An option would be to integrate programming languages to the full application, rather than out-of-the-box tools such as ArcGIS. The trade-off is the ease of fully integrating into the geospatial data of the given institution or agency, and the technical expertise needed for development and upkeep compared to systems such as ArcGIS.
4.1.2. Visualization
Another important aspect of GMMT improvement is rethinking temporal visualization for individual points. Visualizing change over time for a specific point is difficult to optimize for both information dissemination and clarity. The GMMT tool uses individual layers that users can switch on and off, while also including supplemental information such as line graphs to quickly visualize the information. Visualization techniques, such as bivariate symbology schemes can be used to compare three by three or four-by-four characterizations of coverages and are appropriate for time-series mapping [35,36]. However, the inclusion of these comparisons is currently unavailable on AGOL due to the amount of data needed to compare multiple variables. Further, on-the-fly visualization is also not currently available within AGOL. For example, different attributes cannot be selected to compare against, such as selecting two years for a given species to quickly compare based on a bivariate color scheme. This requires predetermining every combination of data and then uploading all combinations to AGOL. The technical problem can be efficiently solved by creating an application from the ground up, but requires technical ability and resources to accomplish. Still, further work on understanding the best way to visualize temporal change over multiple scales for geospatial data in a simplified platform can benefit applications such as the GMMT.
4.1.3. Open Source and Citizen Science
One major component of the GMMT is the implementation of open-source data practices as part of a continued effort to increase sharing of data, models, and processes. This model tool was developed with modularity, a common way to make sure tools can be accessed and edited as needed [34]. This means that submodels may be used from the ArcPro model, or the Survey123 portion may be used for any field collection without the need for additional calculation and mapping. The ArcGIS toolbox and structure can be shared and developed as needed, but only through the ArcGIS ecosystem. Further iterations of these tools could be developed in a way where models can be shared and used across platforms and data types. This can be accomplished through techniques such as using fully open-source code with detailed documentation. Open science is also a consideration for public science engagement, particularly citizen science [31]. While the GMMT was conceptualized to provide internal data analysis with data visualization, an open-source citizen-science process would allow for full integration from collection to data visualization of publicly collected data. This would allow parks to be able to implement volunteers (or simply non-spatial experts) if desired as data would be collected without being processed. This goes beyond a simple collection of data for parks as well. This tool could be implemented to help the public collect data on invasive species in a citizen science setting, as the standardized process and mapping tools can be altered to fit the needs of a scaled project or data-sharing system [37].
5. Conclusions
The GMMT tool provides a web-enabled geospatial workflow that provides a simple and effective way to collect, calculate and visualize species data. It addresses the needs of managers by iteratively building a management database that is easily shareable, and simple enough to not require geospatial experts. It enables the user to quickly report on findings and explore multi-year data without the need for extensive calculations or data manipulation. Further, it can be modified to meet the needs of different species, landscapes, and management plans. The tool as a framework can also be valuable in a data-sharing ecosystem, such as an open-source citizen-science approach, which can be used by non-experts for invasive species (or other) spatial data collection projects. These data can be openly shared and can bridge the gap between easy-to-understand visualization and expert knowledge. In any use, the GMMT addresses the need to integrate data collection and sharing as a path to addressing the increased threat of invasive species in a modifiable framework.
Author Contributions
Conceptualization, Joshua Randall and Jelena Vukomanovic; methodology, Joshua Randall; software, Joshua Randall; investigation, Joshua Randall; data curation, Joshua Randall; writing—original draft preparation, Joshua Randall, Nicole C. Inglis and Lindsey Smart; writing—review and editing, all authors; visualization, Joshua Randall; supervision, Jelena Vukomanovic; funding acquisition, Jelena Vukomanovic. All authors have read and agreed to the published version of the manuscript.
Funding
This research was supported by the U.S. National Park Service (“Analytics and Communication Tools for the Valley Forge Meadow Management Plan”).
Data Availability Statement
The data used in this study includes information about the location and distribution of threatened and endangered species and thus is not publicly available. The toolbox can be accessed here: https://github.com/ncsu-landchangelab/GMMT (accessed on 15 August 2022).
Acknowledgments
We thank Amy Ruhe, John Turck, Nathan Dammeyer, Kate Jensen, and Justin Shedd for assistance and feedback on the GMMT. We thank Kate Jones and Alexander Yoshizumi for helpful feedback on earlier versions of this manuscript.
Conflicts of Interest
The authors declare no conflict of interest. The funders had no role in the design of the study; in the collection, analyses, or interpretation of data; in the writing of the manuscript; or in the decision to publish the results.
References
- Colwell, R.; Avery, S.; Berger, J.; Davis, G.E.; Hamilton, H.; Lovejoy, T.; Malcom, S.; McMullen, A.; Novacek, M.; Roberts, R.J.; et al. Revisiting Leopold: Resource Stewardship in the National Parks. Natl. Park Syst. 2014, 20, 15–24. [Google Scholar] [CrossRef]
- Gonzalez, P.; Wang, F.; Notaro, M.; Vimont, D.J.; Williams, J.W. Disproportionate Magnitude of Climate Change in United States National Parks. Environ. Res. Lett. 2018, 13, 104001. [Google Scholar] [CrossRef]
- Hansen, A.J.; Piekielek, N.; Davis, C.; Haas, J.; Theobald, D.M.; Gross, J.E.; Monahan, W.B.; Olliff, T.; Running, S.W. Exposure of U.S. National Parks to Land Use and Climate Change 1900–2100. Ecol. Appl. 2014, 24, 484–502. [Google Scholar] [CrossRef] [PubMed]
- Jantarasami, L.C.; Lawler, J.J.; Thomas, C.W. Institutional Barriers to Climate Change Adaptation in U.S. National Parks and Forests. Ecol. Soc. 2010, 15, 33. [Google Scholar] [CrossRef]
- Gimmi, U.; Schmidt, S.L.; Hawbaker, T.J.; Alcántara, C.; Gafvert, U.; Radeloff, V.C. Increasing Development in the Surroundings of U.S. National Park Service Holdings Jeopardizes Park Effectiveness. J. Environ. Manag. 2011, 92, 229–239. [Google Scholar] [CrossRef]
- Dayer, A.A.; Redford, K.H.; Campbell, K.J.; Dickman, C.R.; Epanchin-Niell, R.S.; Grosholz, E.D.; Hallac, D.E.; Leslie, E.F.; Richardson, L.A.; Schwartz, M.W. The Unaddressed Threat of Invasive Animals in U.S. National Parks. Biol. Invasions 2020, 22, 177–188. [Google Scholar] [CrossRef]
- Pimentel, D.; Zuniga, R.; Morrison, D. Update on the Environmental and Economic Costs Associated with Alien-Invasive Species in the United States. Ecol. Econ. 2005, 52, 273–288. [Google Scholar] [CrossRef]
- Aukema, J.E.; Leung, B.; Kovacs, K.; Chivers, C.; Britton, K.O.; Englin, J.; Frankel, S.J.; Haight, R.G.; Holmes, T.P.; Liebhold, A.M.; et al. Economic Impacts of Non-Native Forest Insects in the Continental United States. PLoS ONE 2011, 6, e24587. [Google Scholar] [CrossRef]
- Huxel, G.R. Rapid Displacement of Native Species by Invasive Species: Effects of Hybridization. Biol. Conserv. 1999, 89, 143–152. [Google Scholar] [CrossRef]
- Dukes, J.S.; Mooney, H.A. Disruption of Ecosystem Processes in Western North America by Invasive Species. Rev. Chil. Hist. Nat. 2004, 77, 411–437. [Google Scholar] [CrossRef]
- Alexander, J.M.; Frankel, S.J.; Hapner, N.; Phillips, J.L.; Dupuis, V. Working across Cultures to Protect Native American Natural and Cultural Resources from Invasive Species in California. J. For. 2016, 115, 473–479. [Google Scholar] [CrossRef]
- Sharp, R.L.; Larson, L.R.; Green, G.T. Factors Influencing Public Preferences for Invasive Alien Species Management. Biol. Conserv. 2011, 144, 2097–2104. [Google Scholar] [CrossRef]
- Reaser, J.K.; Burgiel, S.W.; Kirkey, J.; Brantley, K.A.; Veatch, S.D.; Burgos-Rodríguez, J. The Early Detection of and Rapid Response (EDRR) to Invasive Species: A Conceptual Framework and Federal Capacities Assessment. Biol. Invasions 2020, 22, 1–19. [Google Scholar] [CrossRef]
- Wotton, B.M.; Nock, C.A.; Flannigan, M.D. Forest Fire Occurrence and Climate Change in Canada. Int. J. Wildland Fire 2010, 19, 253–271. [Google Scholar] [CrossRef]
- Lodge, D.M.; Williams, S.; MacIsaac, H.J. Biological Invasions: Recommendations for US Policy and Management. Ecol. Appl. 2006, 16, 2035–2054. [Google Scholar] [CrossRef]
- Ansson, R.J., Jr. Our National Parks-Overcrowded, Underfunded, and Besieged with a Myriad of Vexing Problems: How Can We Best Fund Our Imperiled National Park System. J. Land Use Environ. Law 1998, 14, 1. [Google Scholar]
- Walls, M. Economics of the US National Park System: Values, Funding, and Resource Management Challenges. Annu. Rev. Resour. Econ. 2022, 14, 579–596. [Google Scholar] [CrossRef]
- Vukomanovic, J.; Randall, J. Research Trends in U.S. National Parks, the World’s “living Laboratories”. Conserv. Sci. Pract. 2021, 3, 1–15. [Google Scholar] [CrossRef]
- Stevenson, M.D.; Rossmo, D.K.; Knell, R.J.; Le Comber, S.C. Geographic Profiling as a Novel Spatial Tool for Targeting the Control of Invasive Species. Ecography 2012, 35, 704–715. [Google Scholar] [CrossRef]
- Epanchin-Niell, R.S.; Haight, R.G.; Berec, L.; Kean, J.M.; Liebhold, A.M. Optimal Surveillance and Eradication of Invasive Species in Heterogeneous Landscapes. Ecol. Lett. 2012, 15, 803–812. [Google Scholar] [CrossRef]
- Neubert, M.G.; Parker, I.M. Projecting Rates of Spread for Invasive Species. Risk Anal. 2004, 24, 817–831. [Google Scholar] [CrossRef] [PubMed]
- Epanchin-Niell, R.S.; Wilen, J.E. Individual and Cooperative Management of Invasive Species in Human-mediated Landscapes. Am. J. Agric. Econ. 2015, 97, 180–198. [Google Scholar] [CrossRef]
- Inglis, N.C.; Vukomanovic, J. Visualizing When, Where, and How Fires Happen in U.S. Parks and Protected Areas. ISPRS Int. J. Geo Inf. 2020, 9, 333. [Google Scholar] [CrossRef]
- Narumalani, S.; Mishra, D.R.; Wilson, R.; Reece, P.; Kohler, A. Detecting and Mapping Four Invasive Species along the Floodplain of North Platte River, Nebraska. Weed Technol. 2009, 23, 99–107. [Google Scholar] [CrossRef]
- Holcombe, T.; Stohlgren, T.J.; Jarnevich, C. Invasive Species Management and Research Using GIS. In Proceedings of the Managing Vertebrate Invasive Species, Fort Collins, CO, USA, 7–9 August 2007. [Google Scholar]
- Skurka Darin, G.M.; Schoenig, S.; Barney, J.N.; Panetta, F.D.; DiTomaso, J.M. WHIPPET: A Novel Tool for Prioritizing Invasive Plant Populations for Regional Eradication. J. Environ. Manag. 2011, 92, 131–139. [Google Scholar] [CrossRef]
- Lookingbill, T.R.; Minor, E.S.; Bukach, N.; Ferrari, J.R.; Wainger, L.A. Incorporating Risk of Reinvasion to Prioritize Sites for Invasive Species Management. Nat. Areas J. 2014, 34, 268–281. [Google Scholar] [CrossRef]
- Agostini Ferrante, D.; Vukomanovic, J.; Smart, L.S. Uncovering Trends and Spatial Biases of Research in a U.S. National Park. Sustainability 2021, 13, 11961. [Google Scholar] [CrossRef]
- Morrison, L.W. Observer Error in Vegetation Surveys: A Review. J. Plant Ecol. 2015, 9, 367–379. [Google Scholar] [CrossRef]
- Engelstad, P.; Jarnevich, C.S.; Hogan, T.; Sofaer, H.R.; Pearse, I.S.; Sieracki, J.L.; Frakes, N.; Sullivan, J.; Young, N.E.; Prevéy, J.S.; et al. INHABIT: A Web-Based Decision Support Tool for Invasive Plant Species Habitat Visualization and Assessment across the Contiguous United States. PLoS ONE 2022, 17, e0263056. [Google Scholar] [CrossRef]
- Bonney, R.; Cooper, C.B.; Dickinson, J.; Kelling, S.; Phillips, T.; Rosenberg, K.V.; Shirk, J. Citizen Science: A Developing Tool for Expanding Science Knowledge and Scientific Literacy. Bioscience 2009, 59, 977–984. [Google Scholar] [CrossRef]
- Latham, R. Desired Condition of Grasslands and Meadows in Valley Forge National Historical Park; National Park Service: Washington, DC, USA, 2012. [Google Scholar]
- Reinke, K.; Jones, S. Integrating Vegetation Field Surveys with Remotely Sensed Data. Ecol. Manag. Restor. 2006, 7, S18–S23. [Google Scholar] [CrossRef]
- Reijers, H.; Mendling, J. Modularity in Process Models: Review and Effects. In Proceedings of the Business Process Management; Springer: Berlin/Heidelberg, Germany, 2008; pp. 20–35. [Google Scholar]
- Strode, G.; Mesev, V.; Thornton, B.; Jerez, M.; Tricarico, T.; McAlear, T. Geovisualization of Florida Land Use Using Bivariate Mapping, Statistical Legends, and Visual Analytics. Fla. Geogr. 2019, 51, 1–16. [Google Scholar]
- Schroeder, J.P. Bicomponent Trend Maps: A Multivariate Approach to Visualizing Geographic Time Series. Cartogr. Geogr. Inf. Sci. 2010, 37, 169–187. [Google Scholar] [CrossRef] [PubMed][Green Version]
- Crall, A.W.; Newman, G.J.; Jarnevich, C.S.; Stohlgren, T.J.; Waller, D.M.; Graham, J. Improving and Integrating Data on Invasive Species Collected by Citizen Scientists. Biol. Invasions 2010, 12, 3419–3428. [Google Scholar] [CrossRef]


Publisher’s Note: MDPI stays neutral with regard to jurisdictional claims in published maps and institutional affiliations. |
© 2022 by the authors. Licensee MDPI, Basel, Switzerland. This article is an open access article distributed under the terms and conditions of the Creative Commons Attribution (CC BY) license (https://creativecommons.org/licenses/by/4.0/).