Abstract
The spatial distribution and accessibility of urban public service facilities affect socioeconomic factors in the lives of residents, especially housing prices. Given that most previous studies focus on the accessibility of a certain, single type of facility and its impact on housing prices, this research uses improved two-step floating catchment area (2SFCA) methods by considering the differences in the service capacity of different types of public service facilities in real life to evaluate their accessibility to residential communities in Jinan city based on 3117 facilities covering 11 different kinds of facilitates. Then, we assess the spatial distribution of the impact of the accessibility of different public service facilities on housing prices in Jinan city through a local indicator of a spatial association (LISA) cluster diagram generated based on the bivariate local Moran’s index. Our objectives are to assess the accessibility of multiple public service facilities using an improved 2SFCA method and to explore the spatial correlations between the accessibility of public service facilities and housing prices. The results show that the housing prices in Jinan are clustered and that the areas with high housing prices are mainly concentrated in the Lixia District and the center of the downtown area. The accessibility of medical, shopping, educational and bus stop facilities in the Lixia District is better than that in other districts. The accessibility of shopping, medical and tourist attraction facilities has the most significant impact on housing prices, and the number of communities in which the accessibility of these public service facilities and housing prices form a positive correlation cluster accounts for 50.5%, 47.9% and 45.8% of all communities, respectively. On the other hand, educational accessibility and bus stop accessibility have nothing to do with housing prices, and the number of communities in which the accessibility of these public service facilities forms a not-significant cluster with housing prices accounting for 51.1% and 56.5% of the total, respectively. In this study, the combined 2SFCA method is used to improve the method for evaluating the accessibility of a variety of public service facilities, and its applicability is verified by practical application. By analyzing the spatial correlation between accessibility and housing prices, we expand our understanding of accessibility and show that it plays a central role in housing prices, which will help to improve the spatial pattern of urban public places in the future, provide support for decision makers and provide a reference for the government and real estate developers.
1. Introduction
The urbanization process is accompanied by a high population concentration and resource redistribution. Residents’ demand for high-quality public service facilities is vividly manifested in the process of housing choices and is indirectly reflected in housing prices [1]. Urban public service facilities are infrastructures that provide residents with public services, such as medical care, education and economic consumption to meet the needs of their daily lives. Due to the regional economic location and historical development, these facilities are unevenly distributed in space, and there is a mismatch with the population distribution [2]. The resulting mismatch between the supply and demand of public service facilities makes the housing prices in the dominant areas of a city remain high. Such housing prices have become a common phenomenon in the city of Los Angeles, Paris, Tokyo [3,4,5] and many other cities and even around the world. The spatial allocation pattern of public service resources dominates the formation and evolution of the space of urban housing prices by affecting the housing choice behavior of house buyers, making housing prices increasingly differentiated and further reshaping the urban landscape through the selection of housing buyers. Thus, the phenomenon of residential segmentation is becoming increasingly serious, thus aggravating the gap in access to public resources among social groups and becoming a source of social contradictions and posing great challenges to the spatial justice of the entire city.
The frequency of different public service facilities participating in residents’ daily lives is different, and their own characteristics also lead to a disparity in service capacity. Therefore, under the condition of fully studying and considering the improved forms of the existing 2SFCA method and combining the characteristics of different types of public service facilities, this study takes Jinan city as an example. The accessibilities of 6 categories of public service facilities, including 11 kinds of facilities, are evaluated by using the combined 2SFCA method composed of the Gaussian 2SFCA (G2SFCA) and hierarchical 2SFCA (H2SFCA) methods, in which the H2SFCA method is used to evaluate the accessibility of educational, medical and shopping facilities, and the G2SFCA method is used to evaluate the accessibility of grocery markets, tourist attractions and bus stops. Innovations are made in the method to ensure the accuracy of the evaluation and the breadth of the evaluation in terms of its scope. The spatial correlation between different levels of accessibility and housing prices is analyzed by the bivariate local Moran’s index method, and then the spatial distribution of this influence is analyzed by a local indicator of spatial association (LISA) cluster diagram. As an innovation of this study, based on the characteristics of different types of public service facilities, different 2SFCA methods are used to evaluate their accessibilities to form a combined 2SFCA evaluation method to reasonably evaluate the accessibility of different types of facilities. There are innovations in accessibility evaluation methods and correlation analysis methods with housing prices, and considering the high operability of the analysis methods, this study can be extended to other areas in which there is a need to analyze the driving force of housing prices and other research areas in which there is a need to explore whether there is a correlation between accessibility and important socio-economic factors. We provide a practical scheme with high maneuverability for optimizing urban planning and improving the travel convenience of urban residents.
2. Literature Review
Accessibility was firstly referred to by Stewart based on the population gravity model [6]; in the early stages of accessibility studies, it was a spatial concept that reflected the difficulty of communication between the starting and end points in space to overcome various obstacles [7]. Subsequently, accessibility assessment has been closely linked to equity and socioeconomic factors [8]. In the evaluation of accessibility, it is inseparable from the starting point, end point and the form of connection maintaining the starting and end points, which together constitute the three main elements that affect accessibility [9]. With the development of GIS applications, not only spatial attributes but also temporal attributes are considered in the accessibility evaluation process, mainly in terms of the travel time from the demand point to the supply point [10]. Therefore, accessibility has usually been considered a spatial–temporal indicator. During decades of research, many methods and models have been produced to evaluate spatial accessibility, among which potential models [11,12,13], the Huff model [14], the kernel density method [15] and the two-step floating catchment area (2SFCA) method [16] have been widely used. Among the many spatial accessibility evaluation methods, the 2SFCA method and the potential model are the most widely used, the factors considered are the most comprehensive and the theoretical basis of both models is similar. However, the 2SFCA method benefits from the idea of a floating catchment area, which is easy to understand and more operable. Thus, it receives more attention and development, and it provides a feasible basic framework for various possible expanded forms [17]. With the widespread use of the 2SFCA method, many scholars have proposed an improved method based on it, of which the most widely accepted is the introduction of the Gaussian distance attenuation function on the basis of the traditional 2SFCA method; this function makes the distance play a more reasonable role in the process of evaluating the accessibility [18,19]. Considering the influence of population aggregation on the demand radius, an expanded form of different search radius based on the regional population density, that is, the dynamic 2SFCA method [20], is proposed. The main idea of the nearest-neighbor 2SFCA method is that any demand point is selected only from the nearest number of facilities (number of alternative facilities) within the search radius, thus deepening our understanding of the facility service scope method [21]. In addition, taking into account the different sizes of supply facilities, based on the different sizes of a facility to set a multi-level search radius, this expanded form can be called the hierarchical 2SFCA (H2SFCA) method [22]. From the existing research, we can observe that the current research on the accessibility of public service facilities mainly focuses on the use of a single method to evaluate the accessibility of a single kind of public service facility, and there is a lack of breadth in the scope of the evaluation. In the selection of evaluation units, the main evaluation units that have been applied at present are the traffic district and Voronoi diagram. The accessibility evaluation unit selected in this study is the Voronoi diagram generated based on the spatial location of the residential community. The Voronoi diagram can describe the service area of the urban road network more accurately than the traditional Euclidean network method [23], which means that the space divided by the Voronoi diagram can accurately describe the spatial pattern of human activities [24,25]. Therefore, in this study, the use of the Voronoi diagram to divide the evaluation unit can more conveniently and accurately reflect the spatial distribution pattern of the demand point (residential community) and the degree to which it is affected by the supply point (public service facilities).
The level of difficulty for urban residents to obtain public facilities services is called the accessibility of public facilities [26]. In the previous literature, there are many studies on the accessibility of single types of public service facilities, including educational [27,28,29], medical [10,30,31], commercial and transportation [32,33]. However, there are few studies on the comprehensive accessibility of multiple kinds of public service facilities. The accessibility of public service facilities is not only related to the quality of life of urban residents, but also has an impact on the surrounding social and economic conditions, especially housing prices, due to the externalities of public service facilities. Evaluating the accessibility of public service facilities and its impact on housing prices has become the focus of academic research. Common ways of combining accessibility with housing prices include the hedonic price model [34,35], the constrained optimization method [36] and the ordinary least squares method [37]. However, the current research on the driving factors of housing prices from the perspective of accessibility lacks a unified paradigm, and most existing studies analyze whether the accessibility of a single kind of facility has an impact on housing prices, lack a comparative relationship and cannot objectively reflect the intensity of this effect. The innovation of this paper is to combine two improved 2SFCA methods to evaluate the accessibility of multiple public service facilities and to explore the correlation between the accessibilities and the spatial distribution of socioeconomic factors (housing prices). The technical approach of this study can provide a clear reference for other scholars who are intended to analyze the spatial correlation between socioeconomic factors and spatial accessibility, thus improving the understanding of the spatial distribution of public service facilities.
3. Data and Methodology
3.1. Study Area
Jinan city, located in the middle of the North China Plain, is the capital city of Shandong Province. Jinan is adjacent to Mount Tai in the south and crosses the Yellow River in the north. It is located in the junction zone between the low mountains and hills in central and southern Shandong and the alluvial plain in northwest Shandong. The terrain is high in the south and low in the north, followed by low mountains and hills, piedmont inclined plains and Yellow River alluvial plains. Jinan is famous for being a spring city, with a warm temperate continental monsoon climate, a mean annual temperature of 14 °C and precipitation of 650–700 mm. Our research focuses on the central area of Jinan (Figure 1), which covers an area of 536 km2 and has an approximate population of 3.77 million. Downtown Jinan includes the Lixia District, most of the Shizhong District and parts of Huaiyin, Tianqiao and Licheng Districts.
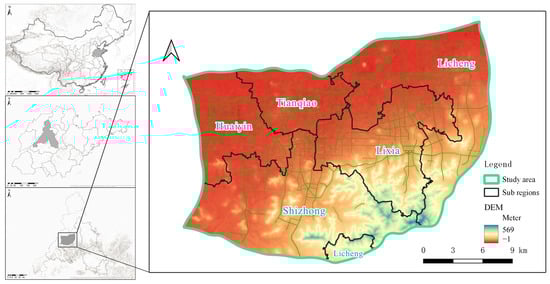
Figure 1.
Map of the study area.
3.2. Data and Pre-Processing
The data used in this study include road data, service provider (public service facilities) data and service demander (residential area) data. Among them, road network data are obtained from OpenStreetMap (www.openstreetmap.org, accessed on 18 October 2021), the road dataset contains not only the spatial location of the roads but also the classification of the road (vehicle road, railroad, pavement, etc.).
The service provider data include the spatial location and the types of public service facilities. We selected 11 kinds of public service places to evaluate the accessibility of educational and medical facilities, grocery markets, tourist attractions, bus stops and shopping places in Jinan. The public service facilities that urban residents visit in their daily lives are not limited to these. Other public service facilities (e.g., petrol stations, office buildings) also play an important role in the lives of residents. We chose these public service facilities because they are closely related to the daily lives of Chinese people, and their spatial distribution is often thought to influence the price of housing in their surroundings [38]. Although Jinan currently has an underground system, it has only been in use for a short time and many of the stations are located in suburban areas outside the study area. Jinan citizens choose buses as their main mode of public transport; therefore, only bus stops were considered when evaluating public transport accessibility. The public service places and their spatial locations are from Amap (www.amap.com, accessed on 25 November 2021). We used the Python language to obtain data from the Amap application programming interface (API), and a total of 3117 public service facilities were acquired and analyzed in this paper.
The demand-side data mainly include the number of households, housing prices (yuan/m2) and location information of the residential communities. The number of households and the housing price information were acquired from an online real estate trading platform (www.lianjia.com, accessed on 25 November 2021), and the location information was from Amap (www.amap.com, accessed on 25 November 2021). The demand-side data were also obtained based on the Python language and were spatially corrected. The communities with only a few households and the cells that were close to each other were merged. A total of 832 residential areas in the study area were obtained, with an average price of 17,475 CNY/m2. The highest housing price was 41,840 yuan/m2, the lowest housing price was 4742 CNY/m2 and the average number of households in each community was 1678. The population data in this article were obtained by multiplying the number of households by the average household population (2.62 persons/household, The Seventh National Census).
3.3. Method
3.3.1. Overall Workflow
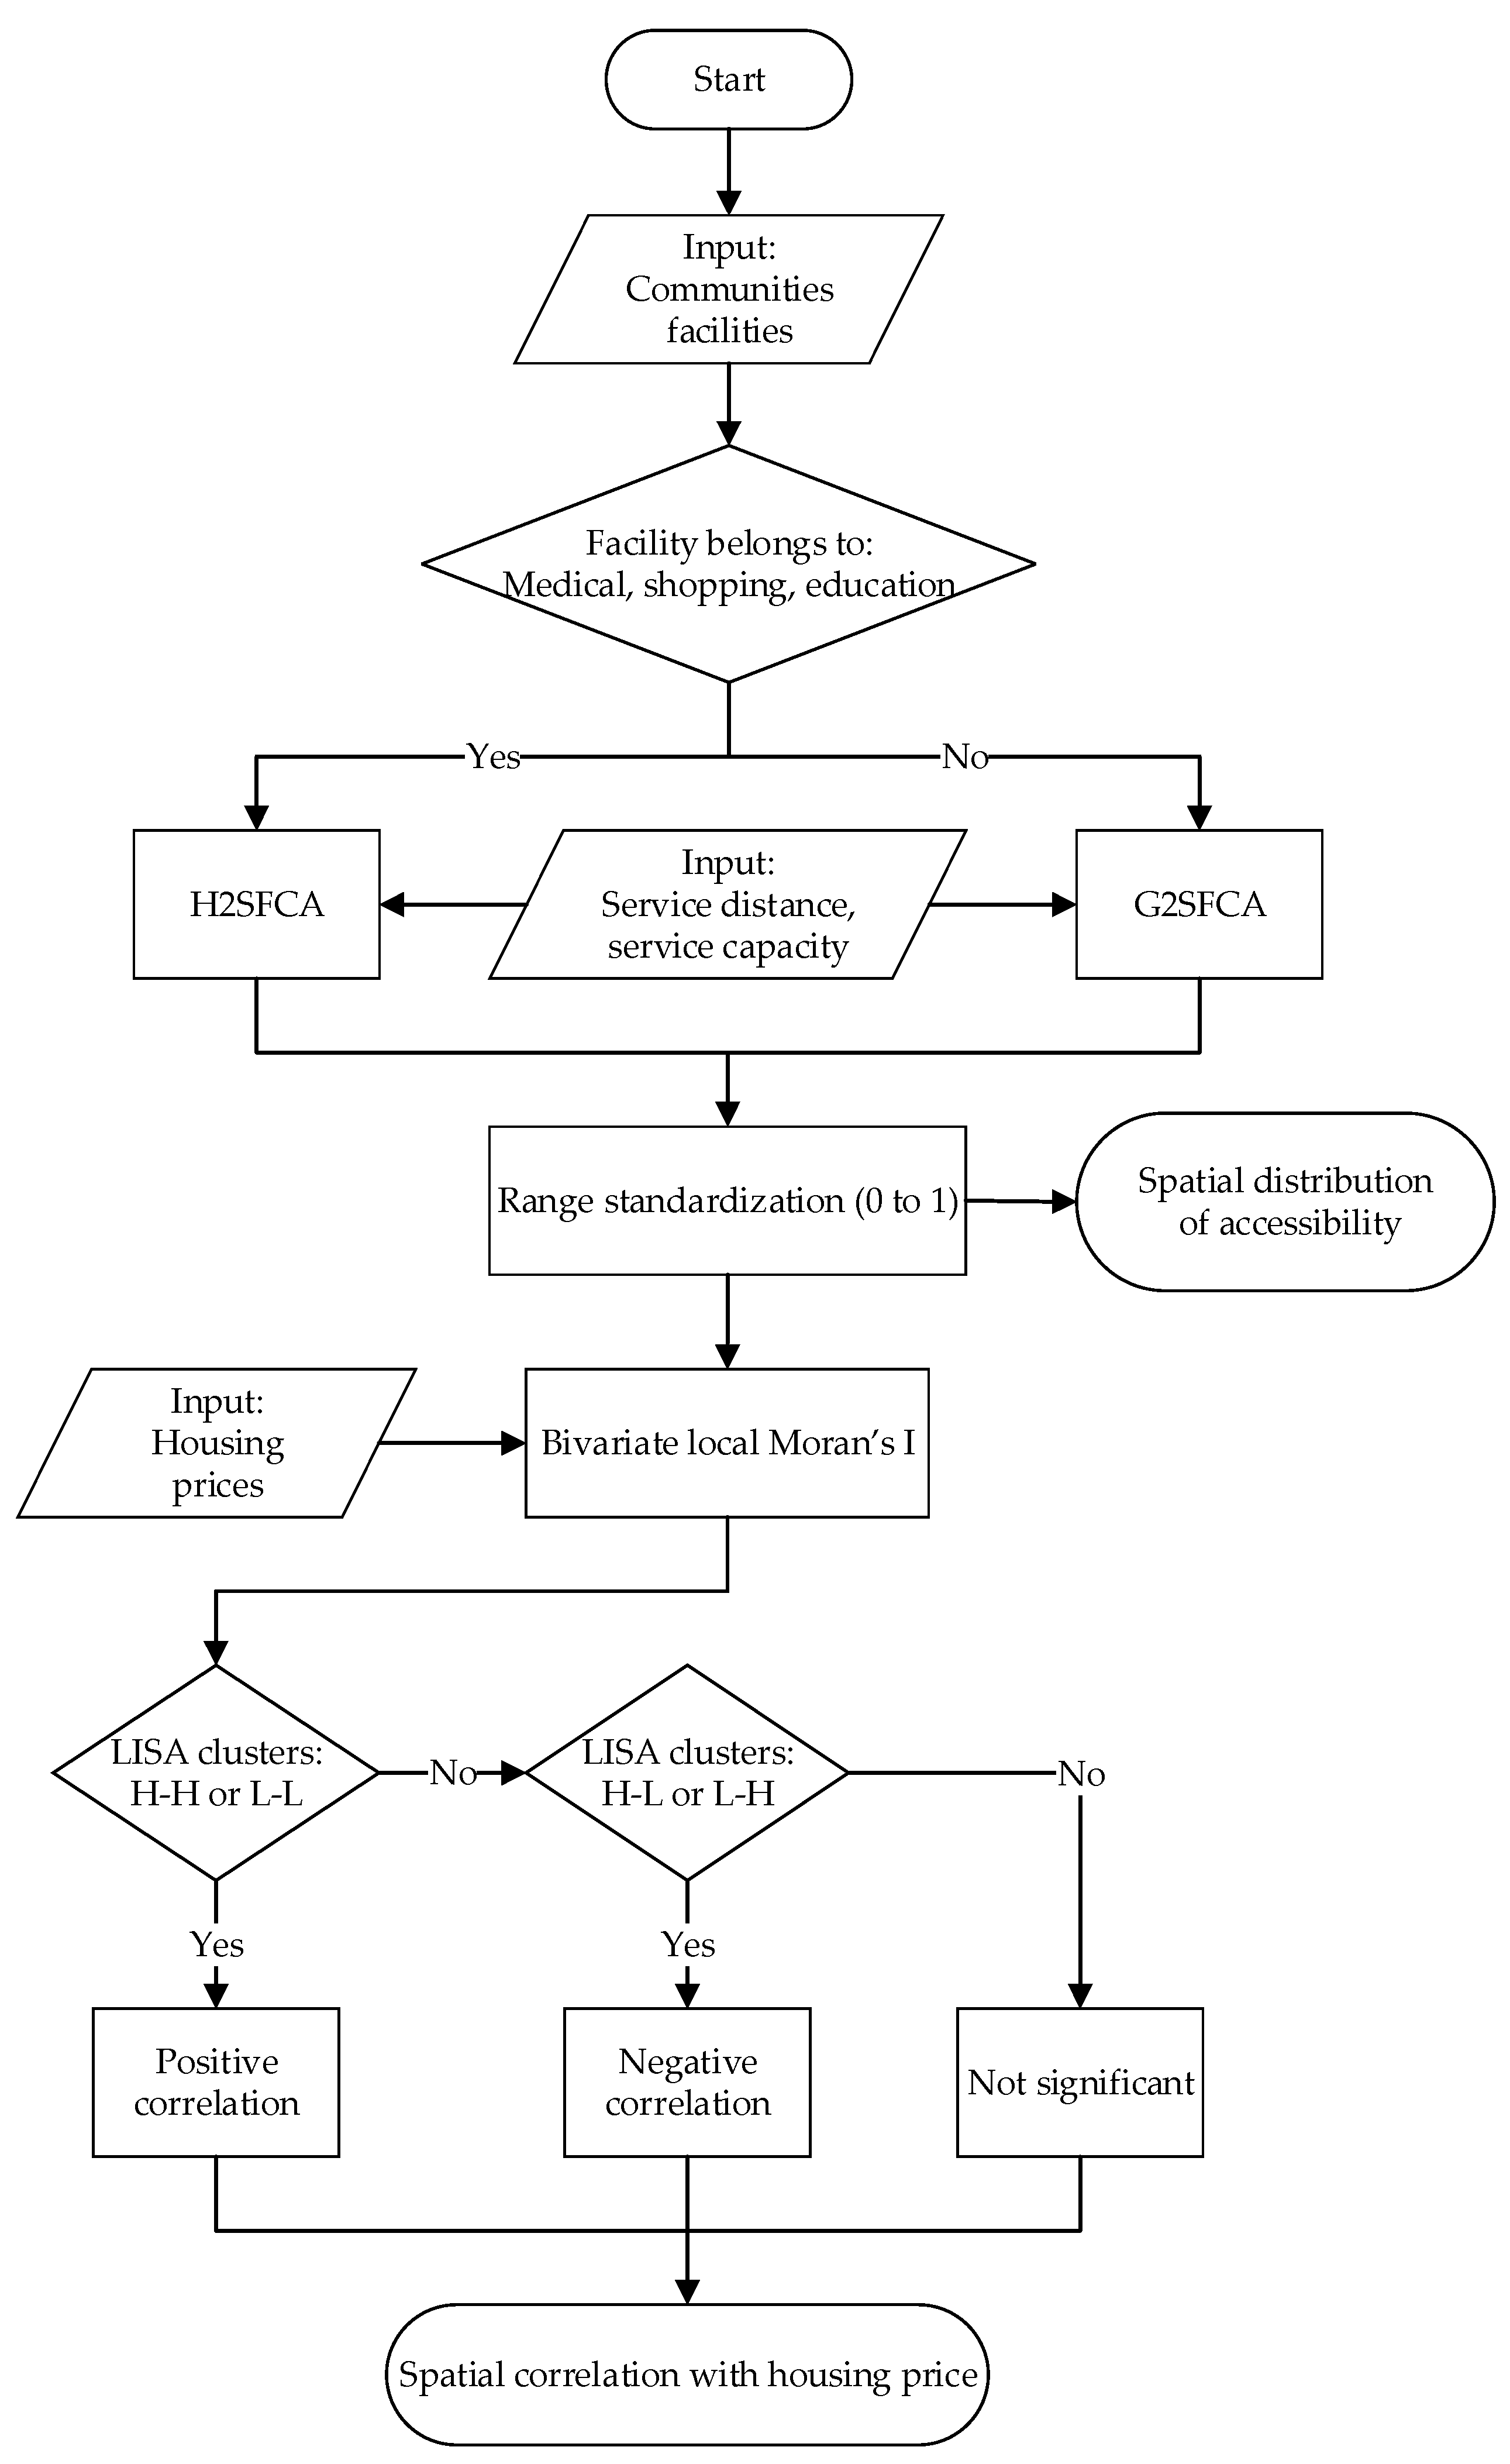
We used the global Moran’s index to determine whether housing prices in Jinan were spatially clustered and then used kernel density analysis to obtain the spatial distribution pattern of housing prices. We used two different 2SFCA methods (H2SFCA and G2SFCA) to analyze the accessibilities of public service facilities, in which the accessibility of medical, shopping and educational facilities was evaluated by the H2SFCA method and the accessibility of bus stops, grocery markets and tourist attractions was evaluated by the G2SFCA method. Accessibility was divided into 5 grades by the natural breakpoint method [39]; the evaluation unit of accessibility used the Voronoi diagram generated from residential communities. The spatial distribution pattern of the accessibility of different types of public service facilities was analyzed at the administrative district level; thus, the conclusion of the accessibility spatial pattern in the urban area of Jinan was obtained. To reduce the impact of large differences in values between the accessibility of different kinds of facilities on the results of the bivariate local Moran’s index, the accessibility results were standardized to (0, 1), the bivariate local Moran’s index was used to analyze the correlation between accessibility and housing prices and the spatial distribution pattern of the correlation relationship was evaluated by the LISA cluster diagram. If there was a large proportion of high–high and low–low clusters in the LISA clusters, then it could be assumed that there was a positive spatial correlation between accessibility and housing prices; conversely, if there was a predominance of low–high and high–low clusters, then it could be assumed that there was a negative spatial correlation between accessibility and housing prices.
The research methodology in this study relied on ArcGIS software operations using ArcGIS’s model builder to reduce repetitive operations and obtain results quickly. We used the Python programming language to obtain POI data and thus improve time efficiency. The use of model builders and the Python language in the research methodology ensured that this study was time efficient in both the data acquisition and data processing phases. The pseudocode flow chart for this study is shown in Figure 2.

Figure 2.
Pseudocode flowchart.
3.3.2. Improved 2SFCA
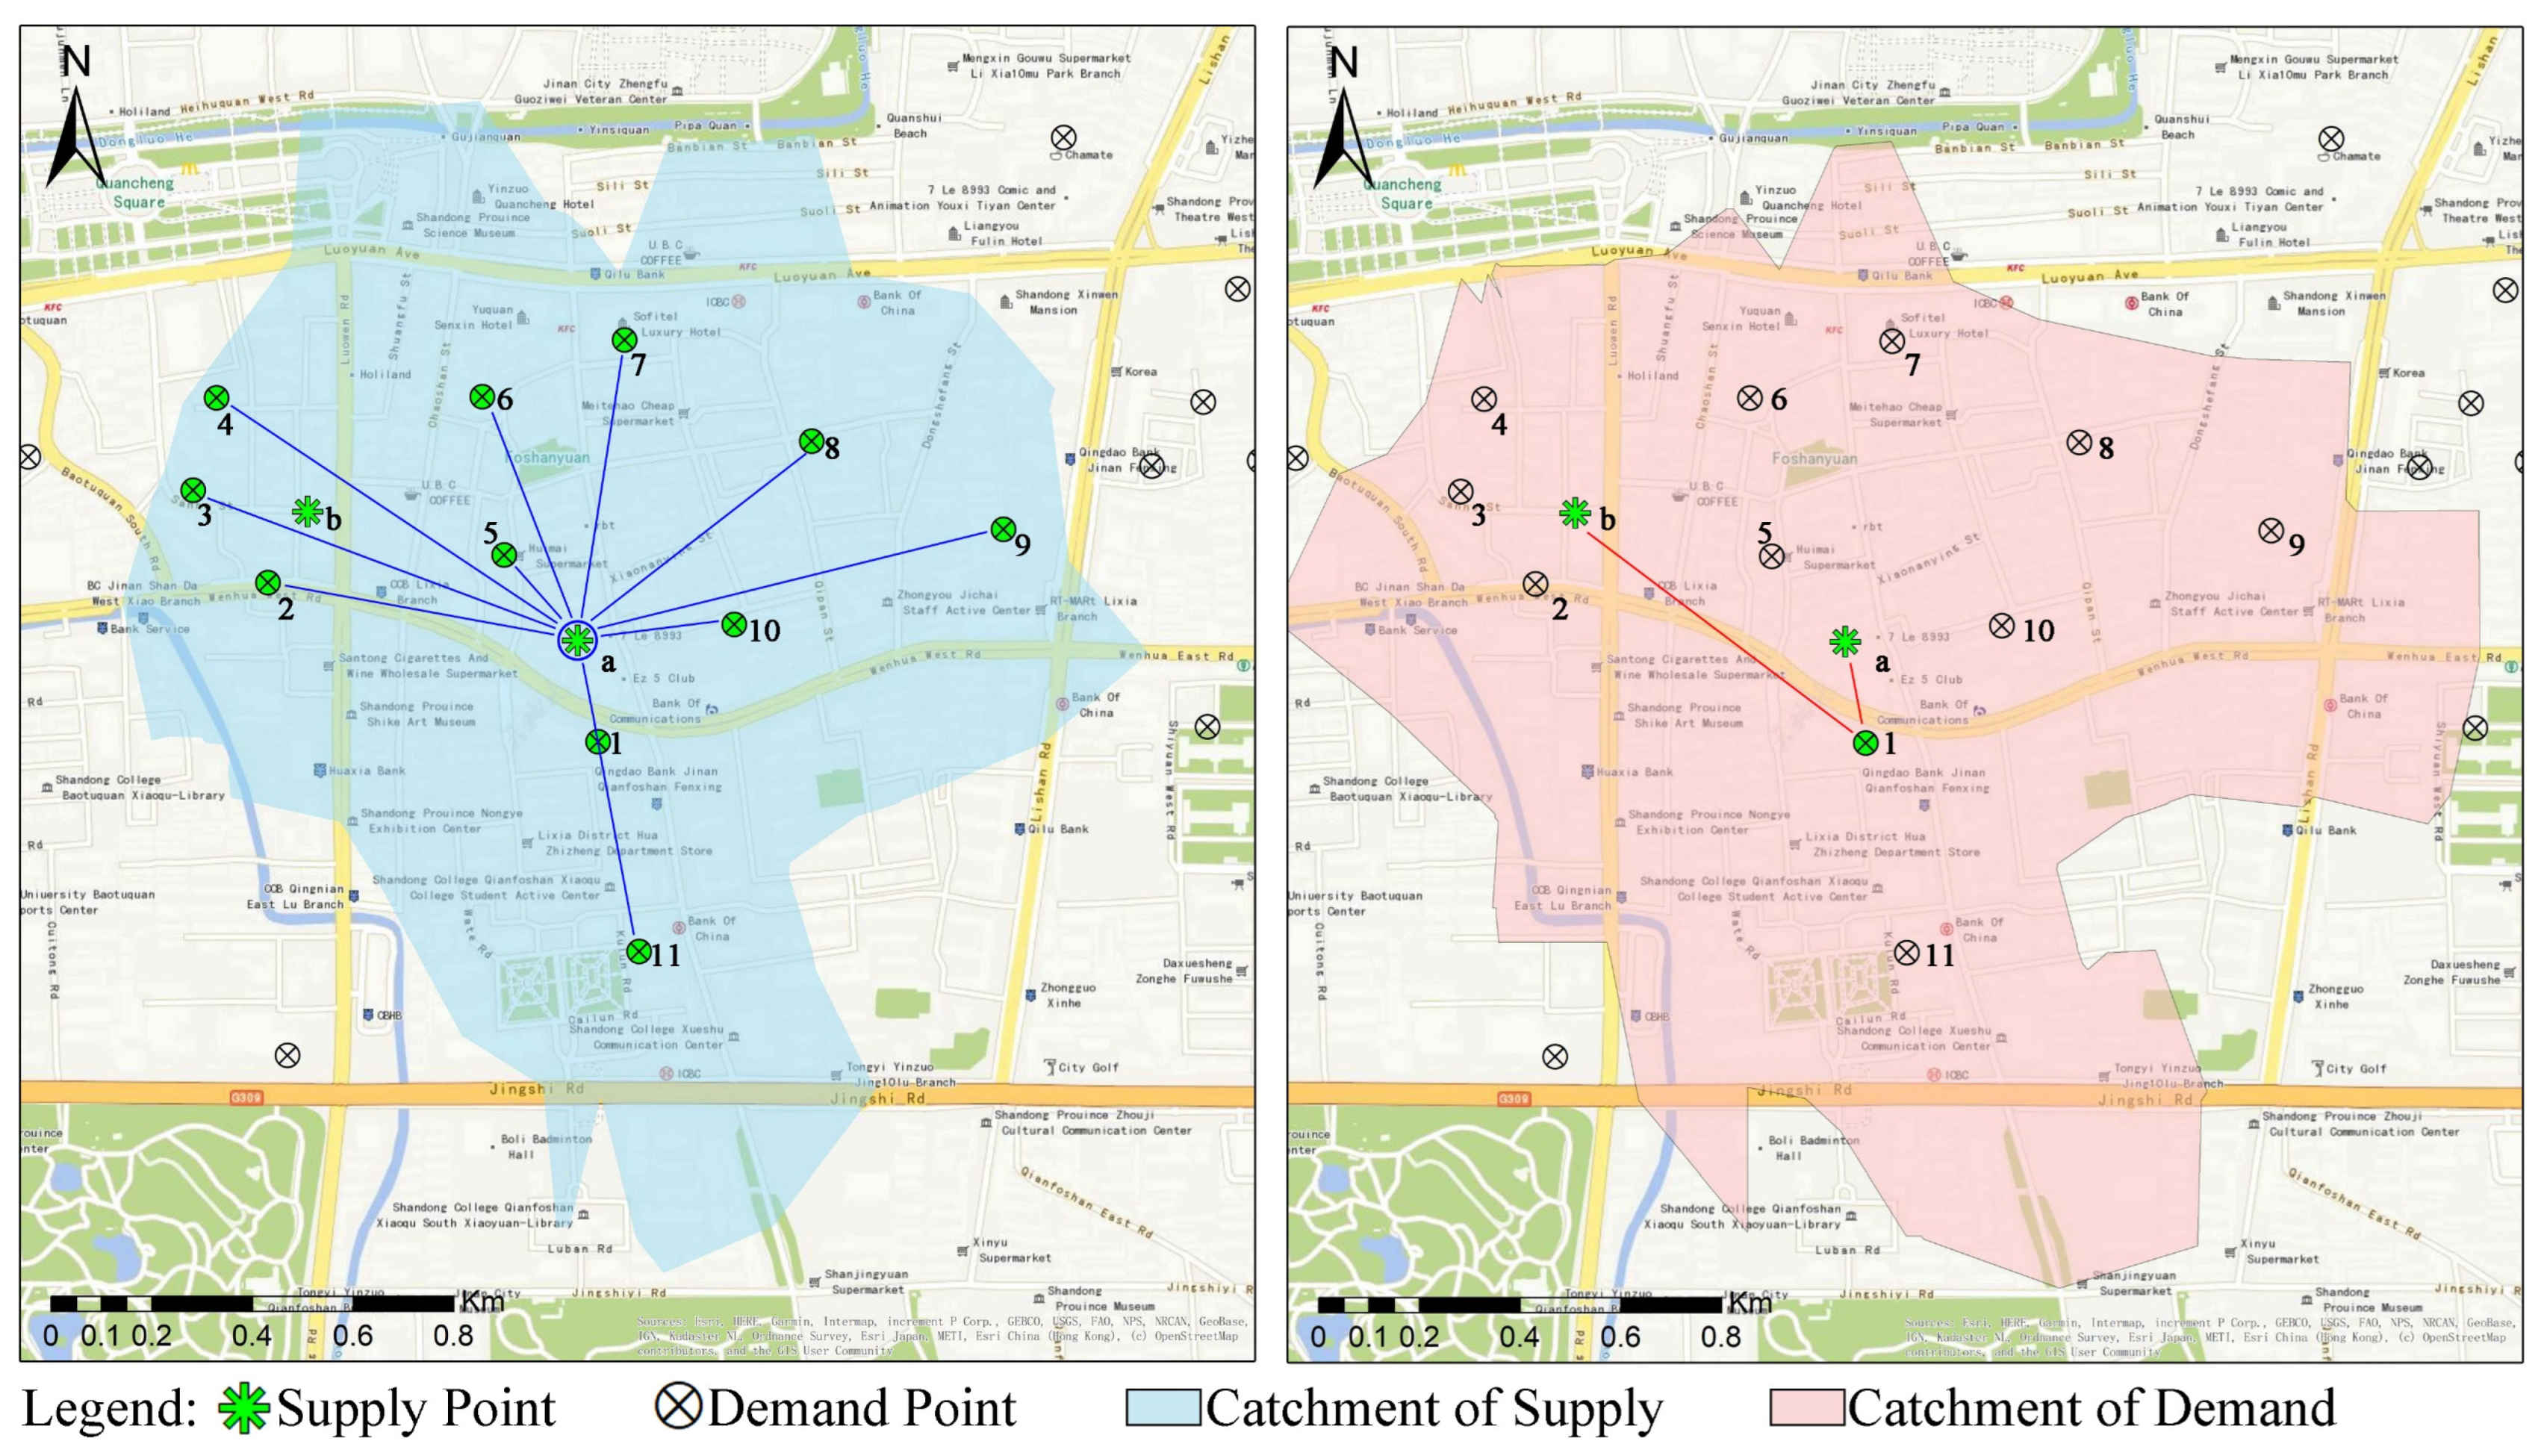
The basic 2SFCA method expresses accessibility through the ratio of demand to supply and demand. First, we defined an area of threshold distance () for each supply point and calculated the ratio of the supply capacity of supply point to the demand population in the region [40]. The supply capacity is usually expressed by the area of facilities, the population that can be accommodated at the service point and the number of service personnel. The supply capacity of various facilities in this paper refers to the service capacity in Table 1. The specific implementation process of the 2SFCA method was divided into 2 steps, and the 2SFCA implementation process is visualized in Figure 3.

Table 1.
Service capacity and service distance in public places.
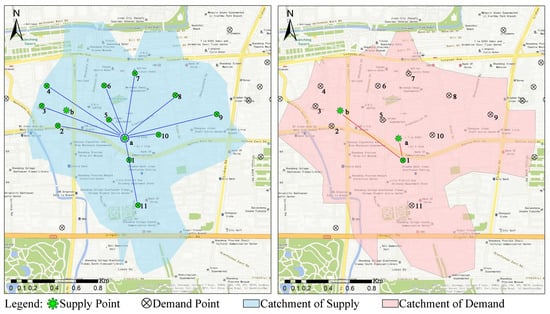
Figure 3.
2SFCA schematic diagram. Supply points are represented by English letters and demand points are represented by Arabic numerals.
The first step is shown on the left side of Figure 3. For each supply point (taking supply point as an example), given spatial distance threshold , a spatial scope with as the center and as the radius is generated based on the road network data (blue area). is an important element in the 2SFCA method, indicating the furthest distance that a supply point can provide services. If the distance from demand point to supply point is greater than , then it is considered in 2SFCA that does not have the ability to serve . The determination of is usually related to the expected travel time. The demand points numbered 1 to 11 fall within the spatial scope, summarize the population of each demand point falling within the spatial scope and are used to obtain the number of all potential users of supply point . Then, supply and demand ratio is obtained by dividing the service capacity of the supply point by the number of all potential users. reflects the difference in the maximum service capacity of different individual facilities within the same kind of facility. There is no specific measurement unit and all indicators that reflect the capacity of the facility can be used (area, number of staff, number of customers, etc.), and can be artificially defined as a fixed value when there is little individual variation in facilities.
The calculation method is as follows:
The second step is shown on the right side of Figure 3. For each demand point (in the figure, demand point is used as an example), with as the center and as the radius, we formed another spatial scope (red area). The supply points a and b fall within the scope, and supply ratio of each supply point falling within the spatial scope is also summed to obtain the accessibility of each demand point to supply facilities . The calculation method is as follows:
Considering that the service capacity of public service facilities is not linearly attenuated by distance, part of the expanded form expands the distance attenuation function, which essentially adds an additional distance attenuation function to the search radius of the 2SFCA method. The Gaussian function is widely used as the distance attenuation function within the 2SFCA search radius (G2SFCA), and is applied to the first step and the second step. The formulas for calculating accessibility after integration are as follows:
In the formulas above, is the distance from demand point to supply point , is the Gaussian distance attenuation function, refers to the threshold distance, which is the maximum range of distances that can be served by a public service facility, is the accessibility calculated by the G2SFCA method and the other meanings are the same as those in Formulas (1) and (2).
At the same time, in real life, when residents choose certain public service facilities, they usually prioritize large-scale service facilities (such as hospitals). This disparity in scale leads to great differences in the service capacity of service facilities, and the attraction of different levels of facilities to residents is quite different, forming the so-called “hierarchizing” phenomenon. Therefore, an H2SFCA method [41] is proposed on the basis of the G2SFCA method. The calculation method is as follows:
where is the level to which it belongs, is the distance threshold of and is the accessibility calculated by the H2SFCA method.
In this study, the H2SFCA method was used to measure the accessibility of shopping, medical care and education. Shopping places were divided into three categories: shopping malls, shopping centers and convenience stores. Medical facilities were divided into general, secondary and tertiary hospitals. Educational facilities were divided into primary and middle schools. Considering that the hierarchy of bus stops, grocery markets and tourist attractions is of little significance in real life, most residents follow the “principle of proximity” when choosing; therefore, the G2SFCA method was used to evaluate these accessibilities.
In this paper, when analyzing accessibility, the classification of public service facilities referred to the classification method used for Amap points of interest (POIs). General hospitals refer to third-tier and first-class hospitals, the highest-level hospitals in China’s hospital hierarchy, which are usually large general hospitals. Secondary hospitals refer to smaller general hospitals and specialist hospitals, and tertiary hospitals refer to community health service centers. A shopping mall refers to a large-scale commercial complex that can accommodate a large number of people, and its services often cover catering, clothing, home furnishings, etc. Shopping centers refer to relatively small commercial facilities with relatively simple services, such as large supermarkets and franchised clothing stores, and convenience stores refer to shops that are small in scale but have a wide variety of goods and sell materials or food related to people’s livelihood. Table 1 lists the service capacity and service distance of various public service facilities.
The service capacity of medical facilities is determined by the number of doctors at different levels, the service capacity of educational facilities is determined by the number of teachers at different levels, the service capacity of bus stops is determined by the number of bus lines that can be reached by the station, with each additional route increasing the service capacity by 1000, the service capacity of tourist attractions is determined by the level of class of a tourist attraction published by the Ministry of Culture and Tourism of China, each higher level of the tourist attraction increases its service capacity by 10,000. Although the service capacity of bus stops and tourist attractions varies according to the attributes of the individual facilities, the service distances between individuals do not differ significantly, considering the way they provide services in the daily lives of residents, so their service distances are the same and they are not considered hierarchical public service facilities. The scale of grocery markets is difficult to quantify; although there are large grocery trading centers in Jinan, they are located in suburban areas outside the study area. The scale of grocery markets in the study area did not vary much and was basically set up to meet the demand for grocery from the residents of one or several nearby communities. Therefore, in this study, their service capacity and service distance were fixed and they are not considered hierarchical facilities. Since it was difficult to determine a specific quantitative standard for the service capacity of shopping places, the three levels from high to low were set to 100%, 60% and 10%. Due to the final standardization of the accessibility of each category, the selection of the service capacity of various public service facilities will not affect the vertical comparison. Similarly, the service capacity of a grocery market was defined as 10,000. Taking into account the spatiotemporal characteristic of accessibility, service distances were determined based on the time it took residents to travel to different public service facilities, which were derived from expert scoring methods combined with real-life experience. Most vehicle roads in Jinan city have a speed limit of 40–60 km/h. Taking into account traffic congestion, we set the average vehicle speed at 30 km/h, which is similar to the vehicle speed of 25.6 km/h at peak time as published by Amap in November 2021, and the average walking speed of 4.8 km/h. The service distance was obtained by multiplying the travel speed by the travel time. When analyzing the accessibility of bus stops, only pavements were considered.
3.3.3. Bivariate Local Moran’s Index
The bivariate local Moran’s index is a statistic that is widely used to evaluate the spatial relationship between two variables in GeoDa software [42]. Its calculation formula is as follows:
where is the normalized value of region variable (supply point), is the normalized value of region variable (demand point) and is the spatial weight matrix between region and region . The spatial relationship between and can be divided into five types, which are represented by LISA cluster diagrams: high–high clustering, high–low clustering, low–high clustering, low–low clustering and not significant. High–high clustering indicates that nearby areas have both high accessibility and high housing prices; high–low clustering indicates that nearby areas have high housing prices and low accessibility; low–high clustering indicates that nearby areas have low housing prices and high accessibility; low–low clustering indicates that nearby areas have both low accessibility and low housing prices and not significant indicates that the relationship between housing prices and accessibility is not obvious. Both high–high clustering and low–low clustering indicate that there is a spatial correlation in the region, and they are collectively referred to as positive correlation clusters. In contrast, low–high clustering and high–low clustering mean that there is spatial irrelevance in the region, and they are collectively referred to as negative correlation clusters. Not significant clustering indicates that whether there is a spatial correlation in the region is not obvious [43,44].
4. Results
4.1. Spatial Distribution Pattern of Public Service Facilities and Housing Prices
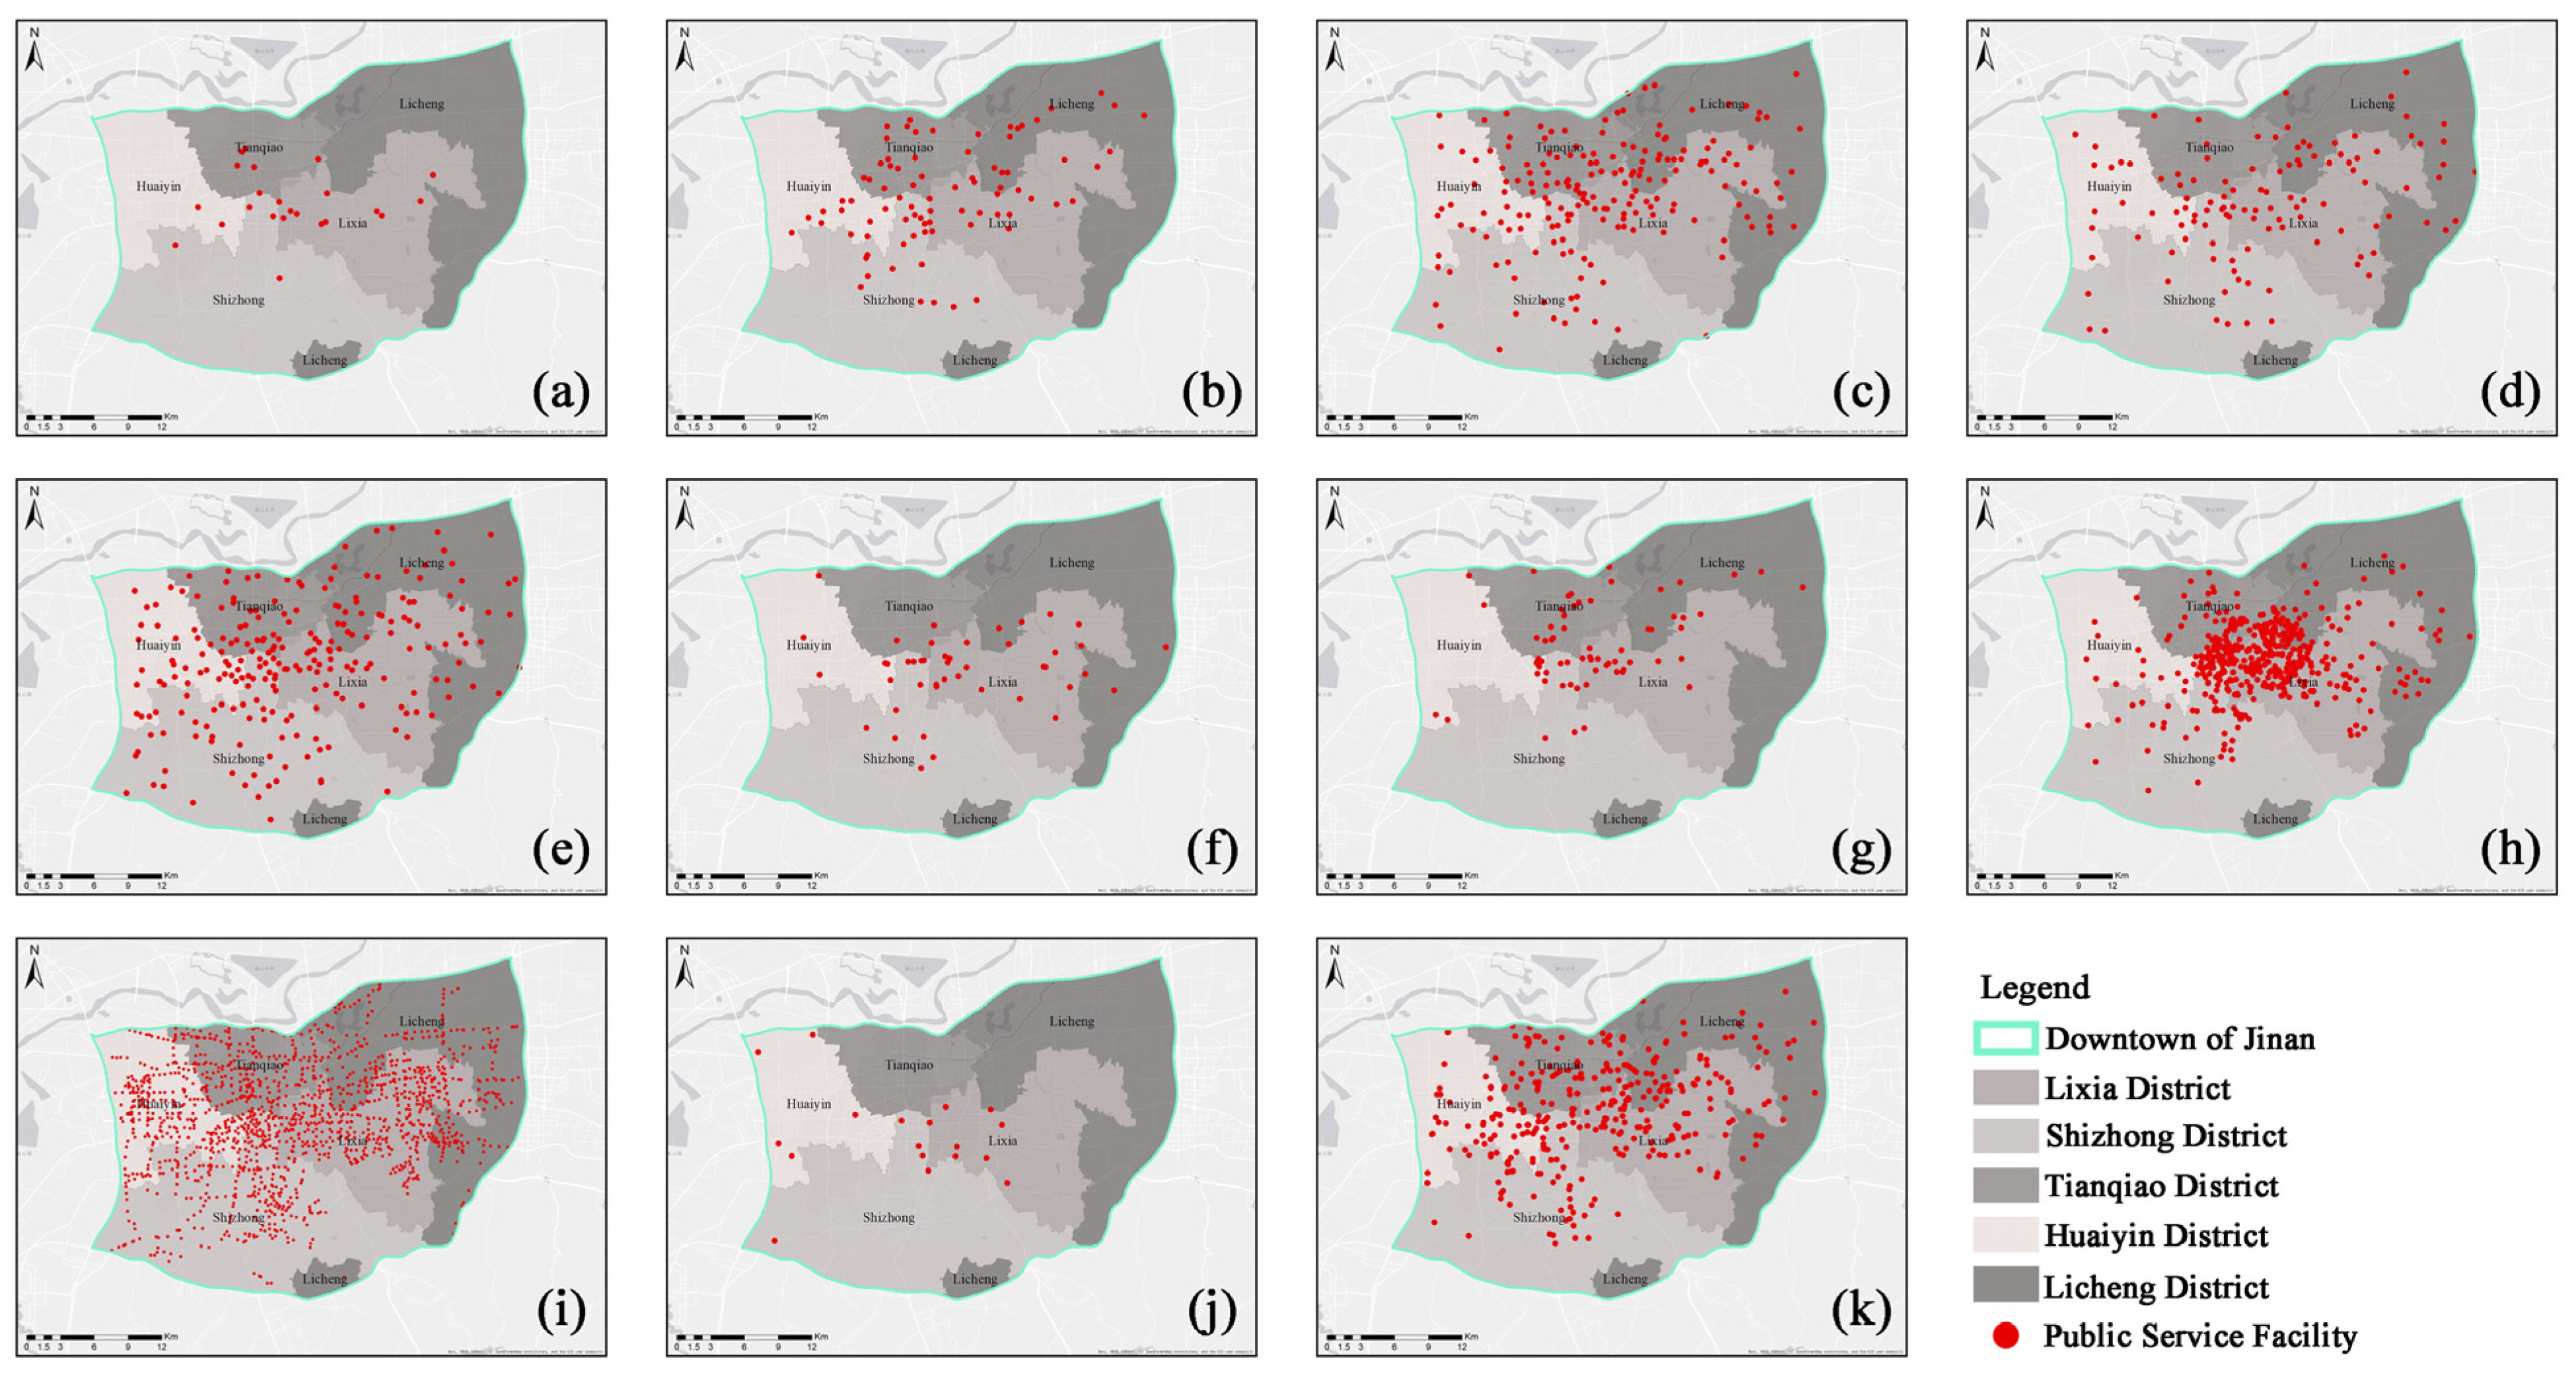
Figure 4 is the spatial distribution map of the 11 kinds of public service facilities selected in this paper. As shown in the figure, the spatial distribution of public service facilities varies by the type of facility. Shopping centers and convenience stores are mainly concentrated in the central area of Jinan. The aggregation of shopping malls and general hospitals in Lixia District is obvious. Secondary and tertiary hospitals are mainly concentrated in Lixia District. Tourist attractions are mainly distributed in Lixia and Huaiyin Districts. Grocery markets are mainly concentrated in Lixia District and Licheng Districts, and the spatial distribution of primary and secondary schools and bus stations is more uniform.
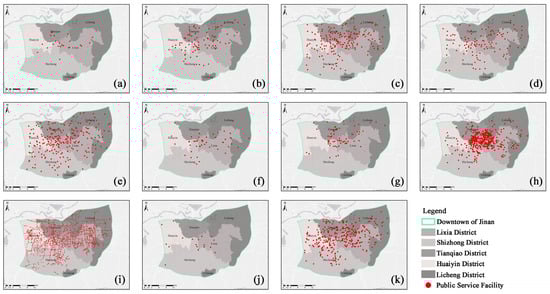
Figure 4.
Spatial distribution of public service facilities. (a): general hospital; (b): secondary hospital; (c): tertiary hospital; (d): middle school; (e): primary school; (f): shopping mall; (g): shopping center; (h): convenience store; (i): bus stop; (j): tourist attraction; (k): grocery market.
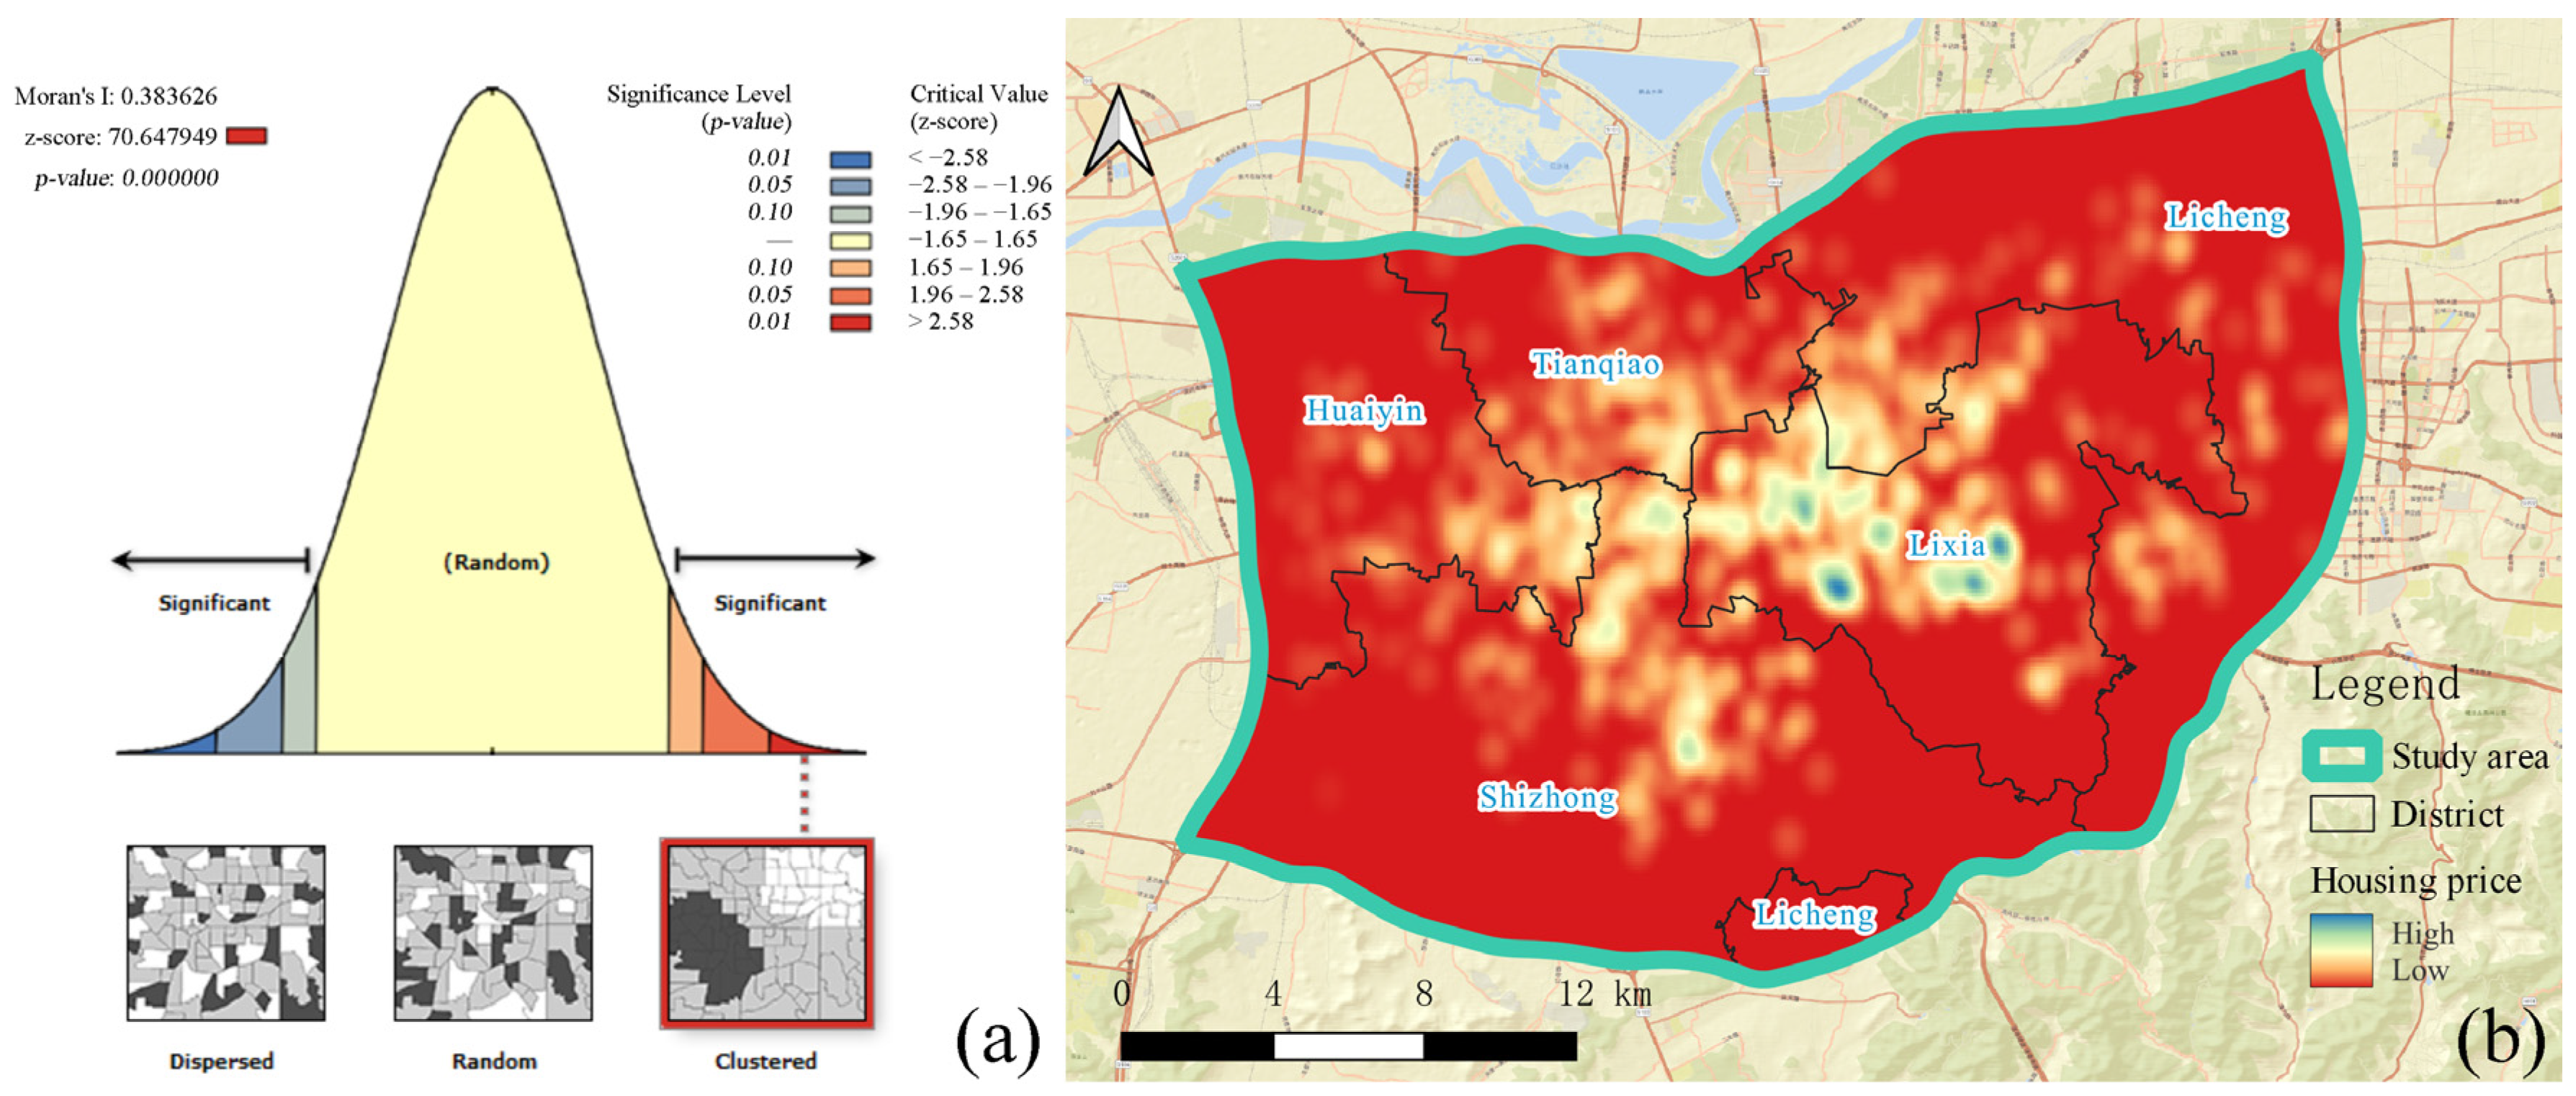
The global Moran’s index is an important index used in the analysis of spatial data, where it is used to reflect whether data are randomly distributed or clustered in space and to judge the spatial correlation of the data. Figure 5a shows the results of the global Moran’s index analysis, while Figure 5b shows the kernel density analysis of housing prices in the study area. As shown in Figure 5a, the Moran’s index of housing prices in Jinan is 0.38, indicating that there is a spatial correlation in the distribution of housing prices in Jinan, with a z score of 70.65 and a p-value of less than 0.01, passing the test of significance at the 99% confidence level. The original assumption that housing prices in Jinan are randomly distributed is rejected. The z score is much higher than the critical value of 1.65 (the threshold set by rejecting the null hypothesis), indicating that housing prices in Jinan are clustered.
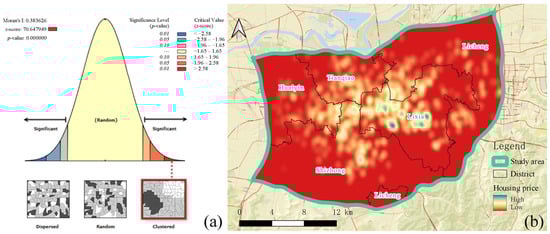
Figure 5.
Analysis of the spatial pattern distribution of housing prices. (a): Moran’s I result; (b): kernel density of housing price.
The kernel density analysis of Figure 5b shows that the spatial distribution of housing prices in Jinan is higher in the central and eastern parts of the city. High housing prices are mainly concentrated in the north of the central district and the whole Lixia District, while the housing prices in Huaiyin and Licheng Districts are relatively low.
4.2. Evaluation of the Accessibilities of Public Service Facilities
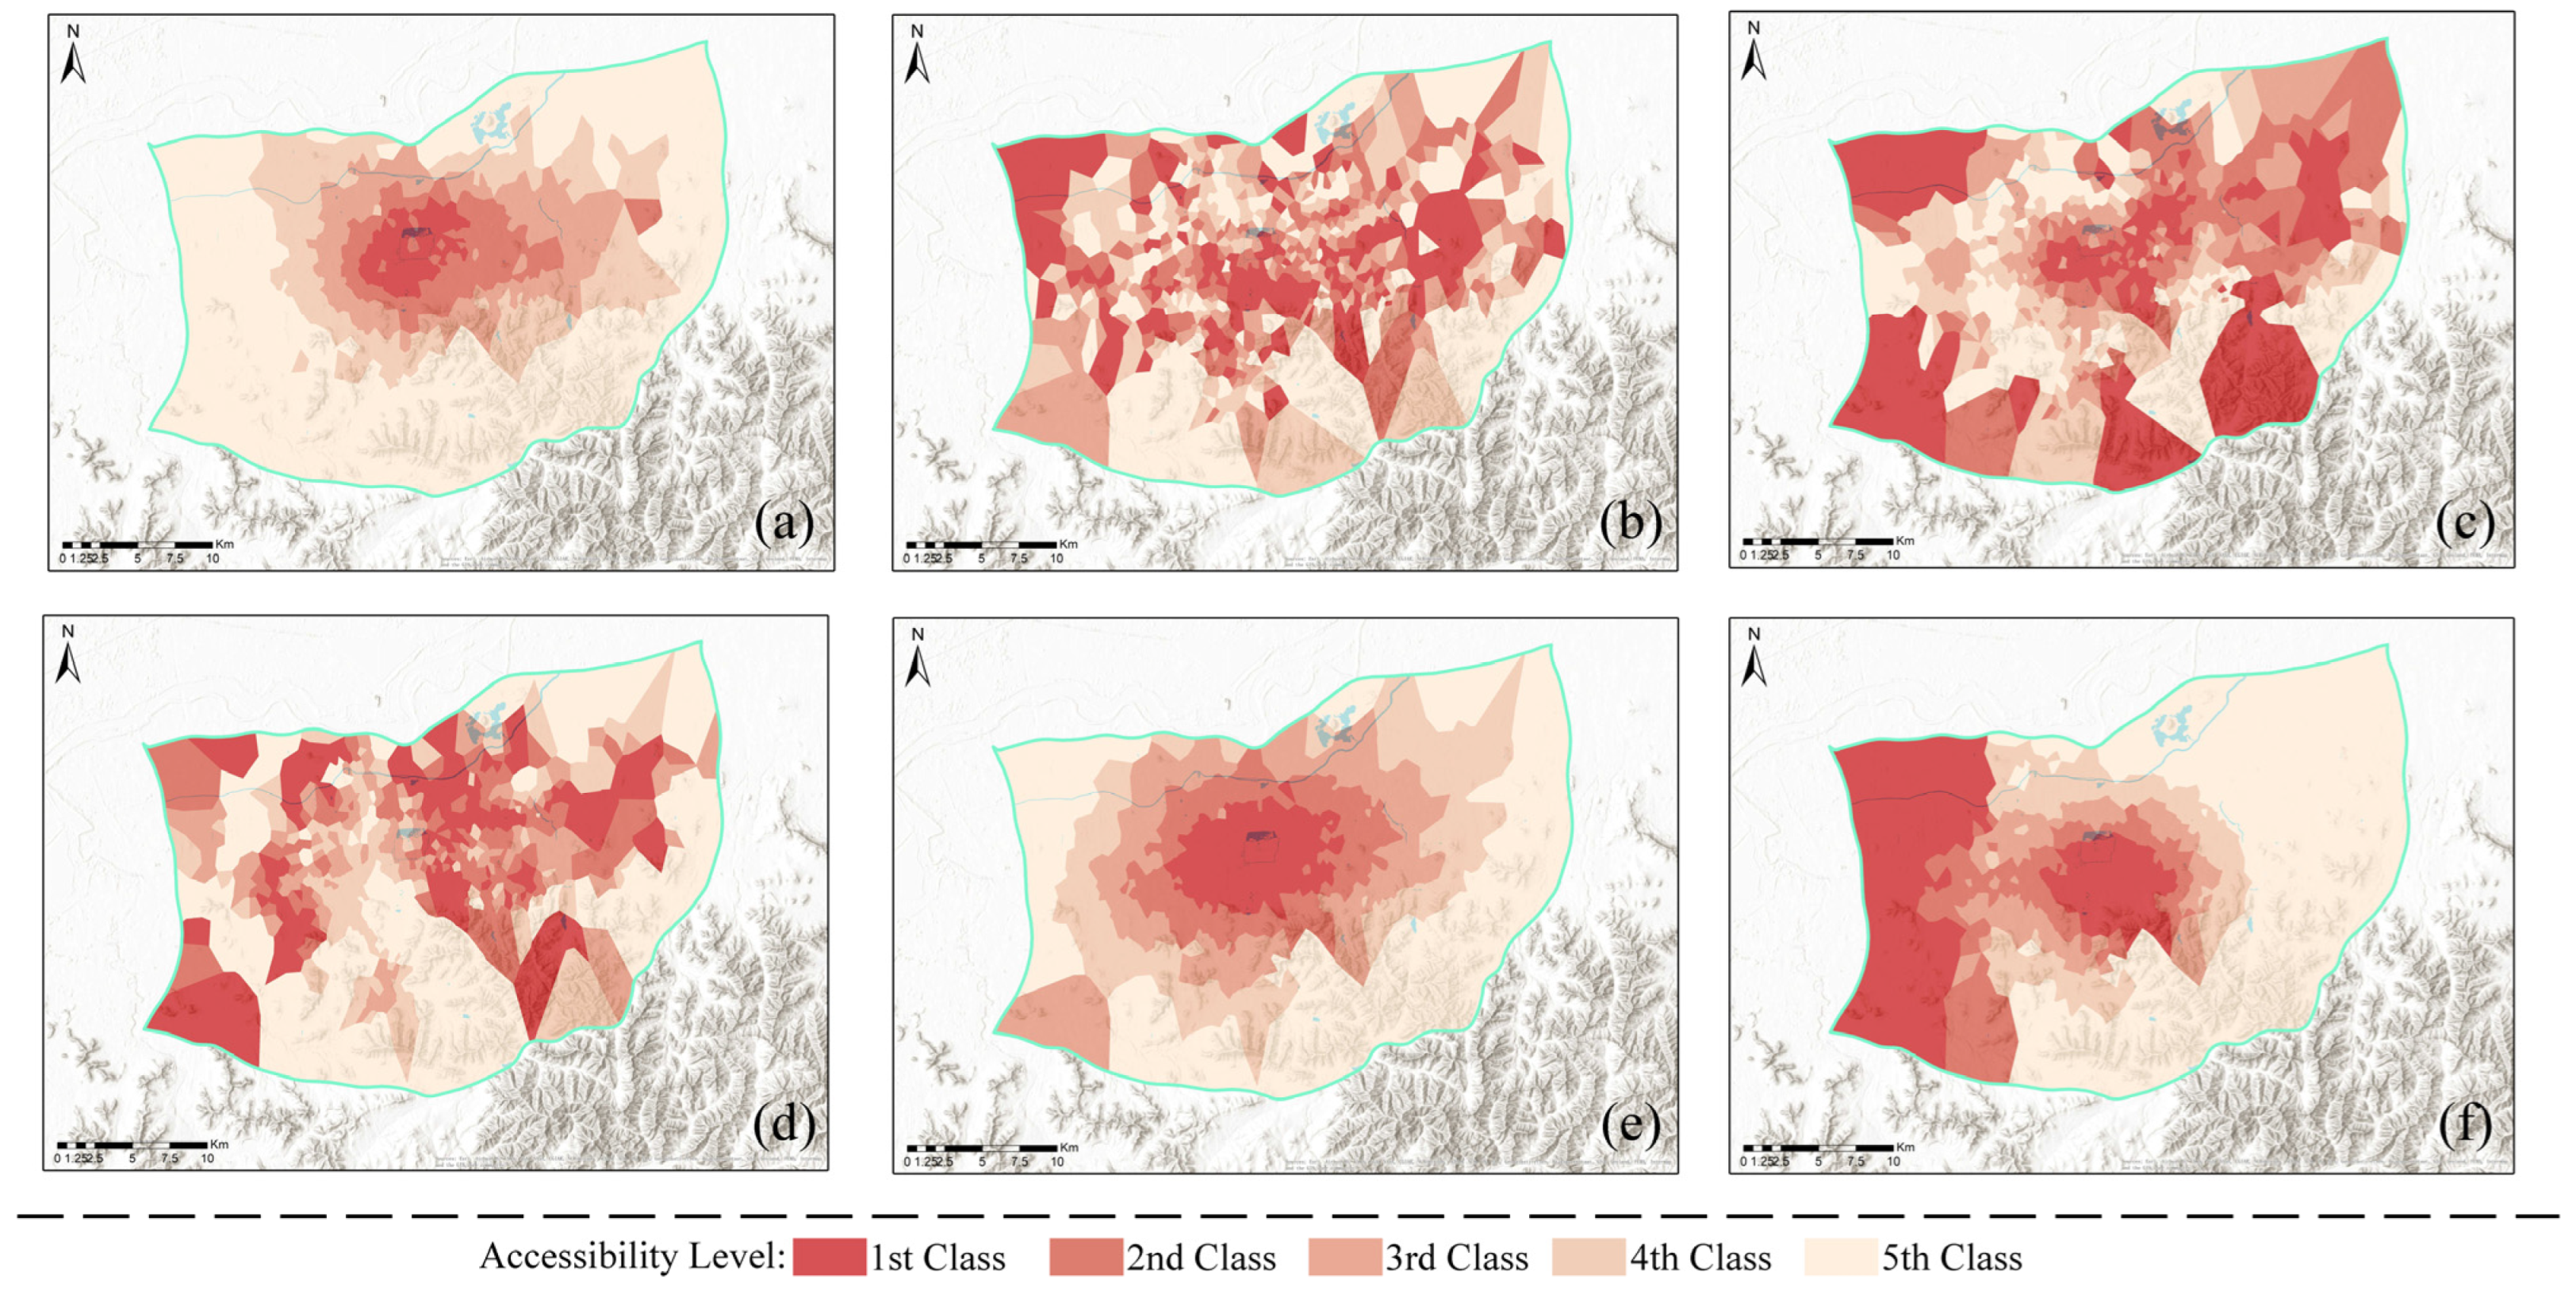
Based on the improved 2SFCA method, taking POI data on the residential communities in downtown Jinan as the evaluation unit, this study calculated the accessibility of each kind of public service facility through the natural breakpoint method, divided the accessibility of public service facilities in Jinan into five levels (level 1 is the highest, while level 5 is the lowest) and created the accessibility map of public service facilities (Figure 6).

Figure 6.
Accessibility distribution map of public service facilities. (a): accessibility of shopping; (b): accessibility of bus stop; (c): accessibility of education; (d): accessibility of grocery market; (e): accessibility of medical; (f): accessibility of tourist attraction.
As shown in Figure 7, the accessibility of medical, shopping and tourist attraction facilities shows an obvious spatial distribution pattern, in which the accessibility of medical treatment and shopping is the highest in the central area and the central-eastern part of the study area and gradually decreases outward in the form of concentric circles. In addition to the high tourist accessibility in the central part, the western part of the urban area of Jinan shows high tourist accessibility and the eastern part shows the lowest. High educational accessibility is mainly concentrated in the eastern region and individual residential communities in the west. Educational accessibility, bus stop accessibility and grocery market accessibility are mainly fragmented and do not show a clear distribution pattern.

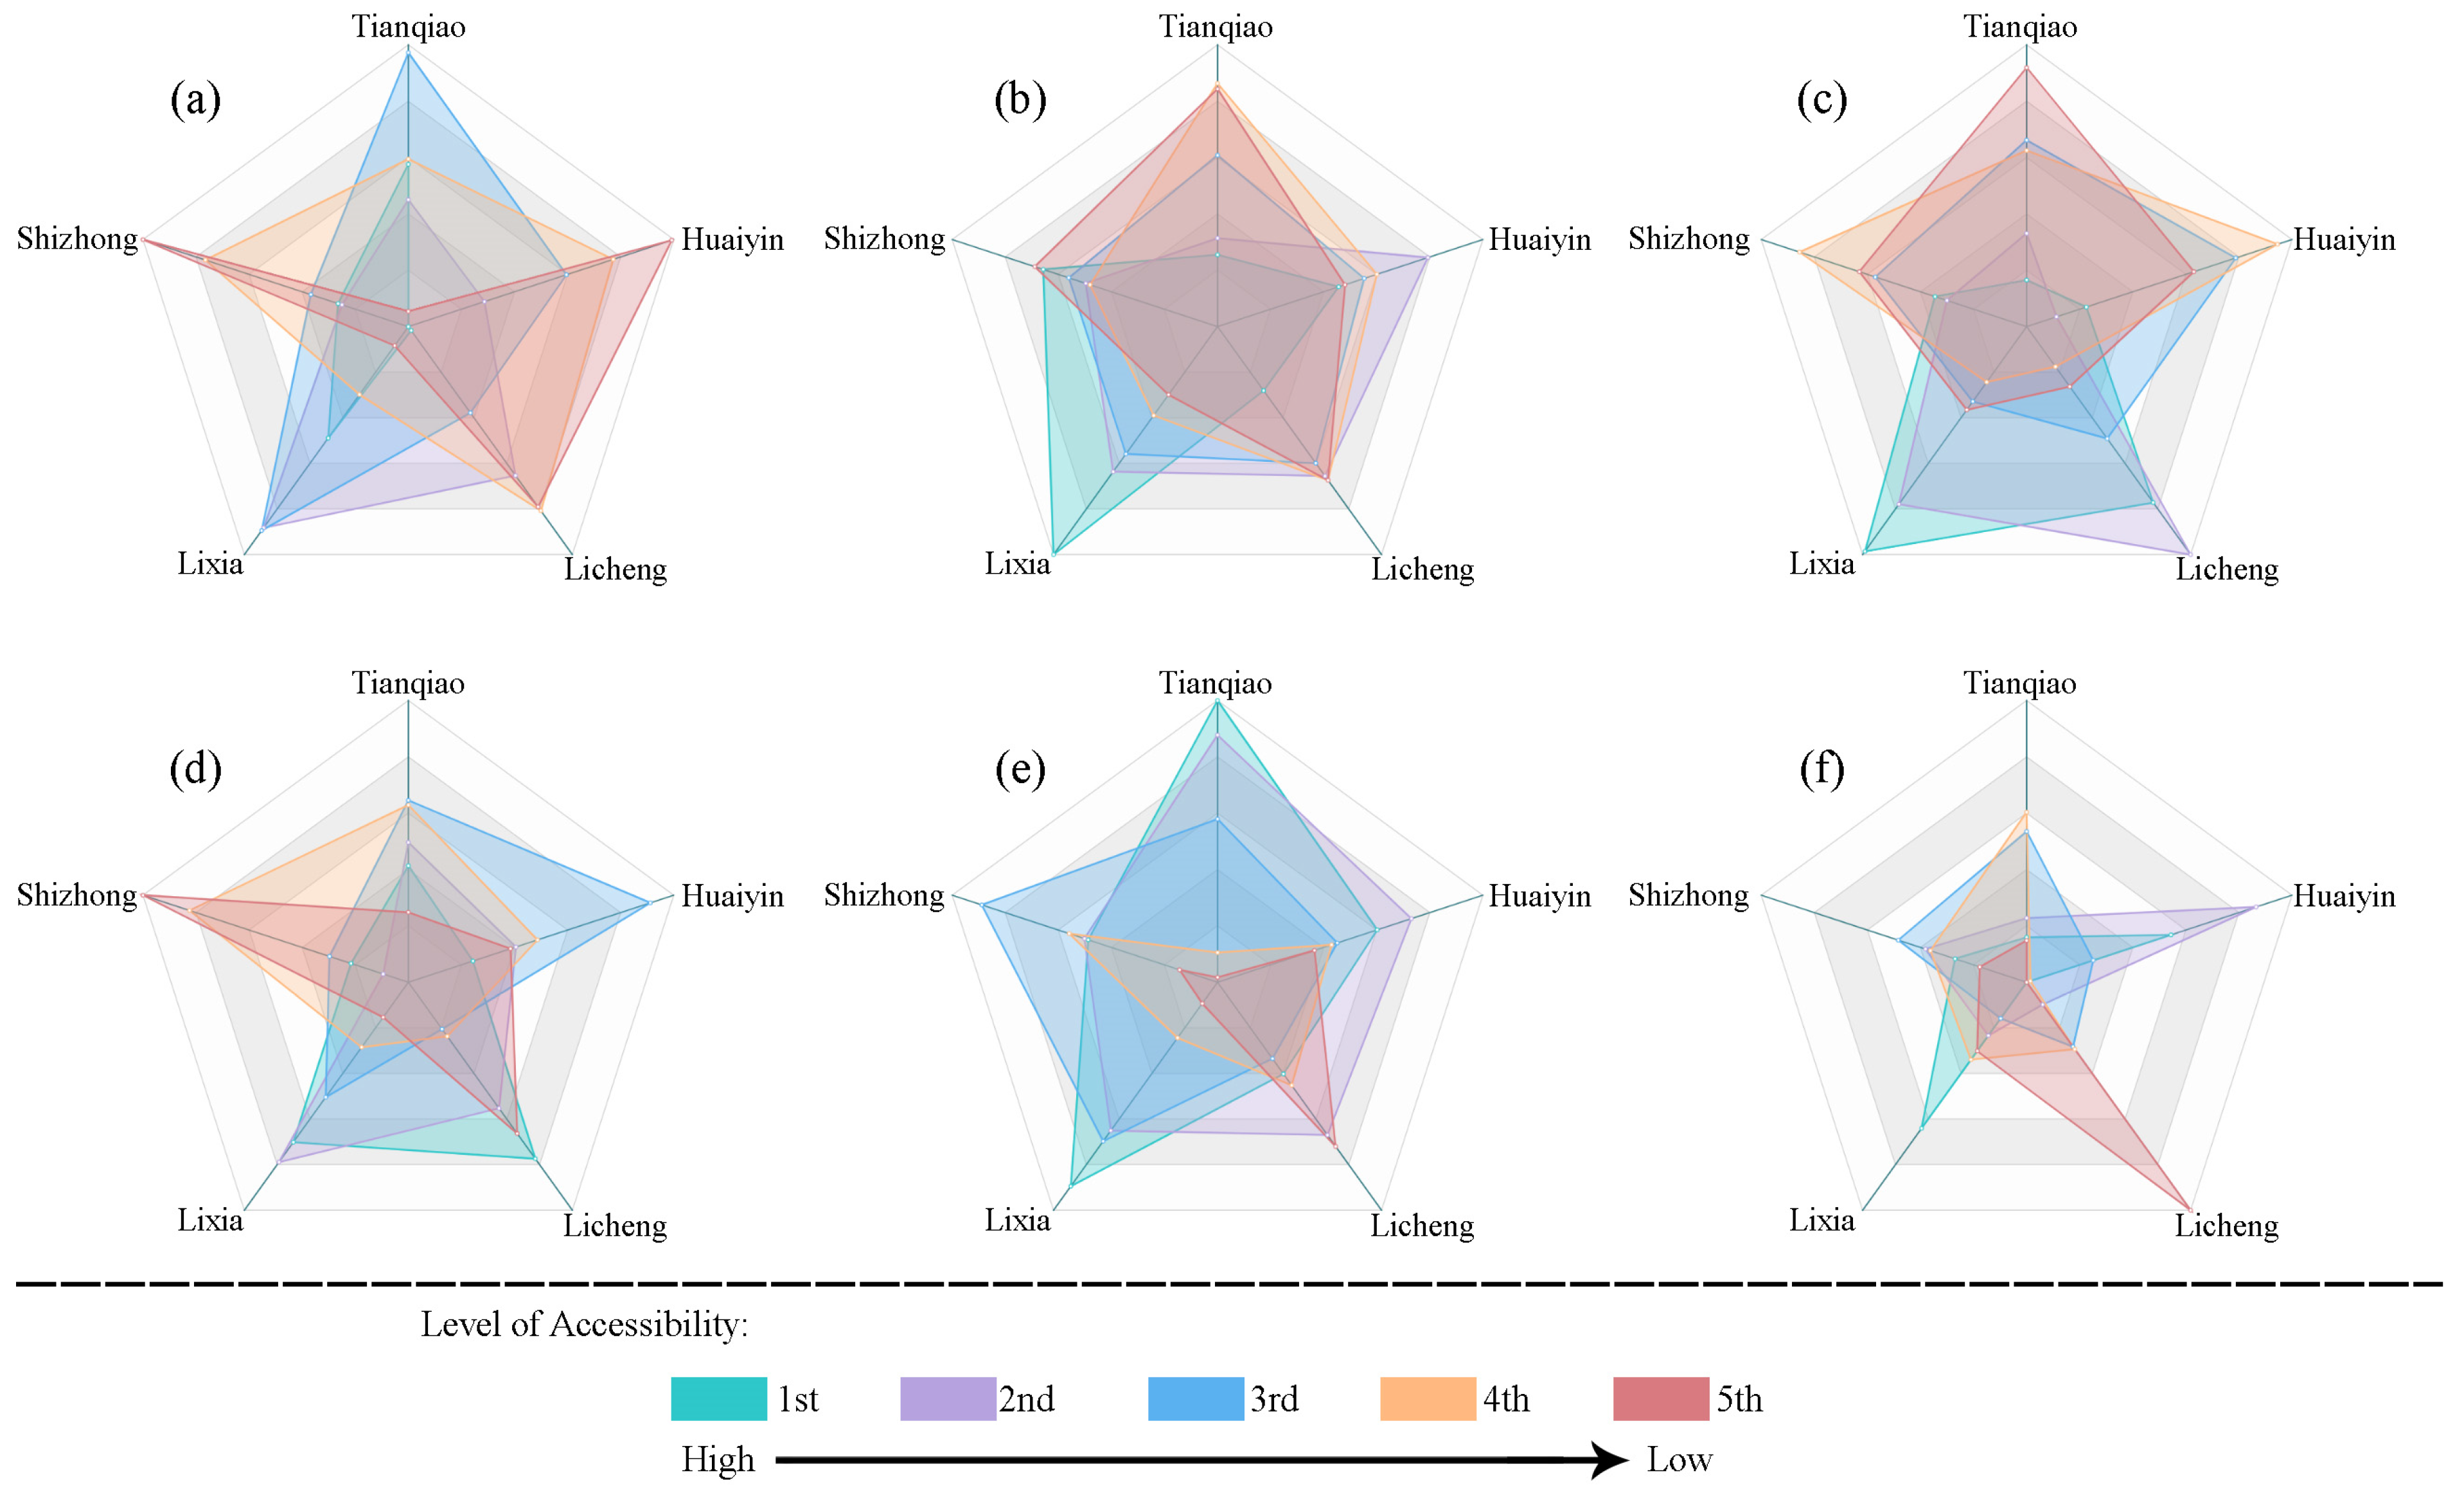
Figure 7.
Quantitative proportion of accessibility at all levels. (a): shopping; (b): bus stop; (c): education; (d): grocery market; (e): medical; (f): tourist attraction.
Residential areas are divided based on their administrative regions, and the proportion of the total number of residential communities in different administrative regions at different levels of accessibility (1–5 represents accessibility from high to low) is analyzed. The quantitative relationship is shown in Figure 7. In Figure 7, the farther the distance from the center is, the higher the proportion of the number of communities located in the district with the specific level of accessibility to the total number of communities in the district. If a district has a relatively high proportion of communities at the first and second levels of accessibility, then the district has an advantage over other districts in this kind of accessibility. In contrast, if a district has a higher proportion of communities at the fourth and fifth levels of accessibility, then the accessibility of the district is weaker.
Regarding shopping accessibility, the Tianqiao and Lixia Districts account for a higher proportion of first- and second-level communities; thus, these two districts have higher shopping accessibility overall. In contrast, Huaiyin and Licheng Districts account for the highest proportion of fifth-level communities; thus, these two districts are not as good as other districts in terms of shopping accessibility. Lixia District is also superior to other districts in bus stop accessibility and educational accessibility, with obvious first- and second-level advantages, while Tianqiao District has a higher proportion of fifth-level and weaker accessibilities. Lixia and Licheng Districts have advantages in grocery market accessibility, while Shizhong District is weaker. In terms of medical accessibility, Tianqiao and Lixia Districts have advantages, while Licheng District is weaker. Regarding tourist attraction accessibility, Huaiyin and Lixia Districts have advantages, while Licheng District is weaker.
4.3. Spatial Correlation between Accessibility and Housing Prices
This study evaluated the spatial correlation between various types of accessibility and housing prices through the LISA cluster diagram generated by the bivariate local Moran’s index. By analyzing the proportion of different cluster types in the total number of residential communities, the spatial correlation between accessibility and housing prices was obtained. The proportion of each cluster type is shown in Table 2. The relationship between the accessibility of residential areas and the number of housing price clusters in each administrative area is shown in Figure 8. The LISA cluster diagram is shown in Figure 9.
Table 2.
The proportion of cluster types of public service facilities.

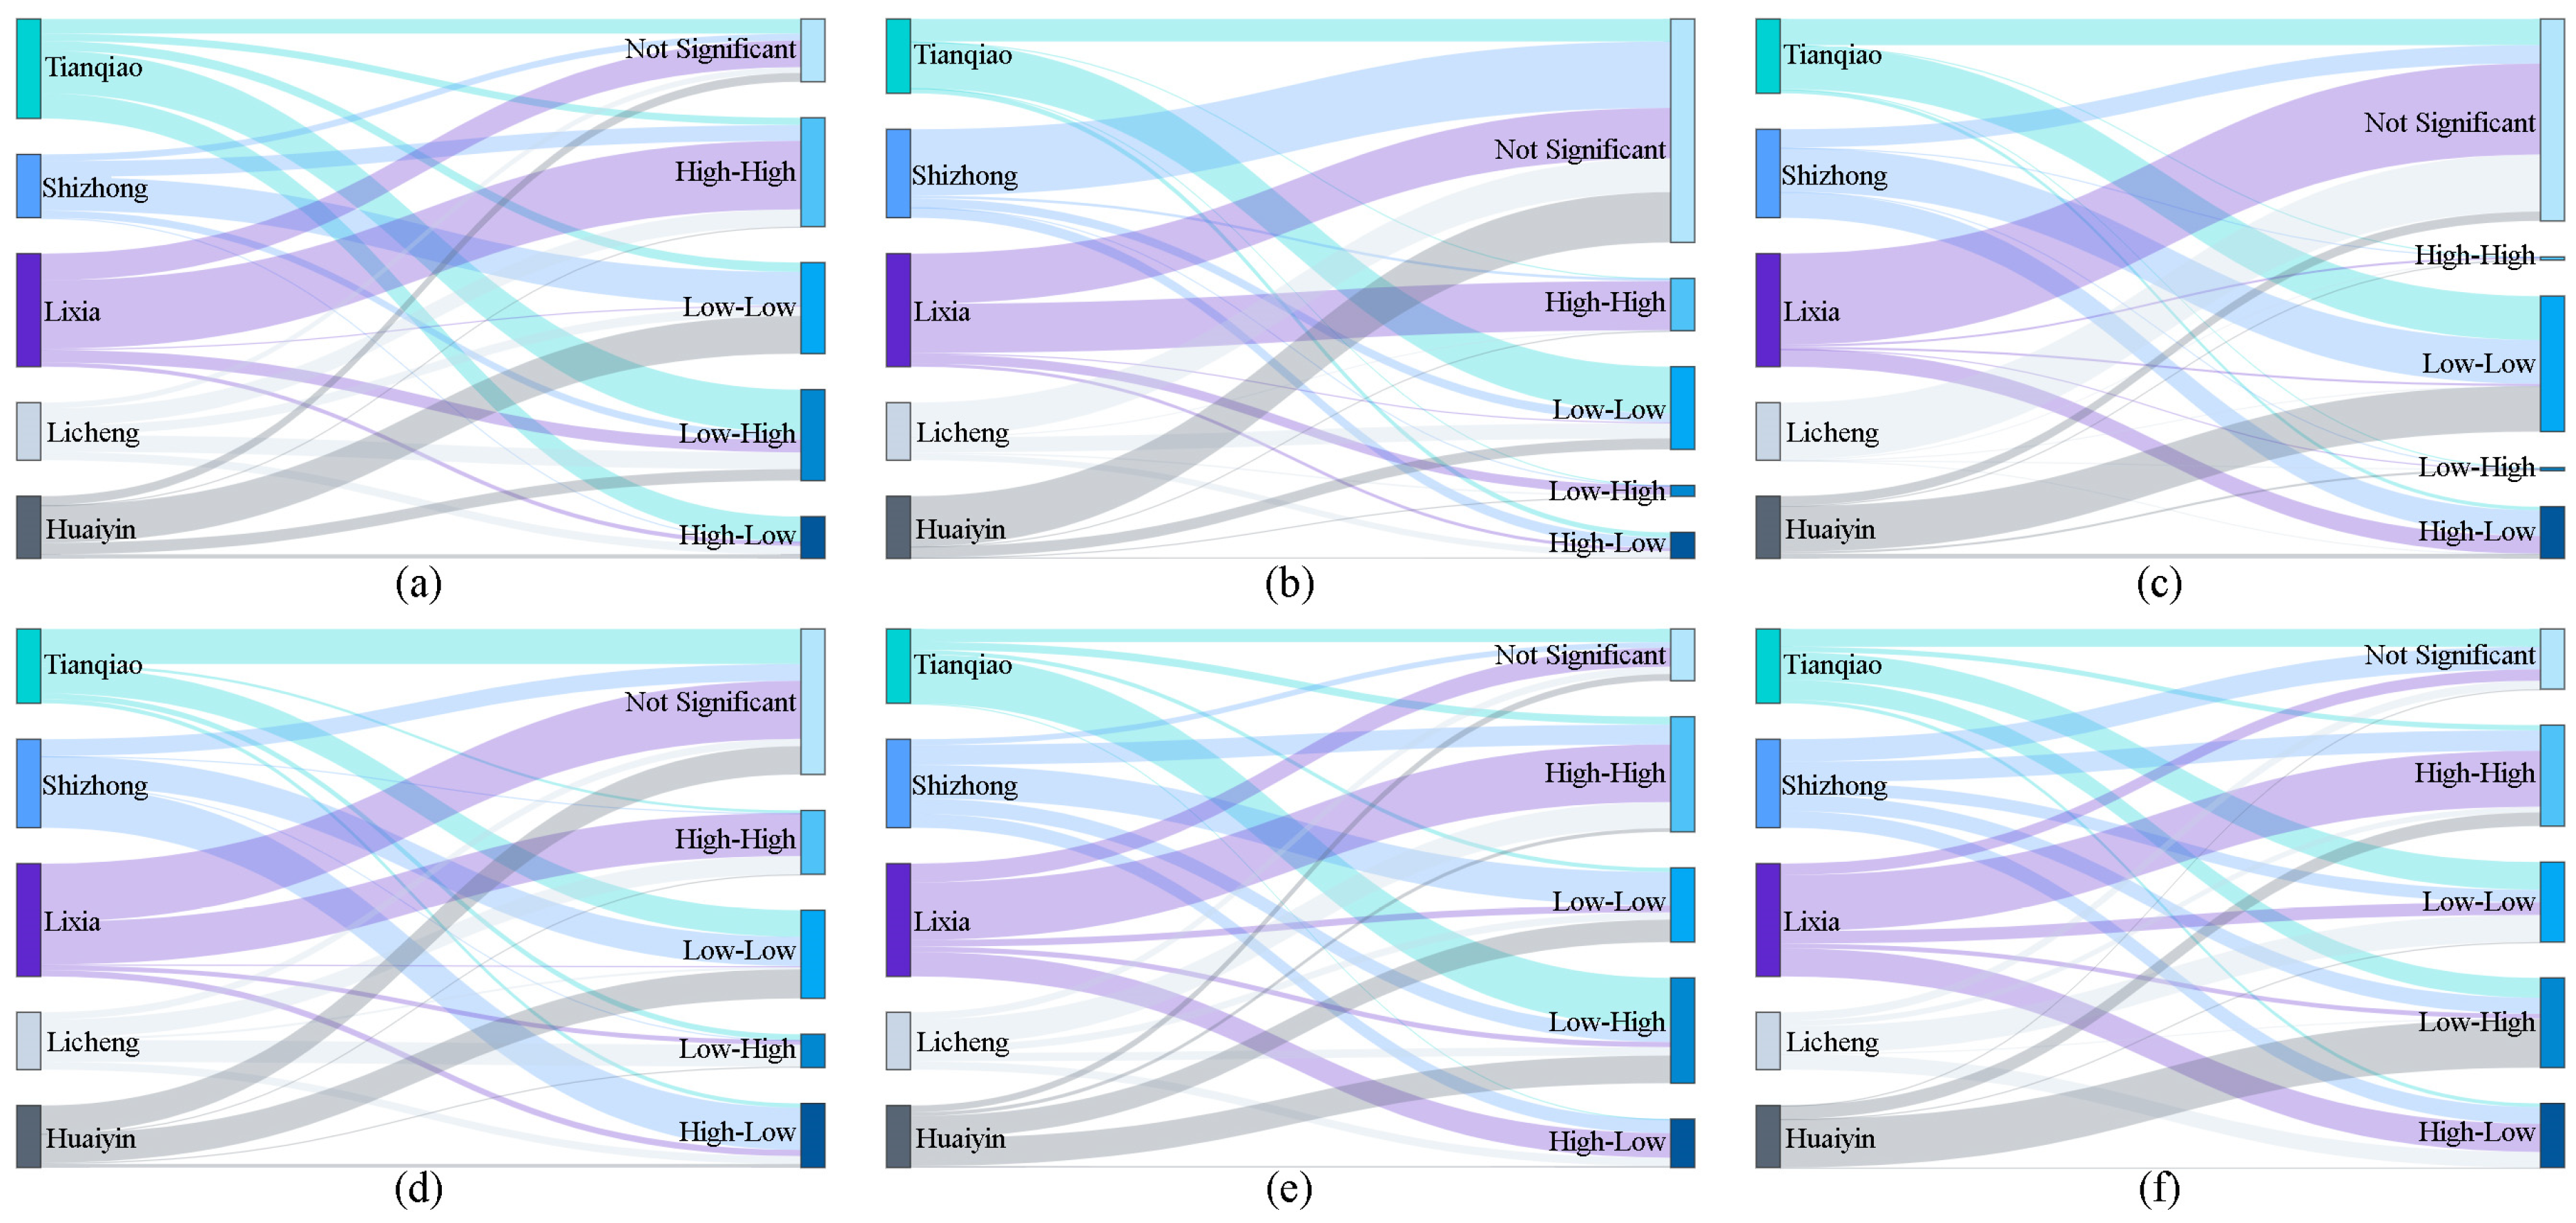
Figure 8.
Sankey diagram of the cluster type of accessibility and housing price. (a): shopping; (b): bus stop; (c): education; (d): grocery market; (e): medical; (f): tourist attraction.

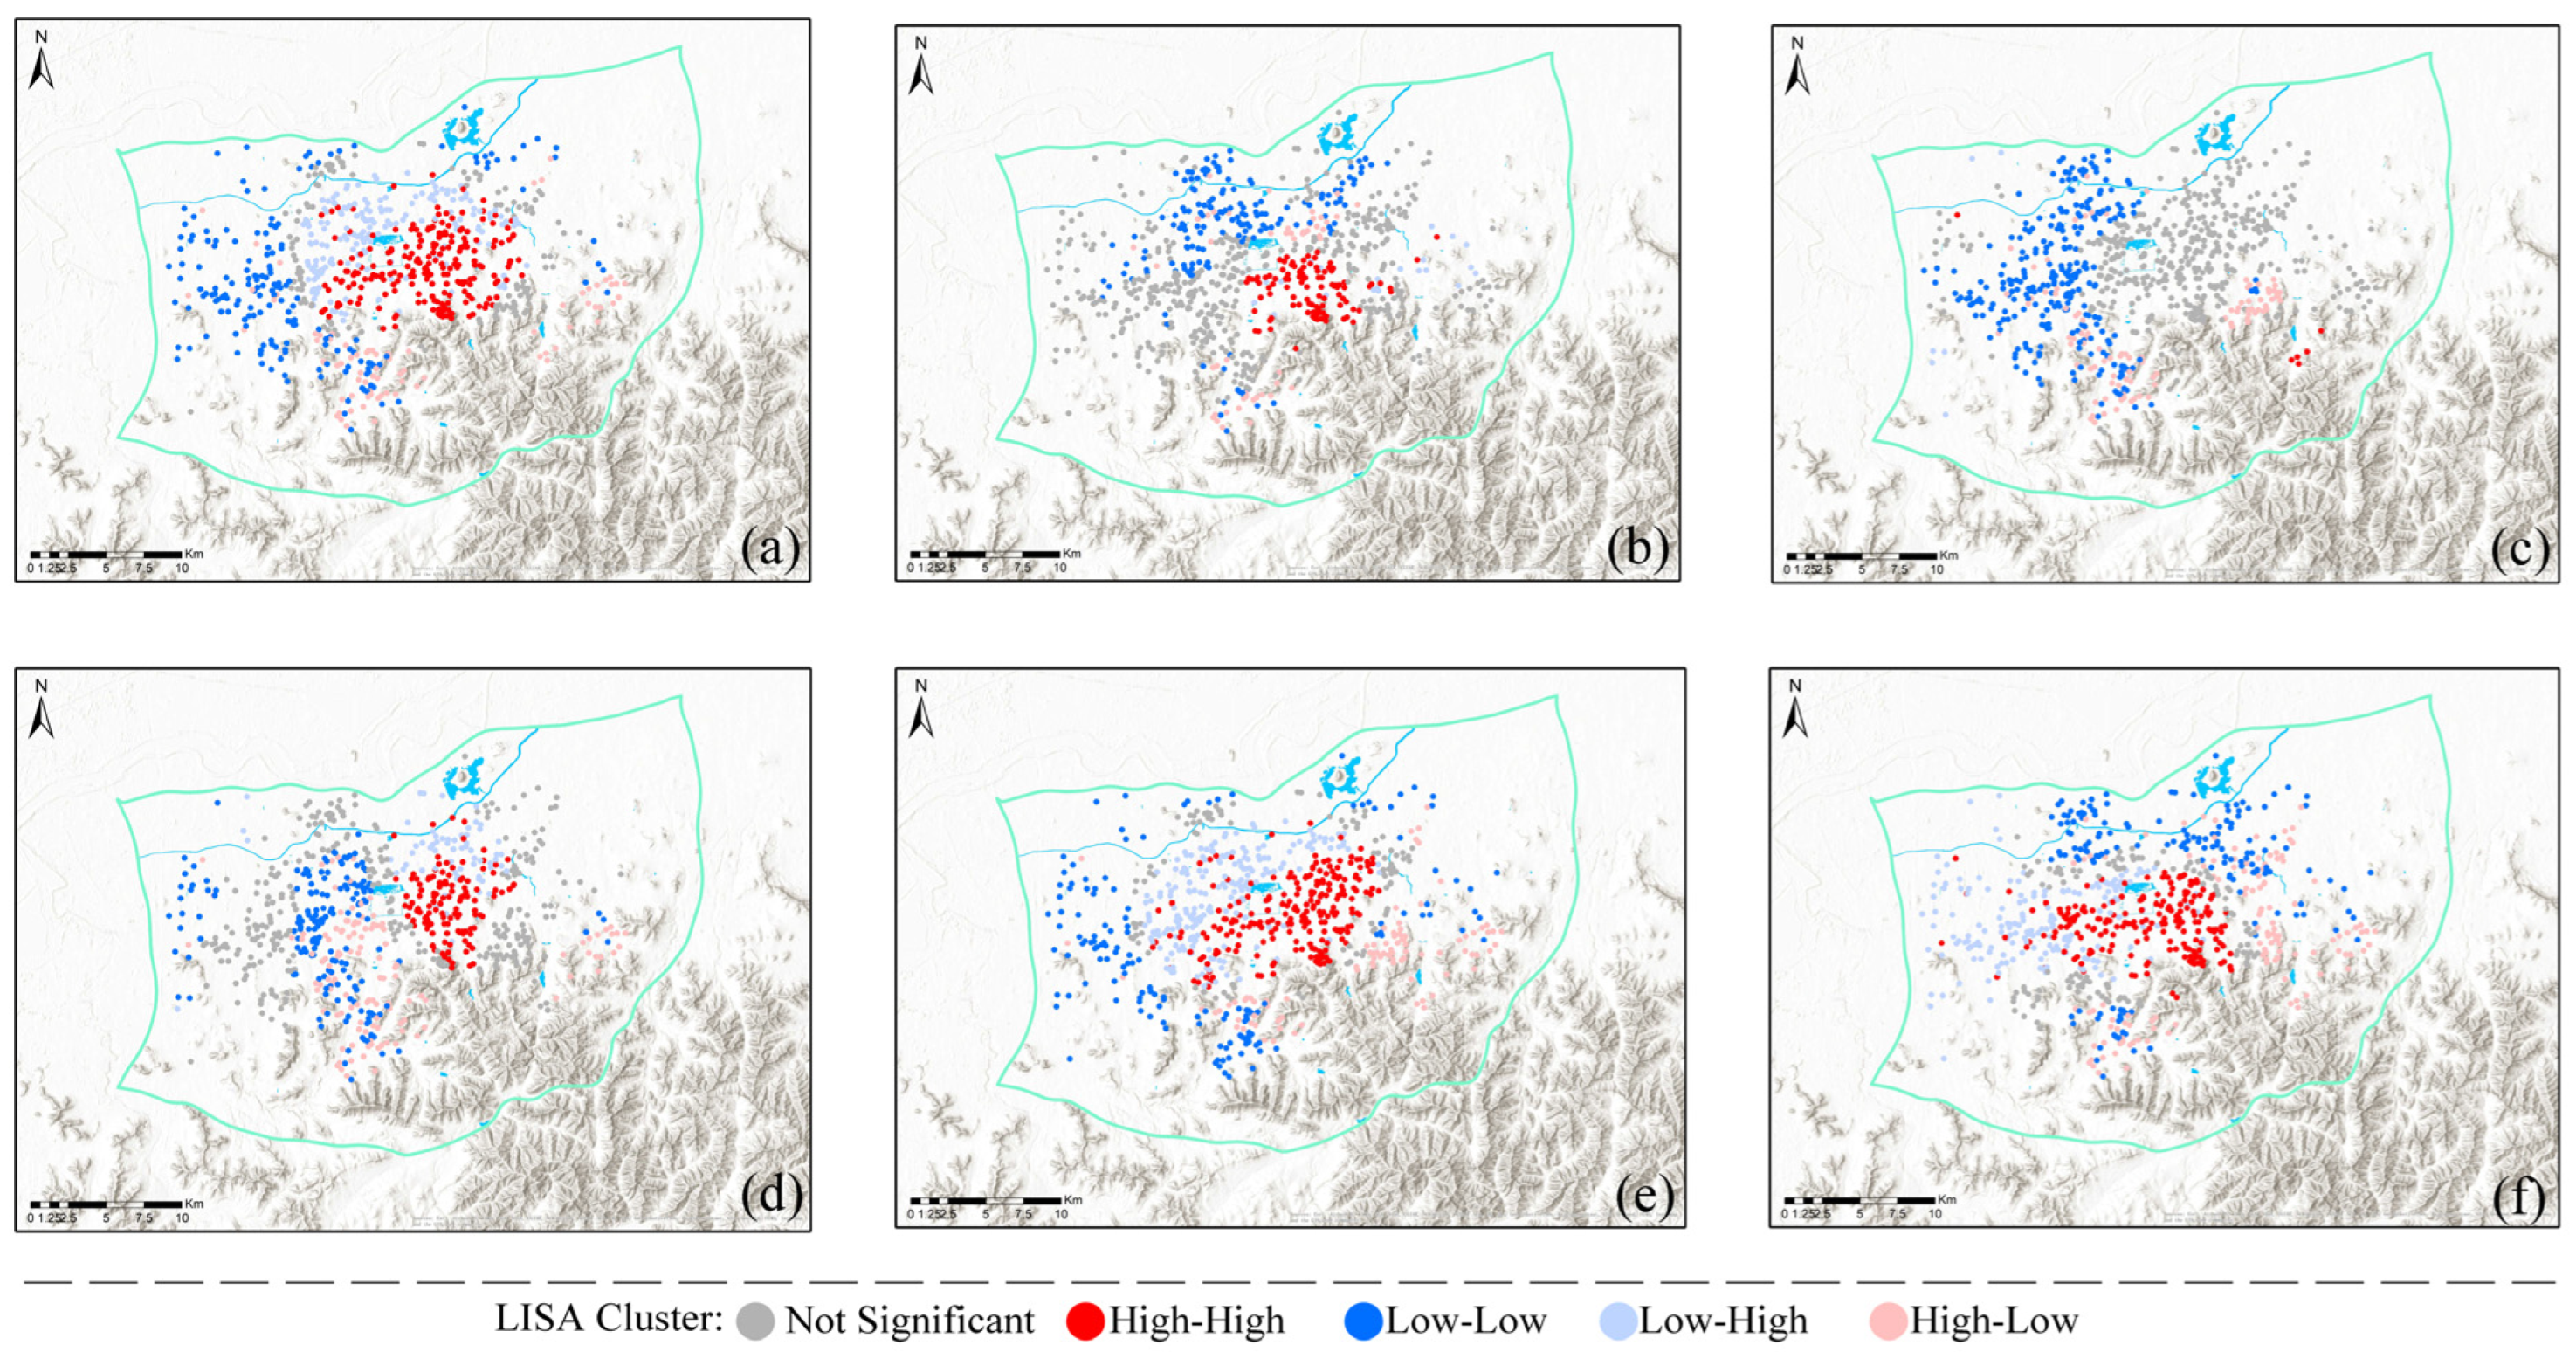
Figure 9.
LISA diagram of accessibility and housing prices. (a): LISA of shopping; (b): LISA of bus stop; (c): LISA of education; (d): LISA of grocery market; (e): LISA of medical; (f): LISA of tourist attraction.
Table 2 shows that shopping accessibility plays a role in promoting housing prices, and the impact of medical accessibility and tourist attraction accessibility is also obvious. The shopping accessibility and housing prices of 50.53% of the communities in the study area show a positive spatial correlation cluster, which is much higher than other cluster types. The proportion of positive correlation clusters of medical accessibility is second only to shopping accessibility, reaching 47.88%, and it has the lowest proportion of not significant clusters. The proportion of positive correlation clusters of tourist attraction accessibility reaches 45.77%, which is also much higher than three other cluster types. There is a weak positive correlation between grocery market accessibility and housing prices, but it is not obvious. The proportion of positive correlation clusters of grocery market accessibility is 38.49%, which is slightly higher than 36.77% of not significant clustering. On the other hand, there is little possibility that there is a spatial relationship between the accessibility of education and the accessibility of bus stations and housing prices, and the proportion of not significant clustering of educational accessibility and bus stop accessibility is more than 50%.
As shown in Figure 8, the proportion of positive spatial correlation clusters of shopping accessibility is the largest; such clusters are mainly in the Lixia, Shizhong and Huaiyin Districts. The negative spatial correlation clusters are mainly in the Tianqiao District. The not-significant clusters of bus stop accessibility are the highest; not-significant clustering is dominant in all regions except Tianqiao District. The quantitative advantages of not significant clustering and low–low clusters of educational accessibility are obvious. The not-significant clusters of grocery market accessibility are the highest, mainly being found in the Tianqiao and Lixia Districts. The proportion of medical accessibility of high–high clustering and low–high clustering is the largest; high–high clustering mainly occurs in Lixia District, while low–high clustering is mainly observed in Tianqiao District. There is no significant difference between positive and negative spatial correlation clusters of tourist attraction accessibility.
Figure 9 shows that the positive correlation clusters of shopping accessibility, medical accessibility, tourist attraction accessibility and housing prices are significantly higher than those of other types of accessibility. The high–high clusters of shopping accessibility are mainly distributed in the middle, while the low–low clusters are concentrated in the west. The cluster distribution of medical accessibility is similar to that of shopping accessibility. The low–low clusters of tourist attraction accessibility are mainly concentrated in the north. The number of negative correlation clusters of bus stop accessibility is the lowest, and the main clustering type is not significant. The cluster type of grocery market accessibility is scattered, mainly high–high clusters and not significant clusters in the middle and negative correlation clusters are scattered. The distribution of educational accessibility is the most special. The rest of the accessibility is dominated by high–high clusters in the central part of the study area, with the exception of educational accessibility. The central part is dominated by not significant clusters, while low–low clusters are widely distributed in the west and north.
5. Discussion
5.1. Impact of Non-Spatial Factors on Accessibility
Accessibility is a spatial concept, but it is restricted by a variety of non-spatial factors when evaluating the accessibility of some places [45,46]. For example, when evaluating the classification of medical facilities, both comprehensive hospitals and community clinics are medical service facilities, but there is a large gap in their ability to attract patients. When choosing facilities for medical treatment, urban residents often prioritize large hospitals with a comprehensive treatment capacity, even if patients do not have complex diseases or life-threatening serious diseases, but only common colds and fever. A number of studies have confirmed this phenomenon [47,48,49]. According to a study based on Chinese patients, only 26.1% of urban residents chose community clinics (which are referred to as tertiary hospitals in this article) [50] at the time of their first visit. This finding means that although large general hospitals have professional doctors and advanced equipment to deal with complex and life-threatening diseases, most of the patients whom they serve can receive appropriate treatment in primary health institutions. At the same time, a survey conducted in Nanjing, China, shows that patients in large hospitals are in stable condition. Only 13% of patients intended to be transferred to lower-level medical institutions for further treatment [51]. Therefore, when urban residents have medical needs, the ability of large-scale general hospitals to attract residents is much greater than that of community clinics; that is, although community clinics can meet most of residents’ medical needs, most residents prioritize higher-level hospitals when choosing medical facilities. Considering this situation, when evaluating the accessibility of medical facilities, the H2SFCA method is used to distinguish the service capacity of different levels of medical facilities based on the average number of medical staff of different levels of medical facilities. In this study, the H2SFCA method also uses similar methods to distinguish the differences between primary and secondary school service capabilities, convenience stores and comprehensive shopping malls in terms of educational accessibility and shopping accessibility.
5.2. Comparison and Interpretation of Results on the Correlation between Accessibility and Housing Prices
The results show that there is a positive correlation between shopping accessibility and housing prices in 50.53% of communities, and for medical accessibility and tourist attraction accessibility, the values are 47.88% and 45.77%, respectively. It can be considered that these three accessibilities of public service facilities have a positive effect on housing prices. These conclusions are in line with our expectations and coincide with the results of the existing research [52,53], and they also prove the feasibility of the evaluation methods used in this study.
Nevertheless, there is still a negative correlation between housing prices and medical accessibility in 39.02% of communities. Figure 9e shows that the communities with a negative correlation are mainly located in the north and east of Jinan. The north side is dominated by low–high clustering, which means that the area has lower housing prices and higher medical accessibility, although hospitals at all levels are distributed in this area. However, because there is the Jinan long-distance coach station, which has the largest passenger transport volume in the country and is close to the railway line, the personnel structure in this area is complex, traffic jams are serious and it is difficult to demolish and renovate the old residential areas, forming a so-called “village in the city”. Thus, the housing prices near this area are relatively low, but because it is close to the core functional area of Jinan, the medical accessibility greatly affected by the general hospital; thus, the medical accessibility is higher, forming low–high clusters. There is a high–low cluster between housing prices and medical accessibility in some residential areas in the east, which means that the region has high housing prices and low medical accessibility. The reason is that the east is the “new downtown” of Jinan; that is, it is a brand-new functional area in Jinan mainly being built in the next decade. Because of policy reasons, the early stage attracted real estate developers to develop high-end residential areas, but the construction of facilities, such as large shopping malls, and general hospitals did not follow in a timely manner. Nevertheless, several large general hospitals have completed site selection and started construction in the eastern part of Jinan. It is believed that the high–low clusters of housing prices and medical accessibility in this area will be improved in the future.
Educational facilities are also generally considered to be an important factor influencing housing prices, but as observed in Figure 4e, educational facilities, particularly primary schools, are more evenly distributed spatially than other facilities, and the spatial accessibility to educational facilities varies less, resulting in a cluster type of “not significant” in correlation to housing prices. In addition, the impact of educational facilities on house prices is influenced by factors other than accessibility, which are discussed in the Limitations Section below.
5.3. Limitations
School districts are the main method of school choosing for students in compulsory education in China, with students being placed in designated schools depending on the residential community in which they live, usually, students and their parents do not have the right to choose other schools according to their own wishes. Figure 9c shows that the spatial distribution of educational accessibility has no obvious clustering characteristics, indicating that its number is relatively even in spatial distribution. However, the actual situation is that the educational quality of each school is extremely uneven, some school districts may have extremely high educational quality, and the housing prices of communities located in high-quality school districts will be 60% higher than those of communities located in adjacent school districts. The term “school district house” is used to describe this housing price phenomenon in China. Nevertheless, in the analysis of medical accessibility, only the demand/supply relationship in the study area is considered, which is not consistent with the actual situation of Jinan, which is the medical and administrative center of the province. As of February 2021, Jinan provided medical insurance reimbursement services for 36,000 medical visits to different facilities, but the data for this area were not withdrawn from the study. In addition, the influencing factors of housing prices are often composed of a variety of factors, such as the economic situation of the city, social stability and the properties of houses. This paper analyzed only the spatial relationship between public service facilities and housing prices. Other social and cultural factors were not considered, and the comprehensiveness of the evaluation method needs to be improved, which is also an important starting point for this study to continue in the future.
6. Conclusions
On the basis of obtaining a large quantity of real and valid data, this paper analysed the spatial distribution characteristics of housing prices in Jinan and evaluated 6 categories of 11 public service facilities in Jinan based on the combined 2SFCA method composed of the G2SFCA and H2SFCA. Accessibility was classified by the natural breakpoint method. The accessibility of shopping, medical and tourist attraction facilities had a similar spatial distribution pattern; that is, the central and eastern areas of the study area had higher accessibility. There was no obvious distribution pattern for bus stop and grocery market accessibility. Subsequently, the distribution characteristics of various types of accessibility were evaluated at the scale of administrative districts. In general, Lixia District had more obvious advantages in accessibility distribution than other administrative districts.
Through bivariate local Moran’s index analysis, the spatial distribution patterns of accessibility and housing prices were classified into the following three categories: positive correlation (high–high and low–low clusters), negative correlation (high–low and low–high clusters) and not significant. The results show that the accessibility of medical, shopping and tourist attraction facilities can obviously promote housing prices. In contrast, grocery market accessibility has a weak correlation with housing prices, while the accessibility of education and bus stations is basically not related to housing prices.
We studied the spatial relationship between the spatial distribution of public service facilities and housing prices in Jinan, a large emerging city, as an example. Due to the universality and maneuverability of the methods that were applied in this study, it can be extended to other study regions and the results can be integrated with regional administrative planning, thus deepening the understanding of decision makers and stakeholders on the spatial distribution of public service facilities.
Author Contributions
Conceptualization: Luoan Yang and Jianfei Cao; data curation: Shumin Zhang and Mei Guan; funding acquisition: Baolei Zhang; investigation: Shumin Zhang; methodology: Luoan Yang and Jianfei Cao; project administration: Baolei Zhang; resources: Shumin Zhang; software: Mei Guan; validation: Mei Guan; writing—original draft: Luoan Yang; writing—review and editing: Baolei Zhang. All authors have read and agreed to the published version of the manuscript.
Funding
This research was supported by the National Social Science Fund of China (No. 18BJY086).
Institutional Review Board Statement
Not applicable.
Informed Consent Statement
Not applicable.
Data Availability Statement
The availability of data and materials is based on personal requests.
Acknowledgments
We would like to thank the editor and the anonymous reviewers for providing constructive comments and suggestions.
Conflicts of Interest
The authors declare no conflict of interest.
References
- Wei, Y.D.; Ewing, R. Urban expansion, sprawl and inequality. Landsc. Urban Plan. 2018, 177, 259–265. [Google Scholar] [CrossRef]
- Gössling, S.; Schröder, M.; Späth, P.; Freytag, T. Urban Space Distribution and Sustainable Transport. Transp. Rev. 2016, 36, 659–679. [Google Scholar] [CrossRef]
- Kanno, Y.; Shiohama, T. Land price polarization and dispersion in Tokyo: A spatial model approach. Asia-Pac. J. Reg. Sci. 2022, 6, 807–835. [Google Scholar] [CrossRef]
- Fack, G.; Grenet, J. When do better schools raise housing prices? Evidence from Paris public and private schools. J. Public Econ. 2010, 94, 59–77. [Google Scholar] [CrossRef] [Green Version]
- Saphores, J.-D.; Li, W. Estimating the value of urban green areas: A hedonic pricing analysis of the single family housing market in Los Angeles, CA. Landsc. Urban Plan. 2012, 104, 373–387. [Google Scholar] [CrossRef]
- Stewart, J.Q. Demographic gravitation: Evidence and applications. Sociometry 1948, 11, 31–58. [Google Scholar] [CrossRef]
- Morris, J.M.; Dumble, P.L.; Wigan, M.R. Accessibility indicators for transport planning. Transp. Res. Part A Gen. 1979, 13, 91–109. [Google Scholar] [CrossRef]
- Talen, E.; Anselin, L. Assessing Spatial Equity: An Evaluation of Measures of Accessibility to Public Playgrounds. Environ. Plan. A Econ. Space 1998, 30, 595–613. [Google Scholar] [CrossRef] [Green Version]
- Moseley, M.J. Accessibility: The Rural Challenge; Methuen: London, UK, 1979. [Google Scholar]
- Luo, W.; Wang, F. Measures of spatial accessibility to health care in a GIS environment: Synthesis and a case study in the Chicago region. Environ. Plan. B Plan. Des. 2003, 30, 865–884. [Google Scholar] [CrossRef] [Green Version]
- Joseph, A.E.; Bantock, P.R. Measuring potential physical accessibility to general practitioners in rural areas: A method and case study. Soc. Sci. Med. 1982, 16, 85–90. [Google Scholar] [CrossRef]
- Randák, J.; Marada, M.; Vrtiška, M. Application of potential accessibility models in decision-making on HSR routing: The case of Rapid Connections in Czechia. AUC Geogr. 2021, 56, 108–119. [Google Scholar] [CrossRef]
- Wang, F.; Luo, W. Assessing spatial and nonspatial factors for healthcare access: Towards an integrated approach to defining health professional shortage areas. Health Place 2005, 11, 131–146. [Google Scholar] [CrossRef] [PubMed]
- Sevtsuk, A.; Kalvo, R. Patronage of urban commercial clusters: A network-based extension of the Huff model for balancing location and size. Environ. Plan. B Urban Anal. City Sci. 2018, 45, 508–528. [Google Scholar] [CrossRef] [Green Version]
- Spencer, J.; Angeles, G. Kernel density estimation as a technique for assessing availability of health services in Nicaragua. Health Serv. Outcomes Res. Methodol. 2007, 7, 145–157. [Google Scholar] [CrossRef]
- Luo, W.; Qi, Y. An enhanced two-step floating catchment area (E2SFCA) method for measuring spatial accessibility to primary care physicians. Health Place 2009, 15, 1100–1107. [Google Scholar] [CrossRef]
- McGrail, M.R.; Humphreys, J.S. Measuring spatial accessibility to primary care in rural areas: Improving the effectiveness of the two-step floating catchment area method. Appl. Geogr. 2009, 29, 533–541. [Google Scholar] [CrossRef]
- Dai, D. Black residential segregation, disparities in spatial access to health care facilities, and late-stage breast cancer diagnosis in metropolitan Detroit. Health Place 2010, 16, 1038–1052. [Google Scholar] [CrossRef]
- Dai, D. Racial/ethnic and socioeconomic disparities in urban green space accessibility: Where to intervene? Landsc. Urban Plan. 2011, 102, 234–244. [Google Scholar] [CrossRef]
- McGrail, M.R.; Humphreys, J.S. Measuring spatial accessibility to primary health care services: Utilising dynamic catchment sizes. Appl. Geogr. 2014, 54, 182–188. [Google Scholar] [CrossRef]
- Jamtsho, S.; Corner, R.; Dewan, A. Spatio-Temporal Analysis of Spatial Accessibility to Primary Health Care in Bhutan. ISPRS Int. J. Geo-Inf. 2015, 4, 1584–1604. [Google Scholar] [CrossRef] [Green Version]
- Tao, Z.; Cheng, Y.; Dai, T. Measuring Spatial Accessibility to Residential Care Facilities in Beijing. Prog. Geogr. 2014, 33, 616–624. [Google Scholar]
- Okabe, A.; Satoh, T.; Furuta, T.; Suzuki, A.; Okano, K. Generalized network Voronoi diagrams: Concepts, computational methods, and applications. Int. J. Geogr. Inf. Sci. 2008, 22, 965–994. [Google Scholar] [CrossRef]
- Dogan, O.; Han, J.; Lee, S. Opening Gated Communities and Neighborhood Accessibility Benefits: The Case of Seoul, Korea. Int. J. Environ. Res. Public Health 2021, 18, 4255. [Google Scholar] [CrossRef]
- Zheng, L.; Li, J.; Hu, W.; Duan, P. Analysis of the spatial range of service and accessibility of hospitals designated for coronavirus disease 2019 in Yunnan Province, China. Geocarto Int. 2021, 36, 1–19. [Google Scholar] [CrossRef]
- Hansen, W.G. How accessibility shapes land use. J. Am. Inst. Plan. 1959, 25, 73–76. [Google Scholar] [CrossRef]
- Sakti, A.D.; Rahadianto, M.A.E.; Pradhan, B.; Muhammad, H.N.; Andani, I.G.A.; Sarli, P.W.; Abdillah, M.R.; Anggraini, T.S.; Purnomo, A.D.; Ridwana, R.; et al. School Location Analysis by Integrating the Accessibility, Natural and Biological Hazards to Support Equal Access to Education. ISPRS Int. J. Geo-Inf. 2022, 11, 12. [Google Scholar] [CrossRef]
- Fleming, J.I.; Wilson, S.E.; Hart, S.A.; Therrien, W.J.; Cook, B.G. Open accessibility in education research: Enhancing the credibility, equity, impact, and efficiency of research. Educ. Psychol. 2021, 56, 110–121. [Google Scholar] [CrossRef]
- Talen, E. School, community, and spatial equity: An empirical investigation of access to elementary schools in West Virginia. Ann. Assoc. Am. Geogr. 2001, 91, 465–486. [Google Scholar] [CrossRef]
- Hashtarkhani, S.; Kiani, B.; Bergquist, R.; Bagheri, N.; VafaeiNejad, R.; Tara, M. An age-integrated approach to improve measurement of potential spatial accessibility to emergency medical services for urban areas. Int. J. Health Plan. Manag. 2020, 35, 788–798. [Google Scholar] [CrossRef]
- Ghorbanzadeh, M.; Kim, K.; Ozguven, E.E.; Horner, M.W. Spatial accessibility assessment of COVID-19 patients to healthcare facilities: A case study of Florida. Travel Behav. Soc. 2021, 24, 95–101. [Google Scholar] [CrossRef]
- Munoz-Raskin, R. Walking accessibility to bus rapid transit: Does it affect property values? The case of Bogotá, Colombia. Transp. Policy 2010, 17, 72–84. [Google Scholar] [CrossRef]
- Saif, M.A.; Zefreh, M.M.; Torok, A. Public transport accessibility: A literature review. Period. Polytech. Transp. Eng. 2019, 47, 36–43. [Google Scholar] [CrossRef] [Green Version]
- Nepal, M.; Rai, R.K.; Khadayat, M.S.; Somanathan, E. Value of cleaner neighborhoods: Application of hedonic price model in low income context. World Dev. 2020, 131, 104965. [Google Scholar] [CrossRef]
- Chin, H.C.; Foong, K.W. Influence of school accessibility on housing values. J. Urban Plan. Dev. 2006, 132, 120–129. [Google Scholar] [CrossRef]
- Smersh, G.T.; Smith, M.T. Accessibility Changes and Urban House Price Appreciation: A Constrained Optimization Approach to Determining Distance Effects. J. Hous. Econ. 2000, 9, 187–196. [Google Scholar] [CrossRef]
- Chen, S.; Zhang, L.; Huang, Y.; Wilson, B.; Mosey, G.; Deal, B. Spatial impacts of multimodal accessibility to green spaces on housing price in Cook County, Illinois. Urban For. Urban Green. 2022, 67, 127370. [Google Scholar] [CrossRef]
- Li, R.; Gong, S.; Gao, Y. Accessibility of Public Service Facilities in Beijing and Its Impact on Housing Prices. Beijing Da Xue Xue Bao 2021, 57, 875–884. [Google Scholar]
- Jenks, G.F. The Data Model Concept in Statistical Mapping. Int. Yearb. Cartogr. 1967, 7, 186–190. [Google Scholar]
- Wang, F. Measurement, Optimization, and Impact of Health Care Accessibility: A Methodological Review. Ann. Assoc. Am. Geogr. 2012, 102, 1104–1112. [Google Scholar] [CrossRef] [Green Version]
- Tao, Z.; Cheng, Y.; Liu, J. Hierarchical two-step floating catchment area (2SFCA) method: Measuring the spatial accessibility to hierarchical healthcare facilities in Shenzhen, China. Int. J. Equity Health 2020, 19, 164. [Google Scholar] [CrossRef]
- Shiode, N.; Morita, M.; Shiode, S.; Okunuki, K.-I. Urban and rural geographies of aging: A local spatial correlation analysis of aging population measures. Urban Geogr. 2014, 35, 608–628. [Google Scholar] [CrossRef]
- Hu, S.; Song, W.; Li, C.; Lu, J. A multi-mode Gaussian-based two-step floating catchment area method for measuring accessibility of urban parks. Cities 2020, 105, 102815. [Google Scholar] [CrossRef]
- Jang, S.; Yi, C. Imbalance between local commuting accessibility and residential locations of households by income class in the Seoul Metropolitan Area. Cities 2021, 109, 103011. [Google Scholar] [CrossRef]
- Kanuganti, S.; Sarkar, A.K.; Singh, A.P. Quantifying Accessibility to Health Care Using Two-step Floating Catchment Area Method (2SFCA): A Case Study in Rajasthan. Transp. Res. Procedia 2016, 17, 391–399. [Google Scholar] [CrossRef]
- Kanuganti, S.; Sarkar, A.K.; Singh, A.P. Evaluation of access to health care in rural areas using enhanced two-step floating catchment area (E2SFCA) method. J. Transp. Geogr. 2016, 56, 45–52. [Google Scholar] [CrossRef]
- Liu, X.; Hou, Z.; Towne, S.D.J.; He, M.; Tan, A.; Jiang, D.; Mohammed, A.S.H.; Mao, Z. Knowledge, attitudes, and practices related to the establishment of the National Hierarchical Medical System (NHMS) among outpatients in Chinese tertiary hospitals. Medicine 2018, 97, e11836. [Google Scholar] [CrossRef] [PubMed]
- Niu, W.; Huang, J.; Xing, Z.; Chen, J. Knowledge Spillovers of Medical Big Data under Hierarchical Medical System and Patients’ Medical Treatment Decisions. IEEE Access 2019, 7, 55770–55779. [Google Scholar] [CrossRef]
- Wu, Q.; Xie, X.; Liu, W.; Wu, Y. Implementation efficiency of the hierarchical diagnosis and treatment system in China: A case study of primary medical and health institutions in Fujian province. Int. J. Health Plan. Manag. 2021, 37, 214–227. [Google Scholar] [CrossRef]
- Zhou, Z.; Zhao, Y.; Shen, C.; Lai, S.; Nawaz, R.; Gao, J. Evaluating the effect of hierarchical medical system on health seeking behavior: A difference-in-differences analysis in China. Soc. Sci. Med. 2021, 268, 113372. [Google Scholar] [CrossRef]
- Huang, Q.; Lu, F.; Chen, W.; Ma, J. Analysis on Cognition and Willingness of Hierarchical Medical System among Hospital Patients. Chin. Prim. Health Care 2016, 30, 1r3. [Google Scholar]
- Peng, T.-C.; Chiang, Y.-H. The non-linearity of hospitals’ proximity on property prices: Experiences from Taipei, Taiwan. J. Prop. Res. 2015, 32, 341–361. [Google Scholar] [CrossRef]
- Wen, H.; Tao, Y. Polycentric urban structure and housing price in the transitional China: Evidence from Hangzhou. Habitat Int. 2015, 46, 138–146. [Google Scholar] [CrossRef]

Publisher’s Note: MDPI stays neutral with regard to jurisdictional claims in published maps and institutional affiliations. |
© 2022 by the authors. Licensee MDPI, Basel, Switzerland. This article is an open access article distributed under the terms and conditions of the Creative Commons Attribution (CC BY) license (https://creativecommons.org/licenses/by/4.0/).