Abstract
The growth simulation of urban underground space (UUS) under the consideration of ecological constraints can effectively reveal the characteristics and trends of UUS changes, and provide a basis for planning the construction of sustainable and livable ecological cities. Therefore, this study considers urban ecological space as a constraint mechanism for UUS development and conducts a simulation study of the dynamic and complex UUS growth process, with a view toward guiding UUS planning under a long-term overall vision. In this study, a patch-based cellular automaton (CA) model is constructed to simulate the dynamic and complex growth process of UUS, subject to the ecological constraints generated by the agent-based land allocation optimization model. The spatial drivers of UUS growth simulation are determined based on the Random Forest (RF) algorithm. The results of the research case in Tianfu New District, Chengdu City, demonstrate that UUS expansion with ecological constraints exhibits sustainable characteristics. However, the growth rate of the UUS development scale is significantly lower when ecological constraints are present compared to when they are not. This study’s results contribute to urban management by finding a balance between UUS development and ecological space conservation, and providing theoretical support for rational UUS planning and decision making in the construction of low-carbon cities.
1. Introduction
The three-dimensional development of cities using urban underground space (UUS) is relevant to the world’s leading metropolitan areas. Cities in developed and developing countries are expanding and growing much faster than their populations [1,2]. Sustainable cities are pursuing compact city policies to exclude new constructions in undeveloped and green areas [3,4]. UUS is one component of the three-dimensional urban space (including above-ground, surface, and underground space). It is a unique space with a vast potential for exploration in achieving the goal of low-carbon cities, which has not been fully utilized [5,6,7]. The results of many studies have demonstrated that the rational and effective use of UUS is beneficial for solving urban development problems, especially for achieving urban sustainability [5,8,9].
UUS planning should be guided by a far-reaching overall vision to ensure that these spaces can be developed and utilized in an orderly and sustainable manner, as it is difficult to demolish or reconstruct UUSs once they have been developed and utilized in a short period [10,11,12,13,14]. In cities worldwide, there is usually a plot of land (either large or small) with a high density that needs to be developed underground, and there is still much space that can be used underground compared with the surface space in most cities [15,16,17,18]. Currently, utilizing UUS usually follows the principle of “first-come-first-served”, whether for underground resource exploitation or physical structures [5,19,20]. All planners and policymakers need to be aware of the opportunities and threats of using UUS to improve urban livability and establish well-thought-out UUS planning systems [6,7,11,21].
The results of modeling the growth simulation of UUS provide a reference for scientific UUS planning and sustainable UUS infrastructure construction. The growth simulation of UUS is an essential tool and method to effectively guarantee the coordinated planning of urban aboveground–underground integrated space [9,12,22,23], the scientific and organized development of underground space and resources [24,25], and the environmental and sustainable construction of UUS infrastructure [26,27,28]. The growth simulation of UUS takes the historical UUS utilized distribution as the critical input and combines traffic conditions [29,30,31], the geographical environment [10,24,32], and socioeconomic [16,33] and other driving factors, and adopts an empirical approach to simulate the spatial and temporal development of UUS use.
The mechanism of cellular automatons (CAs) makes them appropriate for UUS growth simulation because they can describe the spatial interactions in neighboring or layered areas. A growth simulation of UUS, similar to urban space growth simulation, focuses on the self-organization and spatial evolution of UUS or urban space development, where CA models have been widely used in urban space growth simulation [34,35,36] to explore the urban expansion mechanisms of various cities [37,38,39]. CA models can also effectively aggregate various socioeconomic and geographic factors, including demographics, traffic, and location, to simulate spatial utilization dynamics by defining reasonable transition rules based on spatial interactions between cell states and regions [40,41]. In brief, CA models contain a set of cells, each of which maintains a state that may be influenced by neighboring cells [42,43,44,45]. In particular, constructing and developing UUS should meet human needs for urban living, working, and traveling activities and protect the diversity of urban ecological space by ensuring that its area is not reduced [8,11,22]. Modeling growth for UUS simulation not only excludes ecological and natural protected areas, such as water bodies and mountains, but should also include blue–green spaces (BGSs) that exist more widely in the city (e.g., urban forests, grasslands, and farmlands) [46,47].
However, no existing simulation growth model of UUS has explicitly incorporated ecological constraints into the dynamic feedback of its growing spatial configuration as it evolves. The research question in this study is two-fold: (1) How do we construct a model that can accurately simulate the process of UUS growth with ecological constraints? (2) What are the differences between the simulation growth results of urban subspace growth with and without ecological constraints? Therefore, this study aims to construct a growth simulation method for UUS under ecological constraints. The growth simulation of this method is established based on the patch-based CA (patch-CA) model, in which the ecological conservation zones (urban BGS protection areas) are based on the agent-based land allocation optimization (AgentLA) model. The spatial drivers of UUS growth simulation are determined based on the Random Forest (RF) algorithm. The novel contributions of this study, which differ from previous works, are as follows:
- To prioritize the importance of ecological conservation zoning in the future development of UUS use, the AgentLA model was used for ecological conservation zones (urban BGS protection areas) as a spatial constraint in the UUS growth simulation;
- A method based on the RF algorithm to determine the spatial drivers of UUS growth simulation was constructed based on the process and underlying mechanism of UUS development and the spatial driving factors considered in previous urban simulation studies;
- A method was constructed to simulate UUS growth based on the patch-CA model, in which the three spatial pattern types of UUS growth (filling, edge extension, and outlying) were simulated using two complementary procedures of organic and spontaneous growth in the proposed patch-CA model;
- UUS growth simulations under ecological constraints are evaluated using the Tianfu New District in Chengdu, China, as an example, and the validity and reproducibility of the model proposed in this study are verified.
The remainder of this paper is organized as follows: Section 2 provides a literature review, including a review of simulation models and constraint mechanisms of UUS growth from previous research. The framework, using the solution and proposed models, is presented in Section 3. The information and data of the study area are described in Section 4. Section 5 describes the case and corresponding calculation results, including the model parameters and UUS growth simulation results. The discussion and analysis are presented in Section 6. Lastly, Section 7 summarizes the study and presents its limitations.
2. Literature Review
2.1. Simulation Model of UUS Growth
The development of UUS utilization is always a dynamic and complex process, resulting from the constant temporal and spatial changes of natural processes and human activities [10,13,16]. In terms of the history of UUS utilization, the trend has shifted from a simple single space to a comprehensive space, such as a functional compound, network systematization, and deep layout [25,27,48]. Simultaneously, research on UUS is focusing more on its complexity and dynamic development [5,16,48,49,50,51,52].
Humans have intervened and regulated UUS development to various degrees in different periods and regions. However, the self-organization of the UUS system cannot be changed due to the uncertainty of UUS development, and because all the information on UUS development cannot be fully grasped [16,53,54]. Therefore, the UUS system can be considered a self-organization system, wherein the degree of self-organization works differently at different times and under different policy contexts.
The CA model has been proven to be an effective tool for simulating UUS development because of its high degree of consistency in dynamics and self-organization compared with the UUS system. The CA model is a discrete-time dynamic system defined in a discrete lattice state space that can simulate the spatio-temporal evolution of complex systems [55,56,57,58]. CA models are effective because of their flexible structure and support for bottom-up simulations [42,59,60]. CA models [34,35,36,37,38,39,40,41] have been widely used in urban growth simulation, land-use change (LUC), and analysis over the past two decades because they have the advantage of representing the drivers of urban development through transition rules and reflecting the spatial externalities of urban sprawl through neighborhood rules, as illustrated in Table 1.
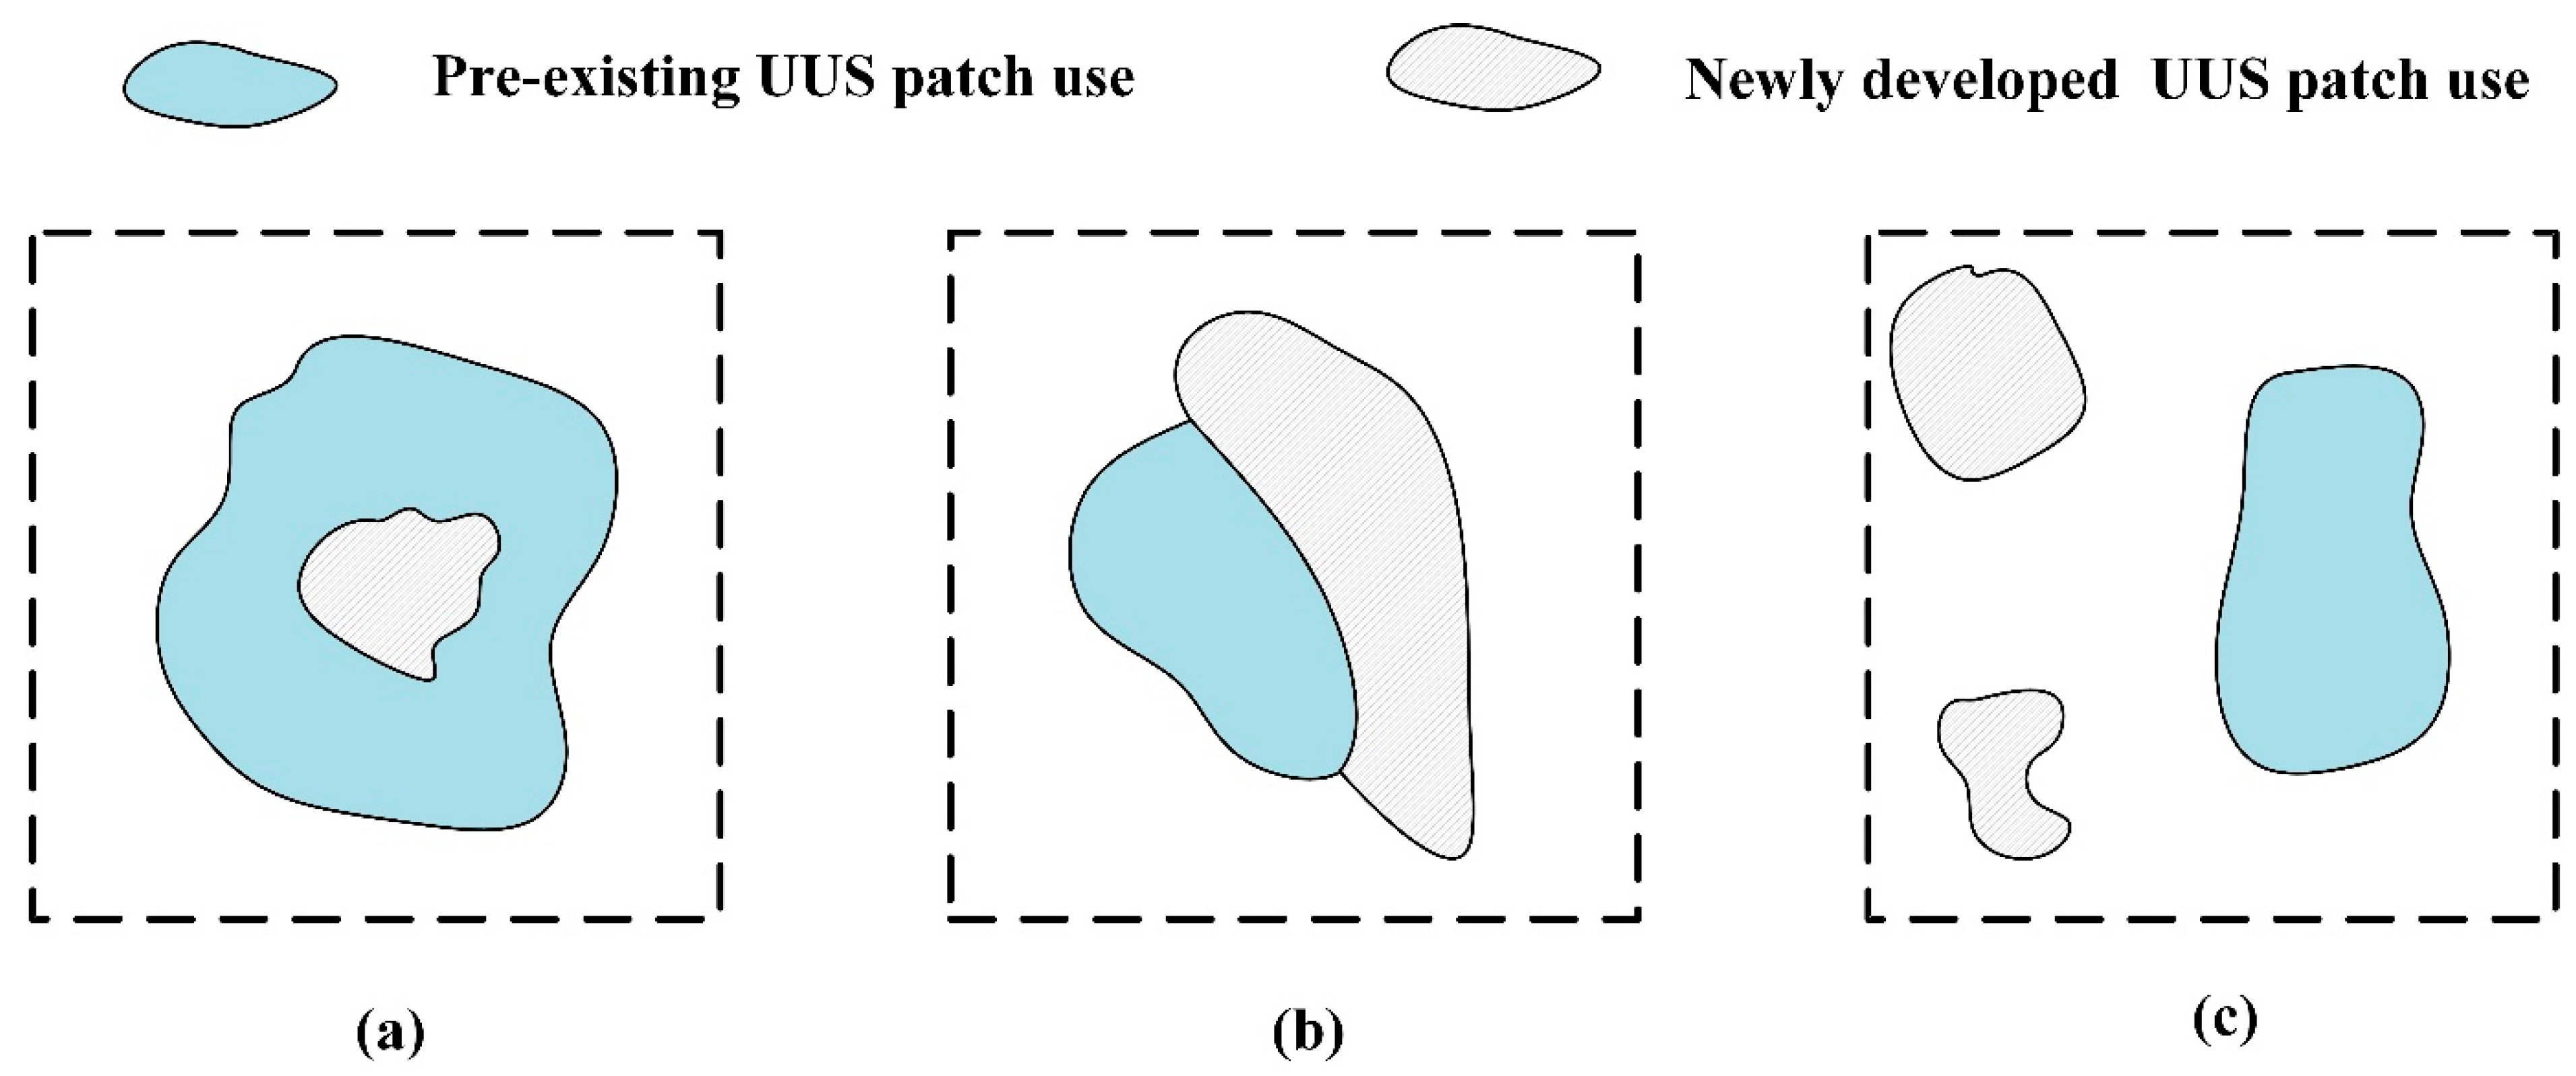
Simultaneously, UUS development is a complex and dynamic system driven by various natural, social, and economic factors. Therefore, the characteristics of CA models and the above studies (see Table 1) demonstrate their similarity to the simulation of UUS development processes. Additionally, patch-based CA models [61,62,63] can simulate patch or parcel-based changes to reflect realistic UUS use change patterns, unlike traditional CA models that simulate cell-based changes. The UUS growth simulation in this study can be divided into three basic spatial modes (as illustrated in Figure 1): infill, edge expansion, and outlying. These three modes are simulated in the proposed CA model using two complementary procedures: organic and spontaneous growth [56,61,62,64,65,66]. The infilling and edge expansion that occur during UUS growth (which can be simulated by organic growth) refer to the expansion of the existing UUS patches that convert adjacent non-UUS cells by combining the neighborhood effect (Equation (9)) with the suitability of UUS occurrence in the spatial configuration module. Outlying UUS growth (which can be simulated by spontaneous growth) is intended to simulate leapfrog development by growing new patches that are not connected to existing UUS areas. New patches are generated as organic extensions in future UUS development, and existing and newly generated patches are combined over time to produce a diverse UUS development pattern.

Figure 1.
Diagram of UUS growth processes; (a) organic growth of UUS use: infilling; (b) organic growth of UUS use: edge expansion; (c) spontaneous growth of UUS use: outlying.

Table 1.
A representative list of literature on the urban growth simulation of CA models.
Table 1.
A representative list of literature on the urban growth simulation of CA models.
| Number | Researcher(s) | Year(s) | Model(s) | Field of Study | Case Study |
|---|---|---|---|---|---|
| 1 | Mitsova et al. [44] | 2011 | CA-Markov chain model | Urban growth projections at a regional scale | Twenty-seven counties in Ohio, Indiana, and Kentucky, USA |
| 2 | Sakieh et al. [34] | 2014 | CA model | Simulating urban expansion and scenario prediction | Karaj City, Iran |
| 3 | Deep et al. [43] | 2014 | CA-Markov chain model | Measure the urban sprawl | Dehradun City, India |
| 4 | Guan et al. [35] | 2015 | Hybrid parallel CA model | Urban growth simulation | California, USA |
| 5 | Liao et al. [36] | 2015 | Logistic-CA model | Land-use simulations | Xiamen City, China |
| 6 | Dahal et al. [42] | 2015 | An irregular CA model | Urban land-use dynamics | San Marcos, Texas, USA |
| 7 | Gounaridis et al. [37] | 2019 | Random Forest—CA model | Explore future land use/cover change | Attica, Greece |
| 8 | Liao et al. [56] | 2019 | Logistic regression-ordered weighted averaging-CA model | Urban sprawl scenario simulations | Xiamen City, China |
| 9 | Shu et al. [38] | 2020 | Traditional logistic CA model | Simulate the urban growth | Tongshan County, China |
| 10 | Chen et al. [39] | 2020 | Geographically weighted regression—CA model | Simulate the urban expansion | Chongqing City, China |
| 11 | Roodposhti et al. [45] | 2020 | CA land-use models | Land-use change (LUC) | Ahvaz, Iran |
| 12 | Cao et al. [55] | 2020 | Logistic-CA model | Urban spatial growth | Hangzhou City, China |
| 13 | Zhou et al. [58] | 2020 | Random Forest and CA-Markov model | Multi-scenario simulation of urban land change | Shanghai City, China |
| 14 | Dinda et al. [40] | 2021 | CA-Markov Chain model | Urban growth pattern and loss in urban green space | Kolkata, India |
| 15 | Wang et al. [59] | 2021 | SM-Logistic-CA model | Simulating urban land growth | Beijing City, China |
| 16 | Liang et al. [62] | 2021 | Patch-generating land-use simulation model | Drivers of land expansion and landscape dynamics | Wuhan City, China |
| 17 | Liu et al. [41] | 2022 | ESP-FLUS Model | Urban growth boundaries | Min Delta Region, China |
| 18 | Jin et al. [57] | 2023 | CA-based Future Land Use Simulation (FLUS) model | Land-use change (LUC) | Myanmar |
| 19 | Lin et al. [63] | 2023 | Novel landscape-driven patch-based CA model | Urban land-use changes | Guangzhou City, China |
2.2. UUS Growth Constraint Mechanisms
Constraint mechanisms are a critical element of urban CAs [67,68], and cells belonging to protected or planned UUS areas are subject to strict management development restrictions. Many scholars have carried out simulations of urban CAs based on constraint mechanisms to reflect the different constraints (e.g., water bodies, mountains, lakes, forests, and government policies) on UUS or land-use changes [56,69,70,71,72,73,74]. The cited studies demonstrate that the incorporation of ecological constraints into scenario simulations of UUS CAs produces significant results.
Ecological constraints have a significant role in simulating UUS growth, and a remarkable compensatory effect exists between these ecological landscapes composed of urban BGSs and UUS development. Several recent studies have confirmed that urban BGSs, comprising waterbodies, urban parks, forests, grasslands, and other green spaces, are the main sources of the urban ecological carbon sink that has strong carbon sequestration effects and capacity [75,76,77]. The plants in urban BGSs absorb CO2 from the air through photosynthesis, which is then stored in the form of biomass, thus accumulating organic carbon [46,76,78,79]. The storage of carbon in vegetation and soil creates sustainable ecosystems in cities’ BGSs [80,81].
Three constraints—urban construction land boundaries, UUS restricted development boundaries (mainly considering geological constraints such as mountains and water systems), and ecological protection areas—hinder UUS development. In particular, the restricted boundaries of urban BGSs are considered to be constraints for ecological protection areas. In this study, an AgentLA model was applied to solve the ecological zoning problem because of the effectiveness and computational efficiency of AgentLA models compared with traditional methods [82,83]. The AgentLA model was utilized to generate a layout of the protected areas of urban BGSs, which were further incorporated into a patch-CA model as spatial constraints to simulate future UUS growth.
3. Methodology
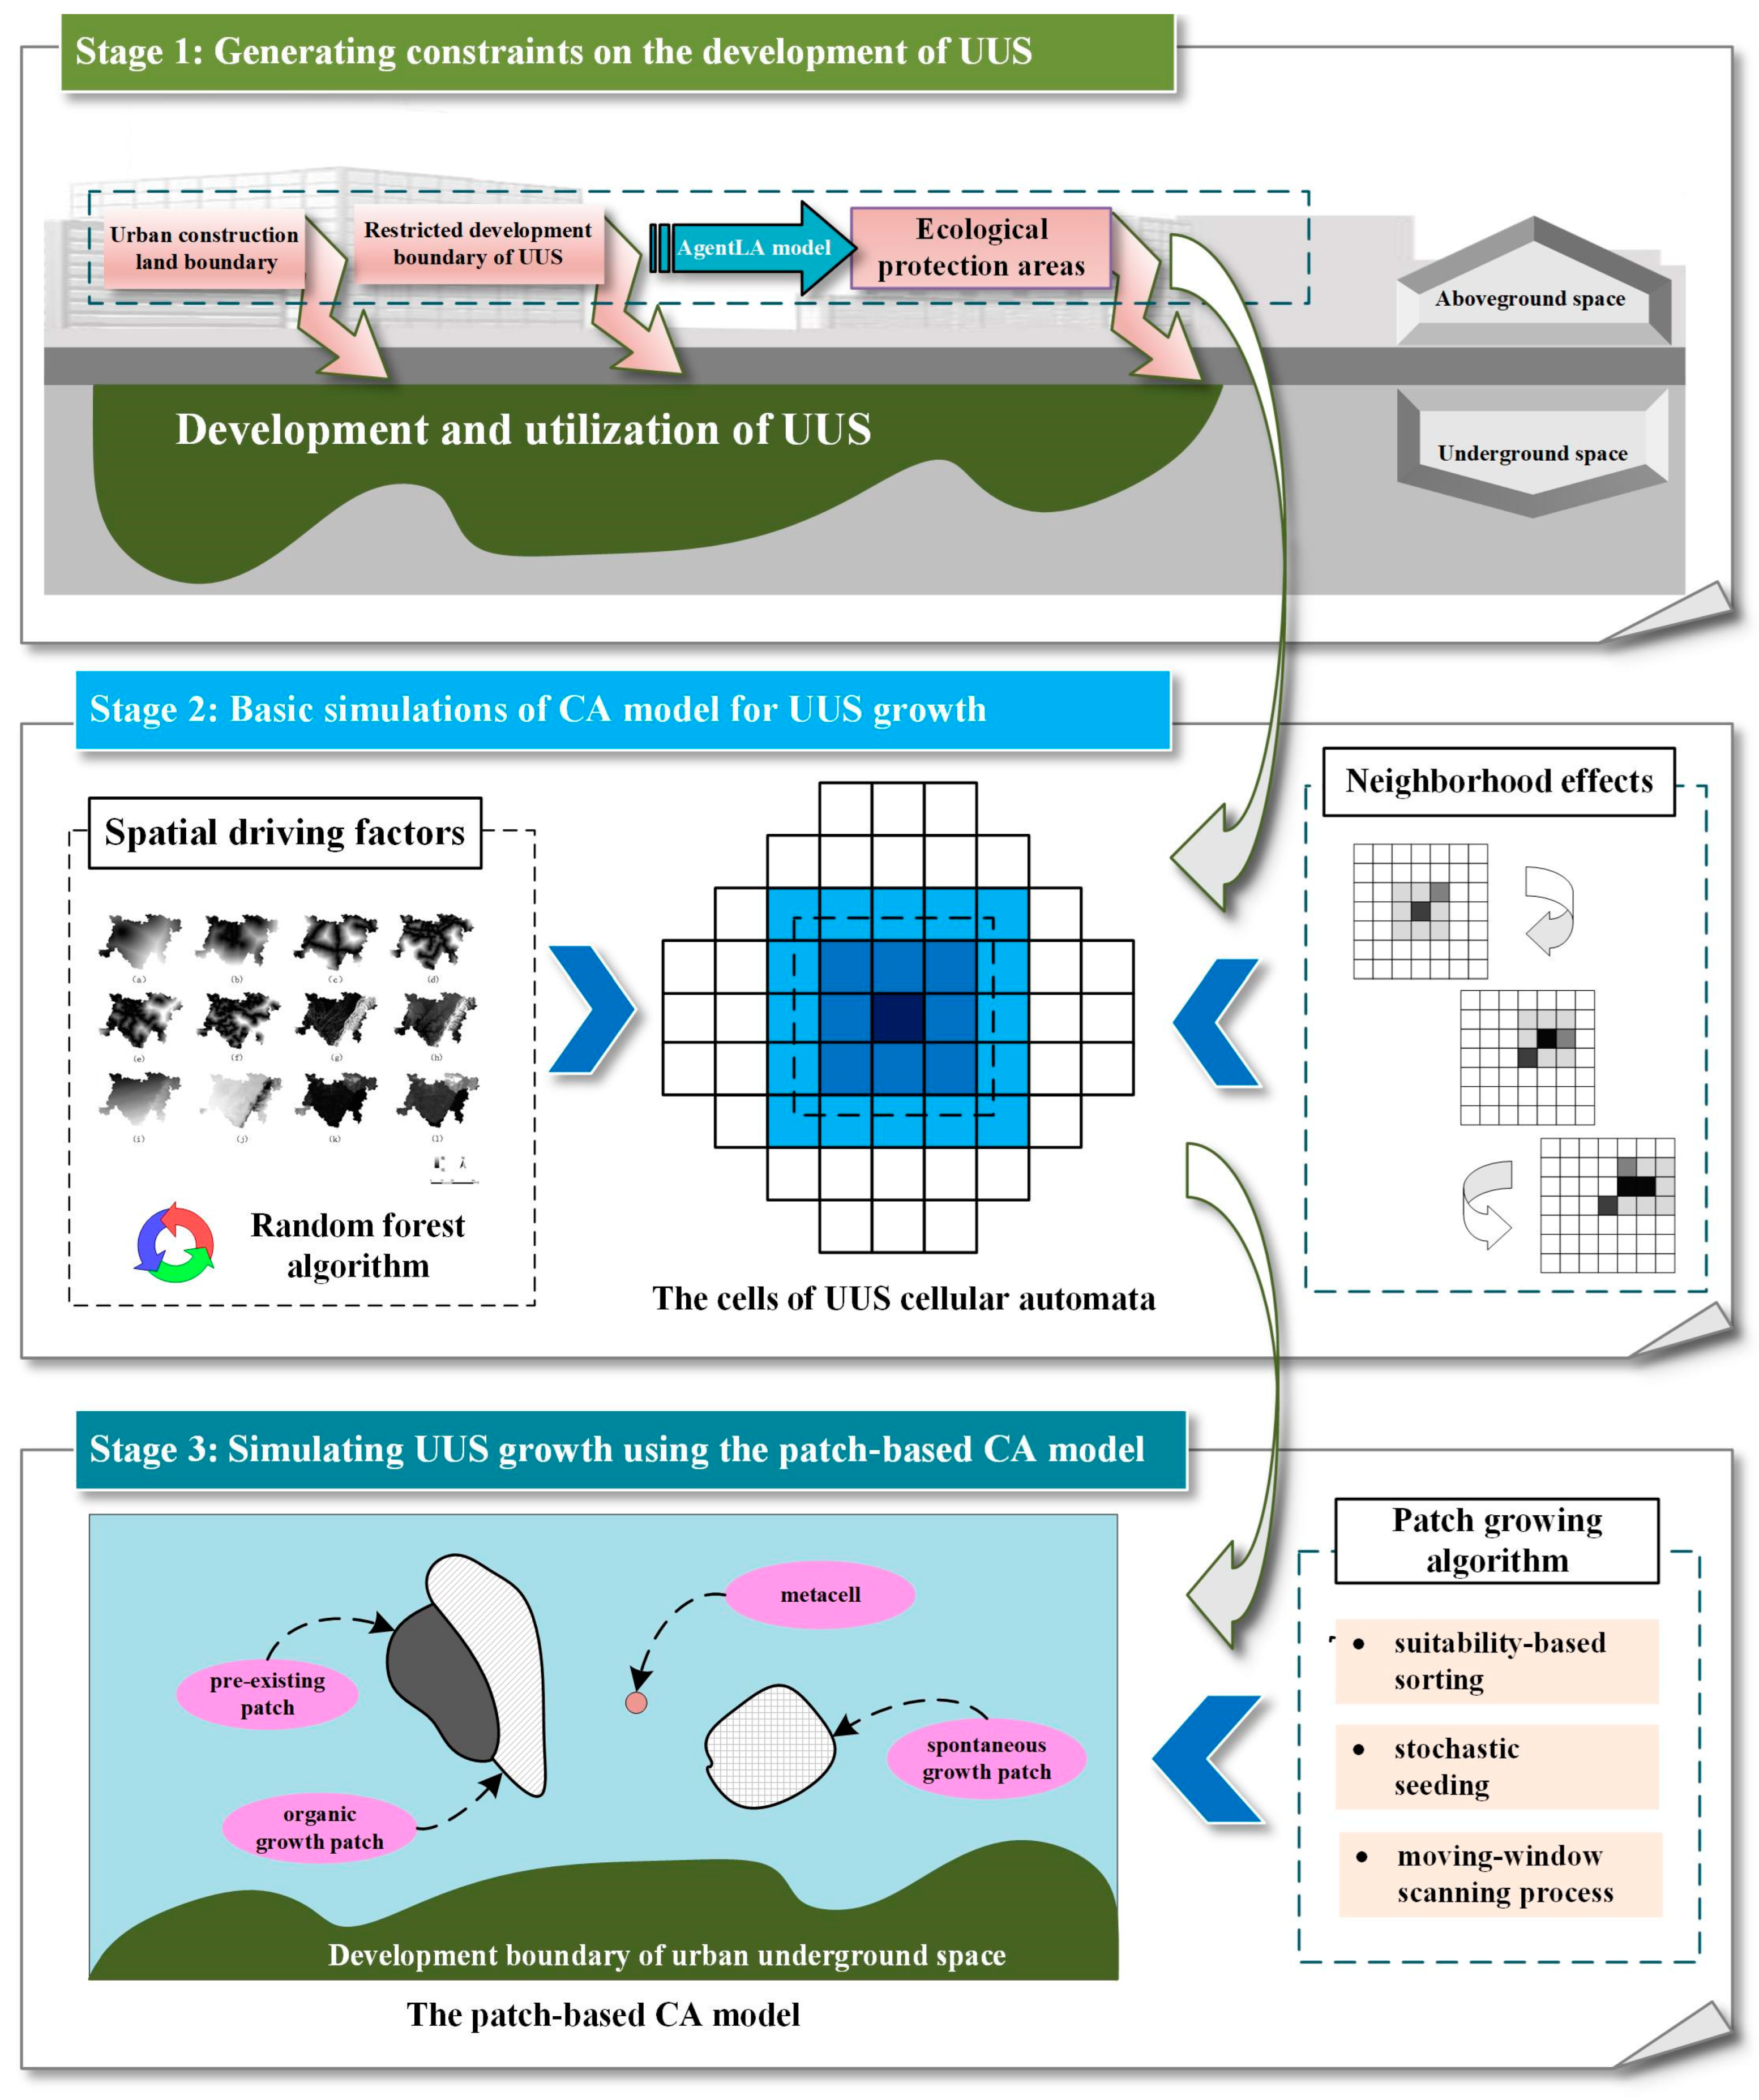
This analysis of the simulation process of UUS growth can be summarized using three main stages (see Figure 2). The first stage is the generation of UUS development constraints: urban construction land boundaries, restricted UUS development boundaries, and ecological protection areas (urban BGSs). The restricted boundaries of urban BGSs are generated using an AgentLA model (as detailed in Section 3.1). The second stage (see Section 3.2 for details) is the basic simulation for constructing the CA model of UUS growth. The main task of this stage is to retrieve the transition rules that determine whether the cell state changes. The transition rules include spatial drivers as well as neighborhood effects. The third stage (as detailed in Section 3.3) is the construction of the UUS growth simulation using the patch-based CA model, which includes the following processes: suitability-based sorting, stochastic seeding, and the moving-window scanning process.
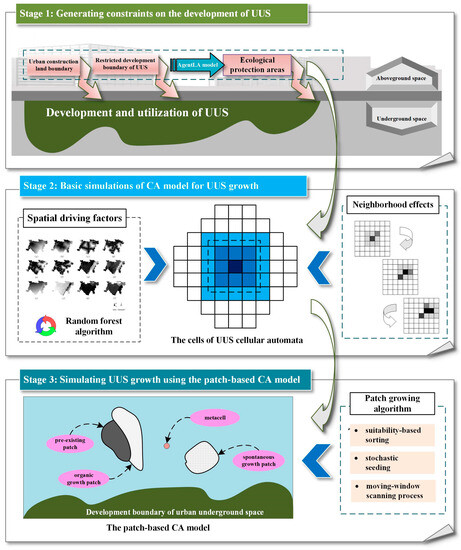
Figure 2.
Conceptual framework of simulations of UUS growth.
3.1. Generating UUS Development Constraints
Urban construction land boundaries, restricted UUS development boundaries (mainly geological constraints such as mountains and water systems), and ecological protection areas, are considered to be constraints on UUS development. Urban construction land and UUS restricted development boundaries are specifically identified by urban planning and geological survey departments; thus, in this study, these two UUS restricted areas are assumed to be clearly and specifically located in urban space. The AgentLA model was utilized to generate ecological reserves as a spatial constraint for the UUS growth simulation; that is, no development is allowed within the protected urban BGSs.
The AgentLA model optimized the spatial pattern of ecological reserves (urban BGS protection) to maximize the total ecological compactness and suitability. To implement the AgentLA model, the amount of available land to be protected within urban BGSs (i.e., the number of plots) should be initially specified. The model then randomly distributes individual agents (i.e., mobile units) in space. The agent’s population is equal to the given amount of land protected within the urban BGSs. Subsequently, each agent makes the decision to iteratively relocate based on the fitness function [83]:
where denotes the fitness at cell ; denotes the value of the ecological suitability in cell ; denotes the neighborhood condition; and denote the weights of and , respectively; denotes the Moore neighborhood of cell ; = 1 if cell is already occupied by an agent; otherwise, it equals 0; denotes the distance between cell and ; and denotes a compensation parameter that can be taken between .
The fitness of each agent first evaluates the current position (). Subsequently, it searches for the vacant position with the highest fitness among the neighboring positions adjacent to cell and can be denoted as . Meanwhile, there is a randomly selected empty space from the whole cell space, which has at least one agent in its 3 × 3 neighborhood-adjacent position. The fitness of this position is denoted as . The agents stay at or move to one of these positions with the highest fitness by comparing the values of , , and . During each iteration, the spatial pattern formed by the decisions of all agents is evaluated using the function:
where and denote the agent’s scores of the ecological compactness and suitability of the currently formed pattern; denotes the potential maximum total ecological suitability value given the land quantity; denotes the total perimeter of patches formed by the agents; and and denote the perimeters of a cell and individual agents (i.e., perimeter per cell × cell count), respectively, given the land quantity. If the value converges to a stable level, the model iteration is terminated to obtain the best model for the environmental protection area.
3.2. Basic Simulations of the CA Model for UUS Growth
The urban CA, in general, can be described using the following equation [36,40,55,56,84], and the meta-CA for UUS growth simulation also obeys such a definition:
where and denote the states of cell at the moment of and , respectively; denotes the neighborhood effect; denotes a constraint function of urban expansion; denotes the total number of cells in the whole cell space; denotes the transition rules; and denotes the number of iterations of the CA simulation.
The transition rules determine the state changes of cells within urban CAs, and many studies have applied transition probabilities to represent the chance of cellular state changes and established corresponding transition rules [36,85,86]. The variation in cell state is thought to be determined by the local transition probabilities influenced by spatial drivers [56,83]. According to the process and underlying mechanism of UUS development [5,6,16,26] and the spatial driving factors considered in previous urban simulation studies [63,83,87,88], distance to train station (a), distance to metro station (b), distance to express road (c), distance to main road (d), distance to subsidiary road (e), distance to by-pass road (f), slope (g), elevation (h), average rainfall (i), average temperature (j), population (k), and GDP (l) were used as spatial driving factors of the UUS simulations.
The contribution of various spatial drivers to the local transition probability is determined using several methods, such as expert experience, spatial statistics, and artificial intelligence [56,87,89]. As a tree-based algorithm, an RF algorithm demonstrates advantages in dealing with interactions among predictors, overcoming overfitting problems, and handling high-dimensional data sets [90,91]. This study uses the importance of the RF as well as its associated Gini feature to select the factors that can influence the changes in UUS. By comparing the UUS utilization patterns, the constant pixels are 0, and the changed pixels are 1. As the binary values of the pixels are set as the classification criteria, the 12 spatial driving factors are normalized and arranged in a set of random trees to evaluate the classification results. Thus, the variable with higher Gini feature importance has a greater impact on UUS utilization changes and vice versa. The Gini feature importance was calculated as follows [41]:
where denotes the Gini importance of variable ; denotes the number of trees; denotes all trees in the forest; denotes the out-of-bag error of tree before variable permutation; and denotes the out-of-bag error of tree after variable permutation. The factorial selection procedure was implemented in R studio using an RF package.
Based on the above analysis, the conversion probability calculation formula is established as follows:
where denotes the local development potential of cell ; denotes the th spatial variable; denotes the spatial driving factors; = a, b, c, d, e, f, g, h, i, j, k, and l correspond to distance to train station (a), distance to metro station (b), distance to express road (c), distance to main road (d), distance to subsidiary road (e), distance to by-pass road (f), slope (g), elevation (h), average rainfall (i), average temperature (j), population (k), and GDP (l), respectively; and denotes the corresponding weight coefficient.
The neighborhood effect is a central component of the urban CA. It embodies the essence of “bottom-up” self-organized evolution in CAs. Generally, the more developed the cells in a neighborhood, the more likely the central cell will be transformed into UUS use. Most studies use Von Neumann or Moore neighborhoods to construct neighborhood rules. A 3 × 3 Moore neighborhood was used in this study to calculate the effect of adjacent developed cells on the development probability of the central cell [43,45,92]:
where denotes the transition probability estimated using the neighborhood function and is calculated based on the number of urban UUS cells in the 3 × 3 kernel neighborhood.
Besides the influence of various drivers and neighborhood effects, the urbanization process is usually affected by some stochastic contingencies that make the expansion of UUS uncertain. Consequently, stochastic factor mechanisms and development constraints are introduced in the UUS CA model, and the final transition probability that determines the change in the central cellular state is expressed as follows [34,35,56,84]:
where denotes the probability under which may change its state from non-developed to developed in the -th iteration of the UUS cellular automaton; denotes a constraint function; denotes a random disturbance factor, wherein denotes a random value that ranges from 0 to 1; and denotes a parameter for controlling the degree of random interference that generally ranges from 1 to 10.
3.3. Simulating UUS Growth Using the Patch-Based CA Model
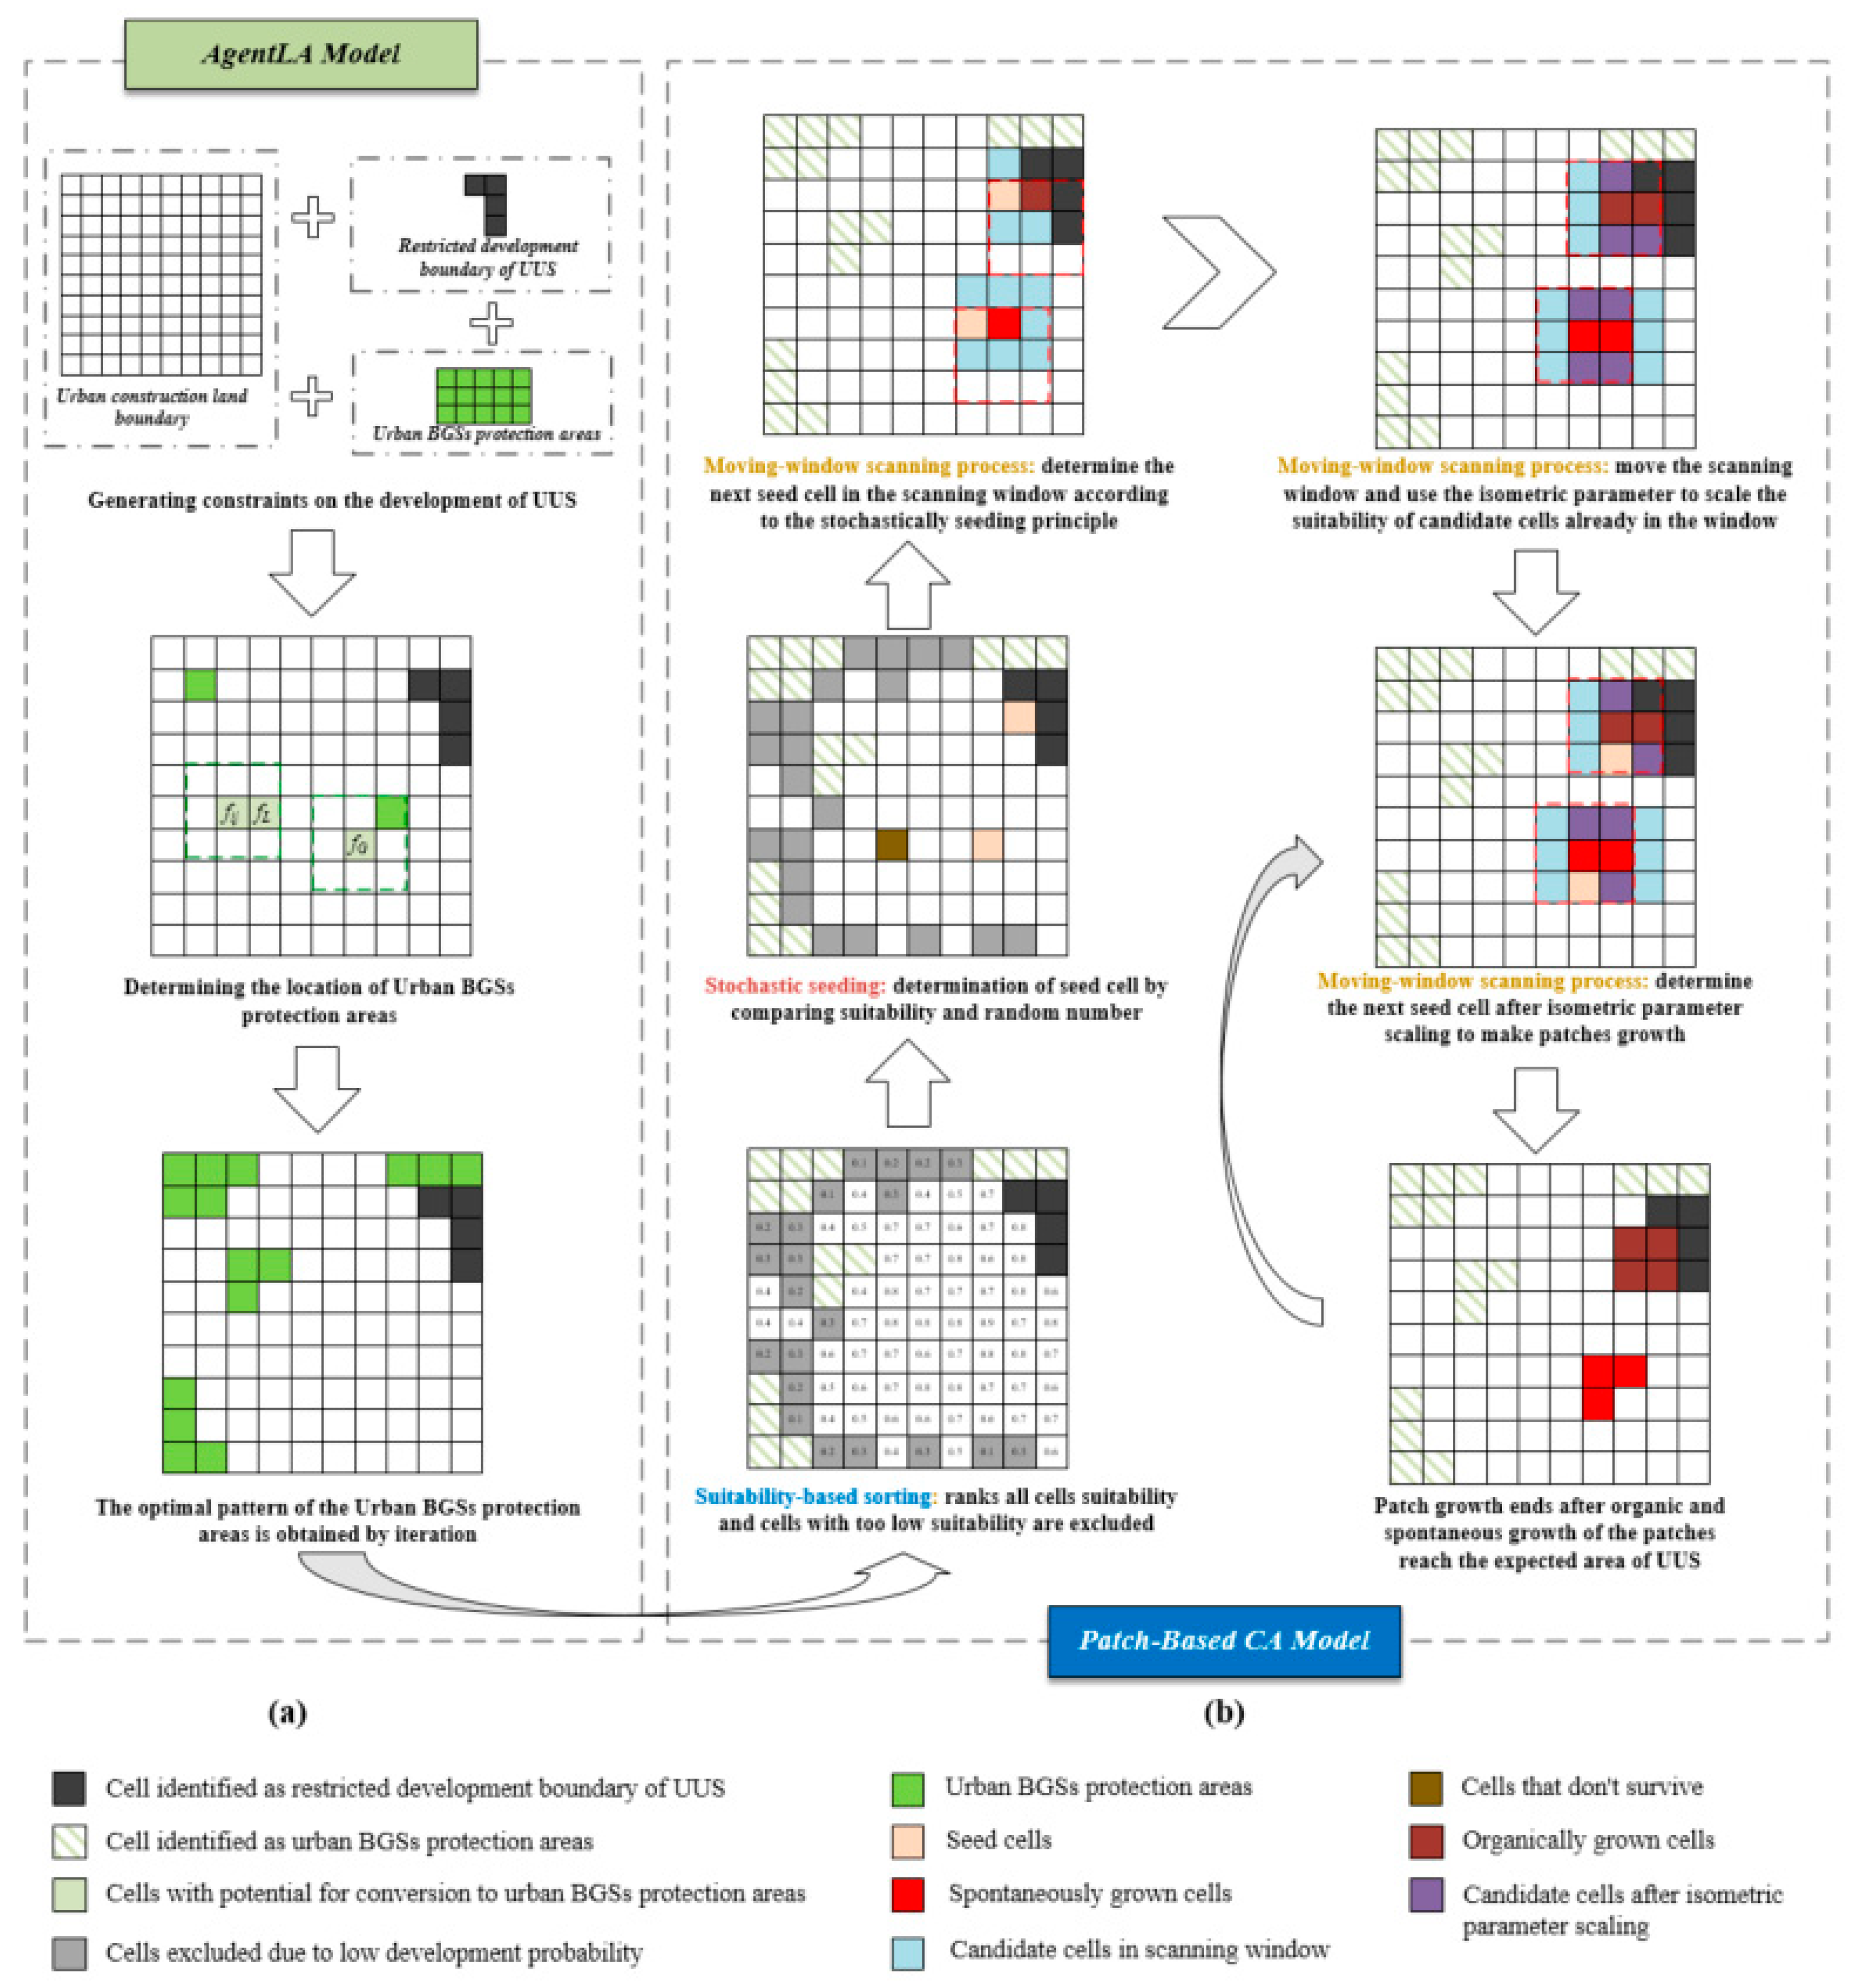
Two complementary procedures (organic and spontaneous growth) of the patch-based CA model were used in this study to simulate three UUS growth types: infilling, edge expansion, and outlying (as illustrated in Figure 1). The AgentLA model was used to generate ecological reserves as spatial constraints for the UUS growth simulation (as illustrated in Figure 3a) before using the patch-based CA model to simulate UUS growth. The patch growing algorithm [61,63,65,66,83,87] used to simulate three UUS growth types was mainly achieved as illustrated in Figure 3b. An operational code of the patch-based CA Model can be downloaded from the following webpage: https://github.com/HPSCIL/Patch-generating_Land_Use_Simulation_Model (accessed on 5 September 2023).
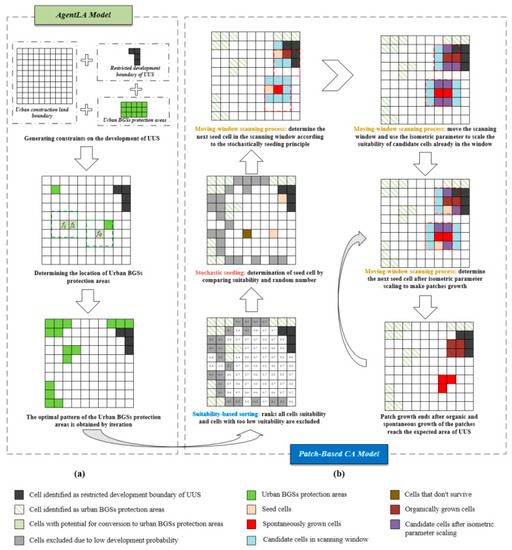
Figure 3.
Schematic of simulating the growth of UUS using a patch-based CA model.
- Suitability-based sorting: The patch growth algorithm ranks the suitability of all cells according to Equation (10). The corresponding subset of cells with the highest suitability is retained according to the expected area of UUS, and the cells with very low suitability are excluded.
- Stochastic seeding: Stochastic seeding is performed on a subset of the retained cells of UUS. A stochastically selected cell is tested for stochastic seeding; the selected cell is used as the seed cell if its suitability is greater than a random number uniformly distributed in the interval of [0, 1], and the cell is accepted as a seed to start a new patch. Otherwise, the stochastic seeding test continues to iterate until a seed cell appears. For the two complementary growth procedures of UUS, we treat the seed cells connected to the built-up area as organically grown cells and the seed cells not connected to it as spontaneously grown cells.
- Moving-window scanning process: A 3 × 3 cell is chosen as the scanning window size, with the seed cell as the center and the other cells within the window as candidates for the self-growing of new patches. The candidate cells determine the next seed cell according to the stochastic seeding principle, while the previous seed cell transforms into a newly grown patch. Then, the scanning window is moved to the center of the new seed cell and continues stochastic seeding within the window to grow patches until the area reaches the expected area of UUS and the self-growing of patches ends. Notably, when the scanning window moves to the new seed cell while the candidate cells are already within the window, then the patch growth is made more compact by multiplying the isometric parameter in the interval of [0, 2] to narrow or amplify its adaptation.
3.4. Validation of Model Accuracy
To validate the accuracy of the data of the UUS growth simulation of this case study, and to enable their use for UUS growth prediction under different scenarios for future years, three parameters—the OA, Kappa coefficient, and figure of merit (FoM)—were selected for the modeling accuracy assessment [41,56,93].
OA is evaluated based on whether each cell has been correctly assigned a value of 0 or 1 [56,88,94], as calculated using the following formula:
where True Positive (TP) denotes that the cell state is correctly classified as a positive (1) sample—that is, the prediction is assigned a value of 1 and the cell is actually assigned a value of 1 as well; True Negative (TN) denotes that the cell state is correctly classified as a negative (0) sample—that is, the prediction is assigned a value of 0 and the cell is actually assigned a value of 0 as well; False Positive (FP) denotes that the cell state is incorrectly classified as a positive (1) sample—that is, the prediction is assigned a value of 1 but the cell is actually assigned a value of 0; False Negative (FN) denotes that the cell state is incorrectly classified as a negative (0) sample—that is, the prediction is assigned a value of 0 but the cell is actually assigned a value of 1.
The Kappa coefficient is used as a metric of the CA model to measure the agreement between the simulation and the reference. The Kappa coefficient varies from 0 to 1, with larger Kappa coefficients representing higher overall simulation accuracy; 0.75 is often considered to be the threshold for high simulation accuracy [93,95] and is calculated as follows:
where denotes the OA as the sum of the number of correctly classified samples in each category divided by the total number of samples; denotes the sum of the product of the number of true samples of each type and the number of predicted samples, divided by the square of the total number of samples (see Equation (13) for the calculation); and denotes the number of metacell samples.
Besides the OA and the Kappa coefficient, the FoM was used to assess the accuracy of the simulated changes. Larger FoM values demonstrate more accurate simulations. In theory, there is no fixed range of FoM values, and most FoMs reported in previous studies are below 0.3 [41,61,96]. The FoM is calculated as follows:
where denotes the pixel numbers with an accurate prediction of UUS growth; denotes the numbers that had an observed change but were predicted as a persistence of UUS growth; denotes the numbers that had an observed persistence but were predicted as a change in UUS growth; and denotes the numbers that had an observed change but were predicted as changing to an incorrect category of UUS growth.
4. Information and Data of the Study Area
4.1. Study Area
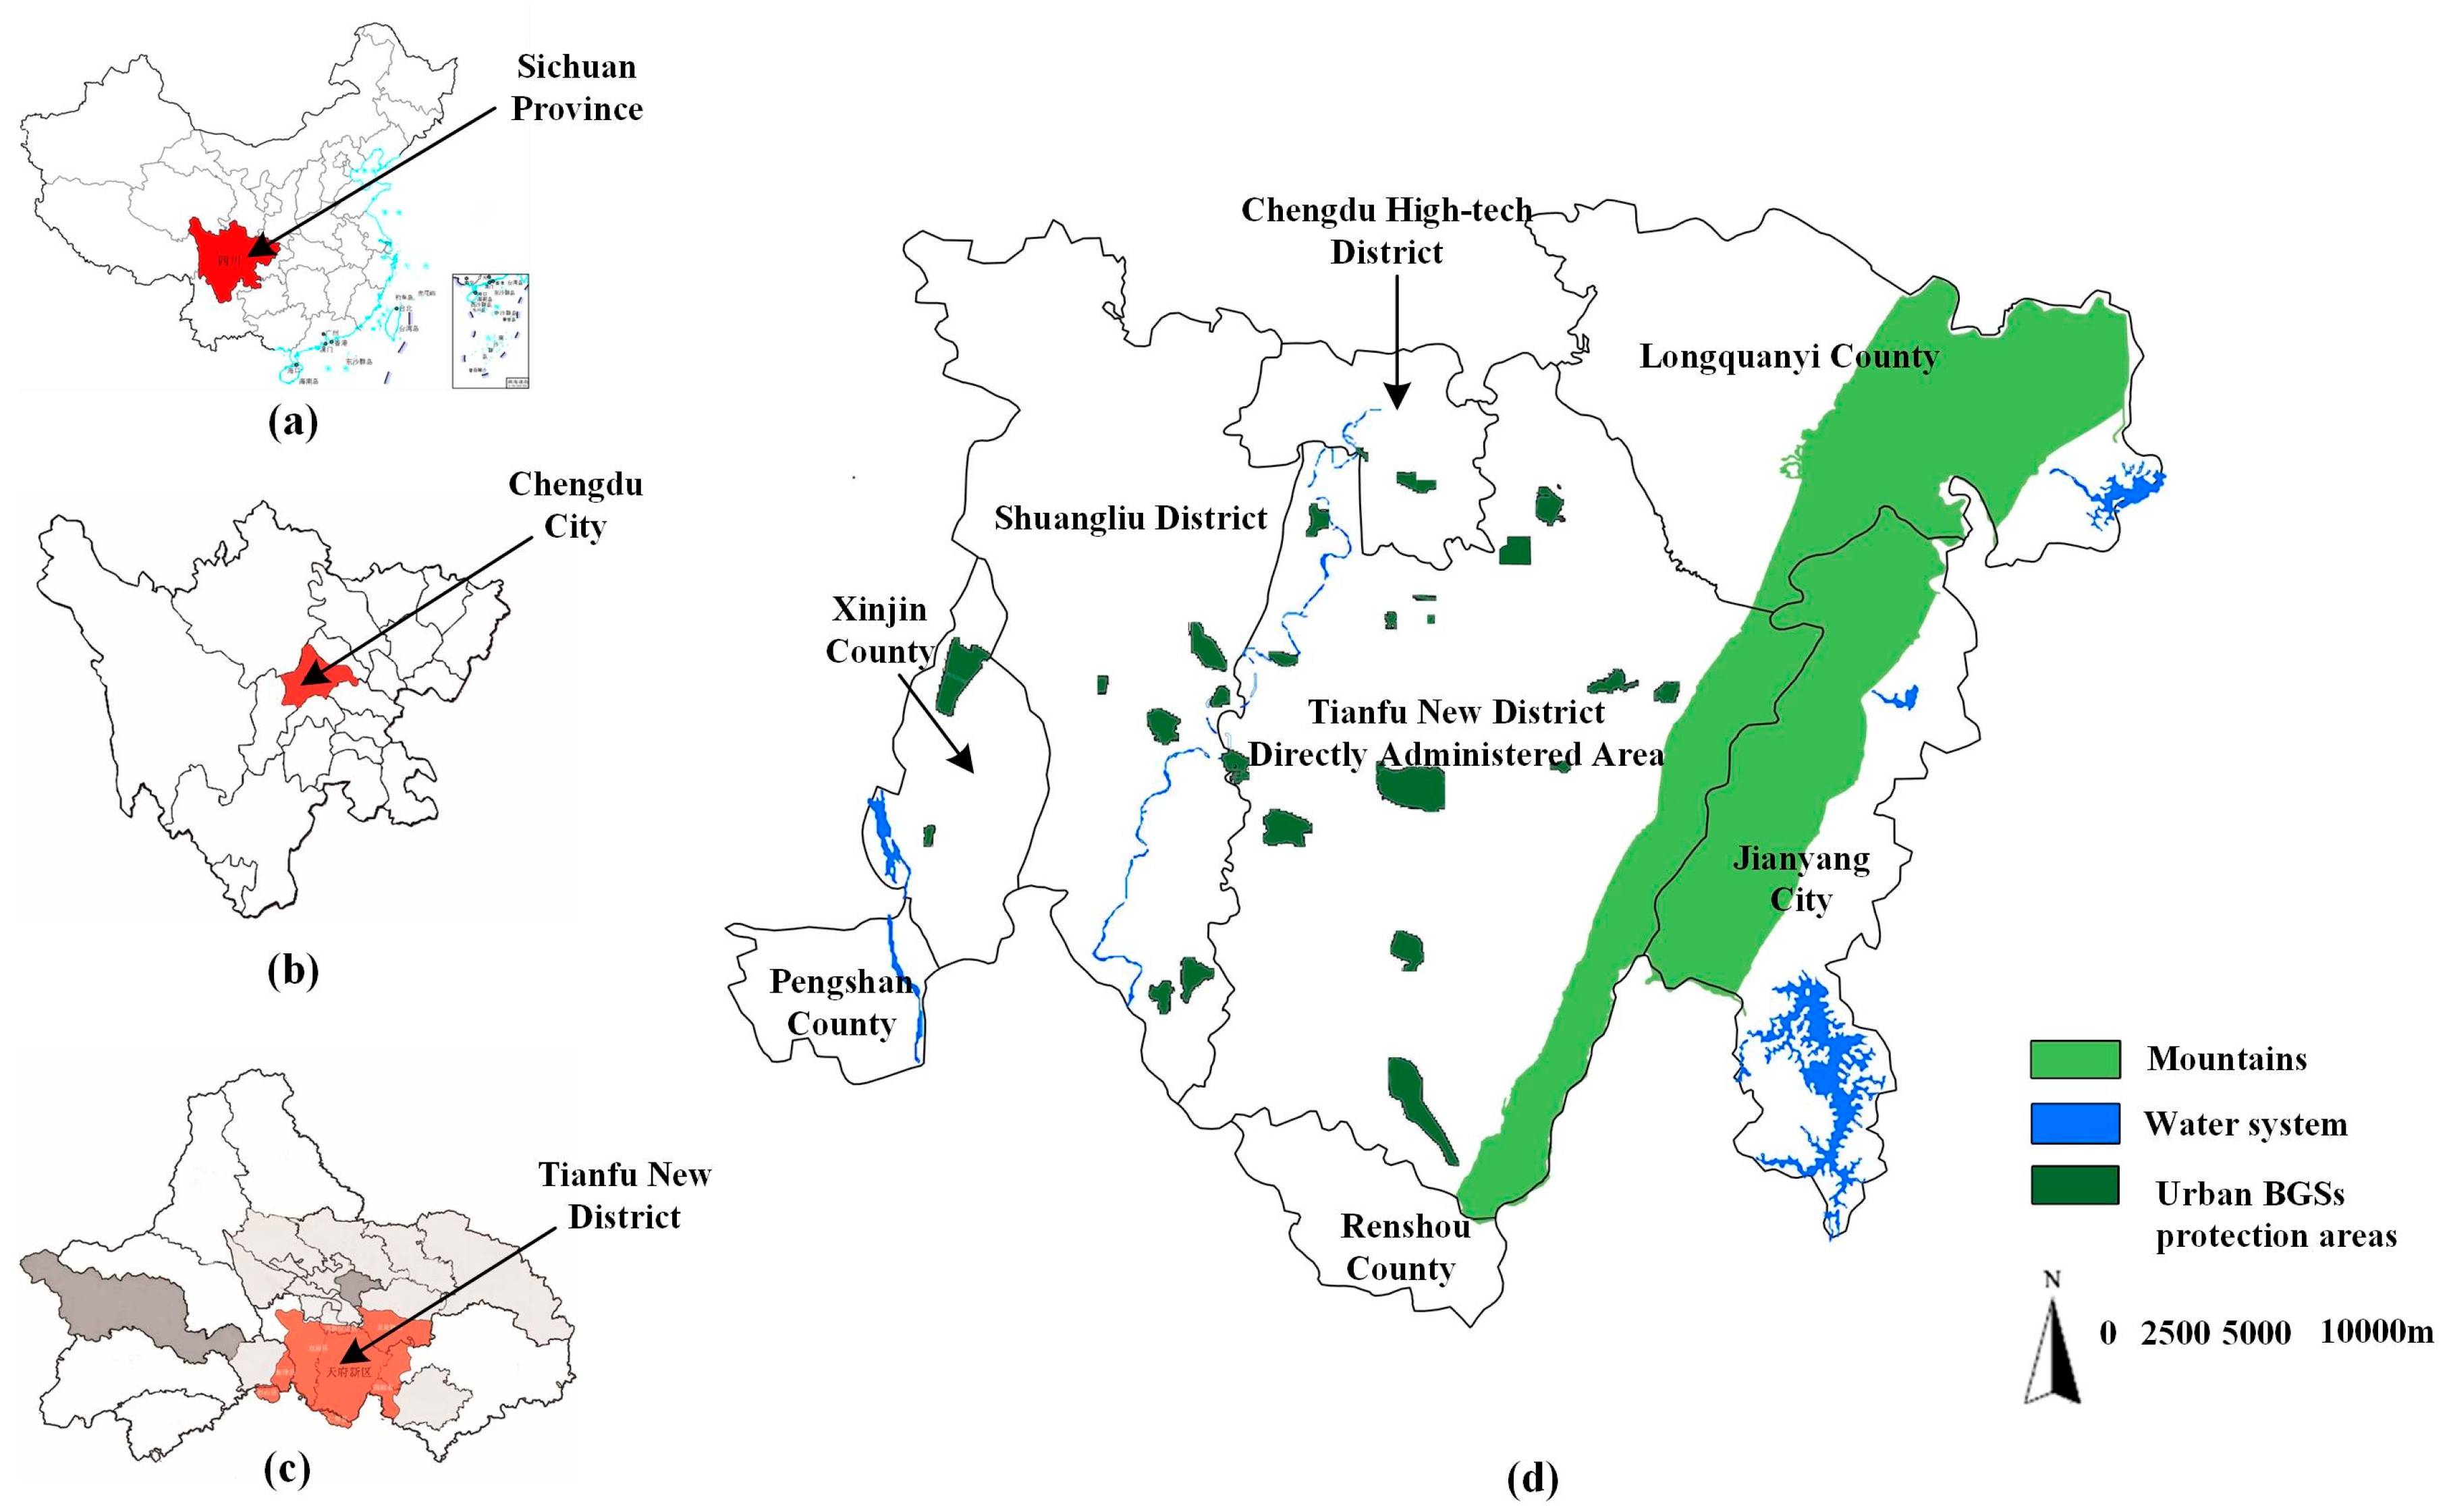
The study area of this paper is Tianfu New District, which is a national-level new area in Chengdu City, Sichuan Province, China. Among them, Tianfu New District includes the Tianfu New District Directly Administered Area, the Chengdu High-tech District, Shuangliu District, Longquanyi County, Xinjin County, Jianyang City (part of the area), Pengshan County, and Renshou County (part of the area). The specific location of the area is illustrated in Figure 4. Chengdu City is located in the central part of Sichuan Province and is its capital. It is an important city in western China. Chengdu City was the first demonstration area for park city construction in China. The government of Tianfu New District, which is a part of Chengdu City, endeavored to build a park city that fully practiced the new development concept. In Tianfu New District, the total planning area is 1578 square kilometers, the urban population will be controlled at 5.8–6.3 million people by 2030, and the various ecological land is about 928 square kilometers, including about 90 square kilometers of green space; the green area per capita can reach 15 square meters.
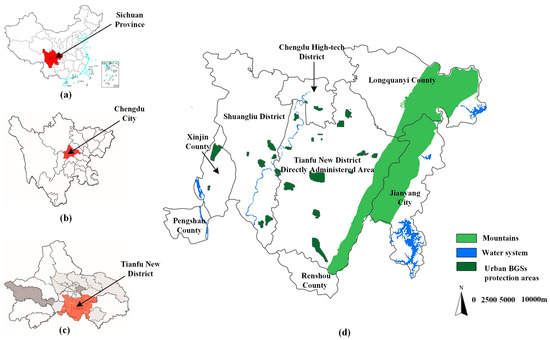
Figure 4.
Map of the study area; (a) Sichuan Province in China; (b) Chengdu City in Sichuan Province; (c) Tianfu New District in Chengdu City; (d) Tianfu New District in this study.
4.2. Experimental Data
The data of Tianfu New District in this study were mainly obtained from different local government departments’ reports in Chengdu, including the “Territorial and Spatial Master Plan of Chengdu Directly Administered Area of Tianfu New District (2019–2035)”, the “Master Plan of Sichuan Tianfu New District (2010–2030)”, the “Chengdu Statistical Yearbook 2021”, “Park City Construction in Chengdu Directly Administered Area of Tianfu New District of Sichuan (2021–2025)”, and other reports and related atlases. In addition, web crawler and remote sensing data were included, which are categorized and organized as follows:
- Data on urban planning land, such as study area boundaries, the area of building land and its spatial distribution, and land-use types and their spatial distribution;
- Data on UUS planning, such as the area and spatial distribution of UUS development and the visionary planning situation of UUS;
- Geographic information-related data, such as slope, elevation, aspect, average rainfall, and average temperature data;
- Transportation-related data information, such as the spatial distribution of subway stations and lines, the location of train stations, the spatial distribution of highway lines, and the spatial layout of city roads.
Land-use data for the study area were obtained from the Resource and Environment Science and Data Center in China (http://www.resdc.cn (accessed on 18 July 2023)), which is classified into six main categories: arable land, forest land, grassland, water bodies, built-up areas, and unused land. The vector road network data were obtained from OpenStreetMap (OSM). Population and GDP data were obtained from the Chengdu Statistical Yearbook 2021. Elevation data were obtained from Google Earth using BIGEMAP software, elevation maps (dem files) were downloaded, and slope data were obtained from a DEM using ArcGIS software. The climate-related data were obtained from the Geographic Remote Sensing Ecology Network (http://www.gisrs.cn (accessed on 18 July 2023)). To facilitate subsequent data processing, we uniformly converted the various types of data in Table 2 into vector data. The spatial coordinate system and resolution (300 m), and the corresponding Euclidean distance and point density, were calculated from the road network and point-of-interest data, and the spatial driving factors for the study of regional UUS growth simulation were constructed as illustrated in Figure 5.
Table 2.
List of data sources for UUS growth simulation.
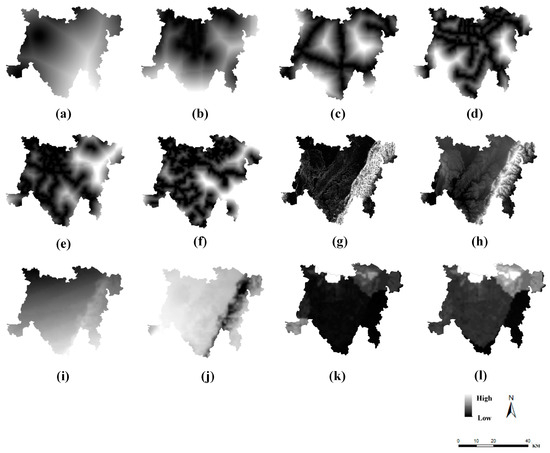
Figure 5.
The spatial driving factors for the study of regional UUS growth simulation; (a) distance to train station; (b) distance to metro station; (c) distance to express road; (d) distance to main road; (e) distance to subsidiary road; (f) distance to by-pass road; (g) slope; (h) elevation; (i) average rainfall; (j) average temperature; (k) population; (l) GDP.
5. Implementations and Results
5.1. Setting of Model Parameters
The sample data set was divided into training data (from 2010 to 2015) and validation data (from 2016 to 2020), as the validation data were used to evaluate the prediction accuracy to ensure the accuracy and stability of the model. The overall accuracy (OA) and Kappa coefficient values (as illustrated in Equations (11) and (12)) increase slightly as the neighborhood size increases from 3 × 3 to 7 × 7. Moreover, using too large of a neighborhood (e.g., 9 × 9) may reduce the sensitivity of the CA model neighborhood interaction (and, thus, the accuracy of the simulation). Therefore, based on better model performance, this CA model set the neighborhood size to 7 × 7. The number of sub-trees of the trained RF model is 100, the maximum depth of the sub-tree is 10, and the maximum number of features considered for each split of the sub-tree node is 5. In addition, the results of calculating the importance of the RF model for the spatial driver are illustrated in Figure 6, which demonstrates that the GDP, population, distance to a metro station, distance to a main road, and slope are significant for UUS development. This is mainly because socioeconomic factors (S1) are the most important factors in UUS development.
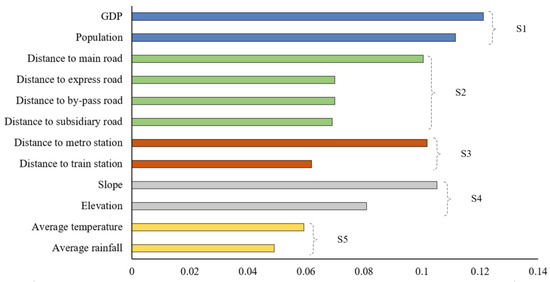
Figure 6.
Results of calculating the importance of spatial drivers for UUS development.
Constructing and utilizing UUS requires a large amount of capital, which is closely related to the city’s GDP; however, the larger the population, the larger the scale of UUS development required. The transportation network distance (S2) and transportation infrastructure (S3) are influential because the transportation network plays an important role in determining the shape of UUS, and the intensity of UUS development is higher in areas with convenient transportation networks. Topographic factors (S4) also play an important role in UUS development in the Tianfu New District, which is rich in topographic features, including mountains, lakes, hills, and plains. Therefore, owing to the large topographic variability, the average temperature and average rainfall factors (S5) play an influential role when considering the potential floodplains caused by climate change. The performance of the AgentLA model is sensitive to the setting. The model F value is highest when the value is 0.7–0.8 [83]; thus, the value is set to 0.75 for the AgentLA model.
5.2. Results of UUS Growth Simulation
The average values of the OA, FoM, and Kappa coefficient were calculated for the validation data from 2016 to 2020, according to the above formulae. The OA was calculated as 90.42%, the Kappa coefficient as 0.8424, and the FoM as 0.638426. The calculated results of the Kappa coefficient and FoM were higher than those reported in the previous related literature [41,61,93,95,96]; therefore, the constructed UUS growth simulation model has good simulation accuracy and can be used to simulate the growth of UUS for future years.
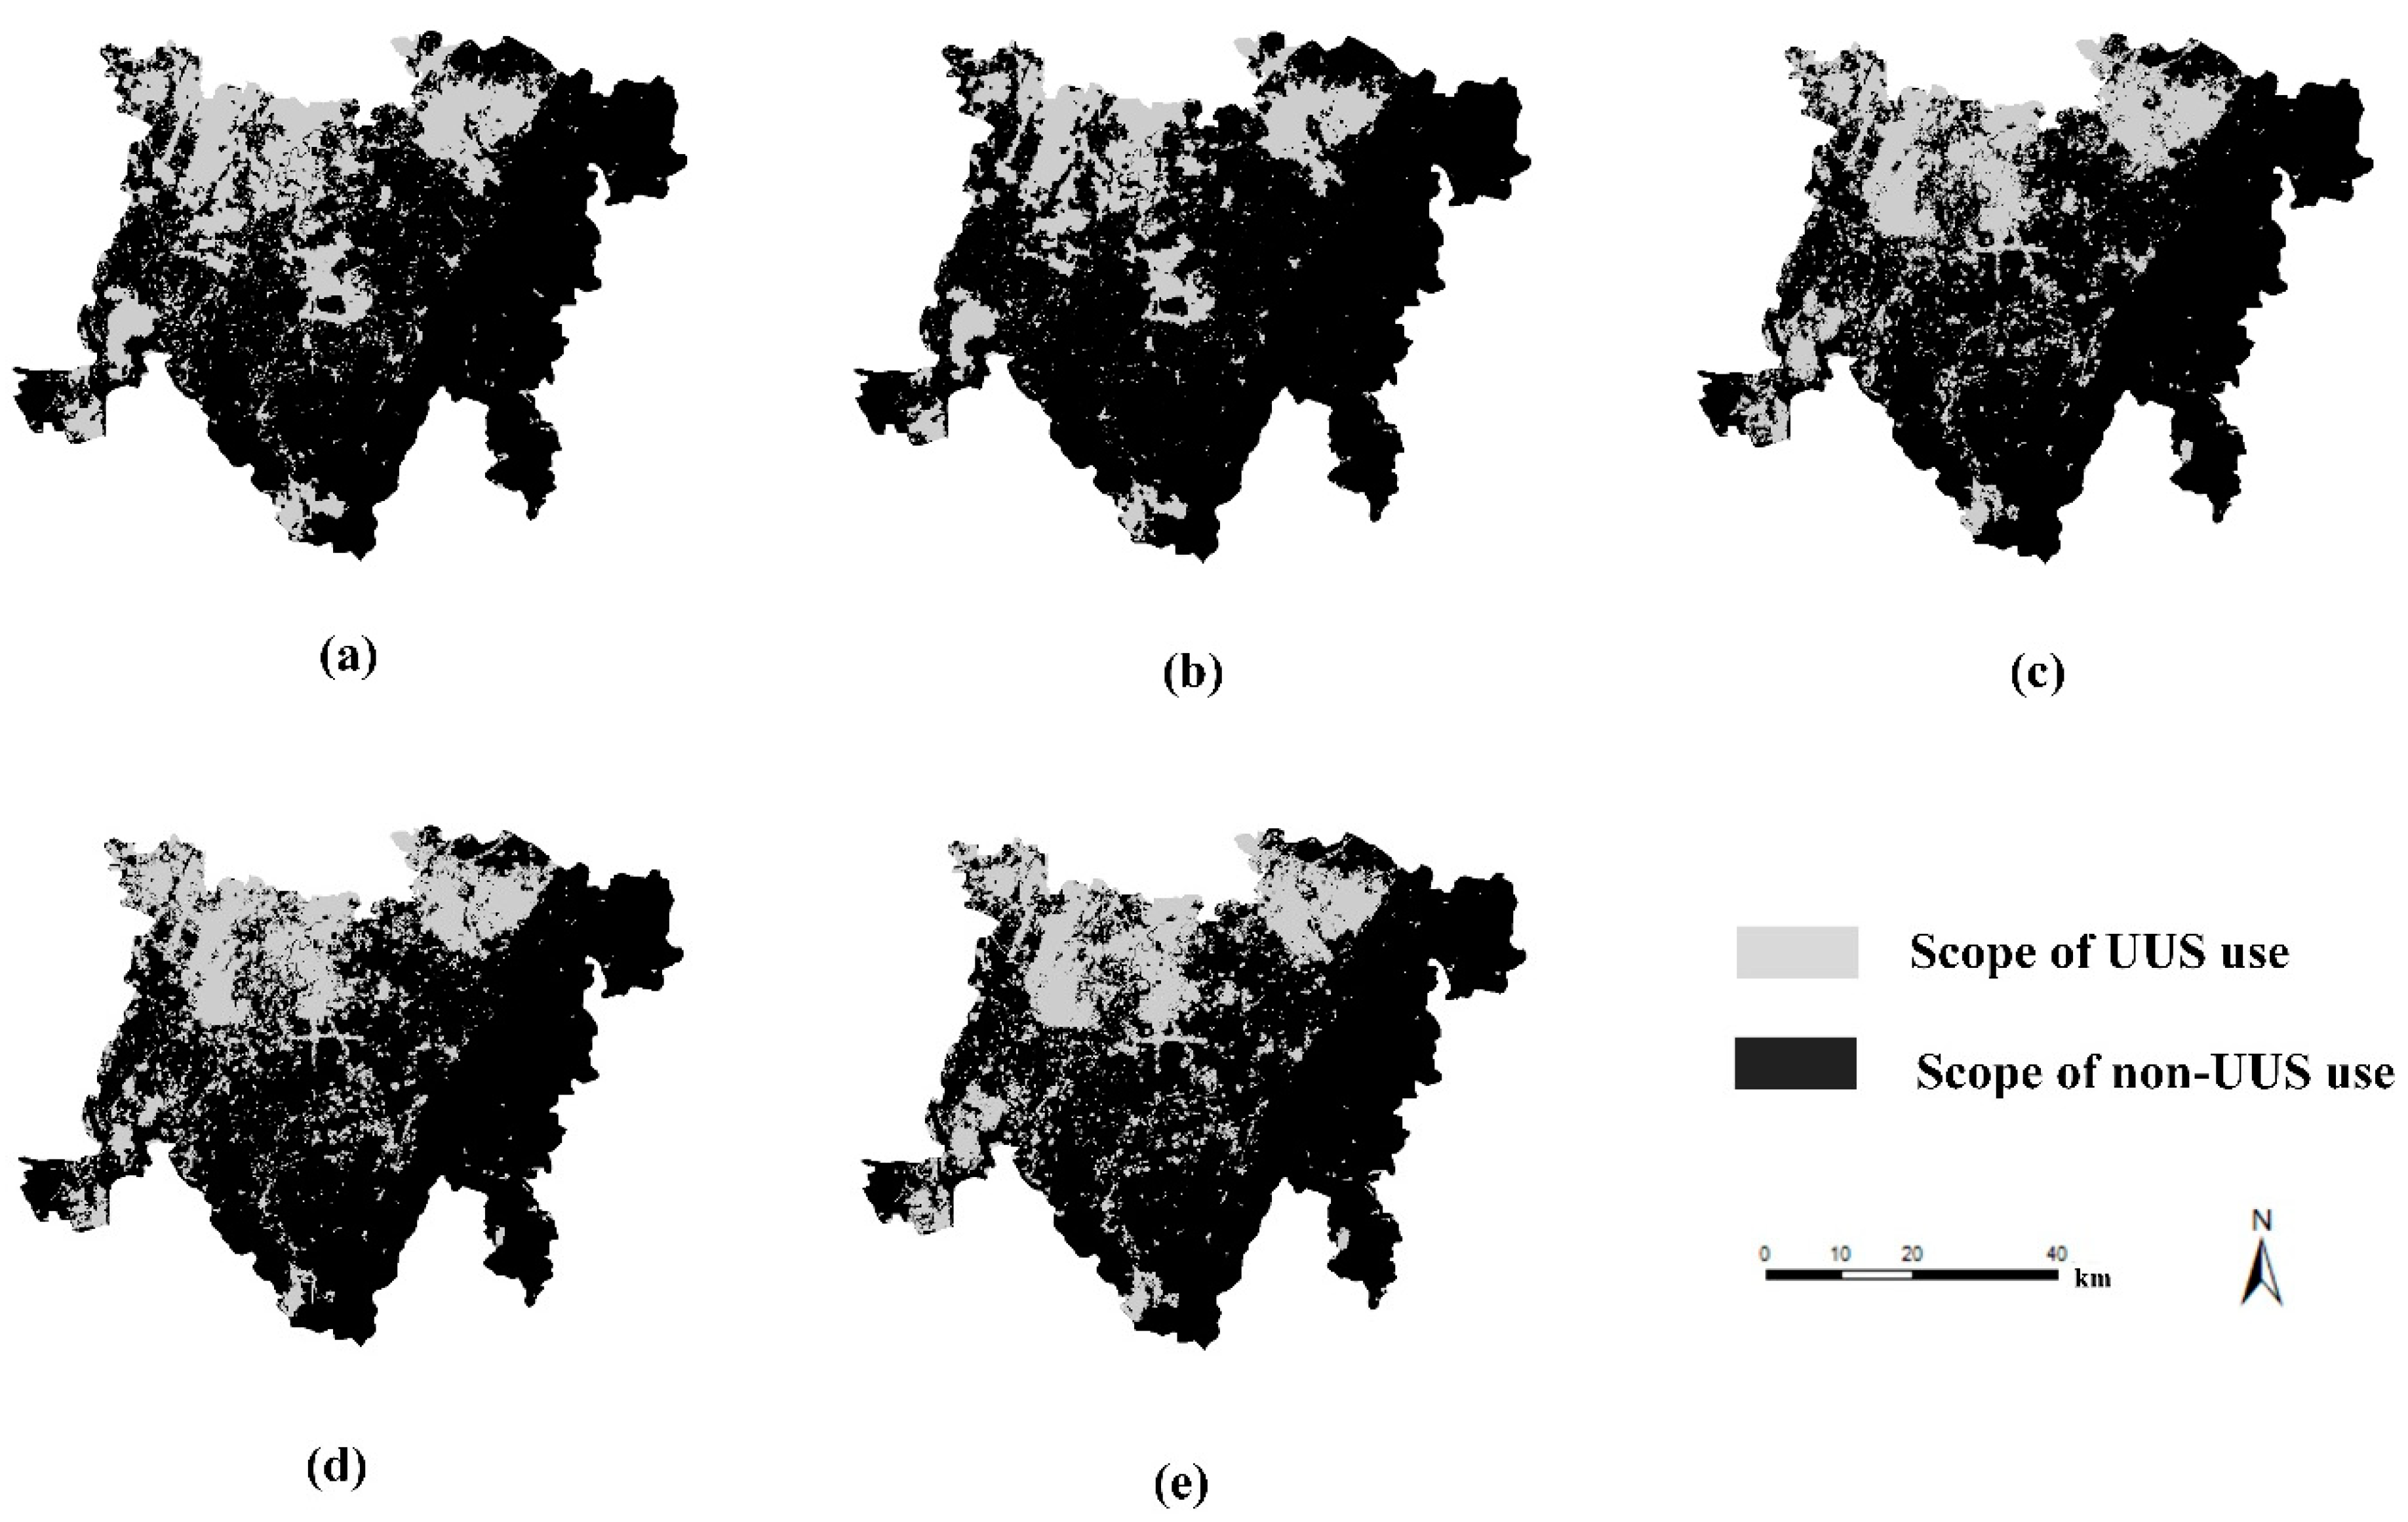
Using the UUS utilization in the study area in 2010 as the initial state and applying the growth simulation model of UUS constructed in this study, the growth simulation results of the UUS utilization in the study area in 2020 were obtained, as illustrated in Figure 7b, and compared with the UUS planning in the study area in 2020. The data sources were the Master Plan of Chengdu Tianfu New District, Sichuan Province, 2010–2030; the Logistic-CA model [55]; the artificial neural network (ANN)-CA model [97]; the and RF-patch-CA (unconstrained) model for comparison, as illustrated in Figure 7a,c–e, respectively.

Figure 7.
Comparison of results of simulation of UUS utilization growth within the study area in 2020; (a) UUS planning within the study area; (b) the simulation model of UUS growth constructed in this study; (c) Logistic-CA model; (d) ANN-CA model; (e) RF-patch-CA (unconstrained) model.
Figure 7 demonstrates that the UUS growth simulation results of the model constructed in this study are closer to the set planning results than are those of the other three CA models; locally, the other three CA models demonstrate the obvious phenomenon of UUS central metacell clustering, while the model constructed in this study effectively combats this phenomenon. To further verify the accuracy of the UUS growth simulation model constructed in this study, the Logistic-CA model, ANN-CA model, and RF-patch-CA (unconstrained) model were calculated at the metacell level, and the OA, FoM, and Kappa coefficient results of the model constructed in this study are illustrated in Table 3.
Table 3.
Precision comparison of UUS utilization growth simulation results of different models.
Table 3 demonstrates that the OA, FoM, and Kappa coefficient values of the model constructed in this paper are higher than those of the other three models, in which the Kappa coefficient improved by 0.1273, 0.1121, and 0.1263, and the FoM increased by 0.2220, 0.2325, and 0.2206, respectively. Therefore, these results further show that the model constructed in this study simulates the growth change pattern of UUS with greater accuracy.
6. Discussion and Analysis
6.1. Unconstrained by Ecological Constraints of UUS Growth Simulation
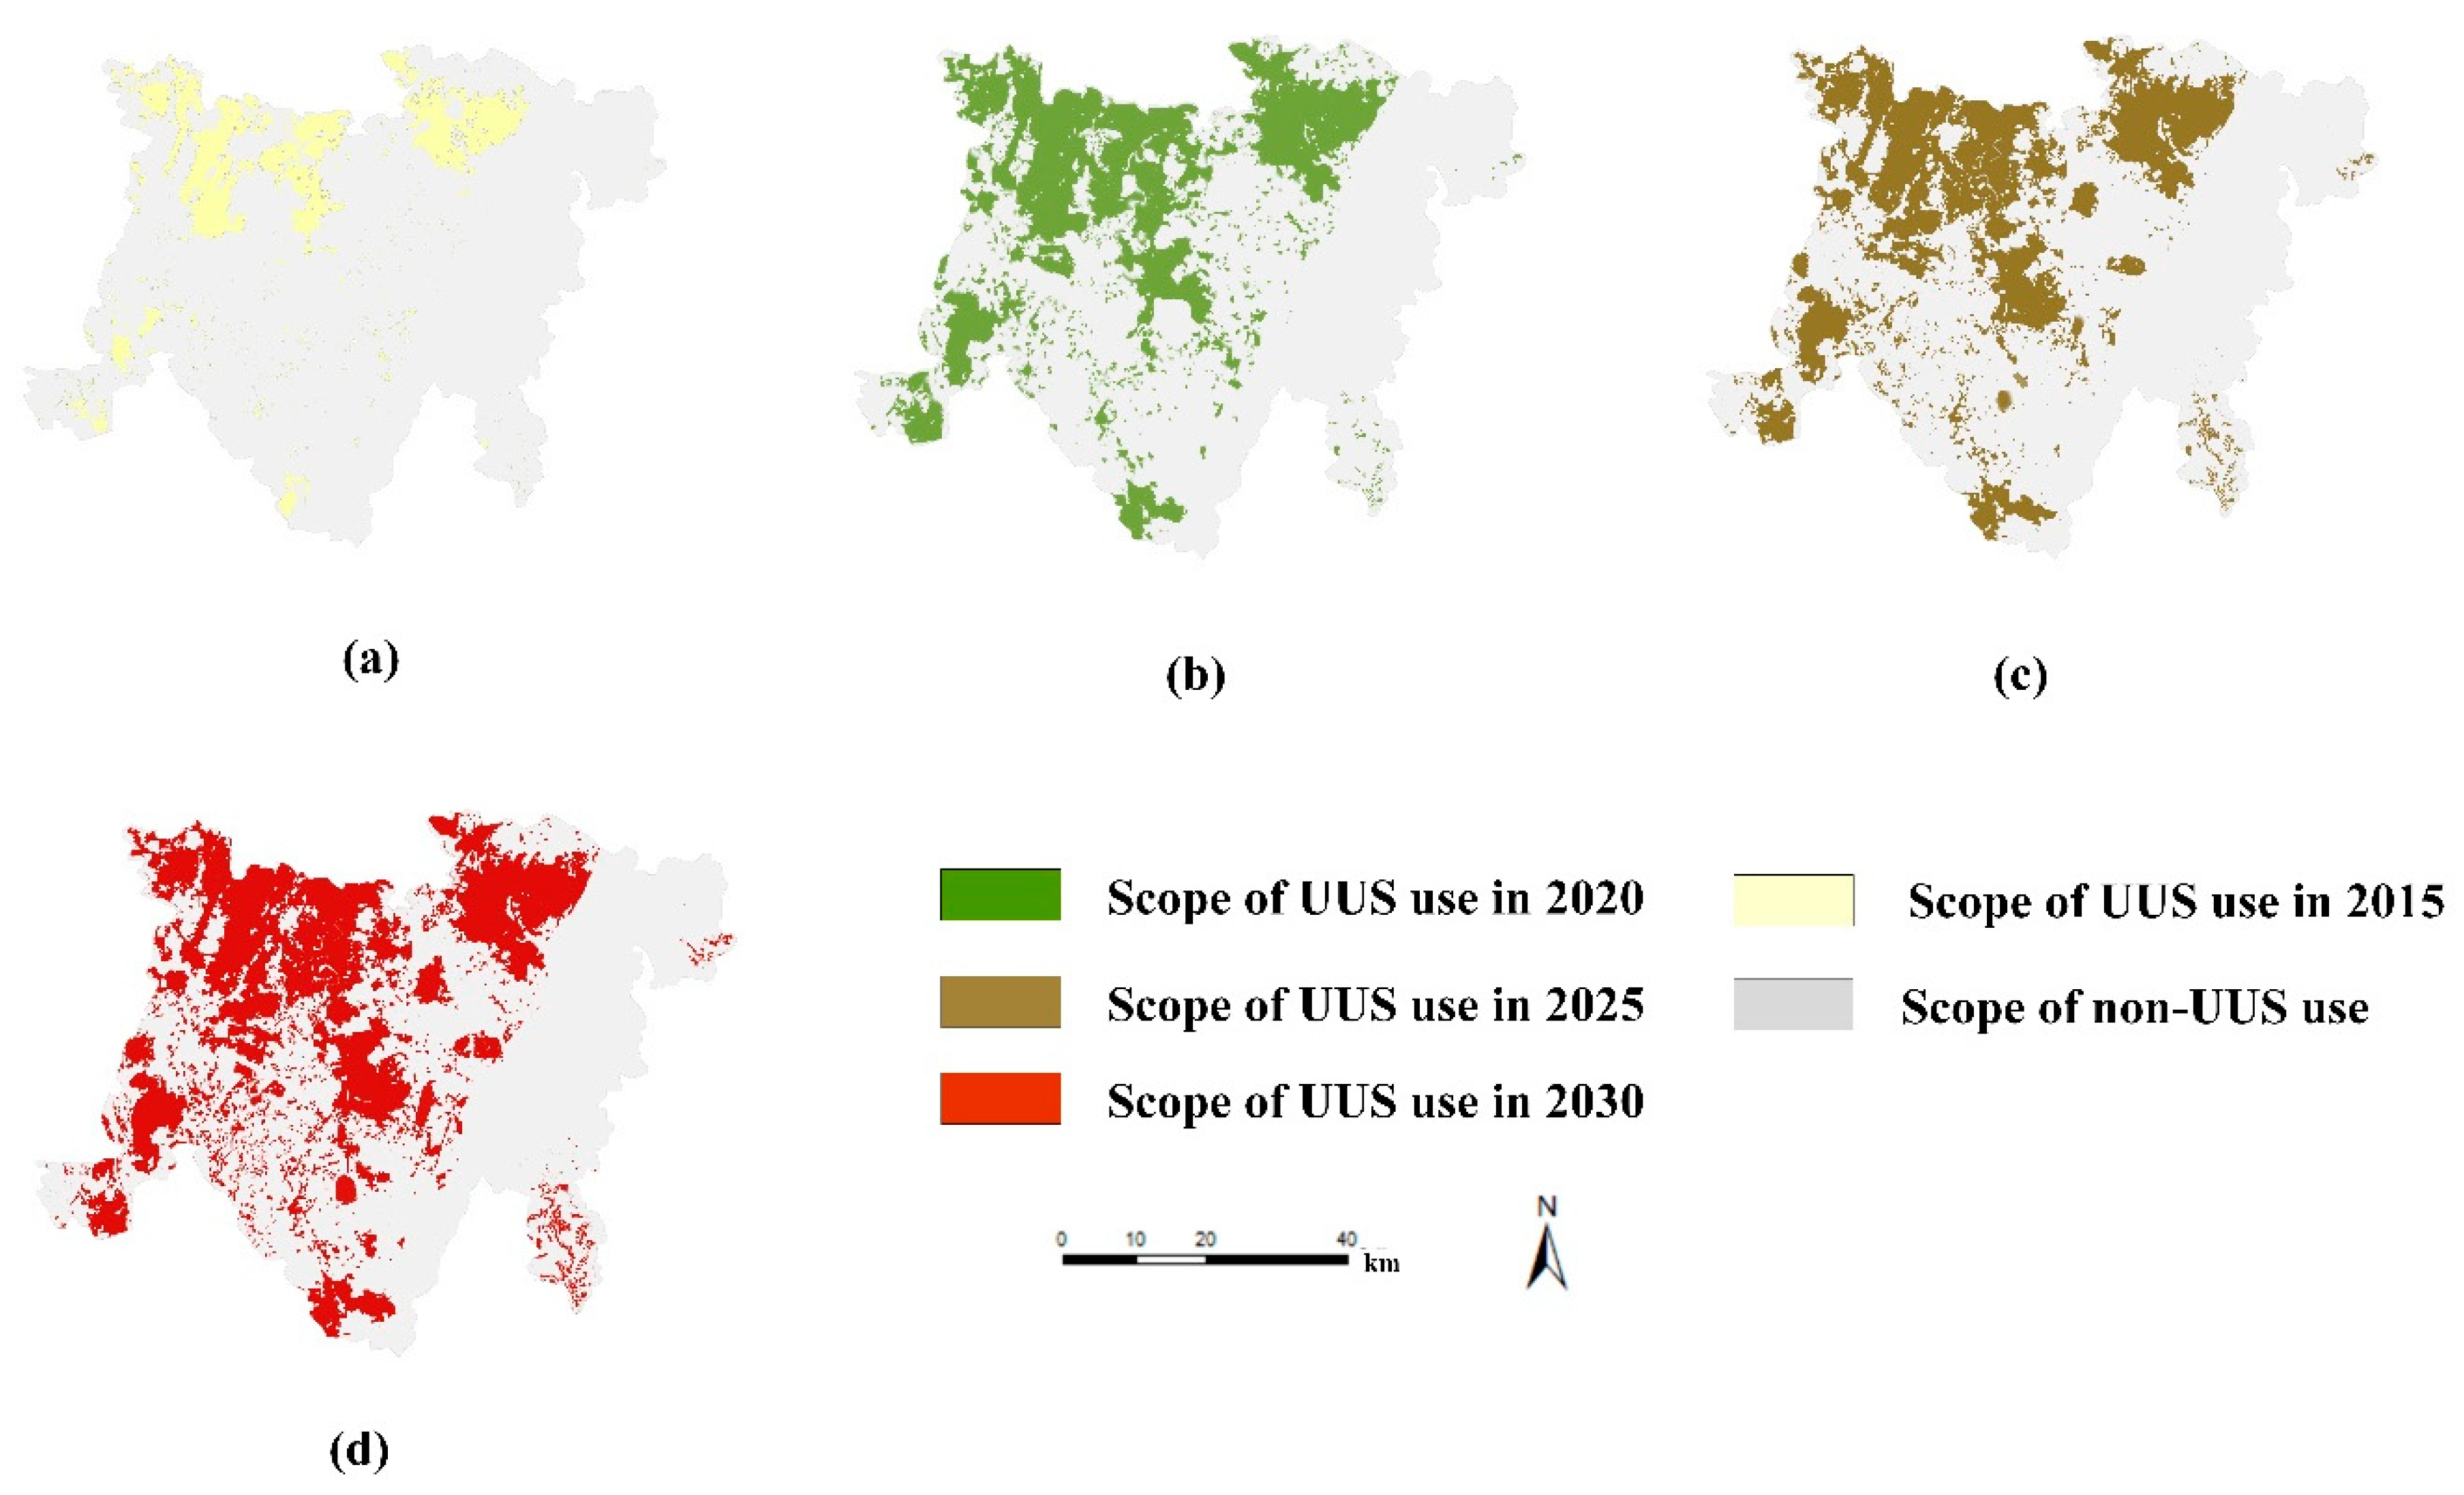
Using the UUS growth simulation model proposed in this study, the simulation of UUS growth without ecological constraints in 2020, 2025, and 2030 considering only the prohibited construction areas, such as mountains and water systems, was calculated (as illustrated in Figure 8), and the change in the area during the UUS growth simulation in each region was calculated (as illustrated in Table 4).

Figure 8.
Simulation results of UUS growth without ecological constraints; (a) UUS use in 2015; (b) UUS use in 2020; (c) UUS use in 2025; (d) UUS use in 2030.
Table 4.
Comparison of UUS use area changes without ecological constraints.
Table 4 and Figure 8 demonstrate that the area of UUS utilization in 2020, 2025, and 2030 will be 637.47 km2, 809.38 km2, and 936.98 km2, respectively. The area of UUS utilization will increase by 299.51 km2 from 2020 to 2030, with an average annual growth rate of 4.70%. Further analysis of the area changes for UUS utilization in each region demonstrates that different regions have different characteristics of change. Their changes can be roughly divided into three categories: (1) the scale of UUS development remains unchanged, with Jianyang City as a representative region; (2) the scale of UUS development grows rapidly and continuously, representing Shuangliu District, the Tianfu New District Directly Administered Area, and Longquanyi County; (3) the scale of UUS development appears to grow at the beginning, but the growth rate of these areas gradually decreases after 2020, representing Pengshan County, Renshou County, Chengdu High-tech District, and Xinjin County.
6.2. Constrained by Ecological Constraints of UUS Growth Simulation
The simulation of UUS growth with ecological constraints considers the UUS utilization constraints of urban BGS protection areas. Using the UUS growth simulation model proposed in this study, the simulation of UUS growth with ecological constraints in 2020, 2025, and 2030, considering the urban BGS protection areas, was calculated (as illustrated in Figure 9), and the area change during the UUS growth simulation in each region was calculated (as illustrated in Table 5).
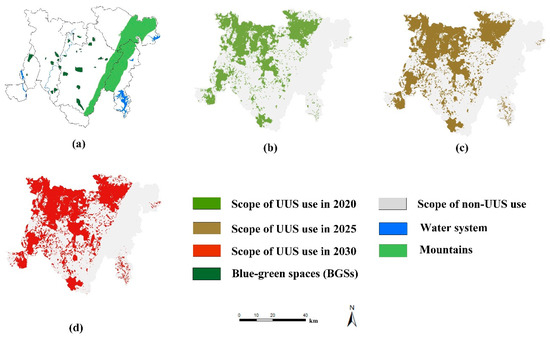
Figure 9.
Simulation results of UUS growth with ecological constraints; (a) ecological constraints within the study area; (b) UUS use in 2020; (c) UUS use in 2025; (d) UUS use in 2030.
Table 5.
Comparison of UUS use area changes under ecological constraints.
Table 5 and Figure 9 demonstrate that the area of UUS utilization in 2020, 2025, and 2030 will be 637.47 km2, 702.03 km2, and 747.19 km2, respectively. Compared to the case without ecological constraints, the scale of UUS development continues to grow, but its growth rate is significantly lower. The area of UUS utilization will increase by 109.72 km2 from 2020 to 2030, with an average annual growth rate of 1.72%, which is significantly less than that in the unconstrained case. Further analysis of the area changes for UUS utilization in each region demonstrates that the area of UUS utilization in Shuangliu District, the Tianfu New District Directly Administered Area, and Longquanyi County will continue to grow from 2015 to 2030. However, owing to the development constraints of urban BGSs’ protection areas on UUS, its growth rate will gradually decrease and be significantly smaller than the growth rate under the “no ecological constraints” scenario.
6.3. Comparative Analysis with or without Ecological Constraints
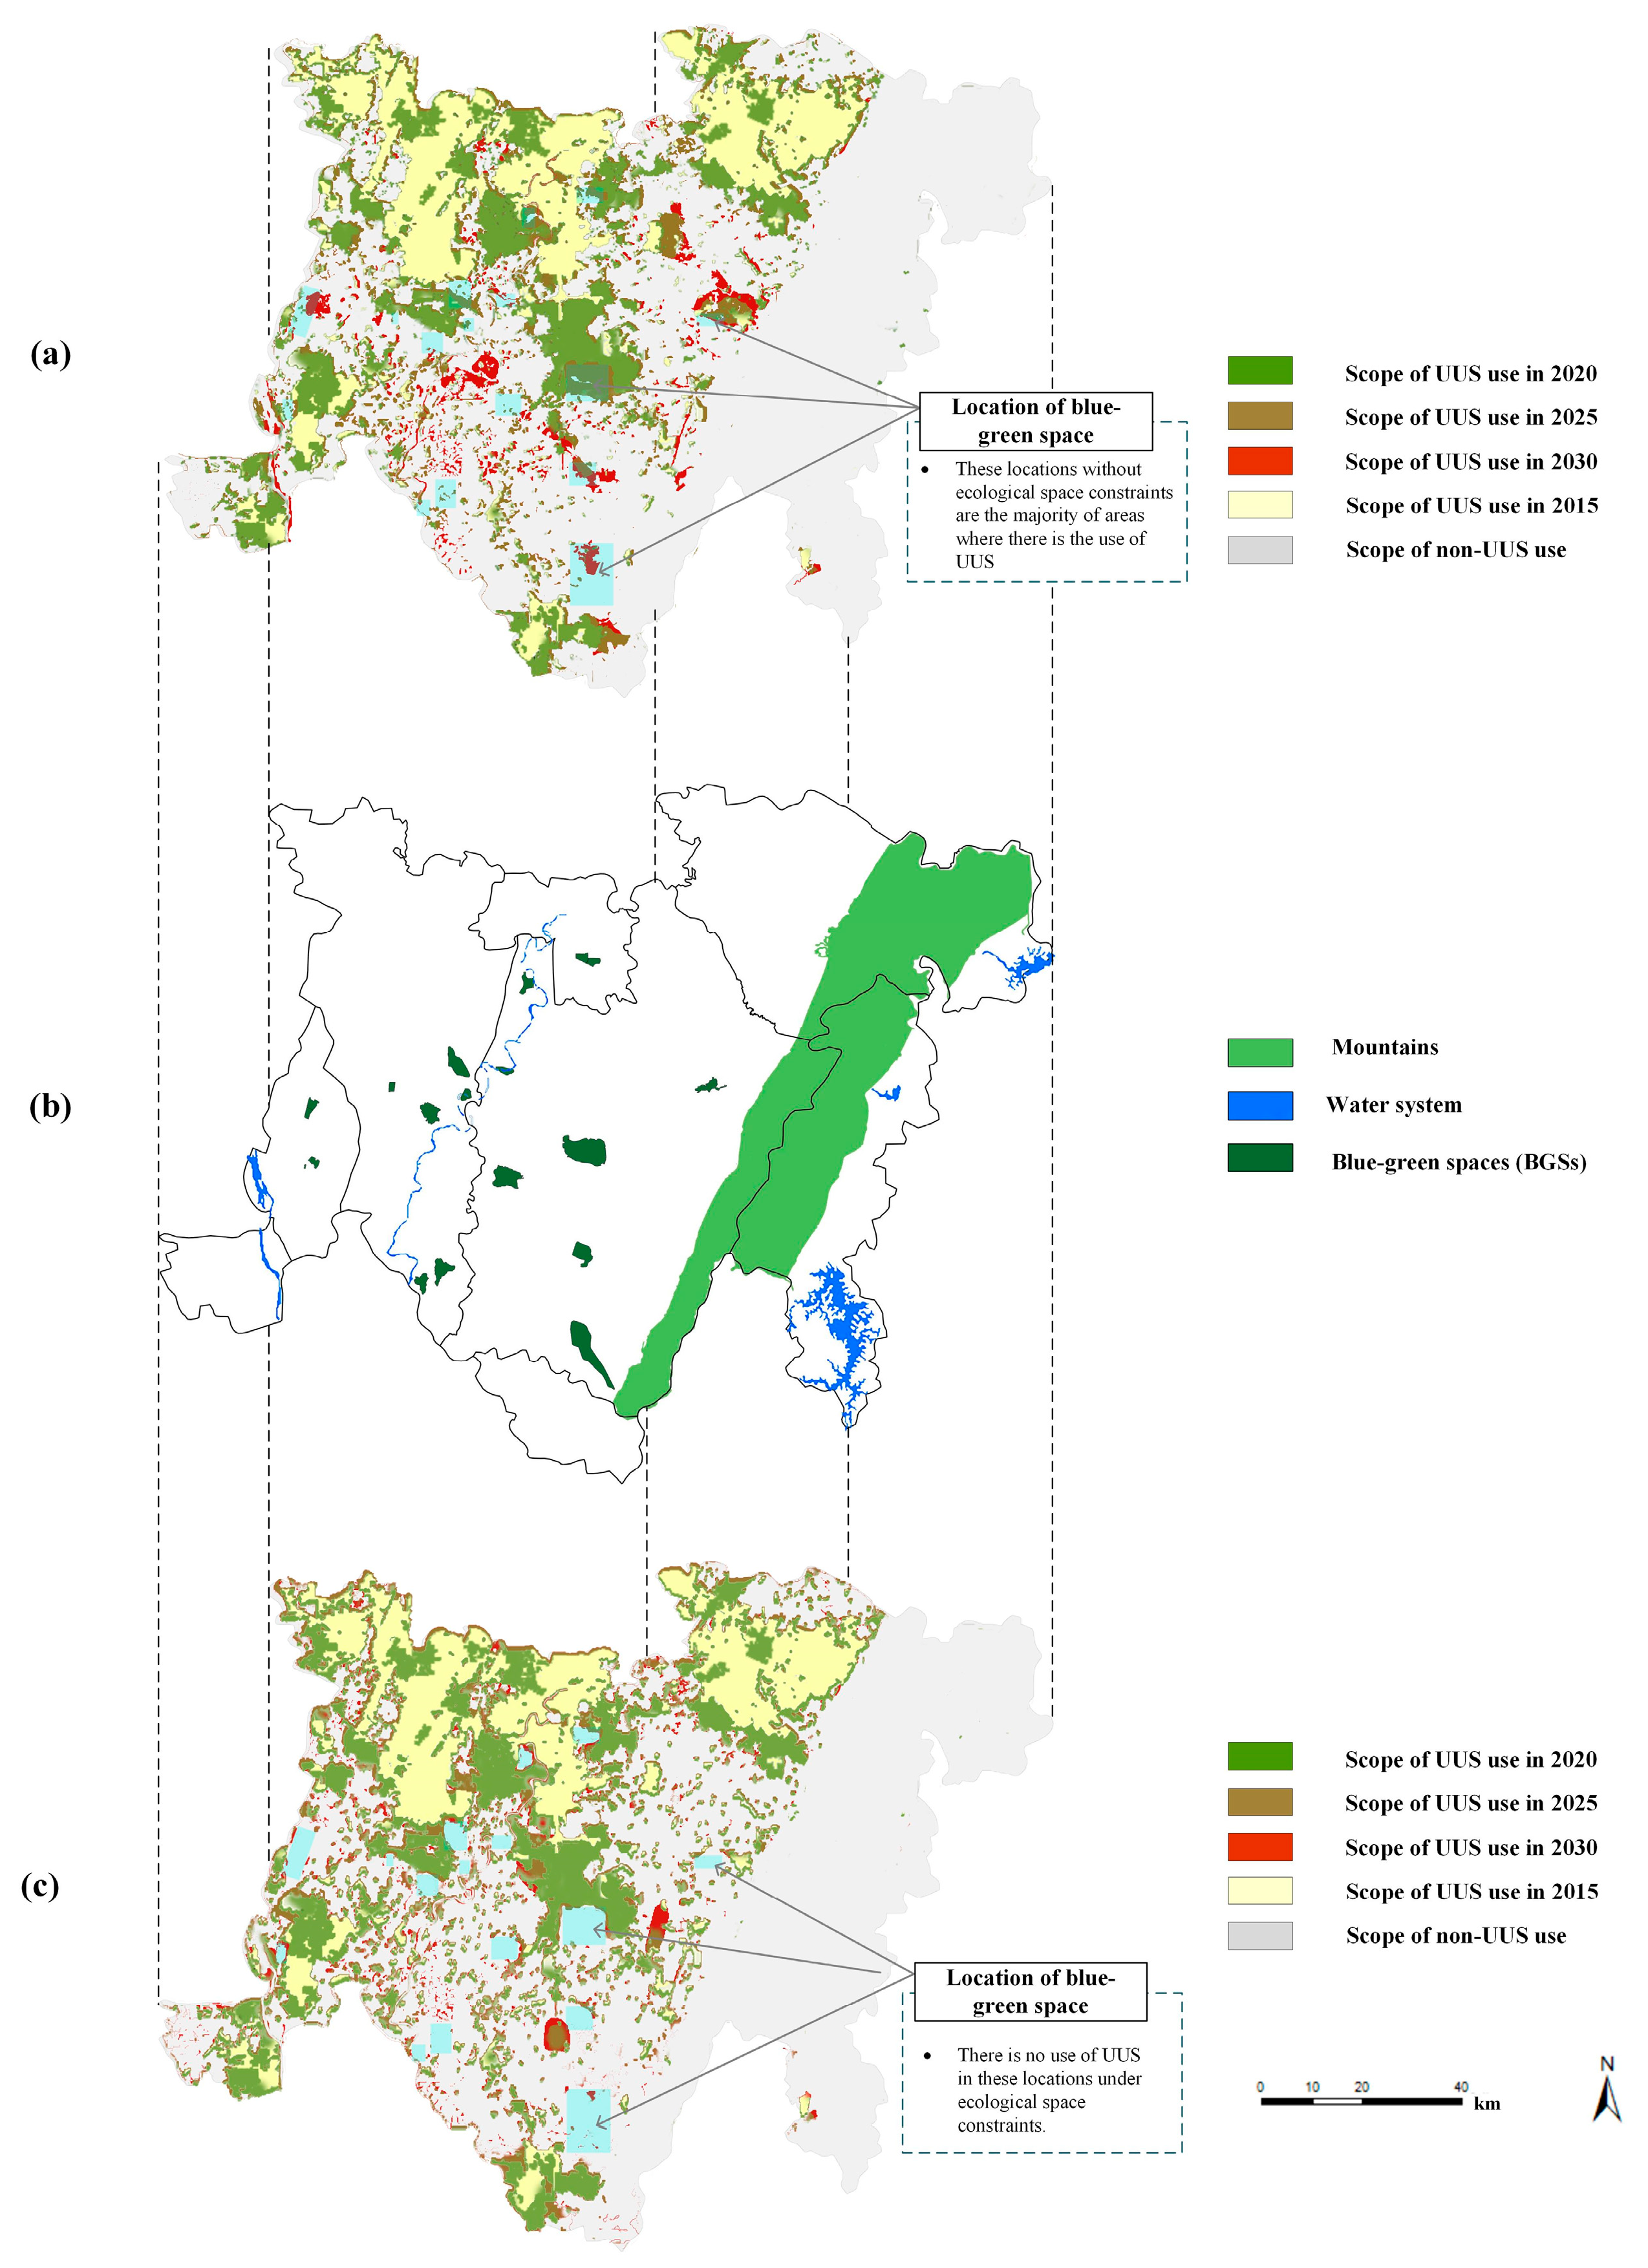
To compare the difference of the UUS growth simulation process with and without ecological constraint scenarios, we compare and analyze the spatial distribution of ecological constraints on urban space in the study area (as illustrated in Figure 10b), the UUS growth simulation without ecological constraints (as illustrated in Figure 10a), and the UUS growth simulation with ecological constraints (as illustrated in Figure 10c), and the changes in the UUS utilization area of UUS with and without ecological constraints are compared (as illustrated in Figure 11).
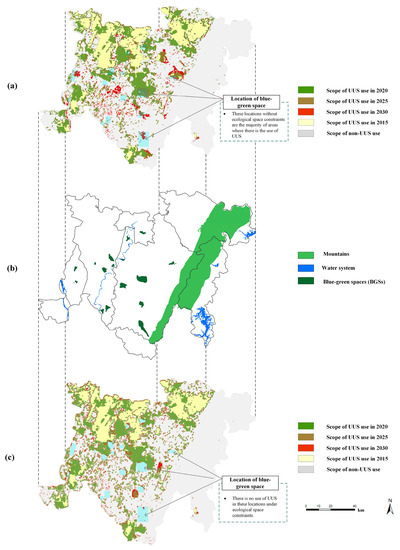
Figure 10.
Comparison of the variability of the simulation process of UUS growth with and without ecological constraint scenarios; (a) the UUS growth simulation without ecological constraints; (b) the spatial distribution of ecological constraints on urban space in the study area; (c) the UUS growth simulation with ecological constraints.
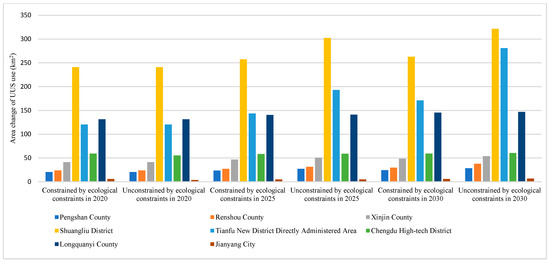
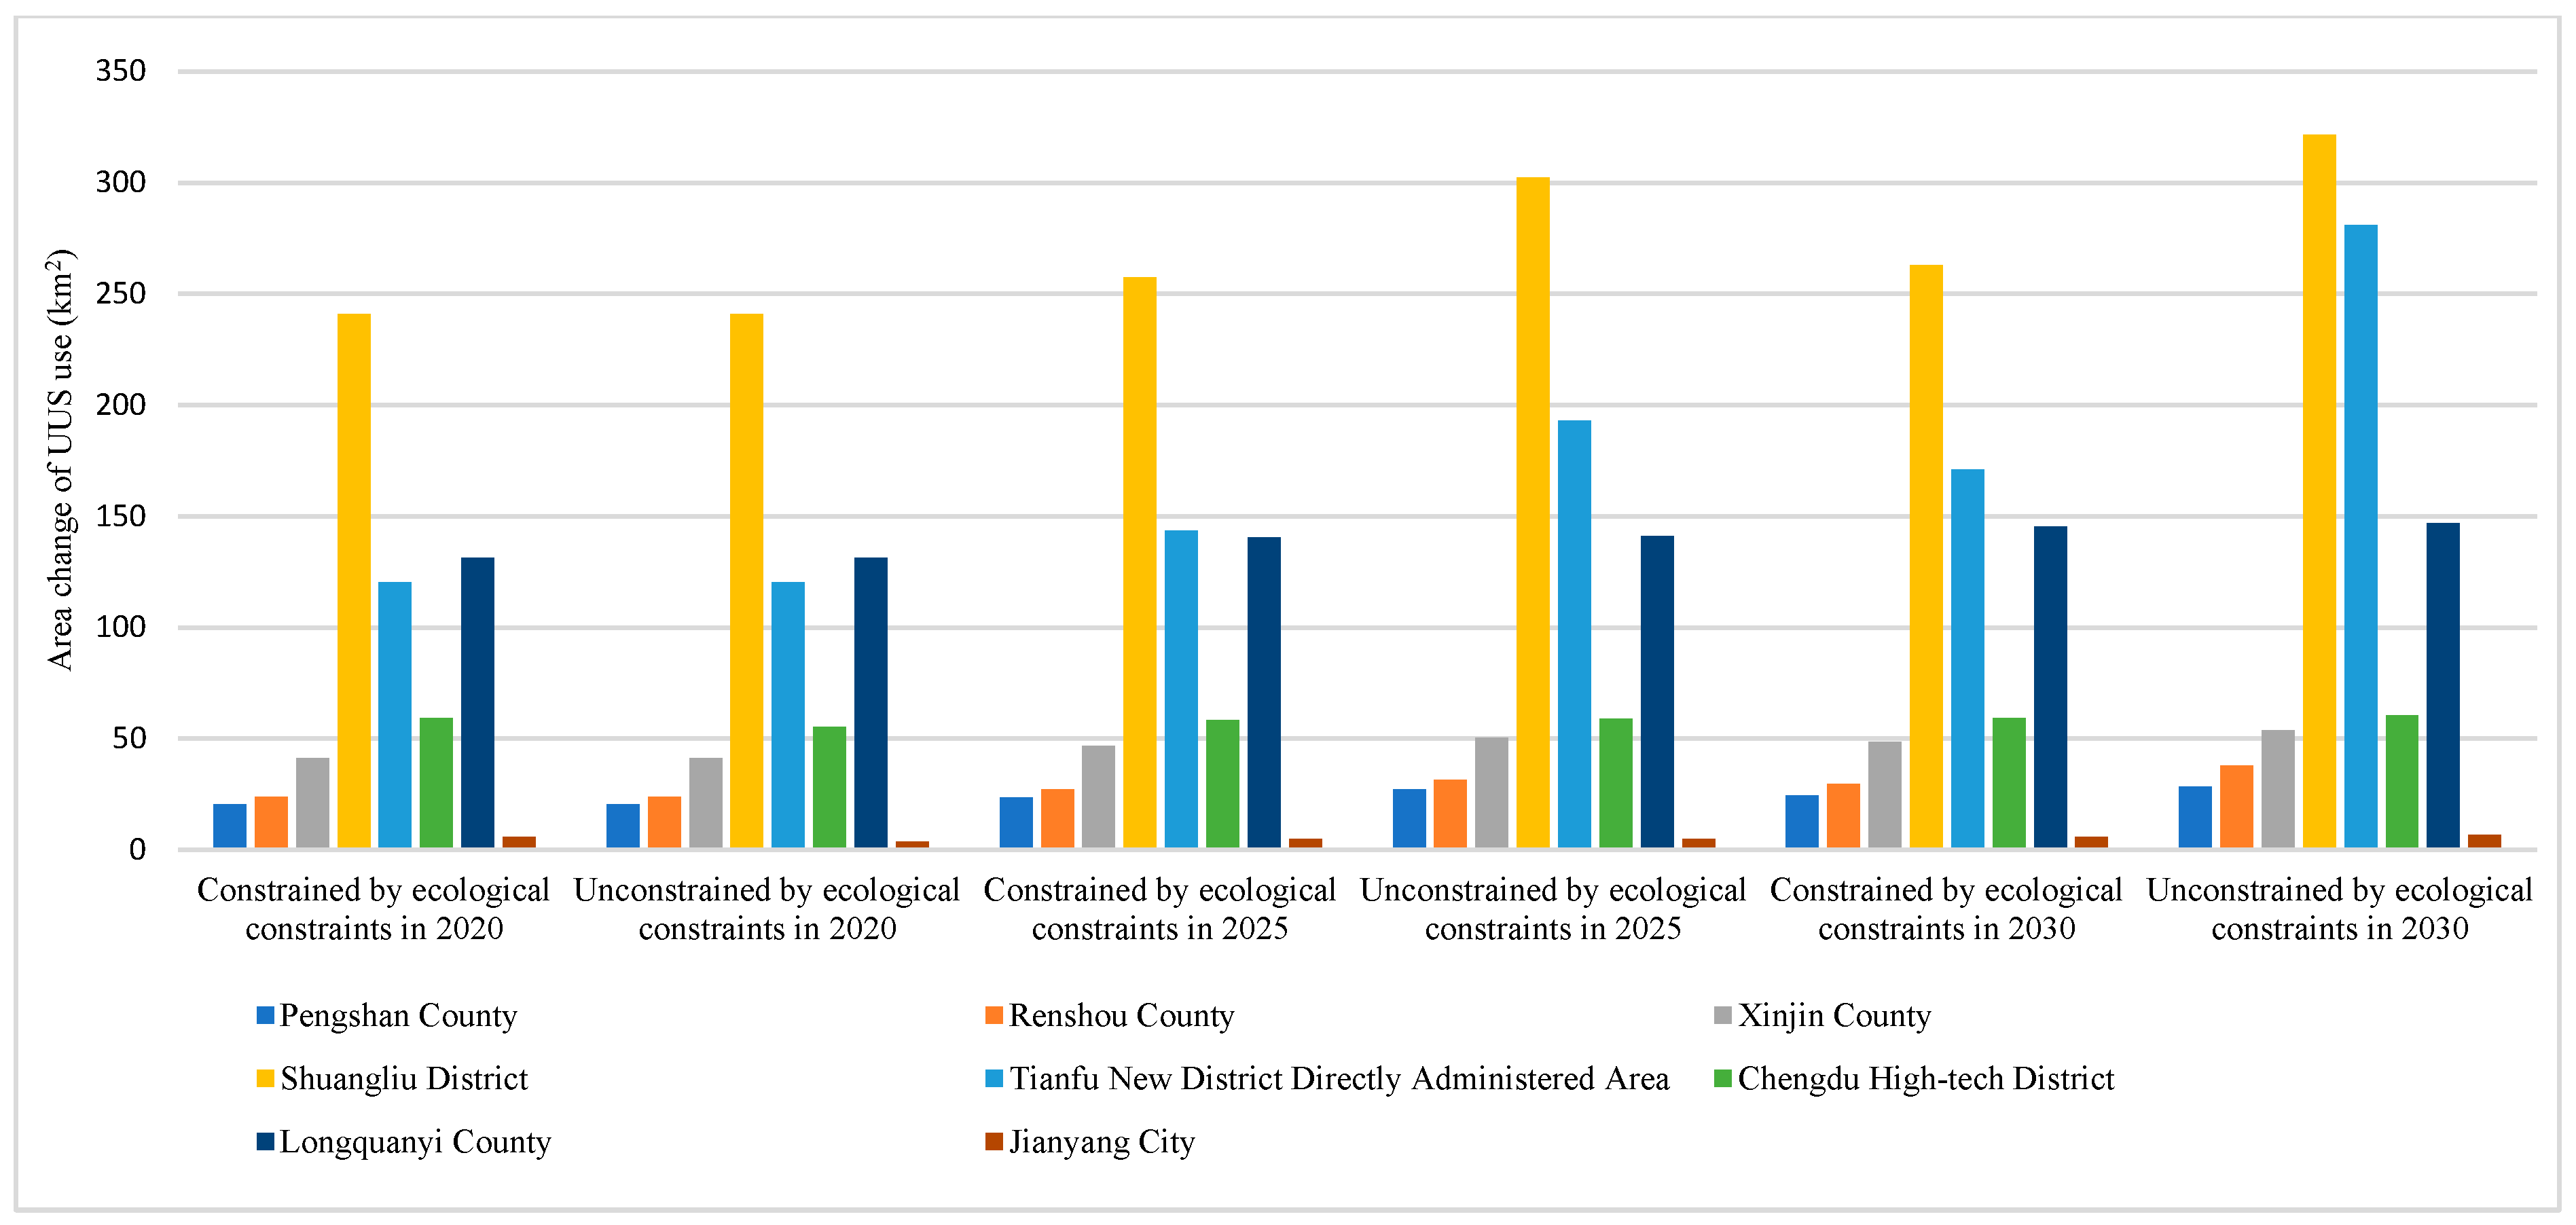
Figure 11.
Comparison of area change in UUS growth simulation processes with and without ecological constraint scenarios.
By comparing the results of the UUS growth simulations with and without ecological constraint scenarios in Figure 10 and Figure 11, we find that urban ecological space constraints are important in influencing the UUS development scale. In both cases, the scale of future UUS development is increasing, but the magnitude of the increase is significantly different. Under ecological constraints, the scale of future UUS development is much smaller than that under unconstrained development. Most of the urban BGS protection areas are located in the Tianfu New District Directly Administered Area, wherein the growth rate of UUS development is significantly slower than that in the unconstrained scenario, owing to the constraint of urban BGS protection areas. Owing to the fragmented distribution of urban BGS protection areas, many fragmented area patches (utilization areas of UUS) have been formed in the Tianfu New District Directly Administered Area. Without ecological constraints, the growth of the UUS development scale in the region will demonstrate a disorderly expansion due to a lack of constraints in the form of urban BGS protection areas. Therefore, UUS development under ecological constraints will be more sustainable and can protect urban BGSs on the ground more effectively, thereby promoting urban parks in Tianfu New District and constructing a low-carbon urban area.
7. Conclusions
This study combined the AgentLA model with the patch-CA model to construct a UUS growth simulation model. By taking Chengdu Tianfu New District as an example, the development process of the UUS scale from 2015 to 2030 was simulated, and two scenarios with and without ecological constraints were provided to predict the simulation results of UUS growth from 2020 to 2030. The simulation results with Chengdu Tianfu New District demonstrate that the model constructed in this study is suitable for simulating the process of changing the scale of UUS development. According to the relative importance measure of the RF algorithm, the GDP, population, distance to the subway station, distance to the main road, and slope have a large impact on the probability of conversion to UUS development. In the case of UUS development without ecological restrictions, the scale of UUS development in Tianfu New District will demonstrate a rapid and large-scale growth in the future; specifically, the Tianfu New District Directly Administered Area is growing faster than other areas. Simultaneously, under the consideration of ecological space constraints, although the scale of UUS development will continue to grow, UUS expansion is characterized by a slow and sustainable growth rate.
Overall, this study explains how the sustainable elements of ecological space can be incorporated into the proposed model, which combines the AgentLA model with the patch-CA model and helps to better simulate the complex dynamics of UUS over time. By comparing the results of different scenarios, we found that UUS planning, considering the urban ecological space constraint, can better implement the concept of a “park city” in the Tianfu New District, preserve more urban BGSs, and optimize the urban spatial structure while the UUS growth simulation combined with spatial drivers can also provide a theoretical basis for future UUS planning and urban planners. More importantly, this study identifies the spatial drivers of UUS growth simulations and their weights based on the RF algorithm, which provides a reference for the study of growth simulations of other UUS developments. On this basis, the patch-based CA model was constructed under ecological constraints and has a high prediction accuracy. The model also demonstrates a high portability for studies on the simulation of the growth of UUS in other cities.
This work represents an ecologically constrained approach to UUS growth simulation; however, limitations are inevitable. This study attempts to construct a UUS growth simulation process in which urban ecological space is effectively protected, but only urban BGSs, mainly large urban parks (including those with water bodies), are considered in the specific case and analysis, while some smaller community-based parks are not considered. A further and more comprehensive refinement of urban ecological space could better reflect the model’s orientation to UUS development. Another limitation is that the development and utilization of UUS can increase the area of ecological space in urban areas by re-constructing it on saved land; however, this aspect has not been considered in constructing our model. Simultaneously, the process of UUS development and utilization can create three-dimensional layout forms, such as urban atriums or sunken spaces, and the creation of such three-dimensional layout forms will include green vegetation planting, which positively impacts urban ecological space and the construction of livable cities.
Author Contributions
Lingxiang Wei: formal analysis, investigation, visualization, methodology, and writing—original draft. Dongjun Guo: conceptualization, funding acquisition, project administration, methodology, and writing—review and editing. Zhilong Chen: investigation, supervision, and writing—review and editing. Yingying Hu: methodology and visualization. Yanhua Wu: investigation and validation. Junyuan Ji: data curation and validation. All authors have read and agreed to the published version of the manuscript.
Funding
This work was supported by the National Natural Science Foundation of China (NNSFC) [Grant No. 52378083 and No. 52078481], and the Natural Science Foundation of Jiangsu Province [Grant No. BK20231488].
Data Availability Statement
Data sharing is not applicable to this article.
Acknowledgments
The authors would like to acknowledge the editors and reviewers of the ISPRS International Journal of Geo-Information for their constructive comments and suggestions.
Conflicts of Interest
The authors declare no conflict of interest.
References
- Teoh, R.; Anciaes, P.; Jones, P. Urban Mobility Transitions through GDP Growth: Policy Choices Facing Cities in Developing Countries. J. Transp. Geogr. 2020, 88, 102832. [Google Scholar] [CrossRef]
- Jedwab, R.; Loungani, P.; Yezer, A. Comparing Cities in Developed and Developing Countries: Population, Land Area, Building Height and Crowding. Reg. Sci. Urban Econ. 2021, 86, 103609. [Google Scholar] [CrossRef]
- Wolsink, M. ‘Sustainable City’ Requires ‘Recognition’—The Example of Environmental Education under Pressure from the Compact City. Land Use Policy 2016, 52, 174–180. [Google Scholar] [CrossRef]
- Bibri, S.E.; Krogstie, J.; Kärrholm, M. Compact City Planning and Development: Emerging Practices and Strategies for Achieving the Goals of Sustainability. Dev. Built Environ. 2020, 4, 100021. [Google Scholar] [CrossRef]
- Bobylev, N. Mainstreaming Sustainable Development into a City’s Master Plan: A Case of Urban Underground Space Use. Land Use Policy 2009, 26, 1128–1137. [Google Scholar] [CrossRef]
- Bobylev, N.; Sterling, R. Urban Underground Space: A Growing Imperative. Tunn. Undergr. Space Technol. 2016, 55, 1–4. [Google Scholar] [CrossRef]
- Lin, D.; Broere, W.; Cui, J. Underground Space Utilisation and New Town Development: Experiences, Lessons and Implications. Tunn. Undergr. Space Technol. 2022, 119, 104204. [Google Scholar] [CrossRef]
- Qiao, Y.-K.; Peng, F.-L.; Sabri, S.; Rajabifard, A. Low Carbon Effects of Urban Underground Space. Sustain. Cities Soc. 2019, 45, 451–459. [Google Scholar] [CrossRef]
- Xia, H.; Lin, C.; Liu, X.; Liu, Z. Urban Underground Space Capacity Demand Forecasting Based on Sustainable Concept: A Review. Energy Build. 2022, 255, 111656. [Google Scholar] [CrossRef]
- Bobylev, N.; Syrbe, R.-U.; Wende, W. Geosystem Services in Urban Planning. Sustain. Cities Soc. 2022, 85, 104041. [Google Scholar] [CrossRef]
- Hunt, D.V.L.; Makana, L.O.; Jefferson, I.; Rogers, C.D.F. Liveable Cities and Urban Underground Space. Tunn. Undergr. Space Technol. 2016, 55, 8–20. [Google Scholar] [CrossRef]
- Qiao, Y.-K.; Peng, F.-L.; Wu, X.-L.; Luan, Y.-P. Visualization and Spatial Analysis of Socio-Environmental Externalities of Urban Underground Space Use: Part 1 Positive Externalities. Tunn. Undergr. Space Technol. 2022, 121, 104325. [Google Scholar] [CrossRef]
- Zhang, Y.; Zhu, J.; Liao, Z.; Guo, J.; Xie, H.; Peng, Q. An Intelligent Planning Model for the Development and Utilization of Urban Underground Space with an Application to the Luohu District in Shenzhen. Tunn. Undergr. Space Technol. 2021, 112, 103933. [Google Scholar] [CrossRef]
- Zhang, C.; Zhao, Z.; Guo, D.; Gong, D.; Chen, Y. Optimization of Spatial Layouts for Deep Underground Infrastructure in Central Business Districts Based on a Multi-Agent System Model. Tunn. Undergr. Space Technol. 2023, 135, 105046. [Google Scholar] [CrossRef]
- Bobylev, N. Underground Space as an Urban Indicator: Measuring Use of Subsurface. Tunn. Undergr. Space Technol. 2016, 55, 40–51. [Google Scholar] [CrossRef]
- Chen, Y.; Chen, Z.; Guo, D.; Zhao, Z. Simulating Spatiotemporal Dynamics of Urban Underground Space Development Using Multi-Agent System: A Case Study in Changzhou City, China. Tunn. Undergr. Space Technol. 2022, 124, 104482. [Google Scholar] [CrossRef]
- Cui, J.; Broere, W.; Lin, D. Underground Space Utilisation for Urban Renewal. Tunn. Undergr. Space Technol. 2021, 108, 103726. [Google Scholar] [CrossRef]
- Zhao, J.-W.; Peng, F.-L.; Wang, T.-Q.; Zhang, X.-Y.; Jiang, B.-N. Advances in Master Planning of Urban Underground Space (UUS) in China. Tunn. Undergr. Space Technol. 2016, 55, 290–307. [Google Scholar] [CrossRef]
- Volchko, Y.; Norrman, J.; Ericsson, L.O.; Nilsson, K.L.; Markstedt, A.; Öberg, M.; Mossmark, F.; Bobylev, N.; Tengborg, P. Subsurface Planning: Towards a Common Understanding of the Subsurface as a Multifunctional Resource. Land Use Policy 2020, 90, 104316. [Google Scholar] [CrossRef]
- Zhao, P.; Li, X.; Zhang, W.; Xiong, Z.; Xu, W.; Dai, J.; Deng, L. System Dynamics: A New Approach for the Evaluation of Urban Underground Resource Integrated Development. Tunn. Undergr. Space Technol. 2022, 119, 104213. [Google Scholar] [CrossRef]
- Price, S.J.; Terrington, R.L.; Busby, J.; Bricker, S.; Berry, T. 3D Ground-Use Optimisation for Sustainable Urban Development Planning: A Case-Study from Earls Court, London, UK. Tunn. Undergr. Space Technol. 2018, 81, 144–164. [Google Scholar] [CrossRef]
- Broere, W. Urban Underground Space: Solving the Problems of Today’s Cities. Tunn. Undergr. Space Technol. 2016, 55, 245–248. [Google Scholar] [CrossRef]
- Qiao, Y.K.; Peng, F.L. Lessons Learnt from Urban Underground Space Use in Shanghai—From Lujiazui Business District to Hongqiao Central Business District. Tunn. Undergr. Space Technol. 2016, 55, 308–319. [Google Scholar] [CrossRef]
- Li, X.; Li, C.; Parriaux, A.; Wu, W.; Li, H.; Sun, L.; Liu, C. Multiple Resources and Their Sustainable Development in Urban Underground Space. Tunn. Undergr. Space Technol. 2016, 55, 59–66. [Google Scholar] [CrossRef]
- Peng, F.-L.; Qiao, Y.-K.; Sabri, S.; Atazadeh, B.; Rajabifard, A. A Collaborative Approach for Urban Underground Space Development toward Sustainable Development Goals: Critical Dimensions and Future Directions. Front. Struct. Civ. Eng. 2021, 15, 20–45. [Google Scholar] [CrossRef]
- Li, X.; Xu, H.; Li, C.; Sun, L.; Wang, R. Study on the Demand and Driving Factors of Urban Underground Space Use. Tunn. Undergr. Space Technol. 2016, 55, 52–58. [Google Scholar] [CrossRef]
- Peng, J.; Peng, F.-L. A GIS-Based Evaluation Method of Underground Space Resources for Urban Spatial Planning: Part 1 Methodology. Tunn. Undergr. Space Technol. 2018, 74, 82–95. [Google Scholar] [CrossRef]
- von der Tann, L.; Ritter, S.; Hale, S.; Langford, J.; Salazar, S. From Urban Underground Space (UUS) to Sustainable Underground Urbanism (SUU): Shifting the Focus in Urban Underground Scholarship. Land Use Policy 2021, 109, 105650. [Google Scholar] [CrossRef]
- Darroch, N.; Beecroft, M.; Nelson, J.D. Going Underground: An Exploration of the Interfaces between Underground Urban Transport Infrastructure and Its Environment. Tunn. Undergr. Space Technol. 2018, 81, 450–462. [Google Scholar] [CrossRef]
- Xu, Y.; Chen, X. Quantitative Analysis of Spatial Vitality and Spatial Characteristics of Urban Underground Space (UUS) in Metro Area. Tunn. Undergr. Space Technol. 2021, 111, 103875. [Google Scholar] [CrossRef]
- Wei, L.; Guo, D.; Chen, Z.; Yang, J.; Feng, T. Forecasting Short-Term Passenger Flow of Subway Stations Based on the Temporal Pattern Attention Mechanism and the Long Short-Term Memory Network. ISPRS Int. J. Geo-Inf. 2023, 12, 25. [Google Scholar] [CrossRef]
- Li, H.; Wan, B.; Chu, D.; Wang, R.; Ma, G.; Fu, J.; Xiao, Z. Progressive Geological Modeling and Uncertainty Analysis Using Machine Learning. ISPRS Int. J. Geo-Inf. 2023, 12, 97. [Google Scholar] [CrossRef]
- Peng, Z.; Zhang, Y.; Tan, F.; Lv, J.; Li, L. Variable-Weight Suitability Evaluation of Underground Space Development Considering Socioeconomic Factors. Sustainability 2023, 15, 3574. [Google Scholar] [CrossRef]
- Sakieh, Y.; Amiri, B.J.; Danekar, A.; Feghhi, J.; Dezhkam, S. Simulating Urban Expansion and Scenario Prediction Using a Cellular Automata Urban Growth Model, SLEUTH, through a Case Study of Karaj City, Iran. J. Hous. Built Environ. 2015, 30, 591–611. [Google Scholar] [CrossRef]
- Guan, Q.; Shi, X.; Huang, M.; Lai, C. A Hybrid Parallel Cellular Automata Model for Urban Growth Simulation over GPU/CPU Heterogeneous Architectures. Int. J. Geogr. Inf. Sci. 2016, 30, 494–514. [Google Scholar] [CrossRef]
- Liao, J.; Tang, L.; Shao, G.; Su, X.; Chen, D.; Xu, T. Incorporation of Extended Neighborhood Mechanisms and Its Impact on Urban Land-Use Cellular Automata Simulations. Environ. Model. Softw. 2016, 75, 163–175. [Google Scholar] [CrossRef]
- Gounaridis, D.; Chorianopoulos, I.; Symeonakis, E.; Koukoulas, S. A Random Forest-Cellular Automata Modelling Approach to Explore Future Land Use/Cover Change in Attica (Greece), under Different Socio-Economic Realities and Scales. Sci. Total Environ. 2019, 646, 320–335. [Google Scholar] [CrossRef]
- Shu, B.; Zhu, S.; Qu, Y.; Zhang, H.; Li, X.; Carsjens, G.J. Modelling Multi-Regional Urban Growth with Multilevel Logistic Cellular Automata. Comput. Environ. Urban Syst. 2020, 80, 101457. [Google Scholar] [CrossRef]
- Chen, S.; Feng, Y.; Tong, X.; Liu, S.; Xie, H.; Gao, C.; Lei, Z. Modeling ESV Losses Caused by Urban Expansion Using Cellular Automata and Geographically Weighted Regression. Sci. Total Environ. 2020, 712, 136509. [Google Scholar] [CrossRef]
- Dinda, S.; Das Chatterjee, N.; Ghosh, S. An Integrated Simulation Approach to the Assessment of Urban Growth Pattern and Loss in Urban Green Space in Kolkata, India: A GIS-Based Analysis. Ecol. Indic. 2021, 121, 107178. [Google Scholar] [CrossRef]
- Liu, X.; Wei, M.; Li, Z.; Zeng, J. Multi-Scenario Simulation of Urban Growth Boundaries with an ESP-FLUS Model: A Case Study of the Min Delta Region, China. Ecol. Indic. 2022, 135, 108538. [Google Scholar] [CrossRef]
- Dahal, K.R.; Chow, T.E. Characterization of Neighborhood Sensitivity of an Irregular Cellular Automata Model of Urban Growth. Int. J. Geogr. Inf. Sci. 2015, 29, 475–497. [Google Scholar] [CrossRef]
- Deep, S.; Saklani, A. Urban Sprawl Modeling Using Cellular Automata. Egypt. J. Remote Sens. Space Sci. 2014, 17, 179–187. [Google Scholar] [CrossRef]
- Mitsova, D.; Shuster, W.; Wang, X. A Cellular Automata Model of Land Cover Change to Integrate Urban Growth with Open Space Conservation. Landsc. Urban Plan. 2011, 99, 141–153. [Google Scholar] [CrossRef]
- Roodposhti, M.S.; Hewitt, R.J.; Bryan, B.A. Towards Automatic Calibration of Neighbourhood Influence in Cellular Automata Land-Use Models. Comput. Environ. Urban Syst. 2020, 79, 101416. [Google Scholar] [CrossRef]
- Yu, Z.; Yang, G.; Zuo, S.; Jørgensen, G.; Koga, M.; Vejre, H. Critical Review on the Cooling Effect of Urban Blue-Green Space: A Threshold-Size Perspective. Urban For. Urban Green. 2020, 49, 126630. [Google Scholar] [CrossRef]
- Song, S.; Wang, S.; Shi, M.; Hu, S.; Xu, D. Urban Blue–Green Space Landscape Ecological Health Assessment Based on the Integration of Pattern, Process, Function and Sustainability. Sci. Rep. 2022, 12, 7707. [Google Scholar] [CrossRef]
- Chen, Y.; Chen, Z.; Guo, D.; Zhao, Z.; Lin, T.; Zhang, C. Underground Space Use of Urban Built-up Areas in the Central City of Nanjing: Insight Based on a Dynamic Population Distribution. Undergr. Space 2022, 7, 748–766. [Google Scholar] [CrossRef]
- Bartel, S.; Janssen, G. Underground Spatial Planning—Perspectives and Current Research in Germany. Tunn. Undergr. Space Technol. 2016, 55, 112–117. [Google Scholar] [CrossRef]
- Edelenbos, J.; Monnikhof, R.; Haasnoot, J.; van der Hoeven, F.; Horvat, E.; van der Krogt, R. Strategic Study on the Utilization of Underground Space in the Netherlands. Tunn. Undergr. Space Technol. 1998, 13, 159–165. [Google Scholar] [CrossRef]
- Monnikhof, R.A.H.; Edelenbos, J.; van der Hoeven, F.; van der Krogt, R.A.A. The New Underground Planning Map of the Netherlands: A Feasibility Study of the Possibilities of the Use of Underground Space. Tunn. Undergr. Space Technol. 1999, 14, 341–347. [Google Scholar] [CrossRef]
- von der Tann, L.; Sterling, R.; Zhou, Y.; Metje, N. Systems Approaches to Urban Underground Space Planning and Management—A Review. Undergr. Space 2020, 5, 144–166. [Google Scholar] [CrossRef]
- Doyle, M.R. From Hydro/Geology to the Streetscape: Evaluating Urban Underground Resource Potential. Tunn. Undergr. Space Technol. 2016, 55, 83–95. [Google Scholar] [CrossRef]
- Xie, H.; Zhang, Y.; Chen, Y.; Peng, Q.; Liao, Z.; Zhu, J. A Case Study of Development and Utilization of Urban Underground Space in Shenzhen and the Guangdong-Hong Kong-Macao Greater Bay Area. Tunn. Undergr. Space Technol. 2021, 107, 103651. [Google Scholar] [CrossRef]
- Cao, Y.; Zhang, X.; Fu, Y.; Lu, Z.; Shen, X. Urban Spatial Growth Modeling Using Logistic Regression and Cellular Automata: A Case Study of Hangzhou. Ecol. Indic. 2020, 113, 106200. [Google Scholar] [CrossRef]
- Liao, J.; Shao, G.; Wang, C.; Tang, L.; Huang, Q.; Qiu, Q. Urban Sprawl Scenario Simulations Based on Cellular Automata and Ordered Weighted Averaging Ecological Constraints. Ecol. Indic. 2019, 107, 105572. [Google Scholar] [CrossRef]
- Jin, Y.; Li, A.; Bian, J.; Nan, X.; Lei, G. Modeling the Impact of Investment and National Planning Policies on Future Land Use Development: A Case Study for Myanmar. ISPRS Int. J. Geo-Inf. 2023, 12, 22. [Google Scholar] [CrossRef]
- Zhou, L.; Dang, X.; Sun, Q.; Wang, S. Multi-Scenario Simulation of Urban Land Change in Shanghai by Random Forest and CA-Markov Model. Sustain. Cities Soc. 2020, 55, 102045. [Google Scholar] [CrossRef]
- Wang, H.; Guo, J.; Zhang, B.; Zeng, H. Simulating Urban Land Growth by Incorporating Historical Information into a Cellular Automata Model. Landsc. Urban Plan. 2021, 214, 104168. [Google Scholar] [CrossRef]
- Yang, G.; Yu, Z.; Jørgensen, G.; Vejre, H. How Can Urban Blue-Green Space Be Planned for Climate Adaption in High-Latitude Cities? A Seasonal Perspective. Sustain. Cities Soc. 2020, 53, 101932. [Google Scholar] [CrossRef]
- Chen, Y.; Li, X.; Liu, X.; Ai, B. Modeling Urban Land-Use Dynamics in a Fast Developing City Using the Modified Logistic Cellular Automaton with a Patch-Based Simulation Strategy. Int. J. Geogr. Inf. Sci. 2013, 28, 234–255. [Google Scholar] [CrossRef]
- Liang, X.; Guan, Q.; Clarke, K.C.; Liu, S.; Wang, B.; Yao, Y. Understanding the Drivers of Sustainable Land Expansion Using a Patch-Generating Land Use Simulation (PLUS) Model: A Case Study in Wuhan, China. Comput. Environ. Urban Syst. 2021, 85, 101569. [Google Scholar] [CrossRef]
- Lin, J.; Li, X.; Wen, Y.; He, P. Modeling Urban Land-Use Changes Using a Landscape-Driven Patch-Based Cellular Automaton (LP-CA). Cities 2023, 132, 103906. [Google Scholar] [CrossRef]
- Dunn, A.G.; Majer, J.D. Simulating Weed Propagation Via Hierarchical, Patch-Based Cellular Automata. Lect. Notes Comput. Sci. 2007, 4487, 762–769. [Google Scholar] [CrossRef]
- Li, X.; Gong, P.; Yu, L.; Hu, T. A Segment Derived Patch-Based Logistic Cellular Automata for Urban Growth Modeling with Heuristic Rules. Comput. Environ. Urban Syst. 2017, 65, 140–149. [Google Scholar] [CrossRef]
- Kim, I.; Kwon, H. Assessing the Impacts of Urban Land Use Changes on Regional Ecosystem Services According to Urban Green Space Policies Via the Patch-Based Cellular Automata Model. Environ. Manag. 2020, 67, 192–204. [Google Scholar] [CrossRef]
- Wang, H.; Zhang, B.; Xia, C.; He, S.; Zhang, W. Using a Maximum Entropy Model to Optimize the Stochastic Component of Urban Cellular Automata Models. Int. J. Geogr. Inf. Sci. 2019, 34, 924–946. [Google Scholar] [CrossRef]
- Xia, C.; Zhang, B.; Wang, H.; Qiao, S.; Zhang, A. A Minimum-Volume Oriented Bounding Box Strategy for Improving the Performance of Urban Cellular Automata Based on Vectorization and Parallel Computing Technology. GISci. Remote Sens. 2019, 57, 91–106. [Google Scholar] [CrossRef]
- He, C.; Zhao, Y.; Tian, J.; Shi, P. Modeling the Urban Landscape Dynamics in a Megalopolitan Cluster Area by Incorporating a Gravitational Field Model with Cellular Automata. Landsc. Urban Plan. 2013, 113, 78–89. [Google Scholar] [CrossRef]
- Liu, D.; Zheng, X.; Wang, H. Land-Use Simulation and Decision-Support System (LandSDS): Seamlessly Integrating System Dynamics, Agent-Based Model, and Cellular Automata. Ecol. Model. 2020, 417, 108924. [Google Scholar] [CrossRef]
- Liu, J.; Xiao, B.; Li, Y.; Wang, X.; Bie, Q.; Jiao, J. Simulation of Dynamic Urban Expansion under Ecological Constraints Using a Long Short Term Memory Network Model and Cellular Automata. Remote Sens. 2021, 13, 1499. [Google Scholar] [CrossRef]
- Ma, Q. Integrating Ecological Correlation into Cellular Automata for Urban Growth Simulation: A Case Study of Hangzhou, China. Urban For. Urban Green. 2020, 51, 126697. [Google Scholar] [CrossRef]
- Sfa, F.E.; Nemiche, M.; Rayd, H. A Generic Macroscopic Cellular Automata Model for Land Use Change: The Case of the Drâa Valley. Ecol. Complex. 2020, 43, 100851. [Google Scholar] [CrossRef]
- Zhang, Y.; Chang, X.; Liu, Y.; Lu, Y.; Wang, Y.; Liu, Y. Urban Expansion Simulation under Constraint of Multiple Ecosystem Services (MESs) Based on Cellular Automata (CA)-Markov Model: Scenario Analysis and Policy Implications. Land Use Policy 2021, 108, 105667. [Google Scholar] [CrossRef]
- Ariluoma, M.; Ottelin, J.; Hautamäki, R.; Tuhkanen, E.-M.; Mänttäri, M. Carbon Sequestration and Storage Potential of Urban Green in Residential Yards: A Case Study from Helsinki. Urban For. Urban Green. 2021, 57, 126939. [Google Scholar] [CrossRef]
- Boukili, V.K.S.; Bebber, D.P.; Mortimer, T.; Venicx, G.; Lefcourt, D.; Chandler, M.; Eisenberg, C. Assessing the Performance of Urban Forest Carbon Sequestration Models Using Direct Measurements of Tree Growth. Urban For. Urban Green. 2017, 24, 212–221. [Google Scholar] [CrossRef]
- Uniyal, S.; Purohit, S.; Chaurasia, K.; Rao, S.S.; Amminedu, E. Quantification of Carbon Sequestration by Urban Forest Using Landsat 8 OLI and Machine Learning Algorithms in Jodhpur, India. Urban For. Urban Green. 2022, 67, 127445. [Google Scholar] [CrossRef]
- Sun, Y.; Xie, S.; Zhao, S. Valuing Urban Green Spaces in Mitigating Climate Change: A City-wide Estimate of Aboveground Carbon Stored in Urban Green Spaces of China’s Capital. Glob. Chang. Biol. 2019, 25, 1717–1732. [Google Scholar] [CrossRef]
- Yang, J.; Gong, J.; Tang, W.; Liu, C. Patch-Based Cellular Automata Model of Urban Growth Simulation: Integrating Feedback between Quantitative Composition and Spatial Configuration. Comput. Environ. Urban Syst. 2020, 79, 101402. [Google Scholar] [CrossRef]
- Labib, S.M.; Lindley, S.; Huck, J.J. Spatial Dimensions of the Influence of Urban Green-Blue Spaces on Human Health: A Systematic Review. Environ. Res. 2020, 180, 108869. [Google Scholar] [CrossRef]
- Shadman, S.; Ahanaf Khalid, P.; Hanafiah, M.M.; Koyande, A.K.; Islam, M.D.A.; Bhuiyan, S.A.; Sin Woon, K.; Show, P.-L. The Carbon Sequestration Potential of Urban Public Parks of Densely Populated Cities to Improve Environmental Sustainability. Sustain. Energy Technol. Assess. 2022, 52, 102064. [Google Scholar] [CrossRef]
- Chen, Y.; Li, X.; Liu, X.; Liu, Y. An Agent-Based Model for Optimal Land Allocation (AgentLA) with a Contiguity Constraint. Int. J. Geogr. Inf. Sci. 2010, 24, 1269–1288. [Google Scholar] [CrossRef]
- Chen, Y.; Li, X.; Liu, X.; Huang, H.; Ma, S. Simulating Urban Growth Boundaries Using a Patch-Based Cellular Automaton with Economic and Ecological Constraints. Int. J. Geogr. Inf. Sci. 2018, 33, 55–80. [Google Scholar] [CrossRef]
- Feng, Y.; Liu, Y.; Tong, X.; Liu, M.; Deng, S. Modeling Dynamic Urban Growth Using Cellular Automata and Particle Swarm Optimization Rules. Landsc. Urban Plan. 2011, 102, 188–196. [Google Scholar] [CrossRef]
- Cheng, J.; Masser, I. Understanding Spatial and Temporal Processes of Urban Growth: Cellular Automata Modelling. Environ. Plan. B Plan. Des. 2004, 31, 167–194. [Google Scholar] [CrossRef]
- Saganeiti, L.; Mustafa, A.; Teller, J.; Murgante, B. Modeling Urban Sprinkling with Cellular Automata. Sustain. Cities Soc. 2021, 65, 102586. [Google Scholar] [CrossRef]
- Yang, J.; Gong, J.; Tang, W.; Shen, Y.; Liu, C.; Gao, J. Delineation of Urban Growth Boundaries Using a Patch-Based Cellular Automata Model under Multiple Spatial and Socio-Economic Scenarios. Sustainability 2019, 11, 6159. [Google Scholar] [CrossRef]
- Zhang, D.; Liu, X.; Lin, Z.; Zhang, X.; Zhang, H. The Delineation of Urban Growth Boundaries in Complex Ecological Environment Areas by Using Cellular Automata and a Dual-Environmental Evaluation. J. Clean. Prod. 2020, 256, 120361. [Google Scholar] [CrossRef]
- Feng, Y.; Liu, Y.; Batty, M. Modeling Urban Growth with GIS Based Cellular Automata and Least Squares SVM Rules: A Case Study in Qingpu–Songjiang Area of Shanghai, China. Stoch. Environ. Res. Risk Assess. 2015, 30, 1387–1400. [Google Scholar] [CrossRef]
- Ma, S.; Jiang, H.; Zhang, X.; Xie, D.; Cai, Y.; Zhao, Y.; Wang, G. Quantify the Potential Spatial Reshaping Utility of Urban Growth Boundary (UGB): Evidence from the Constrained Scenario Simulation Model. ISPRS Int. J. Geo-Inf. 2022, 11, 511. [Google Scholar] [CrossRef]
- Kamusoko, C.; Gamba, J. Simulating Urban Growth Using a Random Forest-Cellular Automata (RF-CA) Model. ISPRS Int. J. Geo-Inf. 2015, 4, 447–470. [Google Scholar] [CrossRef]
- Liu, X.; Ma, L.; Li, X.; Ai, B.; Li, S.; He, Z. Simulating Urban Growth by Integrating Landscape Expansion Index (LEI) and Cellular Automata. Int. J. Geogr. Inf. Sci. 2013, 28, 148–163. [Google Scholar] [CrossRef]
- Xu, L.; Liu, X.; Tong, D.; Liu, Z.; Yin, L.; Zheng, W. Forecasting Urban Land Use Change Based on Cellular Automata and the PLUS Model. Land 2022, 11, 652. [Google Scholar] [CrossRef]
- Mustafa, A.; Cools, M.; Saadi, I.; Teller, J. Coupling Agent-Based, Cellular Automata and Logistic Regression into a Hybrid Urban Expansion Model (HUEM). Land Use Policy 2017, 69, 529–540. [Google Scholar] [CrossRef]
- Yang, X.; Bai, Y.; Che, L.; Qiao, F.; Xie, L. Incorporating Ecological Constraints into Urban Growth Boundaries: A Case Study of Ecologically Fragile Areas in the Upper Yellow River. Ecol. Indic. 2021, 124, 107436. [Google Scholar] [CrossRef]
- Pontius, R.G.; Boersma, W.; Castella, J.-C.; Clarke, K.; de Nijs, T.; Dietzel, C.; Duan, Z.; Fotsing, E.; Goldstein, N.; Kok, K.; et al. Comparing the Input, Output, and Validation Maps for Several Models of Land Change. Ann. Reg. Sci. 2007, 42, 11–37. [Google Scholar] [CrossRef]
- Gharaibeh, A.; Shaamala, A.; Obeidat, R.; Al-Kofahi, S. Improving Land-Use Change Modeling by Integrating ANN with Cellular Automata-Markov Chain Model. Heliyon 2020, 6, e05092. [Google Scholar] [CrossRef]


Disclaimer/Publisher’s Note: The statements, opinions and data contained in all publications are solely those of the individual author(s) and contributor(s) and not of MDPI and/or the editor(s). MDPI and/or the editor(s) disclaim responsibility for any injury to people or property resulting from any ideas, methods, instructions or products referred to in the content. |
© 2023 by the authors. Licensee MDPI, Basel, Switzerland. This article is an open access article distributed under the terms and conditions of the Creative Commons Attribution (CC BY) license (https://creativecommons.org/licenses/by/4.0/).