

Random Forest Variable Importance Measures for Spatial Dynamics: Case Studies from Urban Demography

Abstract
:1. Introduction
2. Background
3. Materials and Methods
3.1. Case Studies and Population Datasets
3.2. Selected Determinants
3.3. Random Forest Variable Importance Measures
3.4. Migrant Distribution and Real Estate Prices
4. Results
4.1. Results on Aggregated Groups
4.2. Results on Individual CoO
4.2.1. The Impact of Natives and Other Migrant Groups
4.2.2. The Impact of Other Factors
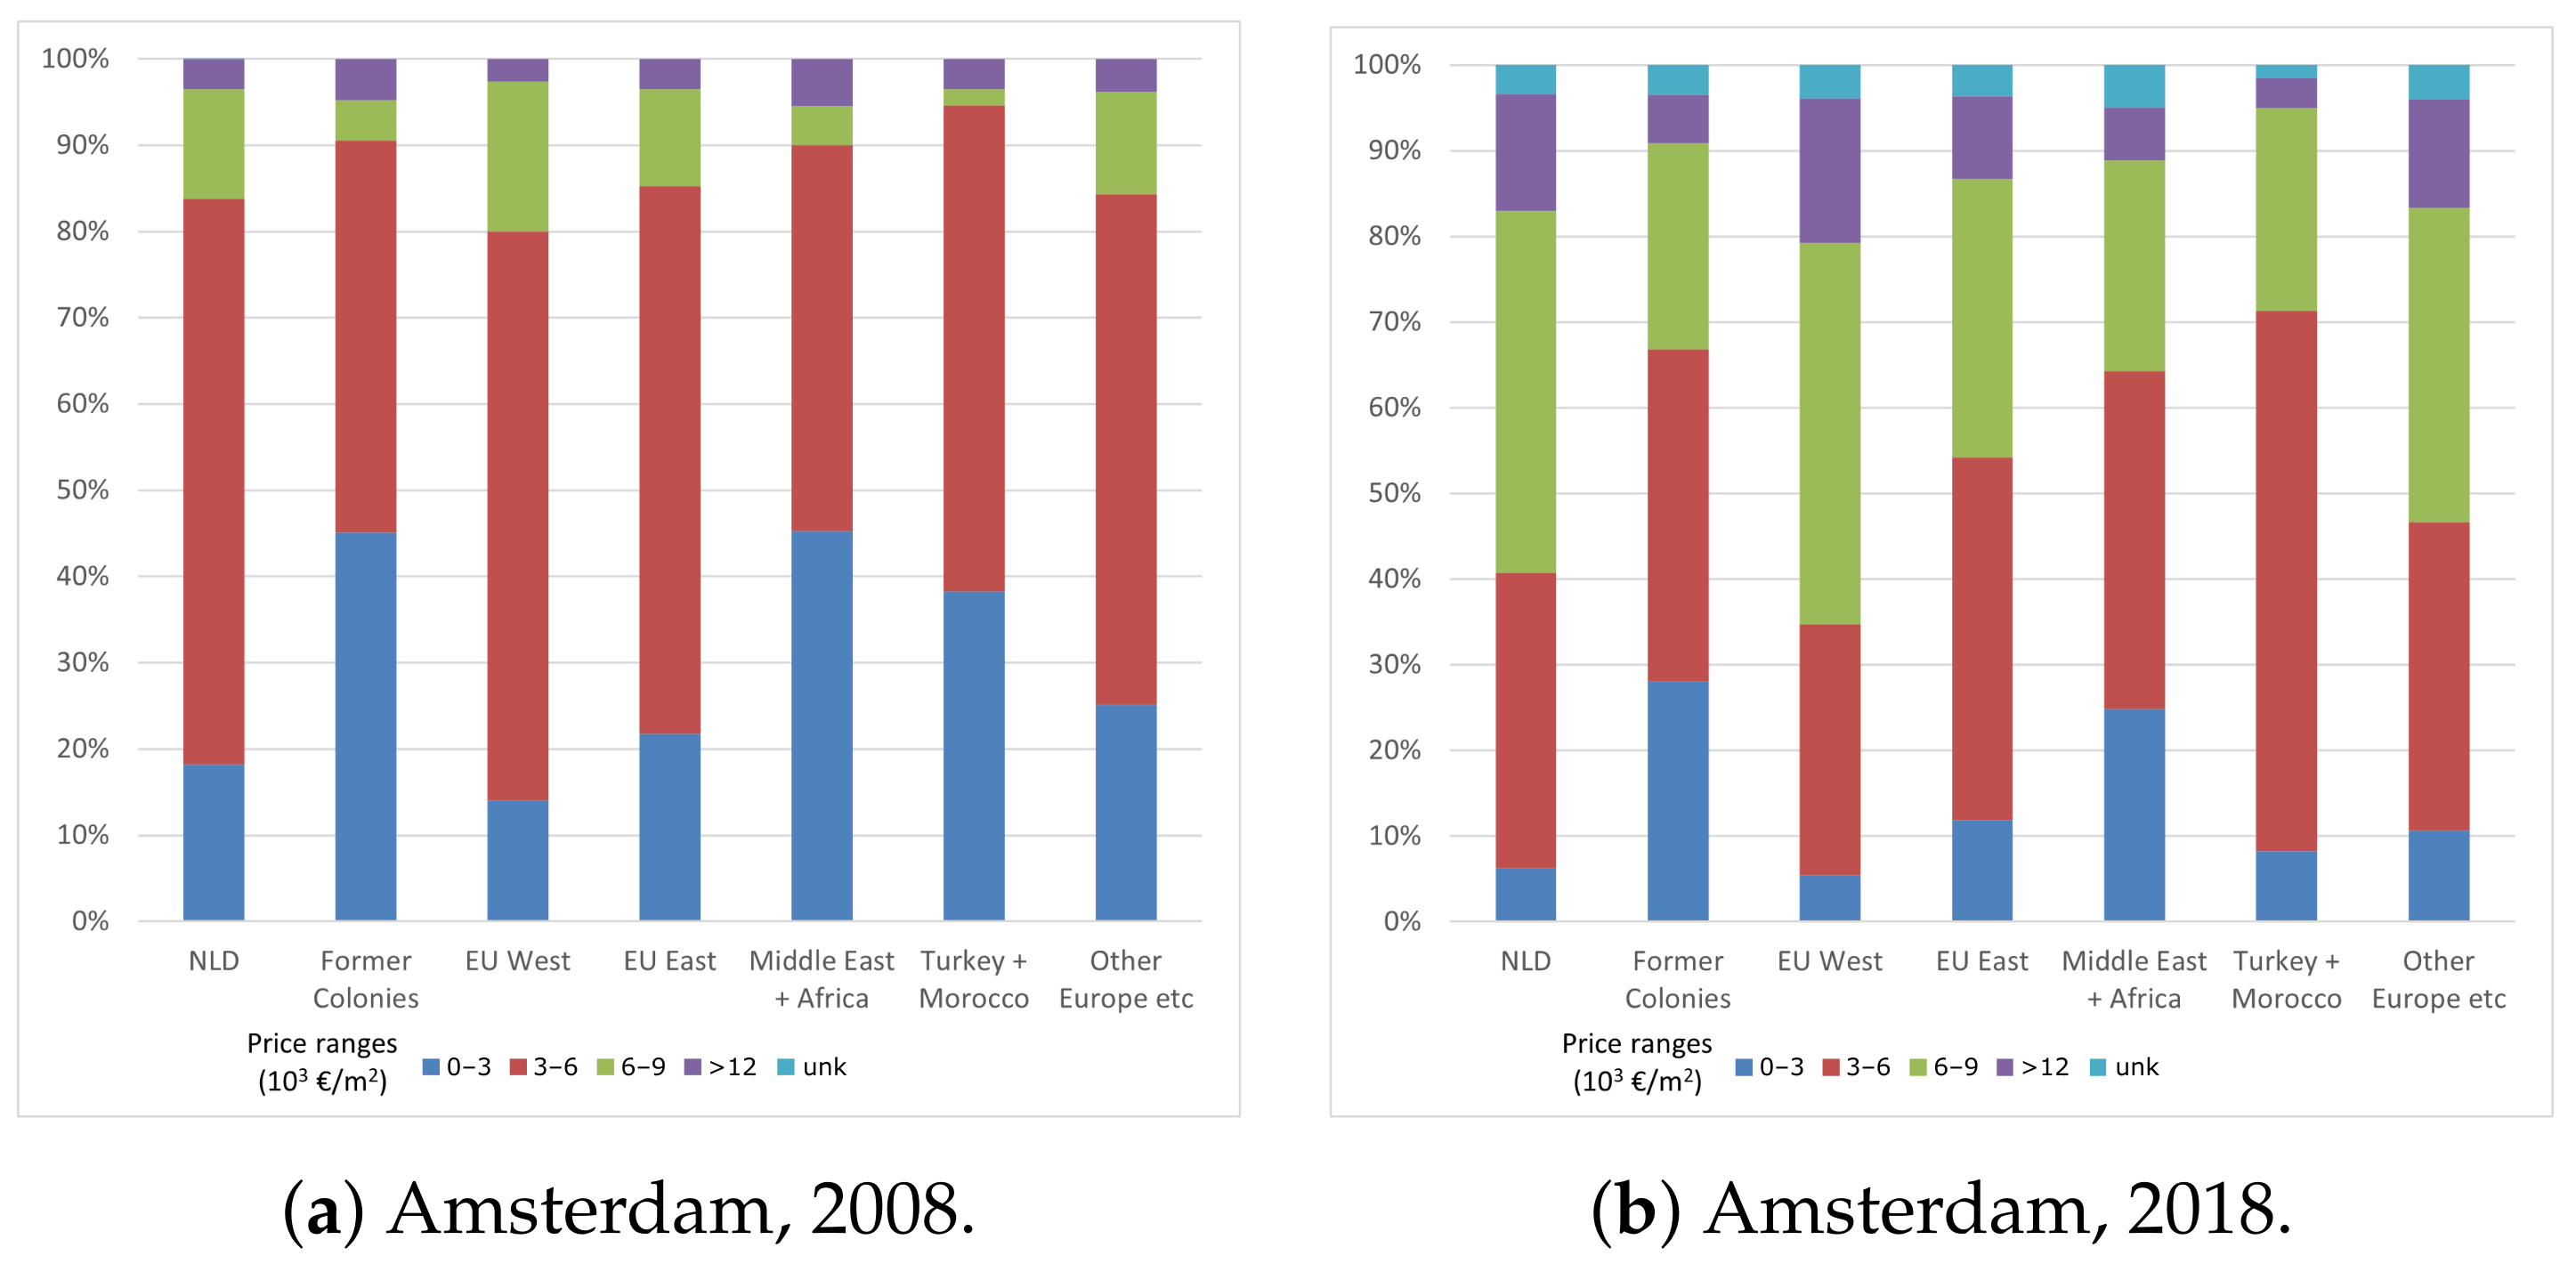
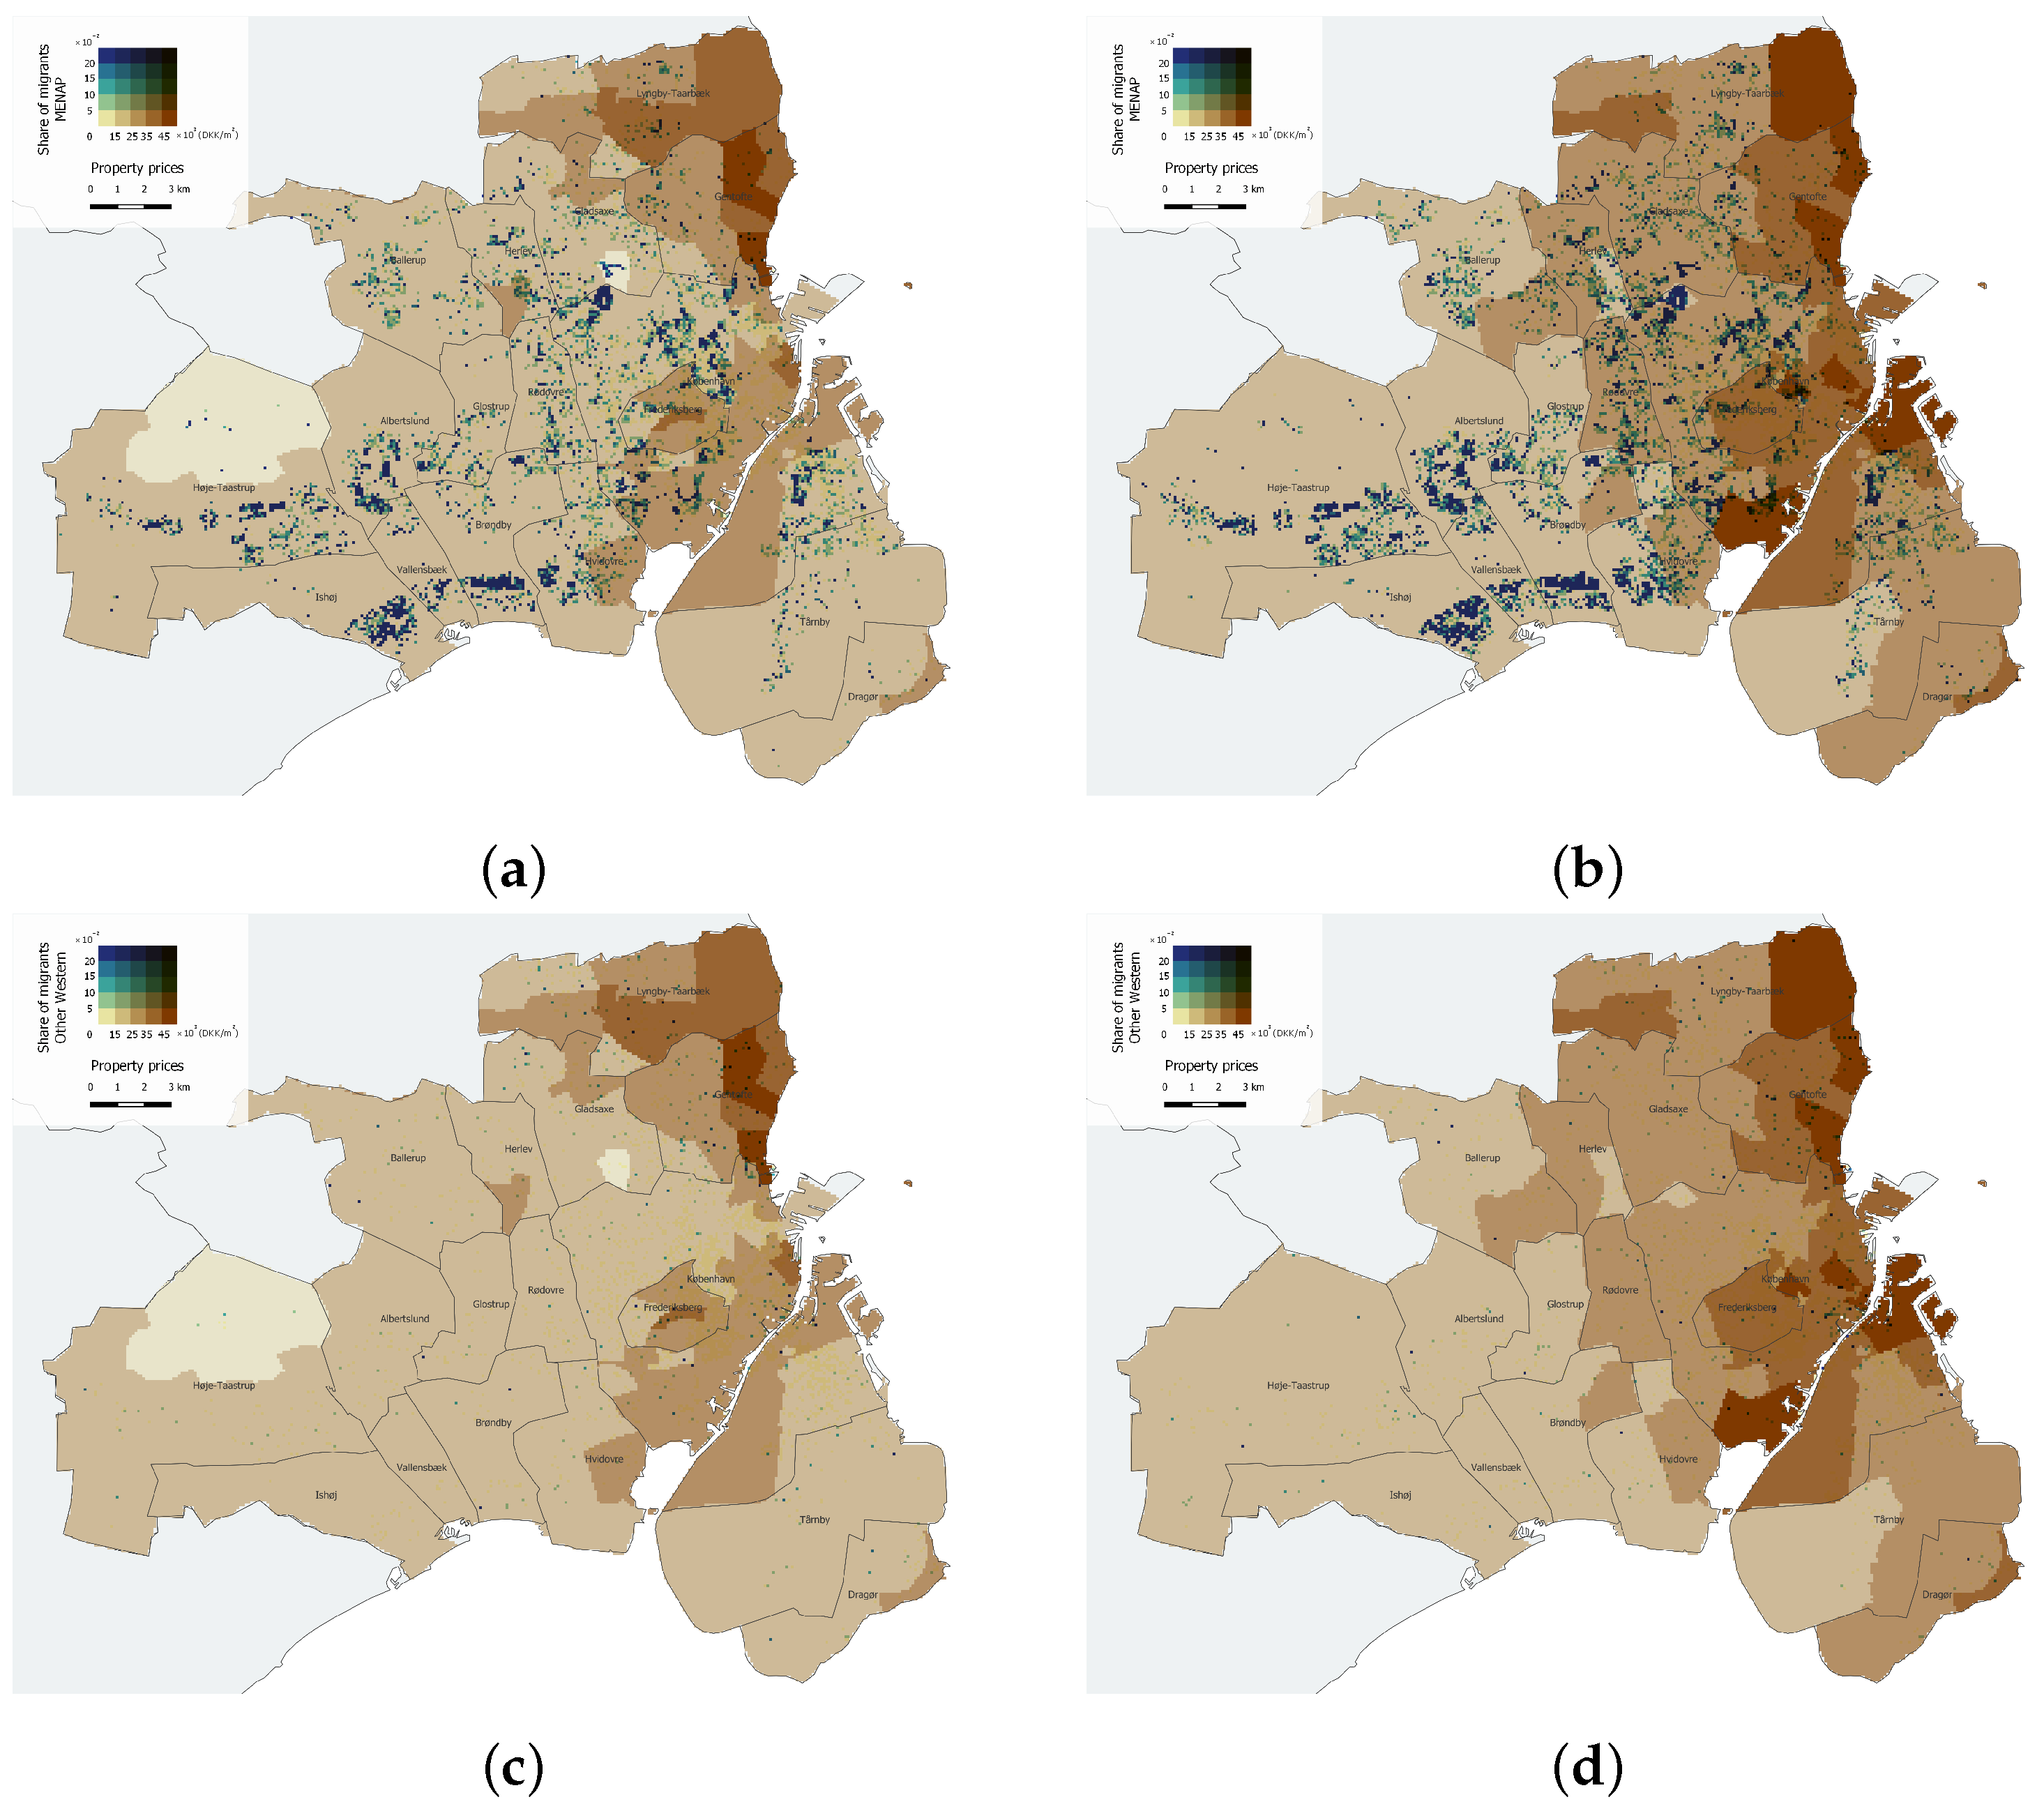
4.3. Real Estate Prices by Migrant Group
5. Discussion
- I. Influences of co-ethnics. High importance scores were found among migrants from the MEA region and the former colonies in Amsterdam, as well as among WEU and other Westerns in Copenhagen.
- II. Influences of dwelling type. The residential area was more important for predicting the distribution of natives and WEU migrants; the number of dwellings was more important for non-Western migrants.
- III. Influences of age as an indicator of migrants’ initial settlement. Distribution by age was the most important factor for migrants derived from EEU and the MEA region.
6. Conclusions
Author Contributions
Funding
Data Availability Statement
Conflicts of Interest
Appendix A. Details on the Case Studies

| Feature | Amsterdam | Copenhagen |
|---|---|---|
| Spatial extent | 219.5 km2 | 527.9 km2 |
| Cells | 42,244 | 114,367 |
| Inhabited cells | 7512 | 21,403 |
| Inhabited cells by natives | 7288 | 21,233 |
| Inhabited cells by migrants | 6782 | 16,818 |
| Case Study | Group | Countries |
|---|---|---|
| Amsterdam | NLD | The Netherlands. |
| EEU | Bulgaria, Hungary, Czech Republic, Poland, Roumania, Slovakia, Estonia, Latvia, Lithuania, Croatia and Slovenia. | |
| WEU | The rest of EU and the United Kingdom (UK). | |
| Turkey + Morocco | Turkey and Morocco. | |
| Middle East + Africa | All countries of Middle East and Africa. | |
| Former Colonies | Aruba, Bonaire, Curaçao, Indonesia, Saba, Saint Maarten-Dutch part, Sint Eustatius and Suriname. | |
| Other Europe etc. | Non-EU European and European Free Trade Association (EFTA) countries, Asia, Oceania and the Americas. | |
| Copenhagen | DNK | Denmark. |
| EEU | Bulgaria, Hungary, Poland, Roumania, Slovakia, Estonia, Latvia, Lithuania, Croatia, Slovenia and Czechoslovakia. | |
| WEU | The rest EU and the EFTA countries, the UK, the Faroe Islands and Greenland. | |
| Non-EU Europe | Yugoslavia, Serbia and Montenegro, and the Soviet Union. | |
| MENAP | Turkey, Algeria, Egypt, Libya, Morocco, Tunisia, Iraq, Iran, Bahrain, Israel, Palestine, Jordan, Kuwait, Lebanon, Oman, Qatar, Saudi Arabia, United Arab Emirates, Syria, Yemen and Pakistan. | |
| Other Western | Canada, United States of America (USA), Australia and New Zealand. | |
| Non-Western | All other countries. |
| Variables | Min. | Max. | Mean | Std. | Range |
|---|---|---|---|---|---|
| Age groups | |||||
| Children | 0 | 295 | 3.94 | 12.70 | 295 |
| Young adults | 0 | 494 | 3.93 | 15.72 | 494 |
| Mobile adults | 0 | 608 | 5.04 | 16.70 | 608 |
| Non-mobile adults | 0 | 583 | 4.97 | 15.05 | 583 |
| Elderly | 0 | 236 | 2.56 | 9.01 | 236 |
| Building features | |||||
| Not used | 0 | 185 | 0.59 | 3.20 | 185 |
| Rented | 0 | 576 | 7.21 | 25.18 | 576 |
| Private | 0 | 164 | 3.12 | 11.06 | 164 |
| Residential area | 0 | 26,681 | 631.35 | 1854.15 | 26,681 |
| Number of dwellings | 0 | 576 | 10.34 | 32.39 | 576 |
| Number of rooms | 0 | 1145 | 33 | 98 | 1145 |
| Building height | 0 | 89.32 | 3.45 | 5.57 | 89.32 |
| Building oldness | 0 | 2016 | 782.88 | 958.99 | 2016 |
| Real estate prices | 0 | 12,064.05 | 891.34 | 2339.12 | 12,064.05 |
| Neighbourhood features | |||||
| Proximity to restaurants and bars | 0 | 1046 | 14.86 | 75.41 | 1046 |
| Proximity to bus stops | 0 | 29 | 1.37 | 3.02 | 29 |
| Proximity to culture | 0 | 42 | 0.57 | 2.83 | 42 |
| Proximity to supermarkets | 0 | 64 | 1.99 | 6.70 | 64 |
| Proximity to a Christian place of worship | 0 | 31 | 3.39 | 6.19 | 31 |
| Proximity to a non-Christian place of worship | 0 | 21 | 1.61 | 3.70 | 21 |
| Proximity to a Buddhist place of worship | 0 | 2 | 0.13 | 0.40 | 2 |
| Proximity to a Christian place of worship | 0 | 20 | 2.12 | 4.03 | 20 |
| Proximity to a Christian place of worship (Catholic) | 0 | 3 | 0.20 | 0.57 | 3 |
| Proximity to a Christian place of worship (Lutheran) | 0 | 1 | 0.07 | 0.25 | 1 |
| Proximity to a Christian place of worship (Protestant) | 0 | 9 | 1 | 1.71 | 9 |
| Proximity to a Hindu place of worship | 0 | 3 | 0.28 | 0.72 | 3 |
| Proximity to a Jewish place of worship | 0 | 4 | 0.28 | 0.86 | 4 |
| Proximity to a Muslim place of worhsip | 0 | 9 | 0.69 | 1.55 | 9 |
| Proximity to a Sunni Muslim place of worship | 0 | 1 | 0.06 | 0.24 | 1 |
| Proximity to a Sikh place of worship | 0 | 3 | 0.17 | 0.49 | 3 |
| Proximity to schools | 0 | 26 | 2.47 | 4.17 | 26 |
| Proximity to train stations | 0 | 7 | 0.74 | 1.44 | 7 |
| Proximity to university | 0 | 4 | 0.22 | 0.83 | 4 |
| RoO | |||||
| Natives | 0 | 796 | 20.76 | 63.49 | 796 |
| Former Colonies | 0 | 499 | 2.04 | 8.42 | 499 |
| EU West | 0 | 140 | 1.59 | 6.02 | 140 |
| EU East | 0 | 68 | 0.47 | 2.03 | 68 |
| Middle East + Africa | 0 | 355 | 1.37 | 6.56 | 355 |
| Turkey + Morocco | 0 | 434 | 2.65 | 13.40 | 434 |
| Other Europe etc | 0 | 377 | 1.90 | 7.07 | 377 |
| Variables | Min. | Max. | Mean | Std. | Range | Variables | Min. | Max. | Mean | Std. | Range |
|---|---|---|---|---|---|---|---|---|---|---|---|
| CoO | |||||||||||
| Afghanistan | 0 | 38 | 0.07 | 0.66 | 38 | Kroatia | 0 | 2 | 0.00 | 0.04 | 2 |
| Albania | 0 | 9 | 0.01 | 0.15 | 9 | Letland | 0 | 4 | 0.01 | 0.13 | 4 |
| Algerije | 0 | 9 | 0.03 | 0.27 | 9 | Libanon | 0 | 7 | 0.02 | 0.19 | 7 |
| Angola | 0 | 6 | 0.01 | 0.13 | 6 | Liberia | 0 | 6 | 0.01 | 0.12 | 6 |
| Argentinia | 0 | 6 | 0.03 | 0.26 | 6 | Libia | 0 | 11 | 0.00 | 0.11 | 11 |
| Aruba | 0 | 3 | 0.00 | 0.05 | 3 | Litouwen | 0 | 6 | 0.02 | 0.18 | 6 |
| Australia | 0 | 14 | 0.05 | 0.34 | 14 | Luxemburg | 0 | 4 | 0.00 | 0.09 | 4 |
| Azerbeidzjan | 0 | 11 | 0.00 | 0.08 | 11 | Malakka | 0 | 5 | 0.01 | 0.09 | 5 |
| Bangladesh | 0 | 8 | 0.01 | 0.14 | 8 | Maleisia | 0 | 5 | 0.01 | 0.11 | 5 |
| Belgisch-Congo | 0 | 2 | 0.00 | 0.06 | 2 | Malta | 0 | 3 | 0.00 | 0.04 | 3 |
| Belgia | 0 | 13 | 0.10 | 0.52 | 13 | Marokko | 0 | 349 | 1.68 | 9.02 | 349 |
| Bolivia | 0 | 4 | 0.01 | 0.10 | 4 | Mauritius | 0 | 3 | 0.00 | 0.05 | 3 |
| Bondsrepubliek Duitsland | 0 | 44 | 0.21 | 1.08 | 44 | Mexico | 0 | 7 | 0.03 | 0.23 | 7 |
| Brazilia | 0 | 17 | 0.12 | 0.65 | 17 | Moldavia | 0 | 3 | 0.00 | 0.06 | 3 |
| Brits Oost-Afrika | 0 | 3 | 0.00 | 0.05 | 3 | Mongolia | 0 | 4 | 0.00 | 0.06 | 4 |
| Brits West-India | 0 | 4 | 0.00 | 0.07 | 4 | Nederland | 0 | 796 | 20.76 | 63.49 | 796 |
| Brits-Guyana | 0 | 8 | 0.02 | 0.20 | 8 | Nederlands Nieuw-Guinea | 0 | 4 | 0.01 | 0.12 | 4 |
| Brits-India | 0 | 8 | 0.04 | 0.28 | 8 | Nederlands-India | 0 | 29 | 0.29 | 1.08 | 29 |
| Brits-Somaliland | 0 | 5 | 0.00 | 0.08 | 5 | Nederlandse Antillen | 0 | 88 | 0.22 | 1.29 | 88 |
| Bulgarije | 0 | 55 | 0.11 | 0.99 | 55 | Nepal | 0 | 10 | 0.01 | 0.23 | 10 |
| Burma | 0 | 6 | 0.00 | 0.10 | 6 | Nicaragua | 0 | 3 | 0.00 | 0.04 | 3 |
| Burundi | 0 | 5 | 0.00 | 0.07 | 5 | Nieuw-Zeeland | 0 | 6 | 0.02 | 0.19 | 6 |
| Cambodja | 0 | 7 | 0.00 | 0.06 | 7 | Nigeria | 0 | 36 | 0.05 | 0.50 | 36 |
| Canada | 0 | 16 | 0.04 | 0.33 | 16 | Noorwegen | 0 | 6 | 0.01 | 0.16 | 6 |
| Canarische Eilanden | 0 | 3 | 0.00 | 0.05 | 3 | Oekraine | 0 | 23 | 0.01 | 0.16 | 23 |
| Ceylon | 0 | 5 | 0.01 | 0.13 | 5 | Onbekend | 0 | 38 | 0.04 | 0.50 | 38 |
| Chili | 0 | 6 | 0.02 | 0.21 | 6 | Oostenrijk | 0 | 8 | 0.03 | 0.25 | 8 |
| China | 0 | 67 | 0.16 | 1.05 | 67 | Opper-Volta | 0 | 6 | 0.00 | 0.07 | 6 |
| Colombia | 0 | 10 | 0.06 | 0.39 | 10 | Pakistan | 0 | 38 | 0.11 | 0.81 | 38 |
| Congo-Kinshasa | 0 | 6 | 0.00 | 0.07 | 6 | Palestina | 0 | 3 | 0.00 | 0.07 | 3 |
| Congo | 0 | 6 | 0.00 | 0.08 | 6 | Panama | 0 | 3 | 0.00 | 0.05 | 3 |
| Costa Rica | 0 | 4 | 0.00 | 0.06 | 4 | Peru | 0 | 7 | 0.02 | 0.20 | 7 |
| Cuba | 0 | 5 | 0.01 | 0.10 | 5 | Polen | 0 | 12 | 0.13 | 0.67 | 12 |
| Cyprus | 0 | 4 | 0.00 | 0.09 | 4 | Portugal | 0 | 13 | 0.08 | 0.49 | 13 |
| Denemarken | 0 | 8 | 0.02 | 0.21 | 8 | Portugees Oost-Afrika | 0 | 3 | 0.00 | 0.05 | 3 |
| Dominicaanse Republiek | 0 | 49 | 0.06 | 0.62 | 49 | Portugees West-Afrika | 0 | 4 | 0.00 | 0.06 | 4 |
| Duitse Democratische Republiek | 0 | 6 | 0.01 | 0.16 | 6 | Puerto Rico | 0 | 3 | 0.00 | 0.04 | 3 |
| Duitsland | 0 | 15 | 0.15 | 0.63 | 15 | Rhodesia | 0 | 3 | 0.00 | 0.04 | 3 |
| Ecuador | 0 | 30 | 0.02 | 0.29 | 30 | Roemenia | 0 | 17 | 0.09 | 0.56 | 17 |
| Egypte | 0 | 36 | 0.13 | 0.88 | 36 | Rusland (oud) | 0 | 2 | 0.00 | 0.05 | 2 |
| El Salvador | 0 | 4 | 0.00 | 0.05 | 4 | Rusland | 0 | 16 | 0.01 | 0.16 | 16 |
| Eritrea | 0 | 23 | 0.02 | 0.34 | 23 | Rwanda | 0 | 5 | 0.00 | 0.06 | 5 |
| Estland | 0 | 4 | 0.01 | 0.10 | 4 | Saoedi-Arabia | 0 | 6 | 0.01 | 0.11 | 6 |
| Ethiopia | 0 | 26 | 0.06 | 0.51 | 26 | Senegal | 0 | 7 | 0.01 | 0.12 | 7 |
| Filipijnen | 0 | 55 | 0.06 | 0.54 | 55 | Siam | 0 | 2 | 0.00 | 0.05 | 2 |
| Finland | 0 | 7 | 0.02 | 0.22 | 7 | Sierra Leone | 0 | 9 | 0.01 | 0.16 | 9 |
| Frankrijk | 0 | 18 | 0.17 | 0.85 | 18 | Singapore | 0 | 7 | 0.01 | 0.15 | 7 |
| Frans West-Afrika | 0 | 5 | 0.00 | 0.06 | 5 | Slovenia | 0 | 3 | 0.00 | 0.04 | 3 |
| Frans-Guyana | 0 | 4 | 0.00 | 0.08 | 4 | Slowakije | 0 | 5 | 0.00 | 0.06 | 5 |
| Gambia | 0 | 5 | 0.00 | 0.09 | 5 | Soedan | 0 | 13 | 0.02 | 0.23 | 13 |
| Ghana | 0 | 104 | 0.21 | 2.22 | 104 | Somalia | 0 | 20 | 0.03 | 0.39 | 20 |
| Goudkust | 0 | 39 | 0.08 | 0.82 | 39 | Sovjet-Unie | 0 | 30 | 0.19 | 0.94 | 30 |
| Griekenland | 0 | 23 | 0.06 | 0.45 | 23 | Spanje | 0 | 26 | 0.14 | 0.71 | 26 |
| Groot-Brittannia | 0 | 35 | 0.28 | 1.29 | 35 | Sri Lanka | 0 | 5 | 0.00 | 0.09 | 5 |
| Guadeloupe | 0 | 3 | 0.00 | 0.04 | 3 | Suriname | 0 | 392 | 1.39 | 6.61 | 392 |
| Guatemala | 0 | 3 | 0.00 | 0.06 | 3 | Syria | 0 | 43 | 0.09 | 0.79 | 43 |
| Guinee | 0 | 8 | 0.01 | 0.14 | 8 | Taiwan | 0 | 7 | 0.01 | 0.16 | 7 |
| Guyana | 0 | 6 | 0.01 | 0.11 | 6 | Tanzania | 0 | 4 | 0.00 | 0.06 | 4 |
| Haiti | 0 | 5 | 0.00 | 0.07 | 5 | Thailand | 0 | 10 | 0.03 | 0.26 | 10 |
| Honduras | 0 | 3 | 0.00 | 0.05 | 3 | Tibet | 0 | 6 | 0.01 | 0.14 | 6 |
| Hongarije | 0 | 10 | 0.05 | 0.35 | 10 | Togo | 0 | 9 | 0.01 | 0.14 | 9 |
| Hongkong | 0 | 14 | 0.05 | 0.36 | 14 | Trinidad en Tobago | 0 | 6 | 0.00 | 0.08 | 6 |
| Ierland | 0 | 8 | 0.04 | 0.29 | 8 | Tsjechia | 0 | 5 | 0.00 | 0.06 | 5 |
| IJsland | 0 | 5 | 0.00 | 0.07 | 5 | Tsjecho-Slowakije | 0 | 7 | 0.04 | 0.29 | 7 |
| India | 0 | 326 | 0.17 | 1.98 | 326 | Tunesia | 0 | 10 | 0.02 | 0.26 | 10 |
| Indonesia | 0 | 17 | 0.12 | 0.59 | 17 | Turkije | 0 | 119 | 0.97 | 5.03 | 119 |
| Irak | 0 | 22 | 0.07 | 0.53 | 22 | Uganda | 0 | 14 | 0.01 | 0.19 | 14 |
| Iran | 0 | 47 | 0.09 | 0.53 | 47 | Uruguay | 0 | 4 | 0.01 | 0.10 | 4 |
| Israal | 0 | 11 | 0.05 | 0.37 | 11 | Venezuela | 0 | 7 | 0.02 | 0.20 | 7 |
| Italiaans-Somaliland | 0 | 3 | 0.00 | 0.06 | 3 | Verenigde Arabische Emiraten | 0 | 3 | 0.00 | 0.06 | 3 |
| Italia | 0 | 28 | 0.21 | 1.02 | 28 | Verenigde Staten van Amerika | 0 | 63 | 0.21 | 1.18 | 63 |
| Ivoorkust | 0 | 9 | 0.01 | 0.12 | 9 | Vietnam | 0 | 6 | 0.02 | 0.20 | 6 |
| Jamaica | 0 | 6 | 0.00 | 0.09 | 6 | Zambia | 0 | 4 | 0.00 | 0.06 | 4 |
| Japan | 0 | 26 | 0.04 | 0.42 | 26 | Zaire | 0 | 6 | 0.00 | 0.10 | 6 |
| Joegoslavia | 0 | 15 | 0.15 | 0.74 | 15 | Zimbabwe | 0 | 5 | 0.00 | 0.05 | 5 |
| Jordania | 0 | 7 | 0.00 | 0.11 | 7 | Zuid-Afrika | 0 | 18 | 0.05 | 0.36 | 18 |
| Kaapverdia | 0 | 7 | 0.01 | 0.17 | 7 | Zuid-Korea | 0 | 10 | 0.01 | 0.18 | 10 |
| Kameroen | 0 | 7 | 0.01 | 0.12 | 7 | Zuid-Rhodesia | 0 | 4 | 0.00 | 0.05 | 4 |
| Kenya | 0 | 6 | 0.01 | 0.11 | 6 | Zweden | 0 | 10 | 0.03 | 0.27 | 10 |
| Koeweit | 0 | 5 | 0.00 | 0.08 | 5 | Zwitserland | 0 | 8 | 0.03 | 0.24 | 8 |
| Korea | 0 | 6 | 0.00 | 0.09 | 6 |
References
- Pagliara, F.; Wilson, A. The State-of-the-Art in Building Residential Location Models. In Residential Location Choice; Springer: Berlin/Heidelberg, Germany, 2010; pp. 1–20. [Google Scholar] [CrossRef]
- Zolfaghari, A.; Sivakumar, A.; Polak, J.W. Choice set pruning in residential location choice modelling: A comparison of sampling and choice set generation approaches in greater London. Transp. Plan. Technol. 2012, 35, 87–106. [Google Scholar] [CrossRef]
- Schirmer, P.M.; Eggermond, M.A.B.V.; Axhausen, K.W. The role of location in residential location choice models. J. Transp. Land Use 2014, 7, 3–21. [Google Scholar] [CrossRef]
- Walker, J.L.; Li, J. Latent lifestyle preferences and household location decisions. J. Geogr. Syst. 2007, 9, 77–101. [Google Scholar] [CrossRef]
- Zondag, B.; Pieters, M. Influence of Accessibility on Residential Location Choice. Transp. Res. Rec. 2005, 1902, 63–70. [Google Scholar] [CrossRef]
- Chen, J.; Chen, C.; Timmermans, H.J.P. Accessibility trade-offs in household residential location decisions. Transp. Res. Rec. 2008, 2077, 71–79. [Google Scholar] [CrossRef]
- Mulder, C.H. The family context and residential choice: A challenge for new research. Popul. Space Place 2007, 13, 265–278. [Google Scholar] [CrossRef]
- Mulder, C.H.; Cooke, T.J. Family ties and residential locations. Popul. Space Place 2009, 15, 299–304. [Google Scholar] [CrossRef]
- Axhausen, K.W.; Scott, D.M.; König, A.; Jürgens, C. Locations, commitments and activity spaces. In Human Behaviour and Traffic Networks; Springer: Berlin/Heidelberg, Germany, 2001. [Google Scholar] [CrossRef]
- Pinjari, A.R.; Bhat, C.R.; Hensher, D.A. Residential self-selection effects in an activity time-use behavior model. Transp. Res. Part B Methodol. 2009, 43, 729–748. [Google Scholar] [CrossRef]
- Pinjari, A.R.; Pendyala, R.M.; Bhat, C.R.; Waddell, P.A. Modeling the choice continuum: An integrated model of residential location, auto ownership, bicycle ownership, and commute tour mode choice decisions. Transportation 2011, 38, 933–958. [Google Scholar] [CrossRef]
- de Palma, A.; Motamedi, K.; Picard, N.; Waddell, P. A Model of Residential Location Choice with Endogenous Housing Prices and Traffic for the Paris Region. Eur. Transp. 2005, 31, 67–82. [Google Scholar]
- Muhammad, A.H.; Miller, E.J. Reference-Dependent Residential Location Choice Model within a Relocation Context. Transp. Res. Rec. 2009, 2133, 92–99. [Google Scholar]
- Beckers, P.; Boschman, S. Residential choices of foreign highly skilled workers in the Netherlands and the role of neighbourhood and urban regional characteristics. Urban Stud. 2019, 56, 760–777. [Google Scholar] [CrossRef]
- Frenkel, A.; Bendit, E.; Kaplan, S. Residential location choice of knowledge-workers: The role of amenities, workplace and lifestyle. Cities 2013, 35, 33–41. [Google Scholar] [CrossRef]
- Florida, R. The Rise of the Creative Class: And How It’s Transforming Work, Leisure, Community and Everyday Life; BasicBooks: New York, NY, USA, 2002. [Google Scholar]
- Dimou, M.; Ettouati, S.; Schaffar, A. From dusk till dawn: The residential mobility and location preferences of immigrants in France. Ann. Reg. Sci. 2020, 65, 253–280. [Google Scholar] [CrossRef]
- Richardson, K. Attracting and Retaining Foreign Highly Skilled Staff in Times of Global Crisis: A Case Study of Vancouver, British Columbia’s Biotechnology Sector. Popul. Space Place 2016, 22, 428–440. [Google Scholar] [CrossRef]
- International Organization for Migration IOM. World Migration Report 2022. 2021. Available online: https://publications.iom.int/books/world-migration-report-2022 (accessed on 23 July 2023).
- World Bank. Urban Development. 2023. Available online: https://www.worldbank.org/en/topic/urbandevelopment/overview (accessed on 23 July 2023).
- United Nations Human Settlements Programme UN-Habitat. World Cities Report 2022: Envisaging the Future of Cities; Technical Report; United Nations Human Settlements Programme: Nairobi, Kenya, 2022. [Google Scholar]
- Aslund, O. Now and forever? Initial and subsequent location choices of immigrants. Reg. Sci. Urban Econ. 2005, 35, 141–165. [Google Scholar] [CrossRef]
- Perez, L.; Dragicevic, S.; Gaudreau, J. A geospatial agent-based model of the spatial urban dynamics of immigrant population: A study of the island of Montreal, Canada. PLoS ONE 2019, 14, e0219188. [Google Scholar] [CrossRef] [PubMed]
- Søholt, S.; Lynnebakke, B. Do Immigrants’ Preferences for Neighbourhood Qualities Contribute to Segregation? The Case of Oslo. J. Ethn. Migr. Stud. 2015, 41, 2314–2335. [Google Scholar] [CrossRef]
- Ibraimovic, T.; Hess, S. A latent class model of residential choice behaviour and ethnic segregation preferences. Hous. Stud. 2018, 33, 544–564. [Google Scholar] [CrossRef]
- Robinson, D.; Reeve, K.; Casey, R. The Housing Pathways of New Immigrants; Joseph Rowntree Foundation: London, UK, 2007. [Google Scholar]
- Wang, C.; Li, C.; Wang, M.; Yang, S. Transnational migrants in Shanghai: Residential spatial patterns and the underlying driving forces. Popul. Space Place 2020, 26, e2272. [Google Scholar] [CrossRef]
- Andersen, H.S. Spatial assimilation? The development in immigrants’ residential career with duration of stay in Denmark. J. Hous. Built Environ. 2016, 31, 297–320. [Google Scholar] [CrossRef]
- Chihaya, G.K.; Marcińczak, S.; Strömgren, M.; Lindgren, U.; Tammaru, T. Trajectories of Spatial Assimilation or Place Stratification? A Typology of Residence and Workplace Histories of Newly Arrived Migrants in Sweden. Int. Migr. Rev. 2022, 56, 433–462. [Google Scholar] [CrossRef]
- Breiman, L. Random forests. Mach. Learn. 2001, 45, 5–32. [Google Scholar] [CrossRef]
- Hapfelmeier, A.; Ulm, K. A new variable selection approach using Random Forests. Comput. Stat. Data Anal. 2013, 60, 50–69. [Google Scholar] [CrossRef]
- Couronné, R.; Probst, P.; Boulesteix, A.L. Random forest versus logistic regression: A large-scale benchmark experiment. BMC Bioinform. 2018, 19, 270. [Google Scholar] [CrossRef]
- Boulesteix, A.L.; Janitza, S.; Kruppa, J.; König, I.R. Overview of random forest methodology and practical guidance with emphasis on computational biology and bioinformatics. Wiley Interdiscip. Rev. Data Min. Knowl. Discov. 2012, 2, 493–507. [Google Scholar] [CrossRef]
- Voges, L.F.; Jarren, L.C.; Seifert, S. Exploitation of surrogate variables in random forests for unbiased analysis of mutual impact and importance of features. Bioinformatics 2023, 39, btad471. [Google Scholar] [CrossRef]
- Stevens, F.R.; Gaughan, A.E.; Linard, C.; Tatem, A.J. Disaggregating Census Data for Population Mapping Using Random Forests with Remotely-Sensed and Ancillary Data. PLoS ONE 2015, 10, e0107042. [Google Scholar] [CrossRef] [PubMed]
- Georgati, M.; Monteiro, J.; Martins, B.; Keßler, C. Spatial Disaggregation of Population Subgroups Leveraging Self-Trained Multi-Output Gradient Boosting Regression Trees. AGILE GISci. Ser. 2022, 3, 5. [Google Scholar] [CrossRef]
- Luo, Y.; Yan, J.; McClure, S.C.; Li, F. Socioeconomic and environmental factors of poverty in China using geographically weighted random forest regression model. Environ. Sci. Pollut. Res. Int. 2022, 29, 33205–33217. [Google Scholar] [CrossRef]
- Kopeć, A.; Trybała, P.; Głąbicki, D.; Buczyńska, A.; Owczarz, K.; Bugajska, N.; Kozińska, P.; Chojwa, M.; Gattner, A. Application of remote sensing, gis and machine learning with geographically weighted regression in assessing the impact of hard coal mining on the natural environment. Sustainability 2020, 12, 9338. [Google Scholar] [CrossRef]
- Cosacov, N. Residential Choices. In The Wiley Blackwell Encyclopedia of Urban and Regional Studies; John Wiley & Sons: Hoboken, NJ, USA, 2019; pp. 1–5. [Google Scholar] [CrossRef]
- Hunt, L.M.; Boots, B.; Kanaroglou, P.S. Spatial choice modelling: New opportunities to incorporate space into substitution patterns. Prog. Hum. Geogr. 2004, 28, 746–766. [Google Scholar] [CrossRef]
- Pagliara, F.; Simmonds, D.; Preston, J. Residential Location Choice: Models and Applications; Springer: Berlin/Heidelberg, Germany, 2010. [Google Scholar] [CrossRef]
- Wen, T. Spatial Assimilation. In The Wiley Blackwell Encyclopedia of Urban and Regional Studies; John Wiley & Sons: Hoboken, NJ, USA, 2019. [Google Scholar] [CrossRef]
- Massey, D.S.; Mullan, B.P. Processes of Hispanic and Black Spatial Assimilation. Am. J. Sociol. 1984, 89, 836–873. [Google Scholar] [CrossRef]
- Massey, D.S.; Denton, N.A. Spatial Assimilation as a Socioeconomic Outcome. Am. Sociol. Rev. 1985, 50, 94–106. [Google Scholar] [CrossRef]
- Alba, R.D.; Logan, J. Minority proximity to whites in suburbs: An individual-level analysis of segregation. Am. J. Sociol. 1993, 98, 1388–1427. [Google Scholar] [CrossRef]
- Charles, C.Z. The Dynamics of Racial Residential Segregation. Annu. Rev. Sociol. 2003, 29, 167–207. [Google Scholar] [CrossRef]
- Vogiazides, L. Exiting distressed neighbourhoods: The timing of spatial assimilation among international migrants in Sweden. Popul. Space Place 2018, 24, e2169. [Google Scholar] [CrossRef]
- Thomas, R. Viewing immigrants’ neighbourhood and housing choices through the lens of community resilience. Sapiens 2013, 6. [Google Scholar]
- Burgess, E.W. The Growth of the City: An Introduction to a Research Project. In Urban Ecology; Springer: Boston, MA, USA, 2008; pp. 71–78. [Google Scholar] [CrossRef]
- Zorlu, A.; Mulder, C.H. Initial and Subsequent Location Choices of Immigrants to the Netherlands. Reg. Stud. 2008, 42, 245–264. [Google Scholar] [CrossRef]
- Bolt, G.; van Kempen, R. Ethnic Segregation and Residential Mobility: Relocations of Minority Ethnic Groups in the Netherlands. J. Ethn. Migr. Stud. 2010, 36, 333–354. [Google Scholar] [CrossRef]
- Hedman, L. Moving Near Family? The Influence of Extended Family on Neighbourhood Choice in an Intra-urban Context. Popul. Space Place 2013, 19, 32–45. [Google Scholar] [CrossRef]
- Coenen, A.; Verhaeghe, P.; de Putte, B.V. Ethnic residential segregation: A matter of ethnic minority household characteristics? Popul. Space Place 2019, 25, e2244. [Google Scholar] [CrossRef]
- Pais, J.; South, S.J.; Crowder, K. Metropolitan Heterogeneity and Minority Neighborhood Attainment. Soc. Probl. 2012, 59, 258–281. [Google Scholar] [CrossRef] [PubMed]
- Martori, J.C.; Madariaga, R. Residential segregation by nationalities: A global and multilevel approach to Barcelona and Madrid (2008–2018). Popul. Space Place 2023, 29, e2655. [Google Scholar] [CrossRef]
- Catney, G.; Lloyd, C.D. Population Grids for Analysing Long-Term Change in Ethnic Diversity and Segregation. Spat. Demogr. 2020, 8, 215–249. [Google Scholar] [CrossRef]
- Malmberg, B.; Andersson, E.K.; Nielsen, M.M.; Haandrikman, K. Residential Segregation of European and Non-European Migrants in Sweden: 1990–2012. Eur. J. Popul. 2018, 34, 169–193. [Google Scholar] [CrossRef]
- Sleutjes, B.; de Valk, H.A.G.; Ooijevaar, J. The Measurement of Ethnic Segregation in the Netherlands: Differences between Administrative and Individualized Neighbourhoods. Eur. J. Popul. 2018, 34, 195–224. [Google Scholar] [CrossRef] [PubMed]
- Imeraj, L.; Willaert, D.; de Valk, H.A.G. A comparative approach towards ethnic segregation patterns in Belgian cities using multiscalar individualized neighborhoods. Urban Geogr. 2018, 39, 1221–1246. [Google Scholar] [CrossRef]
- Rogne, A.F.; Andersson, E.K.; Malmberg, B.; Lyngstad, T.H. Neighbourhood Concentration and Representation of Non-European Migrants: New Results from Norway. Eur. J. Popul. 2020, 36, 71–83. [Google Scholar] [CrossRef] [PubMed]
- Openshaw, S. The Modifiable Areal Unit Problem; CATMOG, 38; Geo: Norwich, UK, 1980. [Google Scholar]
- Andersson, E.K.; Lyngstad, T.H.; Sleutjes, B. Comparing Patterns of Segregation in North-Western Europe: A Multiscalar Approach. Eur. J. Popul. 2018, 34, 151–168. [Google Scholar] [CrossRef] [PubMed]
- Jones, K.; Johnston, R.; Manley, D.; Owen, D.; Charlton, C. Ethnic Residential Segregation: A Multilevel, Multigroup, Multiscale Approach Exemplified by London in 2011. Demography 2015, 52, 1995–2019. [Google Scholar] [CrossRef] [PubMed]
- OpenStreetMap Contributors. 2022. Available online: http://download.geofabrik.de/europe.html (accessed on 3 February 2022).
- Bygnings-og Boligregistret (BBR). Forside—BBR Teknik. 2022. Available online: https://teknik.bbr.dk/forside (accessed on 28 April 2021).
- PDOK. PDOK—3D Downloads. 2022. Available online: https://3d.kadaster.nl/basisvoorziening-3d/ (accessed on 28 April 2021).
- Gemeente Amsterdam. Maps Amsterdam. Available online: https://maps.amsterdam.nl/open_geodata/?LANG=en (accessed on 3 February 2022).
- Movia Trafik. Movia. 2022. Available online: https://www.moviatrafik.dk/ (accessed on 28 April 2021).
- Hastie, T.; Tibshirani, R.; Friedman, J. The Elements of Statistical Learning Data Mining, Inference, and Prediction, 2nd ed.; Springer: New York, NY, USA, 2009. [Google Scholar] [CrossRef]
- Géron, A. Hands-on Machine Learning with Scikit-Learn and TensorFlow; O’Reilly Media, Inc.: Sebastopol, CA, USA, 2009. [Google Scholar]
- Liaw, A.; Wiener, M. Classification and regression by randomForest. R News 2002, 2, 18–22. [Google Scholar]
- Nembrini, S.; König, I.R.; Wright, M.N. The revival of the Gini importance? Bioinformatics 2018, 34, 3711–3718. [Google Scholar] [CrossRef]
- Pedregosa, F.; Varoquaux, G.; Gramfort, A.; Michel, V.; Thirion, B.; Grisel, O.; Blondel, M.; Prettenhofer, P.; Weiss, R.; Dubourg, V.; et al. Scikit-learn: Machine Learning in Python. J. Mach. Learn. Res. 2011, 12, 2825–2830. [Google Scholar]
- Nicodemus, K.K. Letter to the Editor: On the stability and ranking of predictors from random forest variable importance measures. Brief. Bioinform. 2011, 12, 369–373. [Google Scholar] [CrossRef]
- Calle, M.L.; Urrea, V. Letter to the Editor: Stability of Random Forest importance measures. Brief. Bioinform. 2011, 12, 86–89. [Google Scholar] [CrossRef]
- Matplotlib—Visualization with Python. 2023. Available online: https://matplotlib.org/ (accessed on 5 September 2023).
- Seaborn: Statistical Data Visualization. 2023. Available online: https://seaborn.pydata.org/ (accessed on 5 September 2023).
- Andersen, H.S.; Andersson, R.; Wessel, T.; Vilkama, K. The impact of housing policies and housing markets on ethnic spatial segregation: Comparing the capital cities of four Nordic welfare states. Eur. J. Hous. Policy 2016, 16, 1–30. [Google Scholar] [CrossRef]
- Andersson, E.K.; Malmberg, B.; Costa, R.; Sleutjes, B.; Stonawski, M.J.; de Valk, H.A.G. A Comparative Study of Segregation Patterns in Belgium, Denmark, the Netherlands and Sweden: Neighbourhood Concentration and Representation of Non-European Migrants. Eur. J. Popul. 2018, 34, 251–275. [Google Scholar] [CrossRef]
- Arbaci, S. Ethnic segregation, housing systems and welfare regimes in Europe. Eur. J. Hous. Policy 2007, 7, 401–433. [Google Scholar] [CrossRef]
- Tammaru, T.; Marcińczak, S.; Aunap, R.; van Ham, M. Inequalities and Segregation across the Long-Term Economic Cycle: An Analysis of South and North European Cities; IDEAS Working Paper Series from RePEc; IZA—Institute of Labor Economics: Bonn, Germany, 2007. [Google Scholar]
- Deloitte. Average Sales Price of New and Existing Residential Property in Europe in 2021, per Country (In Euros Per Square Meter). 2022. Available online: https://www.statista.com/statistics/722905/average-residential-square-meter-prices-in-eu-28-per-country/ (accessed on 5 September 2023).
- Kveladze, I.; Georgati, M.; Kessler, C.; Hansen, H.S. Analytics of historical human migration patterns: Use cases of Amsterdam and Copenhagen. J. Locat. Based Serv. 2023. [Google Scholar] [CrossRef]
- Gemeente Amsterdam, Bureau Onderzoek en Statistiek. Stadsdelen in Cijfers 2013; Technical Report; Gemeente Amsterdam, Bureau Onderzoek en Statistiek: Amsterdam, The Netherlands, 2013.
- Georgati, M.; Keßler, C. Spatially Explicit Population Projections: The case of Copenhagen, Denmark. AGILE GISci. Ser. 2021, 2, 1–6. [Google Scholar] [CrossRef]
- Lent, M.V.; Fisher, W.; Mancuso, M. An explainable artificial intelligence system for small-unit tactical behavior. In Proceedings of the National Conference on Artificial Intelligence, San Jose, CA, USA, 25–29 July 2004. [Google Scholar]
- Carvalho, D.V.; Pereira, E.M.; Cardoso, J.S. Machine learning interpretability: A survey on methods and metrics. Electronics 2019, 8, 832. [Google Scholar] [CrossRef]
- Erickson, B.O.; Esser, D.E.; Turner, K.L. Spatial Dynamics of Racialized Income Inequality in the Washington, DC, Metropolitan Area. Prof. Geogr. 2021, 73, 72–84. [Google Scholar] [CrossRef]
- Andersen, N.T. Organizing against all Odds: Filipina chambermaids in Copenhagen, 1970s–1990s. Women’s Hist. Rev. 2021, 30, 241–255. [Google Scholar] [CrossRef]
- Garssen, J.; Nicolaas, H. Fertility of Turkish and Moroccan women in the Netherlands. Demogr. Res. 2008, 19, 1249–1280. [Google Scholar] [CrossRef]


| Determinants | Description | Data Source |
|---|---|---|
| Demographic attributes | ||
| Age | The total population divided into five groups: children, students, mobile adults, non-mobile adults and the elderly. | Amsterdam: OIS, Copenhagen: DST |
| Marriages | The number of marriages. | Copenhagen: DST |
| Educational attainment | The share of people with tertiary education. | Copenhagen: DST |
| High and low income | The population in the highest and lowest decile of the yearly equivalent disposable income. | Copenhagen: DST |
| Building attributes | ||
| Building height and construction year | The average height and year of construction of the buildings in the corresponding grid cell. | Amsterdam: PDOK [66], Copenhagen: Bygnings-og Boligregistret (BBR) [65] |
| Dimensions, usage and ownership status | The total number of residential dwellings and rooms, the size of residential area in m2, the share of unoccupied or rented units and the share of private or public year-round dwellings. | Amsterdam: OIS, Copenhagen: DST |
| Neighbourhood attributes | ||
| Real estate prices | For Copenhagen, the layer represents the average purchase price per square metre of the dwellings sold. For Amsterdam, the property value map is the output of an interpolation process disaggregated to grid cells from the neighbourhood level, taking the average value in the provided range. | Amsterdam: Gemeente Amsterdam [67], Copenhagen: Bygnings-og Boligregistret (BBR) [65] |
| Proximity to bus stops, train stations, schools, universities, leisure and cultural facilities (e.g., restaurants, cinemas), and places of worship by religion | The total number of accessible services/ facilities within walking or cycling distance. | Amsterdam: OpenStreetMap contributors [64], Copenhagen: OpenStreetMap contributors [64], Bygnings-og Boligregistret (BBR) [65], Movia Trafik [68] |
| Determinants | Natives | Former Colonies | EU West | EU East | Middle East + Africa | Turkey + Morocco | Rest |
|---|---|---|---|---|---|---|---|
| Age groups | 4.11 | 12.63 | 9.19 | 78.31 | 24.85 | 69.61 | 22.44 |
| Children | 0.25 | 1.60 | 0.35 | 0.96 | 11.00 | 66.12 | 1.90 |
| Young adults | 0.30 | 0.75 | 6.35 | 51.59 | 8.18 | 1.72 | 11.91 |
| Mobile adults | 0.35 | 1.51 | 2.34 | 24.69 | 1.35 | 0.18 | 8.23 |
| Non-mobile adults | 3.12 | 8.45 | 0.09 | 0.31 | 3.77 | 0.96 | 0.30 |
| Elderly | 0.09 | 0.32 | 0.06 | 0.76 | 0.55 | 0.63 | 0.10 |
| Building features | 92.63 | 10.17 | 68.02 | 5.92 | 7.25 | 7.02 | 62.22 |
| Residential area | 72.57 | 1.06 | 61.88 | 0.41 | 0.50 | 0.17 | 45.89 |
| Number of dwellings | 4.58 | 4.34 | 3.62 | 1.25 | 0.80 | 0.10 | 14.34 |
| Number of rooms | 15.13 | 3.56 | 0.15 | 0.83 | 0.48 | 1.23 | 0.34 |
| Building height | 0.01 | 0.01 | 0.15 | 0.90 | 2.15 | 0.03 | 0.63 |
| Building oldness | 0.24 | 0.31 | 0.25 | 0.43 | 0.55 | 0.26 | 0.54 |
| Not used | 0.00 | 0.06 | 0.47 | 0.49 | 0.09 | 0.01 | 0.07 |
| Rented | 0.01 | 0.83 | 0.22 | 0.27 | 1.61 | 4.84 | 0.23 |
| Private | 0.09 | 0.00 | 1.28 | 1.34 | 1.07 | 0.38 | 0.18 |
| Neighbourhood features | 0.87 | 11.37 | 2.84 | 3.78 | 1.85 | 15.38 | 0.67 |
| Real estate prices | 0.65 | 1.25 | 0.16 | 0.88 | 0.20 | 0.11 | 0.02 |
| Prox. to supermarkets | 0.01 | 0.02 | 0.12 | 0.17 | 0.13 | 0.40 | 0.13 |
| Prox. to restaurants and bars | 0.02 | 0.08 | 0.49 | 0.47 | 0.18 | 0.50 | 0.18 |
| Prox. to cultural spaces | 0.00 | 0.01 | 0.02 | 0.03 | 0.03 | 0.02 | 0.04 |
| Prox. to bus stops | 0.00 | 0.00 | 0.03 | 0.20 | 0.21 | 0.08 | 0.06 |
| Prox. to train stations | 0.02 | 5.03 | 0.02 | 0.44 | 0.07 | 11.28 | 0.02 |
| Prox. to schools | 0.03 | 0.11 | 0.54 | 0.66 | 0.61 | 0.44 | 0.10 |
| Prox. to university | 0.00 | 0.00 | 0.22 | 0.02 | 0.00 | 0.00 | 0.02 |
| Prox. to a place of Christian worship | 0.04 | 0.03 | 1.19 | 0.20 | 0.08 | 0.16 | 0.06 |
| Prox. to a place of non-Christian worship | 0.10 | 4.84 | 0.05 | 0.71 | 0.34 | 2.39 | 0.04 |
| Presence of natives/migrant groups | 2.39 | 65.83 | 19.96 | 11.98 | 66.1 | 7.95 | 14.67 |
| Natives | 0.44 | 8.60 | 1.05 | 1.47 | 6.73 | 0.48 | |
| Former Colonies | 0.45 | 0.26 | 0.14 | 61.40 | 0.63 | 0.21 | |
| EU West | 1.06 | 0.09 | 3.14 | 0.97 | 0.10 | 13.19 | |
| EU East | 0.16 | 0.05 | 0.63 | 0.18 | 0.05 | 0.36 | |
| Middle East + Africa | 0.40 | 62.15 | 0.05 | 0.16 | 0.30 | 0.24 | |
| Turkey + Morocco | 0.21 | 2.06 | 0.09 | 1.87 | 1.44 | 0.19 | |
| Other Europe etc | 0.11 | 1.04 | 10.33 | 5.62 | 0.64 | 0.14 | |
| R-squared | 0.938 | 0.804 | 0.825 | 0.526 | 0.736 | 0.792 | 0.663 |
| Determinants | Natives | EEU | WEU | MENAP | Non-EU Europe | Other Non-Western | Other Western |
|---|---|---|---|---|---|---|---|
| Age groups | 1.31 | 61.79 | 27.92 | 52.05 | 55.25 | 47.69 | 6.17 |
| Children | 0.25 | 0.56 | 1.76 | 46.05 | 8.57 | 2.80 | 1.09 |
| Young adults | 0.32 | 42.84 | 15.91 | 3.67 | 5.55 | 7.07 | 2.30 |
| Mobile adults | 0.30 | 18.00 | 7.45 | 0.78 | 40.61 | 35.40 | 1.05 |
| Non-mobile adults | 0.44 | 0.26 | 2.72 | 1.54 | 0.46 | 2.39 | 1.28 |
| Elderly | 0.00 | 0.13 | 0.08 | 0.01 | 0.06 | 0.03 | 0.45 |
| Social features | 0.45 | 3.57 | 11.4 | 25.6 | 4.2 | 25.87 | 6.23 |
| Marriages | 0.11 | 0.14 | 1.44 | 0.52 | 0.16 | 2.48 | 1.05 |
| Higher education | 0.14 | 0.16 | 4.75 | 18.58 | 0.57 | 0.78 | 2.67 |
| High income | 0.01 | 0.11 | 0.78 | 0.43 | 0.35 | 0.01 | 1.00 |
| Low income | 0.19 | 3.16 | 4.43 | 6.07 | 3.12 | 22.60 | 1.51 |
| Building features | 96.42 | 2.8 | 43.85 | 1.59 | 4.74 | 0.6 | 9 |
| Residential area | 66.55 | 0.13 | 42.47 | 0.10 | 0.34 | 0.04 | 2.69 |
| Number of dwellings | 0.75 | 1.34 | 0.22 | 0.07 | 1.50 | 0.21 | 1.14 |
| Number of rooms | 28.98 | 0.08 | 0.34 | 0.01 | 1.44 | 0.03 | 1.36 |
| Number of floors | 0.00 | 0.04 | 0.03 | 0.07 | 0.16 | 0.06 | 0.35 |
| Building oldness | 0.01 | 0.57 | 0.38 | 0.95 | 0.37 | 0.09 | 0.80 |
| Not used | 0.10 | 0.17 | 0.16 | 0.07 | 0.08 | 0.05 | 1.36 |
| Rented | 0.00 | 0.21 | 0.14 | 0.12 | 0.49 | 0.08 | 0.50 |
| Private | 0.03 | 0.26 | 0.10 | 0.20 | 0.36 | 0.04 | 0.64 |
| Public | 0.00 | 0.00 | 0.01 | 0.00 | 0.00 | 0.00 | 0.16 |
| Neighbourhood features | 0.02 | 4.98 | 1.07 | 0.61 | 2.63 | 1.02 | 8.65 |
| Real estate prices | 0.00 | 0.05 | 0.02 | 0.07 | 0.03 | 0.01 | 0.29 |
| Prox. to supermarkets | 0.00 | 1.03 | 0.12 | 0.04 | 0.08 | 0.04 | 0.65 |
| Prox. to bus stops | 0.00 | 0.03 | 0.04 | 0.02 | 0.13 | 0.01 | 0.91 |
| Prox. to train stations | 0.00 | 0.60 | 0.07 | 0.05 | 0.98 | 0.06 | 0.53 |
| Prox. to cultural spaces | 0.00 | 0.67 | 0.21 | 0.06 | 0.20 | 0.18 | 0.28 |
| Prox. to schools | 0.00 | 0.98 | 0.09 | 0.13 | 0.46 | 0.14 | 0.65 |
| Prox. to places of leisure | 0.00 | 0.15 | 0.06 | 0.09 | 0.40 | 0.17 | 0.27 |
| Prox. to bars and restaurants | 0.02 | 0.25 | 0.38 | 0.09 | 0.15 | 0.13 | 4.56 |
| Prox. to a place of Christian worship | 0.00 | 1.18 | 0.05 | 0.05 | 0.18 | 0.28 | 0.48 |
| Prox. to a place of non-Christian worship | 0.00 | 0.04 | 0.03 | 0.01 | 0.02 | 0.00 | 0.03 |
| Presence of natives/migrant groups | 1.8 | 26.84 | 15.76 | 20.15 | 33.17 | 24.83 | 69.94 |
| DNK | 1.39 | 2.04 | 1.76 | 0.67 | 0.77 | 2.14 | |
| EEU | 0.26 | 3.38 | 0.56 | 0.94 | 5.32 | 0.60 | |
| WEU | 0.31 | 2.30 | 0.61 | 0.88 | 3.44 | 63.93 | |
| MENAP | 0.48 | 0.28 | 2.06 | 25.47 | 14.52 | 0.14 | |
| Non-EU Europe | 0.30 | 0.77 | 2.07 | 0.91 | 0.66 | 0.61 | |
| Other Non-Western | 0.26 | 22.03 | 0.98 | 16.21 | 5.12 | 2.52 | |
| Other Western | 0.19 | 0.07 | 5.23 | 0.10 | 0.09 | 0.12 | |
| R-squared | 0.961 | 0.517 | 0.682 | 0.785 | 0.457 | 0.666 | 0.552 |
| City | RoO | Price per Square Meter | Difference | Percentage | |
|---|---|---|---|---|---|
| 2008 | 2018 | Change | |||
| Amsterdam (€/m2) | NLD | 3999.15 | 6198.26 | 2199.11 | 54.99 |
| Former Colonies | 3087.10 | 4687.16 | 1600.06 | 51.83 | |
| EU West | 4292.56 | 6521.69 | 2229.13 | 51.93 | |
| EU East | 3875.81 | 5501.21 | 1625.40 | 41.94 | |
| Middle East + Africa | 3025.40 | 4728.88 | 1703.45 | 56.31 | |
| Turkey + Morocco | 3112.10 | 4857.10 | 1745.00 | 56.07 | |
| Other Europe etc | 3801.01 | 5898.65 | 2097.64 | 55.19 | |
| Copenhagen (DKK/m2) | DNK | 23,963.24 | 33,144.63 | 9181.39 | 38.31 |
| EEU | 23,895.33 | 31,706.37 | 7811.04 | 32.69 | |
| WEU | 25,494.21 | 36,254.49 | 10,760.28 | 42.21 | |
| MENAP | 21,687.94 | 29,275.37 | 7587.43 | 34.98 | |
| Non-EU Europe | 22,473.48 | 31,272.98 | 8799.50 | 39.16 | |
| Other Non-Western | 23,595.73 | 32,188.45 | 8592.72 | 36.42 | |
| Other Western | 26,554.56 | 37,619.51 | 11,064.95 | 41.67 | |
Disclaimer/Publisher’s Note: The statements, opinions and data contained in all publications are solely those of the individual author(s) and contributor(s) and not of MDPI and/or the editor(s). MDPI and/or the editor(s) disclaim responsibility for any injury to people or property resulting from any ideas, methods, instructions or products referred to in the content. |
© 2023 by the authors. Licensee MDPI, Basel, Switzerland. This article is an open access article distributed under the terms and conditions of the Creative Commons Attribution (CC BY) license (https://creativecommons.org/licenses/by/4.0/).
Share and Cite
Georgati, M.; Hansen, H.S.; Keßler, C. Random Forest Variable Importance Measures for Spatial Dynamics: Case Studies from Urban Demography. ISPRS Int. J. Geo-Inf. 2023, 12, 460. https://doi.org/10.3390/ijgi12110460
Georgati M, Hansen HS, Keßler C. Random Forest Variable Importance Measures for Spatial Dynamics: Case Studies from Urban Demography. ISPRS International Journal of Geo-Information. 2023; 12(11):460. https://doi.org/10.3390/ijgi12110460
Chicago/Turabian StyleGeorgati, Marina, Henning Sten Hansen, and Carsten Keßler. 2023. "Random Forest Variable Importance Measures for Spatial Dynamics: Case Studies from Urban Demography" ISPRS International Journal of Geo-Information 12, no. 11: 460. https://doi.org/10.3390/ijgi12110460
APA StyleGeorgati, M., Hansen, H. S., & Keßler, C. (2023). Random Forest Variable Importance Measures for Spatial Dynamics: Case Studies from Urban Demography. ISPRS International Journal of Geo-Information, 12(11), 460. https://doi.org/10.3390/ijgi12110460