1. Introduction
Road traffic accidents (RTAs) are one of the major causes of death, with an annual estimation of 1.3 million fatalities [
1]. Reports show that individuals aged between 5 and 29, male and in countries of low to middle income have a higher probability of participating in a traffic accident [
1,
2]; additionally, the risk is greater for vulnerable road users—motorcyclists, cyclists, and pedestrians—than for those inside a car.
Apart from the direct causes, other factors, such as population density, are somehow related to the frequency of accidents [
3,
4,
5,
6,
7], being established that population densities have different relations with the frequency of accidents. Some studies detail further that accidents with minor or serious consequences are more frequent in urban areas, i.e., regions with higher population density, whereas accidents with fatal victims are more likely in rural areas [
4].
1.1. Location
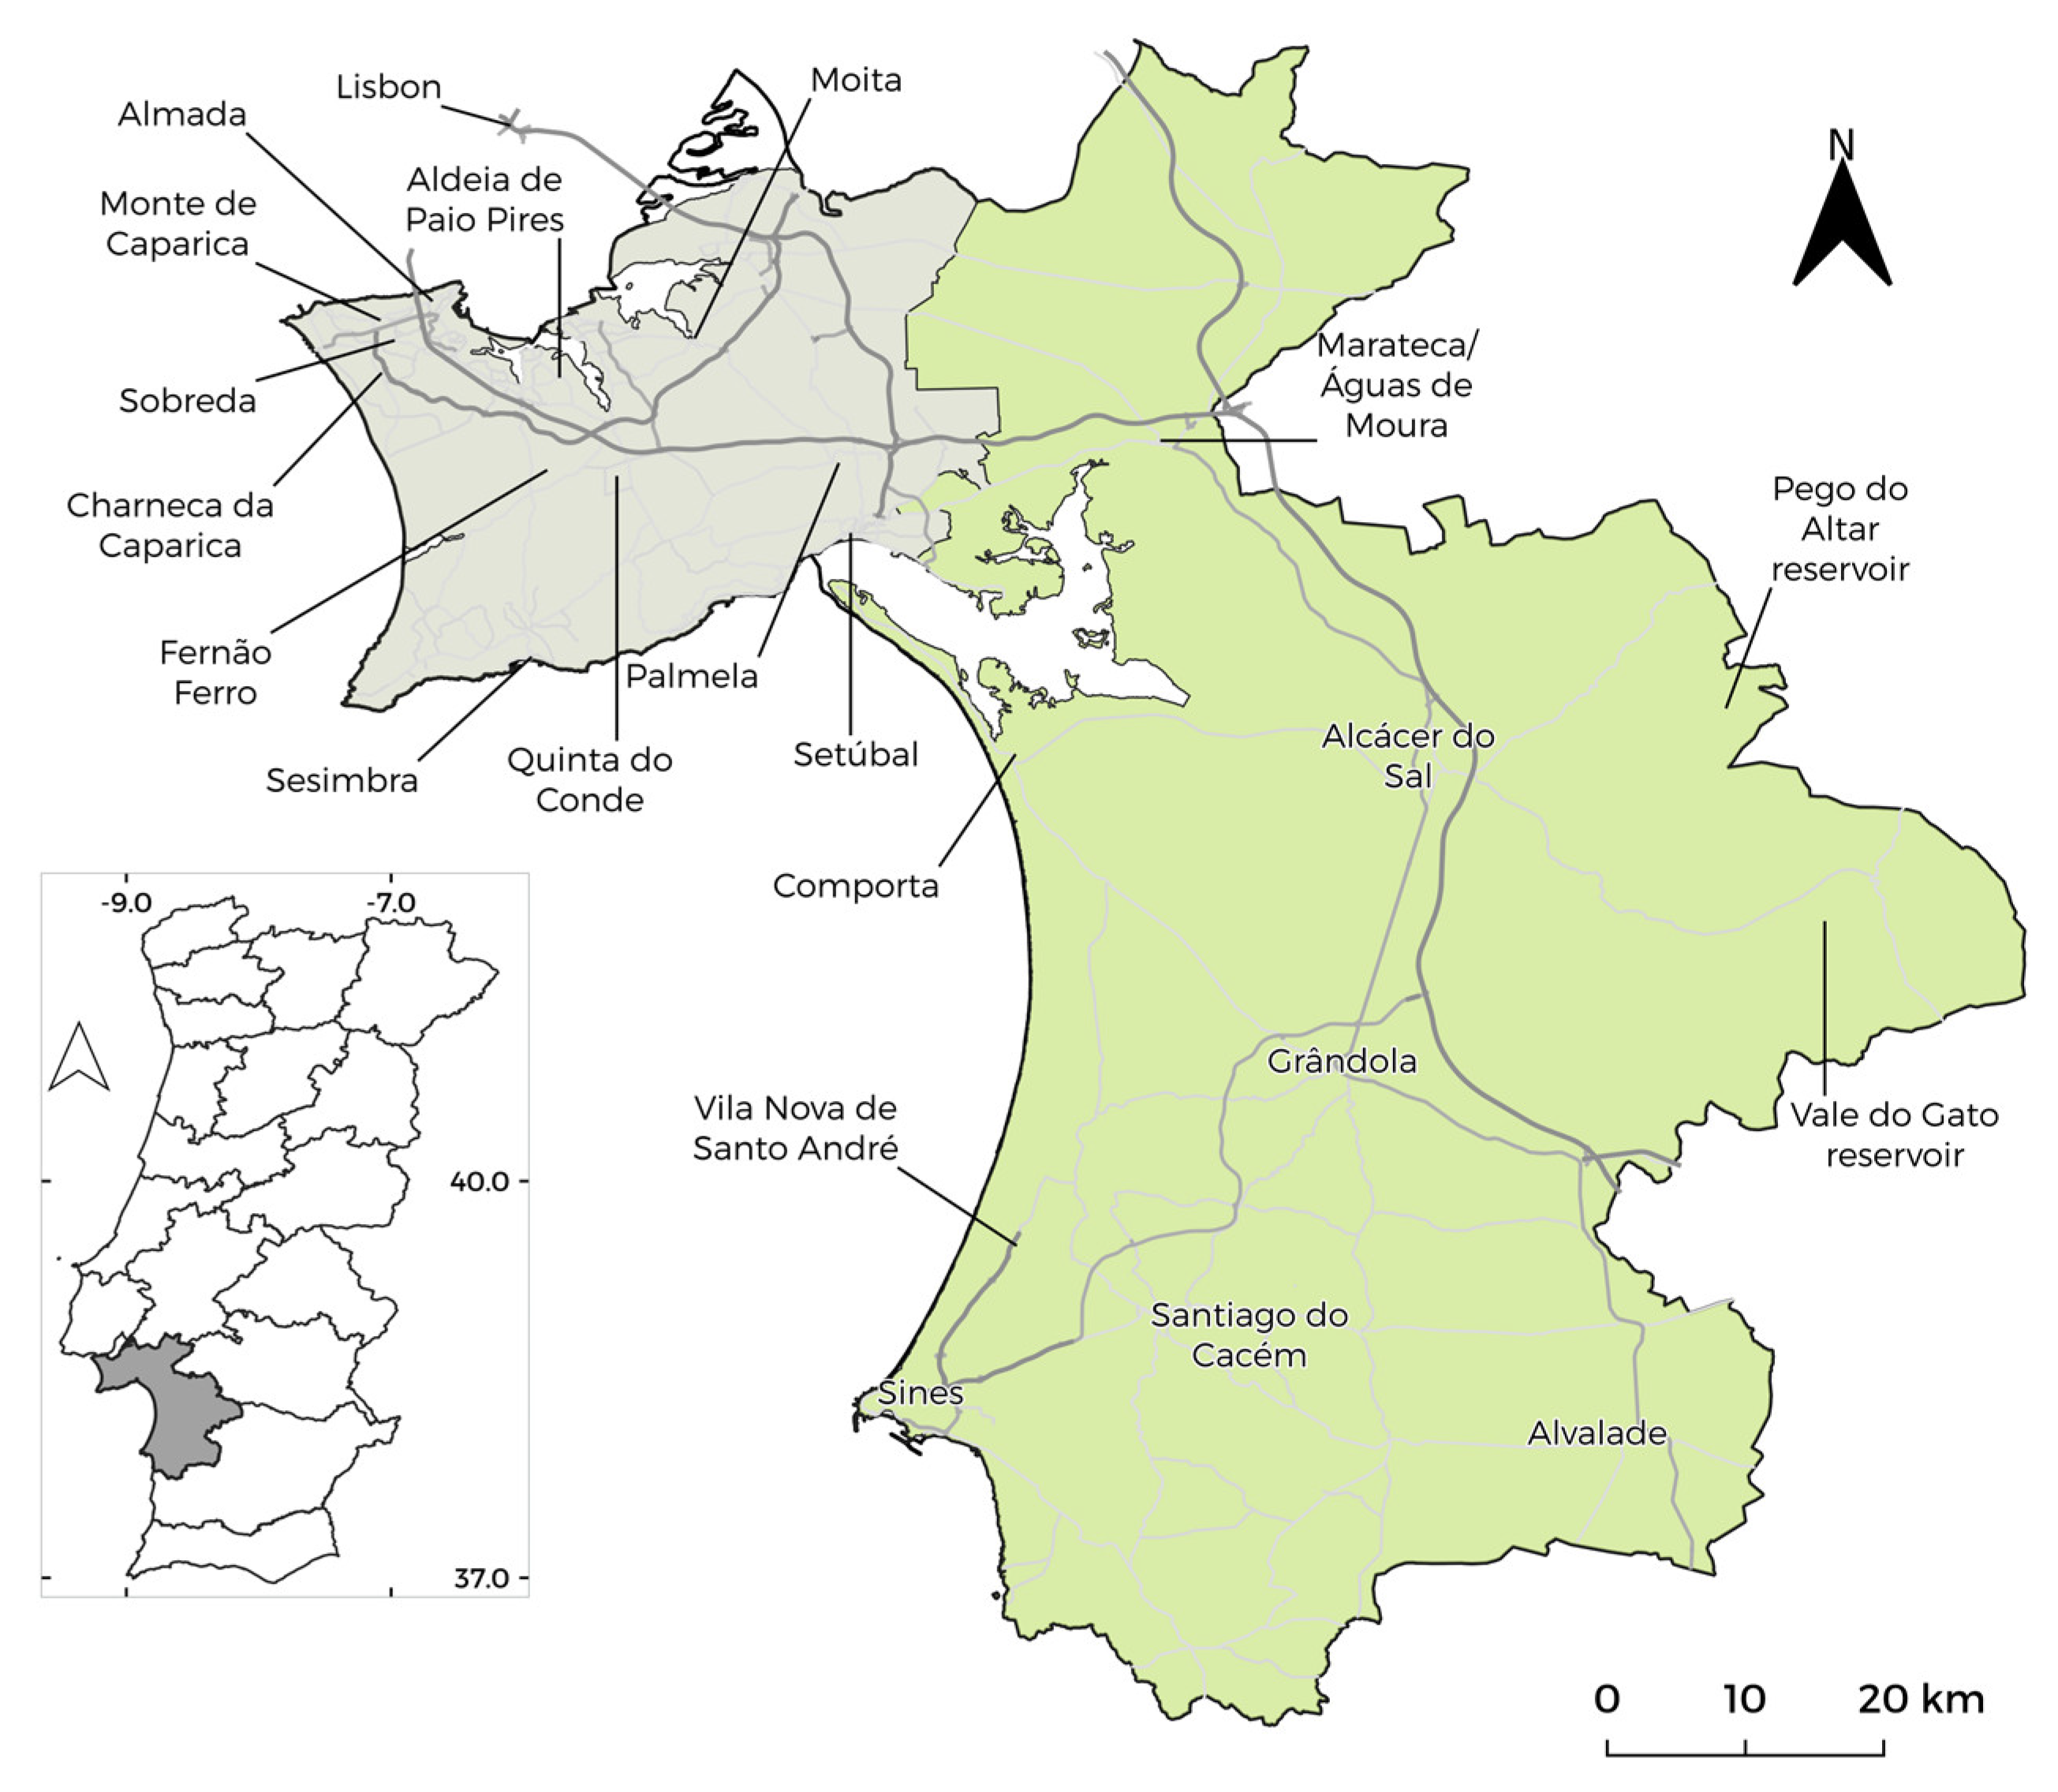
Setúbal district, this work’s case study, is located near Lisbon, Portugal, and comprises a mix of both urban and rural areas. Its northern part can be seen as a city dormitory where lives a relevant part of the Lisbon workforce. As so, most of the district population is housed in the northern part of the district with good access to the Lisbon city centre. In the southern regions, the population density is relatively lower, although it comprises an industrial belt, the Sines city, and its seaport. The remaining territory is considered rural areas or low-density population centers, such as Alcácer do Sal, Grândola or Santiago do Cacém (
Figure 1).
This work is a contribution to the ongoing project MOPREVIS-MOdelation and PREdiction of traffic accidents in the Setúbal district endorsed as a partnership between national security forces, i.e., Guarda Nacional Republicana (GNR) and the University of Évora. The project aims to create the knowledge base and the necessary tools to understand RTAs utilizing spatial analysis, complemented by machine learning and artificial intelligence approaches.
Herein the results from different approaches of spatial analysis using a Geographic Information Systems (GIS) perspective are presented and compared exploiting a multi-sourced spatial dataset using the RTAs from Setúbal district, Portugal as a case study. The results obtained provide new insights and a deeper knowledge of the RTAs problem and provide ‘food for thought’ for decision-makers and authorities to foster new approaches to the prevention and mitigation of an important societal problem.
This work is designed with a two-tier approach: firstly, to verify the usability of different methods to identify RTA patterns; and secondly, to understand the location of RTAs patterns in the Setubal District providing clues to decision and policymakers. The combined use of density and clustering methods to understand RTA patterns is herein proposed as a more complete and novel approach to this complex problem.
1.2. Determinants for RTAs in Setúbal District
The statistical approach conducted to describe the RTAs in the Setúbal District [
8] provided new perceptions and novel information considering what are the underlying factors for RTAs in the study region. The data period is from 2016 to 2019 and comprises 28,103 accidents of which 570 included serious or fatal victims.
Several physical factors are listed as contributing to the occurrence of RTAs. Considering the road typology, the municipal, the national roads and the complementary itineraries, bridges and highways are the most prone sites for accidents with seriously injured or fatal victims (SFV). Accidents where the weather description includes hail, fog, smoke, or strong wind, are more likely to imply SFV. The lack of use of personal protective equipment implies two and a half times higher odds of having SFV.
The temporal factors indicate that non-labour hours have more accidents with SFV. The RTAs occurring between 1–2 am and 6–7 am have five times more odds of including SFV. Another conclusion implies that the days that are more prone to RTAs are Thursdays, Fridays and Sundays. Wednesday is the weekday that has fewer accidents with SFV.
The statistical analysis of RTAs and their geographical location indicates that Alcácer do Sal, Grândola and Palmela are the municipalities where accidents with more SFV occur. The RTAs in these municipalities imply two times higher odds of including SFV. Accidents outside the urban areas are twice more likely to include SFV.
One must note that although some of these factors were expected from common sense reasoning, others are not obvious or priorly expected. The factors related to the spatial location of accidents particularly drew our attention and one must note that a higher risk of having accidents with serious injuries or fatal victims is not necessarily related to higher road traffic or higher population densities.
3. Methodology
The methods applied in this work are a combination of classic RTA analysis, mostly based on hotspot identification with more unconventional spatial methodologies, including Density Based Spatial Clustering and Applications with Noise, i.e., DBSCAN [
15] (and references therein) and autocorrelation methods, such as Getis-Ord-Gi [
16,
17] and Local Moran-I [
18].
3.1. Data Collection
The RTAs from the period of 2016–2019 were selected for analysis and thorough data validation and cleaning was completed. The supporting database contains 947 variables, with all the information that is associated with each RTA: date, time, location (e.g., latitude, longitude, and street name), type of accident (e.g., collision, pedestrian running over, etc.), severity (e.g., property damage, minor injuries, serious injuries, or deaths), number of victims, concurring weather and type and conditions of the road, among others. Notwithstanding, in the database, only the RTAs with serious or fatal victims possess all the information for most of the fields; otherwise, for the simpler car crashes with no victims, only a limited amount of information is available. The database used is from the RTAs under the jurisdiction of GNR and corresponds to nearly 5000 square kilometers, which is approximately 94% of the Setúbal district area.
3.2. Data Validation, Cleaning and Filtering
Data validation involves the confirmation of the RTA’s location and, therefore, detailed maps of the locations were spatially analysed to attest to their position. Conflicting locations or non-conformable sites were corrected; when no definitive decision was possible, they were discarded. The total number of non-conformable positions did not exceed 0.1% of all the data analysed and, therefore, we consider the dataset to be suitable for the envisaged analyses.
Data cleaning was also performed to remove the data that is not directly connected with RTAs. One example of this type of information is the car crashes that occur in parking lots, and hence are not conditioned by the road network, have different causes and, therefore, are not classified as RTAs.
The complete dataset was filtered creating two datasets that were analysed separately: (I) all accidents and (II) accidents with fatalities and/or major injuries.
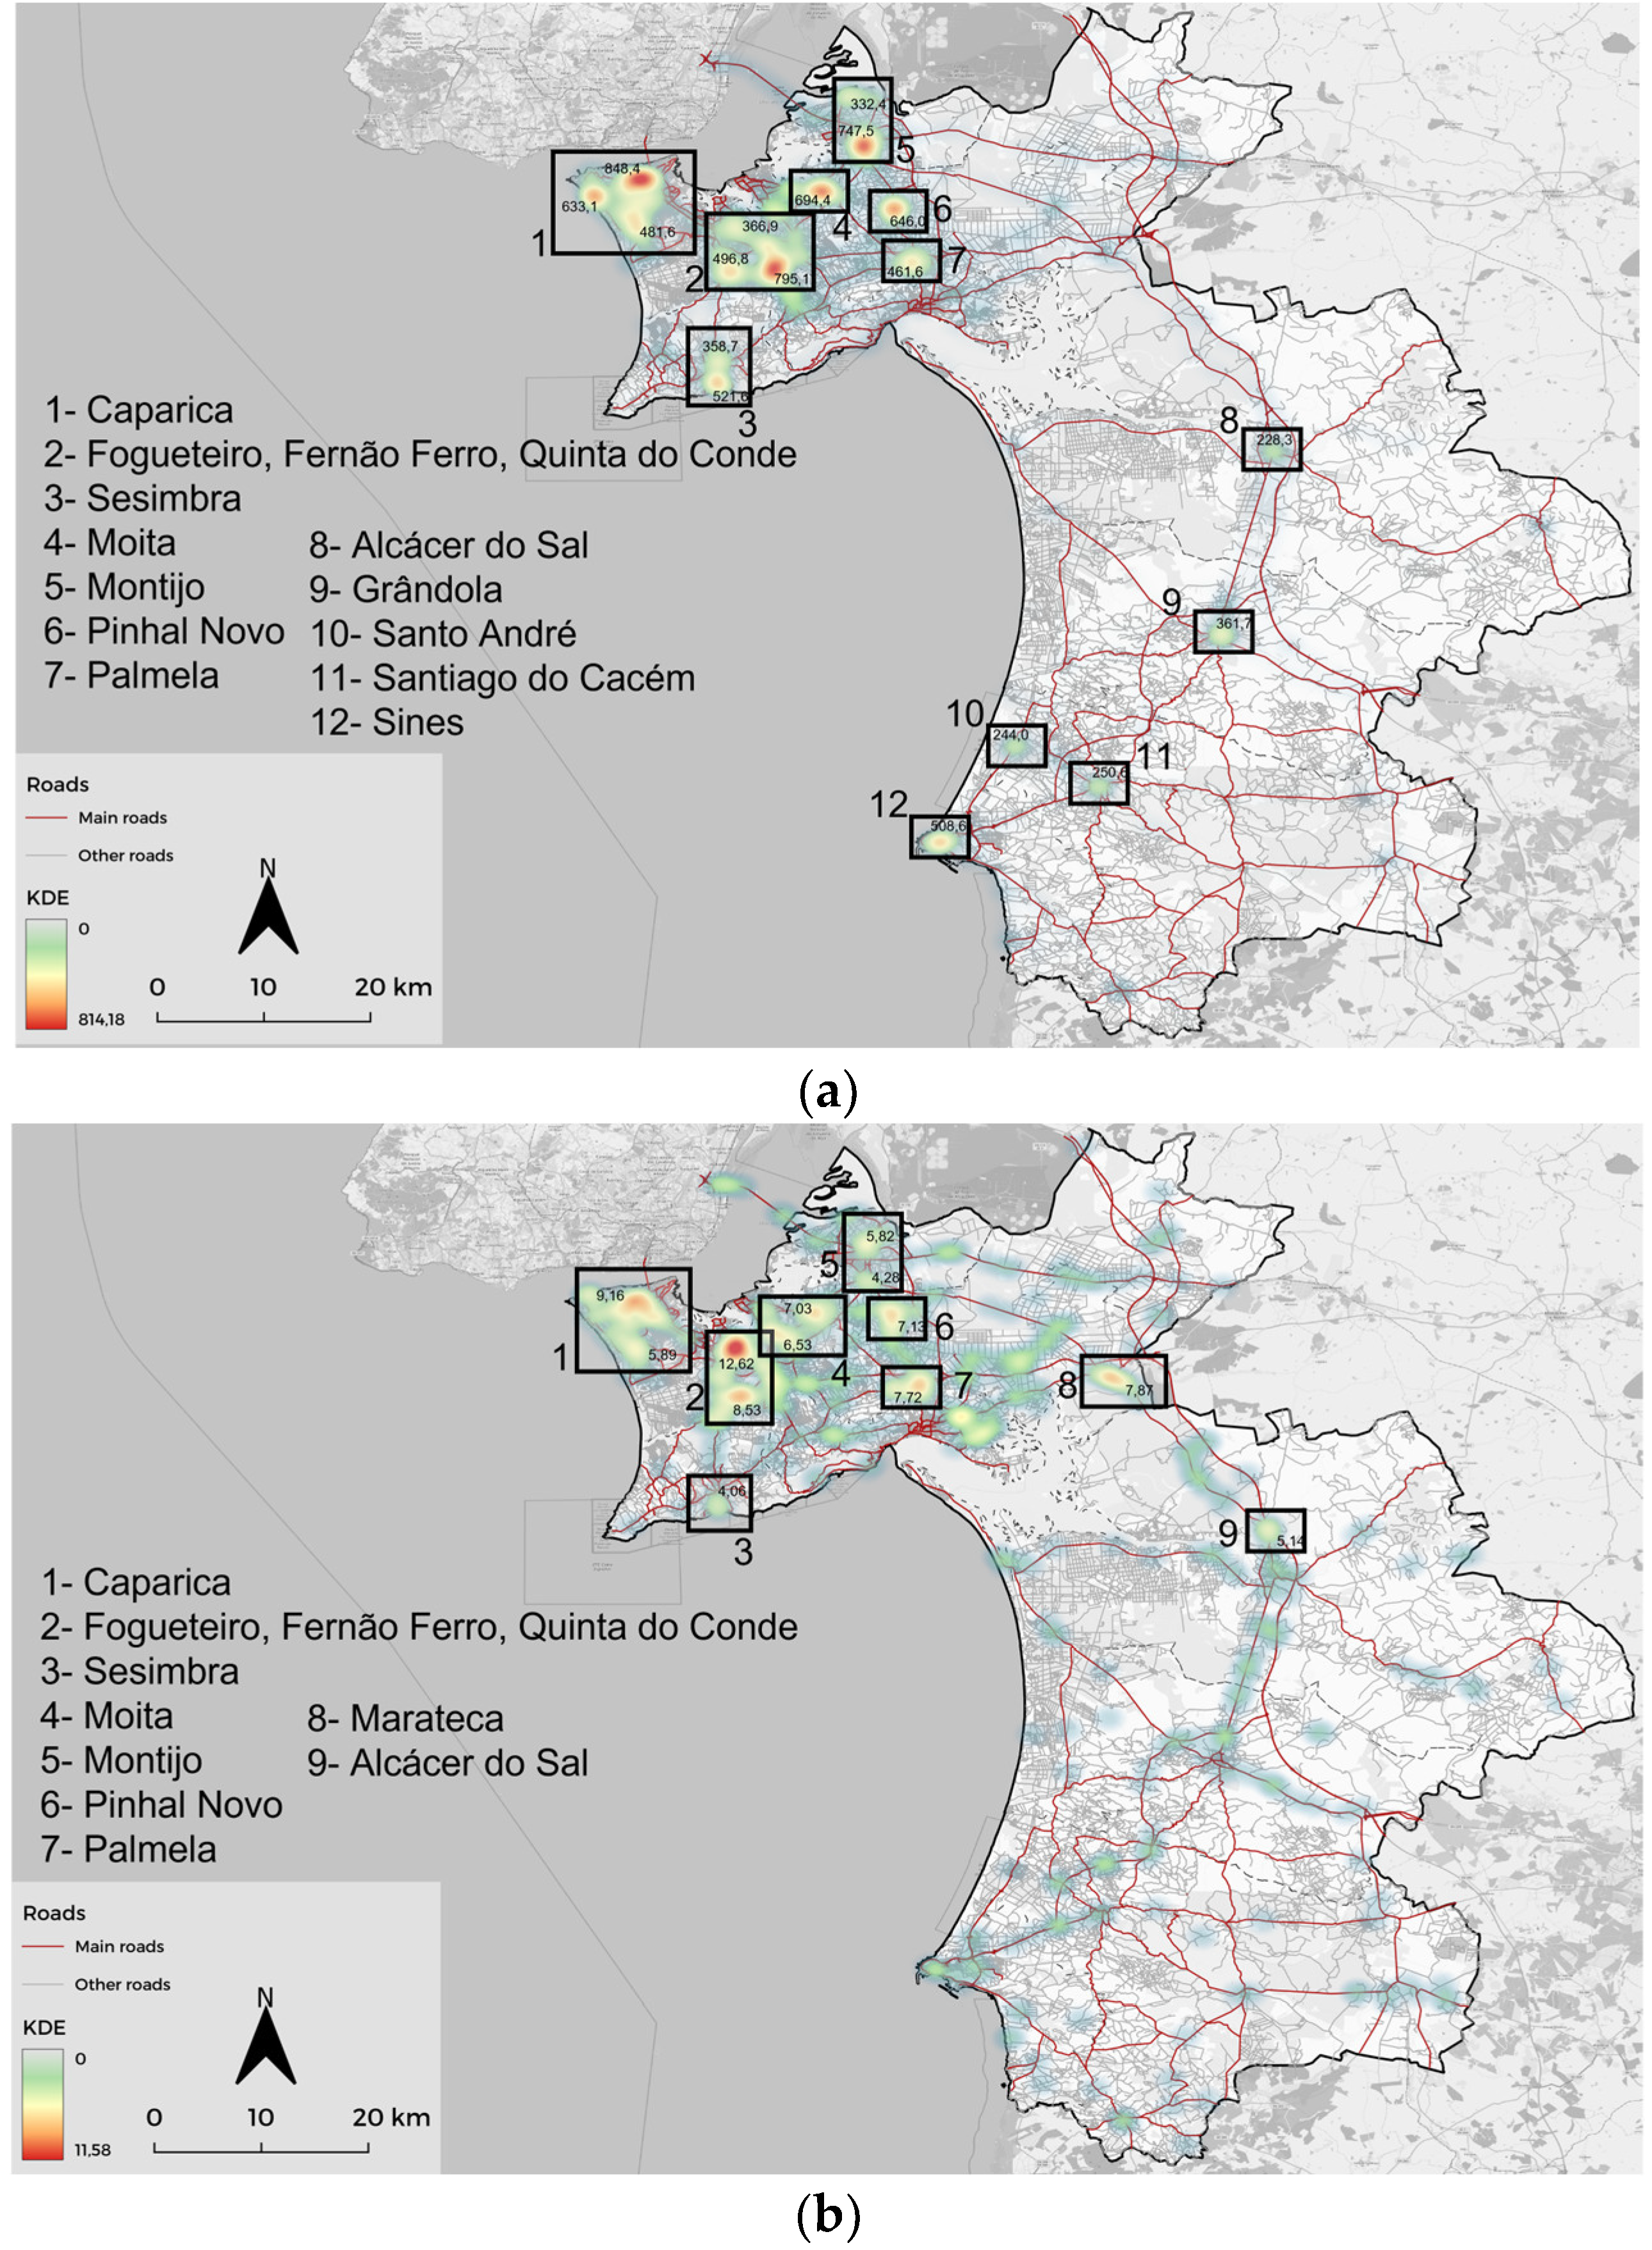
3.3. Kernel Density Estimation (KDE)
Kernel density estimation (KDE) map or heatmap calculates the spatial density based on the distance between occurrences. The KDE maps were created using the heatmap tools developed in the QGIS software [
19].
Several functions can be used to represent the shape of the kernel, upon which the map takes slightly different aspects. A quartic kernel was used for this work using the same approach as previous authors (e.g., [
20,
21]). For the creation of the KDE maps, a cell size of 10 m was used.
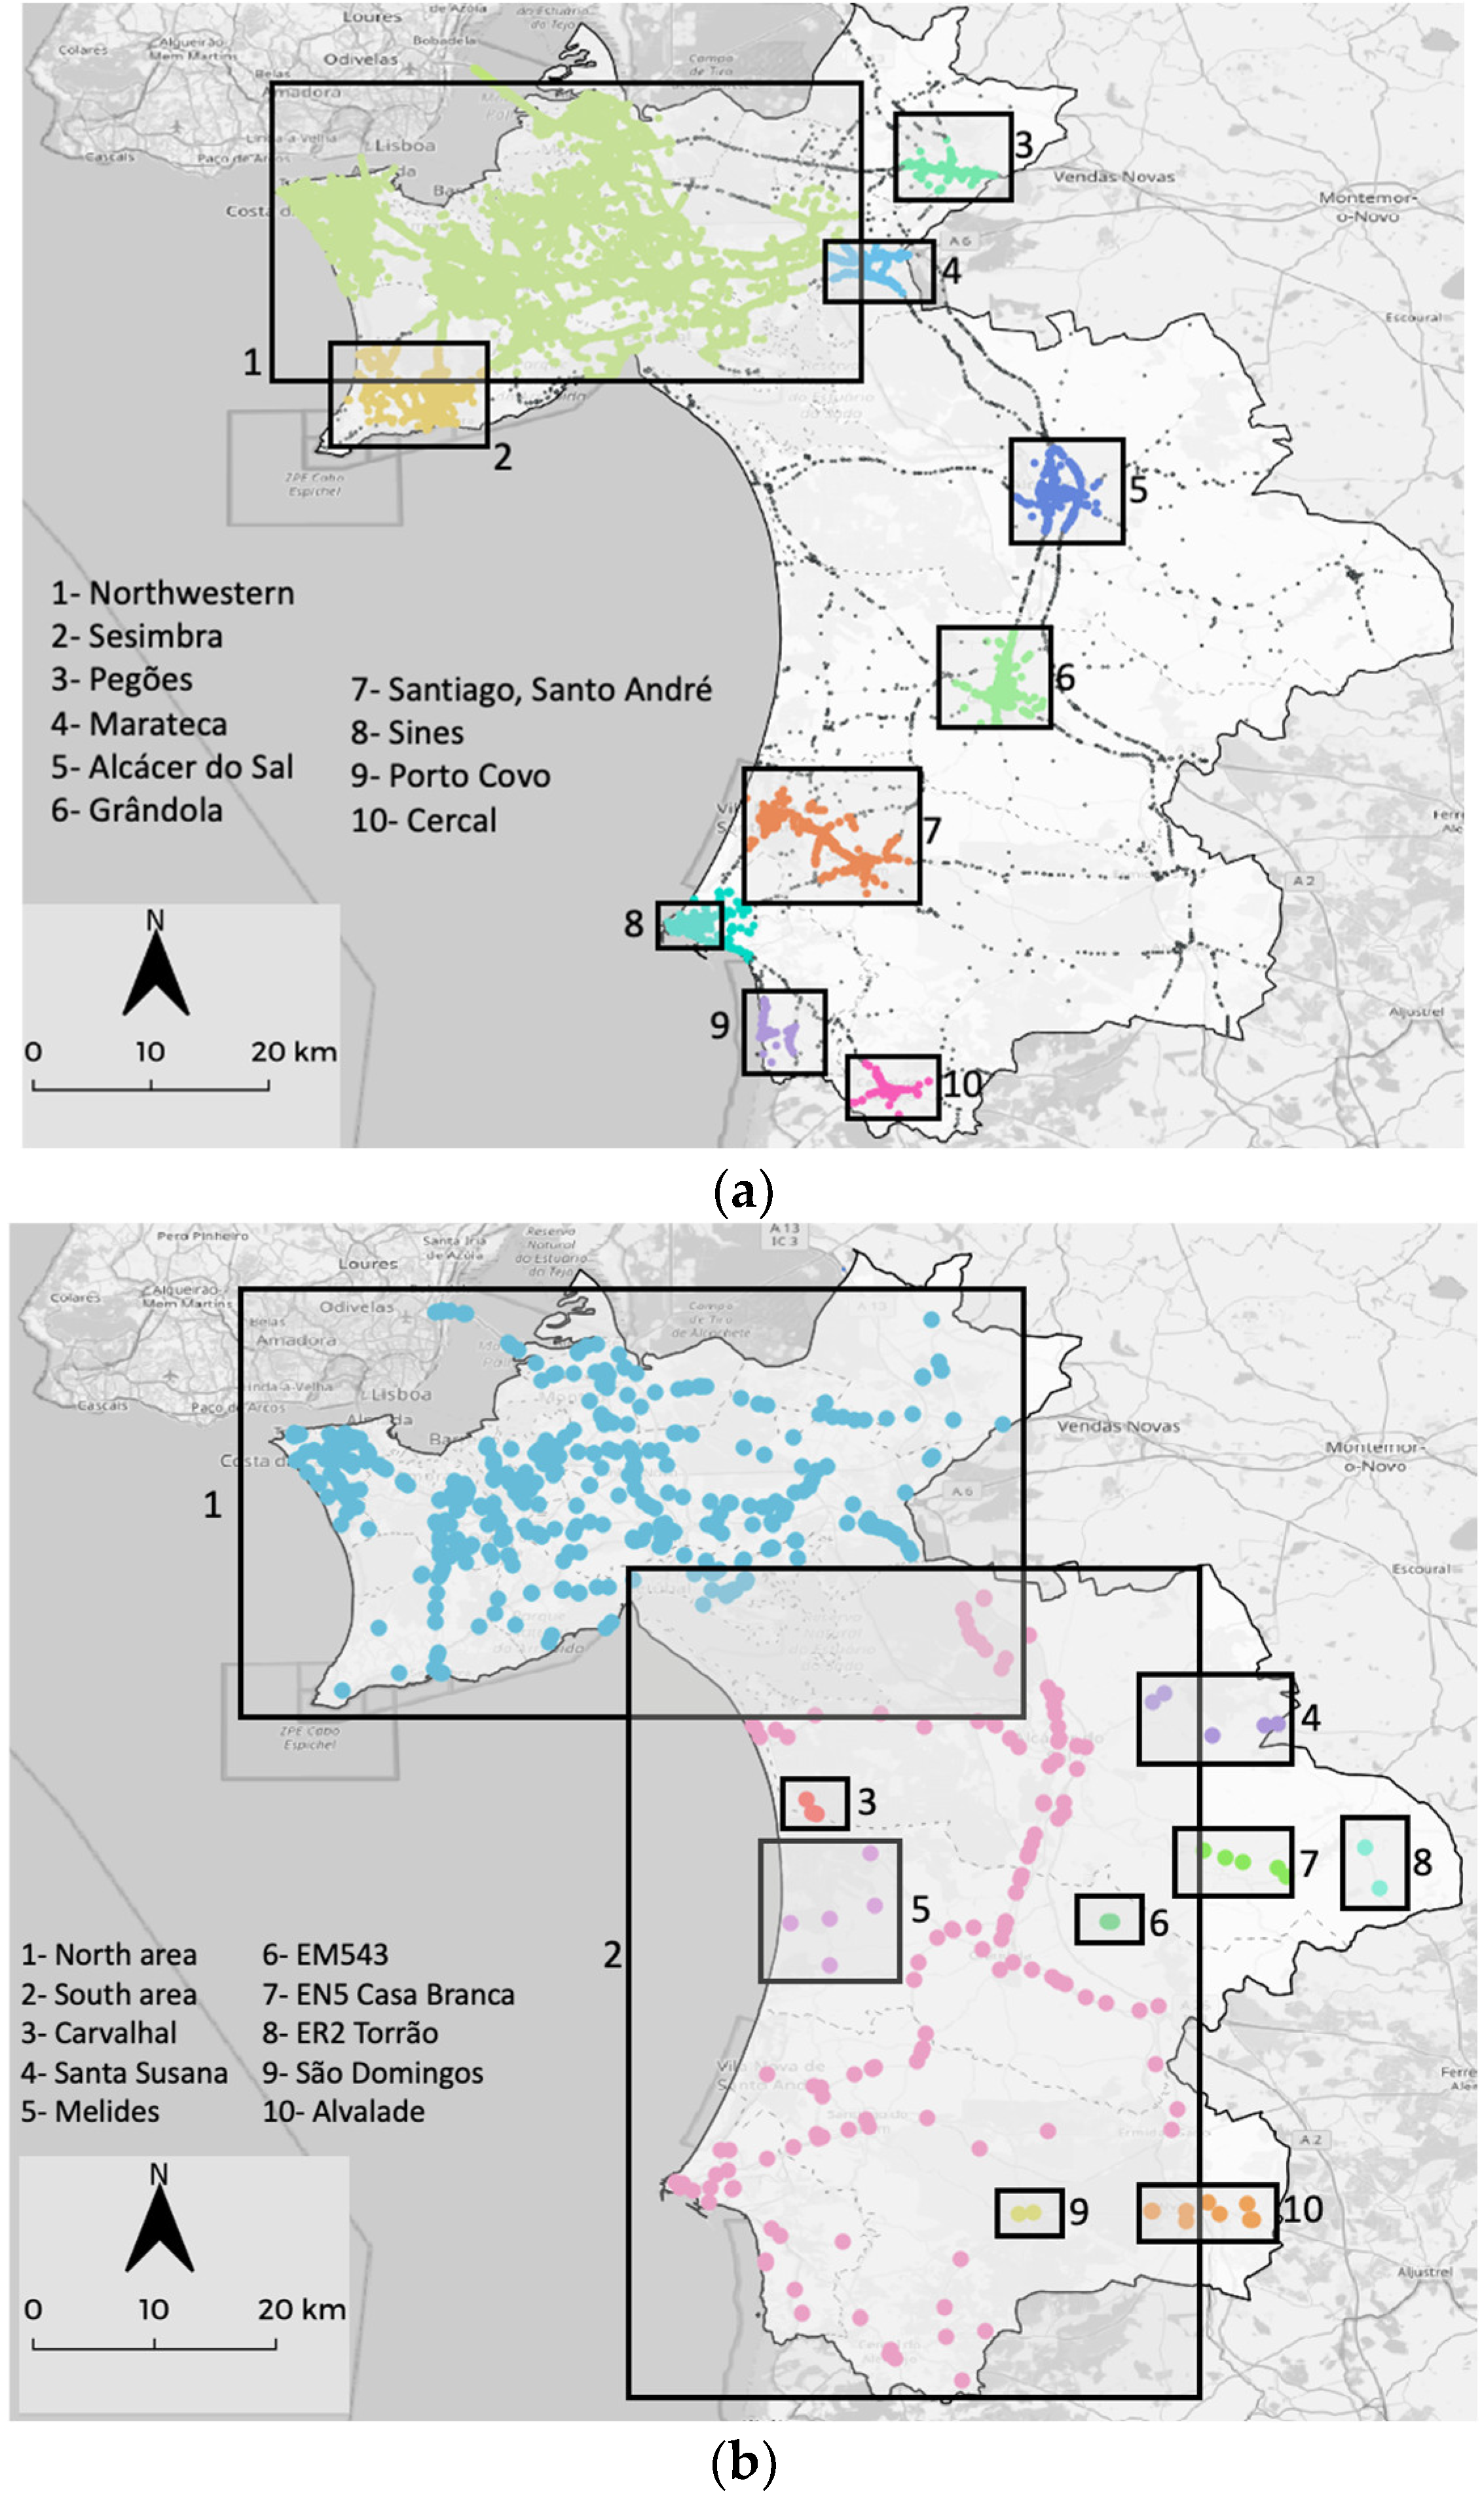
3.4. Density-Based Spatial Clustering of Applications with Noise (DBSCAN)
DBSCAN was crafted by [
22] and is an algorithm that relies on a density notion for creating clusters with any arbitrary shape. DBSCAN is used to classify the data into groups of points. The parameters include the minimum number of points to constitute a cluster and the maximum distance between neighbors; these parameters directly affect the number of clusters defined.
The DBSCAN was applied in both datasets, and several values for the distance between occurrences and several neighbors were tested.
Likewise, K-Means clustering was tested, but as it is responsive to irregularly shaped datasets, it was discarded over the DBSCAN approach that can manage our data better [
23].
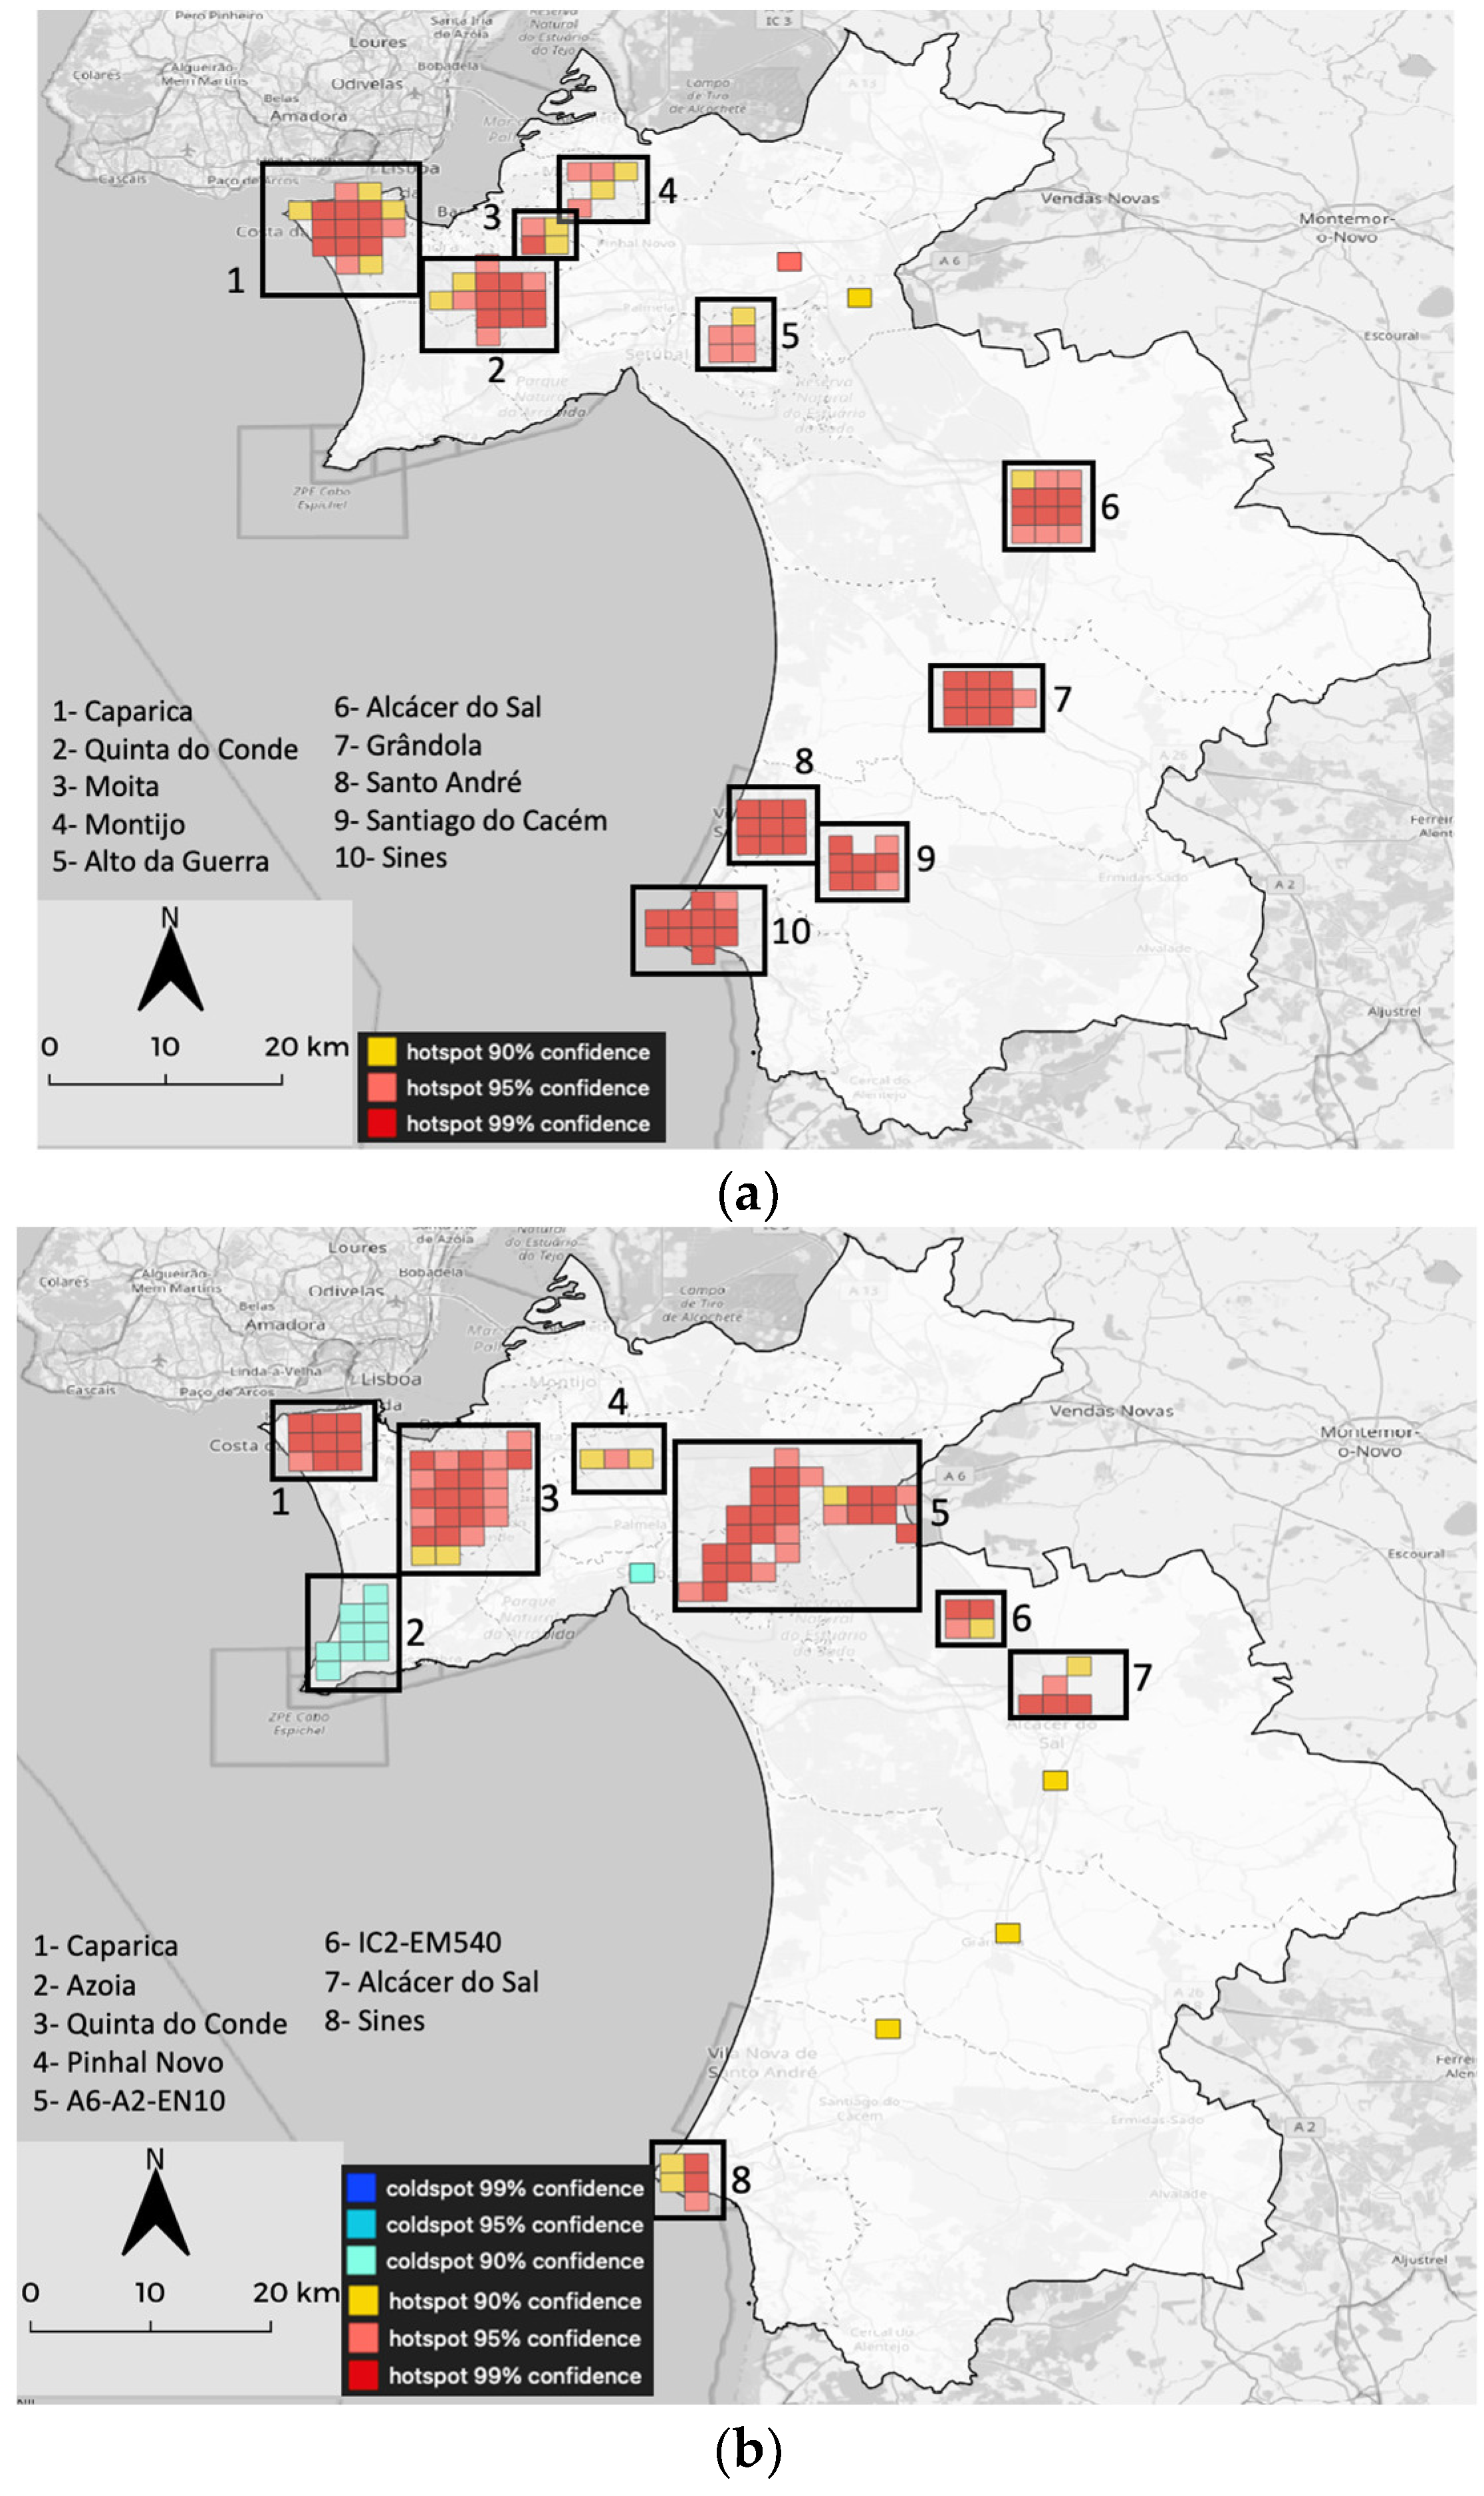
3.5. Getis-Ord Gi* and Local Moran-I
Autocorrelation methods, such as Getis-Ord [
16,
17] and Local Moran-I [
18], are often used in crime and epidemiological research (e.g., [
24,
25,
26,
27,
28,
29]) and can also be applied to road traffic accidents (e.g., [
30,
31]). The similarity of the attributes and their spatial distribution, i.e., the neighborhoods, are used to define the correlation.
Maps of Getis-Ord Gi* and Local Moran-I for the district were created using the QGIS plugin Hotspot [
32]. Several grid sizes were tested and the number of accidents inside each cell was counted. As instructed in the plugin user guide, cells with no accidents are discarded. For the spatial analysis, one must consider that these functions test the relations between cells, hence only cells with valid adjacent ones are suitable to be considered as either hot or coldspots.
5. Discussion
Naturally, each of the tested methods has its strengths and limitations, and while some information is consistent in all approaches, the results that are different across the applied methodologies provide new and invaluable information. For understanding and interpreting the knowledge created, one must first attempt to envisage an explanation for each of the HDR clusters and hotspots identified.
The explanations for the locations of the total accidents (dataset I) are numerous and must be pondered in a case-by-case approach and complemented with more detailed RTA data. Nevertheless, some underlying factors that are known can offer a first tentative explanation for the location of HDRs:
Caparica: the junction between Highway A2 and local roads remain consistently the worse zone in terms of accidents. The high population density of Almada city all year round and the Costa da Caparica beaches during the summer and weekends with good weather are factors that provide a high traffic intensity for these locations.
Quinta do Conde: this location has kept around 300 accidents a year, but in 2018 it had more than 400. Quinta do Conde is a residential locality with predominantly straight or wide curved streets, and the houses are distributed by organized blocks. It is a high population density location with few junctions to access roads to Lisbon.
Sesimbra: RTAs are mostly unchanged from 2016 to 2018, but in 2019 it displayed twice as many accidents as in any other year. Sesimbra is a fishing town located on the hillside of Serra da Arrábida and is a well-known tourist attraction. Founded in the XIII century, the road network pays tribute to its ancestry and consists of winding roads that often end in dead-ends and downhill roads that lead to the coast. A possible explanation for the higher accident frequency in 2019 may be the increase in tourism, both national and international, that brings an intensification of traffic into the town.
Moita, Montijo, Pinhal Novo and Palmela: these localities are dormitory cities with access to the Lisbon city center from the Vasco da Gama bridge. The junction between high-traffic roads, namely highways, with local roads are factors that make it prone to RTAs.
Alcácer do Sal, Grândola, Santo André and Santiago do Cacém: these small towns are all in proximity to roads with high traffic intensity, connecting Sines industrial pole and the Algarve tourist region with Lisbon. Again, the junction of high-traffic roads with low velocity, and high population density areas are considered RTA-prone areas.
Sines: a small town with an important industrial pole supporting one of the most important deep-water maritime ports. This conjunction of factors might be a simple explanation for the high density of RTAs.
Concerning the HDR distribution of dataset II, fundamentally it replicates the pattern established from dataset I, albeit with the difference that this dataset has a lower number of cases. Marateca, which is located at the junction of the A2-A6-EN10 roads, stands out on this map with a significant number of more severe RTAs. The southern region of the study area presents a clustered, but not strong, RTA pattern, mostly among the main roads that provide access to Sines and Algarve.
The clustered nature of RTAs becomes evident from the DBSCAN maps. However, this method indicates that the north-western area has a common nature concerning its inclusion in a unique cluster. For dataset I, the identified clusters mostly replicate the previously defined HDRs, but new ones are brought to our attention, namely, Pegões (171 RTAs), Marateca (219 RTAs), Porto Covo (119 RTAs) and Cercal (124 RTAs). Pegões is a crossroads area between EN4 and EN10, whereas Porto Covo and Cercal are small near-the-sea villages where most of the RTAs occur in the city centers. In dataset II, the two main clusters correspond to a division of the two main areas: the northern (more urban area) and the southern (more dispersed or rural area). Apart from these two big clusters, other less important clusters arise, namely Santa Susana (5 RTAs), Melides (5 RTAs), EN5 Casa Branca (5 RTAs) and Alvalade (9 RTAs). All these clusters are mainly RTAs related to single roads, except the Melides cluster which has an unclear nature.
Concerning the Getis-Ord GI* analysis, the main identified hotspots coincide with HDRs. It is noteworthy that in dataset I, there are no clear coldspot zones. Sesimbra, according to this approach, no longer constitutes a hotspot, and most HDRs in the north–eastern part are not present or are poorly defined. In dataset II, although the pattern is still familiar, there are some significant differences. Firstly, the presence of a coldspot in the Azoia area; secondly, a clear and considerable hotspot related to the A6-A2-EN10 junction and another one in the IC2-EM540 junction. Another remarkable finding is the loss of importance of the RTAs in the southern region, except for Sines.
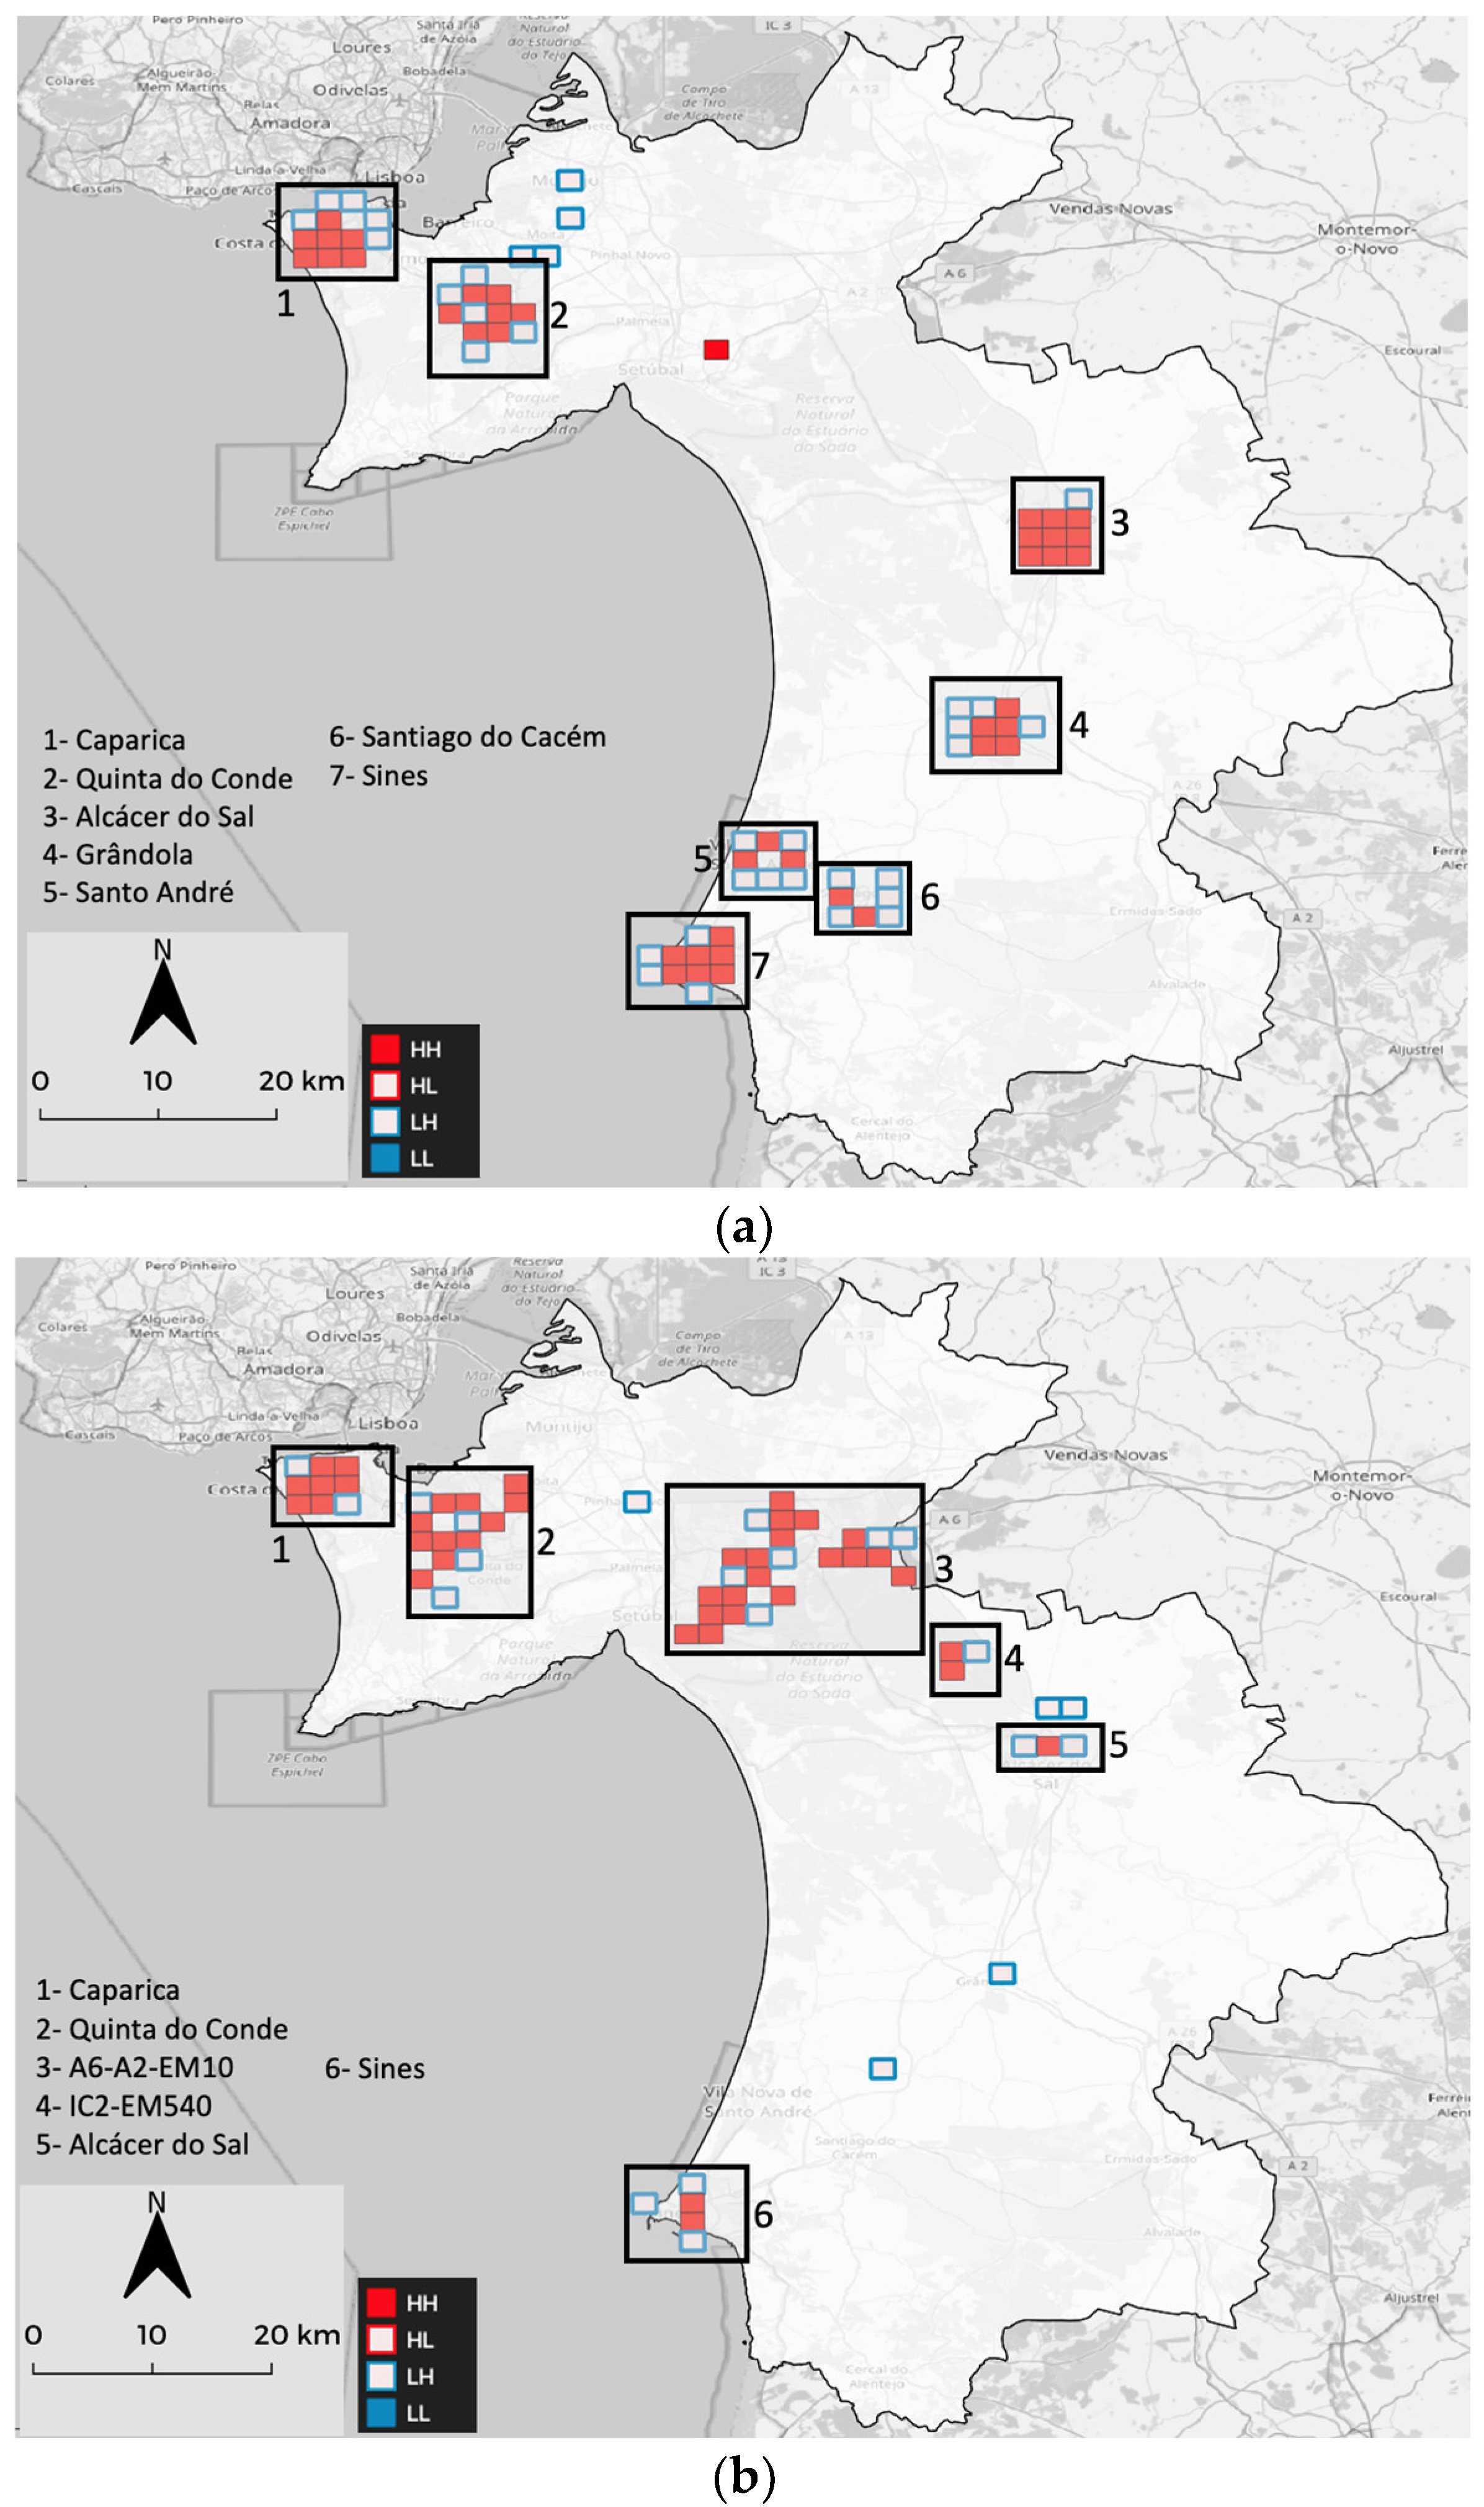
The local Moran-I maps roughly have the same distribution of RTAs as the previous analysis. It is noticeable that for both datasets there are only cells with High–High (HH) values corresponding to RTA clusters and cells with Low–High (LH) values, corresponding to outliers where low values are surrounded by high values. This implies that the RTAs are commonly clustered by HDRs. The persistence of the A6-A2-EN10 area with accidents involving severe and fatal victims is also remarkable.
As stated previously, the comparison of the different methodologies applied in this study combined with already known RTA determinants [
8] and other underlying factors help us to learn from the existing data. Conversely, it is also important to extract, from the spatial information created, some insights into the methodologies used.
Cross-checking the KDE maps for each studied year established that the pattern obtained for RTAs remains the same, only slightly changing the value of density in each HDR. The KDE maps of both datasets, i.e., the one with all accidents and the one with only seriously injured and fatal victims, shows that the most important HDR locations are the same. Observations with different pixel resolutions, ranging from 1 m to 10 m or more for the KDE with all accidents show no discernible differences that justify the increase in file size and processing times, corroborating what was stated by other authors [
21].
The DBSCAN output varies depending on the chosen minimum number of neighbors and maximum distance. Our analysis reveals that the number of clusters has an inverse relation with both parameters, meaning that the higher the minimum neighbors and/or maximum distance, the lower the number of clusters. However, the number of outliers also varies, increasing with the neighbors but decreasing with the maximum distance.
Local Moran-I and Getis-Ord GI* maps feature most of the same locations, confirming the existence of autocorrelation for the identified cells.
The main goal of this work was to understand how the different methodologies provide relevant information on RTA’s pattern distribution. However, one must state that these results represent the starting line for ongoing research on what concerns the causes of these significant RTA locations, not only high-density locations but also clustered geometries. Results from other concomitant studies (e.g., [
8,
33,
34,
35]) reveal that other factors, such as an hour of the day, weekday, the age of drivers involved or meteorological conditions, are relevant for RTA accumulation.
6. Final Remarks
It is compulsory to learn from RTAs to contribute to solving one of the plagues of modern times, the severe injuries and deaths related to human mobility. Often common sense, the lack of data or bad information mislead us in the commitment to deciding what actions are needed to prevent such fatalities. Apart from defining the determinants for RTAs, usually based on a robust statistical analysis, in this work, we test some tools to clarify the spatial patterns underlying the RTAs in a case study.
The spatial analysis was performed with a GIS tool and included density estimation, cluster analysis and hotspot identification. For the different approaches, several parameter values were tested, and the better fitted results are presented and an interpretation is herein avowed.
Although some contributing factors to RTAs are considered in the Discussion section, it is not the goal of this research to identify the solutions. That important role is left to policy and decision-making authorities.
From the application of the different methods, some robust conclusions can be drawn. All the tested methods were able to identify the principal regions where RTAs are prone to occur. Nevertheless, some features remain particular to each of the methods and dependent on the dataset that is being considered.
Kernel density estimation offers a good expedite spatial analysis method, sufficiently capable of identifying areas with higher susceptibility for RTAs. As such, KDE was successful in determining where the number of accidents happening within a small radius is most concerning. This helps in pursuing the answer to questions, such as ‘why is this place so active in accidents?’ or ‘what common attributes do all these locations share?’.
DBSCAN can be useful to find small or new clusters based on their distance. In this paper, DBSCAN helped to look for relations between small sets of accidents, but critical thinking is key to understanding and interpreting these sets as the varying number of neighbors or maximum distance between them can greatly alter the results.
The Getis-Ord GI* analysis is usually accompanied by Local Moran-I since it shows if the hotspots or coldspots found have a clustered behavior or a more dispersed one. The results obtained provide a richer knowledge of where the most concerning places are located, specially focused on where the most damaging accidents are occurring and also try to explain why there are places with an unusually high ratio of these types of accidents.
KDE and Getis-Ord Gi* maps share many similar features, and while it may be argued that the additional steps that Getis-Ord Gi* take produce diminishing returns, this method can not only outline hotspots but also coldspots, which may help to understand why a location is accident-prone against another with seemingly similar attributes.
Naturally, new subsets of data, whether they be HDRs, clusters or hotspots, will be the target for new research, namely to define the determinants and the features that define them, providing new lessons to mitigate the RTA curse.


 ,
, 


