Article

Measuring the Spatial Accessibility of Parks in Wuhan, China, Using a Comprehensive Multimodal 2SFCA Method

1
School of Resource and Environment Sciences, Wuhan University, Wuhan 430072, China
2
Faculty Geomatics, Lanzhou Jiaotong University, Lanzhou 730070, China
3
Key Laboratory of Urban Land Resources Monitoring and Simulation, Ministry of Natural Resources, Beijing 100804, China
*
Author to whom correspondence should be addressed.
ISPRS Int. J. Geo-Inf. 2023, 12(9), 357; https://doi.org/10.3390/ijgi12090357
Submission received: 19 June 2023 / Revised: 15 August 2023 / Accepted: 30 August 2023 / Published: 31 August 2023

Abstract

:
The spatial accessibility of urban parks is an important indicator of the livability level of cities. In this paper, we propose a comprehensive multimodal two-step floating catchment area (CM2SFCA) method which integrates supply capacity, the selection probability of individuals, and variable catchment sizes into the traditional multimodel 2SFCA method. This method is used to measure park accessibility in Wuhan, China. The results show that the spatial distribution of park accessibility under the proposed method is variant. High accessibility areas are clustered near the Third Ring Road with strong supply capacity parks, and low accessibility areas are distributed in the western and southern regions. Compared with the single-model accessibility (bicycling, driving, and public transit) method, we found that the multimodal spatial accessibility, combining the characteristics of three single transportations, can provide a more realistic evaluation. We also explore the spatial relationship between park accessibility and population density by bivariate local Moran’s I statistic and find that the Low Ai-High Pi area is located in the center of the study area, and the Low Ai-Low Pi area is located at the edge of the study area, with a relatively discrete distribution of parks and weak supply capacity. These findings may provide some insights for urban planners to formulate effective policies and strategies to ease the spatial inequity of urban parks.

1. Introduction

The urban park connects people and nature in urbanized cities [1,2,3]. It is an ideal place for people to relax and engage in sports activities [4,5,6,7,8]. Generally, the spatial distribution of urban parks is not uniform due to high urbanization rates and tight use of urban land [9,10,11,12]. Therefore, studying the spatial accessibility of parks is important for improving public health and urban livability. The early accessibility models focused mainly on a single-transportation mode that assumed people always reach services in the same way [13,14]. However, in real life, people usually use different transportation modes to reach services. Therefore, the accessibility measurement model with multitransportation mode can reflect service accessibility more realistically. In recent years, some scholars have proposed new accessibility models that integrate multiple transportation modes into traditional accessibility methods [15,16,17,18,19]. However, these methods rarely consider both spatial and nonspatial aspects, such as the attraction coefficient of services, variable catchment areas, and the selection probability for individuals.
This paper proposes a comprehensive multimodal 2SFCA (CM2SFCA) method to measure park accessibility based on three transportation modes (bicycling, driving, and public transit). This method considers the different transportation modes and integrates the park attraction coefficient, distance decay, and individual selection probability into the traditional multimodal 2SFCA method. From the perspective of spatial equity, the proposed CM2SFCA is applied to measure park accessibility in Wuhan, China, and the results can reveal the spatial distribution characteristics of park accessibility and identify the areas of insufficient park services.
The remainder of this paper is organized as follows. Section 2 reviews the literature on park accessibility measurements and the improvements of the two-step floating catchment area (2SFCA) method. Section 3 describes the proposed CM2SFCA method in detail. Section 4 introduces the study area and data sources, analyzes the park accessibility under the multimodal method, and compares the results under single models. Finally, Section 5 presents the conclusions and discussions.

2. Related Works

Previous studies have pointed out that the factors affecting the spatial accessibility of urban parks include the following three aspects: supply, demand, and their connections [13]. Supply refers to the quantity and acreage of parks. Demand refers to the size and composition of the population. Their connection means the travel impedance between service sites and the demand location, represented as distance, road conditions, and transportation modes [20,21].
Many existing approaches have been proposed to measure the spatial accessibility of urban parks, which can be divided into the following four categories [22]: (1) the container approach, which only focuses on the parks within a specific geographical unit. However, the travel range of residents is not limited by specific boundaries in the actual scenario, and people can usually enter parks of neighboring units. (2) The coverage approach, which is not limited by geographical units and measures the demand-to-supply ratio by buffer analysis [23], network analysis [24], kernel density estimation [25], and so on. However, these methods do not consider the distance threshold and distance decay between the service site and the demand location. (3) The proximity approach, which improves the boundary limitation and predefined distance that evaluates the spatial accessibility by calculating the travel impedance from the demand location to the nearest service. However, it only considers the connection between supply and demand, without considering the supply attractiveness and the demand condition. (4) The gravity model, which defines the travel impedance function of time or distance to measure spatial accessibility. However, it is challenging to select a suitable fitting distance decay function. Therefore, improved from the gravity model, the 2SFCA method was proposed [26], which has been widely used to measure the spatial accessibility of urban public services, such as medical services [27,28,29], parks [13,30], fire services [31,32,33], and so on.
In past decades, the original 2SFCA method has been extended to address its limitations in spatial accessibility measurement, including distance decay problems [34], fixed catchment problems [35], supply and demand improvement [13,22], and multiple transportation modes [30]. The original 2SFCA method is a dichotomous approach that does not consider the distance decay and the selection probability for individuals. To solve the problem of the dichotomous measure, some scholars have integrated different distance impedance functions into the initial 2SFCA method, such as the kernel density (KD) function [36] and the Gaussian function [34]. These modified 2SFCA methods set a fixed catchment size for all supply services and population demands. However, the supply capacity of services is different at different levels or in different areas (such as urban and rural areas). Thus, the catchment sizes for different levels of services or different regions are likely to vary. Some scholars have addressed the issue of fixed catchment sizes by adjusting the population and service catchment sizes [37]. For example, ref. [35] proposed a variable two-step floating catchment area (V2SFCA) to dynamically determine the demand and supply catchment sizes by incrementally increasing the catchment until a base population and a demand-to-supply ratio are met, which is a practical approach to determine the appropriate catchment sizes. Ref. [38] set the park attractiveness as a function of size and the number of amenities, and determined the park catchment size based on their attractiveness. However, it is difficult to quantitatively determine the supply and demand ratio between population and urban parks. Also, determining the optimal attractiveness function is much more complex than using the area of the park.
Meanwhile, the competition between different forms of urban parks may affect the visits of individuals, who often tend to enter high-quality parks within an acceptable time threshold [14,39]. Therefore, the accessibility models that do not consider the selection probability of individuals will lead to overestimation for some areas. Ref. [40] proposed the three-step floating catchment area (3SFCA) method to deal with this limitation by assigning a travel time-based competition weight for each pair of demand–supply sites. However, this weight does not consider the supply-side effects of people’s selection. To moderate the overestimating or underestimating of population demand, ref. [41] integrated the Huff model with the FCA method to articulate population selection on services, and the Huff model-based selection probability of individuals is reflected by the impacts of both distance impedance and service-site capacity. In assessing urban parks, it is also necessary to consider the impact of park heterogeneity on individual needs.
Furthermore, the original 2SFCA method only measures accessibility by a single mode of transportation. However, in real-life scenarios, the travel transportation modes may vary depending on personal preferences, travel impedance (distance or time), and other factors. Therefore, some scholars have recently integrated multiple transportation modes into the original 2SFCA method. For example, ref. [17] first proposed the multimodal 2SFCA method by dividing the population into car-mode and bus-mode transportation subgroups. However, this method does not generate different accessibility values for each subgroup population, and the travel time is not obtained from the real network from the estimated travel speed. Then, [15] improved Mao and Nekorchuk’s method by estimating the travel time based on the existing bus network. Based on these two studies, ref. [42] further improved the multimodal 2SFCA method by estimating travel time via online map APIs, which can improve the estimation of travel time by public transit or car, and has been successfully applied to other fields of accessibility measurement [43,44]. Furthermore, ref. [45] integrated different transportation modes (walking, public transport, and car modes) and attractiveness coefficients of services into a Gaussian-based 2SFCA model. However, the travel time calculation is based on estimated travel speed rather than actual road network conditions. At the same time, the existing improved multimodal 2SFCA methods do not consider the competition among the heterogeneous forms of parks and the probability of peoples’ selection, and most transportation modes only include car mode and public transit mode, without considering walking or cycling.
In general, although the above improvements have enhanced the reliability and flexibility of the original 2SFCA method to measure park accessibility, they only focus on the arbitrary two or three improvements, and few studies comprehensively consider the above issues in combination. For example, in the improvement of various transportation modes, parks’ attractiveness and competitive effects are not considered, while in the improvement of supply and demand, the difference in park accessibility under different transportation modes is not studied. Therefore, the CM2SFCA method is proposed in this paper to measure park accessibility that simultaneously considers distance decay, variable catchment size, supply and population improvement, and multiple transportation modes.

3. Methodology

3.1. Traditional Multimodal 2SFCA Method

The multimodal 2SFCA method was first proposed by [17] and then improved by [15,42,43,44] and other scholars [45,46]. In Tao’s methods, the multimodal 2SFCA method mainly includes two steps: first, the subgroup population locations within the threshold distance ( d m ) under different transport modes are searched separately. Then, the subgroup population is weighted using a Gaussian function, the sum of the population of each group after weighting is regarded as the potential demand of supply, and the supply-to-demand ratio can be calculated as:
R j = S j m = 1 M k ϵ d k j , m d m W k j , m P k α m
where S j is the supply capacity of the service at j . M is the total number of transportation modes. d k j , m is the travel cost from population location k to park location j when using transportation mode m . d m is the threshold distance under mode m . P k is the total population at the location k , which is within the catchment (i.e., d k j , m d m ) from supply location j , α m is the proportion of people traveling via transport mode m ; thus, P k α m is the subgroup population reaching the service j under transport mode m at location k . W k j , m is the travel impedance under transport mode m , which is represented as follows:
W k j , m = ( e 1 2 ( d k j , m d m ) 2 e 1 2 ) / ( 1 e 1 2 )   ,   d k j , m d m 0 ,    d k j , m > d m
Second, under the transport mode m , all parks ( l ) within the threshold distance ( d m ) from population location i are searched, and the supply-to-demand ratio R l is weighted and summed to calculate the spatial accessibility by:
A i , m = l ϵ d i l , m d m W i l , m × R l
where A i , m is the park accessibility score for the population subgroup that travels by mode m at location i , l represents all parks within the threshold distance d m , d i l , m is the travel cost from population location i to park location l via transport mode m .

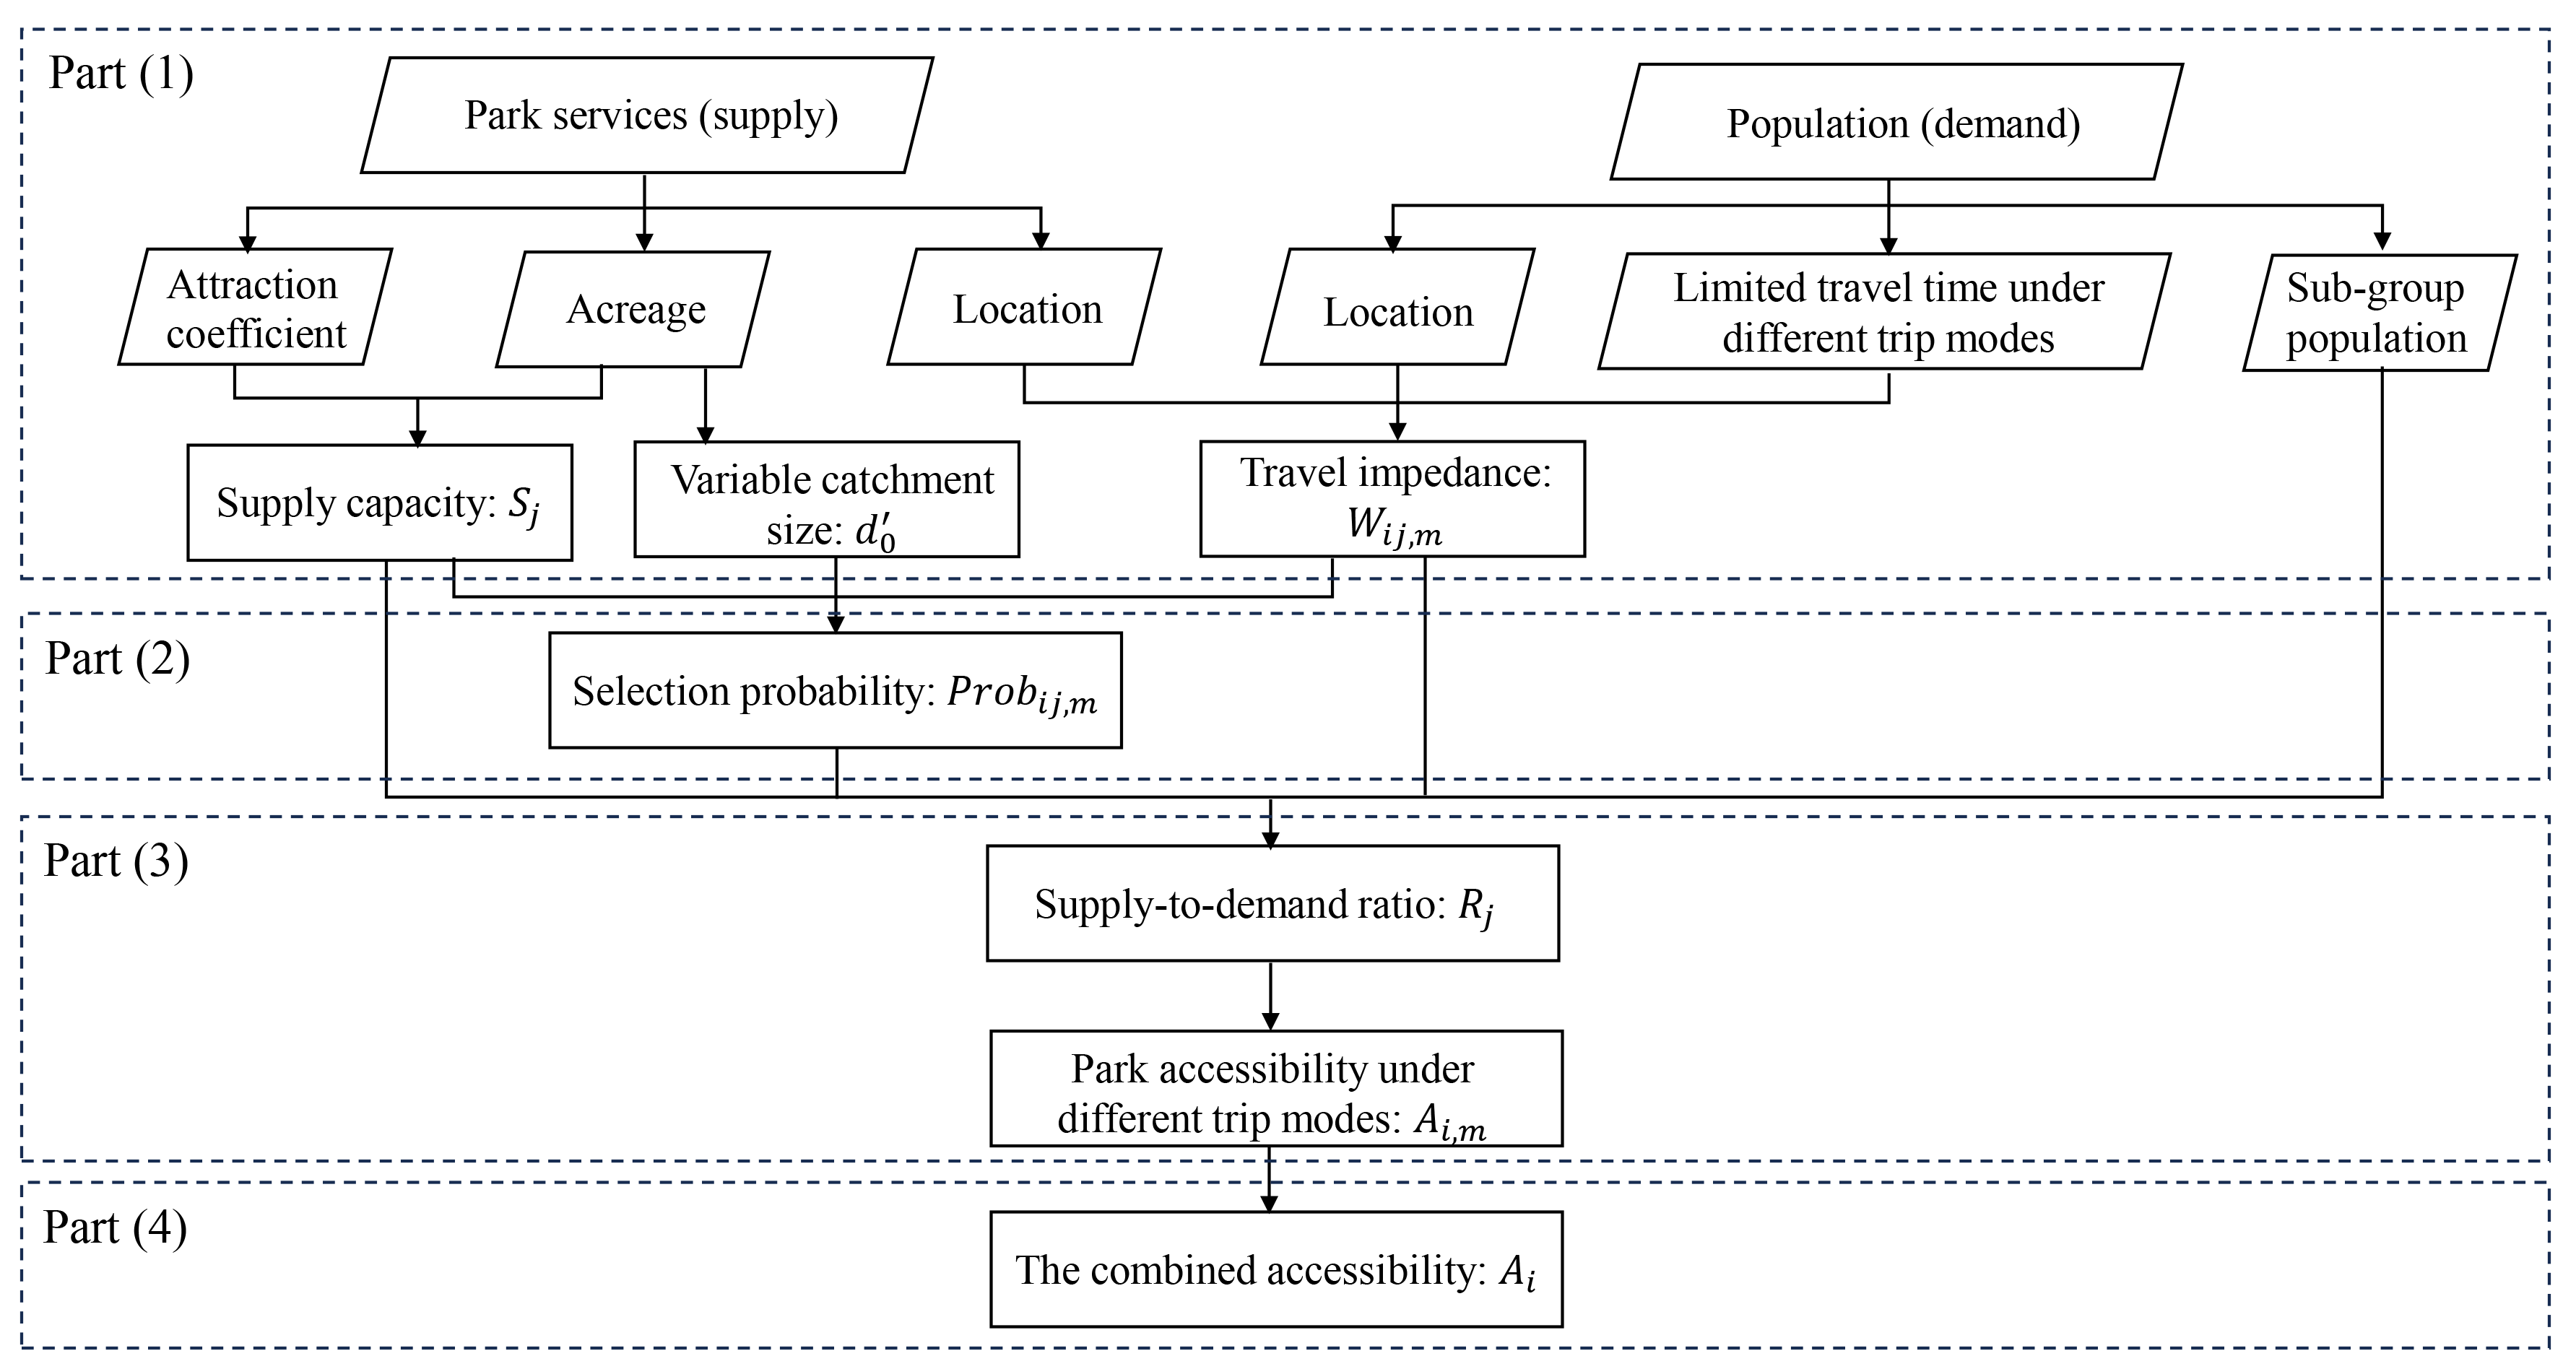
3.2. Comprehensive Multimodal 2SFCA Method

The proposed CM2SFCA method improves the traditional multimodal 2SFCA method by integrating the park attraction coefficient, variable catchment sizes, and individual selection probability. The flowchart is shown in Figure 1, which includes four main parts: (1) the park supply capacity, variable catchment size of each park, and travel impedance between population and park services are calculated separately in the first parts, among which the supply capacity is affected by the attractiveness and the acreage of each park; the variable catchment size is affected by park acreage; the travel impedance is affected by the on-road travel time and the maximum tolerance times for visiting the park under bicycling, driving, and public transportation (i.e., limited travel time). (2) Based on the park supply capacity, variable catchment size, and the travel impedance between population and park services obtained in step (1), the selection probability for each population demand point i to reach the park j can be calculated by the Huff model under three different trip modes. (3) Based on the park supply capacity, the selection probability, the travel impedance, as well as the number of people traveling under a certain mode of transportation (i.e., subgroup population), the supply-to-demand ratio of each park and the park accessibility under different trip modes can be calculated. (4) Finally, the combined park accessibility under multiple transportation modes can be measured based on the proportion of the traveling population under bicycling, driving, and public transportation.
Park quality is a key indicator for evaluating the supply of parks [47]; most studies have used park area as the only parameter in the traditional 2SFCA models [34,48,49]. However, a park with a considerable area can only partially represent the service capacity. Therefore, in addition to the acreage, this paper also considers the user ratings of urban parks from Amap [50], Meituan [51], and Dianping [52], which are the commonly used tourism strategy apps for people in China. A higher user rating score means that the park is more attractive. This improvement can also provide the basis for calculating the demand probabilities. In this way, we can better reveal the heterogeneity supply of parks by both considering the acreage and the average score, and the total supply capacity S j can be calculated as follows:
S j = S j A × q 1 + q 2 + q 3 3
where   S j A is the acreage of park j . q 1 , q 2 , and q 3 represents the score on Amap, Meituan, and Dianping, respectively. The maximum score for each platform is 5.0. If the platform lacks score data for a particular park, the default score is 1.0. Furthermore, in this paper, we take the park entrance as the destination, because, in reality, people enter the park from the park entrance, and we calculate the shortest travel time between the population location and all entrances of the park as the final one in order to obtain more accurate results.
According to China’s Park Classification Standards (GB/T51346-2019), parks can be classified into two categories: Category II includes comprehensive parks (≥10 ha) and community parks (1~10 ha); Category Ⅱ includes street parks (0.2~1 ha) and small parks (0.04~0.2 ha). The classification standards dictate that the catchment size, representing the area surrounding a park and its user base, varies according to the park’s area. Larger parks with greater areas generally have larger catchment sizes, while smaller ones have relatively smaller ones [38]. The variable catchment size of parks with different areas is determined by Equation (5), which follows China’s Park Classification Standards (GB/T51346-2019).
d 0 ( km ) = 0.5 ,         1.0   ha S j A < 5.0   ha   1 ,           5.0   ha S j A < 10.0   ha 2 ,      10.0   ha S j A < 20.0   ha   3 ,       20.0   ha S j A < 50.0   ha 10 ,                        50.0   ha S j A
where   S j A is the area of park j . In this way, the variable catchment area ( d 0 ) is related to the size of the park.
Additionally, it is widely acknowledged that the supply capacity of urban parks will affect the selection probability of individuals because people may be more likely to access parks with high supply capacity [41,53]. Therefore, the Huff model is integrated into the traditional multimodal 2SFCA to enhance the calculation of population demand, which considers both the travel impedance and supply capacity of each park:
P r o b i j = S j W i j k ϵ t k j t 0 S k W k j
where P r o b i j is the Huff model-based selection probability of demand population i visiting park j ; S j is the supply capacity of park j in Equation (4); the Gaussian function ( W i j ) is the travel impedance coefficient in Equation (2); t k j is the travel time from location i to park j , and t 0 is the travel time threshold corresponding to the variable park distance threshold in Equation (5).
Three means of transportation modes, i.e., bike, driving, and public transit, are considered in this study. We let a denote bicycle mode, b denote driving mode, and c denote public transportation mode. Based on the previous studies, the maximum tolerance times for visiting the park under these three transportation modes are 18 min (bicycle), 15 min (driving), and 20 min (public transit) [54,55], respectively. After weighing the Huff model-based selection probability ( P r o b i j ) and travel impedance ( W i j ), the supply-to-demand ratio R j   can be calculated with Equation (7). The accessibility of each subgroup population by different transport modes can be calculated with Equations (8)–(10):
R j = S j m = a , b , c k ϵ t k j , m t j P r o b k j , m W k j , m P k α m
A i , a = j ϵ t i j , a t a P r o b i j , a W i j , a R j
A i , b = j ϵ t i j , b t b P r o b i j , b W i j , b R j
A i , c = j ϵ t i j , c t c P r o b i j , c W i j , c R j
where A i , a , A i , b , and A i , c   represent the bicycle-mode accessibility, driving-mode accessibility, and transit-mode accessibility at population location i , respectively. P r o b i j , a , P r o b i j , b , and P r o b i j , c are the selection probability of the demand population i visiting the park j via bicycle, driving, and public transit mode. t i j , a , t i j , b , and t i j , c are the travel time from park j to population i via bicycle, driving, and public transit mode, respectively. t a , t b , and t c are the maximum tolerance times to access parks under bicycle, driving, and public transit mode. P k and α m are explained in Equation (1). t j is the travel time threshold of park j , which corresponds to the distance threshold of parks in Equation (5).
Finally, the combined spatial accessibility at each population location i can be calculated as the weighted average of A i , a , A i , b , and A i , c as follows:
A i = P i α a A i , a + P i α b A i , b + P i α c A i , c P i α a + P i α b + P i α c
where A i is the overall accessibility at population location i , which combined three trip modes and other variables, as with Equations (8)–(10). From the residential trip survey released by the Wuhan government in 2020 [56], we can find that the proportions of cycling, driving (including private car and taxi), and public transit mode (including bus and subway) in Wuhan are about 57.6%, 20.8%, and 21.3%, respecitvely. After standardization to the sum of 100%, α a = 0.577, α b = 0.209, and α c = 0.214.

3.3. Spatial Pattern Analysis of Park Accessibility

Optimized Hot Spot Analysis in ArcGIS 10.4 is used to explore the spatial pattern of park spatial accessibility. This software can create a map of statistically significant hot and cold spots using the Getis–Ord Gi* statistic and can evaluate the characteristics of the input feature class to produce optimal results.
The output results include Z-score, p-values, and significance level. Z-scores can indicate the degree of clustering. Positive Z-scores represent hot spots, indicating areas with high attribute values surrounded by high values. Negative Z-scores represent cold spots, indicating areas with low attribute values surrounded by low values. The p-values associated with each Z-score determine the statistical significance of the clustering. Lower p-values indicate stronger evidence for significant clustering. The significance level can be set to control the threshold for determining statistically significant hot and cold spots. The default significance level is set at 0.05. Spatial autocorrelation indices, such as Moran’s I, can provide insights into the overall spatial patterns and validate if clustering identified by hot spot analysis is statistically significant.

4. Experiment and Analysis

4.1. Study Area and Data
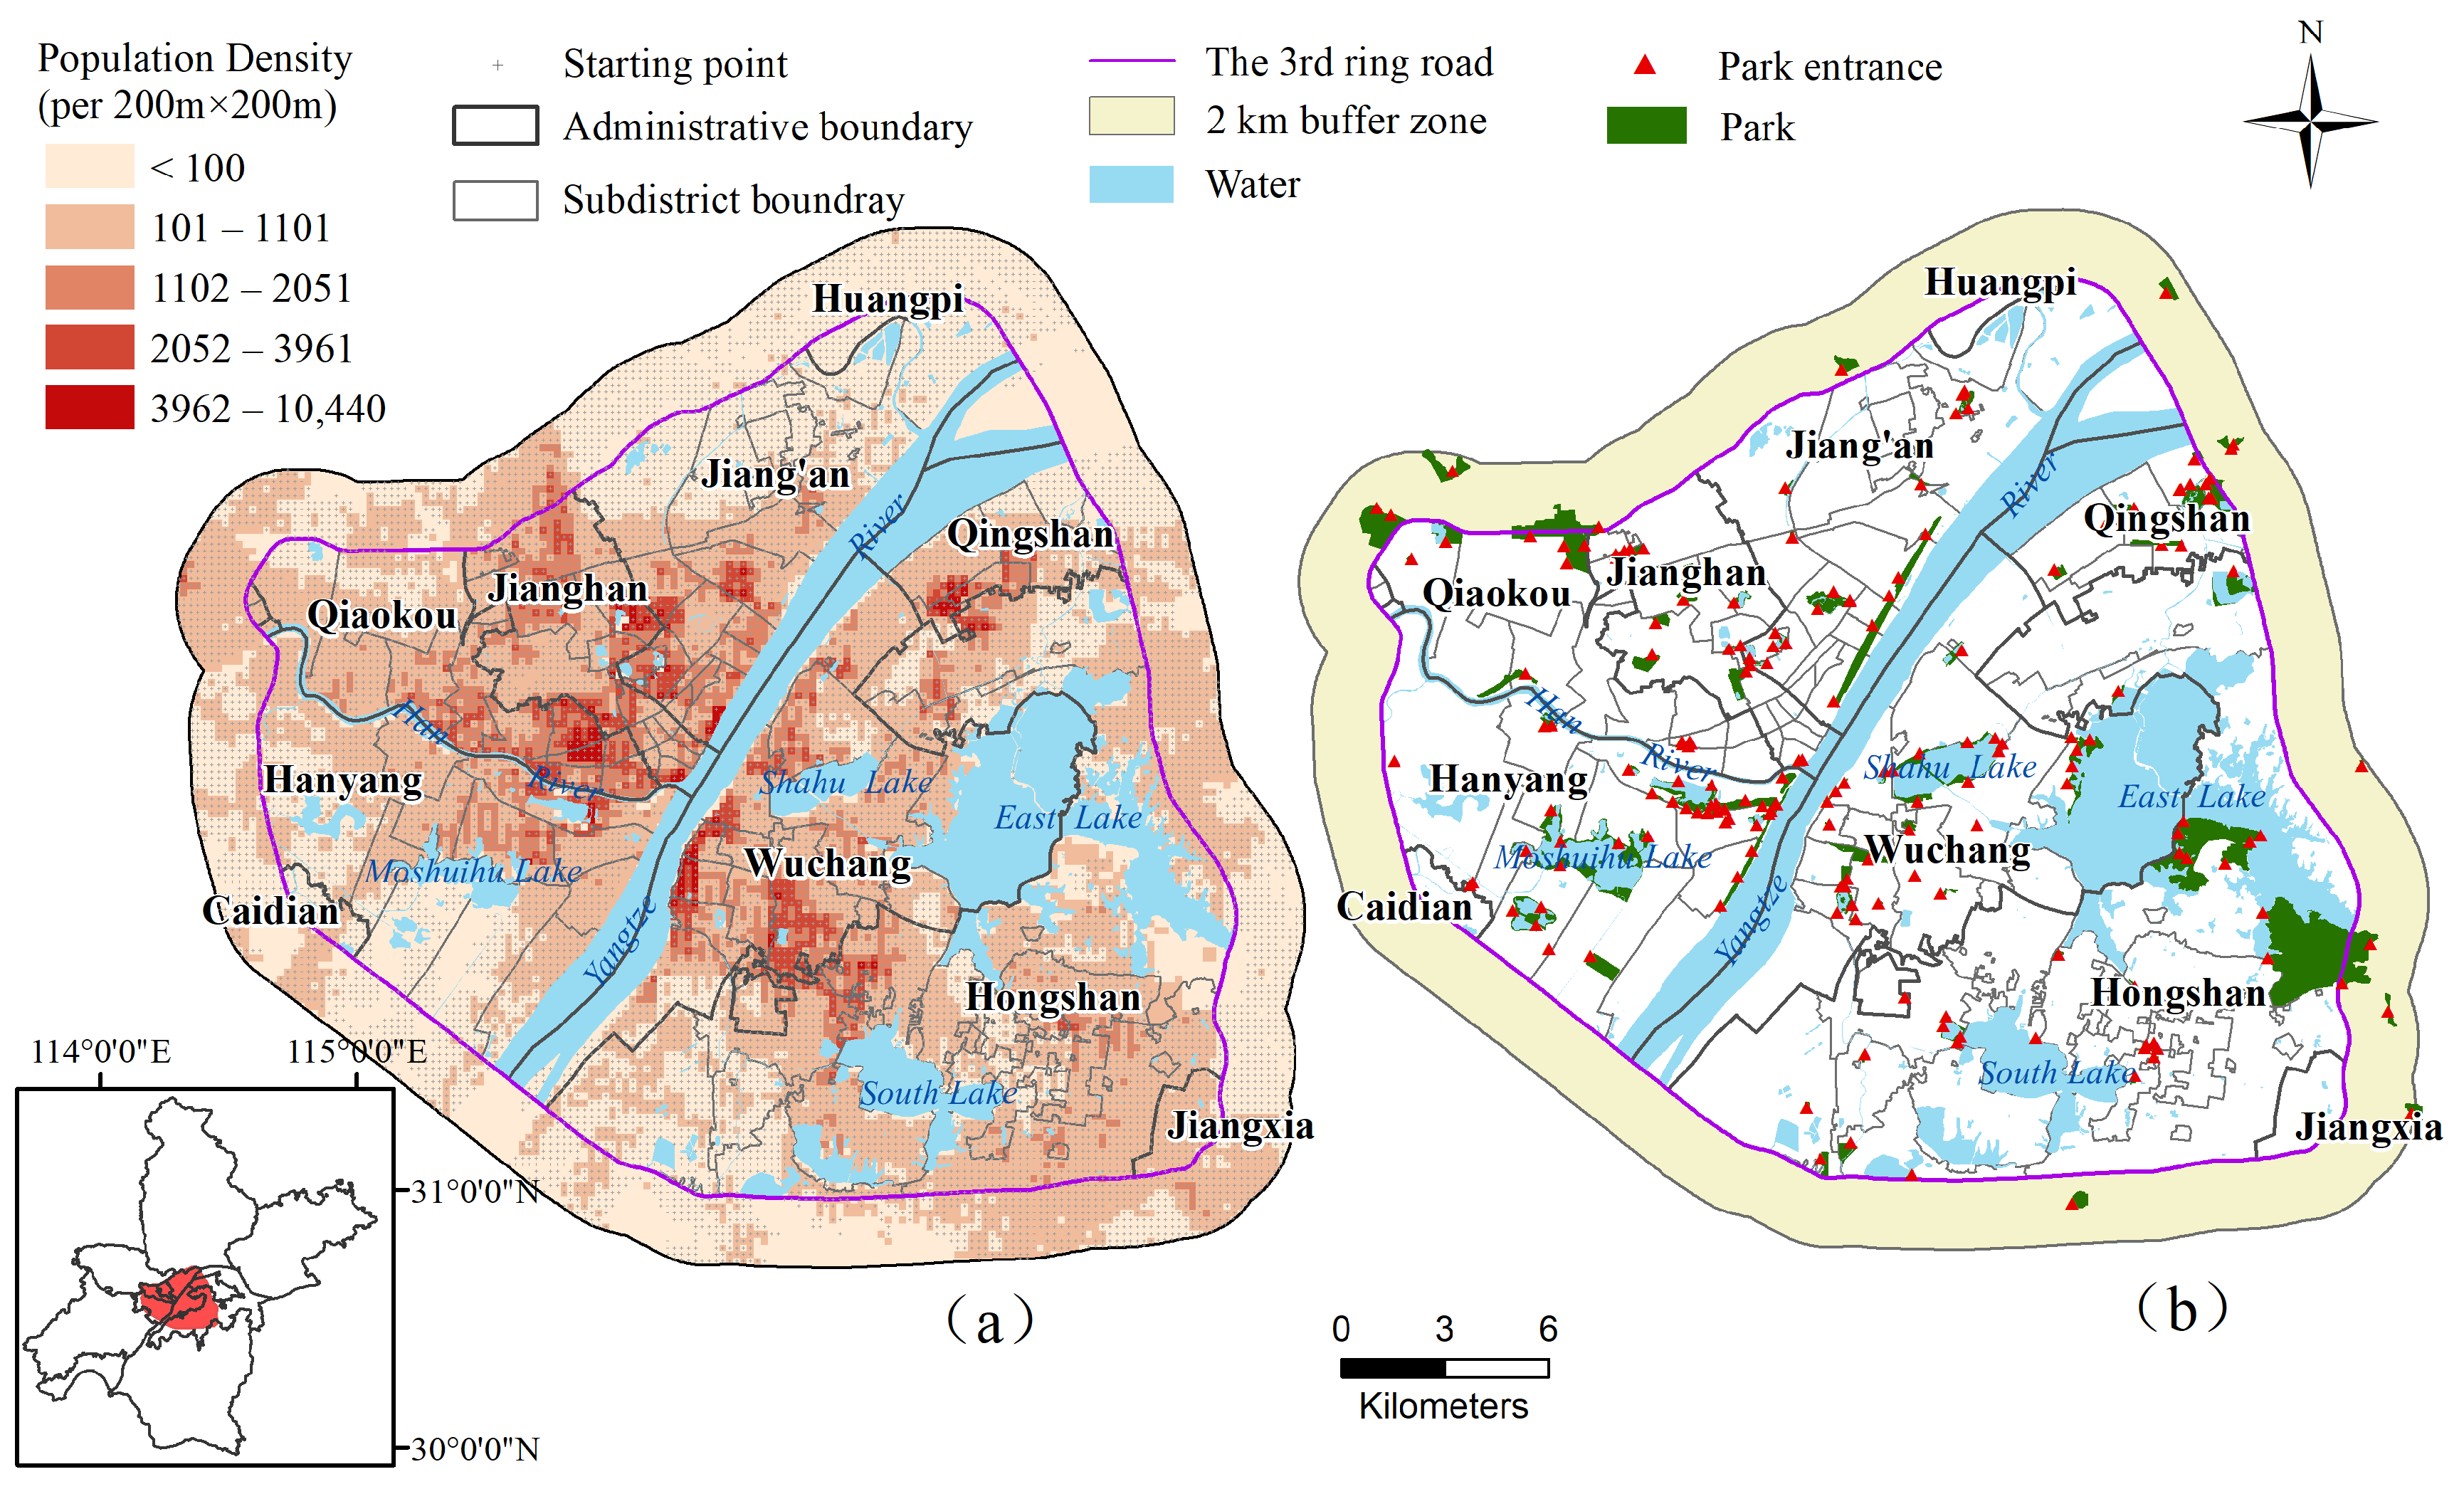
4.1.1. Study Area

Wuhan is the capital city of Hubei Province and the core city of the Yangtze River Economic Belt [57]. As one of the earliest cities to rapidly urbanize in modern China, Wuhan is a typical area for urban park construction in large cities, making it suitable for analyzing the spatial accessibility of urban parks. In this paper, we select the inner city of Wuhan, China, as the study area, which is bordered by the Third Ring Road, has an estimated population of 6.13 million, and is divided into 93 subdistricts and ten administrative districts.

4.1.2. Data Sources and Processing

The population demand location for park accessibility measurement is the center point of the 200 m × 200 m grid demarcated by ArcGIS in the study area, which is sourced from the remote sensing data of Worldpop [58] with a resolution of 200 m in 2020. Waters and the uninhabited areas are removed, and we finally obtain 13,359 demand points. As shown in Figure 2a, the spatial distribution of the population is mainly concentrated in the core of the study area.
The AOI (area of interest) of urban parks was extracted through Amap [50]. This study focuses on parks with an area of more than 1 ha because small parks are frequently short of amenities such as playgrounds, walking/cycling paths, hiking trails, and outdoor fitness equipment. As shown in Table 1, there are 85 parks with a total area of 3219.6 ha in the inner city of Wuhan as of 2023, including 12 parks with an area of more than 50 ha, 18 parks between 20–50 ha, 15 parks between 10–20 ha, 14 parks between 5–10 ha, and 26 parks between 1–5 ha. The catchment size of parks with different areas is determined based on China’s Park Classification Standards (GB/T51346-2019) in Section 3.2.
Additionally, the commonly known “edge effect” may affect the accessibility along the border [30]; that is, people within the border may visit the parks outside of the study area and vice versa. Therefore, this study expands the range of urban parks by 2 km as a buffer from the Third Ring Road and obtains the outer parks (see Figure 2b), including ten parks and 3200 grids of the population surrounding the study area. The destination for the accessibility measurement is the entrances of each park, and a total of 181 destinations are obtained in this paper.
Travel impedance (i.e., travel distance and travel time) will restrict people’s accessibility to urban parks, mainly depending on the actual road network conditions and travel transportation modes [42]. The modeled road network can obtain the travel distance, and the travel time is commonly measured by the assumed driving speed, which ignores the impact of the temporal impedance of the transportation system. Many studies use online maps to generate a more accurate travel time which takes into account the current transport network and real-time traffic conditions [59,60,61]. The Amap API [62], one of the biggest online maps in China, has been broadly adopted in measuring the accessibility of public services such as urban fire services [31,63], health care [42,60], urban parks [18], and so on. It calculates real-time travel time and distance by analyzing data sources like GPS, traffic patterns, and user reports, allowing informed decisions based on up-to-date information. To handle missing data, Amap employs historical analysis and predictive modeling, estimating travel time based on past traffic patterns and existing data. While unexpected incidents may temporarily affect reliability, they are infrequent and can be disregarded. This study takes the center of population grids as the origin and the entrance point of urban parks as the destination. The path planning function provided by Amap API is used to extract the travel time and distance under three transportation modes (cycling, public transit, and driving). If a park has several entrances, the shortest travel time was used as the final result from residential areas to the urban park. The average travel time and distance starting at 9 am on four working days (from 27 March to 30 March 2023), were used as the final result to eliminate the uncertainty of travel impedance under different traffic conditions.

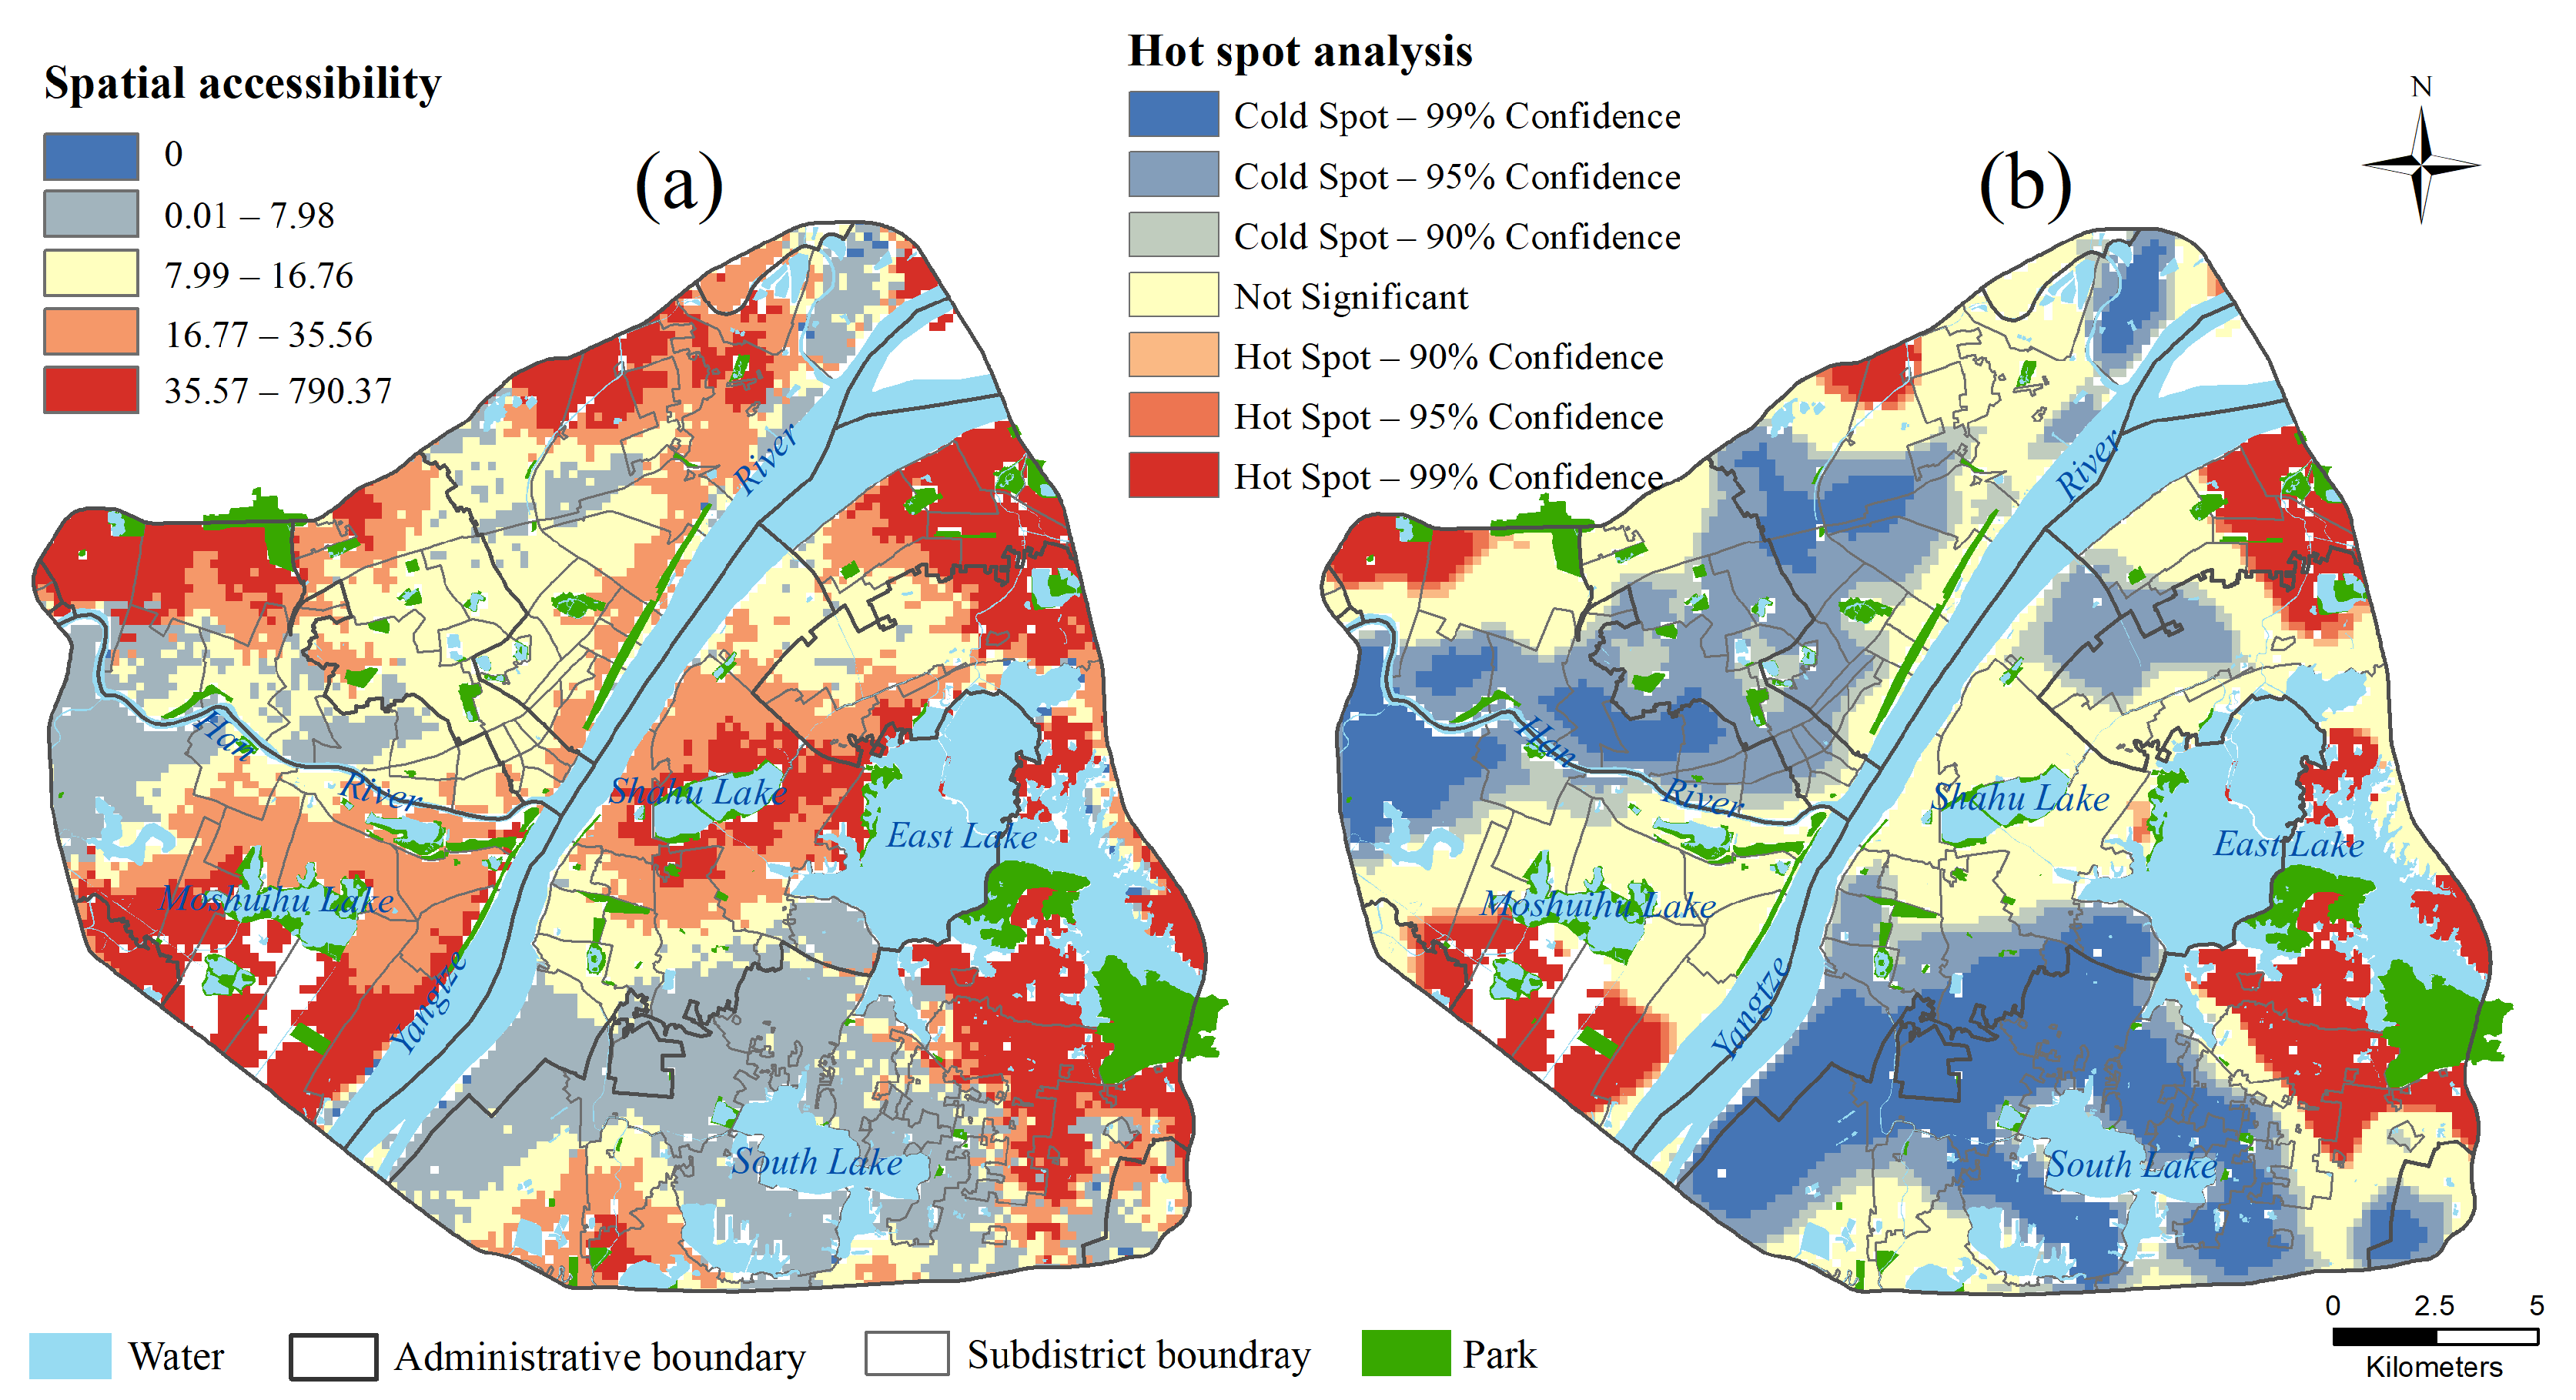
4.2. Multimodel Park Accessibility Analysis

Figure 3a shows the spatial distribution of park accessibility using the CM2SFCA method. Quartile classification is used to sort the accessibility scores, except for zero values, in ascending order. An area with a value of 0 indicates that the travel time exceeded the limits of all transportation modes, indicating very low accessibility (i.e., 18 min for cycling, 20 min for public transit, and 15 min for driving) and requiring special attention. The sorted scores are divided into quartiles, where the first 25% are classified as low levels, the next 25% to 50% as medium levels, the 50% to 75% as high levels, and the last 25% as very high levels [64]. About 21.1% of the population is in the low type, 40.4% is in the medium type, and only 38.5% is in the high or very high type. As shown in Figure 3a, the spatial accessibility pattern of the CM2SFCA method shows apparent spatial heterogeneity. High accessibility areas are mainly distributed near the Third Ring Road, with parks of strong supply capacity, such as those south of Moshuihu Lake, northwest of Qingshan, and southeast of East Lake. Parks with low accessibility are distributed in the western and southern regions.
Optimized Hot Spot Analysis in ArcGIS was used to analyze the spatial patterns of parks. Hot spots are spatial units with high accessibility surrounded by neighbors with high accessibility value, and cold spots are those with low accessibility surrounded by neighbors with low accessibility value. As shown in Figure 3b, the neighborhoods of South Lake and Han River, as well as the central part of Jiang’an district, are the cold spots clustered in low accessibility which need to be given special attention. The distribution of hot spots is similar to the spatial distribution of high accessibility in Figure 3a. They are clustered near the parks with strong supply capacity at the boundary of the study area. It is worth mentioning that the accessibility value near Shahu Lake is very high, but this area is not identified as a hot spot unit. This is due to the scattered distribution and smaller size of areas with high park accessibility in that region compared to other hot spot areas. In addition, other areas do not show any significant spatial clustering pattern.

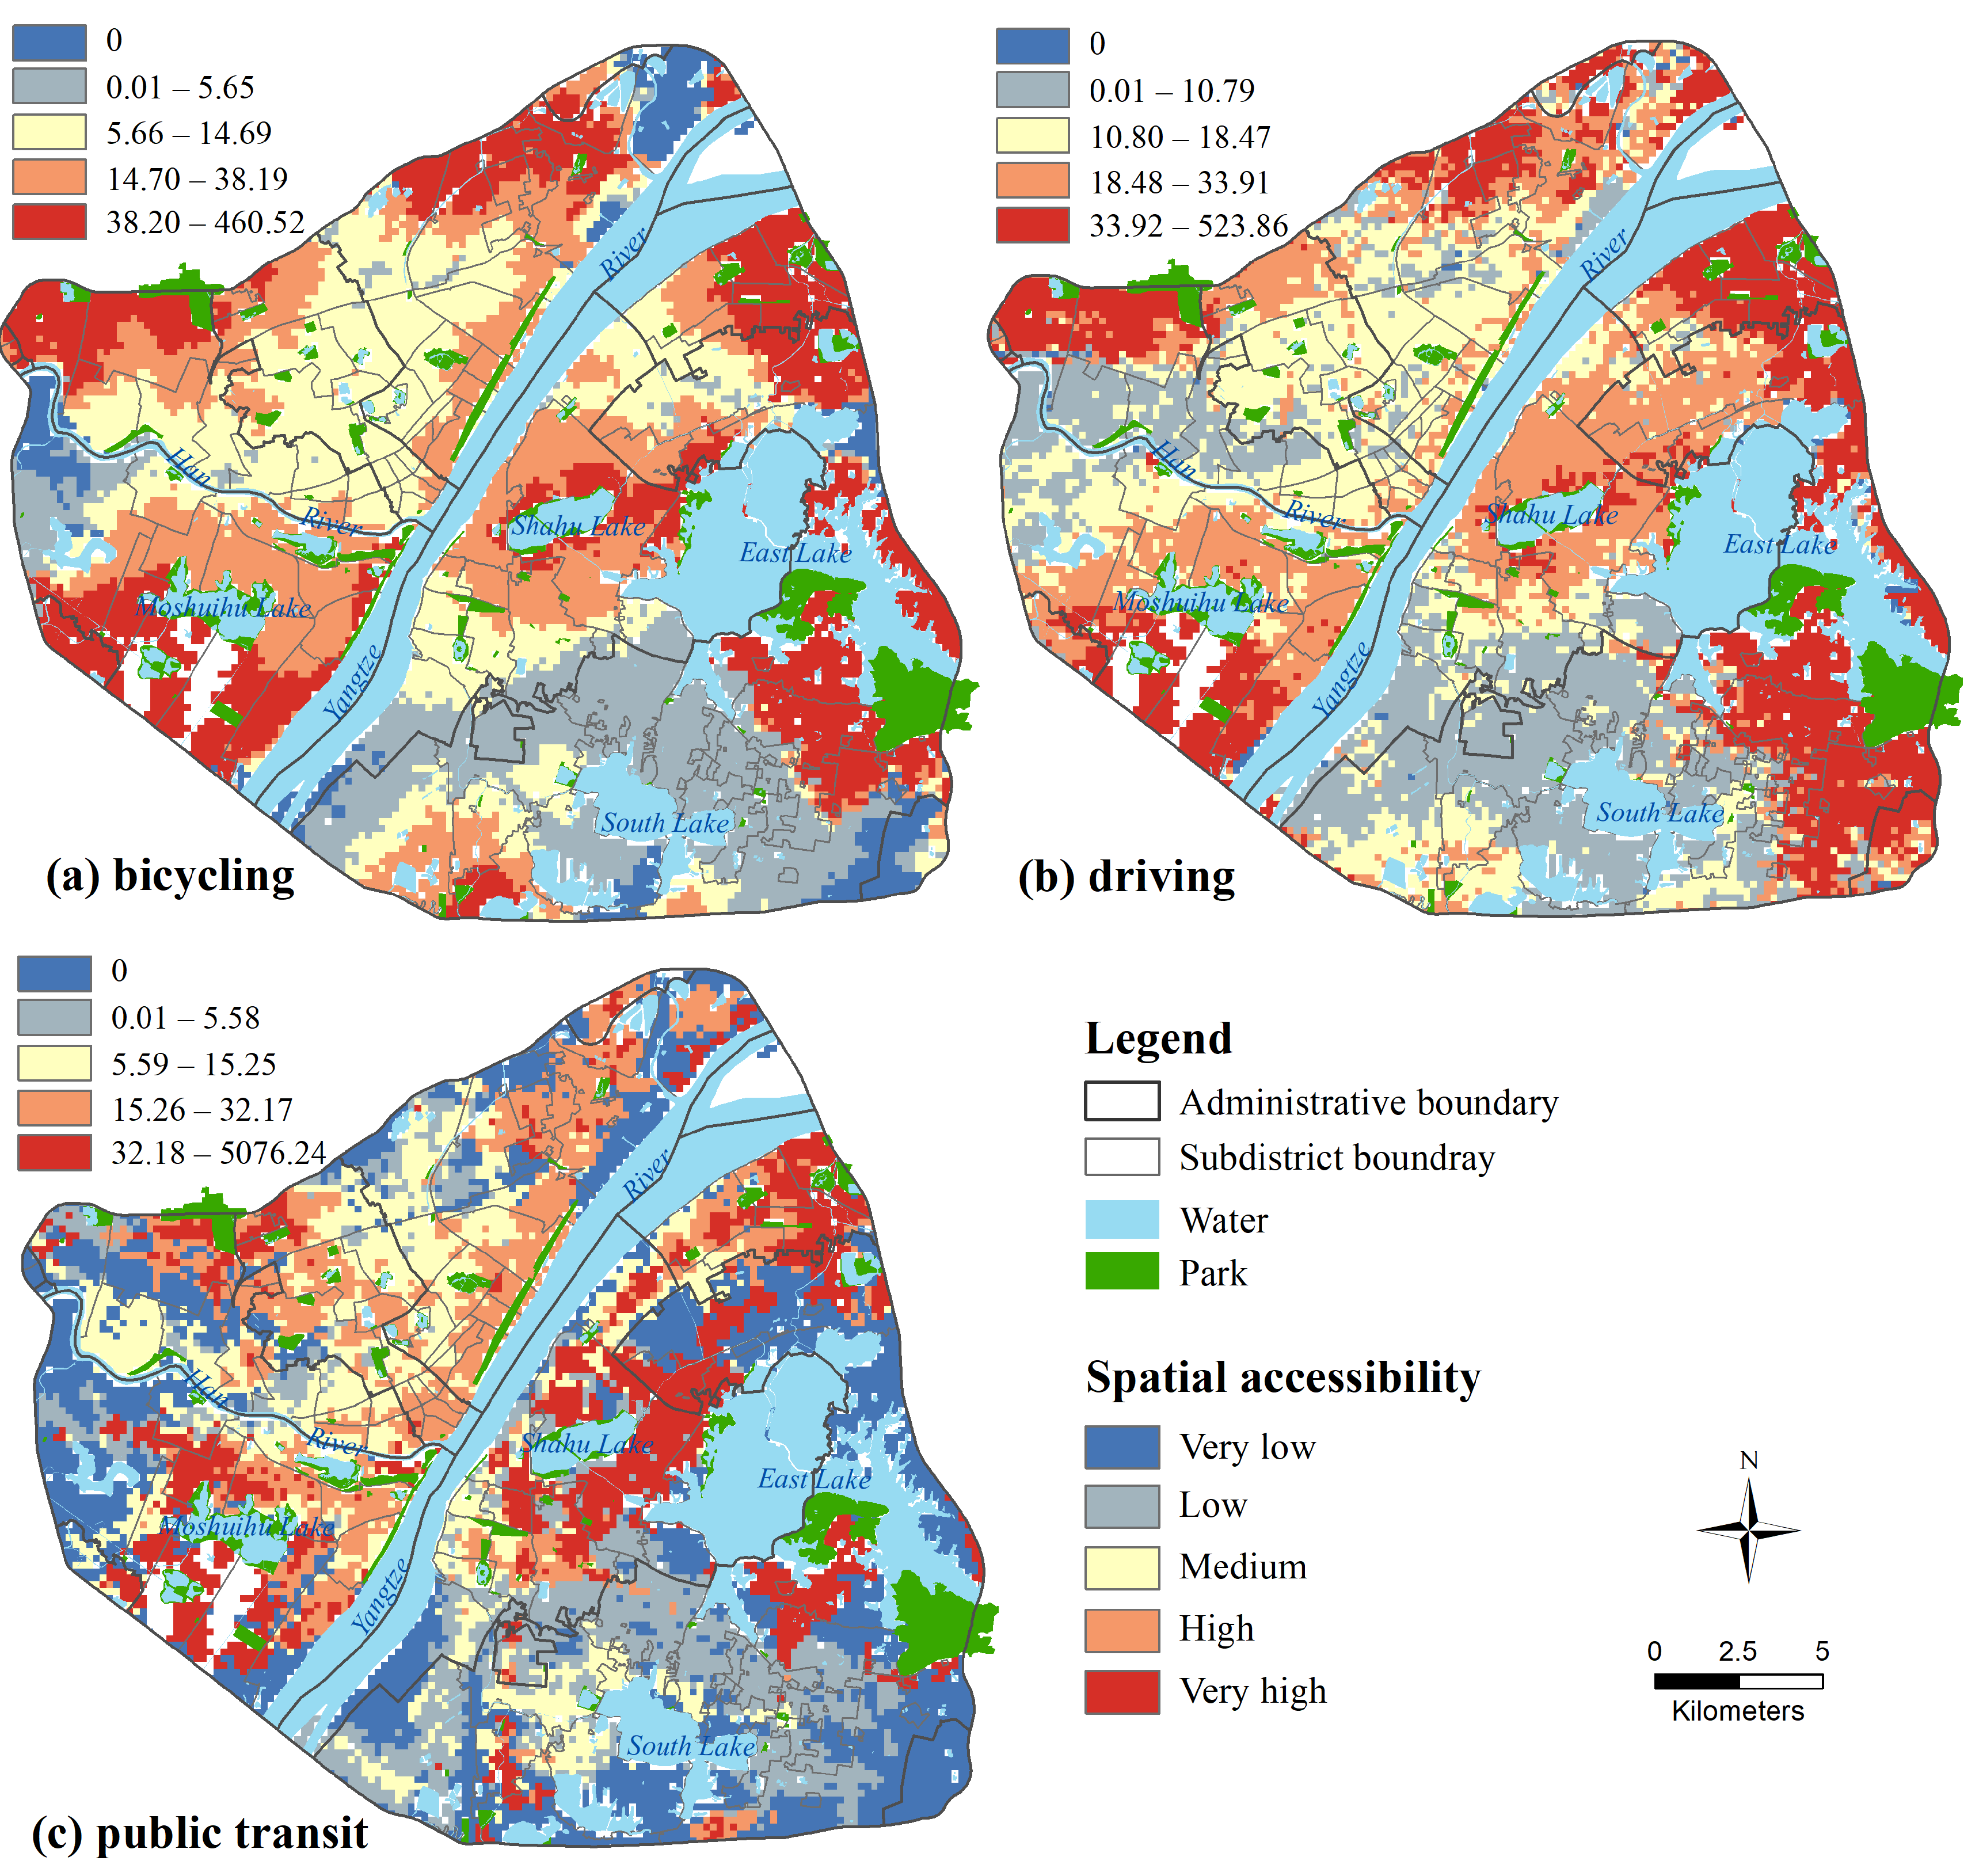
4.3. Comparison with Single-Model Accessibility

The statistical results of four scenarios—multimode transportation, bicycle mode, driving mode, and public transit mode—were compared to explore the differences in park accessibility under multimodal and single-mode scnarios. As shown in Table 2, based on the value from Q1 to Q3, we can find that driving accessibility is the highest, while public transit accessibility is the lowest. Furthermore, the percentage of the underserved population (0.3%) is the lowest under driving, followed by multimodal (0.9%), and cycling (2.2%), but the highest under public transit (15.5%). This is because public transportation usually has a fixed travel route and cannot reach the destination directly. In contrast, the driving route is flexible, and drivers can choose the route with the lowest travel cost. At the same time, there are transfers during public transportation, which take up a portion of the travel time. Therefore, in some areas, the travel time exceeds the travel threshold of public transit (20 min) but is within the travel threshold of driving (15 min).
Meanwhile, the average and standard deviation of park accessibility by public transit is the highest, while the average accessibility under cycling is the lowest, and the standard deviation under driving is the lowest. This is because driving speed is higher than cycling speed, so people who drive to the park may travel farther than those who bike, resulting in higher accessibility averages. Also, the subway is faster than driving and is unaffected by traffic congestion. As a result, it takes less time to reach the park via the subway than driving for those who live near the subway. Therefore, in those areas, the accessibility value is higher, resulting in the highest standard deviation in this trip mode.
By comparing the spatial distribution of park accessibility under three single models and the multimodel, we find that the cycling accessibility distribution (Figure 4a) is similar to the multimodel accessibility distribution (Figure 3a) with a blocky structure. High accessibility areas are mainly distributed around the parks with strong supply capacity, and the accessibility value gradually decreases from the park center outward. The result shows that cycling accessibility can be significantly affected by travel distance. The inaccessible areas are concentrated in the north of Jiang’an District, the west of Hanyang District, and the west and southeast of Hongshan District. Compared with cycling accessibility, the spatial accessibility distribution of public transit is discontinuous and varies greatly. Because the public transit routes (such as bus and subway) are permanently fixed and distributed in strips along the road, the distribution of high accessibility has changed from blocks to strips, such as in the area near the Yangtze River in Qingshan District. In addition, although public transportation travels much faster than bicycles, the spatial accessibility of public transit in some areas (Figure 4c) is lower than that of cycling, such as in the west of Qiaokou District, due to the parking at each station, waiting, and transferring when using public transportation. Finally, the spatial accessibility distribution of driving (Figure 4b) is more balanced than that of multimodal, bicycle, and public transportation, with the smallest areas of low and very low levels.
In general, the multimodal spatial accessibility combines the characteristics of three single transportations (bicycling, driving, and public transit) and is more in line with the actual travel situation. In the choice of transportation modes to access urban parks, public transportation can be preferred if the area is located near the metro, and vice versa for travel by driving.

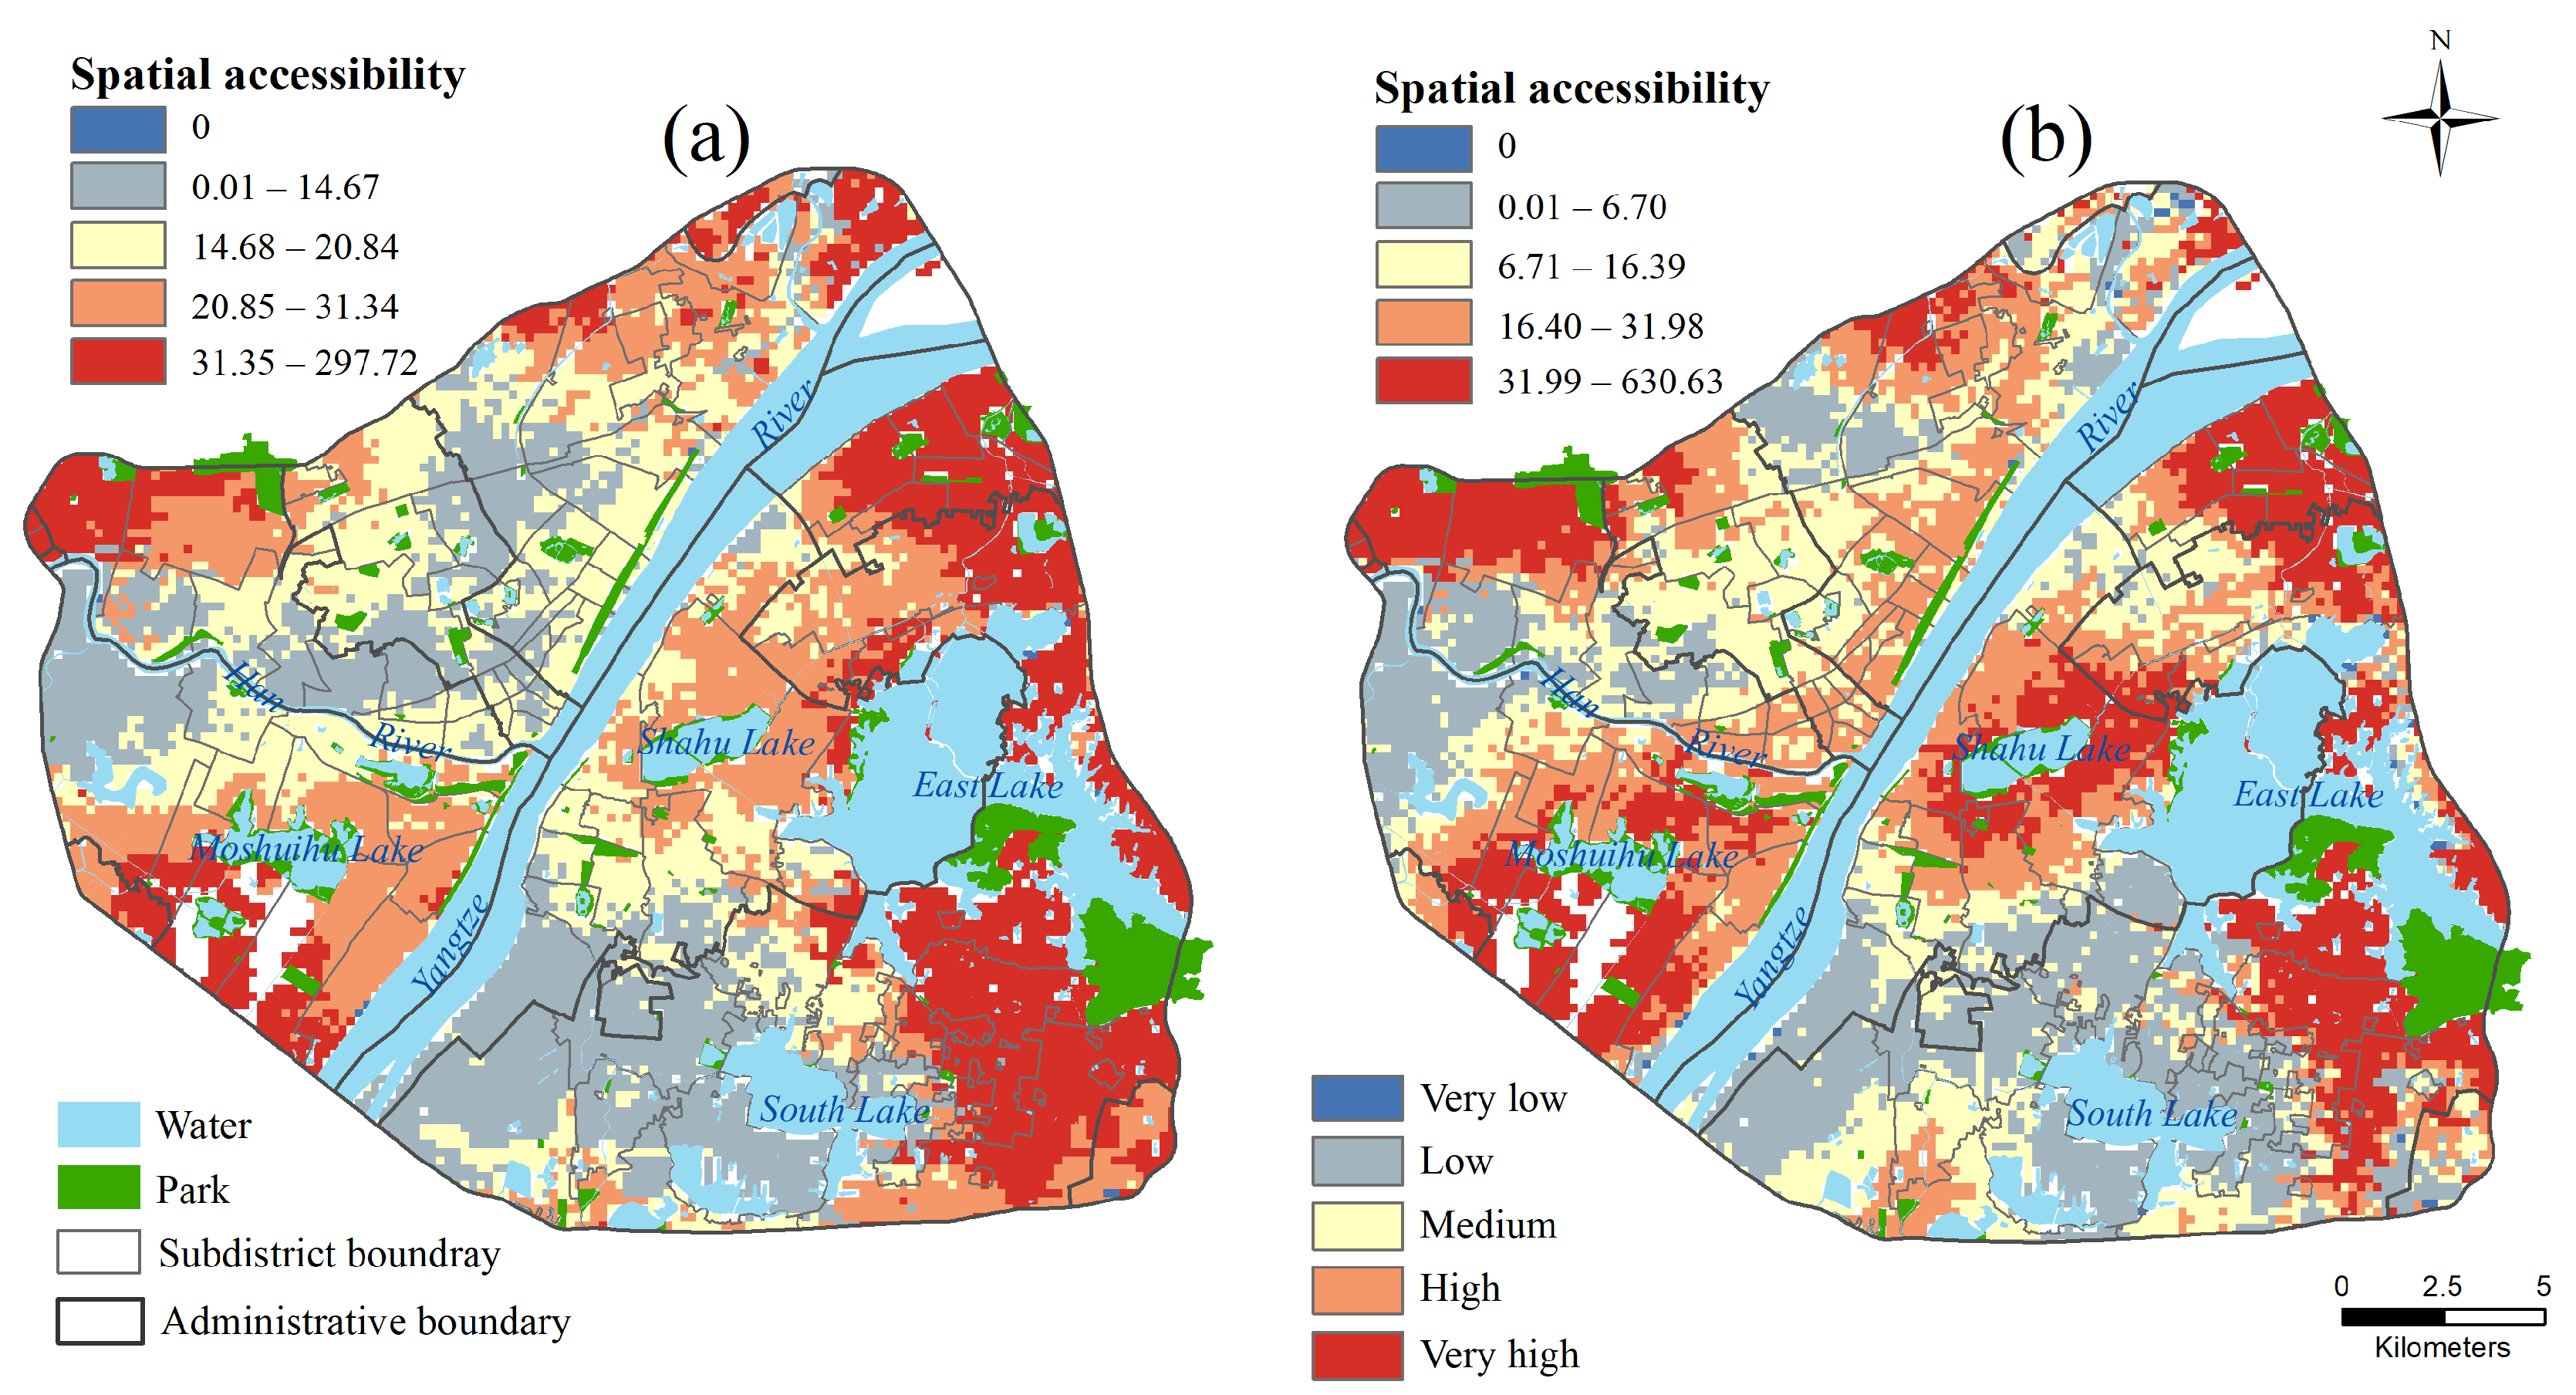
4.4. Comparison with Other Methods

To explore the sensitivity of the variable catchment sizes and the selection probability for individuals, a comparison between the CM2SFCA model and two other models (the Huff model-based 2SFCA method [41] and the variable two-step floating catchment area (V2SFCA) method) is conducted in this paper [35]. The maximum acceptable time for residents to arrive at the nearest park is 30 min [13]. Thus, in the Huff model-based 2SFCA method, a fixed catchment size of 30 min is utilized for each park. As for the V2SFCA method, it considers the various catchment sized but does not consider the selection probability for individuals.
As shown in Table 3, based on the value from Q1 to Q3, we can find that the spatial accessibility of the Huff model-based 2SFCA method and the V2SFCA method are both lower than those of the CM2SFCA method; in addition, the percentage of underserved population is much lower than that of the CM2SFCA method. This indicates that using a fixed catchment size or not considering the selection probability of individuals would underestimate the overall park accessibility.
Figure 5 shows the spatial distribution of park accessibility using the Huff model-based 2SFCA (Figure 5a) and V2SFCA (Figure 5b) methods. By comparing the result of Huff model-based 2SFCA (Figure 5a) and the CM2SFCA method (Figure 3a), we can find that the accessibility of the eastern region of the study area in Figure 5a is higher than that in Figure 3a. This is because the catchment size of all parks is set as 30 min in the Huff model-based 2SFCA method, which overestimates the supply capacity of parks with weak supply capacity and underestimates the supply capacity of parks with strong supply capacity. As shown in Figure 5a, the supply capacity of the parks near Qingshan District is not strong, while they are significantly overestimated in the Huff model-based 2SFCA method, resulting in the overestimation of spatial accessibility. At the same time, as a large park with water bodies, the real supply capacity of Shahu Park is significantly underestimated, resulting in the underestimation.
By comparing Figure 3a and Figure 5b, it can be observed that the park accessibility in the northern riverside area of the Yangtze River (Figure 5b) is higher than that in Figure 3a. This disparity can be attributed to the V2SFCA method’s omission of the probability factor related to park selection based on their supply capabilities, which assumes that individuals have an equal likelihood of reaching any parks within their catchment area, disregarding the variations in park supply capacity. Also, these areas are highly densely populated (see Figure 1b), which leads to the dispersion of excessive population demand towards nearby parks, resulting in a decrease in population demand for each park and an increase in accessibility.
However, in real-world scenarios, parks with different supply capacities often have varying catchment sizes, and people tend to prefer parks with closer travel distance and stronger supply capacities. The proposed CM2SFCA model considers both the variable catchment sizes and selection probability of individuals, allowing for a more comprehensive capture of individual behavior and the capacity differences between parks. As a result, it can moderate both the overestimations and underestimations of the traditional 2SFCA method and provide more realistic spatial accessibility values.

4.5. Spatial Relationship between Park Accessibility and Population Density

It is necessary to explore the spatial relationship between park accessibility and population density to improve the equity of urban park resource allocation. In this study, using the bivariate local Moran’s I, five categories are obtained by Geoda software: High-High cluster, High-Low cluster, Low-High cluster, Low-Low cluster, and not-significant cluster. High-High cluster means High accessibility (Ai)-High population density (Pi), while Low-Low cluster means Low Ai-Low Pi. High-Low cluster means High Ai-Low Pi—that the supply outweighs the population demand, while Low-High cluster means Low Ai-High Pi—that the population demand outweighs the supply. Finally, the non-significant type indicates that the spatial relationship between park accessibility and population density is insignificant.
Figure 6 shows the spatial distribution of the association between park accessibility and population density, while Table 4 shows the statistical results. From Figure 6 and Table 4, we can find: (1) only a tiny part of the population (1.6%) presents a distribution pattern of High Ai-High Pi with average accessibility of 67.44, which is only distributed near the Shahu Lake and Moshuihu Lake, as well as in the southern part of East Lake. These areas are densely populated and close to the parks with strong capacity. Thus, they show High Ai-High Pi characteristics. (2) The population percentage in areas with High Ai-Low Pi is relevantly low, with an average population of 106,187 (1.7%) and an average accessibility of 102.5. These areas are located near the Third Ring Road and close to the strong supply capacity parks with relatively low population density. (3) The average population of 2,890,060 (47.2%) is characterized by Low Ai-High Pi, and the average accessibility is 14.2. These areas are located in the central area of the study area, where the population is highly concentrated. (4) The average population in the Low Ai-Low Pi area is 233,909 (3.8%), with average accessibility of 13.21, which is mainly located at the edge of the study area, except for the High Ai and High Pi region. Compared with the central region, these areas have relatively lower population density and more dispersed distribution of parks, showing Low Ai-Low Pi characteristics due to long travel impedance and the insufficient capacity of accessible parks.
In general, about half of the population in the inner city of Wuhan live in areas with Low Ai-High Pi, which is a common problem faced by many other large cities. On the one hand, it is difficult to build new parks in the central city due to the high level of urbanization, high population density, and high-intensity land development. The supply capacity of the existing parks is no longer sufficient to meet the current growing population demand. On the other hand, most parks with strong supply capacity are located in suburban areas, where the relevantly poor traffic conditions can lead to higher travel time costs and the increased population density can further contribute to traffic congestion, thereby reducing park accessibility. The following suggestions may be feasible to balance population demand and park supply. (1) The urban planners can establish new parks in the suburbs (Low Ai-Low Pi area in Figure 6) while improving the transportation network to shorten the time cost. (2) In urban centers with high population density, some small open spaces can be developed into micro parks, or the regions with large parks can be opened up, such as universities and communities. By sharing these spaces with the public, the population demand of the central city can be dispersed.

5. Conclusions and Discussion

In this study, we propose the CM2SFCA method to analyze the spatial characteristics of urban park accessibility and compare the results of multimodel and single-mode accessibility. The method considers the effect of supply capacity, the selection probability of individuals, and variable catchment sizes based on multimodal transportation, which has the following advantages in theory: firstly, the acreage and the rating of urban parks are used as quality assessment components to improve supply parameters. Secondly, according to policy regulations, variable service range thresholds are adopted for parks that correspond to a larger service range. Thirdly, the competitive effect between parks and selection probability for individuals can avoid the overestimation of accessibility. Finally, the model can improve the studies that do not consider the impact of transportation modes on accessibility. These improvements ensure that the accessibility evaluation method proposed in this paper can provide a more realistic evaluation. Moreover, since urban parks can be regarded as a public service, the proposed method also applies to studying other services such as health care and food outlets.
Additionally, we conducted a case study in the inner city of Wuhan, China, and the main findings are summarized as follows: (1) the park accessibility in the study area shows apparent spatial differentiation, where high accessibility areas are mainly clustered near the Third Ring Road, with parks of strong supply capacity, such as the parks that are south of Moshuihu Lake, northwest of Qingshan, and southeast of East Lake; those with low accessibility are clustered in the neighborhoods of South Lake and Han River as well as the central part of Jiang’an district. (2) Multimodal spatial accessibility combines the characteristics of three single transportations (bicycling, driving, and public transit) and can provide a more realistic evaluation. (3) By using bivariate local Moran’s I analysis, we found the areas with Low Ai-High Pi and Low Ai-Low Pi that require special attention. The former is located in the central area of the study area with high population density, and the latter is located at the edge of the study area, except for the High Ai and High Pi region, with a relatively discrete distribution of parks and weak supply capacity.
In practice, the empirical research in this paper may have policy significance for the planning and management of urban parks. First, the 200 m × 200 m grid units are adopted as the location of population demand, which can obtain a finer park accessibility than that using the centroid of communities. Second, this study measures park accessibility under multimodel and single-transportation modes (cycling, driving, and public transit) and finds that the proportion of underserved populations is the highest under public transit. However, public transportation can be preferred for areas near the subway because these areas have the highest accessibility values. In underserved areas, people cannot access parks within adequate travel time. Therefore, parks within acceptable travel times should be built, and the transportation network should be improved to shorten travel costs. Third, according to the bivariate local Moran’s I analysis, we found the areas with Low Ai-High Pi and put forward suggestions to balance population demand and park supply.
However, there are still some limitations in this study. First, the use of e-mopeds as a mode of transportation is common in many cities in China due to their flexibility and cost advantages. However, this paper only considers the travel modes of cycling, driving, and public transit for residents. In future research and planning, it is necessary to consider the e-moped trip mode to explore park accessibility under more comprehensive multiple transportation modes. Second, the financial cost is an essential factor that affects travel mode choices. Hence, it is necessary for further exploration to develop a comprehensive measurement method that considers both financial costs and travel costs (time and distance). Third, for personalized and accurate travel planning, as well as specific transportation scenarios (such as peak hours or special events), it is essential to distinguish different times of day (peak and off-peak) or days of the week (weekdays and weekends) to capture the variations in travel time. The spatiotemporal accessibility of parks in Wuhan could be explored based on the CM2SFCA model in future work. Furthermore, as the urban park is a public service, the proposed CM2SFCA method can be applied to other cities or services such as health care and shopping stores.

Author Contributions

Conceptualization, Jingzhong Li; Methodology, Kainan Mao and Jingzhong Li; Software, Kainan Mao; Validation, Haowen Yan; Resources, Haowen Yan; Data curation, Kainan Mao; Writing—review & editing, Jingzhong Li; Visualization, Kainan Mao; Supervision, Haowen Yan; Project administration, Haowen Yan. All authors have read and agreed to the published version of the manuscript.

Funding

This work was financially supported by the Open Research Fund of Key Laboratory of Digital Earth Science (Grant number 2022LDE004); the National Natural Science Foundation of China (Grant number 42271454 and 42001402); the Key Program of National Natural Science Foundation of China (Grant number 41930101); and the Open Fund of Key Laboratory of Urban Land Resources Monitoring and Simulation, Ministry of Natural Resources (Grant number KF-2022-07-017).

Data Availability Statement

Datasets for this paper are available through figshare: https://doi.org/10.6084/m9.figshare.24056649

Acknowledgments

We acknowledge any support not covered by the author’s contributions or funding sections, including administrative and technical support that is not covered and data materials for experiments.

Conflicts of Interest

The authors declare no conflict of interest.

References

  1. Bertram, C.; Rehdanz, K. The role of urban green space for human well-being. Ecol. Econ. 2015, 120, 139–152. [Google Scholar] [CrossRef]
  2. Macháč, J.; Brabec, J.; Arnberger, A. Exploring public preferences and preference heterogeneity for green and blue infrastructure in urban green spaces. Urban For. Urban Green. 2022, 75, 127695. [Google Scholar] [CrossRef]
  3. Onose, D.-A.; Ioja, C.; Niţă, M.-R.; Badiu, D.L.; Hossu, C.-A. Green Struggle—Environmental Conflicts Involving Urban Green Areas in Bucharest City. In Making Green Cities: Concepts, Challenges and Practice; Breuste, J., Artmann, M., Ioja, C., Qureshi, S., Eds.; Springer International Publishing: Cham, Switzerland, 2023; pp. 555–569. [Google Scholar]
  4. Thompson, C.W.; Roe, J.; Aspinall, P.; Mitchell, R.; Clow, A.; Miller, D. More green space is linked to less stress in deprived communities: Evidence from salivary cortisol patterns. Landsc. Urban Plan. 2012, 105, 221–229. [Google Scholar] [CrossRef]
  5. Kaźmierczak, A. The contribution of local parks to neighbourhood social ties. Landsc. Urban Plan. 2013, 109, 31–44. [Google Scholar] [CrossRef]
  6. Beyer, K.M.; Kaltenbach, A.; Szabo, A.; Bogar, S.; Nieto, F.J.; Malecki, K.M. Exposure to neighborhood green space and mental health: Evidence from the survey of the health of Wisconsin. Int. J. Environ. Res. Public Health 2014, 11, 3453–3472. [Google Scholar] [CrossRef] [PubMed]
  7. Silveira, I.H.D.; Junger, W.L. Green spaces and mortality due to cardiovascular diseases in the city of Rio de Janeiro. Rev. De Saude Publica 2018, 52, 49. [Google Scholar] [CrossRef]
  8. White, P.C.; Wyatt, J.; Chalfont, G.; Bland, J.M.; Neale, C.; Trepel, D.; Graham, H. Exposure to nature gardens has time-dependent associations with mood improvements for people with mid- and late-stage dementia: Innovative practice. Dementia 2018, 17, 627–634. [Google Scholar] [CrossRef] [PubMed]
  9. Zhou, X.; Kim, J. Social disparities in tree canopy and park accessibility: A case study of six cities in Illinois using GIS and remote sensing. Urban For. Urban Green. 2013, 12, 88–97. [Google Scholar] [CrossRef]
  10. Xiao, Y.; Wang, D.; Fang, J. Exploring the disparities in park access through mobile phone data: Evidence from Shanghai, China. Landsc. Urban Plan. 2019, 181, 80–91. [Google Scholar] [CrossRef]
  11. Song, Y.; Chen, B.; Kwan, M.-P. How does urban expansion impact people’s exposure to green environments? A comparative study of 290 Chinese cities. J. Clean. Prod. 2020, 246, 119018. [Google Scholar] [CrossRef]
  12. Song, Y.; Chen, B.; Ho, H.C.; Kwan, M.-P.; Liu, D.; Wang, F.; Wang, J.; Cai, J.; Li, X.; Xu, Y.; et al. Observed inequality in urban greenspace exposure in China. Environ. Int. 2021, 156, 106778. [Google Scholar] [CrossRef] [PubMed]
  13. Xing, L.; Liu, Y.; Wang, B.; Wang, Y.; Liu, H. An environmental justice study on spatial access to parks for youth by using an improved 2SFCA method in Wuhan, China. Cities 2020, 96, 102405. [Google Scholar] [CrossRef]
  14. Wei, X.; Zhao, C.; Yan, L.; Fu, J.; Bao, Y.; Liu, X. Spatial accessibility analysis of green space from a health-benefit perspective: Implications for healthy urban development. Front. Ecol. Evol. 2022, 10, 1083563. [Google Scholar] [CrossRef]
  15. Langford, M.; Higgs, G.; Fry, R. Multi-modal two-step floating catchment area analysis of primary health care accessibility. Health Place 2016, 38, 70–81. [Google Scholar] [CrossRef]
  16. Lin, Y.; Wan, N.; Sheets, S.; Gong, X.; Davies, A. A multi-modal relative spatial access assessment approach to measure spatial accessibility to primary care providers. Int. J. Health Geogr. 2018, 17, 33. [Google Scholar] [CrossRef]
  17. Mao, L.; Nekorchuk, D. Measuring spatial accessibility to healthcare for populations with multiple transportation modes. Health Place 2013, 24, 115–122. [Google Scholar] [CrossRef]
  18. Niu, Q.; Wang, Y.; Xia, Y.; Wu, H.; Tang, X. Detailed Assessment of the Spatial Distribution of Urban Parks According to Day and Travel Mode Based on Web Mapping API: A Case Study of Main Parks in Wuhan. Int. J. Environ. Res. Public Health 2018, 15, 1725. [Google Scholar] [CrossRef]
  19. Chen, J.; Wang, C.; Zhang, Y.; Li, D. Measuring spatial accessibility and supply-demand deviation of urban green space: A mobile phone signaling data perspective. Front. Public Health 2022, 10, 1029551. [Google Scholar] [CrossRef]
  20. Wolch, J.R.; Byrne, J.; Newell, J.P. Urban green space, public health, and environmental justice: The challenge of making cities ‘just green enough’. Landsc. Urban Plan. 2014, 125, 234–244. [Google Scholar] [CrossRef]
  21. Rigolon, A. A complex landscape of inequity in access to urban parks: A literature review. Landsc. Urban Plan. 2016, 153, 160–169. [Google Scholar] [CrossRef]
  22. Zhang, J.; Cheng, Y.; Zhao, B. How to accurately identify the underserved areas of peri-urban parks? An integrated accessibility indicator. Ecol. Indic. 2021, 122, 107263. [Google Scholar] [CrossRef]
  23. Nicholls, S.; Shafer, C.S. Measuring accessibility and equity in a local park system: The utility of geospatial technologies to park and recreation professionals. J. Park Recreat. Adm. 2001, 19, 102–124. [Google Scholar]
  24. Comber, A.; Brunsdon, C.; Green, E. Using a GIS-based network analysis to determine urban greenspace accessibility for different ethnic and religious groups. Landsc. Urban Plan. 2008, 86, 103–114. [Google Scholar] [CrossRef]
  25. Moore, L.V.; Diez Roux, A.V.; Evenson, K.R.; McGinn, A.P.; Brines, S.J. Availability of Recreational Resources in Minority and Low Socioeconomic Status Areas. Am. J. Prev. Med. 2008, 34, 16–22. [Google Scholar] [CrossRef] [PubMed]
  26. Radke, J.; Mu, L. Spatial Decompositions, Modeling and Mapping Service Regions to Predict Access to Social Programs. Ann. GIS 2000, 6, 105–112. [Google Scholar] [CrossRef]
  27. Ghorbanzadeh, M.; Kim, K.; Ozguven, E.E.; Horner, M.W. Spatial accessibility assessment of COVID-19 patients to healthcare facilities: A case study of Florida. Travel Behav. Soc. 2021, 24, 95–101. [Google Scholar] [CrossRef]
  28. Tao, Z.; Cheng, Y.; Liu, J. Hierarchical two-step floating catchment area (2SFCA) method: Measuring the spatial accessibility to hierarchical healthcare facilities in Shenzhen, China. Int. J. Equity Health 2020, 19, 164. [Google Scholar] [CrossRef]
  29. Polzin, P.; Borges, J.; Coelho, A. An extended kernel density two-step floating catchment area method to analyze access to health care. Environ. Plan. B Plan. Des. 2014, 41, 717–735. [Google Scholar] [CrossRef]
  30. Li, L.; Du, Q.; Ren, F.; Ma, X. Assessing Spatial Accessibility to Hierarchical Urban Parks by Multi-Types of Travel Distance in Shenzhen, China. Int. J. Environ. Res. Public Health 2019, 16, 1038. [Google Scholar] [CrossRef]
  31. Mao, K.; Chen, Y.; Wu, G.; Huang, J.; Yang, W.; Xia, Z. Measuring Spatial Accessibility of Urban Fire Services Using Historical Fire Incidents in Nanjing, China. ISPRS Int. J. Geo-Inf. 2020, 9, 585. [Google Scholar] [CrossRef]
  32. Min, S.; Kim, D.; Lee, C.K. Association between spatial accessibility to fire protection services and unintentional residential fire injuries or deaths: A cross-sectional study in Dallas, Texas. BMJ Open 2019, 9, e023780. [Google Scholar] [CrossRef]
  33. Guo, S.; Song, C.; Pei, T.; Liu, Y.; Ma, T.; Du, Y.; Chen, J.; Fan, Z.; Tang, X.; Peng, Y.; et al. Accessibility to urban parks for elderly residents: Perspectives from mobile phone data. Landsc. Urban Plan. 2019, 191, 103642. [Google Scholar] [CrossRef]
  34. Dai, D. Racial/ethnic and socioeconomic disparities in urban green space accessibility: Where to intervene? Landsc. Urban Plan. 2011, 102, 234–244. [Google Scholar] [CrossRef]
  35. Luo, W.; Whippo, T. Variable catchment sizes for the two-step floating catchment area (2SFCA) method. Health Place 2012, 18, 789–795. [Google Scholar] [CrossRef] [PubMed]
  36. Dai, D.; Wang, F. Geographic Disparities in Accessibility to Food Stores in Southwest Mississippi. Environ. Plan. B Plan. Des. 2011, 38, 659–677. [Google Scholar] [CrossRef]
  37. McGrail, M.R.; Humphreys, J.S. Measuring spatial accessibility to primary health care services: Utilising dynamic catchment sizes. Appl. Geogr. 2014, 54, 182–188. [Google Scholar] [CrossRef]
  38. Dony, C.C.; Delmelle, E.M.; Delmelle, E.C. Re-conceptualizing accessibility to parks in multi-modal cities: A Variable-width Floating Catchment Area (VFCA) method. Landsc. Urban Plan. 2015, 143, 90–99. [Google Scholar] [CrossRef]
  39. Ekkel, E.D.; de Vries, S. Nearby green space and human health: Evaluating accessibility metrics. Landsc. Urban Plan. 2017, 157, 214–220. [Google Scholar] [CrossRef]
  40. Wan, N.; Zou, B.; Sternberg, T. A three-step floating catchment area method for analyzing spatial access to health services. Int. J. Geogr. Inf. Sci. 2012, 26, 1073–1089. [Google Scholar] [CrossRef]
  41. Luo, J. Integrating the Huff Model and Floating Catchment Area Methods to Analyze Spatial Access to Healthcare Services. Trans. GIS 2014, 18, 436–448. [Google Scholar] [CrossRef]
  42. Tao, Z.; Yao, Z.; Kong, H.; Duan, F.; Li, G. Spatial accessibility to healthcare services in Shenzhen, China: Improving the multi-modal two-step floating catchment area method by estimating travel time via online map APIs. BMC Health Serv. Res. 2018, 18, 345. [Google Scholar] [CrossRef]
  43. Tao, Z.; Cheng, Y. Modelling the spatial accessibility of the elderly to healthcare services in Beijing, China. Environ. Plan. B Urban Anal. City Sci. 2019, 46, 1132–1147. [Google Scholar] [CrossRef]
  44. Tao, Z.; Zhou, J.; Lin, X.; Chao, H.; Li, G. Investigating the impacts of public transport on job accessibility in Shenzhen, China: A multi-modal approach. Land Use Policy 2020, 99, 105025. [Google Scholar] [CrossRef]
  45. Hu, S.; Song, W.; Li, C.; Lu, J. A multi-mode Gaussian-based two-step floating catchment area method for measuring accessibility of urban parks. Cities 2020, 105, 102815. [Google Scholar] [CrossRef]
  46. Xing, L.; Liu, Y.; Liu, X. Measuring spatial disparity in accessibility with a multi-mode method based on park green spaces classification in Wuhan, China. Appl. Geogr. 2018, 94, 251–261. [Google Scholar] [CrossRef]
  47. Rigolon, A. Parks and young people: An environmental justice study of park proximity, acreage, and quality in Denver, Colorado. Landsc. Urban Plan. 2017, 165, 73–83. [Google Scholar] [CrossRef]
  48. Lee, G.; Hong, I. Measuring spatial accessibility in the context of spatial disparity between demand and supply of urban park service. Landsc. Urban Plan. 2013, 119, 85–90. [Google Scholar] [CrossRef]
  49. Wei, F. Greener urbanization? Changing accessibility to parks in China. Landsc. Urban Plan. 2017, 157, 542–552. [Google Scholar] [CrossRef]
  50. Amap. Available online: https://ditu.amap.com/ (accessed on 17 March 2023).
  51. Meituan. Available online: https://www.meituan.com/ (accessed on 17 March 2023).
  52. Dianping. Available online: https://www.dianping.com/wuhan (accessed on 17 March 2023).
  53. Liyan, X.; Yin, H.; Fang, J. Evaluating the supply-demand relationship for urban green parks in Beijing from an ecosystem service flow perspective. Urban For. Urban Green. 2023, 85, 127974. [Google Scholar] [CrossRef]
  54. Tu, X.; Huang, G.; Wu, J.; Guo, X. How do travel distance and park size influence urban park visits? Urban For. Urban Green. 2020, 52, 126689. [Google Scholar] [CrossRef]
  55. Xu, M.; Xin, J.; Su, S.; Weng, M.; Cai, Z. Social inequalities of park accessibility in Shenzhen, China: The role of park quality, transport modes, and hierarchical socioeconomic characteristics. J. Transp. Geogr. 2017, 62, 38–50. [Google Scholar] [CrossRef]
  56. The Results of “the Fourth Travel Trial Survey in Wuhan” Are Available. Available online: http://www.wuhan.gov.cn/sy/whyw/202111/t20211104_1826693.shtml (accessed on 5 March 2023).
  57. Zhang, S.; Yu, P.; Chen, Y.; Jing, Y.; Zeng, F. Accessibility of Park Green Space in Wuhan, China: Implications for Spatial Equity in the Post-COVID-19 Era. Int. J. Environ. Res. Public Health 2022, 19, 5440. [Google Scholar] [CrossRef] [PubMed]
  58. WorldPop. Available online: https://www.worldpop.org/ (accessed on 7 March 2023).
  59. Wang, F.; Xu, Y. Estimating O-D travel time matrix by Google Maps API: Implementation, advantages, and implications. Ann. GIS 2011, 17, 199–209. [Google Scholar] [CrossRef]
  60. Tao, Z.; Cheng, Y.; Dai, T.; Rosenberg, M.W. Spatial optimization of residential care facility locations in Beijing, China: Maximum equity in accessibility. Int. J. Health Geogr. 2014, 13, 33. [Google Scholar] [CrossRef]
  61. Jin, T.; Cheng, L.; Wang, K.; Cao, J.; Huang, H.; Witlox, F. Examining equity in accessibility to multi-tier healthcare services across different income households using estimated travel time. Transp. Policy 2022, 121, 1–13. [Google Scholar] [CrossRef]
  62. Path Planning. Available online: https://lbs.amap.com/api/webservice/guide/api/direction (accessed on 1 May 2023).
  63. Chen, Y.; Li, Y.; Wu, G.; Zhang, F.; Zhu, K.; Xia, Z.; Chen, Y. Exploring Spatiotemporal Accessibility of Urban Fire Services Using Real-Time Travel Time. Int. J. Environ. Res. Public Health 2021, 18, 4200. [Google Scholar] [CrossRef]
  64. Xia, Z.; Li, H.; Chen, Y.; Yu, W. Integrating Spatial and Non-Spatial Dimensions to Measure Urban Fire Service Access. ISPRS Int. J. Geo-Inf. 2019, 8, 138. [Google Scholar] [CrossRef]
Figure 1. Flowchart of the comprehensive multimodal 2SFCA method.
Ijgi 12 00357 g001
Figure 2. The spatial distribution of (a) population density and (b) parks in the inner city of Wuhan, China.
Ijgi 12 00357 g002
Figure 3. Spatial distribution of (a) park accessibility and (b) hot spot analysis under the CM2SFCA method.
Ijgi 12 00357 g003
Figure 4. Spatial distribution of park accessibility under single models: (a) bicycling, (b) driving, and (c) public transit.
Ijgi 12 00357 g004
Figure 5. Spatial distribution of park accessibility using: (a) Huff model-based 2SFCA method, (b) V2SFCA method.
Ijgi 12 00357 g005
Figure 6. Spatial distribution of the association between park accessibility (Ai) and population density (Pi).
Ijgi 12 00357 g006
Table 1. Quantity, scale, and catchment area of parks in the inner city of Wuhan.
Size/haNumber (Proportion/%)Area/ha (Proportion/%)Catchment Area/km
1.0~5.026 (30.6)63.2 (2.0)0.5
5.0~10.014 (16.5)91.2 (2.8)1
10.0~20.015 (17.6)220.9 (6.9)2
20.0~50.018 (21.2)603.7 (18.7)3
≥50.012 (14.1)2240.6 (69.6)10
Table 2. Statistics of park accessibility under multimodal and single-mode scenarios.
Transportation ModeQ1Q2Q3MeanStandard DeviationUnderserved Population
Multimodal7.9816.7635.5636.1763.745553 (0.9%)
Single-modalBicycling5.6514.6938.1932.2357.60137,188 (2.2%)
Driving10.7918.4833.9136.1342.2819,671 (0.3%)
Public transit07.2425.9238.14166.60950,379 (15.5%)
Note: Q1, Q2 and Q3 are the lower quartile, the median, and the upper quartile.
Table 3. Statistics of park accessibility under Huff model-based 2SFCA and V2SFCA methods.
MethodQ1Q2Q3MeanStandard DeviationUnderserved Population
Huff model-based 2SFCA14.6920.8431.3429.4328.042572 (0.04%)
V2SFCA6.7016.3931.9832.3557.785523 (0.09%)
Note: Q1, Q2, and Q3 are the lower quartile, the median, and the upper quartile.
Table 4. Statistics of the association between park accessibility (Ai) and the population (Pi).
High Ai-High PiHigh Ai-Low PiLow Ai-High PiLow Ai-Low PiNot Significant
Population
(Proportion)
97,813 (1.6%)106,187 (1.7%)2,890,060 (47.2%)233,909 (3.8%)2,793,872 (45.6%)
Average Accessibility67.44102.5014.2013.2135.09
Disclaimer/Publisher’s Note: The statements, opinions and data contained in all publications are solely those of the individual author(s) and contributor(s) and not of MDPI and/or the editor(s). MDPI and/or the editor(s) disclaim responsibility for any injury to people or property resulting from any ideas, methods, instructions or products referred to in the content.

