1. Introduction
Urban sustainable development is affected by multiple factors, such as rising populations, climatic change, spatial planning, and the geographic distribution of building coverage [
1,
2]. Noise is an issue that runs through all the sustainable development goals [
3]. Improvement of sound quality is beneficial to achieve the sustainable development goals, such as health and well-being, as well as quality education. Considering noise more in urban construction can reduce the economic losses caused by insufficient resources and reconstruction. A good sound environment is crucial to build a more sustainable city. Noise also reflects social inequality to a certain extent. Vulnerable groups are more susceptible to noise. Noise pollution has attracted widespread concern from all over the world and from all walks of life and has recently been the subject of much discussion and research among scholars. With the acceleration of urbanization and motorization, the environmental pressure brought by urban noise pollution is rising. Noise pollution has a remarkable negative impact on human health, such as hearing loss [
4], mental health [
5,
6], sleep disorder [
7], cardiovascular diseases [
8], hypertension [
9], and obesity [
10]. In addition, noise can also adversely affect the reproduction and distribution of animals [
11]. Therefore, it is essential to assess and analyse urban noise to support noise management.
Nowadays, various sensors are installed and deployed in cities to monitor diverse information inside the city, which has gradually become one of the trends in the development of smart cities. The Array of Things (AoT, see
https://arrayofthings.github.io/ (accessed on 11 January 2022)) project is a smart city measurement project designed to build city-scale sensor networks for understanding cities and urban life [
12,
13]. The AoT project deployed nodes with multiple sensors and cameras in the city of Chicago to collect near-real-time, location-based data on urban environments, infrastructure, and activities. The data measured by these nodes include light, temperature, vibration, sulfur dioxide, ozone, and sound intensity. About 130 nodes had been installed across Chicago by the end of January 2020. The dataset provided by the AoT has been widely used in various studies. The literature [
14] studied the heat environment of Chicago based on CyberGIS-jupyter and temperature data provided by the AoT, and the study demonstrated the ability of CyberGIS-jupyter and AoT sensing data to support urban analysis. The literature [
15] developed a framework by integrating CyberGIS and machine learning, which was utilized to make fine-grained spatiotemporal predictions of urban heat island in Chicago and achieved better results. The authors used AoT sensing data in the prediction process. The literature [
16] combined AoT sensor data with family data of 450 elderly residents in Chicago to explore the health effects of air pollution using GIS and spatial modeling. All of the above studies have shown that the data have some research value. However, the results of our literature search indicate that there are few studies on the sound data provided by the AoT at present.
Noise monitoring and sound data mining are crucial prerequisites for urban noise management. Our study focuses on the analysis of urban sound spatiotemporal trends and the mining of sound influencing factors. Since the influence of natural and anthropogenic factors on the urban sound environment is a complex process, the acquisition of urban sound data is not an easy task. Therefore, there are three key challenges in the study of sound data. The first is the acquisition of sound data; the second is the delineation of discrete sound nodes over the study area; and the last is the selection of methods for analyzing urban sound influences. In this study, we propose to use the sound data provided by the AoT, divide the discrete sound nodes over the spatial region using Thiessen polygon, and utilize GeoDetector for the mining of sound influencing factors.
Taking Chicago as the study area, this study generated the noise maps of Chicago in the morning and evening peak on both weekdays and weekends based on the Thiessen polygon and the geographic information system. Using the statistical method of spatial correlation analysis and GeoDetector, we studied the spatiotemporal distribution characteristics of Chicago’s sound. In addition, we discussed the impacts of seven factors and the interaction between these factors on the spatial variation of Chicago’s sound. The factors include the population density, park area, density of the road network, density of the sidewalk, density of bike routes, number of hospitals, and number of fire stations. This study expects to support urban planning and policy-making and have positive significance for the sustainable development of Chicago by providing reference value to some extent. This paper is divided into seven aspects as follows. Following the description of the introduction in
Section 1 and the relevant research on the topic of sound in
Section 2,
Section 3 describes the research area and the data source.
Section 4 presents the experiment methods, including Thiessen polygon and GeoDetector.
Section 5 illustrates the noise maps and explains the experimental results.
Section 6 discusses the experimental results combining a correlation analysis and GeoDetector.
Section 7 concludes this study.
2. Related Work
Experts and scholars have studied the topic of the urban sound environment with various acquisition and analysis methods of sound data. The literature [
17] designed an environmental health monitoring program that users can use to measure their noise exposure continuously and mark the sound. The literature [
18] created a noise map of New York City based on complaints data, social media, road networks, and Point of Interest (POIs), mainly illustrating location ranks according to the value of noise indicators and displaying noise distribution of different noise categories. These studies focus on the composition or distribution of noise and methods to obtain better noise data. These studies focus on fine-grained data, such as how each noise may be associated with location, timestamp, and fine-grained noise categories, such as noisy music or construction noise. However, it is difficult and costly to obtain fine-grained data. The sound data provided by AoT are time series data, with an acquisition interval of the 20 s. Compared with the fine-grained data, the AoT dataset is freely accessible and has smaller temporal granularity.
Leisure activities associated with various high-power sound systems, celebrations, and transportation are partial sources of urban noise [
19]. Road traffic noise is the most important source of environmental noise [
20], but the green belt along roads effectively mitigates traffic-induced noise pollution [
21,
22]. As the vegetation density on both sides of the road changes from sparse to moderate, traffic noise can be significantly reduced [
23]. In addition, building density and land use type also affect urban noise levels [
24,
25]. The literature [
26] analyzed the impact of human activities on noise complaint behavior by combining the spatial distribution characteristics of POIs and found that there is a certain correlation between noise complaints and the distribution and types of POIs. The POIs they selected included 14 types of data, such as scenic spots, public facilities, transportation facilities, and medical care. The literature [
27] realized the assessment of people exposed to traffic noise in the main urban area of Guangzhou based on POIs and noise maps, and the study found that areas with higher population density are affected by traffic noise more, and usually areas with POI types of residential, catering services, shopping services, and living services are densely populated. The literature [
25] explored the relationship between urban noise and socio-economic factors, such as population and nighttime light intensity; explored the impact of landscape structure on urban noise; and studied the impact of different urban forms on urban noise based on urban functional areas. Their study found that urban vegetation can reduce urban environmental noise, and road density aggravates urban environmental pollution. From this, it is easy to find that the factors often used by researchers in urban noise analysis include population, vegetation, traffic, and buildings, and when considering traffic, more consideration is given to the road network for motor vehicles, and sidewalks and bicycle paths are seldom considered separately. In addition, researchers’ selection of factors is coarse-grained. Coarse-grained factors often cause us to overlook certain implications of finer-grained factors. Therefore, in our study, seven factors—population, parks, road network, sidewalks, bike lanes, fire stations, and hospitals—were selected to explore the impact of these factors on Chicago’s sound. The selection of fine-grained factors is novel to the current study.
Geographic Information Systems (GIS) are often used in urban noise analysis, especially in the drawing of urban noise maps. Past studies have demonstrated the effectiveness and importance of using GIS in noise analysis [
28,
29]. The noise map can intuitively reflect the distribution of noise, which is conducive to noise assessment. The literature [
30] drew a dynamic traffic noise map using noise monitoring data and traffic speed data. The literature [
31] drew a 24-h noise map of Chancheng District in Foshan, China. The study [
29] used GIS and GPS to map daytime and nighttime traffic noise in Guangzhou, China. The literature [
32] created a noise map of Şanliurfa using GIS. We can find that noise maps have become one of the effective methods for reflecting noise levels. These studies provide us with ideas for noise mapping. When studying a phenomenon, the driving factors are usually explored. A commonly used driver analysis method is geographically weighted regression (GWR) [
33]. The GWR has been widely used in various studies, such as the spatial distribution of Tibetan Buddhist Monasteries [
34], the spatial–temporal distribution of PM
2.5 [
35], and the spatial–temporal analysis of rock concerts [
36]. However, as with other regression analysis techniques, the GWR method suffers from the problem of multicollinearity, and the results of the analysis can be easily influenced by it. Currently, GeoDetector has been widely used as a powerful tool for driver and factor analysis in a variety of fields: agriculture [
37], plants [
38,
39], geology [
40], pollution [
41,
42], tourism [
43], health [
44], etc. GeoDetector is a statistical method that detects the spatial heterogeneity of geographic phenomena to reveal the driving forces behind it [
45,
46]. Its core idea is that if an independent variable has an important influence on a dependent variable, the spatial distribution of the independent variable and the dependent variable should be similar. Compared with other methods of driving factor analysis, GeoDetector is more suitable for processing geographical data [
47].
3. Research Area and Data
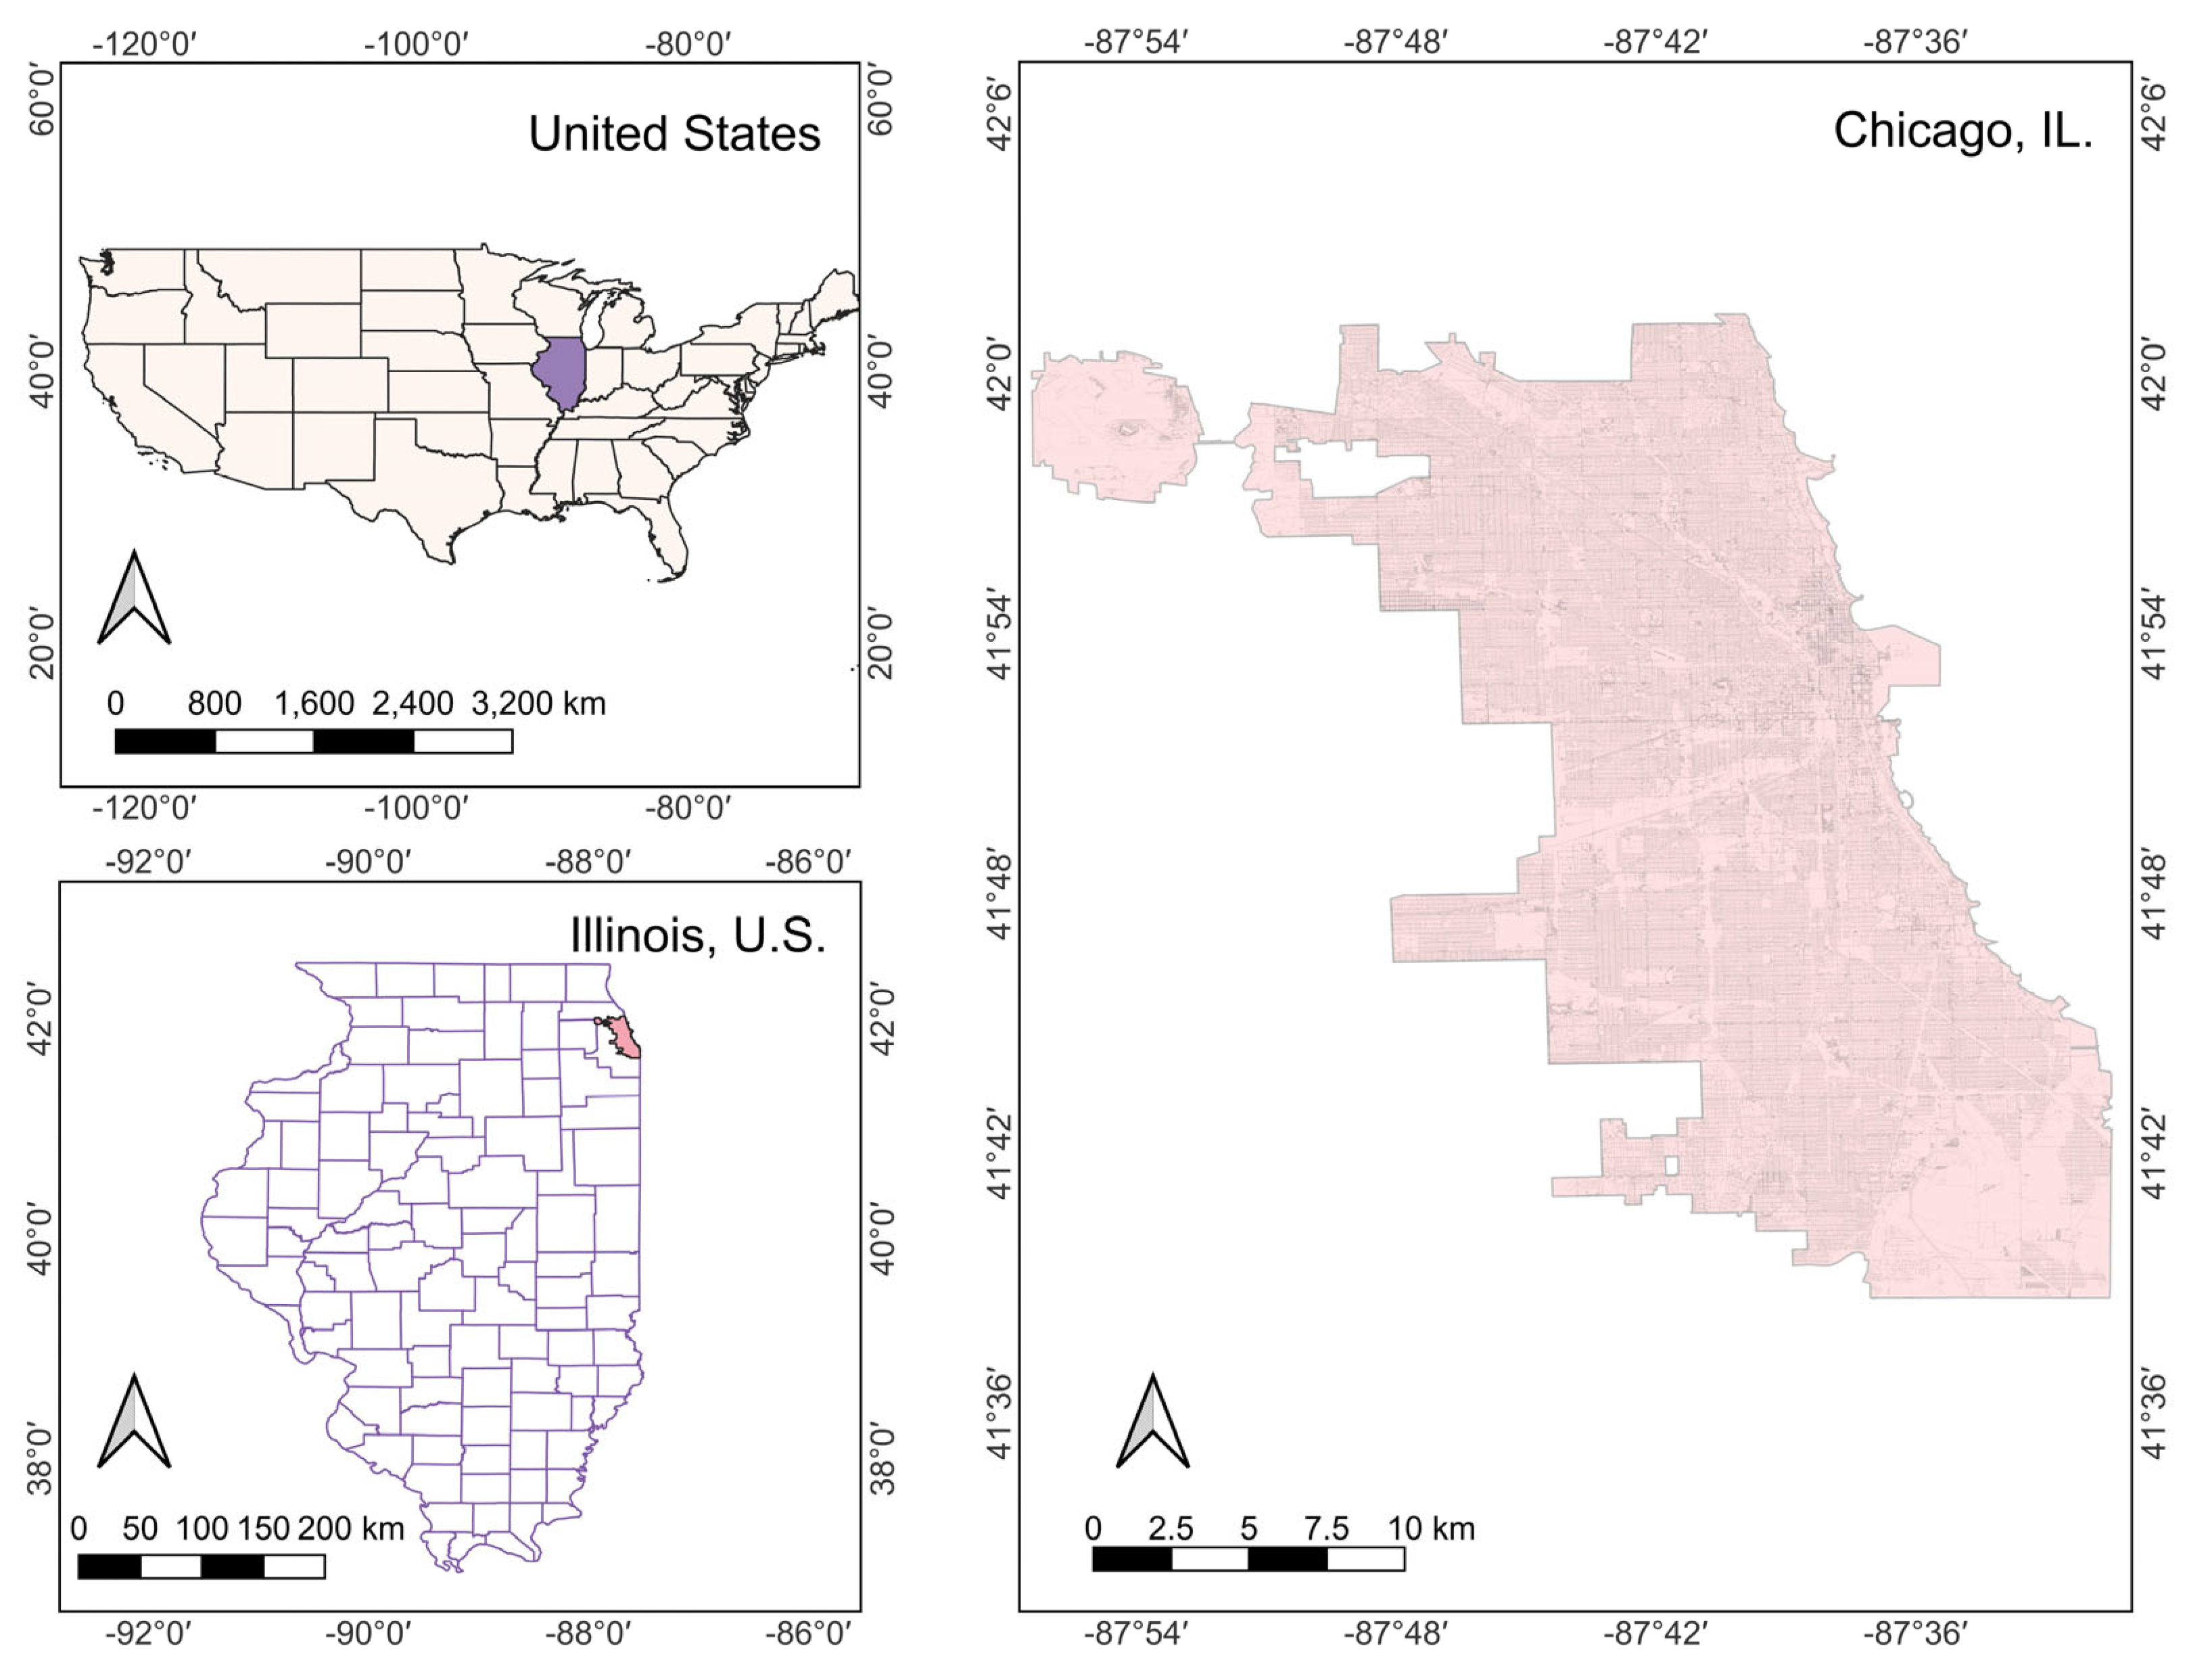
In our study, we choose Chicago as the research area, as shown in
Figure 1. Chicago is the third largest economy in the US and one of the world’s international financial centres, which is at the crossroads of North American rail, road, and air transport infrastructure, accounting for about 28,000 km
2 with the population more than 10 million in the region [
14]. Additionally, the existing studies have revealed that Chicago’s environmental noise level is high enough to be problematic [
48].
The data provided by AoT includes 4 datasets (
Table 1), namely data dataset, node dataset, sensor dataset, and provenance dataset. Each dataset is a csv file. This study mainly uses data dataset and node dataset in AoT. The data dataset describes the measured values of the object at each time point during a certain period, see
Table 2 for details. The node dataset mainly comprises node descriptions, see
Table 3 for details. The sound data in our study comes from AoT data in Chicago from 30 September 2019 to 6 October 2019. There are 126 nodes in these data, including 36 sound nodes. Among the 36 sound nodes, one node is working abnormally, and the monitored sound level is NA. The spatial distribution of these nodes in Chicago is shown in
Figure 2. Sound nodes that work normally are orange, black nodes represent abnormal sound nodes, and blue nodes are all nodes except sound nodes distributed in Chicago. In addition, the sound data contained in these data can be obtained by specifying the sensor. The sensor for acquiring sound data is spv1840lr5h_ b.
The influencing factors we selected in this study have seven factors, including population density (PD), park area (PA), density of road network (DRN), density of sidewalk (DS), density of bike route (DBR), number of hospitals (NH), and number of fire stations (NFS). See
Table 4 for details.
6. Discussion
Geographic objects form various spatial distribution patterns according to their attributes or human activities. Moran’s
I is widely used to quantify the level of spatial autocorrelation between adjacent locations, and the positive or negative value of Moran’s
I indicates that observations at locations that are spatially close tend to have identical or different values [
59]. In this study, we attempted to perform spatial data analysis to explore spatial patterns of the noise level in Chicago. First, Moran’s
I at global and local scales was simulated based on observations (35 for weekday morning peak, 33 for weekday evening peak, 31 for morning and evening peaks on weekends).
Figure 9 reveals a global Moran scatter plot of Chicago’s noise for different time groups, and the sound level is used to represent the noise level. The Moran statistic for the morning peak on weekdays is 0.106, and the
p-value is less than 0.05; that for the evening peak on weekdays is 0.068, and the
p-value is less than 0.05, indicating that the spatial autocorrelation of Chicago’s noise is statistical for two time groups (See
Figure 9).
Figure 10 displays a local Moran index cluster plot of Chicago’s noise. High–high or low–low suggests that areas with high (low) noise are adjacent to other regions with high (low) noise. Whereas high–low or low–high states that areas with high (low) noise are adjacent to areas with low (high) noise. We may observe that the four southern areas of Chicago have a high–high sound gathering mode, and the remaining areas are mostly randomly distributed during the morning peak on weekdays. The difference from the morning peak on weekdays is that the two eastern regions of Chicago present a low–low sound gathering mode. Chicago sounds have different aggregation patterns in different time periods, which may be related to the different behavioral activities of people in these periods.
Correlations can be explored using multi-source data and spatial analysis methods [
60]. Taking the morning peak on weekdays as an example, we examined the impact of PD, PA, DRN, DS, DBR, NH, and NFS on the sound environment through the bivariate Moran’s
I. We discovered that noise level in an area during the weekdays’ morning peak was negatively correlated with the area’s PD, PA, and DBR, and the correlation coefficients were 0.15 (
p < 0.01), 0.18 (
p < 0.01), and 0.10 (
p < 0.1), respectively (
Table 6). According to the analysis, we can know that: (1) the larger the population, the lower the noise. This may be connected to the location of people’s activities, such as office buildings and residential buildings, and even if the population is large, there will be no excessive noise in general. (2) Areas with large park boundaries may have lower noise levels, and as parks continue to expand, noise levels decrease. This could be the case since the natural landscape features of the park, such as vegetation and water bodies, might affect the sound environment, and these impacts will increase along with the rising land area. This finding is identical to existing results [
61]. (3) With the increase of bike routes, the noise will be reduced. Cyclists are more likely to be exposed to noise in the short term, but with the increase in bike routes and the substitution of bicycles for cars and motorcycles, noise pollution will gradually decrease, and the noise pollution suffered by cyclists will also decrease [
62]. Furthermore, we also found that there are no statistically significant correlations between the DS, DRN, NH, and NFS and the noise level, which may be because the impact of these factors on noise is an interactive and complex process.
In addition to spatial autocorrelation, spatial heterogeneity is another essential feature of sound distribution. We define spatial heterogeneity as the difference in sound magnitude between diverse regions of Chicago. The results of the factor detector are sorted by q value as follows: PA (0.2617) > PD (0.1975) > DS (0.1581) > DRN (0.1558) > DBR (0.1402) > NFS (0.0970) > NH (0.0722). Of the seven factors, NH and NFS have a small effect on sound levels, PA has the largest effect, and PD is a close second, indicating that PA and PD are the most important drivers of sound levels in Chicago. Due to the reduction effect of vegetation and lakes on sound in the park, the sound decreases with the increase in the park area. This further illustrates that the most central way to improve the future sound environment in Chicago is to increase vegetation cover and lake area. In addition, population distribution has an important effect on the spatial differentiation of sound levels. DS, DRN, and DBR also have a large effect on sound levels, suggesting that an important aspect of improving Chicago’s sound environment is proper planning of the road network. The influence of NFS and NH on Chicago sounds are relatively small, which may be because hospitals have the need to keep quiet while fire stations produce a single sound.
The results of the interaction detector are shown below (
Table 7). The interaction of the seven factors is enhanced, including bi-factor enhancement and nonlinear enhancement, and there are no factors that work independently of each other, which shows that the spatial differentiation pattern of the Chicago sounds is not controlled by a single factor but is the result of the joint action of multiple factors. The interaction between PD and PA (0.7353) as well as PA and DBR (0.6399) are significant in the interaction between the two factors, indicating that the population distribution should be intervened while the expansion of Chicago parks and investment in bike routes should be increased to jointly improve the noise distribution in Chicago. The interaction between NH and DRN (0.1740) as well as NH and NFS (0.1390) are small in the interaction between the two factors.
7. Conclusions and Future Work
In this study, we analysed the sound environment in Chicago using sound data provided by the AoT. We examined the trend of the sound changes of each node in a week by drawing a line chart. The isolated sound nodes were divided into diverse regions using a Thiessen polygon, and the noise maps of various regions at different time periods were drawn using the geographic information system. The spatial distribution characteristics of sounds in Chicago and the influence of factors in space on the spatial distribution of sounds were explored by means of spatial correlation analysis and GeoDetector. Since the GeoDetector used in this study can detect the real interaction between two factors, it is not limited to the multiplicative relationship, and the principle of GeoDetector ensures that it is immune to multi-independent variable collinearity, it achieves a more effective and comprehensive analysis. Taking the morning peak on weekdays as an example, we found that (1) there is a statistically significant positive correlation between noise in Chicago during this time. (2) Population density, park area, and density of bike routes were significantly negatively correlated with sound level. (3) Park area and population density are the two most crucial controlling factors for the spatial differentiation of sounds in Chicago. (4) There is an interaction enhancement effect between each factor, and the enhancement effects are more obvious between population density and park area as well as park area and density of bike routes. The results show that a good analysis result can also be achieved using AoT data. This study can provide a reference for Chicago’s policy making and help Chicago to develop healthily and efficiently.
This study contributes to the study of urban sound. First, our study may be the first application of GeoDetector for Chicago’s sound analysis. Compared to the previous literature that focused on the measurement of spatial autocorrelation, this study also focuses on the effects of urban factors on the spatial differentiation of sound. Second, this study enriches the research on noise pollution in Chicago, aids in better understanding the distribution of sounds in Chicago, provides suggestions for urban residents’ travel, and offers the framework for the government to formulate relevant policies. Finally, we have used a Thiessen polygon to divide isolated sound nodes into different regions for research. This method is suitable for the study of any isolated points, such as sensors.
However, this study still has some limitations. The sound data only comes from 35 nodes, and the location of the sound nodes is not dense enough for the whole city. In addition, whether an individual identifies a sound as noise depends heavily on their specific activity and associated environment. Analysing the sound data collected by an urban sensor network can only explain a small number of troubles and distractions that people experience in their daily lives.
In the future, we will consider more aspects. First, we will consider historical data and use more data for analysis to support travel and government related decisions. Second, we will further adjust the weighted Thiessen polygon to empirically prove whether there will be a difference.


