Abstract
Large Language Models (LLMs) such as GPT, BART, and Gemini stand at the forefront of Generative Artificial Intelligence, showcasing remarkable prowess in natural language comprehension and task execution. This paper proposes a novel framework developed on the foundation of Llama 2, aiming to bridge the gap between natural language queries and executable code for geospatial analyses within the PyQGIS environment. It empowers non-expert users to leverage GIS technology without requiring deep knowledge of geospatial programming or tools. Through cutting-edge Natural Language Processing (NLP) techniques, including tailored entity recognition and ontology mapping, the framework accurately interprets user intents and translates them into specific GIS operations. Integration of geospatial ontologies enriches semantic comprehension, ensuring precise alignment between user descriptions, geospatial datasets, and geospatial analysis tasks. A code generation module empowered by Llama 2 converts these interpretations into PyQGIS scripts, enabling the execution of geospatial analysis and results visualization. Rigorous testing across a spectrum of geospatial analysis tasks, with incremental complexity, evaluates the framework and the performance of such a system, with LLM at its core. The proposed system demonstrates proficiency in handling various geometries, spatial relationships, and attribute queries, enabling accurate and efficient analysis of spatial datasets. Moreover, it offers robust error-handling mechanisms and supports tasks related to map styling, visualization, and data manipulation. However, it has some limitations, such as occasional struggles with ambiguous attribute names and aliases, which leads to potential inaccuracies in the filtering and retrieval of features. Despite these limitations, the system presents a promising solution for applications integrating LLMs into GIS and offers a flexible and user-friendly approach to geospatial analysis.
1. Introduction
Artificial Intelligence (AI) chatbots have significantly enhanced the way humans interact with technology. These innovative tools, such as ChatGPT, Bing chat, and Google Bard, have been specifically designed and developed to provide a user-friendly interface for communication. This emergent technology has become increasingly popular and widely available for public use. It utilizes advanced Natural Language Processing (NLP) algorithms and machine learning techniques to simulate human conversation, providing users with a seamless and efficient experience. Through their ability to understand and respond to natural language inputs, these chatbots have revolutionized the way individuals from a diverse range of backgrounds interact with technology, thus making it easier and more efficient to obtain information and complete specialized tasks.
Large Language Models (LLMs) play a crucial role in this digital transformation. They are potent machine-learning models designed to comprehend and generate natural language by leveraging massive amounts of text and code data, enabling them to learn patterns and relationships inherent in language. This makes them capable of generating text that is often indistinguishable from that written by humans. Their versatility allows them to perform tasks such as language translation, sentiment analysis, and creative text generation [1]. They also exhibit proficiency in sentiment analysis, distinguishing between positive and negative tones in customer reviews. Moreover, LLMs excel to a large extent in performing other NLP tasks requiring creativity, such as generating code, poems, and musical compositions [2], as well as generating or editing images based on users’ will [3], demonstrating their broad applicability. Delving into the future implications of LLMs unveils their potential impact on job markets, communication dynamics, and societal paradigms, prompting a thoughtful consideration of the evolving landscape shaped by these powerful language models. Our initiative involves leveraging LLMs as the core reasoning component to introduce ChatGeoAI as an AI-empowered geographic information system (GIS).
Geospatial analysis is a key factor in making well-informed decisions in various fields and different applications. It heavily relies on the careful collection, examination, and representation of geographic data, while GIS has long been instrumental in this realm. However, the technical intricacies of GIS platforms often pose challenges, limiting access to those without a technical background who could otherwise benefit from geospatial intelligence. Wang et al. [4] highlighted that the conventional interfaces of GIS can be daunting for non-experts, restricting their ability to leverage geospatial analysis for decision-making.
The challenges surrounding the usability and accessibility of GIS are multifaceted, encompassing complexity, technical skill requirements, cost, and integration issues. These barriers impede the broad adoption and effective use of GIS technology, particularly among non-expert users [5]. To address these challenges and democratize GIS technologies, integrating Generative AI and LLMs with geospatial analysis tools could be a significant transformative step, making geospatial analysis available to all.
Our innovative approach aims to bridge the gap between complex geospatial analysis and users with limited or no GIS expertise. The core idea is to use natural language processing to interpret user requests and Generative AI to automatically generate executable codes for geospatial analysis, which can be run automatically to perform analyses and create resulting maps. By enhancing accessibility and usability, this approach offers several benefits for non-expert users, e.g.,:
- Intuitive interaction: Users can engage with GIS tools using natural language requests to perform complex geospatial analyses.
- Wider adoption: The accessibility of this integration encourages the adoption of GIS across diverse fields and industries-
- Efficiency: Automating the translation of user requests into executable codes reduces the time and resources needed for complex geospatial analyses.
- Informed decision-making: public users can make better decisions in areas such as urban planning, environmental conservation, emergency response, and even daily activities such as booking hotels based on spatial criteria.
- Interdisciplinary collaboration: Enabling various disciplines to incorporate geospatial analysis into their research promotes collaboration and innovation.
The central challenge for implementing this idea lies in refining the decision-making core of LLMs to accurately respond to user queries and adapt to domain-specific requirements (geospatial analysis, in this case), ensuring reliable and precise results. In other words, the LLMs must acquire geospatial analysis knowledge. Additionally, geospatial tasks involve multiple operations that must be executed in a specific order. This implies that the LLMs should be provided with the reasoning capacity to be able to generate operations and execute them in the right order to perform a required geospatial analysis, correctly.
In this paper, we propose a methodology for applying state-of-the-art LLMs to reason geospatial analysis. Our specific aim is to design and evaluate a system architecture and methodology for an AI-empowered GIS called ChatGeoAI. This system leverages LLMs, which are fine-tuned on GIS tasks and contextualized through the integration of domain-specific ontologies, to understand natural language queries, generate executable code, and perform geospatial analysis to support the decision-making of users with no or limited GIS skills. To achieve this aim, the following research questions should be answered:
- How can natural language processing be used efficiently to interpret and convert geospatial queries into executable GIS code?
- What role do large language models play in enhancing the accessibility and usability of GIS for non-expert users, and what level of accuracy can they achieve in solving GIS tasks?
- How can the fine-tuning of LLM and incorporation of geospatial entity recognition improve the accuracy and contextual relevance of responses generated by geospatial AI systems?
The remainder of this paper is organized as follows. The second section delves into the background of LLMs, exploring their applications, capabilities, and inherent limitations. Particular focus is paid to a literature review on LLM applications in geospatial analysis, highlighting both their potential and current challenges. This section will be concluded by situating this paper in the context and clarifying its contribution to knowledge. Following this, the third and the fourth sections describe, respectively, the architecture of the proposed system and its development steps, providing a detailed overview of its design and functionality. Afterward, the subsequent two sections present the results gleaned from the system’s performance analysis and in-depth discussions about its efficacy and limitations. Finally, this paper concludes by summarizing key insights, implications, and avenues for future research and development in developing such systems.
2. Materials and Methods
2.1. NLP Techniques for Geospatial Analysis
NLP techniques in geospatial analysis offer a systematic and interpretable way to extract and understand geographical information from text. Rule-based approaches, which rely on predefined linguistic rules and patterns, are commonly used to extract geospatial information from natural language. These rules, designed by domain experts, identify specific syntactic or semantic patterns that point to geospatial references or queries. While effective for straight forward, well-defined queries, these methods struggle with complex or ambiguous cases and require ongoing manual rule creation and maintenance. On the other hand, statistical models extract geospatial information by analyzing large text datasets and learning relationships between words, phrases, and geospatial entities. Commonly used techniques include Named Entity Recognition (NER) and Part-of-Speech (POS) tagging. Trained on annotated datasets, these models can identify and extract geospatial entities, such as locations, addresses, and coordinates, based on observed statistical patterns.
Machine learning has significantly enhanced spatial analysis by providing more sophisticated techniques for extracting, interpreting, and analyzing geographical information from text. For example, Syed et al. [6] developed a platform for extraction and geo-referencing spatial information from textual documents. Hu et al. [7] explored the concept of geo-text data, which encompasses texts that are linked to geographic locations either explicitly through geotags or implicitly through place mentions. Their work systematically reviewed numerous studies that have utilized geo-text data for data-driven research. Yin et al. [8] developed an NLP-based question-answering framework that facilitates spatio-temporal analysis and visualization, although it considers only a limited number of operations using keyword-operation mapping.
NER models, such as Conditional Random Fields (CRFs) and deep learning-based approaches, are often used for identifying and classifying place-names [9]. Geocoding algorithms, which leverage machine learning, convert textual descriptions into geographical coordinates and can achieve high accuracy [10]. Spatial entity linking and toponym resolution models use contextual analysis and disambiguation techniques to associate place names with specific locations in geographical databases [11]. Geospatial topic modeling applies NLP to detect and analyze the semantic, spatial, and temporal dynamics of geo-topics within geospatially-tagged documents [12]. Sentiment analysis models classify and map sentiments expressed in text, offering insights into geographical trends. Spatial language understanding techniques extract and interpret spatial relationships described in the text, while spatial data fusion models integrate data from various sources for comprehensive analysis [13].
A recent paper conducted an extensive evaluation of 27 widely used methods for geoparsing and location reference recognition, including rule-based, gazetteer matching–based statistical learning, and hybrid approaches [14]. This study concludes that deep learning is currently the most promising technique for location reference recognition. Furthermore, integrating multiple approaches through a voting mechanism enhances robustness and mitigates the limitations of individual methods. Performance varies depending on the type of text and location references, with notable differences in computational efficiency. Overall, machine learning algorithms outperform rule-based techniques, offering greater accuracy, efficiency, and depth in geospatial analysis across these diverse tasks.
Existing approaches in connecting NLP techniques with geospatial analysis have yet several limitations and challenges that hinder their effectiveness and scalability that can be summarized as:
- Low level of semantic understanding: A major limitation is the inadequate semantic understanding of current approaches. Geospatial NLP systems struggle with nuanced queries and ambiguous language, which may lead to incorrect or incomplete results.
- Inefficiency in query processing: Efficiently processing natural language queries over geospatial data is crucial. Traditional query methods are not well-suited for complex natural language queries. Query optimization, including rewriting and execution planning, is vital to ensure efficient retrieval of geospatial information. Innovative techniques for processing natural language queries and optimizing query execution are needed to improve system performance and responsiveness.
- Struggling with data integration and handling heterogeneity: Geospatial data often come from diverse sources with varying formats, schemas, and spatial reference systems. Integrating and harmonizing these heterogeneous data sources with natural language interfaces is challenging. Techniques such as semantic mapping, data fusion, and data interoperability are necessary to address these challenges and enable seamless integration and retrieval of geospatial information.
- Limited training data and domain-specific knowledge: Training effective NLP models for geospatial applications requires substantial labeled training data, which is costly and time-consuming to acquire. Additionally, geospatial domains have specific terminologies and concepts not well-represented in general-purpose language models. Building domain-specific knowledge bases and leveraging transfer learning techniques can help overcome these challenges and improve the performance of geospatial NLP systems.
In addition to these limitations, many existing methods encounter scalability issues when handling large volumes of geospatial data. Usually, the datasets involved are vast and complex, making natural language query processing computationally intensive. Scaling systems to manage high data volumes and real-time queries remains a significant challenge. Therefore, developing efficient retrieval mechanisms is crucial for optimizing both performance and scalability.
In the case of solving GIS tasks through code generation, NLP is often applied only to structured queries. one example is the extraction of data from complex datasets (i.e., transportation database) where semantic role classification (a specific NLP technique) is used to convert queries stated in natural human language into formal database queries [15].
LLMs can significantly enhance the integration of natural language processing with geospatial analysis thanks to their extensive training on diverse text corpora. These models excel in semantic understanding, which enables them to interpret complex queries with nuanced meanings more accurately. This capacity helps reduce semantic errors and ambiguities, making them highly effective at grasping contextual nuances in geospatial queries.
In terms of processing efficiency and data integration, LLMs excel in converting natural language into actionable analysis queries or codes by understanding user intent and extracting relevant entities and conditions from complex sentences. Their advanced capabilities also make it easier to integrate heterogeneous data sources, leveraging semantic mapping and data fusion techniques to handle diverse schemas and formats seamlessly. This flexibility is crucial for harmonizing and integrating various geospatial datasets. LLMs also show promising in optimizing query execution by generating intermediate codes and representations that align closely with underlying data and software, streamlining query execution plans.
LLMs further address challenges related to the scalability of geospatial data processing and the need for extensive domain-specific training data. By utilizing techniques such as transfer learning and knowledge augmentation, LLMs can be fine-tuned with relatively small datasets to improve their domain-specific performance. Furthermore, their deployment in distributed computing environments enables large-scale data processing, essential for managing large volumes of geospatial data and real-time query processing.
2.2. Large Language Models
Pre-trained Language Models (PLMs) such as ELMo and BERT [16] have revolutionized natural language processing by capturing context-aware word representations through pre-training on large-scale, unlabeled corpora. ELMo introduced bidirectional LSTM networks for initial pre-training, later fine-tuned for specific tasks, while BERT employed Transformer architecture with self-attention mechanisms for similar purposes. These models established the “pre-training and fine-tuning” paradigm, which inspired subsequent PLMs such as GPT-2 [17] and BART [18] to refine pre-training strategies and excel in fine-tuning for specific downstream tasks.
Scaling PLMs, by increasing the model size or expanding the training data, has often enhanced their performance on downstream tasks, as supported by the scaling law [19]. Notable examples of progressively larger PLMs include GPT-3 (with 175 billion parameters) and PaLM (with 540 billion parameters), both of which have demonstrated emergent capabilities [20]. Although these LLMs maintain similar architectures and pre-training tasks to smaller models such as BERT (330 million parameters) and GPT-2 (1.5 billion parameters), their large scale leads to distinct behaviors. For instance, LLMs, such as GPT-3, showcase emergent abilities in handling complex tasks, as shown by the adeptness of GPT-3 in few-shot learning through in-context adaptation [20].
The typical architecture of LLMs consists of a layered neural network that integrates embedding, recurrent, feedforward, and attention layers [21]. The embedding layer converts each word in the input text into a high-dimensional vector, capturing both semantic and syntactic information to facilitate contextual understanding. Subsequently, the feedforward layers apply nonlinear transformations to the input embeddings, enabling the model to learn higher-level abstractions. Recurrent layers process the input text sequentially, maintaining a dynamic hidden state that captures dependencies between words in sentences [21]. The attention mechanism enhances the model’s focus on different parts of the input text, allowing it to attend to relevant portions for more precise predictions selectively. In summary, the architecture of LLMs is meticulously designed to process input text, extract its meaning, decipher word relationships, and ultimately generate precise predictions [22].
A key advantage of LLMs is their capacity as few-shot learners, meaning they can grasp new tasks or understand novel information with only a minimal number of examples or “shots”. Dissimilar to traditional models that require large datasets for effective learning, few-shot learners excel at generalizing from limited data, making them highly efficient and adaptable in scenarios with constrained data [20]. This was notably demonstrated in an experiment by Zhou et al. [23], who could outperform GPT-3 DaVinci003 by fine-tuning a LLaMA 1 model (having only 65 billion parameters) on just 1000 high-quality samples.
2.3. Applications of LLMs and Their Limitations
In practical implementations, LLMs and their associated products have been used in various applications. For example, ChatGPT has been used in robotics, focusing on prompt engineering and dialog strategies for different tasks ranging from basic logical and mathematical reasoning to complex tasks such as aerial navigation [24]. Liang et al. [25] presented the vision, key components, feasibility, and challenges of building an AI ecosystem that connects foundation models with millions of APIs for task completion. The idea suggests using existing foundation models as the core of the system and APIs of other AI models and systems as sub-task solvers to be able to solve specialized tasks in both digital and physical domains. Li et al. [26] used ChatGPT to develop a generic interactive programming framework that aims to increase efficiency by automatic modeling, coding, debugging, and scaling in the energy sector. They argued that for complex tasks where engineers have no prior knowledge or totally new problems without readily available solutions, ChatGPT can reduce the learning cost by recommending appropriate algorithms and potential technology roadmap while auto-coding each step.
In the pursuit of building autonomous agents harnessing the power of LLMs, Richards (2023) [27] introduced Auto-GPT. This agent-based application is equipped to independently initiate prompts and autonomously execute tasks using a blend of automated Chain of Thought prompting and reflective processes. This application possesses the capability to generate its own code and run scripts, enabling recursive debugging and development. In the same vein, Nakajima [28] developed BabyAGI, which is an AI-empowered task management system leveraging OpenAI and embedding-based databases such as Chroma or Weaviate to streamline task creation, prioritization, and execution. BabyAGI features multiple LLM-based agents, each with distinct functions: one generates new tasks based on previous outcomes, another prioritizes tasks, and a third completes them while aligning with the specified objectives. To simplify the creation of such autonomous agents, Hong et al. [29] developed MetaGPT, a meta-programming framework optimizing LLM-based multi-agent collaborations for complex tasks. MetaGPT encodes Standardized Operating Procedures into prompt sequences, streamlining workflows and reducing errors. Employing an assembly line paradigm, it efficiently delegates roles to agents, breaking down tasks into manageable subtasks.
2.4. LLMs for Geospatial Analysis
Large pre-trained models, known as foundation models, are gaining prominent in the field of GIS. In geospatial analysis, a foundation model is a sizable pre-trained machine learning model that can be fine-tuned for specialized tasks with minimal additional training, often through zero-shot or few-shot learning. Mooney et al. [30] evaluated the performance of ChatGPT on a real-world GIS exam to assess its understanding of geospatial concepts and its ability to answer related questions. The results showed that both GPT-3.5 and GPT-4 could pass an introductory GIS exam, excelling in basic GIS data models. Notably, GPT-4 demonstrated significant improvements, scoring 88.3% compared with the 63.3% score of GPT-3.5 due to its more accurate handling of complex questions involving, for example, distance calculations. However, both models struggled with numerical computations, highlighting the limitations of LLMs in handling spatial analysis tasks that require advanced mathematical reasoning.
Another study [31] explored the ability of GPT-4 to evaluate spatial information within the context of the Fourth Industrial Revolution (Industry 4.0). While ChatGPT exhibited a solid understanding of spatial concepts, its responses tended to emphasize technological and analytical aspects. The authors also raised concerns about potential hallucinations and fabrications, underscoring the need for ground truth validation when deploying LLMs in Industry 4.0 applications. Despite these challenges, the interpretability and broad training of ChatGPT offer promising opportunities for developing user-friendly, interactive GeoAI applications in spatial science, data analysis, and visualization.
Several studies have explored the potential of ChatGPT in related fields, such as remote sensing. Agapiou and Lysandrou [32] conducted a literature review on using ChatGPT in remote sensing archaeology, while Guo et al. [33] introduced “Remote Sensing ChatGPT,” which integrates ChatGPT and visual models to automate remote sensing interpretation tasks. This system aims to make remote sensing more accessible to researchers across different disciplines by understanding user queries, planning tasks, and providing responses. Quantitative and qualitative evaluations indicate that Remote Sensing ChatGPT demonstrated precision and efficiency in some tasks while achieving acceptable performance in others. IBM and NASA have jointly released a new geospatial foundation model (GFM) named Prithvi [34], developed using self-supervised learning techniques on Harmonized Landsat and Sentinel-2 (HLS) data from across the continental United States. Prithvi, trained on satellite imagery that captures essential spectral signatures of the Earth’s surface, holds greater potential for enhancing geospatial tasks compared with models trained on other types of natural images.
Several studies have used LLMs to conceptualize or develop AI-empowered GIS. One such study explored the use of large LLMs, such as ChatGPT and Bard, for interacting with geospatial data through natural language. This study presented a framework for LLM training, SQL query generation, and response parsing, demonstrating promising results in generating SQL code for spatial queries [35]. A more recent study introduced a framework for autonomous GIS agents, which leverages LLMs to automate the discovery and retrieval of geospatial data for spatial analysis and cartography [36]. This framework autonomously generates, executes, and debug codes to retrieve data from selected sources, guided by metadata and technical handbooks. In a similar vein, Li et al. [37] developed LLM-Geo, a prototype system based on GPT-4 API. LLM-Geo efficiently generated outcomes such as aggregated numbers, maps, and charts, significantly reducing manual processing time. Although the system is still in its early stages and lacks features such as logging and code testing, it shows great potential for advancing AI-empowered GIS. In addition, autonomous GIS frameworks that automate geospatial data retrieval and processing systems, such as MapGPT, are being designed for specific real-world applications. MapGPT utilizes LLMs to improve pathfinding by integrating visual and textual information with dynamically updated topological maps, enabling agents (robots) to perform adaptive path planning and multi-step navigation [38]. Mai et al. [39] examined the performance of various Foundation Models across a range of geospatial tasks, including Geospatial Semantics, Urban Geography, Health Geography, and Remote Sensing. The results showed that for tasks primarily reliant on text data, such as toponym recognition and location description recognition, task-agnostic LLMs outperformed task-specific models in zero-shot or few-shot learning scenarios. However, for tasks incorporating multiple data modalities, such as street view image-based urban noise intensity classification, POI-based urban function classification, and remote sensing image scene classification, existing foundation models lagged behind task-specific models. This study also emphasized the importance of improving computational efficiency during both the training and fine-tuning phases of large models. Additionally, this study highlighted the challenges of incorporating external knowledge into models without accessing their internal parameters, pointing to the complexities involved in leveraging supplementary information to enhance model performance.
Another study explored ChatGPT’s potential in map design and production using both thematic and mental mapping approaches [40]. It demonstrated the advantages of LLMs in enhancing efficiency and fostering creativity but also acknowledged limitations such as user intervention dependency and unequal benefits.
To lower the barrier for non-professional users in addressing geospatial tasks, Zhang et al. [41] introduced GeoGPT, a framework that combines the semantic understanding capabilities of LLMs with established tools from the GIS community. GeoGPT utilizes the Langchain framework using the GPT-3.5-turbo as the controlling agent and integrates classical GIS operations such as Buffer, Clip, and Intersect alongside professional tools such as land use classification. This enables GeoGPT to handle a variety of geospatial tasks, such as data crawling, facility placement, spatial queries, and mapping. However, GeoGPT faces limitations in fine-tuning for geospatial knowledge. In fact, generic LLMs often lack precise geographic knowledge, as demonstrated by challenges in query-POI matching [39]. Additionally, GeoGPT does not use an LLM specialized in coding, which could offer greater reliability for manipulation of GIS tools directly and allow for a broader range of operations beyond its predefined set.
Our paper shares a similar objective to Zhang et al. [41] but employs a different methodology. Rather than providing the model with a predefined pool of tools, we fine-tune the model on PyQGIS, enhancing its ability to learn a wide range of potential operation combinations.
Another study, which is related to our work, presented a framework that integrates LLMs with GIS and constrains them with a flood-specific knowledge graph to improve public understanding of flood risks through natural language dialogues. The LLM generates code that runs in ArcPy to perform flood analysis and provide personalized information aligned with domain-specific knowledge [42]. While this study focuses on flood risk mapping, our paper proposes a system and methodology that can be used in any application.
It is worth noting that the commercial offerings of OpenAI, such as ChatGIS, GIS Expert, and GIS GPT, already provide users with general knowledge of geography, geology, and GIS through natural language conversation. Dissimilar to our proposed system, ChatGeoAI, these models are not specifically designed to perform geospatial analysis. Instead, they aim to enhance user understanding of domain-specific concepts and provide generic solutions for simple tasks. These GPT models have not been fine-tuned for task-specific applications but use techniques such as Retrieval-Augmented Generation (RAG) to incorporate external knowledge dynamically. While this approach enables them to offer insights across a broad spectrum of topics, they do not perform specific geospatial analysis tasks, which is the goal of our system.
The existing literature reveals some gaps in applying LLMs to geospatial analysis. Current studies predominantly focus on using LLMs for tasks such as text generation and knowledge extraction via structured queries or integrating LLMs with GIS tools, where their role is limited to interpreting user intent and selecting operations. This leaves the potential of LLMs for direct code generation in geospatial analysis largely unexplored. Moreover, the few studies that use LLMs for code generation, in this context, do not consider fine-tuning and the integration of domain-specific knowledge, which could significantly enhance their capabilities.
2.5. Contribution to Knowledge
Generative AI, encompassing technologies capable of generating diverse types of data using various model architectures, intersects with two major AI domains: NLP and Computer Vision. NLP focuses on processing and generating text, while Computer Vision handles visual content. Within this intersection, LLMs primarily specialize in text processing and generation, leveraging transformer-based architectures.
In this study, we focus on integrating LLMs with Geographic Information Systems (GIS), a field that greatly benefits from advanced AI techniques to enhance geospatial analysis and decision-making. Our work represents a novel approach at the intersection of LLMs and GIS, using fine-tuned LLMs, enhanced by Generative AI methodologies, to perform GIS tasks.
Our paper offers several contributions. First, we extend the capabilities of LLMs by enabling them to control external tools such as QGIS (used in this study, version 3.30). Second, we fine-tune an LLM, specifically Llama 2, for domain-specific geospatial tasks, improving its performance through named entity extraction methods to provide more accurate context. Additionally, we introduce and evaluate a system architecture methodology called ChatGeoAI, designed to create an AI-empowered GIS. Finally, we test and assess the proposed system’s performance, focusing on its ability to understand user requirements and execute a sequence of relevant functions to conduct geospatial analyses in response to those needs.
3. System Design and Implementation
3.1. System Architecture
Figure 1 shows the overall architecture of ChatGeoAI. The proposed system architecture consists of a pipeline designed to translate user-generated task specifications into actionable geospatial analysis tasks within a GIS environment, culminating in intuitive result visualizations. The workflow begins in the User Interface component (1), which contains a natural language input module for “Task Definition” (2). In the interface, the user can write its specific geospatial analysis task requirements, in a natural language. This input may range from a simple descriptive task such as “find hotels within 500 m distance of the river” to a complex request that includes particular data needs, analytical methods, desired outcomes, and relevant constraints.

Figure 1.
The proposed system architecture for ChatGeoAI.
Upon capturing the task specifications, the system engages in Text Preprocessing and Normalization (3) using NLP techniques. This step is to standardize language variations such as synonyms and colloquialisms, thus homogenizing the input text for more effective subsequent analysis. The processed text then undergoes the Named Entity Recognition (NER) component (4) for the semantic process. There are several libraries for semantic processing, and we used SpaCy Library [43] in this study. Following the recognition of entities, the next crucial step involves linking them to their corresponding ontological entities or concepts (ontological mapping and enrichment) (5). For this, we used the WorldKG ontology [44]. Integrating NER and ontology as inputs for LLMs can enhance their performance in generating accurate outputs and reducing potential hallucinations. They improve the ability of an LLM to understand context by identifying key entities and their relationships. This reduces ambiguity and ensures that the generated code aligns with the user’s intent and applies domain-specific rules which will potentially lead to more precise and semantically meaningful code. These points are supported by recent studies. For instance, a study presented an NLP and ontology matching framework that successfully extracted semantic and spatiotemporal information from geological hazard reports, thus allowing for better analysis and decision-making [45]. Another study integrated LLMs with ontologies to build AI-assisted tools in urban planning, with the main objective of automated land-use configuration. Ontologies provide the structured knowledge needed for LLMs to generate sophisticated, innovative, and sustainable urban designs [46]. Concerning NER, proposed a framework combining fine-tuned NER models with LLMs to address the challenges of NER specialization and tuning difficulties and demonstrated improved performance of LLMs [47].
Enriched with this semantic context, the user-defined task and associated NER are fed into the LLM (6), which is primed to generate the codes that will execute the specified geospatial analysis task. We used Llama 2 (as explained in the next section) and all the required libraries for training and code generation inside a singularity environment [48]. Singularity is a computing framework that packages software stacks, including the OS and applications, into a single container image for easy, reproducible, and isolated execution across different platforms without administrative privileges.
Once the LLM constructs the generated codes, the system executes them within the GIS environment and thus performs the desired geospatial analysis. PyQGIS and QGIS are used as the GIS library and GIS software (7), respectively, for running the codes. The output of this computation is then translated into a user-friendly visualization (8), typically maps, and will be sent to the Result Visualization component of the user interface.
Through this architecture, we facilitate a seamless interface between non-expert users and advanced geospatial analysis, democratizing access to GIS analyses.
3.2. End-to-End System Development
Figure 2 shows the workflow and the methodology for the development and evaluation of the proposed system, as described below. It is worth mentioning that PyQGIS and QGIS were selected, respectively, as the language for generating geospatial analysis codes and the GIS software for visualization of outputs.

Figure 2.
Workflow of the implementation of the proposed system.
3.2.1. Model Selection
An LLM should have been selected for the development of the proposed system. Among available options, Llama 2 [49] was found to be the most suitable option for this study. Llama 2 builds upon its predecessor with an innovative transformer-based architecture, incorporating 70 billion parameters designed to enhance processing efficiency and model understanding. Dissimilar to its predecessor, Llama 2 integrates novel attention mechanisms and layer normalization techniques to facilitate deeper, more contextually aware language comprehension and generation. Llama 2 exhibits superior performance on several NLP benchmarks, including GLUE, SuperGLUE, and SQuAD, outperforming GPT-3.5 [50] in tasks requiring deep language understanding and context awareness. While GPT-4 excels when it comes to handling extensive datasets and long text, it lags behind Llama 2 in terms of text prediction accuracy, primarily because of the latter’s meta-learning capability. Furthermore, in code generation benchmarks, Code-Llama 2 demonstrates remarkable proficiency, rivaling specialized models such as Codex [31]. The latest 70B-instruct-version achieved a HumanEval score of 67.8, surpassing both GPT-4 and Gemini Pro for zero-shot prompts (published only on their website, waiting for their paper).
The choice of Llama 2 to be a core model for our system is due to several reasons. Llama 2 was released by Meta for research purposes and commercial use. Depending on minor licensing terms, it might be available for use at no cost or for a significantly lower cost than other commercial LLMs. This accessibility can make advanced geospatial analysis more affordable, especially for academic and start-up projects. In addition, it can handle complex problems, and thanks to its large parameter size, Llama 2 is exceptionally good at understanding and generating codes for complex tasks. Moreover, it can quickly generate code based on user inputs. This responsiveness is crucial in project environments where quick iterations and modifications are often needed and where the tasks include many processes and computations to perform.
Specifically, the reliability of the output from Llama-Python is greatly enhanced by its extensive training regimen, featuring an impressive 70 billion parameters that make the model capable of generating high-quality PyQGIS codes consistently for general problems. This allows the possibility of fine-tuning the model and being able to improve its performance on specialized tasks related to GIS significantly. This adaptability means that Llama 2 can be tailored to generate PyQGIS codes that satisfy very specific requirements of our project. Moreover, one of the main advantages of using Llama 2 to build geospatial analysis systems is its capability to scale up. In fact, it can handle increased demand without a significant drop in performance, making it suitable for both small and large-scale GIS applications.
3.2.2. Environment Setup
Two high-performance GPU NVIDIA A100 are used for model fine-tuning and inference. Additionally, RAM of 64 GB and storage space of 500 GB is used to store the model, datasets, and required software. These were provided by the National Academic Infrastructure for Supercomputing (NAISS Supr) in Sweden.
Regarding the software, the Singularity container is used to deploy the model because it provides a secure, portable, and reproducible method for managing software environments, particularly suited for scientific and data-intensive applications. The process involves installing Singularity and creating a container with a definition file specifying all necessary components and required Python libraries, such as torch and transformers.
3.2.3. Data Collection
We rigorously collected a dataset to train and enhance the Python-Llama Instruct 70B model to be able to generate PyQGIS scripts for geospatial analysis. This process involved identifying tasks, crafting natural language prompts, and collecting precise PyQGIS scripts for each prompt. We gathered 1000 code snippets from reliable sources such as verified solutions on platforms such as Stack Overflow or examples provided in the documentation of PyQGIS. The relatively low size of the collected prompts aligns with the nature of LLMs, including Llama 2, as few-shot learners, and the choice of this specific number is based on findings from prior research, which indicate that 1000 samples are enough to fine-tune LLM [14]. The collected codes solve a large spectrum of diverse geospatial analysis tasks that range from data processing, basic mapping, and visualization to more complex operations such as spatial querying, routing, and network analysis. The dataset predominantly includes the common functions that closely mimic real-world scenarios that GIS analysts and normal users frequently encounter. However, to ensure comprehensive coverage, the dataset also includes advanced GIS functions such as statistical evaluations of geospatial data. The samples in the dataset involve dealing with both vector and raster data formats. Most of the code snippets are designed to address specific tasks under the assumption that these input data are already in the correct format and have been properly cleaned and preprocessed. Consequently, these snippets may not encompass comprehensive error handling or account for exceptional cases that could arise with less structured data.
These snippets were meticulously selected to ensure accuracy and reliability. In addition, we randomly checked and verified the correctness of some script outcomes.
For each code snippet, we prepared a prompt that provides a clear task description, specifies input parameters if needed, and describes expected outcomes concisely. Natural language variations were considered to accommodate diverse user expressions while maintaining clarity and simplicity to suit users with different levels of expertise. For some prompts, the context is included as supplementary input to help the model learn from contextual information. The context input aims to offer sufficient contextual relevance and illustrative examples to aid the model in understanding user intent and generating accurate PyQGIS scripts. The data is structured in a JSON format, split into training and validation sets, and fed to the model for fine-tuning.
3.2.4. Llama 2 Fine-Tuning
Utilizing LLMs in specific applications involves employing various strategies, with fine-tuning and in-context learning being the most prevalent approaches. Fine-tuning, a method of transfer learning, entails adapting a pre-trained LLM to a particular application by adjusting specific weights [22]. This process includes augmenting the prompt (or query) set with domain-specific training examples, allowing the LLM to learn from these “few-shot” instances.
A groundbreaking approach in NLP that diverges from traditional methods is Parameter-Efficient Fine-Tuning (PEFT) [51]. Dissimilar to conventional fine-tuning, PEFT selectively identifies and adjusts only essential model parameters for a specific task, speeding up the process and reducing memory consumption significantly. The introduction of LoRA and its subsequent Quantized LoRA (QLoRA) marked a notable advancement in this field, setting new efficiency standards in NLP [51,52].
PEFT addresses several challenges, including Catastrophic Forgetting—a significant issue in continual learning. By selectively preserving parts of the model, PEFT prevents the erasure of previously learned generalized knowledge during fine-tuning, which enhances adaptability across diverse tasks. Additionally, PEFT optimizes only a subset of parameters, making it accessible to users without extensive computational resources. It also mitigates the risk of overfitting, where a model becomes too tailored to limited training data, while ensuring scalability for larger and more complex models. Overall, PEFT offers a cost-effective solution for future applications.
The fine-tuning of Llama 2 using the PEFT approach was conducted by following these steps:
Step 1—Data processing: we meticulously prepared a dataset comprising 1000 prompts, covering a diverse range of geospatial analysis tasks. The dataset was thoughtfully structured to include the following components:
- Query: Each prompt represents a user’s natural language query related to geospatial analysis.
- Context: Additionally, we included optional context information where available. This context aids in understanding the specific use case or scenario.
- PyQGIS script: Corresponding to each query, we provided a PyQGIS script. These scripts serve as the bridge between user intent and actual geospatial operations.
In our system, data processing plays a critical role in preparing user queries for analysis by the Llama model and entity recognition using SpaCy. Initially, tokenization and normalization are performed on the input text to break it down into manageable units (tokens) and standardize these tokens for consistent processing. This step is crucial for the Llama model to interpret and generate PyQGIS code from natural language queries accurately. Hugging Face’s Transformers are employed for handling the Llama model’s input, ensuring that the tokenization aligns with the model’s pre-trained understanding of language. Following tokenization, to obtain context from user queries for geospatial tasks using SpaCy and the WorldKG ontology, a systematic approach is employed to extract, enrich, and understand geospatial entities and their relationships. Initially, user queries are processed through SpaCy, a powerful NLP library, to identify and extract potential geospatial entities, such as location, landmarks, quantities, or time. SpaCy allows for the initial parsing of the query to find names, places, and other relevant entities that might correspond to geospatial features. With a list of extracted entities and keywords, the WorldKG ontology, which structures geospatial data from OpenStreetMap (OSM) in a semantic graph format, is queried. This step is crucial for matching the identified entities with their corresponding entries in WorldKG, utilizing SPARQL queries to access the ontology. The responses from WorldKG provide a wealth of information about the identified entities, including their types (e.g., park, highway, school), spatial relationships, and other attributes defined within the ontology. This information enriches the entities with a broader context, making the understanding of the user query more comprehensive.
This structured format of our dataset plays a crucial role in the efficient ingestion of the data by the Llama model. By organizing the information in this way, the model can efficiently learn the intricate mapping between user queries and PyQGIS scripts.
To facilitate robust training, we split these data into an 80% training set and a 20% validation set. Tokenization serves as the initial step in transforming natural language queries and PyQGIS scripts into a format that the model can comprehend. During tokenization, the text is broken down into smaller units called tokens, which represent the fundamental vocabulary elements used by the model. This systematic approach ensures that the Llama model can learn and generalize effectively, ultimately enhancing its ability to assist users in geospatial analysis tasks.
Step 2—Quantization: The Llama 2 model, being both large and computationally expensive to train, undergoes a crucial process called quantization. The primary goal of quantization is twofold:
- Model size Reduction: By converting model weights from floating-point precision to lower-bit precision (specifically int16), we significantly reduced the memory footprint of the model.
- Inference speedup: Quantization also accelerates inference by making computations more efficient.
- In practice, we loaded the pre-trained Llama model and applied quantization to its weights.
Step 3—LoRA Configuration: Low-Rank Adaptation (LoRA) is a powerful technique that enhances model adaptation with minimal modifications to the model architecture. By introducing additional trainable parameters to the attention layers in the Llama model, LoRA enhances the model’s ability to focus on long-range dependencies in the data. The implementation of the QLoRA technique is adapted from the PEFT library.
Step 4—Training Configuration: This step involves setting various parameters for the training process, including learning rate, batch size, number of epochs, and optimization algorithms. It is crucial for ensuring efficient and effective learning. The TensorFlow framework, along with its dependent high-level APIs, is used to configure these training parameters.
Step 5—Supervised fine-tuning: In this final step, we train the model for our specific domain (GIS) using the preprocessed dataset and the defined training configuration. During this process, the model adjusts its weights to minimize loss on the new task, thereby enhancing performance on similar tasks. Finally, we evaluated the fine-tuned model on a set of tasks, which will be explained in the next section. The fine-tuned Llama 2 can generate PyQGIS code to perform geospatial analyses needed to produce the user’s required output.
3.2.5. Integration with QGIS
The fine-tuned Llama 2 model was seamlessly integrated with QGIS, a free and open-source geospatial analysis platform. The integration enables the model to directly interact with geospatial data and the analytical tools provided by QGIS through the PyQGIS Python environment. In other words, this integration will make it possible to execute later the generated PyQGIS codes by the fine-tuned Llama 2 model in QGIS to perform geospatial analyses and produce user required output. The incorporation of QGIS offers numerous advantages, primarily stemming from its open-source nature, which enables free access, customization and leveraging a comprehensive array of geospatial analysis tools.
3.2.6. User Interface Design
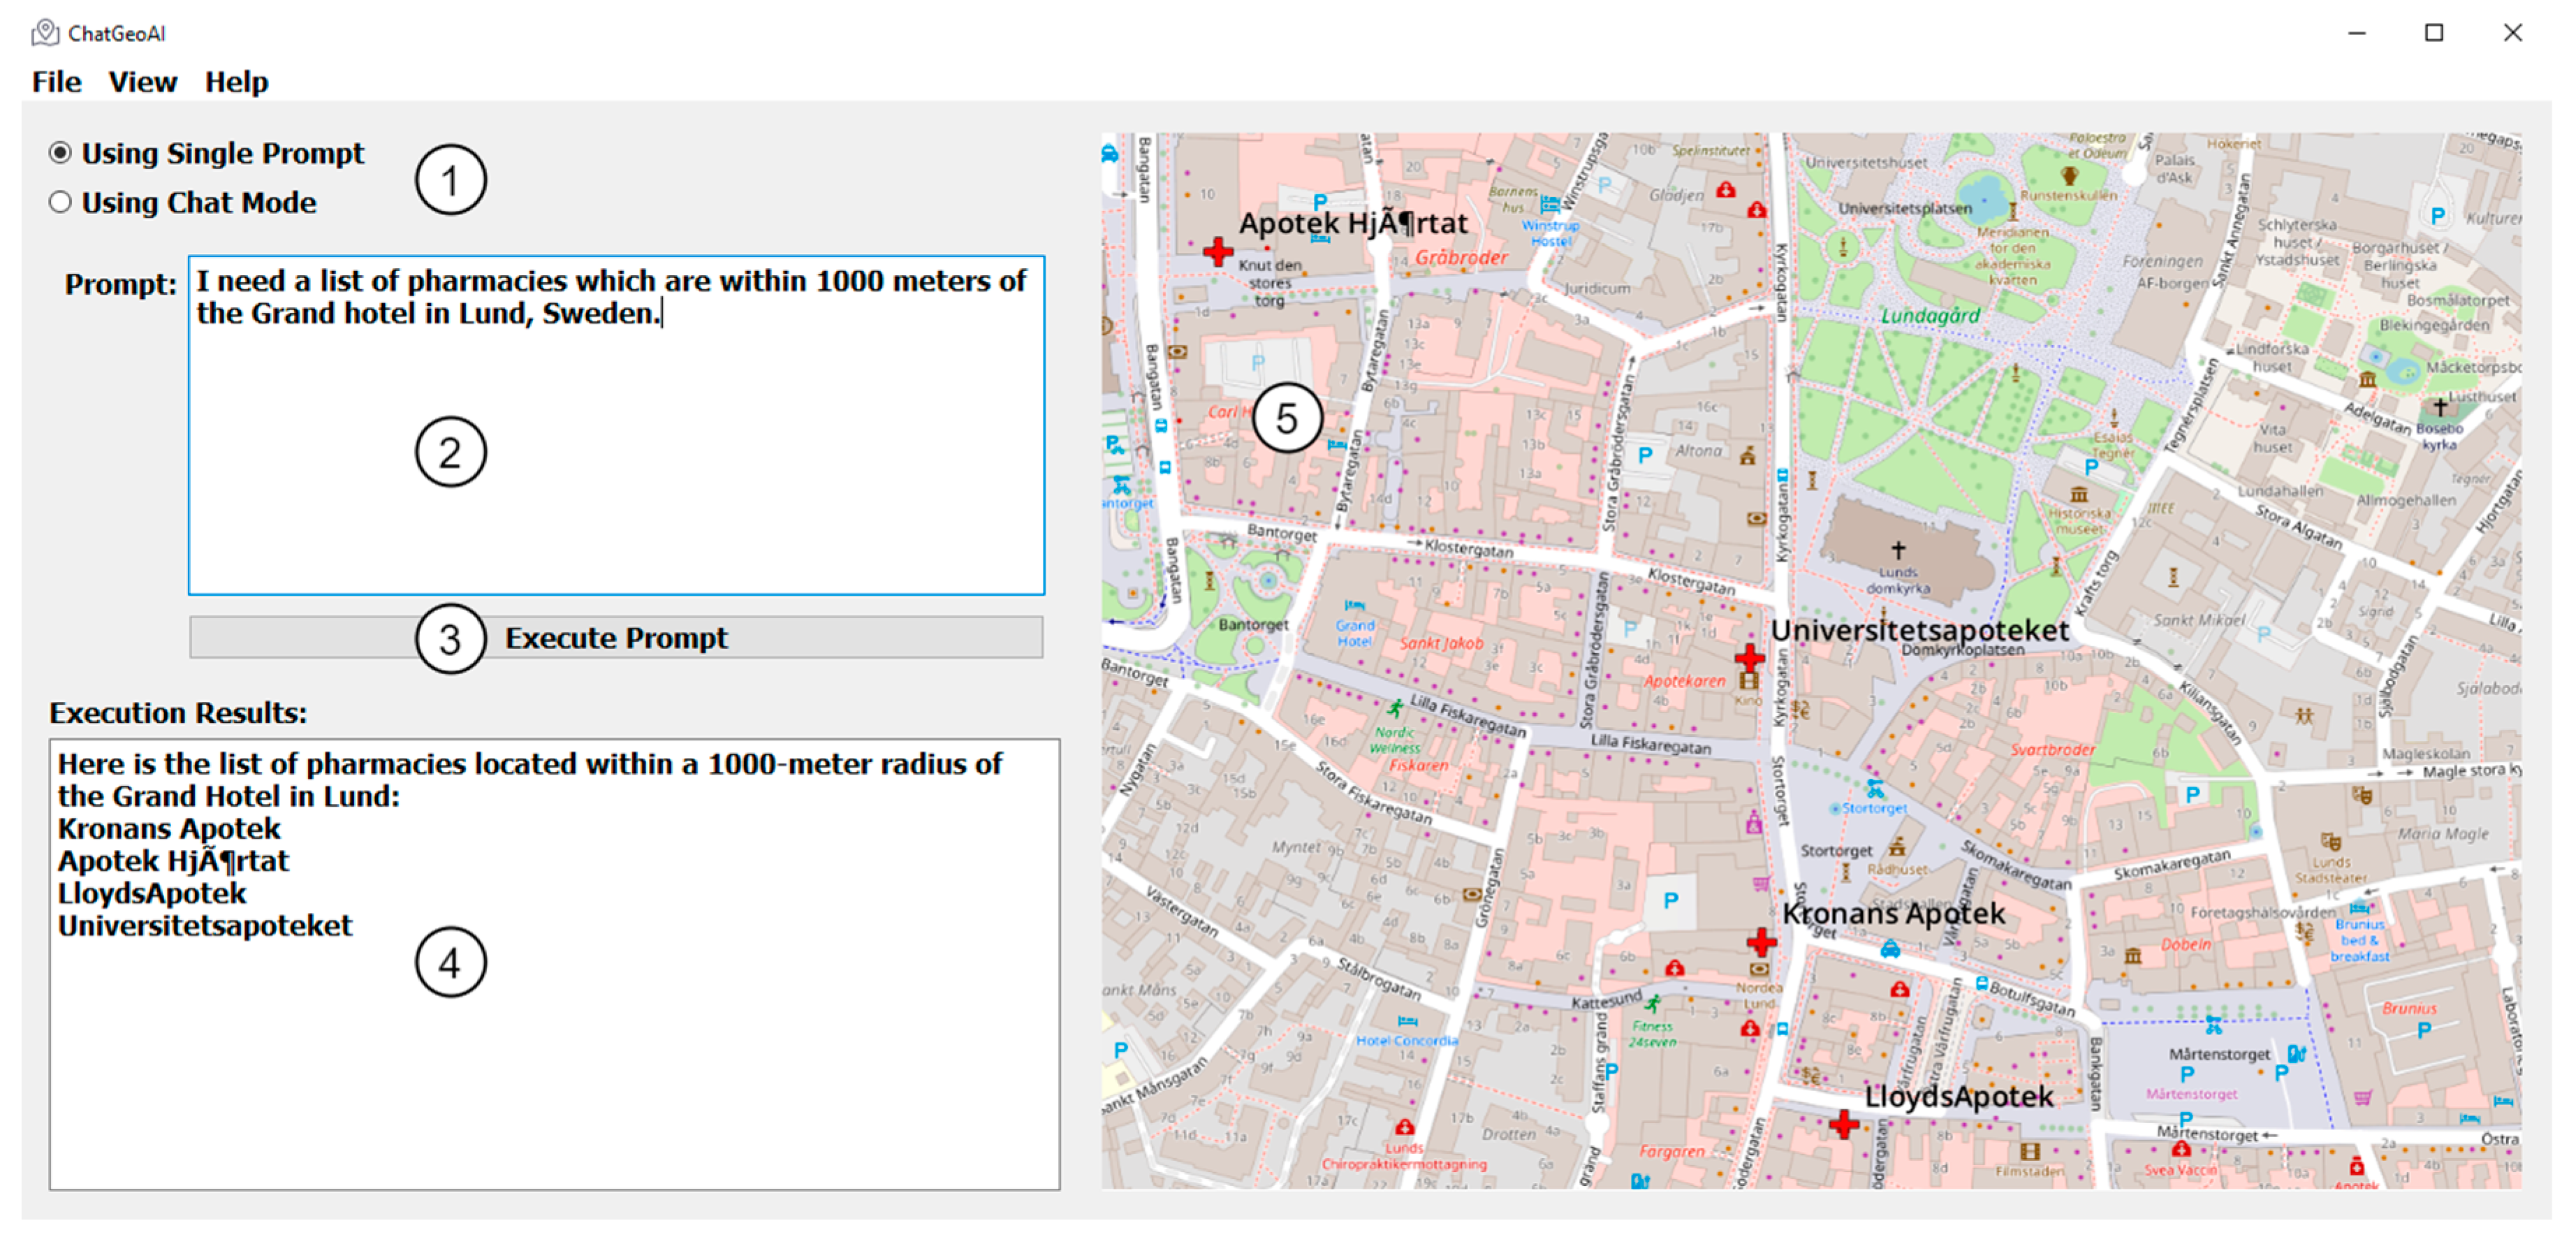
A desktop chatbot application was developed to facilitate user interaction with the system and obtain visual results. As shown in Figure 3, the proposed user interface for the ChatGeoAI includes these main key components: (1) Radio buttons toggle between interactive chat mode and a single prompt mode, allowing users to choose their preferred interaction style. Users have two options: they can either submit a single query at a time or engage in an ongoing chat with the system. The latter option allows for additional queries, adjustments to analysis parameters, and exploration of alternative scenarios. This functionality is achieved through chat mode. The feedback collected from users serves to enhance the system’s understanding of their intent and ensures the successful achievement of the desired task outcomes. (2) A large text area for users to input geospatial analysis queries, with example prompts for guidance. (3) A button to execute the query, which triggers the backend processing and code generation. (4) A results area where textual outputs from the PyQGIS console are displayed. This includes descriptive information about the output results. (5) A visual map display area that allows interactive exploration of the resulting geospatial data, with features for zooming and layer toggling.
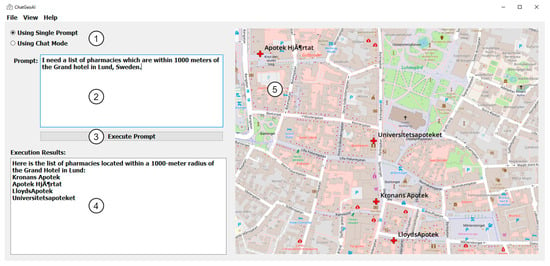
Figure 3.
User interface components for ChatGeoAI.
3.2.7. System Deployment
After developing, linking, and integrating the system components, we proceeded with the deployment of the system. To ensure effective interaction, the fine-tuned Lama 2 model needed clear guidelines on its role and behavior. This was achieved through a system input that encapsulates general rules and specifications that guide how the model interprets user queries and generates PyQGIS code. By adhering to these rules, we ensure consistent application across various tasks. We used OSM data for the deployment and evaluation of the developed system.
The system input serves as a framework within which the model operates, independent of the specific user input. Here are the specifications of the system prompt we utilized:
- Understand and translate natural language geospatial queries: The model should convert user queries into executable PyQGIS code.
- Data layer iteration for feature searches: Unless a specific data layer is mentioned, the model should search across all layers. It applies OSM tag logic to identify relevant features.
- Create the output data layer with feature names and key attributes: The model should generate an output layer that includes feature names and attributes. Additionally, it should apply styling for visual outputs and select the most suitable SVG from the specified path (e.g., Path/to/svg/folder”) for various features (e.g., pharmacy, hospital, school).
- Error checking and graceful handling of missing data: The model should handle errors gracefully and address missing data.
- Comments and user feedback: The model should provide comments explaining parameter choices not explicitly mentioned in the query or instructions. Furthermore, it should encourage user feedback within output scripts to improve accuracy.
- Documentation and generated code: The model should document the generated code, listing its main steps for user understanding.
This comprehensive system prompt ensures that the fine-tuned Llama model operates effectively and consistently, enhancing its usability and reliability.
3.2.8. System Evaluation
To evaluate the proposed system, we examined the impact of fine-tuning on the Llama 2 model. We assessed the code quality of ChatGeoAI and compared it with the baseline Llama 2 model using various natural language processing metrics to ensure a comprehensive evaluation. The primary metrics used for comparison were CodeBLEU, ChrF, Rouge-L, and BERTScore.
CodeBLEU [53] is a composite metric designed specifically to evaluate the quality of generated code. It extends the traditional BLEU (BiLingual Evaluation Understudy) metric, which is commonly used in NLP to assess the quality of a machine-translated text. To be more suitable for the evaluation of code generation, CodeBLEU introduces additional components to address the specific aspects of programming languages and capture their structural and functional requirements. The metric comprises four components that collectively offer a comprehensive evaluation by considering n-gram matches, syntax correctness, and data flow:
- N-gram Match Score: This component measures the overlap of n-grams (sequences of tokens) between the generated code and the reference code. It assesses the similarity in structure by comparing short sequences of tokens. A higher score indicates that the generated code has a greater resemblance to the reference code in terms of these token sequences.
- Weighted N-gram Match Score: Dissimilar to the N-gram Match Score, this score assigns different weights to different n-grams based on their importance. It evaluates how well the generated code matches the reference code while assigning different weights to the sequences. This scoring method recognizes that some code fragments are more important than others for maintaining functionality.
- Syntax Match Score: This component evaluates the syntax correctness of the generated code. It checks whether the code adheres to the grammatical rules of the programming language. A higher Syntax Match Score indicates fewer syntax errors and a closer alignment with standard coding practices, which is crucial for executable code.
- Data Flow Score: This score assesses data flow consistency in the generated code. It examines how data move through the code, ensuring that variables and operations are used correctly. A high Data Flow Score means that the generated code logically follows the intended flow of data, maintaining the integrity and functionality of the program.
Evtikhiev et al. recommend using the ChrF metric for assessing code generation models [54]. The ChrF metric is a character n-gram F-score metric. Dissimilar to word-based metrics, ChrF operates at the character level and computes precision and recall in the F-score using the average over 1- to 6-g of characters. This approach allows ChrF to capture more fine-grained similarities between the translated and reference texts while handling issues such as spelling variations and inflections. Another metric used to evaluate the proposed system is the ROUGE-L (Recall-Oriented Understudy for Gisting Evaluation) metric, which is usually used to assess the quality of summaries and generated text [55]. ROUGE-L specifically measures the longest common subsequences between the generated text and the reference text, based on which the F-score is computed. This approach captures the longest sequence of words that appear in both codes in the same order, thus considering the sequential nature of the code and providing a more nuanced evaluation of code quality compared with simple n-gram matching. The last metric used for the system evaluation is BERTScore [56]. This metric evaluates text generation, specifically the code quality, such as in our case, by leveraging contextual embeddings from pre-trained transformer models such as BERT [15]. It computes the cosine similarity between token embeddings in the reference and generated texts, thus capturing semantic similarities. BERTScore and ROUGE metrics were initially designed for evaluating text summarization and machine translation. However, they are often used to gain insights into the differences between LLMs for code generation in terms of semantic understanding, syntax, and structure. While these metrics provide valuable information, they may not fully capture the syntactic and structural nuances specific to programming languages.
To further evaluate the system, we demonstrated its performance using a series of geospatial queries. These queries were designed to cover a broad range of geospatial analysis tasks, gradually increasing in complexity from straightforward (easy) to intermediate and challenging (difficult). The queries mirror the typical requirements of an everyday user and address common scenarios encountered in geospatial data analysis.
To the best of our knowledge, no benchmark dataset currently exists specifically designed to evaluate LLM-based systems for the generation of geospatial code (i.e., code snippets) or executing GIS tools. While BB-GeoGPT [57] provides some evaluation capabilities, it is not optimized for directly assessing the accuracy and functionality of geospatial analysis execution. Instead, its focus is on the evaluation of text-based geospatial tasks such as text summarization, question answering, NER, and spatial relation extraction.
Our test queries fall into one of these categories:
- Spatial proximity queries involve identifying properties, schools, pharmacies, and buildings within specific distances of highways, roads, hotels, or other locations. An example is “I need a list of pharmacies which are within 500 m of the Grand hotel in Lund, Sweden”.
- Routing and navigation queries: focus on determining the shortest path between two points or finding the optimal route to reach a specific destination. An example query could be “What is the shortest path by car from Lund Cathedral to Monumentet?”.
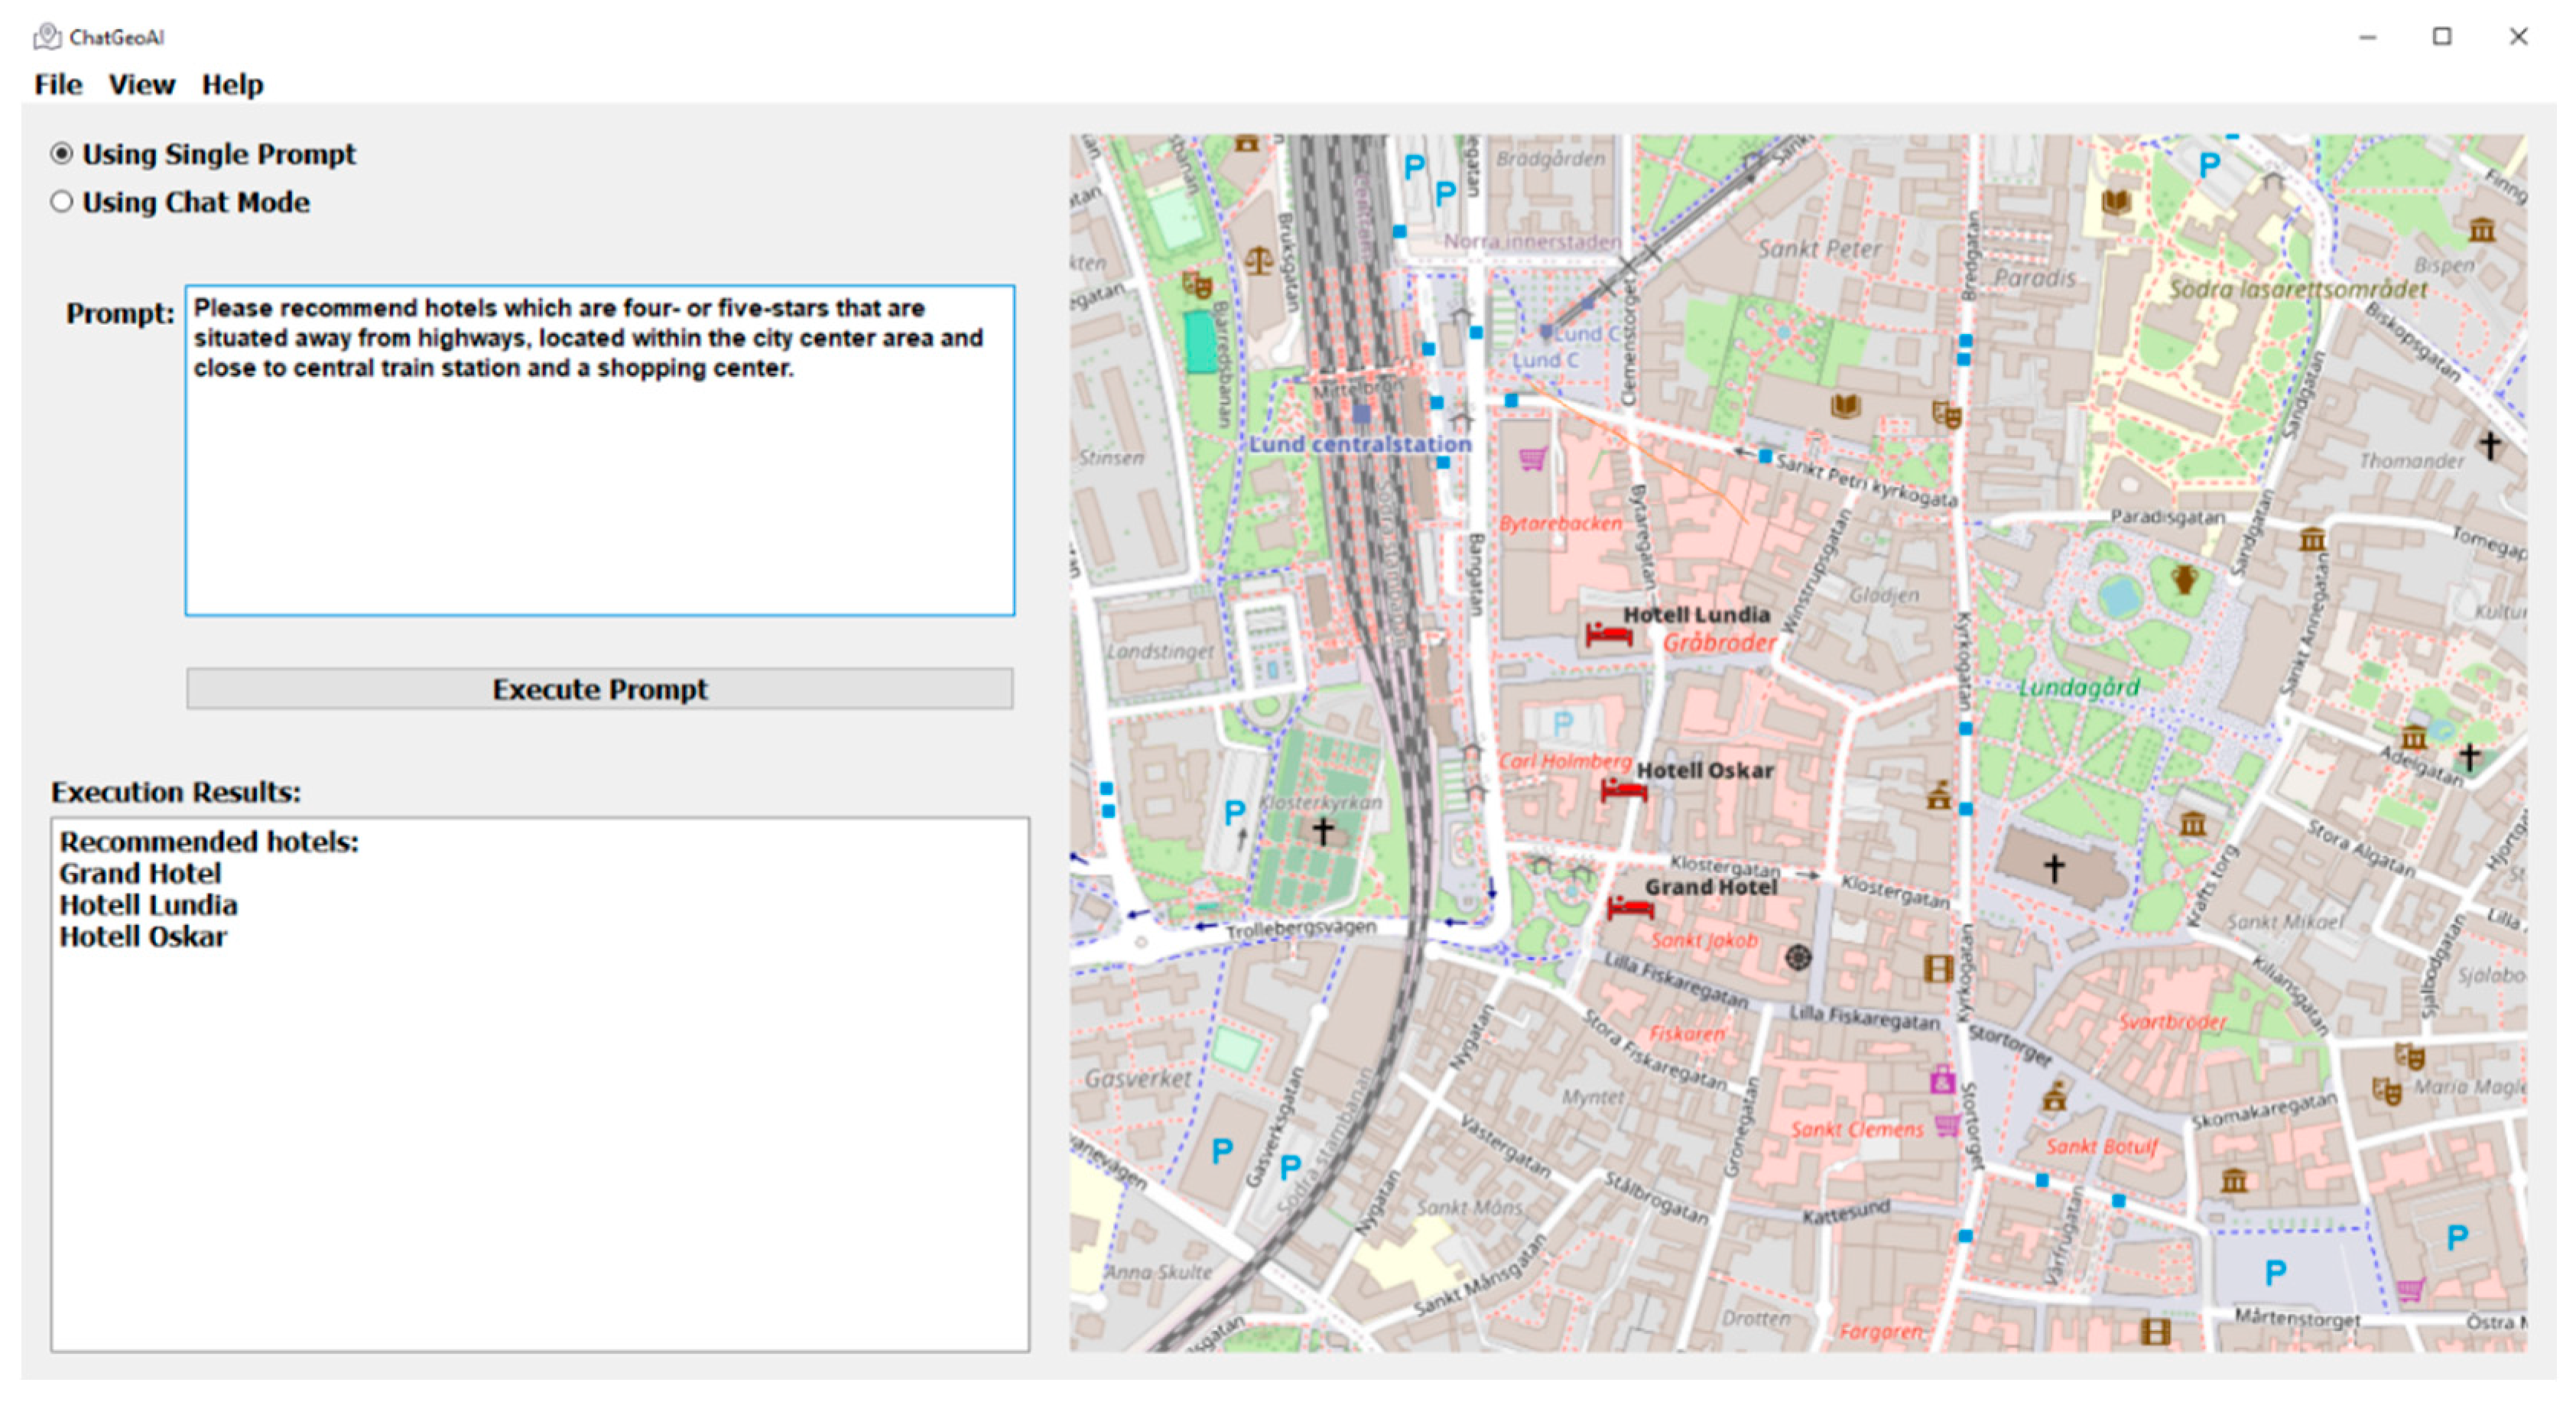
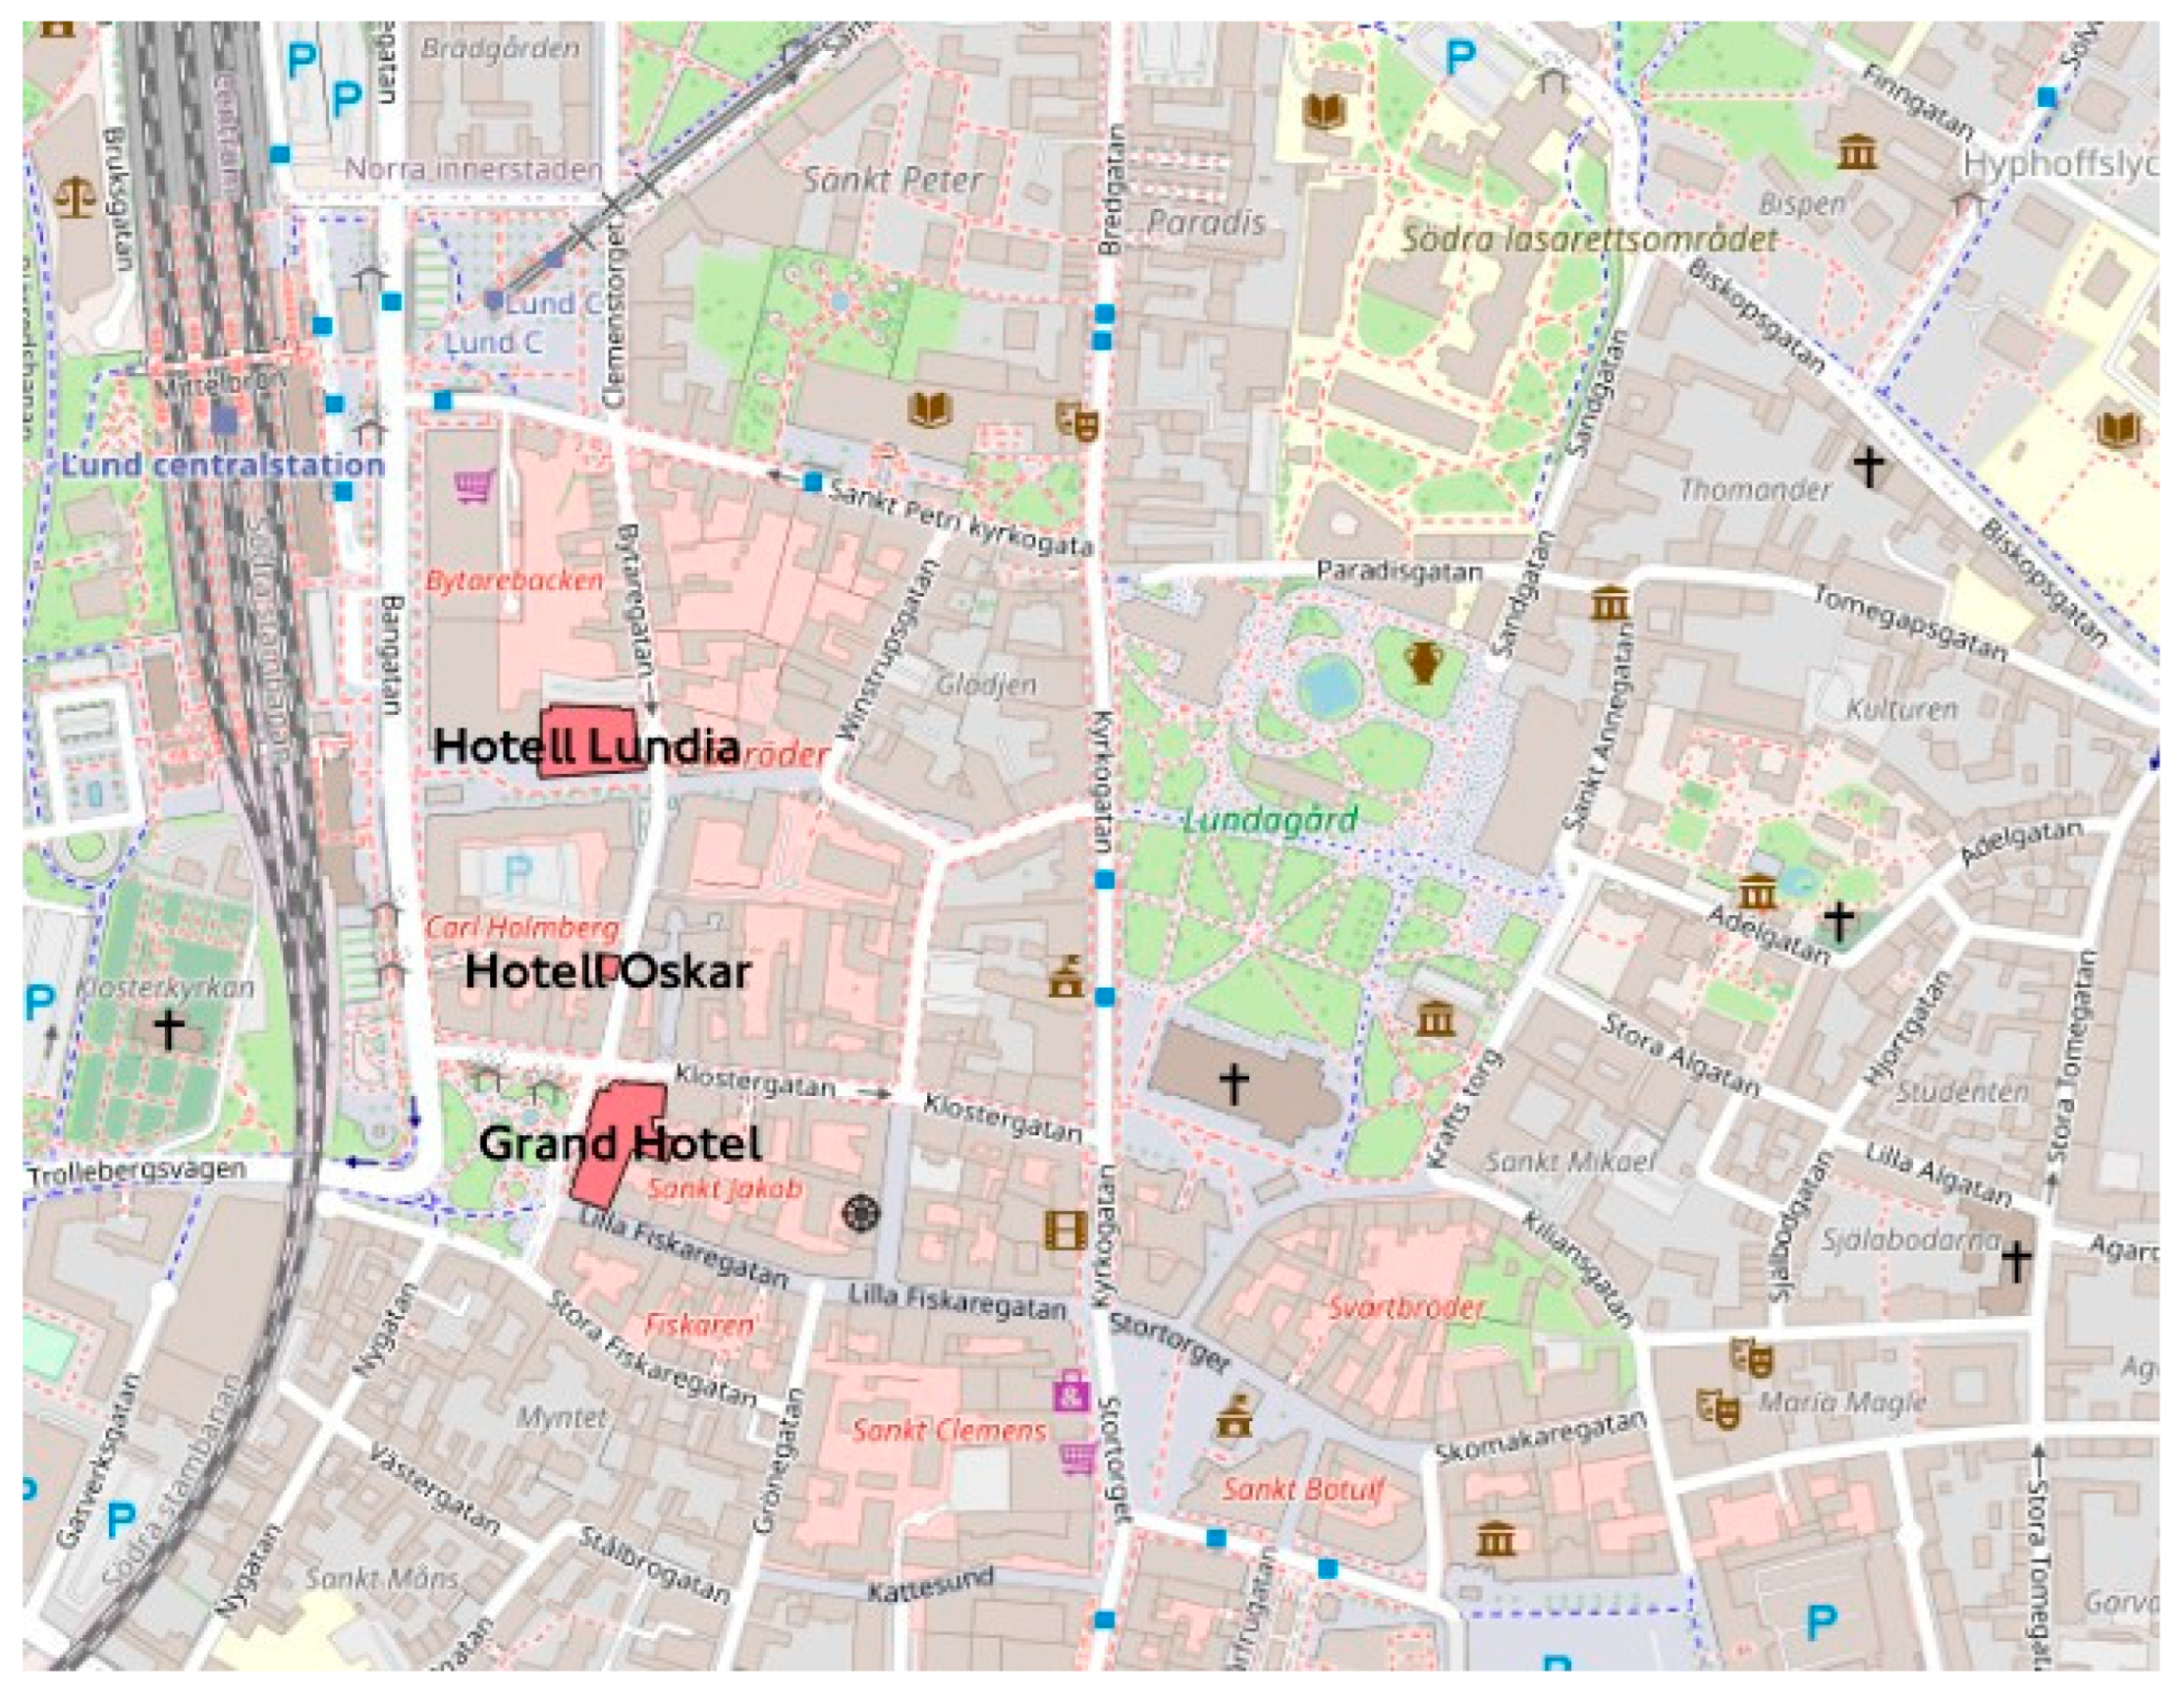
- Recommendation queries: This category aims to identify suitable facilities based on specific criteria. For instance, a user might ask, “Please recommend hotels which are four- or five-stars, situated away from highways, within the city center area, and close to central train station and a shopping center”.
4. Results
In this section, we report the results of the evaluation of the proposed system and its contribution to improved performance compared with the baseline Llama 2 model. We begin by assessing our architecture, with a particular focus on the impact of fine-tuning on performance. Subsequently, we evaluate the system across multiple queries to determine its ability to generate accurate and executable code.
4.1. System Architecture Analysis
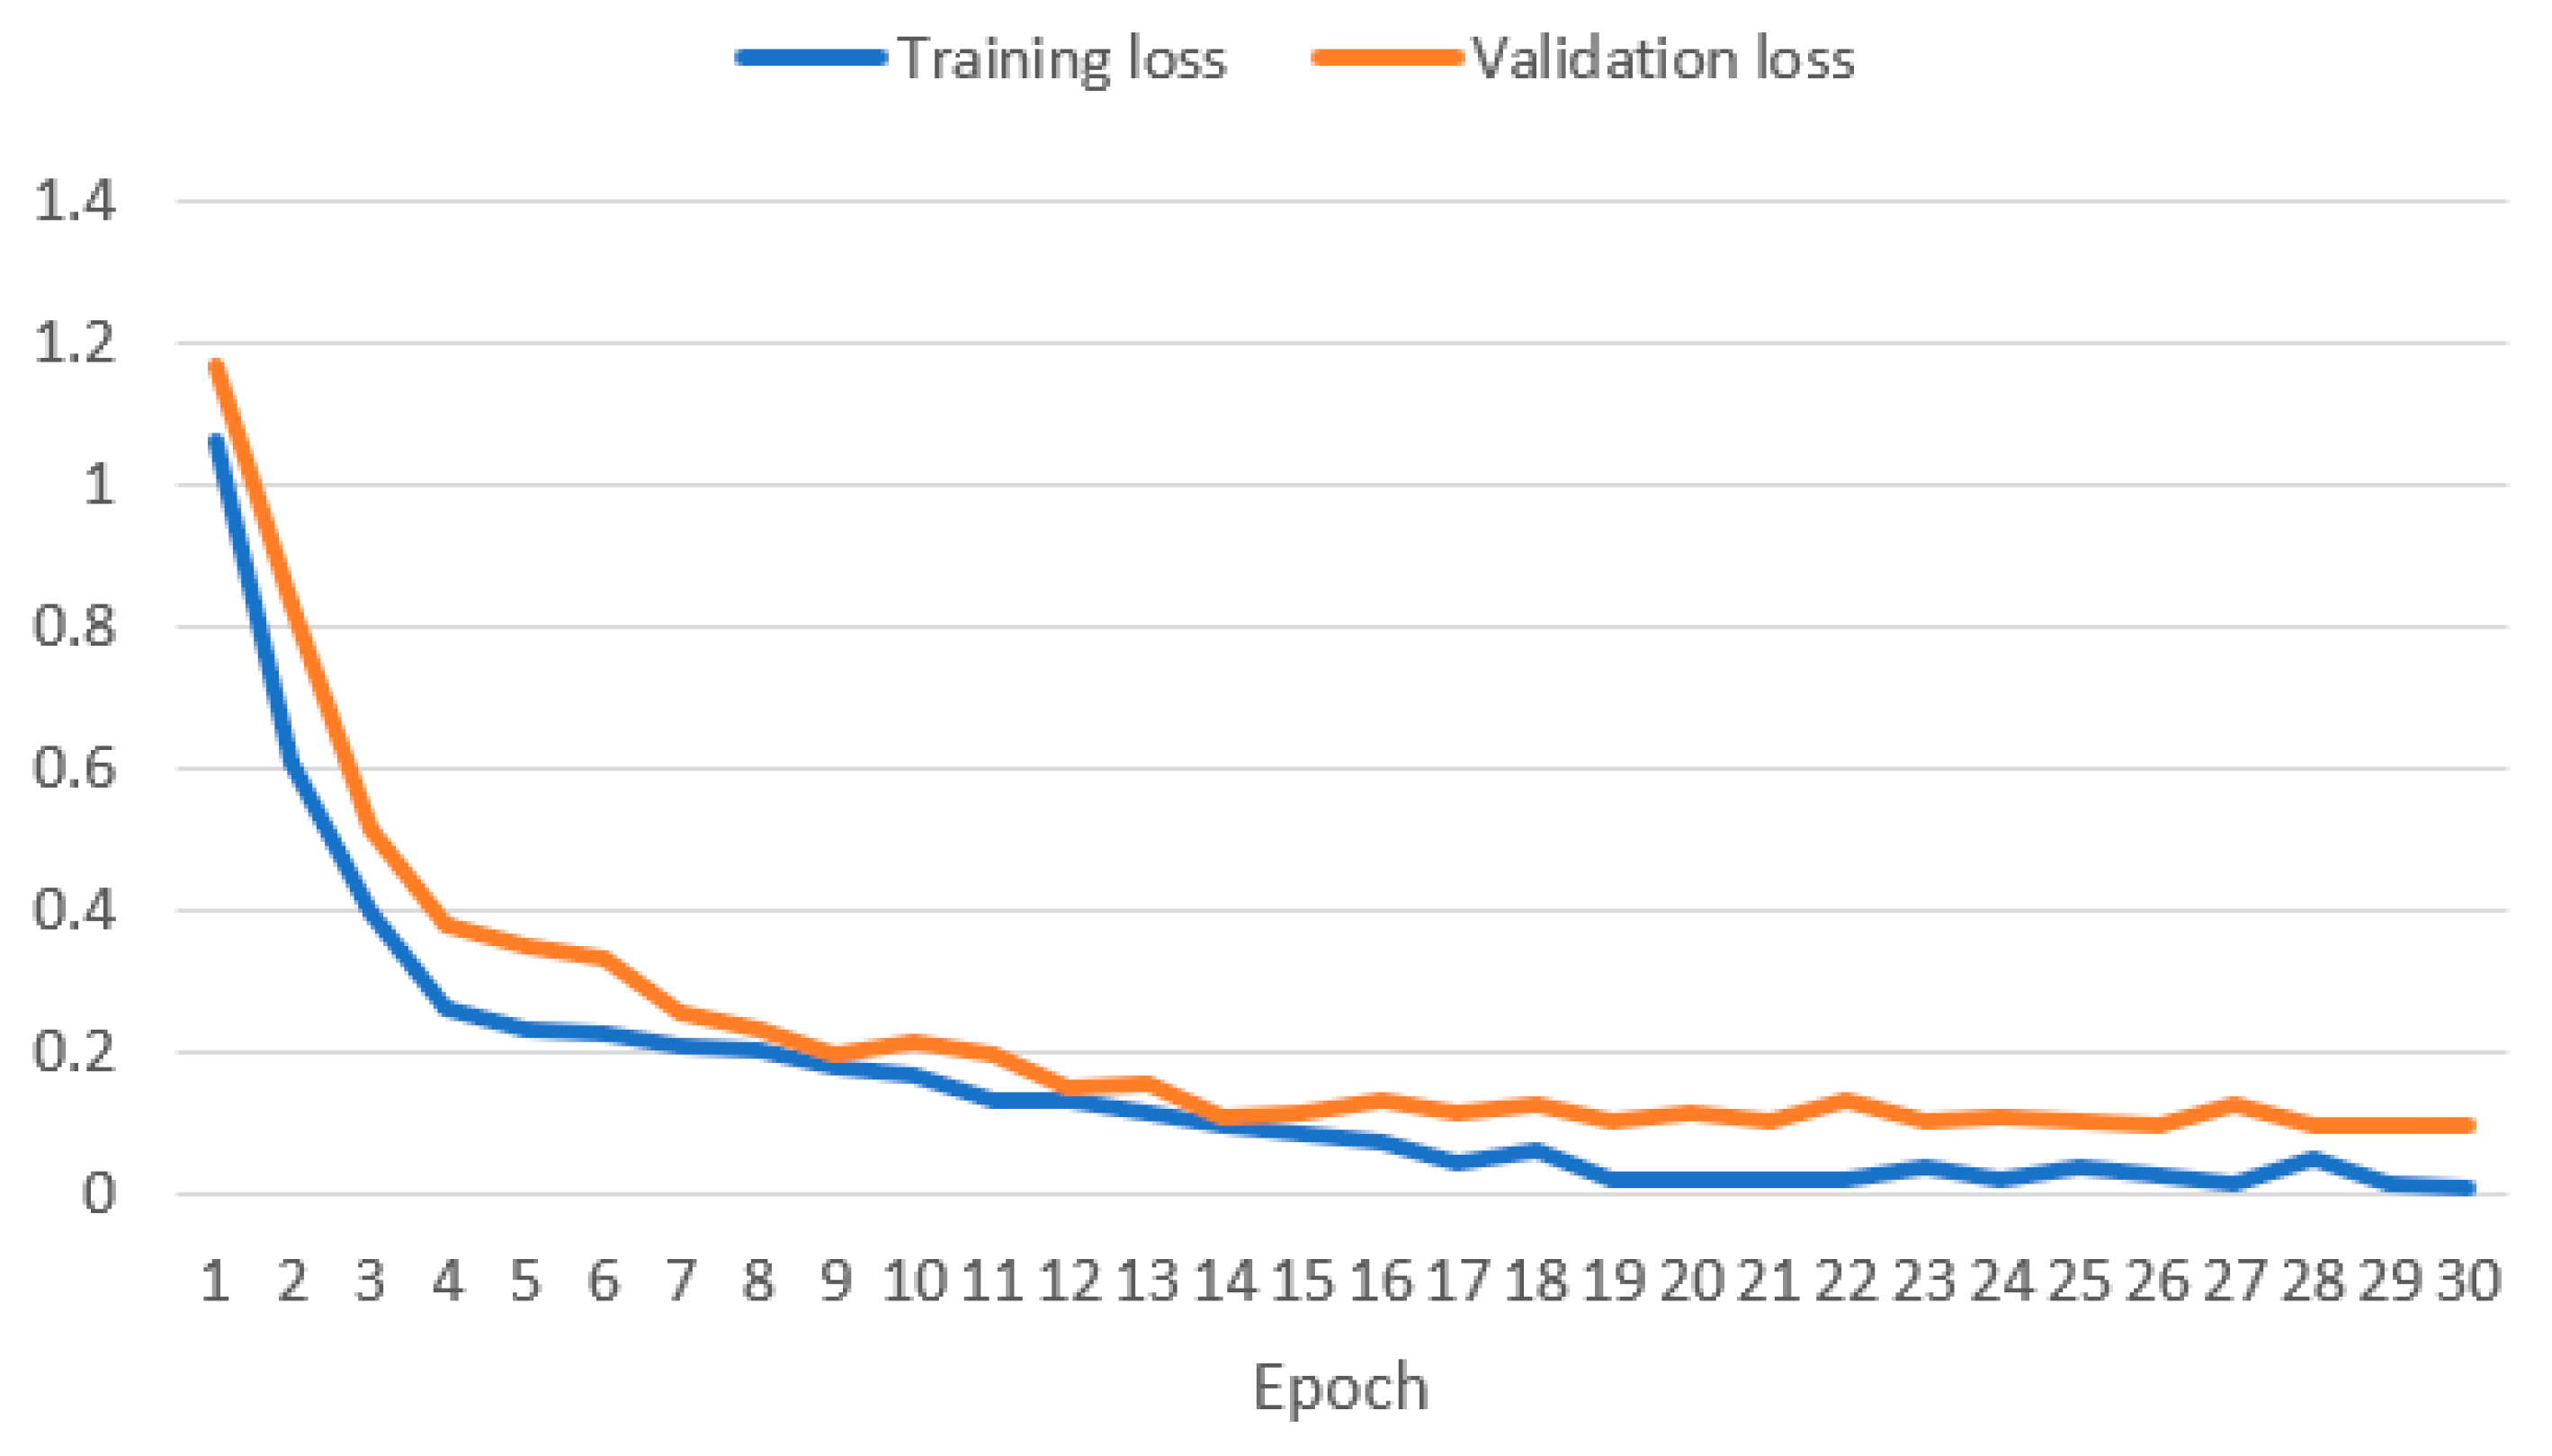
To assess the proposed system, we evaluate the impact of fine-tuning on the Llama 2 model. Therefore, to ensure robust model performance and mitigate overfitting, we closely monitored the model’s performance on the validation set. Figure 4 shows the training and validation loss function curves illustrating a substantial decrease from 1.062 to 0.0129 and from 1.16 to 0.09, respectively. This signifies that the fine-tuning increases the Llama 2 model’s ability to generate codes effectively. Such progression is in harmony with the inherent nature of LLMs as few-shot learners, supported by research indicating that approximately 1000 prompts can be adequate for fine-tuning LLMs [14].
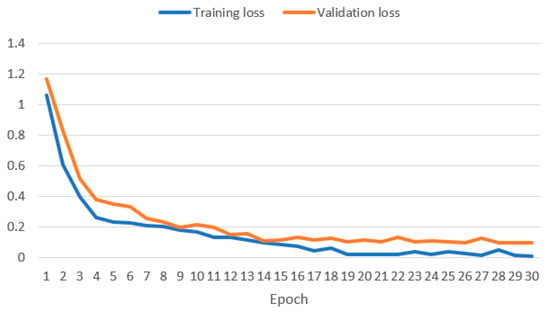
Figure 4.
Training and validation loss curves of Llama 2 model during the fine-tuning.
A reduction in loss alone does not fully capture the quality and accuracy of the generated code. Therefore, we assessed the code quality using various natural language processing metrics to obtain a more comprehensive evaluation and capture diverse aspects such as structural similarity, semantic accuracy, syntax correctness, and data flow consistency. This multi-metric approach provides a holistic view of the system’s performance and reliability, highlighting specific strengths and weaknesses. Additionally, using multiple metrics allows for comparing performance against the baseline across various dimensions, thus ensuring a balanced and thorough evaluation.
Table 1 shows the performance comparison of baseline Llama 2 and ChatGeoAI using the CodeBLEU metric. This metric comprises four sub-metrics: N-gram Match Score, Weighted N-gram Match Score, Syntax Match Score, and Data Flow Score. Assigning equal weight to all these aspects, ChatGeoAI achieved a CodeBLEU score of 23.58%, which is 2.35 points higher than the baseline Code-Llama 2. CodeBLEU scores typically range from 0 to 100, depending on the complexity of the tasks and models used. Scores between 20–30 are generally considered reasonable, with scores exceeding 40% indicating good performance. Ren et al. evaluated various LLMs on text-to-code tasks, achieving scores between 18.04 and 30.96% [53]. Scores higher than 30 are often achieved when tested on simpler data such as CoNaLa, which includes simple generic programming problems such as sorting a list or file operations and which involve typically short and one-line code snippets that are easier for models to generate accurately based on well-defined intents [58]. So, the achieved score indicates moderate performance that we will analyze further by showing its sub-metrics. ChatGeoAI achieves slightly higher values in terms of N-gram Match Score (6.70 vs. 5.62) and Weighted N-gram Match Score (9.18% vs. 6.81%). Both metrics are typically low for code generator models due to high syntax variability and structural differences in programming languages. ChatGeoAI, however, achieved slightly higher values in both, indicating it generates code more similar in content to the reference code than the code generated by the baseline model. The Syntax Match Score assesses the syntactical correctness of the generated code by evaluating how well it matches the reference code’s syntax tree. By achieving a score of 28.19%, which is approximately 10% higher than the baseline, our system seems to adhere more closely to correct syntax rules, making it more likely to be executable and understandable. Dataflow Match Score measures the accuracy of the data flow in the generated code. A higher score means the logical flow of data (variables, functions, etc.) in the generated code is more consistent with the reference code, thus ensuring correctness in functionality. A 7.2% increase in this metric can potentially enhance the logical flow of the code and its correctness which makes the proposed system more accurate. To summarize, the achieved values in CodeBLEU and its components indicate that the generated code maintains a reasonable structural resemblance to the reference code, with well-aligned data flow, despite the discrepancy in token sequences, likely because of varying variable names and code structuring practices. At the character level, ChatGeoAI outperformed the baseline, achieving a ChrF score of 26.43% compared with the baseline score of 23.86%. This suggests that it has a better fine-grained similarity and captures more character-level details and nuances than the baseline. To consolidate this interpretation of the syntax matching, we use semantic similarity metrics, specifically BERTScore.

Table 1.
Performance Comparison of Baseline Llama 2 and ChatGeoAI using the CodeBLEU metric.
ChatGeoAI outperforms the baseline Llama 2 model in both BERTScore and ROUGE-L metrics, as depicted in Table 2. BERTScore, which uses BERT embeddings to evaluate similarity, shows a 4-point increase in recall for ChatGeoAI, suggesting it generates a broader range of relevant content compared with the baseline. Precision also improves, though less significantly. This suggests that the exactness of the generated instances remains relatively closer to the baseline, even if ChatGeoAI generates a wider range of relevant content or code syntax. The achieved value of F1-scores for BERTScore, which is 83.56%, demonstrates its balanced improvement in recall and precision over the baseline. It also reflects good performance, as scores above 80% are usually considered excellent.

Table 2.
Performance metrics comparison between Baseline Llama 2 and ChatGeoAI.
Rouge-L reflects the ability of the model to produce sequences of words that match the reference text by measuring the longest common subsequences. ChatGeoAI also outperformed baseline Llama 2 in the recall of Rouge-L metric (36.71% vs. 32.53%), suggesting that ChatGeoAI is better at generating sequences of words that match those in the reference text with quite better precision of 29.66% (vs. 25.38%). The F1-score of the ROUGE-L metric, at 32.81%, indicates a moderate degree of sequence overlap with the reference code. Typically, ROUGE-L scores range between 20% and 50%, with higher scores in this range achievable for simple and generic programming tasks such as those in the CoNaLa dataset [55].
To summarize, ChatGeoAI demonstrates slight to significant improvements over the baseline across all metrics. In addition, the high BERTScore and decent syntax and dataflow sub-metrics of CodeBLEU indicate good semantic understanding, structure, and logic, which signifies that the generated code can effectively capture the intended functionality despite differences in implementation details. Moderate scores in the N-gram matching component of CodeBLEU, ChrF, and ROUGE-L show the acceptable structure of the code but also some fine-grained variability. This variability is likely due, to some extent, to the expected differences in tokens, variable names, and coding style, which are typical due to the flexible nature of coding. In the next section, we will evaluate the impact of this fine-grained variability on the correctness and executability of the generated code.
4.2. System Performance Analysis
The comparative evaluation between Baseline Llama 2 and ChatGeoAI highlights significant enhancements in the performance of ChatGeoAI across various metrics, as shown in Table 3. ChatGeoAI demonstrated a superior initial success rate of 25% on the first trial, a notable increase from the 15% baseline of Llama 2, indicating its enhanced ability to accurately process queries on the first attempt due to advanced NLP capabilities. Furthermore, ChatGeoAI required fewer average trials to achieve success, with only 8 compared with the 14 of baseline Llama 2, suggesting better efficiency in refining and correcting user queries through iterative interactions. This efficiency is critical in reducing user frustration and increasing engagement. Additionally, ChatGeoAI showed a lower rate of permanent failures at 20%, as opposed to 30% for Baseline Llama 2, reflecting its superior error handling and adaptive learning mechanisms that effectively manage complex or ambiguous queries. Overall, these improvements mark ChatGeoAI as a more robust, user-friendly system and valuable for practical applications where quick geospatial analysis is required.

Table 3.
Comparative performance analysis of Baseline Llama 2 and ChatGeoAI on Geospatial Query Execution.
4.3. System Demonstration
In this section, we present the results obtained from running the system using the queries designed for system evaluation. Due to space constraints, the results of just three queries with different levels of complexity (easy, intermediate, and difficult) have been described as examples. Further demonstrations have been provided in Appendix A. The complexity of the query is determined based on three criteria: the number of steps, the complexity of the workflow, and the complexity of the underlying algorithm. For each query, we first detail the procedural steps executed within the code to complete the task. Next, we present the resulting map visualizations to demonstrate how users can visualize the output. This comprehensive approach enables a nuanced analysis of the system’s performance across different levels of query complexity, providing insights into both its capabilities and limitations.
Here is a detailed step-by-step breakdown of how the ChatGeoAI system would process the query “I need a list of pharmacies which are within 1000 m of the Grand hotel in Lund, Sweden”:
- User Interface Component: The user enters the query into the natural language input module: “I need a list of pharmacies which are within 1000 m of the Grand hotel in Lund, Sweden”.
- Task Definition: The system captures the user’s geospatial analysis task specification: finding pharmacies within a specific distance from a landmark.
- Query processing: preprocessing and normalization using NLP techniques will transform the raw query into a structured and clean format. It performs the following operations to standardize language variations: Lowercasing, tokenization, removing stop words, lemmatization, removing punctuation, and normalization. The output is:
[“need”, “list”, “pharmacy”, “within”, “1000”, “meter”, “grand”, “hotel”, “lund”, “sweden”]
- 4.
- Named Entity Recognition (NER): the system identifies and extracts entities from the preprocessed text. The output is:
“Countries: Sweden
Cities: Lund
Specific Locations: Grand Hotel in Lund
Commercial and Healthcare Entities: Pharmacies
Proximity/Spatial Relationships: Within 1000 m”
These entities help contextualize and understand the query within WorldKG, enabling accurate and relevant results based on the spatial and relational context provided.
- 5.
- Enriched Context-Aware Query: Integration of the original query with extracted named entities.
- 6.
- Llama 2 Code Generation: The enriched semantic context is fed into fine-tuned Llama 2 to generate the necessary code for geospatial analysis.
Table 4 shows the procedural steps executed by the fine-tuned Llama2 of ChatGeoAI to provide a response to the user. The complexity level of the query is considered easy because it has limited (six) steps in one chain without any hierarchical structure in the workflow, and only basic GIS operations are needed to run the analysis.

Table 4.
Procedural code steps for identifying pharmacies within 1000 m of the Grand Hotel in Lund, Sweden.
Looking at the 5th step, in Table 4, an interesting observation is that the generated code has calculated the distances from the Grand Hotel to the pharmacies and incorporated this information as a field within the newly created layer (memory layer, as a temporary layer), even if it is not explicitly requested by the user. The procedural steps are responding accurately to the user intent. Regarding the code itself, there is potential for further optimization from an expert’s perspective. For instance, instead of iterating over all features, a spatial index could be created or utilized for the pharmacies’ dataset. This approach will allow faster identification of those within a certain radius of the Grand Hotel. Additionally, experts might refine the process by adding a spatial query after applying the initial buffer to ensure that only pharmacies genuinely within 1000 m are considered.
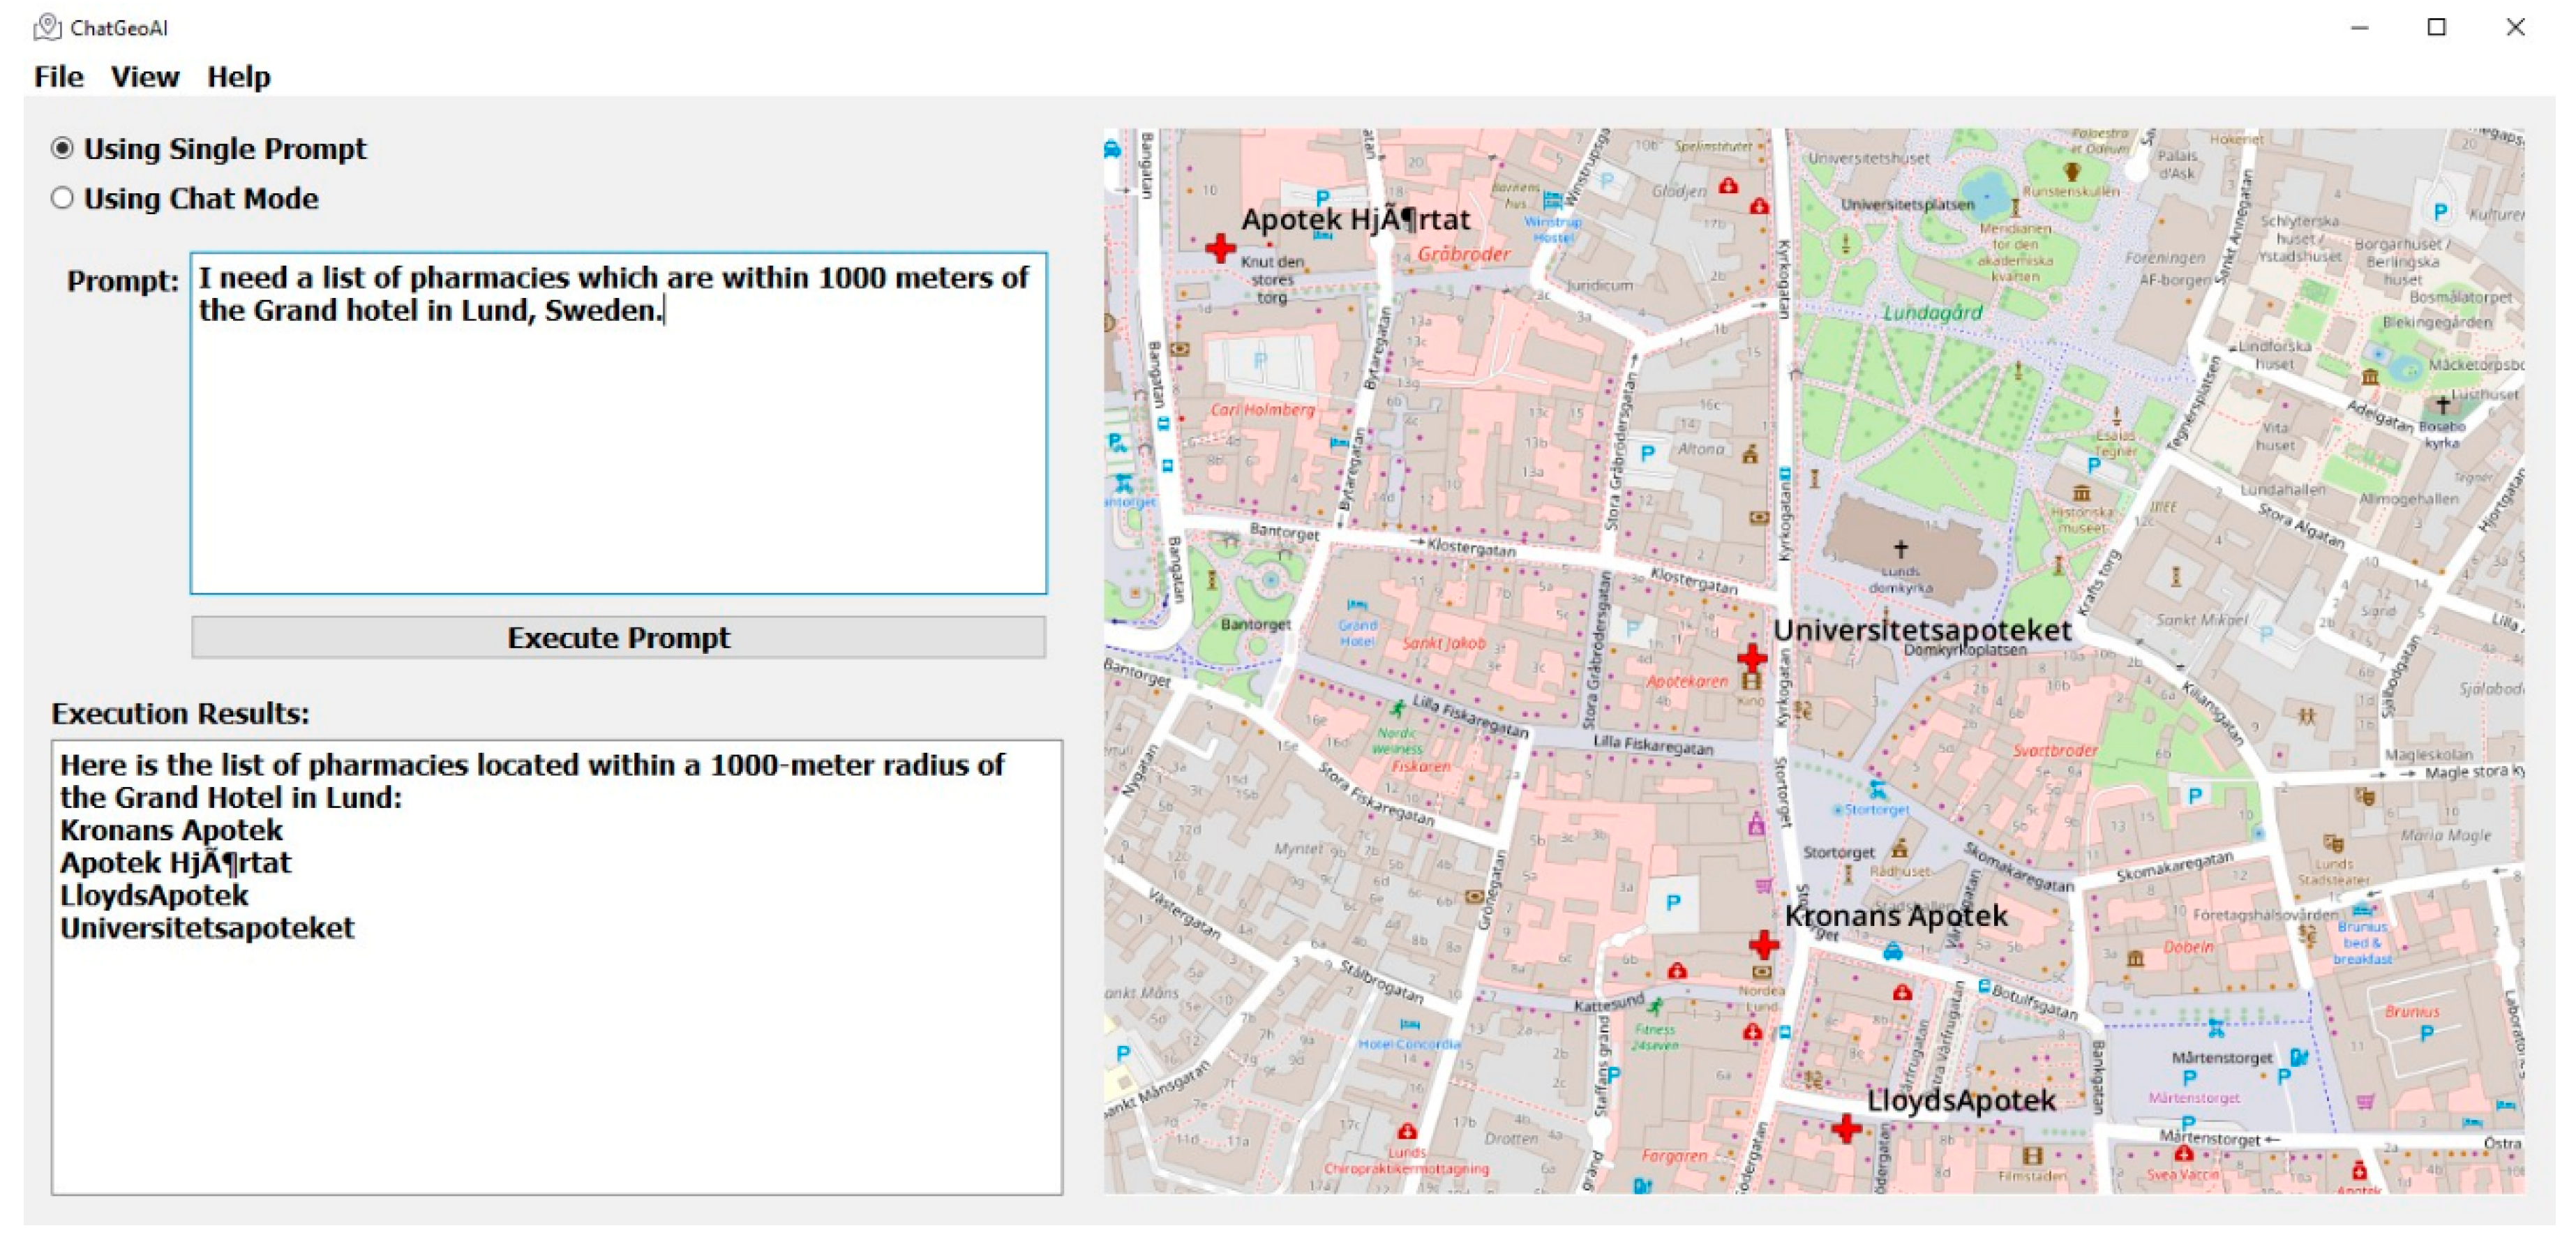
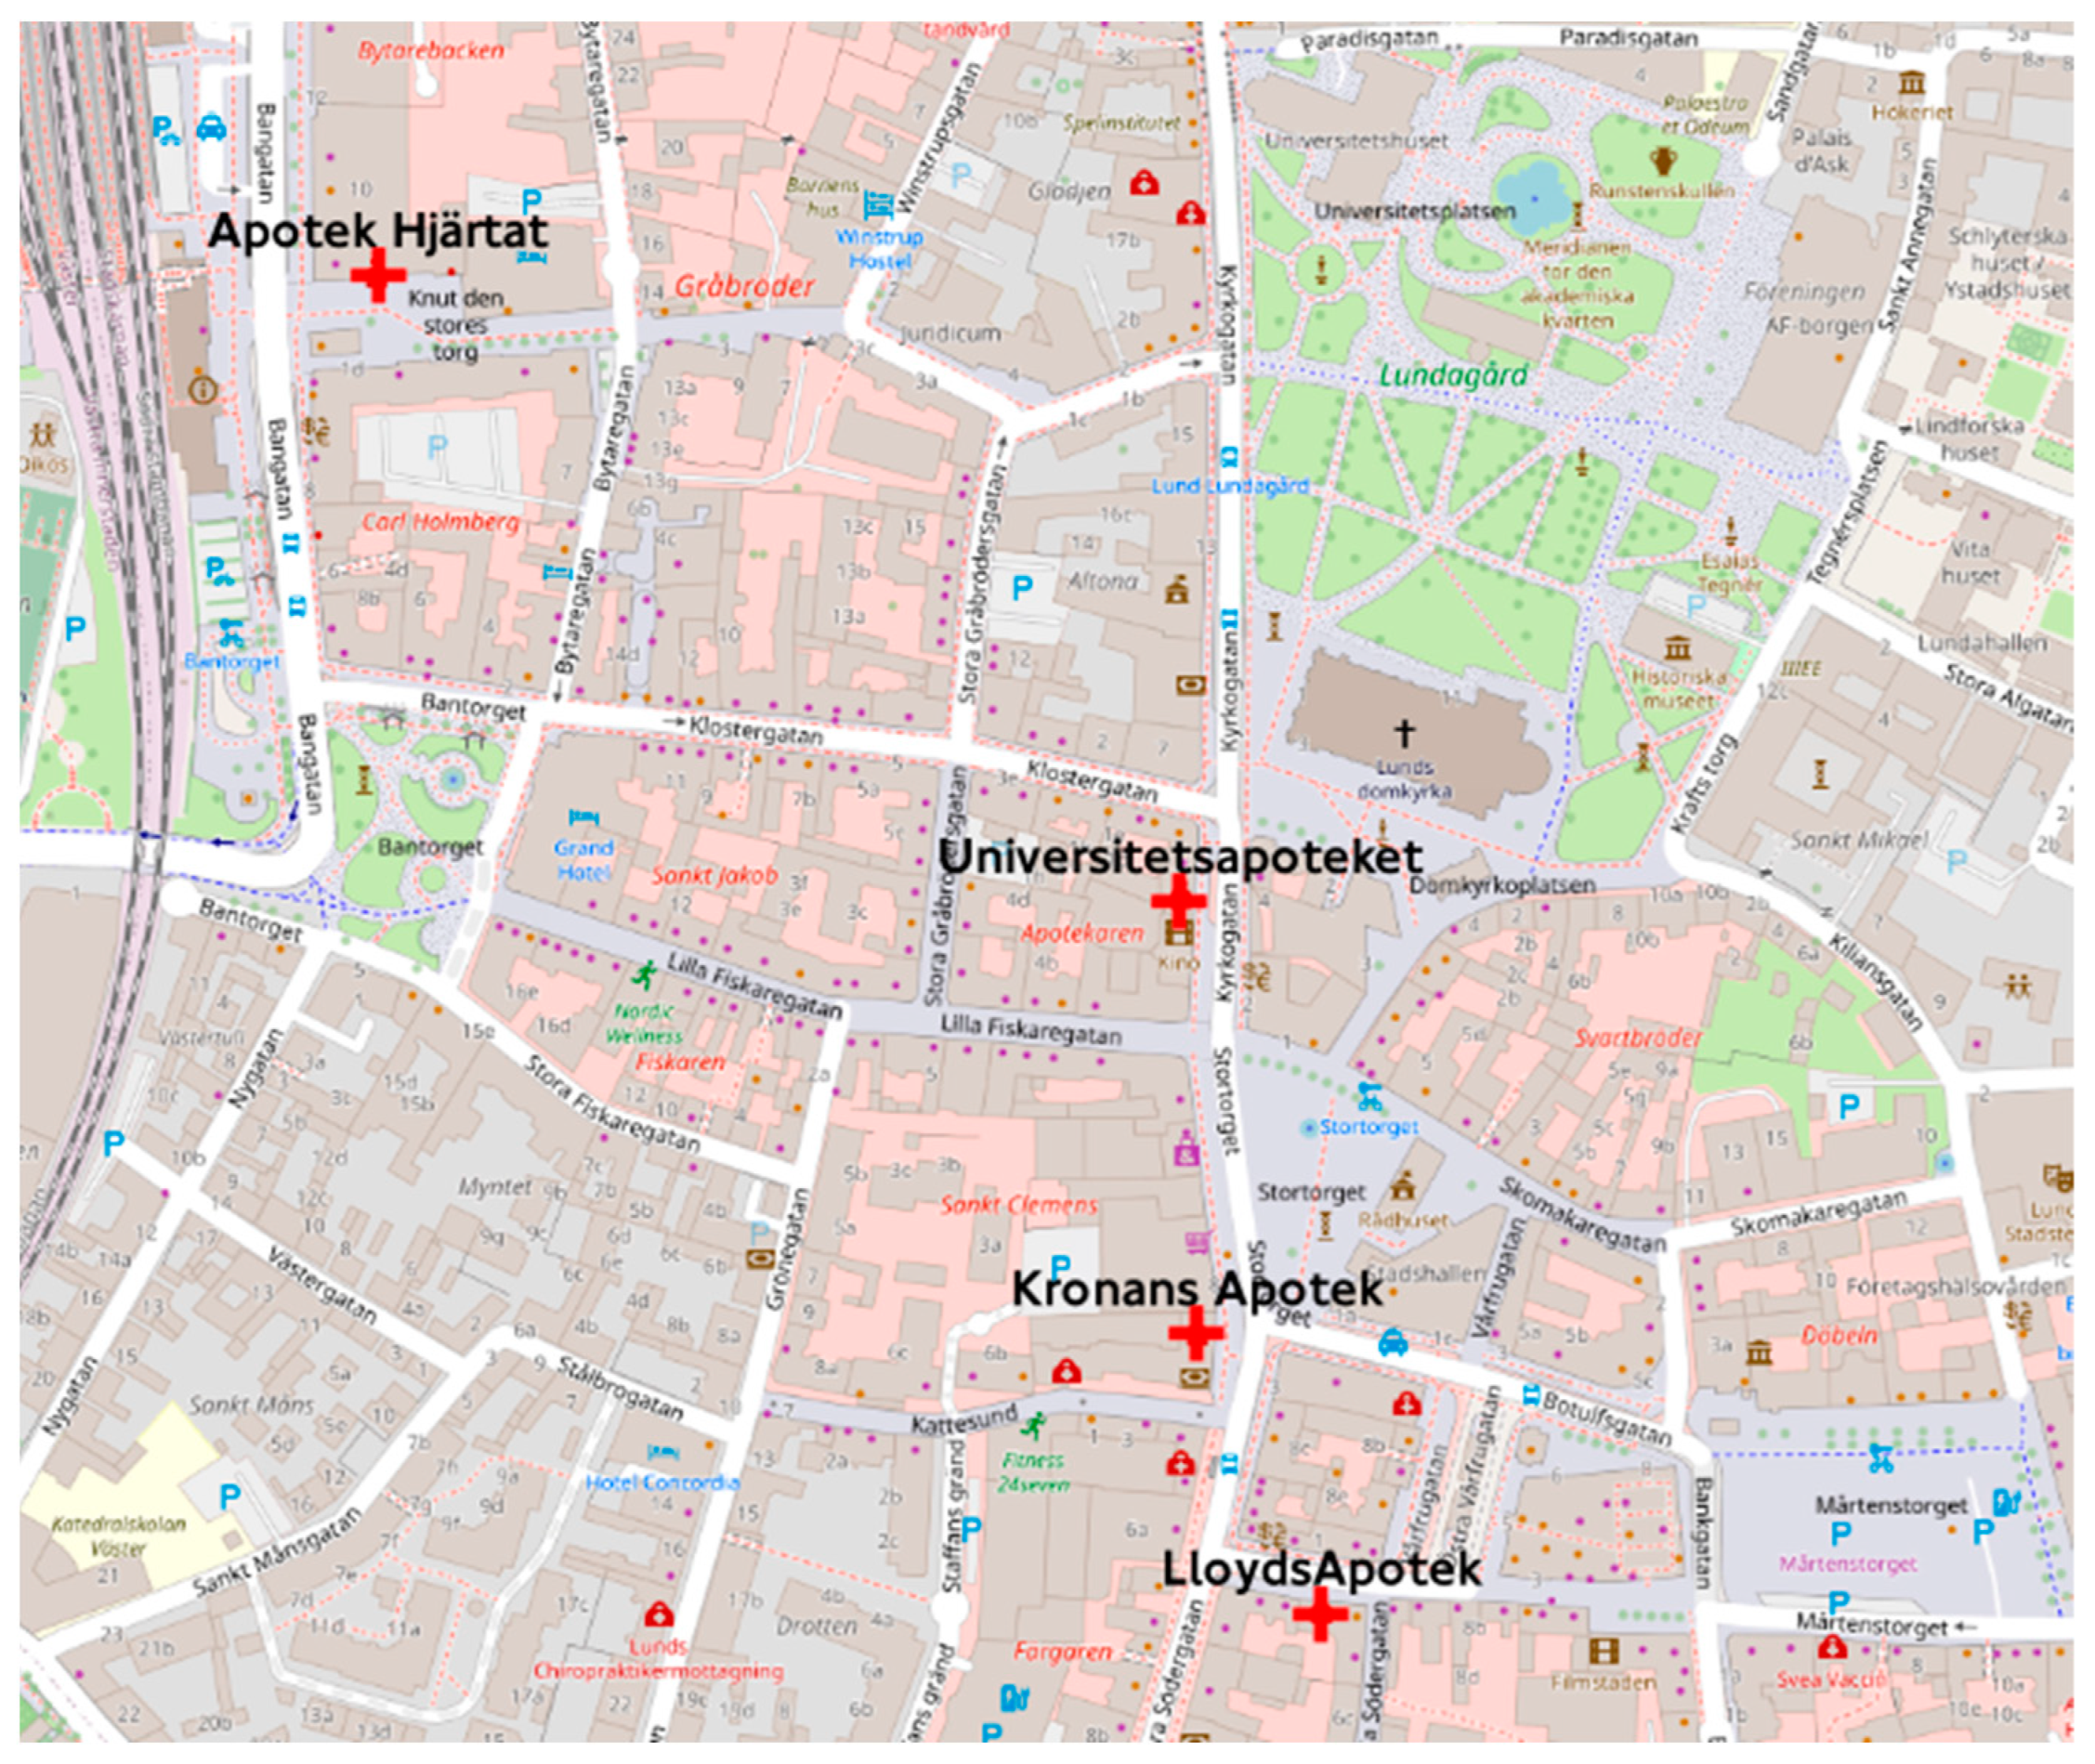
Figure 5 shows the output map in the ChatGeoAI user interface. The names of the pharmacies have been printed in the output text area of the application and a generated map, on which the location of pharmacies have been highlighted, is also presented to the user. The system has been able to generate and perform the required geospatial analysis to provide a response to the query. Experts can achieve similar results by using GIS tools. In QGIS, for example, the Identify Features tool can be used to locate and select Grand Hotel. Then, the creation of a 1 km buffer around the hospital can be achieved using “Vector > Geoprocessing Tools > Buffer”. Then, the list of pharmacies can be obtained using “Vector > Research Tools > Select by Location” to select pharmacy features within the buffer. Finally, one can add labels and adjust symbology as desired. To list the names of selected pharmacies, the user can export them from the attribute table. Figure 6 shows the result of this manual process, which closely resembles the outcome achieved by the proposed system when compared.
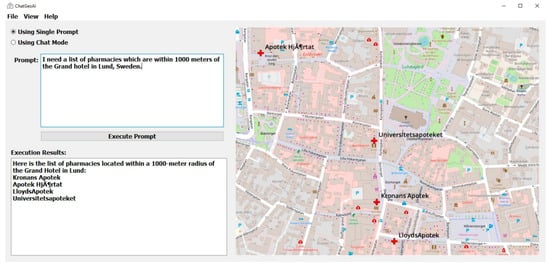
Figure 5.
Results on the desktop application show the map with pharmacies within 1000 m of the Grand Hotel.
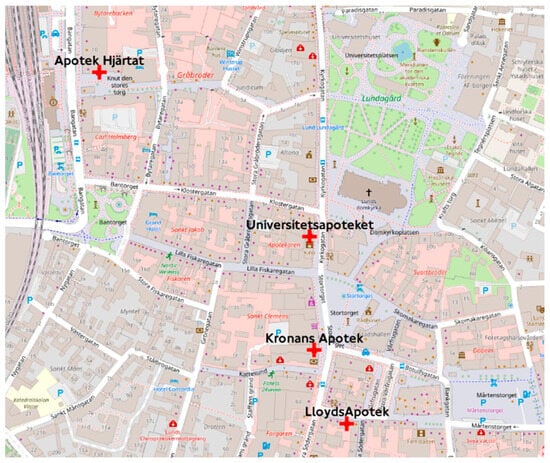
Figure 6.
Map showing the pharmacies within 1000 m of the Grand Hotel using a GIS tool (i.e., QGIS).
Table 5 illustrates a query with intermediate complexity, entered by the user, and the procedural steps executed by the system to provide a response to the user. The complexity of the query is considered intermediate because although it involves limited steps and uses a pre-developed path optimization algorithm, the system should cope with some challenges, such as determining the type of the required data (network data), defining the right inputs and arguments for the functions and generating and saving the expected output properly. In addition, it involves a workflow that is more complex than the first query with additional data processing.

Table 5.
Routing Analysis: Determining the shortest path between two attractions in Lund, Sweden.
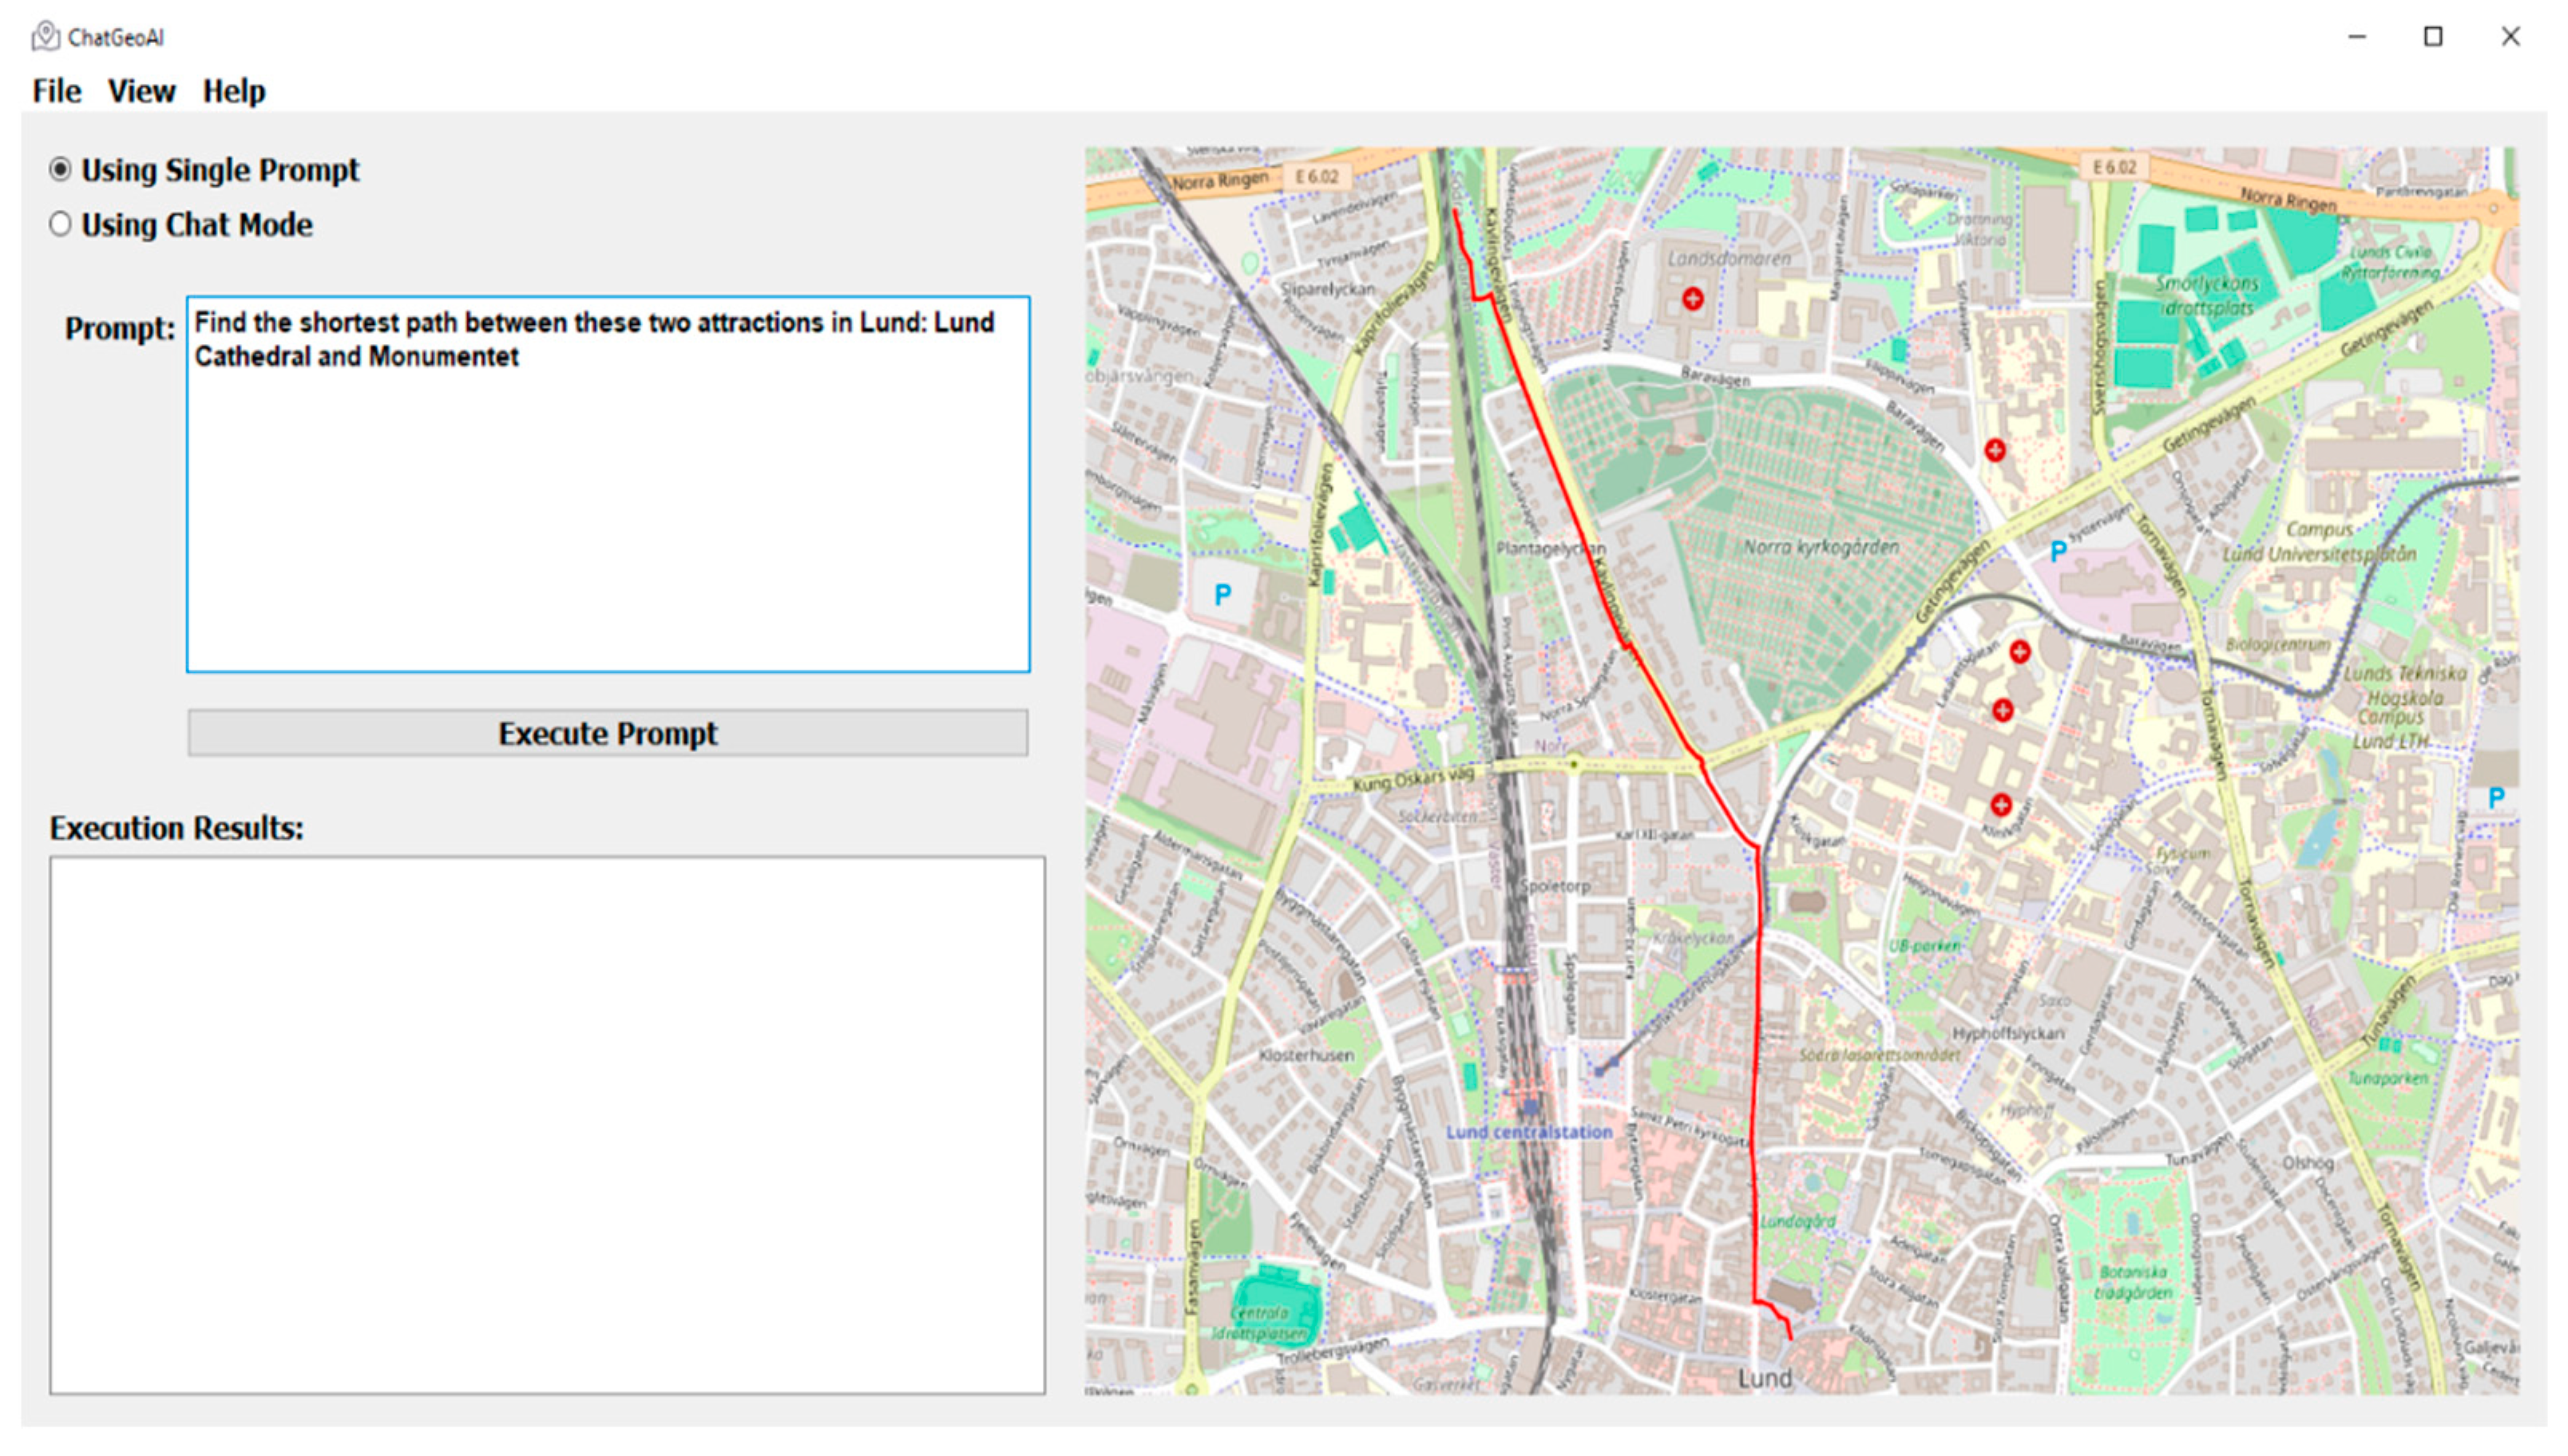
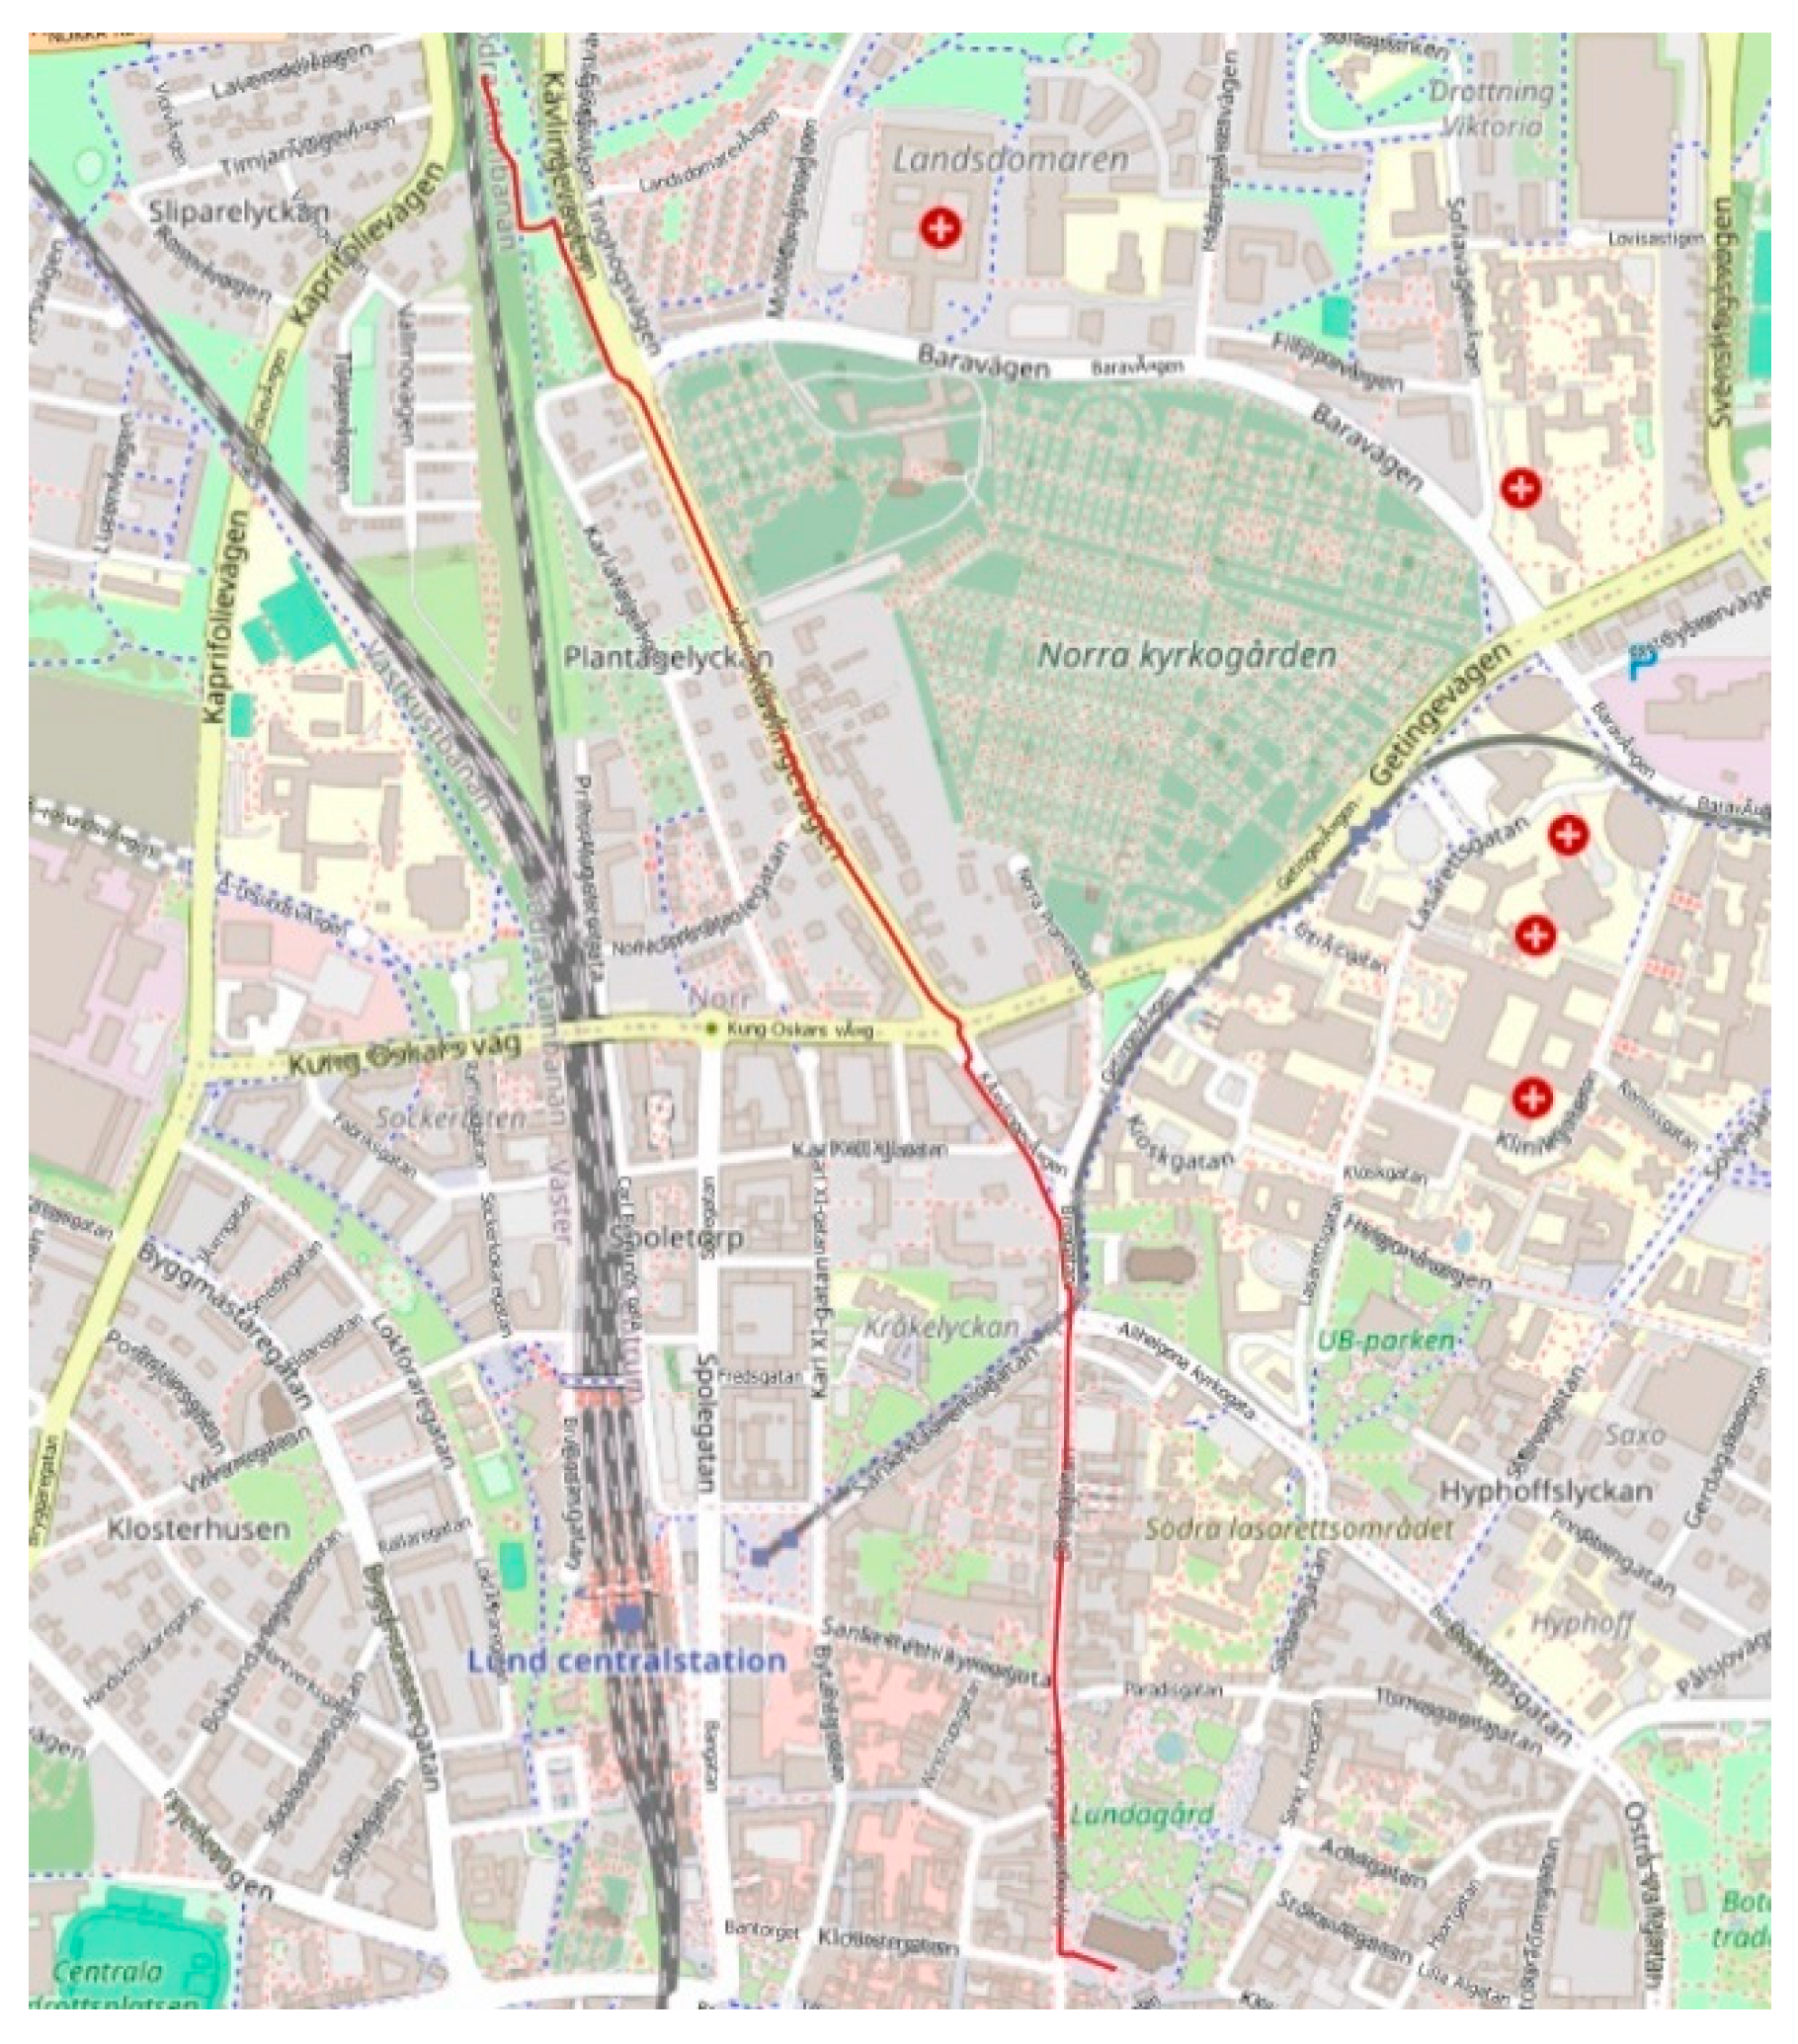
The code generated by the system successfully achieved the task of finding the shortest path between two attraction sights, Lund Cathedral, and Monumentet, using the PyQGIS library. For other queries, ChatGeoAI uses the local data downloaded from OSM. To run this query, the model contacted the OpenStreetMap to retrieve the OSM network via the OSMnx library for Lund, Sweden. This capability is already defined in Llama 2, demonstrating its ability to access external geospatial datasets when needed. It then employs NetworkX to analyze the street network as a graph, enabling efficient computation of the shortest path between Lund Cathedral and Monumentet. An emergent behavior of the system is that it knows the coordinates for Lund Cathedral and Monumentet and uses them directly, bypassing the need to search local datasets.
The transportation mode in the code is set to “all” by the ChatGeoAI model for the network type parameter, implying that the network comprises all the edges (links) that are suitable for walking, driving, and biking. So, the shortest path shown in Figure 7 is a type of multimodal path. This outcome is understandable, given that the query does not specify the mode of transportation. However, it would enhance user experience if the code could visually distinguish between walking and driving segments along the route depicted on the map. By explicitly specifying the transportation mode in the query, such as “by car,” the system loads only the driving network from OSMnx, thus enabling the identification of a new route tailored specifically for driving conditions. The same thing can be said for the criteria for determining the shortest path. Without explicit mention of alternative criteria such as travel time, the system considers only distance as the criterion for determining the shortest path. Table 6 shows a query with a high level of complexity and the procedure for performing the analysis.
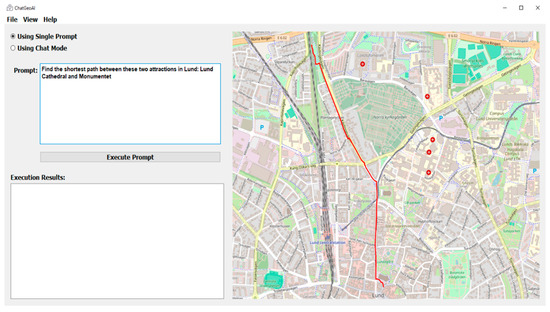
Figure 7.
Shortest path between Lund Cathedral and Monumentet.

Table 6.
Geospatial recommendation analysis: Recommending hotels based on multiple criteria.
To achieve similar results using QGIS software (version 3.30), the user can use the “Shortest Path (Point to Point)” tool from “Processing > Toolbox > Network analysis”. He should configure the tool by selecting the road network layer as the Input Layer and choosing the start and end points from the respective layers. Additional parameters, such as cost or direction, can be specified if needed. Finally, he can click “Run” to generate the shortest path, which will be added as a new layer in the project for visualization. Figure 8 shows the result obtained using QGIS which is quite similar to the one produced by ChatGeoAI, except for short segments such as in road intersection and the starting point, which is less accurate in the ChatGeoAI output.
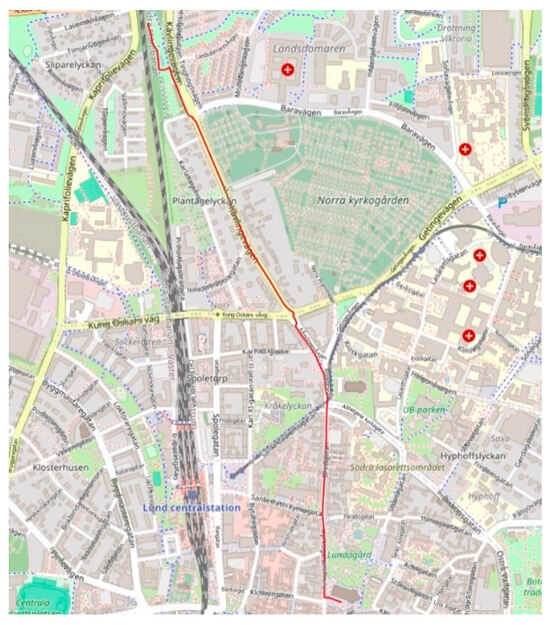
Figure 8.
Shortest path, obtained using QGIS, between Lund Cathedral and Monumentet.
To provide a response to this query, multiple analyses should be conducted including “query by attribute” and “spatial analysis” as well as “handling fuzzy proximities”. The generated code effectively handles multiple criteria for hotel recommendation. It filters hotels based on star ratings, ensuring that only those with four or five stars are considered. Additionally, it performs spatial analysis to determine proximity to highways, train stations, and shopping centers, which enhances the relevance of the desired hotels by the user. By leveraging spatial relationships, the code accurately assesses the proximity of hotels to key amenities such as train stations and shopping centers. The system sets a threshold of 500 m as the maximum distance for a hotel to be categorized as “close” to an amenity. Conversely, distances beyond 1000 m are classified as “away” in the solution. Interestingly, the system returns a message to the user indicating that the chosen distances can be customized based on the user’s preferences. The result is shown in Figure 9. Considering the above, the complexity of the query is high because it involves multiple steps that should be run in a complex hierarchical workflow to produce the results. In addition, the system should understand and decide about fuzzy variables.
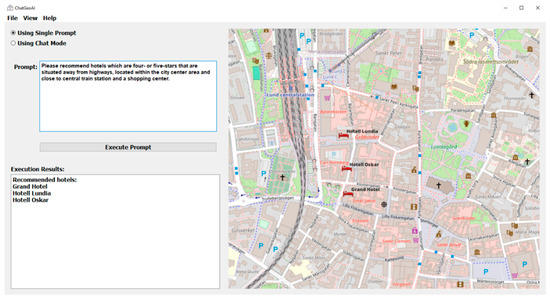
Figure 9.
Recommended hotels based on the user’s query.
Using the same distances used by ChatGeoAI, results can be obtained using QGIS, as depicted in Figure 10. The manual process involves filtering hotels by star rating, selecting those within the city center boundary, and creating buffers around the central train station and shopping centers to identify nearby hotels. After refining the selection by intersecting these buffers, a highway buffer is applied to exclude hotels near highways. The resulting layer contains hotel polygons that can be labeled, symbolized, or converted into point features with icons for better visualization.
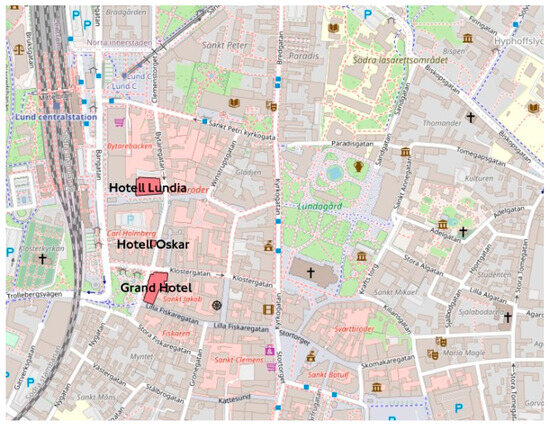
Figure 10.
Maps displaying hotels meeting the user’s requirements.
In chat mode, users can iteratively refine their results, adjust parameters, and introduce additional constraints to their original queries without needing to restate the entire context. For example, the user might initially ask the system the following query: “Can you find all playgrounds in Lund? Please count these playgrounds and highlight them on the map”. Subsequently, he obtains the results as shown in Figure 11. Then, in the same chat session, he can refine the query to, “I am interested only in the playgrounds that are located within or intersecting with parks? Please list their names and highlight these playgrounds on the map”. The system retains all previous interactions in the session, allowing it to understand that the playgrounds should still be in Lund, even though the location is not reiterated in the follow-up query. This session memory simplifies the user experience by enabling the addition of specific constraints while the system seamlessly maintains the broader context established in earlier exchanges.
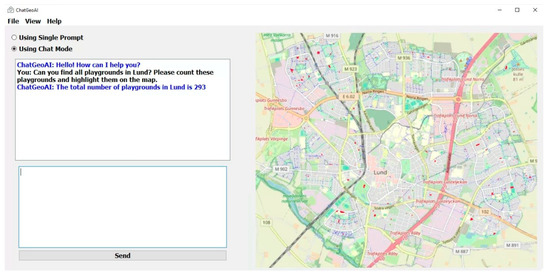
Figure 11.
Playground distribution in Lund.
This interactive setup not only aids in honing the query to meet specific needs but also allows the fine-tuned Llama model to generate the correct code and expected results. This is shown by the continuation of the example. When the user submits the refined query asking for the playgrounds that are located within or intersecting with parks, some errors can be encountered while running the generated executable script. The first error, in this specific case, was an AttributeError due to incorrectly accessing feature attributes. As shown in Figure 12, no results are displayed, and an error was caught and returned by the system in the chat. The user has only to copy the error message, which is returned by the system and paste it back into the chat. The system will then generate a new code to correct the error. After fixing this issue, another AttributeError occurred because QVariant objects were not converted to strings before calling lower(). Users only need to send back the error messages, and the system will provide the corrected code until it works and the desired results are achieved, as shown in Figure 13.
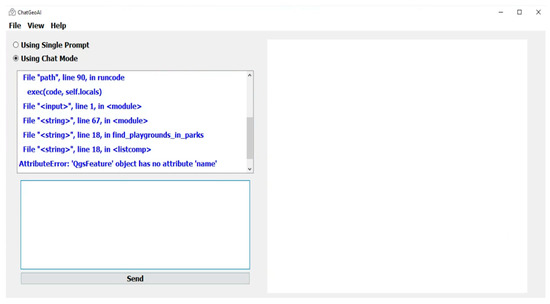
Figure 12.
No results were returned due to AttributeError.
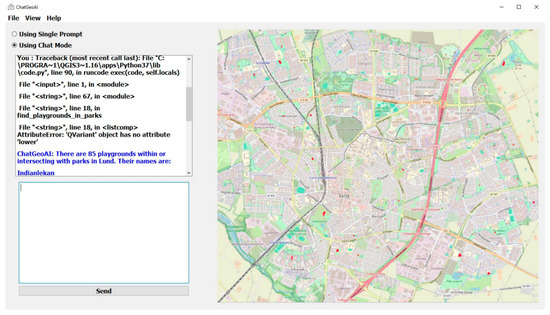
Figure 13.
Playground areas in Lund parks.
If any syntax or semantic errors occur, they are displayed in the results area. Users can then copy and paste the error message back into the chat. The Llama model, which has the ability to recognize and understand these errors, processes the feedback, automatically corrects the code, and the system executes it again in the background. This feedback loop significantly enhances the model’s accuracy and the user’s ability to achieve desired outcomes efficiently. Similarly, the user can refine the results if they are not as expected. In this example, if the user considers that the system incorrectly counted individual features labeled as “playground” in OSM data, which led to over-counting when multiple features represented the same playground, then he can simply notify the system. Attempts to improve the code using DBSCAN from ‘sklearn’ failed due to the library not being installed, and subsequent efforts with QGIS’s native DBSCAN faced parameter configuration issues until the desired result was achieved.
5. Discussion
The presented performance analysis reveals that ChatGeoAI exhibits a high failure rate of 75% from the first instance. While this statistic initially appears disappointing, it underscores a broader challenge within the field—currently, LLMs struggle with generating correct executable code for GIS analysis, reflecting intrinsic limitations in their application to spatial data processing. Despite these limitations, the results should not be viewed purely in a negative light. In fact, in the context of software development, coding is inherently prone to errors requiring frequent debugging, even for skilled human programmers. Thus, the a need, at least in this stage, for iterative testing and refinement. Looking forward, the integration of an autonomous self-correcting mechanism could significantly enhance system performance by allowing the model to learn from its errors and dynamically improve its code output, although this development lies outside the scope of the current paper and is suggested as a primary direction for future research. In fact, Li and Ning [35] tried to develop an autonomous GIS system having a quite similar purpose. The system first decomposes the spatial problem into a workflow of operations; each represented as nodes in a solution graph. The system then generates Python code for each operation, assembling these into a complete program that executes the entire spatial analysis. However, the system is not fine-tuned on geospatial analysis tasks and lacks incorporated semantic knowledge, such as ontology, specific to geospatial analysis.
Furthermore, supplementing the system with a repository of pre-defined, ready-to-use codes with a complete list of arguments for various GIS operations could potentially increase the success rate. To solve a complex task, the LLMs have to understand the query and subsequently build a series of operations from the pool. This approach would streamline the code generation process by providing reliable building blocks that reduce the complexity the model needs to handle directly, thus paving the way for more accurate and robust GIS application development through advanced AI models. However, this approach, similar to that used by Zhang et al. [38], has certain limitations. Relying on a predefined set of operations could restrict the LLM’s flexibility and creativity, and therefore, it would potentially overlook more efficient or accurate solutions outside of it. In addition, keeping this pool comprehensive and up-to-date would be both challenging and resource-intensive. Therefore, a sounder solution could be a hybrid approach where the system should primarily rely on the method introduced in this paper to ensure the coverage of a wide range of tasks and, in case of failure, switch to the aforementioned alternative by drawing a solution from the operation pool. This approach presents one of the most compelling perspectives of this paper. Another straightforward hybrid approach is to use LLMs for natural language processing while utilizing GIS tools for processing and analysis. However, the role of LLMs in this method is limited and strictly confined to the understanding of the user intent and does not involve any code generation.
It is important to note that widely used mapping services do not fully integrate advanced NLP for interaction with normal users, and they are not designed for geospatial analysis. For example, Google Maps supports natural language-like input through keyword searches and voice commands, but it is strictly limited to handling structured queries such as “restaurants near me” or “navigate to the nearest gas station”. It fails to respond to the type of queries presented in this paper.
The performance analysis of our system also reveals its proficiency in various aspects of geospatial query generation, spanning from geometry identification to error handling and validation. This performance is notably achieved by the robust capabilities of the Llama 2 model which are also further enhanced through meticulous fine-tuning. Here, we delve into a comprehensive examination of the system’s capabilities from different perspectives while mentioning some of its limitations or failures that call for further research and studies.
Geometry identification: the system can parse and understand textual descriptions or instructions that specify different types of geometry. For example, it can recognize phrases such as “find parks,” “identify roads,” or “locate buildings,” indicating different types of geometries.
Feature geometry analysis: Given a specific geospatial analysis task, the system can generate code that checks the geometry type of features before performing operations on them. For instance, it can generate code that distinguishes between polygons, multilines, points, etc. and applies appropriate operations or conditions based on the geometry type.
While the system demonstrates accuracy in many cases, there are certain scenarios where it falls short. One such instance occurs when the system attempts to create a new “Point” layer to accommodate features with diverse geometries. In such cases, the generated code may make assumptions about the uniformity of feature types, leading to errors when dealing with polygons. For instance, the code may incorrectly place markers for polygonal features, failing to represent them with their centroids accurately.
Handling different geometries: The generated code can include logic to handle different geometries effectively. For example, when identifying parks or green spaces, it can filter features based on their geometry type to ensure that only polygons are considered. Similarly, when analyzing road networks, it can focus on features with line or multiline string geometries.
Error handling for incompatible geometries: In cases where the specified operation is incompatible with certain geometry types, the system can potentially generate error-handling mechanisms to address such situations. For example, it can include conditional statements to skip features with incompatible geometries or provide informative error messages.
Attribute queries: The model can understand and process queries related to attribute data associated with geographic features. For example, it can filter features based on attribute values such as names, stars, and/or amenities. However, it may struggle with ambiguous attribute names or aliases, leading to incorrect filtering or retrieval of features. For example, in OSM, “highway” is a tag for all types of roads (including primary, secondary, and tertiary roads), while in natural language, “highway” is a synonym to, e.g., “motorway”. So, when a user asks to find attractions near a “highway,” the system may be confused with selecting either roads with OSM highway tags or roads that are classified conventionally as highways (motorways).
Spatial relationships: The system can comprehend instructions involving spatial relationships between features, such as proximity, containment, and intersection. This enables it to perform tasks such as finding neighboring features and identifying features within a certain distance. When dealing with queries that include fuzzy relations, such as “near to,” the system suggests, for example, 500 m as an approximation distance and runs the analysis accordingly. But at the same time, it returns a message to the user that the selected distance value (e.g., 500 m) can be adjusted as needed.
Coordinate systems and projections: The model can identify the coordinate system of the map and create the output layers in that reference accordingly. So, the output results are correctly geocoded. However, we have noticed some incompatibility issues, for example the case when the model computes areas in degrees rather than conventional units such as square meters expected in the query. This disparity between user expectations, preferring areas in square meters, and the output in degrees may potentially cause confusion and misinterpretation.
Spatial operations: the model can generate code for various spatial operations, such as buffer analysis, intersection, union, difference, centroid calculation, area calculation, and length calculation, on-the-fly, to perform simple or complex geospatial analysis in response to a user query. However, the system still struggles with edge cases. For example, consider a scenario when a user requests the union of a neighborhood boundary and a park boundary which are overlapping as the park lies within the neighborhood. Despite this spatial relationship, when the model attempts to compute the union, it struggles to handle the shared boundaries accurately. Consequently, the resulting output may combine both boundaries incorrectly, potentially leading to flawed urban planning or resource allocation decisions.
In addition, the system typically does not incorporate spatial indexation, a technique crucial for efficient spatial data retrieval. The absence of spatial indexation led to prolonged computation times due to the exhaustive iteration through all features. Additionally, errors may occur, for example, when attempting to access elements using spatial indexation in PyQGIS, especially when the spatial indexation involves multiple layers.
Syntax accuracy: The system generally excels in producing code with correct syntax and can generate PyQGIS code with accurate function calls, variable assignments, and control structures. However, there have been instances where functions from older versions of PyQGIS were utilized with slightly different spellings.
Map styling and visualization: The system can assist in tasks related to map styling and visualization, properly. It can generate code for applying different styles, symbology, and labels to geographic features on a map. We just set the location of SVG files for the markers, and then the model had the capability to choose the most suitable symbol for each feature. The used icons have predefined colors, sizes, and paths, ensuring minimum visualization in the output maps. However, it is important to note that the primary focus of our manuscript is on the application of LLMs for GIS analysis rather than GIS visualization. This latter is an aspect that requires separate research and special attention as the system might encounter challenges in creating visually appealing maps with optimal legibility of labels and aesthetics. This challenge becomes particularly apparent when the output contains dense features, necessitating post-processing styling using predefined codes.
Data manipulation and processing: It can perform data manipulation and processing tasks, such as data conversion, merging, splitting, filtering, joining, and summarizing, on spatial datasets.
Error handling and validation: The system can generate code with error handling mechanisms to validate input data, check for errors, handle exceptions, and provide informative messages to users.
6. Conclusions
‘ChatGeoAI’ demonstrates the capability of utilizing LLMs to translate natural language queries into executable geospatial analysis codes. The system shows commendable adaptability in handling a wide spectrum of geospatial analysis tasks. Utilizing the Llama 2 model for code generation, enriched by contextually relevant inputs, ChatGeoAI can address diverse geospatial queries, ranging from simple location-based searches to intricate spatial analyses.
By seamlessly bridging the gap between geospatial analysis and intuitive natural language processing, ChatGeoAI democratizes access to sophisticated geospatial analyses for non-expert users across various sectors. Its integration into platforms such as hotel booking systems exemplifies its practical utility, enabling users to select accommodations based on spatial criteria effortlessly. Furthermore, its applicability can be extended to disciplines such as health, epidemiology, and disaster risk management, where proficiency in GIS may be limited among professionals. This facilitates using GIS in other fields.
While the current study lays a foundational framework for enhancing accessibility to GIS through AI, it represents an initial stride towards the ambitious objective of democratizing GIS accessibility for everyone. Although the reliability of system outputs was promising, studies are needed to refine further and enhance the quality and reliability of the outputs. Our future research will focus on expanding the system’s autonomy and robustness, particularly through the implementation of a feedback loop that corrects generated PyQGIS code based on errors returned by QGIS. Given the system’s potential for syntax and semantic coding errors, a continuous cycle of error correction can be initiated by analyzing the returned errors, thereby ensuring that the system iteratively refines its performance until the desired outcomes are attained. In addition, enhancing our system could significantly benefit from integrating Retrieval-Augmented Generation (RAG) alongside rigorous fine-tuning for the Llama model, particularly with the most used geospatial datasets such as OpenStreetMap. RAG’s incorporation of extensive domain knowledge, combined with specialized fine-tuning, promises to refine the system’s accuracy and depth in handling geospatial queries. This approach not only broadens the contextual understanding of the model but also tailors its capabilities to process and analyze prevalent geospatial data sources efficiently. Moreover, exploring fine-tuning techniques other than QLoRa used in this paper and comparing their efficiency may offer a pathway to increase the performance of the proposed system.
Author Contributions
Conceptualization, Ali Mansourian and Rachid Oucheikh; methodology, Ali Mansourian and Rachid Oucheikh; software, Rachid Oucheikh; validation, Ali Mansourian and Rachid Oucheikh; formal analysis, Ali Mansourian; investigation, Ali Mansourian; resources, Ali Mansourian; data curation, Ali Mansourian and Rachid Oucheikh; writing—original draft preparation, Ali Mansourian and Rachid Oucheikh; writing—review and editing, Ali Mansourian and Rachid Oucheikh; visualization, Ali Mansourian and Rachid Oucheikh; supervision, Ali Mansourian; project administration, Ali Mansourian. All authors have read and agreed to the published version of the manuscript.
Funding
This research received no funding.
Data Availability Statement
The datasets collected during the current study are available from the corresponding author on reasonable request.
Conflicts of Interest
The authors declare no conflict of interest.
Appendix A
The appendix supplements this study with additional queries and corresponding results, aiming to enhance the understanding of geospatial analysis outcomes. One such query involves identifying parks or green spaces exceeding an area of 50,000 square meters while concurrently containing more than 100 buildings within a 300-m radius. The system adeptly interprets spatial constraints related to both area size and proximity features, enabling it to identify parks that meet these criteria. Subsequently, it accurately retrieves parks that satisfy the specified constraints. It is worth mentioning that the system produces variants of the code depending on the query formulation. In instances where the code utilizes geometry.area(), the returned area is in degrees, potentially resulting in erroneous comparisons and inaccurate final results. However, when the generated code uses QgsDistanceArea(), it sets setEllipsoid(‘WGS84’) and the computed areas are in square meters as expected. This underscores the importance of meticulous attention to CRS transformations to ensure the accuracy and reliability of geospatial analyses.

Table A1.
Spatial analysis query combining proximity analysis and attribute (i.e., area) computation.
Table A1.
Spatial analysis query combining proximity analysis and attribute (i.e., area) computation.
| Query: Find the parks or green spaces which are larger than 50,000 sq.m and have more than 100 buildings within 300 m distance of them. |
| Measurement of park areas: iterate through layers in the project and filter out layers that are vector layers and have a field named ‘leisure’. Then, filter parks larger than 50,000 sq.m. Calculate buffer around parks: If the area of a specific park is greater than 50,000 sq.m, a buffer of 300-m is created around it. Check buildings within buffer: Count the number of buildings that intersect with the buffer zone around each park and check if there are more than 100 buildings. Create a memory layer with the found parks: Once the parks meeting the criteria are identified, the script creates a memory layer, adds markers representing these parks in their centroids and prints the list of their names. |
This query serves not only as a tool accessible to ordinary users but also as an initial step within an advanced geospatial analysis framework. Its outcomes play a vital role in comprehending park characteristics, their spatial relationships, and their potential implications on urban landscapes. Ultimately, such insights facilitate informed decision-making processes pertinent to park management and urban planning initiatives.
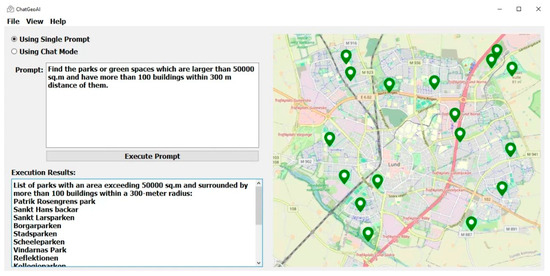
Figure A1.
Parks which are larger than 50,000 sq.m and have more than 100 buildings within their 300 m radius of them.
Figure A1.
Parks which are larger than 50,000 sq.m and have more than 100 buildings within their 300 m radius of them.
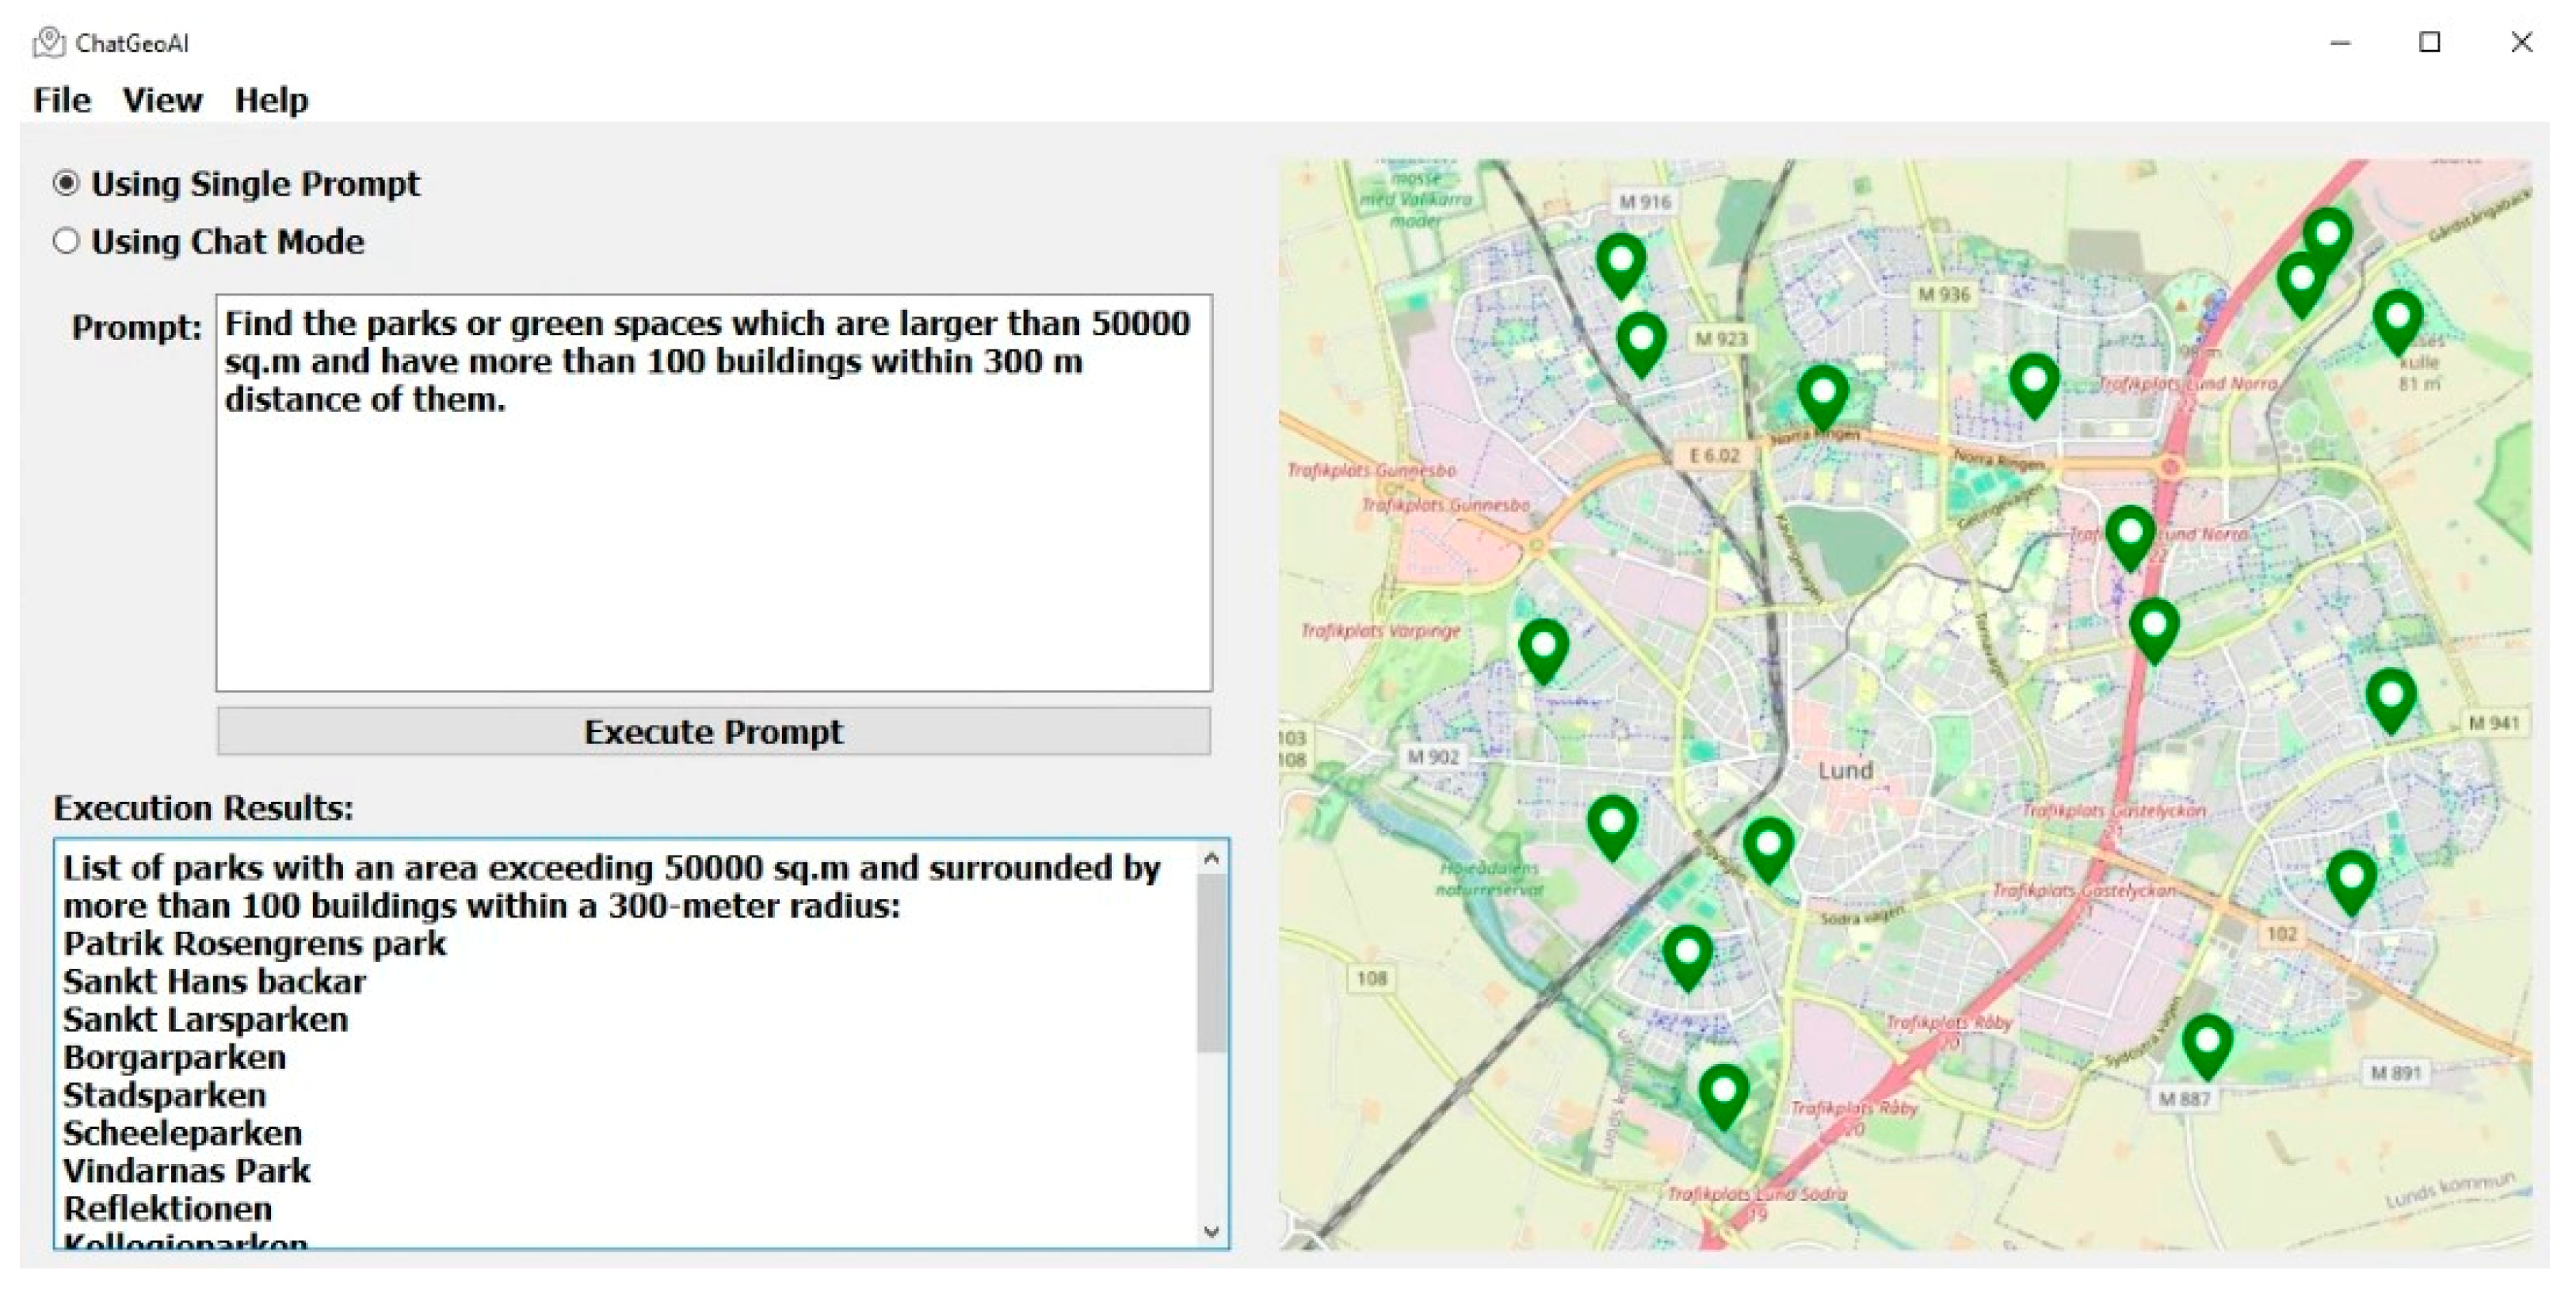
The second query aims to retrieve the schools situated within a 1-km radius of Skånes Universitetssjukhus hospital in Lund. This geospatial analysis task contributes to understanding the spatial relationship between hospitals and nearby features such as schools. Such insights hold significance for diverse advanced applications, including urban planning, healthcare accessibility assessment, and emergency response planning. However, it is essential to acknowledge that our focus remains primarily on micro tasks, rather than testing on complex professional analyses.
The system effectively identifies schools located within close proximity to the hospital, adhering to the specified distance threshold of 1 km (Figure A2). One observation within the code is its attempt to construct a list of hospitals, even if the query pertains to a single hospital. Despite this, the resulting list typically contains only one feature, which does not affect the accuracy of the results in this scenario.

Table A2.
Proximity analysis: identifying schools near selected hospital location.
Table A2.
Proximity analysis: identifying schools near selected hospital location.
| Query: Identify schools located within a 1-km radius of the hospital Skånes Universitetssjukhus in Lund. |
| Identify hospital features with names containing ‘Skånes Universitetssjukhus’: The code iterates through the map layers to find vector layers that contain features representing hospitals. It filters these features based on their name, specifically looking for hospitals with the name ‘Skånes Universitetssjukhus’. Calculate distances between hospitals and schools: For each identified hospital feature, the code loops through the map layers again to find vector layers containing features representing schools. Then, identify schools that are within a specified distance (1 km) from each hospital. Add markers for nearby schools: If a school is found to be within the specified distance from a hospital, and it has not been added as a marker yet, the code adds a marker for that school and prints its name. |
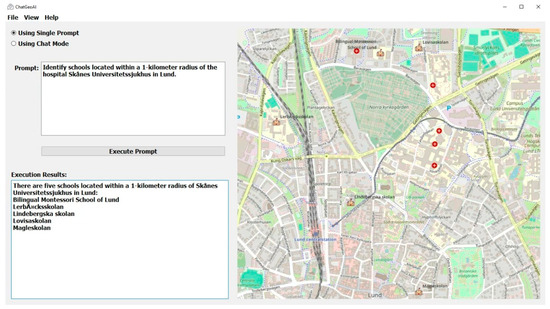
Figure A2.
Schools located within a 1-km radius of the hospital Skånes Universitetssjukhus in Lund.
Figure A2.
Schools located within a 1-km radius of the hospital Skånes Universitetssjukhus in Lund.
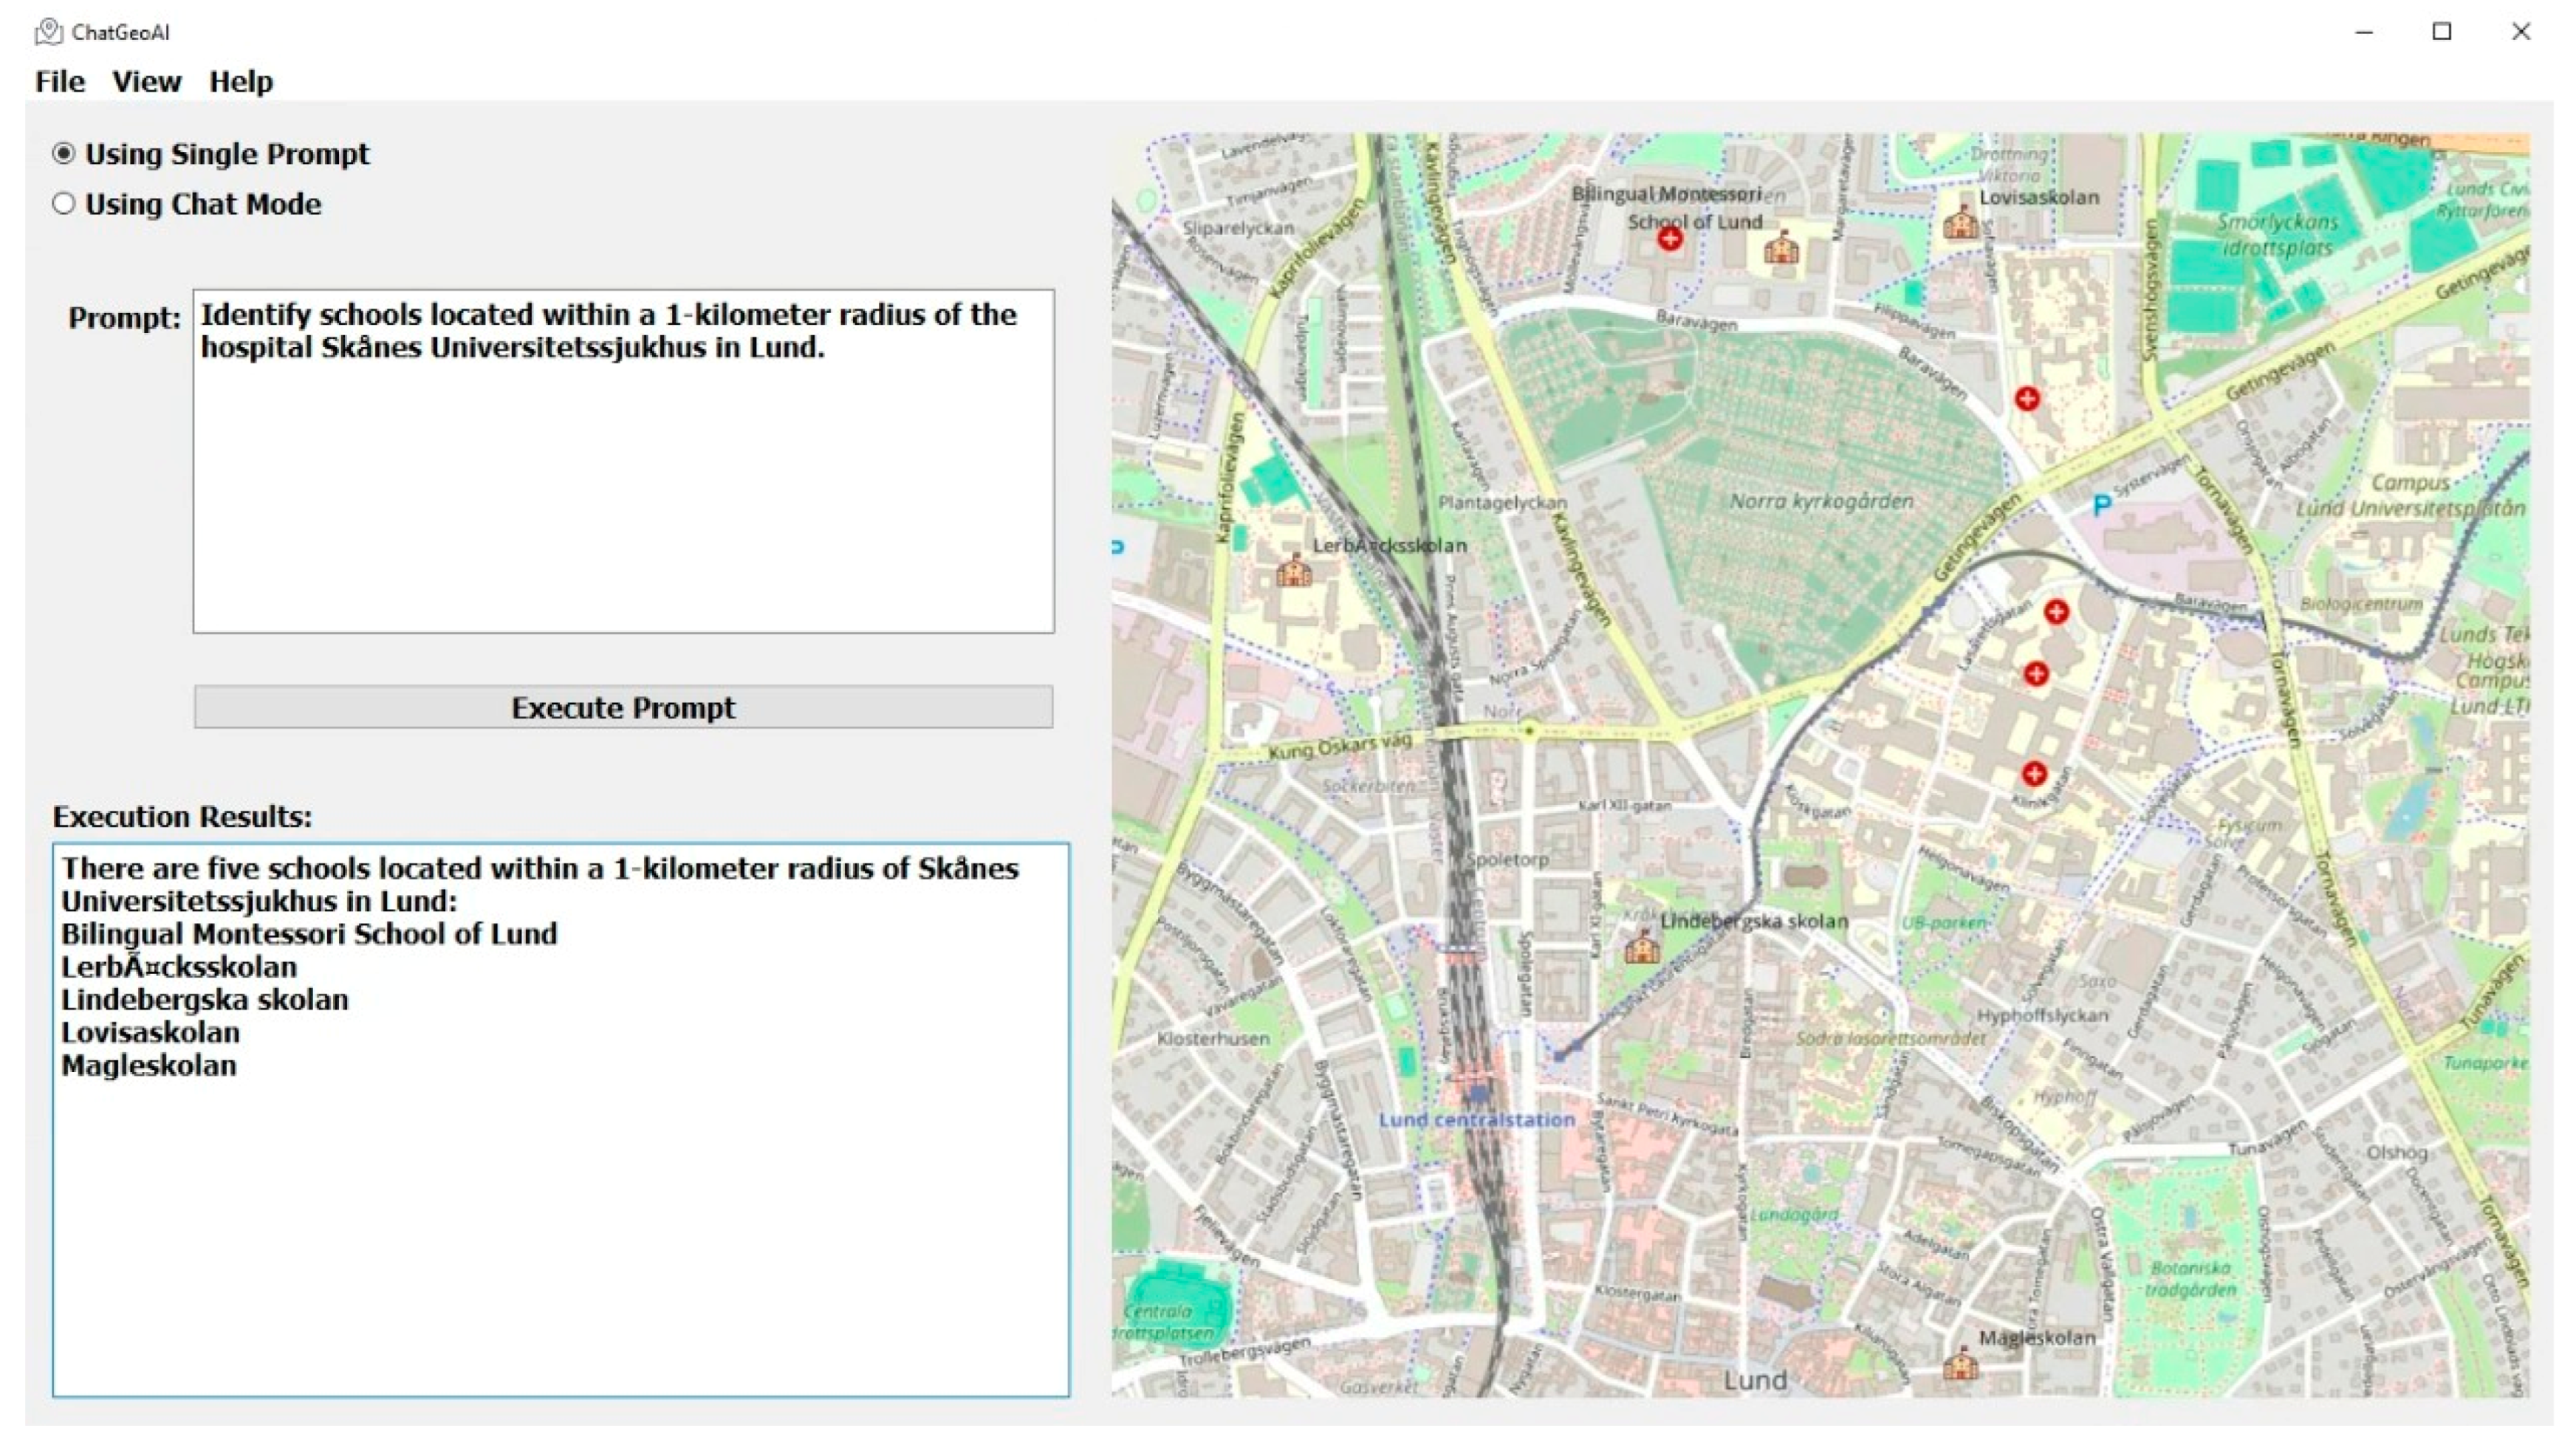
The third query is designed to evaluate the system’s capability to comprehend implicit queries expressed in informal natural language, thereby making it more user-friendly for everyday users. For instance, when a user submits the query “I want to eat in the centre of Lund”, it may not explicitly articulate a geospatial analysis or specify the features to be examined. However, leveraging contextual cues and system prompts, such as instructing Llama 2 to function as a geospatial analyst and utilize available data to generate executable code, enables the system to interpret the query effectively. In this context, the system may infer that the user is seeking information about restaurants located in proximity to the center of Lund, thus demonstrating its ability to translate implicit queries into actionable geospatial analyses (Figure A3). Without those high-level directions (i.e. system prompts), the system gives a general answer that the idea sounds great and asks how it can help the user.

Table A3.
Query expressed in informal/implicit language.
Table A3.
Query expressed in informal/implicit language.
| Query: I want to eat in the centre of Lund. |
| Iterating over layers and identifying restaurants: It iterates over all layers to identify features representing restaurants. Identifying nearby restaurants: The code checks if each restaurant is within a specified distance (500 m) from the centre of Lund. Visualization of nearby restaurants: After identifying nearby restaurants, the code lists them and creates a memory layer to visualize their locations using markers. |
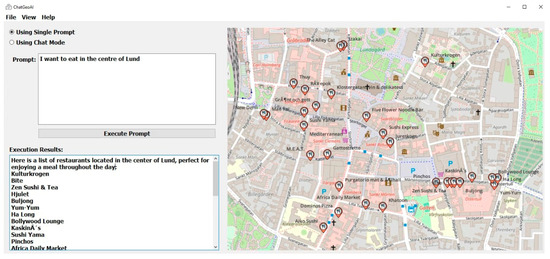
Figure A3.
Restaurants displayed in response to a user who wants to eat in the centre of Lund.
Figure A3.
Restaurants displayed in response to a user who wants to eat in the centre of Lund.
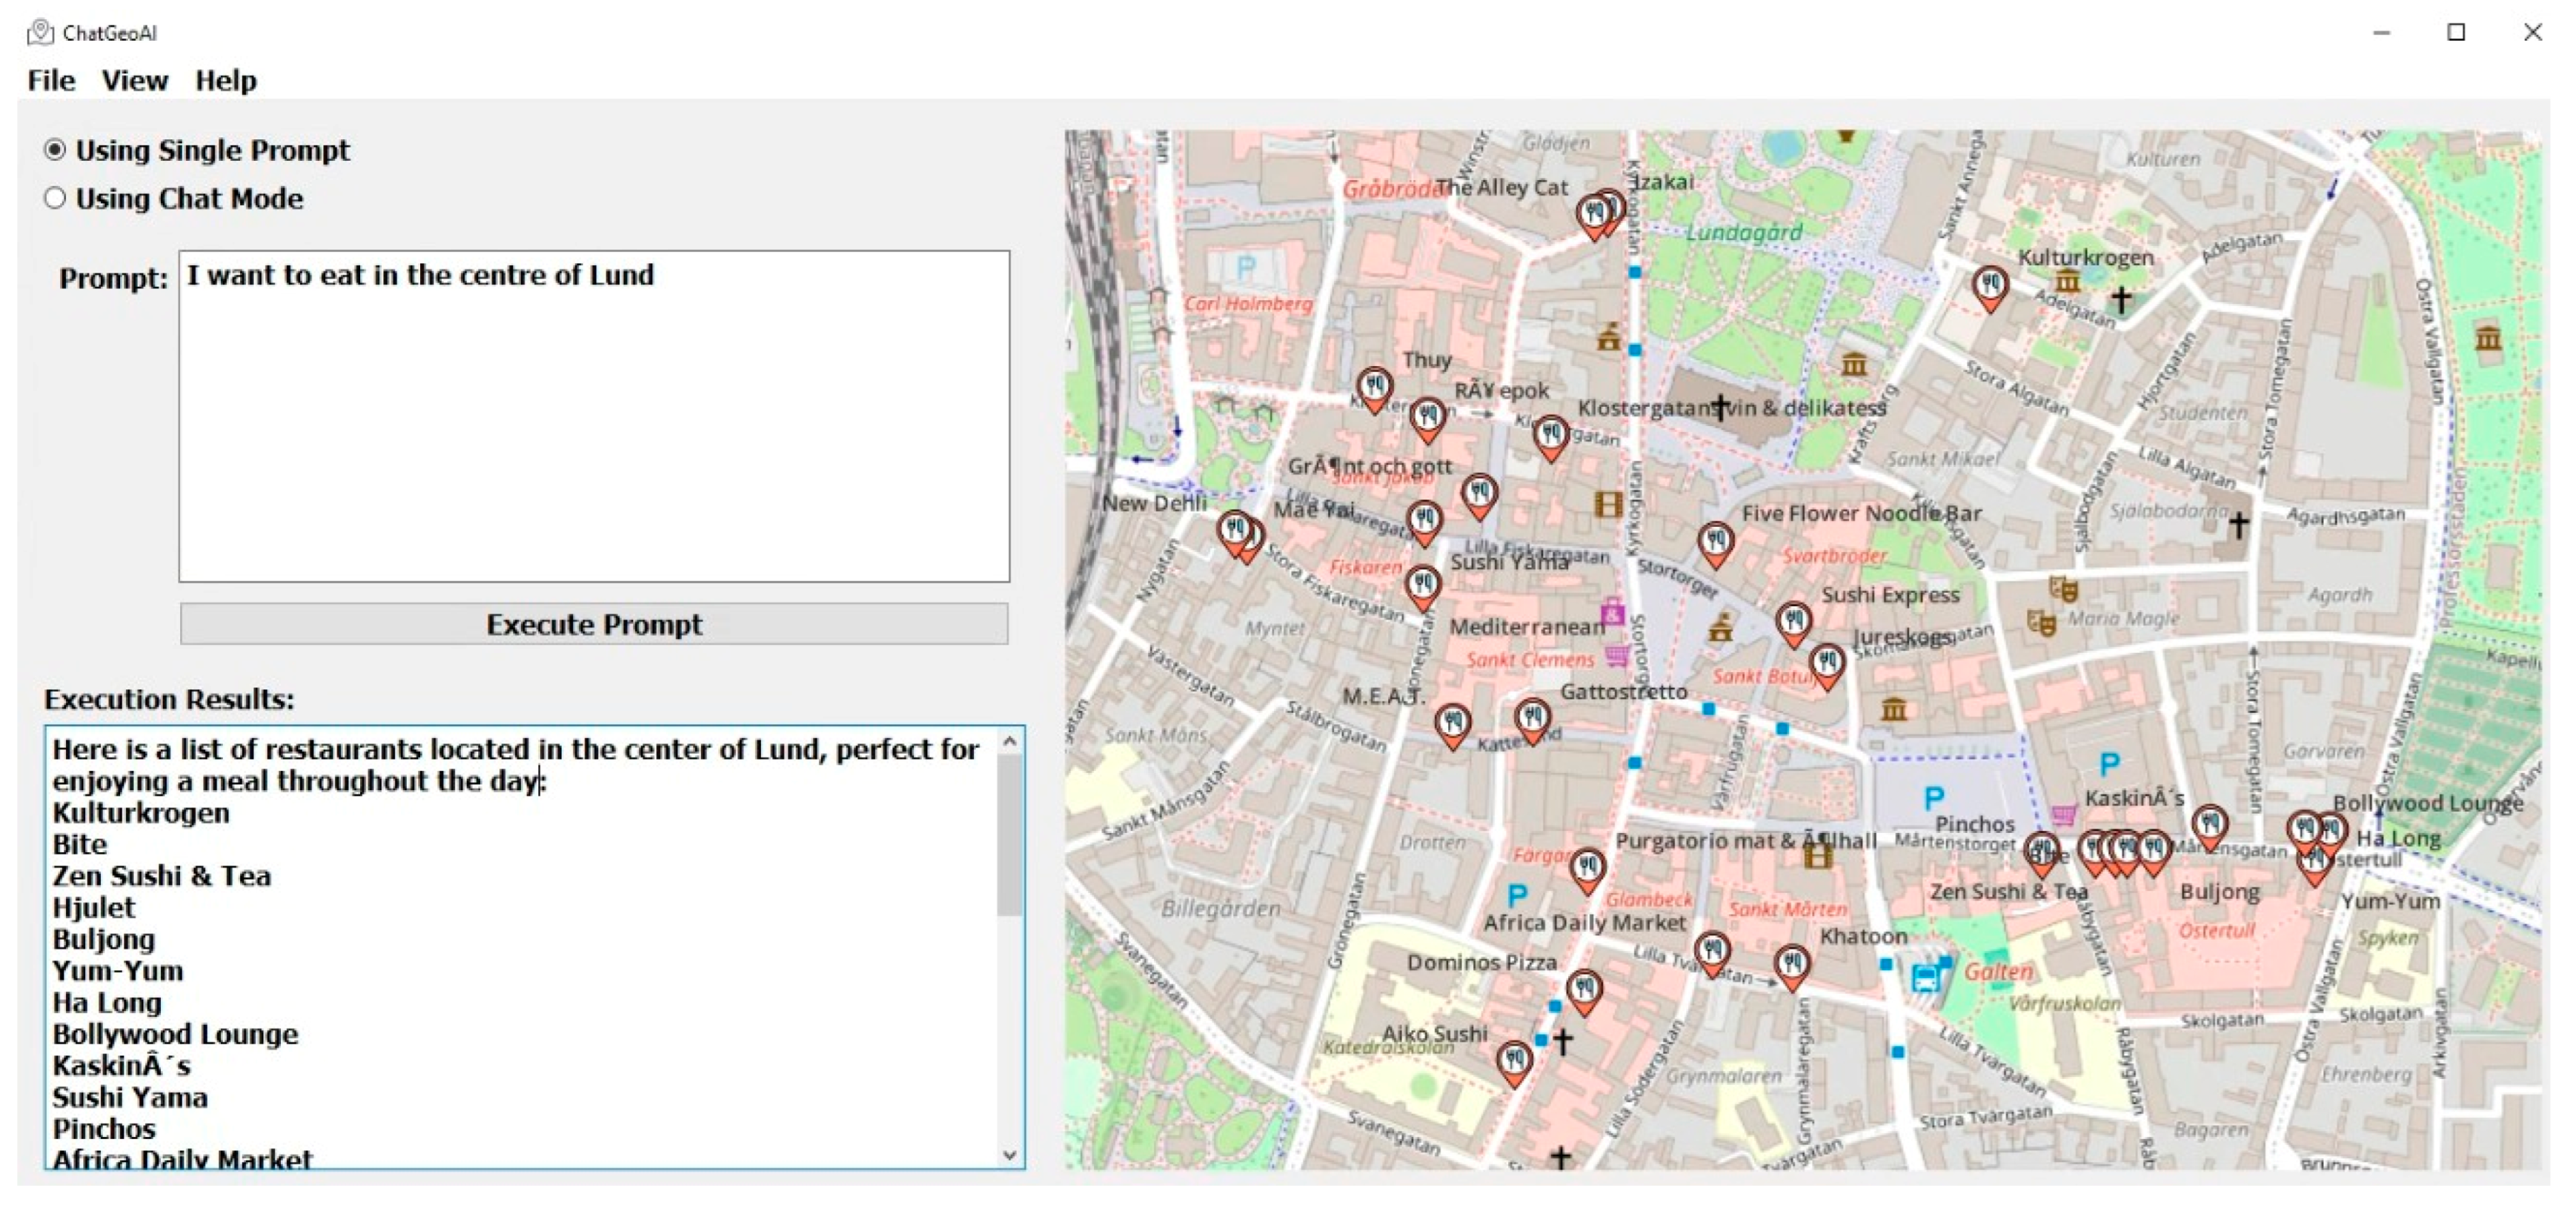
Let us delve into the fourth query, which involves more advanced considerations. The user seeks to identify the most efficient route for visiting the top three tourist attractions in the city, considering both the availability and travel times of public transportation options, along with walking distances. However, the system’s response falls short in addressing this query accurately. The provided code overlooks the query’s requirement by ranking attractions based on short travel times, however this should be based on ratings or specific attributes. This oversight fails to capture the query’s emphasis on selecting attractions based on their significance or popularity as tourist destinations, rather than solely optimizing travel time.
Moreover, the code lacks the inclusion of public transportation nodes and edges in the constructed graph. This omission is critical, as the query explicitly mentions the importance of considering public transportation options. Without incorporating such data, the system cannot fulfill the user’s request effectively.

Table A4.
Complex route planning: combining walking and public transport.
Table A4.
Complex route planning: combining walking and public transport.
| Query: Identify the most efficient route for a user to visit the top three tourist attractions in the city, taking into account availability and travel times of public transportation options, and walking distances. |
| Extract attraction points: It iterates over all the layers in the QGIS project to extract the attraction points’ coordinates. These points represent the locations of tourist attractions within the city. Find nearest nodes: The code utilizes the osmnx library to download OpenStreetMap data for Lund city. Then, for each attraction point, the code finds the nearest node in the OSM road network graph. Calculate shortest paths: It calculates the shortest paths between all pairs of attractions function. Calculate travel times: For each pair of attractions, the code calculates the travel time between them by summing the lengths of the edges along the shortest path. The travel time is computed based on the length attribute of the edges in the graph. Identify Top Attractions: Finally, the code identifies the top three attractions with the shortest total travel times. It sorts the attractions based on the sum of travel times to all other attractions and selects the top three from the sorted list. |
To address these shortcomings and fulfill the query’s requirements, further chat with the system and debugging of the code are necessary. Only then can the system provide a satisfactory response by incorporating all relevant factors, including attraction ratings, public transportation options, and walking distances, to identify the most efficient route for visiting the top three tourist attractions in the city.
References
- Raiaan, M.A.K.; Mukta, M.S.H.; Fatema, K.; Fahad, N.M.; Sakib, S.; Mim, M.M.J.; Ahmad, J.; Ali, M.E.; Azam, S. A Review on Large Language Models: Architectures, Applications, Taxonomies, Open Issues and Challenges. IEEE Access 2024, 12, 26839–26874. [Google Scholar] [CrossRef]
- Lin, L.; Xia, G.; Jiang, J.; Zhang, Y. Content-based controls for music large language modeling. arXiv 2023, arXiv:2310.17162. [Google Scholar]
- Koh, J.Y.; Fried, D.; Salakhutdinov, R.R. Generating images with multimodal language models. In Advances in Neural Information Processing Systems; Oh, A., Neumann, T., Globerson, A., Saenko, K., Hardt, M., Levine, S., Eds.; Curran Associates, Inc.: Red Hook, NY, USA, 2024; Volume 36, pp. 21487–21506. [Google Scholar]
- Wang, S.; Zhang, J.; Xue, C. Assessment model for perceived visual complexity of GIS system. In Proceedings of the IEEE 5th Information Technology and Mechatronics Engineering Conference (ITOEC), Chongqing, China, 12–14 June 2020; pp. 33–37. [Google Scholar] [CrossRef]
- Zhu, A.X.; Zhao, F.H.; Liang, P.; Qin, C.Z. Next generation of GIS: Must be easy. Ann. GIS 2020, 27, 71–86. [Google Scholar] [CrossRef]
- Syed, M.A.; Arsevska, E.; Roche, M.; Teisseire, M. GeospatRE: Extraction and geocoding of spatial relation entities in textual documents. Cartogr. Geogr. Inf. Sci. 2023, 1–16. [Google Scholar] [CrossRef]
- Hu, Y. Geo-text data and data-driven geospatial semantics. Geogr. Compass 2018, 12, e12404. [Google Scholar] [CrossRef]
- Yin, Z.; Zhang, C.; Goldberg, D.W.; Prasad, S. An NLP-based Question Answering Framework for Spatio-Temporal Analysis and Visualization. In Proceedings of the 2nd International Conference on Geoinformatics and Data Analysis, Prague, Czech Republic, 15–17 March 2019; Association for Computing Machinery: New York, NY, USA, 2019; pp. 61–65. [Google Scholar] [CrossRef]
- Nasar, Z.; Jaffry, S.W.; Malik, M.K. Named Entity Recognition and Relation Extraction: State-of-the-Art. ACM Comput. Surv. 2022, 54, 1–39. [Google Scholar] [CrossRef]
- Fize, J.; Moncla, L.; Martins, B. Deep Learning for Toponym Resolution: Geocoding Based on Pairs of Toponyms. ISPRS Int. J. Geo-Inf. 2021, 10, 818. [Google Scholar] [CrossRef]
- Cardoso, A.B.; Martins, B.; Estima, J. A Novel Deep Learning Approach Using Contextual Embeddings for Toponym Resolution. ISPRS Int. J. Geo-Inf. 2022, 11, 28. [Google Scholar] [CrossRef]
- Yao, F.; Wang, Y. Tracking urban geo-topics based on dynamic topic model. Comput. Environ. Urban Syst. 2020, 79, 101419. [Google Scholar] [CrossRef]
- Lim, W.L.; Ho, C.C.; Ting, C.Y. Sentiment Analysis by Fusing Text and Location Features of Geo-Tagged Tweets. IEEE Access 2020, 8, 181014–181027. [Google Scholar] [CrossRef]
- Hu, X.; Zhou, Z.; Li, H.; Hu, Y.; Gu, F.; Kersten, J.; Fan, H.; Klan, F. Location Reference Recognition from Texts: A Survey and Comparison. ACM Comput. Surv. 2023, 56, 1–37. [Google Scholar] [CrossRef]
- Le, T.; Jeong, H.D.; Gilbert, S.B.; Chukharev-Hudilainen, E. Parsing Natural Language Queries for Extracting Data from Large-Scale Geospatial Transportation Asset Repositories. In Proceedings of the Construction Research Congress 2018, New Orleans, LA, USA, 2–4 April 2018. [Google Scholar] [CrossRef]
- Devlin, J.; Chang, M.; Lee, K.; Toutanova, K. BERT: Pre-training of deep bidirectional transformers for language understanding. In Proceedings of the Conference of the North American Chapter of the Association for Computational Linguistics: Human Language Technologies, Minneapolis, MN, USA, 2–7 June 2019; Burstein, J., Doran, C., Solorio, T., Eds.; Association for Computational Linguistics: Stroudsburg, PA, USA, 2019; Volume 1, pp. 4171–4186. [Google Scholar]
- Radford, A.; Wu, J.; Child, R.; Luan, D.; Amodei, D.; Sutskever, I. Language models are unsupervised multitask learners. OpenAI blog 2019, 1, 9. [Google Scholar]
- Lewis, M.; Liu, Y.; Goyal, N.; Ghazvininejad, M.; Mohamed, A.; Levy, O.; Stoyanov, V.; Zettlemoyer, L. BART: Denoising sequence-to-sequence pre-training for natural language generation, translation, and comprehension. In Proceedings of the 58th Annual Meeting of the Association for Computational Linguistics, Online, 5–10 July 2020; ACL: Stroudsburg, PA, USA, 2020; pp. 7871–7880. [Google Scholar]
- Kaplan, J.; McCandlish, S.; Henighan, T.; Brown, T.B.; Chess, B.; Child, R.; Gray, S.; Radford, A.; Wu, J.; Amodei, D. Scaling laws for neural language models. arXiv 2020, arXiv:2001.08361. [Google Scholar]
- Brown, T.B.; Mann, B.; Ryder, N.; Subbiah, M.; Kaplan, J.; Dhariwal, P.; Neelakantan, A.; Shyam, P.; Sastry, G.; Askell, A.; et al. Language models are few-shot learners. In Advances in Neural Information Processing Systems, Proceedings of the Annual Conference on Neural Information Processing Systems, Vancouver, BC, Canada, 6–12 December 2020; Larochelle, H., Ranzato, M., Hadsell, R., Balcan, M., Lin, M., Eds.; NeurIPS: San Diego, CA, USA, 2020. [Google Scholar]
- Bubeck, S.; Chandrasekaran, V.; Eldan, R.; Gehrke, J.; Horvitz, E.; Kamar, E.; Lee, P.; Lee, Y.T.; Li, Y.; Lundberg, S.; et al. Sparks of artifcial general intelligence: Early experiments with gpt-4. arXiv 2023, arXiv:2303.12712. [Google Scholar]
- Patil, R.; Gudivada, V. A Review of Current Trends, Techniques, and Challenges in Large Language Models (LLMs). Appl. Sci. 2024, 14, 2074. [Google Scholar] [CrossRef]
- Zhou, C.; Liu, P.; Xu, P.; Iyer, S.; Sun, J.; Mao, Y.; Ma, X.; Efrat, A.; Yu, P.; Yu, L.; et al. LIMA: Less Is More for Alignment. arXiv 2023, arXiv:2305.11206. [Google Scholar]
- Vemprala, S.; Bonatti, R.; Bucker, A.; Kapoor, A. ChatGPT for Robotics: Design Principles and Model Abilities. arXiv 2023, arXiv:2306.17582. [Google Scholar]
- Liang, Y.; Wu, C.; Song, T.; Wu, W.; Xia, Y.; Liu, Y.; Ou, Y.; Lu, S.; Ji, L.; Mao, S.; et al. TaskMatrix.AI: Completing Tasks by Connecting Foundation Models with Millions of APIs. arXiv 2023, arXiv:2303.16434. [Google Scholar] [CrossRef]
- Li, R.; Pu, C.; Tao, J.; Li, C.; Fan, F.; Xiang, Y.; Chen, S. LLM-Based Frameworks for Power Engineering from Routine to Novel Tasks. arXiv 2024. [Google Scholar] [CrossRef]
- Bruce Richards, T. Auto-gpt: An Autonomous gpt-4 Experiment. 2023. Available online: https://github.com/M-Chandru/Auto-GPT4 (accessed on 15 June 2024).
- Nakajima, Y. Babyagi. 2023. Available online: https://github.com/yoheinakajima/babyagi (accessed on 5 April 2024).
- Hong, S.; Zheng, X.; Chen, J.; Cheng, Y.; Zhang, C.; Wang, Z.; Yau, S.K.C.; Lin, Z.; Zhou, L.; Ran, C.; et al. Metagpt: Meta programming for multi-agent collaborative framework. arXiv 2023, arXiv:2308.00352. [Google Scholar]
- Mooney, P.; Cui, W.; Guan, B.; Juhász, L. Towards Understanding the Geospatial Skills of ChatGPT: Taking a Geographic Information Systems (GIS) Exam. In Proceedings of the 6th ACM SIGSPATIAL International Workshop on AI for Geographic Knowledge Discovery (GeoAI ‘23), Hamburg, Germany, 13 November 2023; Association for Computing Machinery: New York, NY, USA; 2023. pp. 85–94. [CrossRef]
- Hwang, Y.S.; Um, J.S.; Pradhan, B.; Choudhury, T.; Schlueter, S. How does ChatGPT evaluate the value of spatial information in the 4th industrial revolution? Spat. Inf. Res. 2023, 32, 187–194. [Google Scholar] [CrossRef]
- Agapiou, A.; Lysandrou, V. Interacting with the Artificial Intelligence (AI) Language Model ChatGPT: A synopsis of Earth Observation and Remote sensing in Archaeology. Heritage 2023, 6, 4072–4085. [Google Scholar] [CrossRef]
- Guo, H.; Su, X.; Wu, C.; Du, B.; Zhang, L.; Li, D. Remote Sensing ChatGPT: Solving Remote Sensing Tasks with ChatGPT and Visual Models. arXiv 2024, arXiv:2401.09083. [Google Scholar]
- Jakubik, J.; Roy, S.; Phillips, C.E.; Fraccaro, P.; Godwin, D.; Zadrozny, B.; Szwarcman, D.; Gomes, C.; Nyirjesy, G.; Edwards, B.; et al. Foundation models for generalist geospatial artificial intelligence. arXiv 2023, arXiv:2310.18660. [Google Scholar]
- Jiang, Y.; Yang, C. Is ChatGPT a Good Geospatial Data Analyst? Exploring the Integration of Natural Language into Structured Query Language within a Spatial Database. ISPRS Int. J. Geo-Inf. 2024, 13, 26. [Google Scholar] [CrossRef]
- Ning, H.; Li, Z.; Akinboyewa, T.; Lessani, M.N. An Autonomous GIS Agent Framework for Geospatial Data Retrieval. arXiv 2024, arXiv:2407.21024. [Google Scholar]
- Li, Z.; Ning, H. Autonomous GIS: The next-generation AI-powered GIS. Int. J. Digit. Earth 2023, 16, 4668–4686. [Google Scholar] [CrossRef]
- Chen, J.; Lin, B.; Xu, R.; Chai, Z.; Liang, X.; Wong, K.-Y.K. MapGPT: Map-Guided Prompting with Adaptive Path Planning for Vision-and-Language Navigation. arXiv 2024, arXiv:2401.07314. [Google Scholar]
- Mai, G.; Huang, W.; Sun, J.; Song, S.; Mishra, D.; Liu, N.; Gao, S.; Liu, T.; Cong, G.; Hu, Y.; et al. On the opportunities and challenges of foundation models for geospatial artificial intelligence. arXiv 2023, arXiv:2304.06798. [Google Scholar]
- Tao, R.; Xu, J. Mapping with ChatGPT. ISPRS Int. J. Geo-Inf. 2023, 12, 284. [Google Scholar] [CrossRef]
- Zhang, Y.; Wei, C.; Wu, S.; He, Z.; Yu, W. GeoGPT: Understanding and Processing Geospatial Tasks through an Autonomous GPT. arXiv 2023, arXiv:2307.07930. [Google Scholar]
- Zhu, J.; Dang, P.; Cao, Y.; Lai, J.; Guo, Y.; Wang, P.; Li, W. A Flood Knowledge-Constrained Large Language Model Interactable with GIS: Enhancing Public Risk Perception of Floods. Int. J. Geogr. Inf. Sci. 2024, 38, 603–625. [Google Scholar] [CrossRef]
- spacy.io. 2016. Available online: https://www.spacy.io (accessed on 30 August 2024).
- Dsouza, A.; Tempelmeier, N.; Yu, R.; Gottschalk, S.; Demidova, E. WorldKG: A World-Scale Geographic Knowledge Graph. In Proceedings of the 30th ACM International Conference on Information & Knowledge Management, Online, 1–5 November 2021; Demartini, G., Zuccon, G., Culpepper, J.S., Huang, Z., Tong, H., Eds.; Association for Computing Machinery: New York, NY, USA, 2021; pp. 4475–4484. [Google Scholar] [CrossRef]
- Wang, D.; Lu, C.-T.; Fu, Y. Towards Automated Urban Planning: When Generative and ChatGPT-like AI Meets Urban Planning. arXiv 2023, arXiv:2304.03892. [Google Scholar]
- Qiu, Q.; Huang, Z.; Xu, D.; Ma, K.; Tao, L.; Wang, R.; Chen, J.; Xie, Z.; Pan, Y. Integrating NLP and Ontology Matching into a Unified System for Automated Information Extraction from Geological Hazard Reports. J. Earth Sci. 2023, 34, 1433–1446. [Google Scholar] [CrossRef]
- Zhang, Z.; Zhao, Y.; Gao, H.; Hu, M. LinkNER: Linking Local Named Entity Recognition Models to Large Language Models Using Uncertainty. arXiv 2024, arXiv:2402.10573. [Google Scholar]
- Godlove, D. Singularity: Simple, secure containers for compute-driven workloads. In Proceedings of the Practice and Experience in Advanced Research Computing on Rise of the Machines (Learning), Chicago, IL, USA, 28 July–1 August 2019; Association for Computing Machinery: New York, NY, USA, 2019; Volume 24, pp. 1–4. [Google Scholar] [CrossRef]
- Touvron, H.; Martin, L.; Stone, K.; Albert, P.; Almahairi, A.; Babaei, Y.; Bashlykov, N.; Batra, S.; Bhargava, P.; Bhosale, S.; et al. Llama 2: Open Foundation and Fine-Tuned Chat Models. arXiv 2023, arXiv:2307.09288. [Google Scholar]
- Chang, Y.; Wang, X.; Wang, J.; Wu, Y.; Yang, L.; Zhu, K.; Chen, H.; Yi, X.; Wang, C.; Wang, Y.; et al. A Survey on Evaluation of Large Language Models. ACM Trans. Intell. Syst. Technol. 2024, 15, 1–45. [Google Scholar] [CrossRef]
- Hu, E.J.; Shen, Y.; Wallis, P.; Allen-Zhu, Z.; Li, Y.; Wang, S.; Wang, L.; Chen, W. Lora: Low-rank adaptation of large language models. arXiv 2021, arXiv:2106.09685. 2021. [Google Scholar]
- Dettmers, T.; Pagnoni, A.; Holtzman, A.; Zettlemoyer, L. QLoRA: Efficient finetuning of quantized LLMs. arXiv 2023, arXiv:2305.14314. [Google Scholar]
- Ren, S.; Guo, D.; Lu, S.; Zhou, L.; Liu, S.; Tang, D.; Sundaresan, N.; Zhou, M.; Blanco, A.; Ma, S. CodeBLEU: A Method for Automatic Evaluation of Code Synthesis. arXiv 2020, arXiv:2009.10297. [Google Scholar]
- Popović, M. ChrF: Character n-gram F-score for automatic MT evaluation. In Proceedings of the Tenth Workshop on Statistical Machine Translation, Lisbon, Portugal, 17–18 September 2015; Association for Computational Linguistics: New York, NY, USA, 2015; pp. 392–395. [Google Scholar] [CrossRef]
- Lin, C.Y. ROUGE: A Package for Automatic Evaluation of Summaries. In Text Summarization Branches Out; Association for Computational Linguistics: Barcelona, Spain, 2015; pp. 74–81. [Google Scholar]
- Zhang, T.; Kishore, V.; Wu, F.; Weinberger, K.Q.; Artzi, Y. BERTScore: Evaluating Text Generation with BERT. arXiv 2019, arXiv:1904.09675. [Google Scholar]
- Zhang, Y.; Wang, Z.; He, Z.; Li, J.; Mai, G.; Lin, J.; Wei, C.; Yu, W. BB-GeoGPT: A Framework for Learning a Large Language Model for Geographic Information Science. Inf. Process. Manag. 2024, 61, 103808. [Google Scholar] [CrossRef]
- Evtikhiev, M.; Bogomolov, E.; Sokolov, Y.; Bryksin, T. Out of the BLEU: How should we assess quality of the Code Generation models? J. Syst. Softw. 2023, 203, 111741. [Google Scholar] [CrossRef]
Disclaimer/Publisher’s Note: The statements, opinions and data contained in all publications are solely those of the individual author(s) and contributor(s) and not of MDPI and/or the editor(s). MDPI and/or the editor(s) disclaim responsibility for any injury to people or property resulting from any ideas, methods, instructions or products referred to in the content. |
© 2024 by the authors. Published by MDPI on behalf of the International Society for Photogrammetry and Remote Sensing. Licensee MDPI, Basel, Switzerland. This article is an open access article distributed under the terms and conditions of the Creative Commons Attribution (CC BY) license (https://creativecommons.org/licenses/by/4.0/).


