Article

A Method for Constructing an Urban Waterlogging Emergency Knowledge Graph Based on Spatiotemporal Processes

by
Wei Mao
1,
Jie Shen
1,2,3,*,
Qian Su
4,
Sihu Liu
1,
Saied Pirasteh
5 and
Kunihiro Ishii
6
1
School of Geography, Nanjing Normal University, Nanjing 210023, China
2
Key Laboratory of Virtual Geographic Environment of Ministry of Education, Nanjing Normal University, Nanjing 210023, China
3
Jiangsu Center for Collaborative Innovation in Geographical Information Resource Development and Application, Nanjing 210023, China
4
ShanDong EastDawn Corporation, Jinan 250101, China
5
Institute of Artificial Intelligence, Shaoxing University, Shaoxing 312000, China
6
Asia Air Survey Co., Ltd., Tokyo 160-0023, Japan
*
Author to whom correspondence should be addressed.
ISPRS Int. J. Geo-Inf. 2024, 13(10), 349; https://doi.org/10.3390/ijgi13100349
Submission received: 27 August 2024 / Revised: 30 September 2024 / Accepted: 2 October 2024 / Published: 3 October 2024
(This article belongs to the Topic Geospatial Knowledge Graph)

Abstract

:
Urban waterlogging is one of the major “diseases” faced by cities, posing a great challenge to the healthy and sustainable development of cities. The traditional geographic knowledge graph struggles to capture dynamic changes in urban waterlogging over time. Therefore, the objective of this study is to analyze the time, events, properties, geographic objects, and activities associated with urban waterlogging emergency responses from the geographic spatial and temporal processes perspective and to construct an urban waterlogging emergency knowledge graph by combining top-down and bottom-up approaches. We propose a conceptual model of urban waterlogging emergency response ontology based on spatiotemporal processes by analyzing the basic laws and influencing factors of urban waterlogging occurrence and development. Secondly, we describe the construction process of the urban waterlogging emergency response knowledge graph from knowledge extraction, knowledge fusion, and knowledge storage. Finally, the knowledge graph was visualized using 159 urban waterlogging events in China from 2020–2022, with a quality assessment indicating 81% correctness, 65.5% completeness, and 95% data conciseness. The results show that this method can effectively express the spatiotemporal process of an urban waterlogging emergency response and can provide a reference for the spatiotemporal modeling of the knowledge graph.

1. Introduction

Urban waterlogging is a water hazard where surface runoff exceeds drainage capacity during heavy precipitation [1], leading to economic losses, transportation issues, water pollution, and social and environmental problems [2]. It is a significant challenge for healthy and sustainable urban development in cities.
Research on urban waterlogging has expanded with advancements in science and technology. Various spatial and temporal data sources, including geographic, statistical, and social media data, offer valuable resources for disaster emergency management [3]. However, the development of data application technology has been slow, and only a small portion of these data have been applied, resulting in a low proportion of data transformed into knowledge [4].
In order to better analyze geographic spatiotemporal data, obtain key knowledge from the data, analyze the relationships between geographic entities, and identify hidden geographic relationships, relevant researchers have proposed geographic knowledge graphs [5,6]. The geographic knowledge graph is a way to organize knowledge in the field of geography into a graph, which can structure and semantically express the information of geographic information, geographic entities, geographic relationships, and geographic phenomena to realize the intelligent processing and application of geographic knowledge [7,8]. However, traditional geographic knowledge graphs mainly describe static facts and struggle to represent changes [9]. Current research mainly focuses on the construction of geographic entities and relationships, but the representation of geographic spatiotemporal process knowledge is neglected, which greatly limits its application in disaster emergency spatiotemporal processes. How to represent and analyze the spatiotemporal process knowledge of urban waterlogging emergency is an urgent problem, which is the key to spatiotemporal data processing and its intelligent application. Meanwhile, what is different from the current research on geographic knowledge graph is that the field of urban waterlogging emergency response has its own characteristic conceptual system and spatial knowledge rules, in addition to its general characteristics as a geospatial object. Therefore, it is the focus of our research to consider the influencing factors and property characteristics of an urban waterlogging emergency in the process of constructing the knowledge graph.
This paper investigates the construction method of an urban waterlogging emergency knowledge graph based on spatiotemporal processes. Beginning with existing knowledge pertaining to urban waterlogging and emergency management systems, we propose a conceptual model of urban waterlogging emergency ontology rooted in spatiotemporal processes. This involves defining the conceptual hierarchy of the ontology and establishing attribute relationships, spatiotemporal relationships, and semantic relationships among entities. We then explore the construction of a knowledge graph for urban waterlogging emergencies, encompassing key technologies such as knowledge extraction, fusion, and storage. Subsequently, we undertake a quality assessment of the urban waterlogging emergency knowledge graph to enable query and visualization, event association analysis, and event evolution analysis. These applications aim to bolster urban waterlogging emergency response intelligence and provide essential support for effective decision-making in such scenarios.
The remaining parts of this paper include related works presented in Section 2. Section 3 describes the methodology in detail, including the overall framework, the timeline-based representation of the urban waterlogging emergency response process, the proposed ontology conceptual model, and the construction method of the knowledge graph. Experiments and results are analyzed in Section 4. Section 5 presents the discussion. Finally, conclusions and future directions are presented in Section 6.

2. Related Works

2.1. Geographic Knowledge Graph and Construction Methods

2.1.1. Geographic Knowledge Graph

The geographic knowledge graph (GeoKG) can be understood as the application of knowledge graph technology in the field of geography; it is a multidimensional, cross-domain data representation model covering geographic entities, attributes, and relationships [5]. It centers on providing a comprehensive framework for geographic information through the combination of semantic networks and spatial relationships. The GeoKG includes not only the spatial location and geometry of entities, but also the temporal dimension, semantic information, and spatial and logical relationships between entities [9,10]. In recent years, geographic knowledge graphs were constructed around application tasks such as intelligent remote sensing image interpretation [11], epidemic disease monitoring and trend prediction [12,13], disaster emergency response and mitigation [14], urban flow analysis [15], and geographic data correlation and recommended reasoning [16,17]. For example, researchers constructed a knowledge graph of landslide disaster scenarios oriented to the needs of multiple types of users, realizing the accurate definition and clear description of multiple types of users and scenario objects as well as the efficient management of complex semantic relationships [18]. Based on a knowledge graph, the water quality dataset of the Bogota River Basin has been characterized [19]. A knowledge graph of landslide disasters has also been constructed by analyzing the elemental characteristics and association relations of landslide disasters [20].

2.1.2. Construction Methods for Geographic Knowledge Graph

The construction of the GeoKG involves multiple steps, aiming to combine the geographic information system (GIS) with knowledge graph technology in order to achieve the semantic, structured, and intelligent processing of geographic data. Currently, progress has been made in geographic entity extraction [21,22], relationship extraction [23], geographic knowledge fusion [24,25], and geographic knowledge representation and complementation [9,26]. For example, researchers have constructed a neural network place name recognition model for linguistic irregularities for location extraction from social media messages [27]. Ontology and rule-based approaches utilize geographic ontology libraries and predefined semantic rules to construct knowledge graphs [28,29], and such a construction process not only improves the intelligence level of knowledge graphs but also promotes cross-domain information sharing. When exploring the application of machine learning methods in entity and relationship extraction, CRF and its variants are indispensable techniques. Meanwhile, CNN and RNN structures based on deep learning, such as BERT–BiLSTM–Attention–CRF models [30], Transformer models [31], and DeBERTa models [32], have become classic and cutting-edge designs in this field. An entity alignment method between knowledge graphs using attribute embedding has helped to align entities from different knowledge graphs, thus enabling the integration of multiple knowledge graphs [33]. In addition, researchers have proposed a holistic approach to align geospatial data with multidimensional similarity measures in response to the need for effective similarity-matching methods for the semantic alignment of heterogeneous geospatial datasets from multiple sources [34]. Most current studies rely on predefined ontologies and rules, which may limit the flexibility and scalability of the resulting knowledge graphs, especially when dealing with dynamic geographic data. In contrast, advanced machine learning techniques, including deep learning models, are used to learn dynamically and extract semantic patterns from unstructured data, thereby improving the adaptability and accuracy of GeoKG.

2.2. Representation of Geographic Spatiotemporal Process Knowledge

The traditional geographical spatiotemporal process offers a diverse range of static data representations. To better capture the evolving relationships of geographical entities and reflect spatiotemporal processes, researchers have introduced object-oriented spatiotemporal data models [35], i.e., spatiotemporal models of events and geographical process models. In the era of big data, various spatiotemporal data models have emerged, including dynamic object storage models [36], graph-based data models [37,38], and spatiotemporal data models in the cloud environment [39], all of which play pivotal roles across various industries. However, despite their abundance, the current landscape of spatiotemporal data models lacks a universal framework, making it challenging to address the complexities of urban waterlogging scenarios adequately.
Urban waterlogging emergency response necessitates not only the depiction of entity states and their transformation processes but also the intricate interrelationships between entities and events. Consequently, harnessing the power of knowledge graphs to extract the rich semantics embedded within spatiotemporal data becomes imperative. This approach enables the construction of a semantic operational data model that unifies the representation of time, space, attributes, relationships, and change processes. Such a model effectively expresses the interconnectedness between entity objects, events, and their evolutionary trajectories, thereby catering to the unique demands of urban waterlogging management.

2.3. Structured Representation of Urban Waterlogging Knowledge

Structured representations of waterlogged elements, which provide the basis for intelligent computation, reasoning, and prediction, can be categorized into ontology-based representations and graph-structure-based representations [9].
Ontology-based representation: Gruber’s definition of ontology [40], which states that an ontology is “an explicit specification of a conceptualization”, serves as a fundamental cornerstone for understanding the organization and representation of domain knowledge. This definition has been widely adopted and applied in various fields, providing a framework for constructing, sharing, and reusing domain knowledge structures. Ontologies have been utilized in many urban waterlogging studies, such as hazard monitoring [41], risk assessment [42], and disaster management [43]. Constructing a flood ontology demonstrates a conceptual framework of flooding, showing the relationship between the causes of flooding and the different actions taken to minimize its consequences [44]. The framework based on the ontology calculates the impact index of the factors affecting flood hazards, thus identifying the factors that have the greatest impact on flood hazards [45].
Representation based on graph structure: Knowledge graphs are semantic networks that structurally represent concepts, property, and the relationships between them and are used to reveal complex connections and deep knowledge in the real world. Geographic entities have spatiotemporal characteristics, and knowledge graphs are gradually being used to model changes [9]. Disaster events have typical timeline characteristics, e.g., researchers identified disaster timelines during storms and floods in the UK through Twitter contextual information [46]. A timeline disaster prevention plan has been constructed for underground flood protection measures through field investigations [47]. The “My Timeline” planning program has been developed to equip residents with the information needed for urban flood evacuation for crisis management [48].
In conclusion, more and more researchers have participated in academic and applied technology research on urban inland inundation emergencies and have achieved significant research results. However, the current research still has the following problems: (1) Most of the current research on geographic ontologies and knowledge graphs starts from the overall characteristics of geographic elements, while less consideration is given to the spatial characteristics specific to different domains. However, the urban waterlogging disaster emergency response field has its characteristic conceptual system and spatial knowledge rules, in addition to its generic characteristics as a geospatial object. Therefore, to construct a knowledge graph with the characteristics of urban waterlogging disaster and emergency response domain, it is necessary to combine the knowledge of the influencing factors and attribute characteristics of urban waterlogging and emergency response. (2) The current research on geographic knowledge graphs and the construction of knowledge graphs in the disaster domain mainly focuses on the geographic entities or events. It describes the attributes and relationships between the geographic entities or events, and the knowledge service is limited to the static facts, with less attention paid to the representation of the spatiotemporal process knowledge. How to represent and analyze the spatiotemporal process knowledge of urban waterlogging emergency is an urgent problem, which is the key to spatiotemporal data processing and its intelligent application.

3. Methodology

3.1. Overall Framework

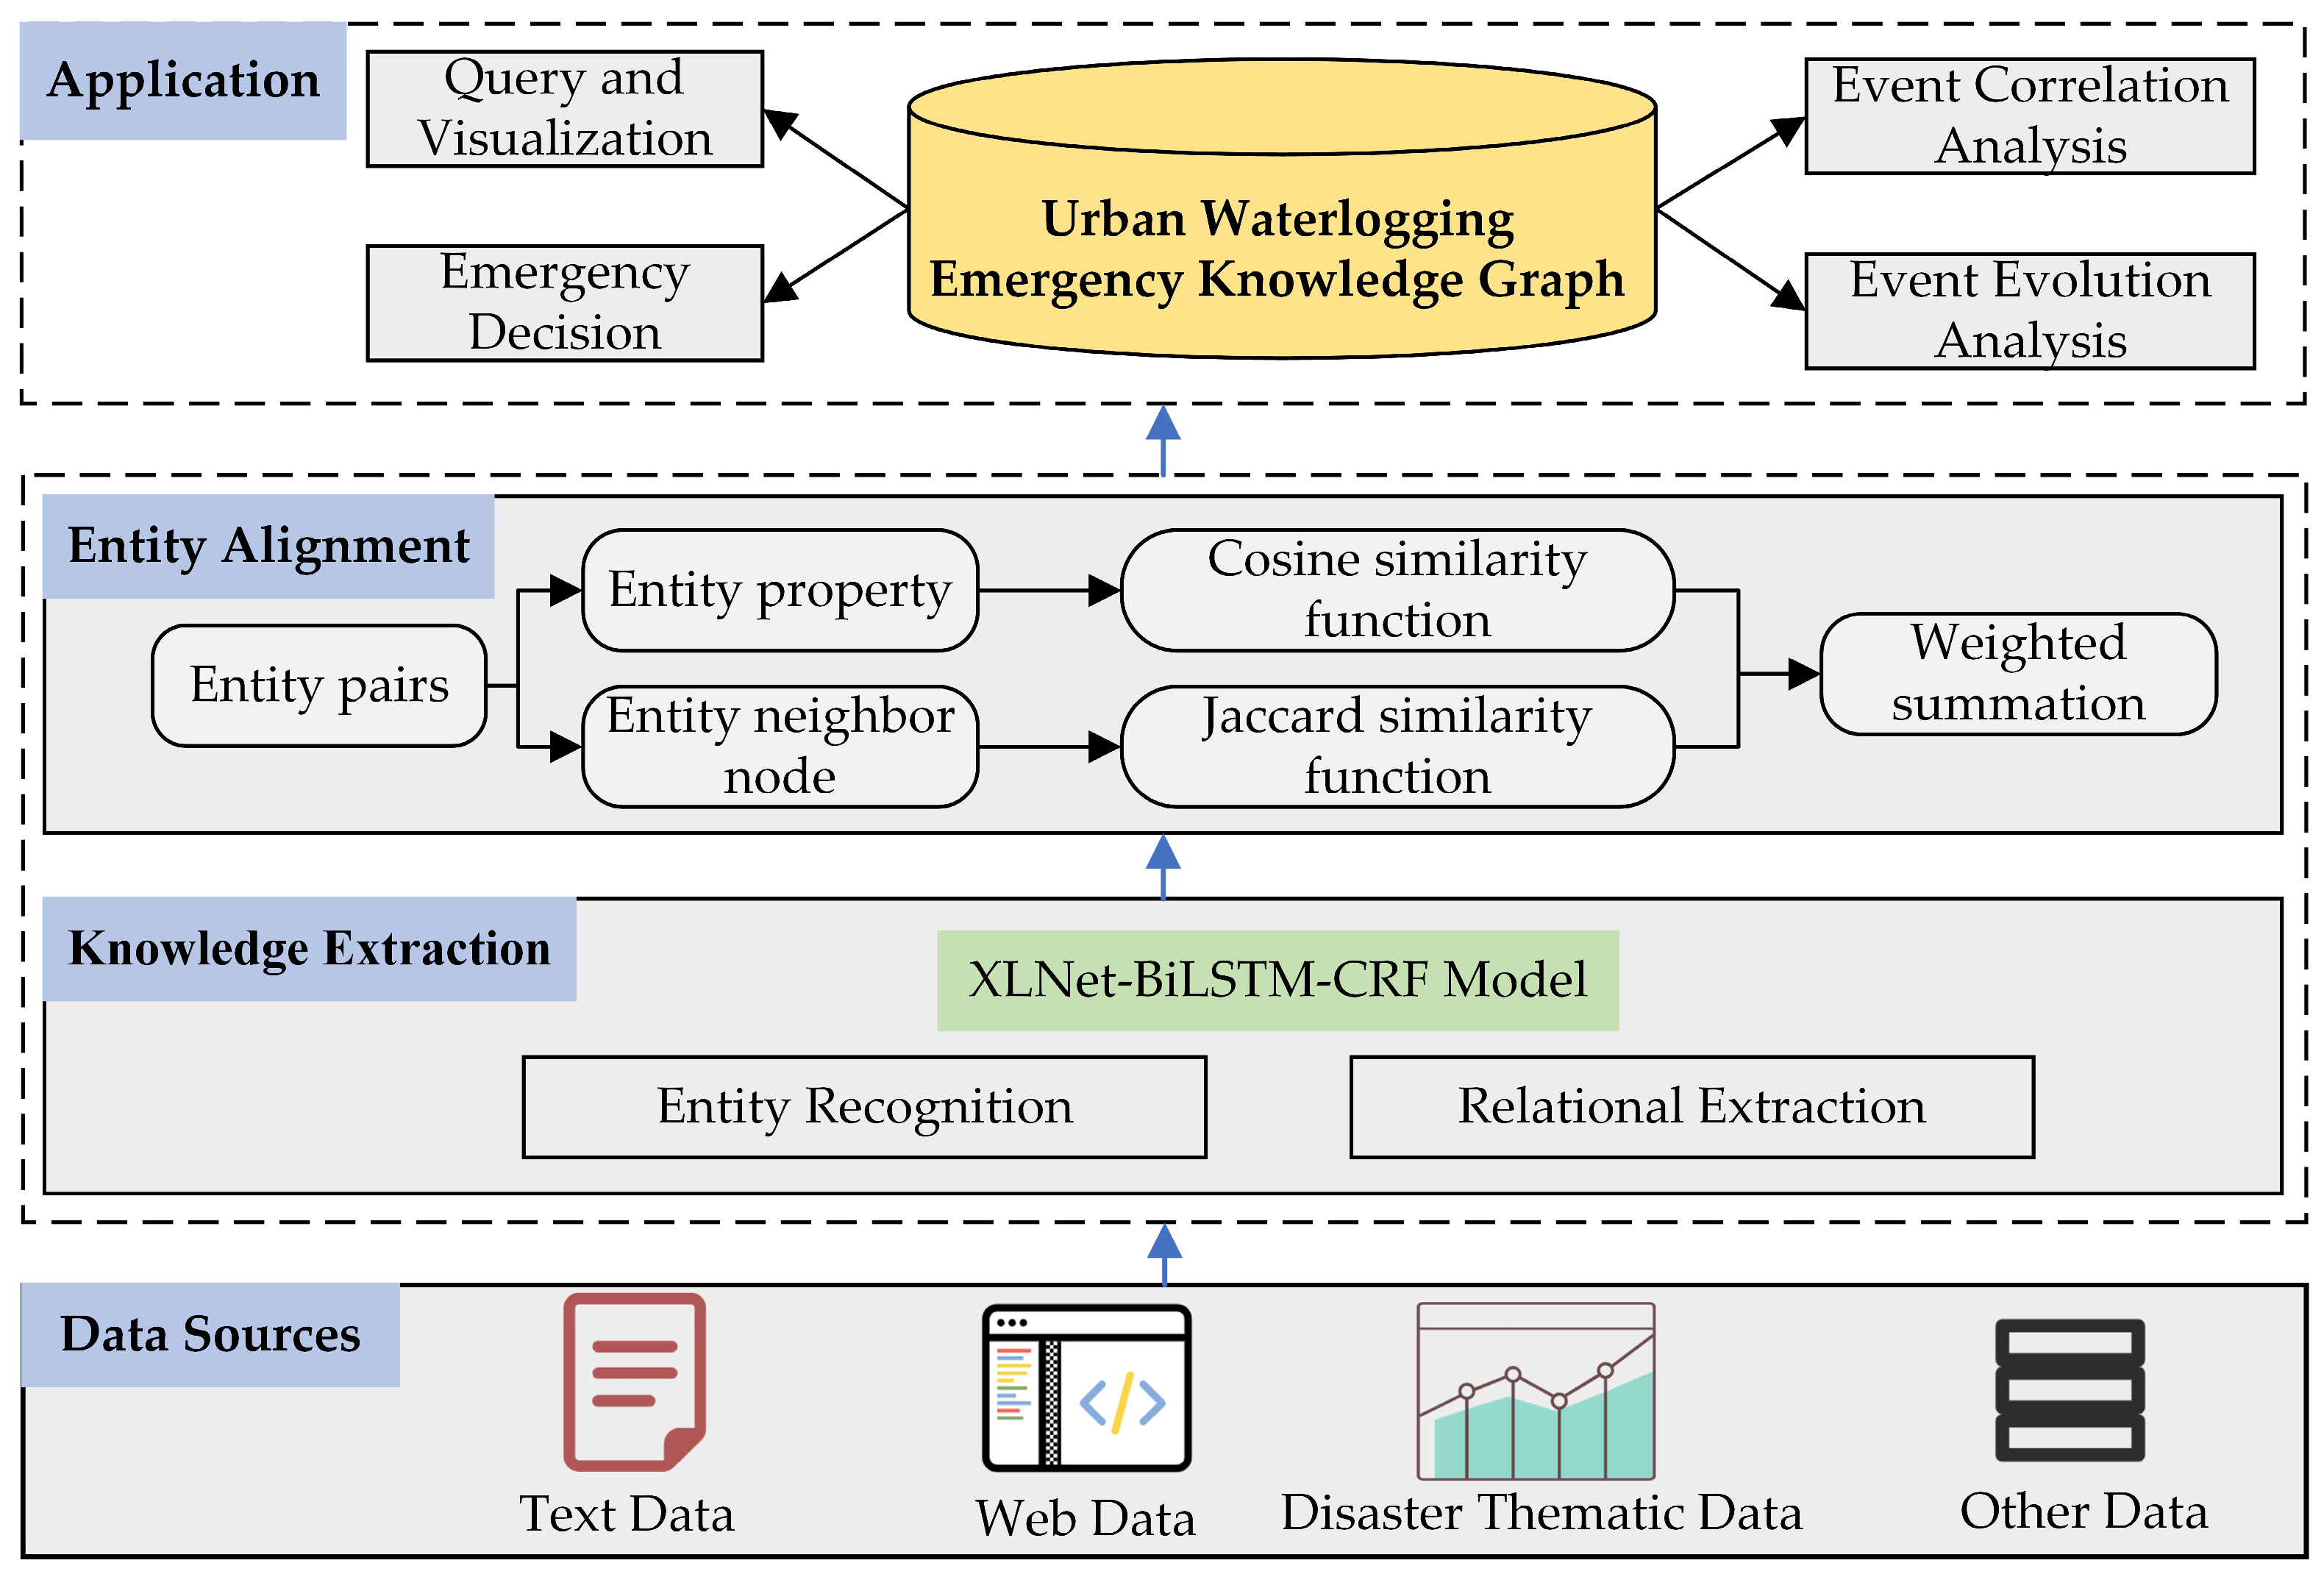
The construction methods of the knowledge graphs are mainly divided into top-down construction and bottom-up construction [49]. In this paper, we use the combination of top-down and bottom-up construction to construct a knowledge graph of urban waterlogging emergency response, as shown in Figure 1. First, top-down construction constructs the ontology of the knowledge graph and describes the concepts, attributes, and relationships of urban waterlogging emergency response domain in a unified way. Then, the data of the urban waterlogging emergency response domain are extracted from the bottom up, and the mapping from the data layer to the schema layer is realized through knowledge extraction, knowledge fusion, and designing an appropriate knowledge storage schema.

3.2. Timeline-Based Representation of Urban Waterlogging Emergency Response Process

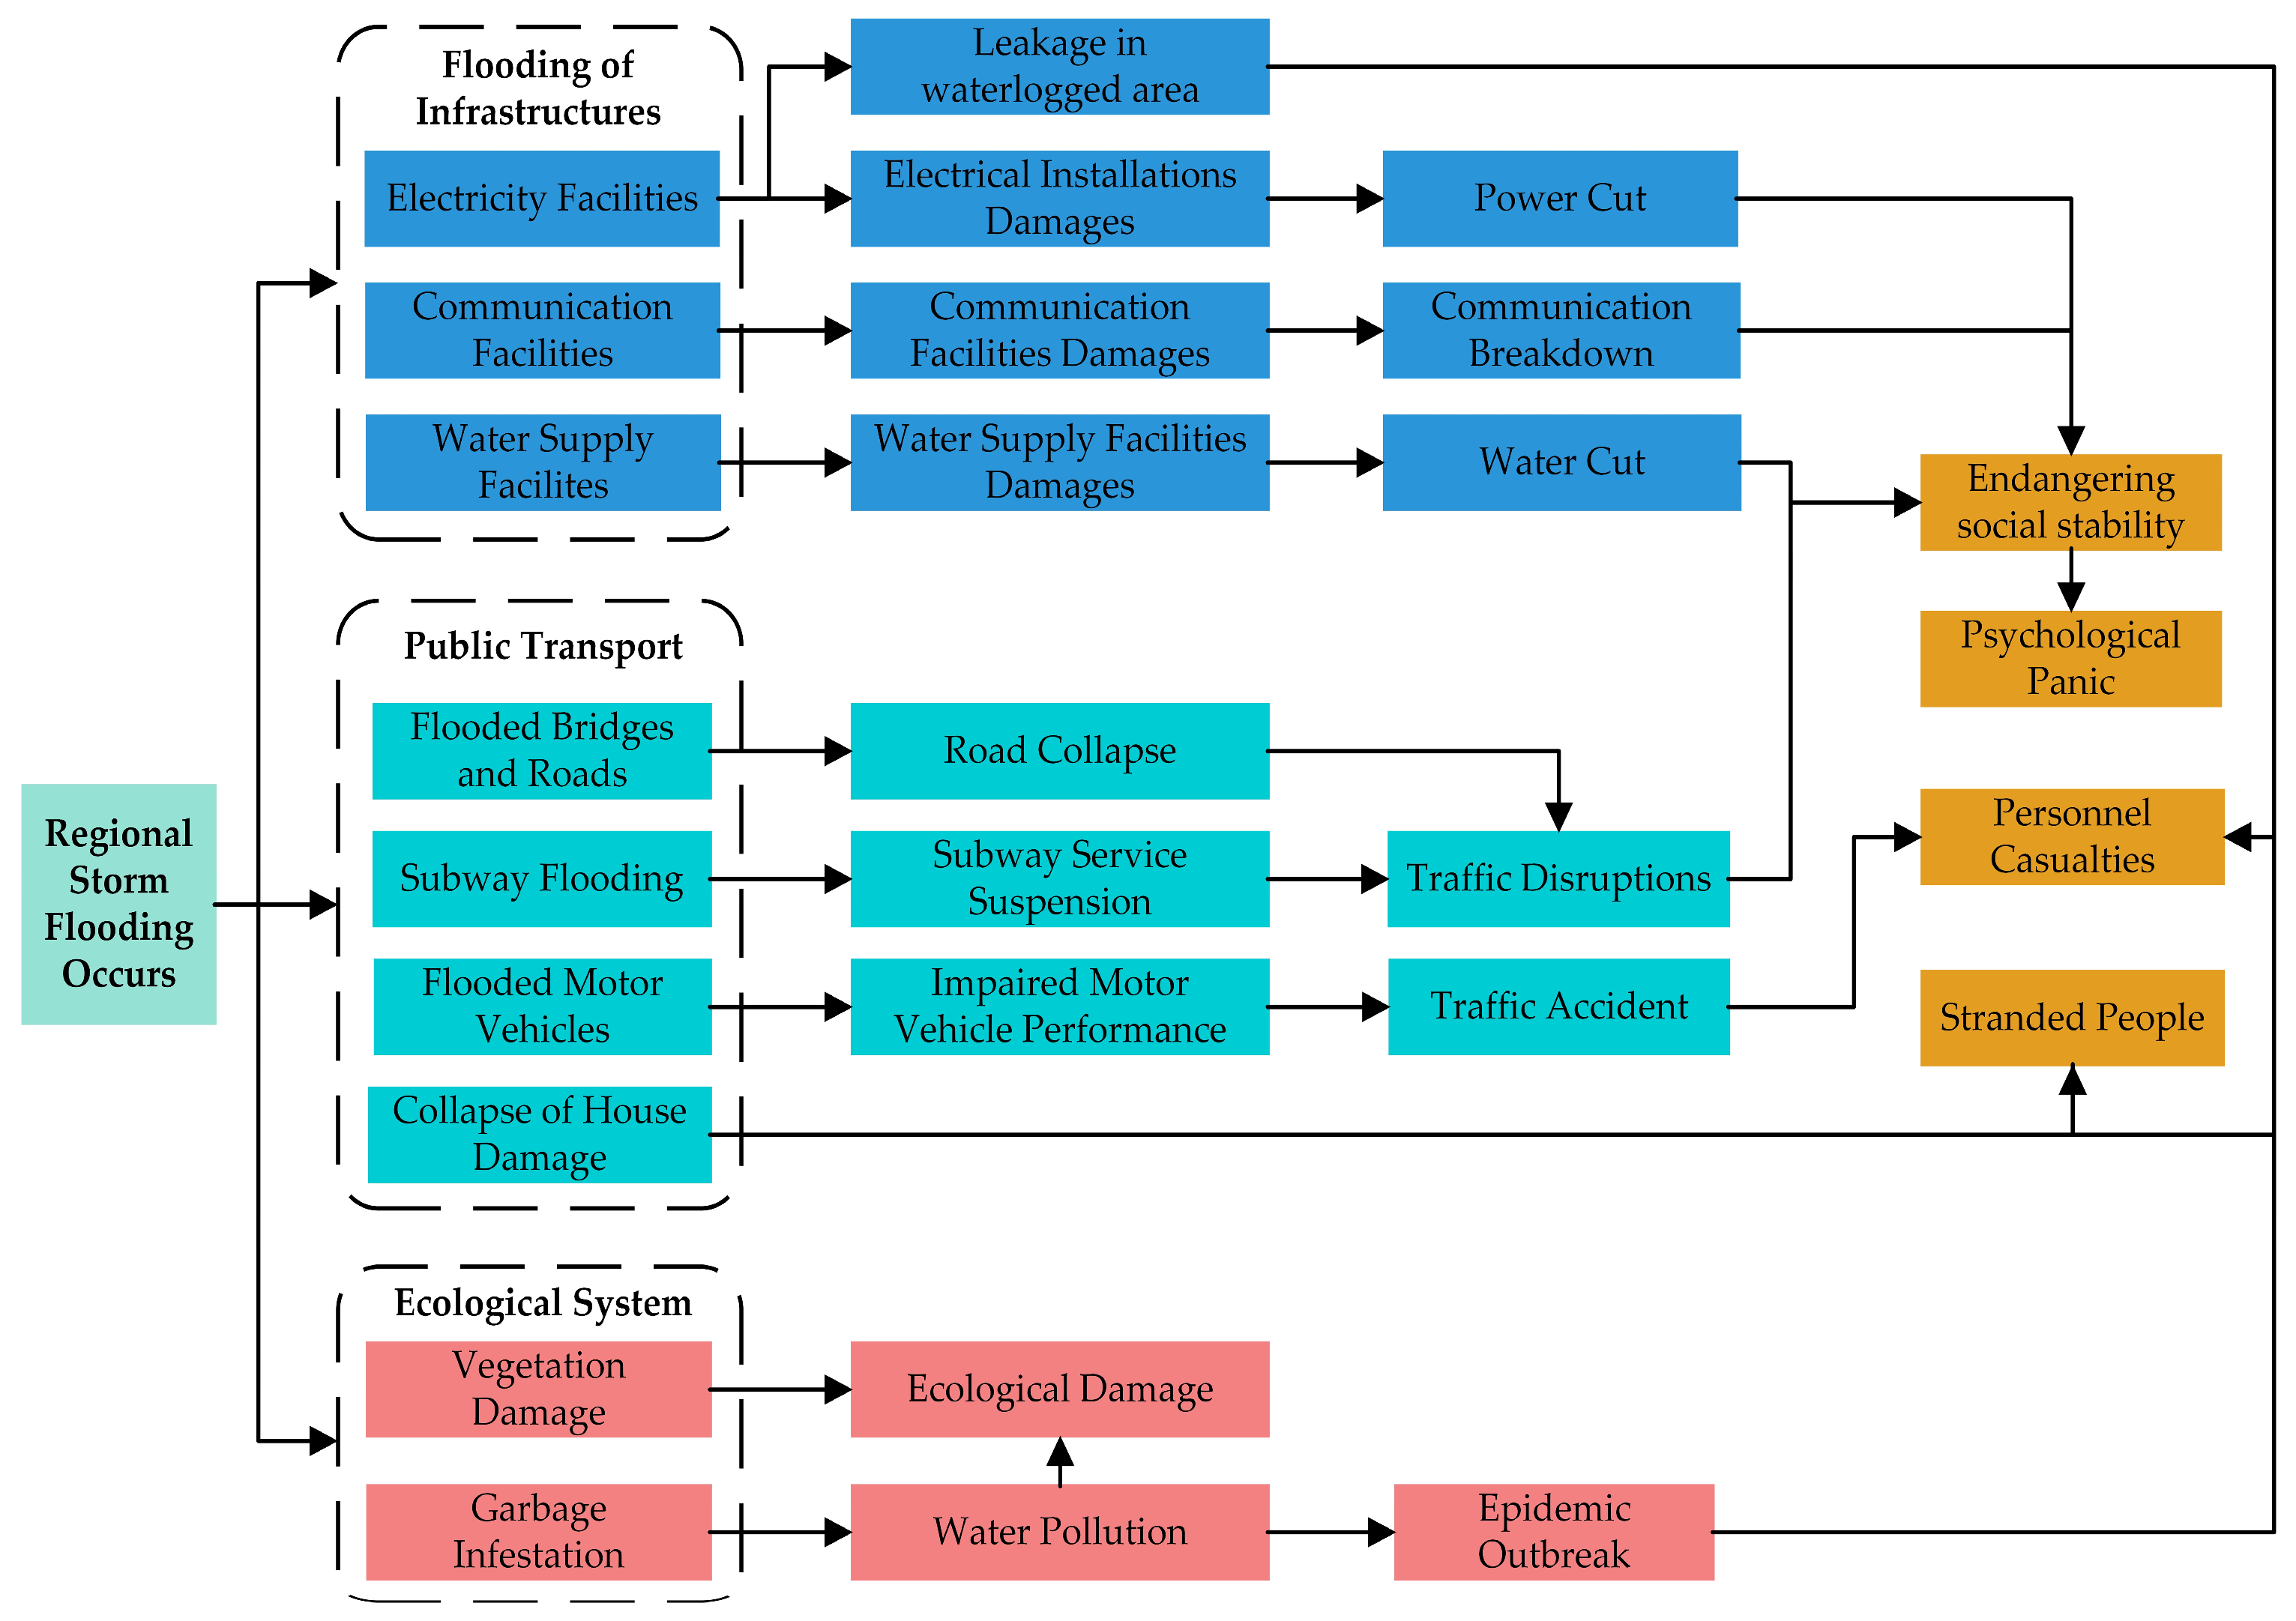
Extreme events such as urban waterlogging are inherently dynamic; i.e., they evolve over time, as shown in Figure 2. Therefore, spatiotemporal analysis of such catastrophic events is very important. Disaster events such as waterlogging are dynamic and evolve during the duration of flooding, and various factors such as topography, urban drainage systems, and rainfall intensity during the period of waterlogging can have an impact on this dynamically evolving behavior.
The timeline-based representation of the urban waterlogging emergency process is an effective method by of helping urban emergency management, rescue agencies, and other related departments develop waterlogging emergency plans and response strategies to deal with waterlogging events. The timeline-based urban waterlogging emergency process representation method mainly includes the following steps:
(1) Identify key events and stages in the internal flooding emergency response process, such as warning, response, rescue, and recovery. These phases are the activities and tasks that must be performed during the emergency response process.
(2) Create a timeline and place the key events and phases of the inland flooding emergency response process on the timeline. The timeline can help to clarify the sequence of the phases in the inland flooding emergency response process and to analyze and evaluate the time constraints and limitations in the inland flooding emergency response process.
(3) Detailed descriptions and analyses of each critical event and phase, including the start time and end time of the event, the event characteristics, the scope of the impacts, and the emergency response activities and tasks.
(4) Conduct relationship analysis between key events and phases in the internal flooding emergency response process, especially analyzing and evaluating the causal and interactive relationships between events.
It is important to establish a disaster preparedness action plan with a timeline for disaster events such as urban waterlogging. By planning, organizing, and allocating resources and action plans in advance and by developing timelines through the cooperation of all parties, timely emergency responses can be made when flooding events occur. The timeline-based representation of the emergency response process for urban waterlogging helps to analyze the evolutionary trajectory and dynamics of waterlogging disaster events for the better planning and implementation of disaster prevention action plans.

3.3. An Ontology Construction Method Based on Spatiotemporal Process

3.3.1. Proposed Conceptual Model

According to the characteristics of the elements in the spatiotemporal process of urban waterlogging emergency response, an ontology conceptual model is constructed, which contains five core elements: time, event, property, geographic object, and emergency response activity. Specifically, the model is capable of dynamically capturing and storing spatiotemporal changes and supports the querying of the relationships between entities at any time node or time period. Compared with traditional static knowledge graph ontology models, the model is able to flexibly retrieve and analyze the evolution of a flood event, including but not limited to the beginning, development, and decline of the event, thus providing a powerful tool for users to gain insights into the spatiotemporal dynamics of a flood event.
(1) Time, including time point and timeline: The waterlogging event’s occurrence, development, and recession have the property of time. There is a temporal relationship between t i and t i + 1 , which is expressed in terms of r t e m p o r a l .
(2) Event: Urban waterlogging is a dynamic process of occurrence and evolution, including the induction, occurrence, development, and end of a disaster and a series of secondary disaster events.
(3) Property: Property is used to describe urban waterlogging disaster events, geographic objects, and emergency response activities, which is a further refinement of the logical architecture of the ontology. In urban waterlogging emergency response ontology, spatiotemporal properties are a typical characteristic, and they also include non-spatiotemporal properties, such as the depth of waterlogging, the scope of the disaster, etc.
(4) Geographic object: Urban waterlogging involves a series of geographic objects, including the disaster-inducing environment and disaster receptor. The disaster-inducing environment mainly refers to the elevation, climate, topography, water system, vegetation, soil, etc. The disaster receptor mainly refers to the sum of the people and property that may suffer from meteorological threats. The spatial distribution and impact range of waterlogging can be determined by describing and modeling the geographic objects.
(5) Emergency response activities: The changes with time during the spatiotemporal evolution of the waterlogging event correspond to different emergency response activities, which are denoted as E r a n .
Based on time, disaster event, and emergency action, the conceptual model of urban waterlogging emergency ontology can be represented as follows:
O n t o l o g y = < E v t r i , E r a t r i , T t r i > ,
where E v t r i denotes a disaster event at a given time, E r a t r i denotes emergency response activity at that time, and T t r i denotes change over time.
The conceptual model of urban waterlogging emergency ontology is shown in Figure 3. According to the representation method of urban waterlogging emergency elements and relations, a cubic graph structure with time level is established to represent the evolution of urban waterlogging emergency elements and relations. A timeline T represents a collection of times, which, for simplicity, we refer to as “timepoints”. These timepoints could represent individual events, observations, or milestones in a temporal sequence, which contains discrete instances relevant to our analysis. This structure can be used to represent the development and change process of two-dimensional graphics along the time dimension to express the evolution of urban waterlogging events, geographical objects, property, and emergency tasks over time. Given a time value, the state of the corresponding section can be obtained from the 3D cube.

3.3.2. Ontology Construction for Urban Waterlogging Emergency

(1) Conceptual hierarchy construction
This includes three aspects: urban waterlogging events, emergency response, and geographical objects. Urban waterlogging has obvious spatiotemporal characteristics, which are categorized into four phases: early warning period, beginning period, climax period, and demise period. Urban waterlogging events are a complex system developed by multiple factors interacting and influencing each other, and conductivity is one of its remarkable features. Once serious damage occurs in a certain system, it will be propagated through the correlation between urban systems, eventually leading to urban waterlogging and present chain development.
The emergency response mainly involves two aspects: emergency organization and emergency action. Emergency organizations mainly include emergency response agencies, relevant departments, and personnel. Emergency response operations are divided into three phases: before, during, and after a disaster. These phases are listed according to the entire process of the disaster, with different objectives and tasks for each phase.
The geographic objects of urban waterlogging events are diverse, mainly including two aspects: the disaster-inducing environment and the disaster receptor.
(2) Property construction
The description of urban waterlogging event attributes can be divided into four categories: temporal properties, spatial properties, morphological properties, and disaster properties, as shown in Table 1. These properties are interconnected and constitute the ontology of urban waterlogging events.
The emergency response to urban waterlogging can be categorized into three phases: pre-disaster, disaster, and post-disaster, involving task names, categories, and descriptions of actions, as shown in Table 2.
(3) Relationship construction
The semantic relations of urban waterlogging emergency ontology refer to the semantic associations between different entities, i.e., their meanings and semantic relationships. In the construction of urban waterlogging emergency ontology, there are usually three types of semantic relationships: implementation, containment, and logical relationships. The semantic relationships are shown in Table 3.
(4) Generation of ontology
After the above steps, the definition of classes and properties in the urban waterlogging emergency ontology is basically completed. Using GeoSPARQL to represent spatial data, we can define and query features (features class), geometrical objects of features (geometries class), and spatial relationships between these objects. The geometries’ classes can be points, lines, circles, and polygons. In order to facilitate the spatial query using Cypher language in Neo4j at a later stage, we use the WKT (Well-Known Text) format to store the geometries. The basic structure of the WKT format consists of geometric object types (e.g., POINT, LINESTRING, and POLYGON) and specific coordinate data. We define and process spatial relations through GeoSPARQL and define time-related descriptions based on the existing temporal ontology [50]. Then, relying on the Unified Modeling Language (UML), we transform these classes and attributes into an intuitive, easy-to-understand, and highly extensible ontology model, as shown in Figure 4.

3.4. Urban Waterlogging Emergency Knowledge Graph Construction Method

3.4.1. Construction Process

The flowchart is shown in Figure 5. There are two types of knowledge sources: structured data sources (e.g., thematic databases); and semi-structured and unstructured data sources (e.g., disaster public announcement web pages, domain literature). For thematic databases, field values, records, and other valid information needed for research can be obtained directly from the database. For the unstructured data in the ubiquitous network, the data volume is larger and contains more information, which is an important data source for this study and needs to be considered. The knowledge graph is constructed using XLNet-BiLSTM-CRF to extract entity, relationship, and event information from textual and web data. This includes flooding event information concerning the time, location, people involved, and the disaster itself from news reports and social media. The knowledge is fused and stored in a Neo4j graph database. Finally, the urban waterlogging emergency knowledge graph will be generated.

3.4.2. Entity and Relation Extraction

For the task of entity recognition in disaster events, we adopt a deep-learning-based approach. This is because deep-learning-based methods can fully utilize large-scale data and the expressive power of deep neural networks to recognize entities in complex and variable disaster events accurately.
We use an entity recognition and relationship extraction model based on XLNet-BiLSTM-CRF [51], which has shown excellent performance in related tasks and is in line with our task requirements. This model first converts the text into a sequence of word vectors then obtains each word’s contextual information by BiLSTM feature extraction, as shown in Figure 6. BiLSTM consists of two LSTMs: one forward LSTM and one backward LSTM.
  • Forward LSTM: Starting from the starting position of the input sequence, it gradually reads each word vector ( X i ) and generates a forward hidden state vector ( h a i ).
  • Backward LSTM: Starting from the end position of the input sequence, it reverse-reads each word vector ( X i ) and generates a backward hidden state vector ( h b i ).
Then, the model concatenates the forward hidden state vector ( h a i ) and the backward hidden state vector ( h b i ) to obtain a complete bidirectional hidden state vector ( H i ). Finally, the model outputs a label prediction score ( y i ) for each input data point (usually a word in a sentence or sequence).
Next, the context information is modeled using XLNet to obtain the context representation of each word. Then, the context representation is input into the CRF layer for label prediction. Finally, entity recognition and relationship extraction are performed based on the prediction results. By combining the advantages of XLNet, BiLSTM, and CRF, the model can effectively capture the semantic information in the text and improve the accuracy of entity recognition and relationship extraction.

3.4.3. Knowledge Fusion

Knowledge fusion is the process of integrating and merging knowledge extracted from different sources. We use the method based on attribute and structure similarity for knowledge fusion based on the cosine similarity function [33] and that based on the Jaccard similarity function to calculate the degree of attribute similarity and the degree of neighboring node similarity, respectively, as shown in Figure 7.
(1) Attribute similarity calculation
In order to assess the similarity of two entities at the attribute level, the cosine similarity function is used in this paper. Specifically, the attribute set of each entity is regarded as a vector in the vector space, the dimensions of the vector correspond to different attributes, and the values of the attributes are normalized as the components of the vector. Subsequently, the cosine value of the angle cosine between two vectors is calculated using the cosine similarity formula, which is used as a measure of attribute similarity.
(2) Structure similarity calculation
In order to measure the similarity of two entities in the graph structure, the Jaccard similarity function is introduced in this paper. This method evaluates the degree of similarity between two entities in the graph structure by comparing the ratio of the intersection and concatenation of their sets of neighbor nodes. The selection of neighbor nodes is based on direct relationships between entities, such as edge connections.
(3) Combined scoring and fusion decision making
By means of weighted summation, the two are combined into a composite score to fully reflect the degree of similarity between two entities. Based on a set threshold, determine whether the similarity between the two entities is high enough to decide whether to fuse them into one entity. If the similarity is higher than the threshold, the fusion operation is performed, including merging attributes, updating link relationships, etc.
In the knowledge fusion process, the similarity function between the computed entity E 1 and the candidate entity E 2 is defined as follows:
F s i m E 1 , E 2 = 1 α M 1 , M 2 E 1 , E 2 f s i m a E 1 , E 2 + α f s i m n E 1 , E 2 ,
f s i m M 1 , M 2 = j = 1 n w 1 j w 2 j W 1 W 2 ,
W 1 = j = 1 n w 1 j 2 ,
W 2 = j = 1 n w 2 j 2 ,
f s i m n E 1 , E 2 N E 1 N E 2 N E 1 N E 2 .
0 ≤ α ≤ 1, and α = 0.5 is chosen for the experiment. M 1 and M 2 denote the set of tokens of the two entity strings, which are converted into n-dimensional vectors, and the weight of token in each vector is calculated as w . The attribute similarity of the entities is obtained through Equation (3). Meanwhile, the ratio of the intersection and concatenation of the set of common neighbors of the two entities to be aligned is calculated to determine the degree of similarity between the neighboring nodes of the entities, and the structural similarity is obtained through Equation (6). When conducting several experiments, we adjusted the threshold interval from 0.3 to 0.6 in steps of 0.05 and finally found that the fusion results were most satisfactory when the threshold was set to 0.55. Finally, the attribute similarity and structural similarity correspond to their respective weights to obtain the final knowledge fusion results. Table 4 shows some knowledge fusion examples.

3.4.4. Knowledge Storage Based on Neo4j Graph Database

The data in the field of urban waterlogging emergency response, after entity identification, relationship extraction, and knowledge fusion, form knowledge triples of <entity, relationship, entity> and <entity, property, property value> structures, as shown in Figure 8, and the next step needs to store and manage these triples in a specific way. There are three main storage methods for knowledge graphs: RDF, relational, and graph databases. Aiming at the characteristics of an urban waterlogging emergency knowledge graph, we adopt the storage method of the Neo4j graph database. This method can solve the storage and query problem of complex relations and attributes in the urban waterlogging emergency knowledge graph and can also well support the interaction and fusion of knowledge graph data.

4. Experiment and Result Analysis

4.1. Experimental Data Acquisition and Processing

The data sources include two types, as shown in Table 5: (1) structured data sources, mainly from the National Earth System Science Data Center, which contain the basic geographic, sociodemographic, and flood prediction and forecasting data of the affected area in their thematic data; (2) unstructured data sources, mainly from disaster public announcement web pages and encyclopedias; for example, the National Disaster Reduction Official Website (NDRCC) and Wikipedia contain information on the time and location of the disaster, the attributes of the disaster-causing factors, and information on the damage of the disaster, such as that inflicted on the population, housing, and economy.
We directly obtain the required data records for structured data types. For unstructured data types, we obtain disaster-related data through web crawlers. In this paper, a total of 159 urban waterlogging events from January 2020 to December 2022 were acquired as a data source from which to obtain information about urban waterlogging event entities and their attributes. Through entity and relationship extraction, the corresponding urban waterlogging event attributes and relationships are extracted, including the start time and end time, “province–city–county” information, disaster-causing factors, the affected population, the emergency relocation of the population, the number of damaged houses, and the economic losses. Most of these waterlogging events occur in southeastern China, i.e., in the plains of the middle and lower reaches of the Yellow River, Yangtze River, and Pearl River. The waterlogging events in megacities such as Beijing, Shanghai, and Guangzhou show a clustering effect. Waterlogging sites in these cities are more concentrated in certain areas, which may be related to the topography, drainage system layout, and land use of the cities. The incidence of internal flooding is higher in certain specific locations in the city, such as overpasses, underground garages, and underground shopping malls. Some of the results of the knowledge extraction are shown in Table 6.

4.2. Knowledge Graph Generation for Urban Waterlogging Emergency

The processed knowledge triples can be batch-imported into the Neo4j graph database using py2neo. Specifically, the nodes and relationships can be created, queried, and analyzed through Neo4j’s API and Cypher language. Such a knowledge graph can provide support for emergency management and decision making in urban waterlogging and achieve efficient management and utilization of complex urban waterlogging information.

4.3. Quality Assessment of Urban Waterlogging Emergency Knowledge Graph

The knowledge graph’s construction strives to be automated, i.e., using as little human labor as possible, but there are some quality issues. For example, data extracted from semi-structured or unstructured resources usually suffer from problems such as inconsistent information, erroneous and incomplete narratives, etc. [52]. Therefore, quality assessment of knowledge graphs is essential to knowledge graph construction [53]. Knowledge graph quality assessment dimensions generally include three items: correctness, completeness, and conciseness [54]. Correctness refers to whether the entities and relationships described in the knowledge graph are compatible with those in the real world. Completeness refers to whether the knowledge graph contains all the important entities and relationships in the domain. Succinctness is whether the knowledge graph’s description of entities and relationships is sufficiently concise and clear.
We adopt a partial gold standard approach [55] for quality evaluation, selecting part of the knowledge graph as the sample set for evaluation by sampling and manually annotating it so that we can use a smaller annotation cost to complete the assessment of the correctness, completeness, and conciseness of the knowledge graph with greater precision, and the framework of quality evaluation is shown in Figure 9.
Computational correctness: It is generally believed that knowledge from reliable data sources is usually reliable. Therefore, we use random sampling and manual comparison to compare the content in the knowledge graph with the original content in the data sources. Some entities are randomly selected as evaluation samples, which are evenly divided into n groups, and all triples involved in these entities are manually labeled, and the accuracy rate of each sampling group is calculated.
Computational completeness: Raw data from different sources are randomly extracted and knowledge triples are manually constructed and then compared with the knowledge transformed by this data in the knowledge graph. For structured and semi-structured data, each extracted datum is a set of continuous and related data. For unstructured text data, each extracted datum is a descriptive text containing multiple sentences. The entities, attributes, and relationships are manually extracted according to the ontology model in Section 3.3.2 and organized into the form of triples. In order to prevent the limitation of single-person cognition, multiple people are used to conduct multi-group experiments. The completeness calculation takes the constructed knowledge triples as the smallest unit and compares the triples in the knowledge graph with the manually constructed triples.
Computational conciseness: There are two main aspects, redundancy and data conciseness, where entity redundancy = number of redundant entities/total number of entities; and relationship redundancy = number of redundant relationships/total number of relationships. Data conciseness is used to evaluate the knowledge in the data that are not related to the urban waterlogging emergency knowledge graph; data conciseness = 1 − number of irrelevant entities/total number of entities. We calculated the conciseness degree by randomly sampling the triples in the urban waterlogging emergency knowledge graph and manually labeling the redundant entities, attributes, and relationships, such as recurrence, redundancy, and ambiguity, and comparing them with the sampled overall entities, attributes, and relationships.
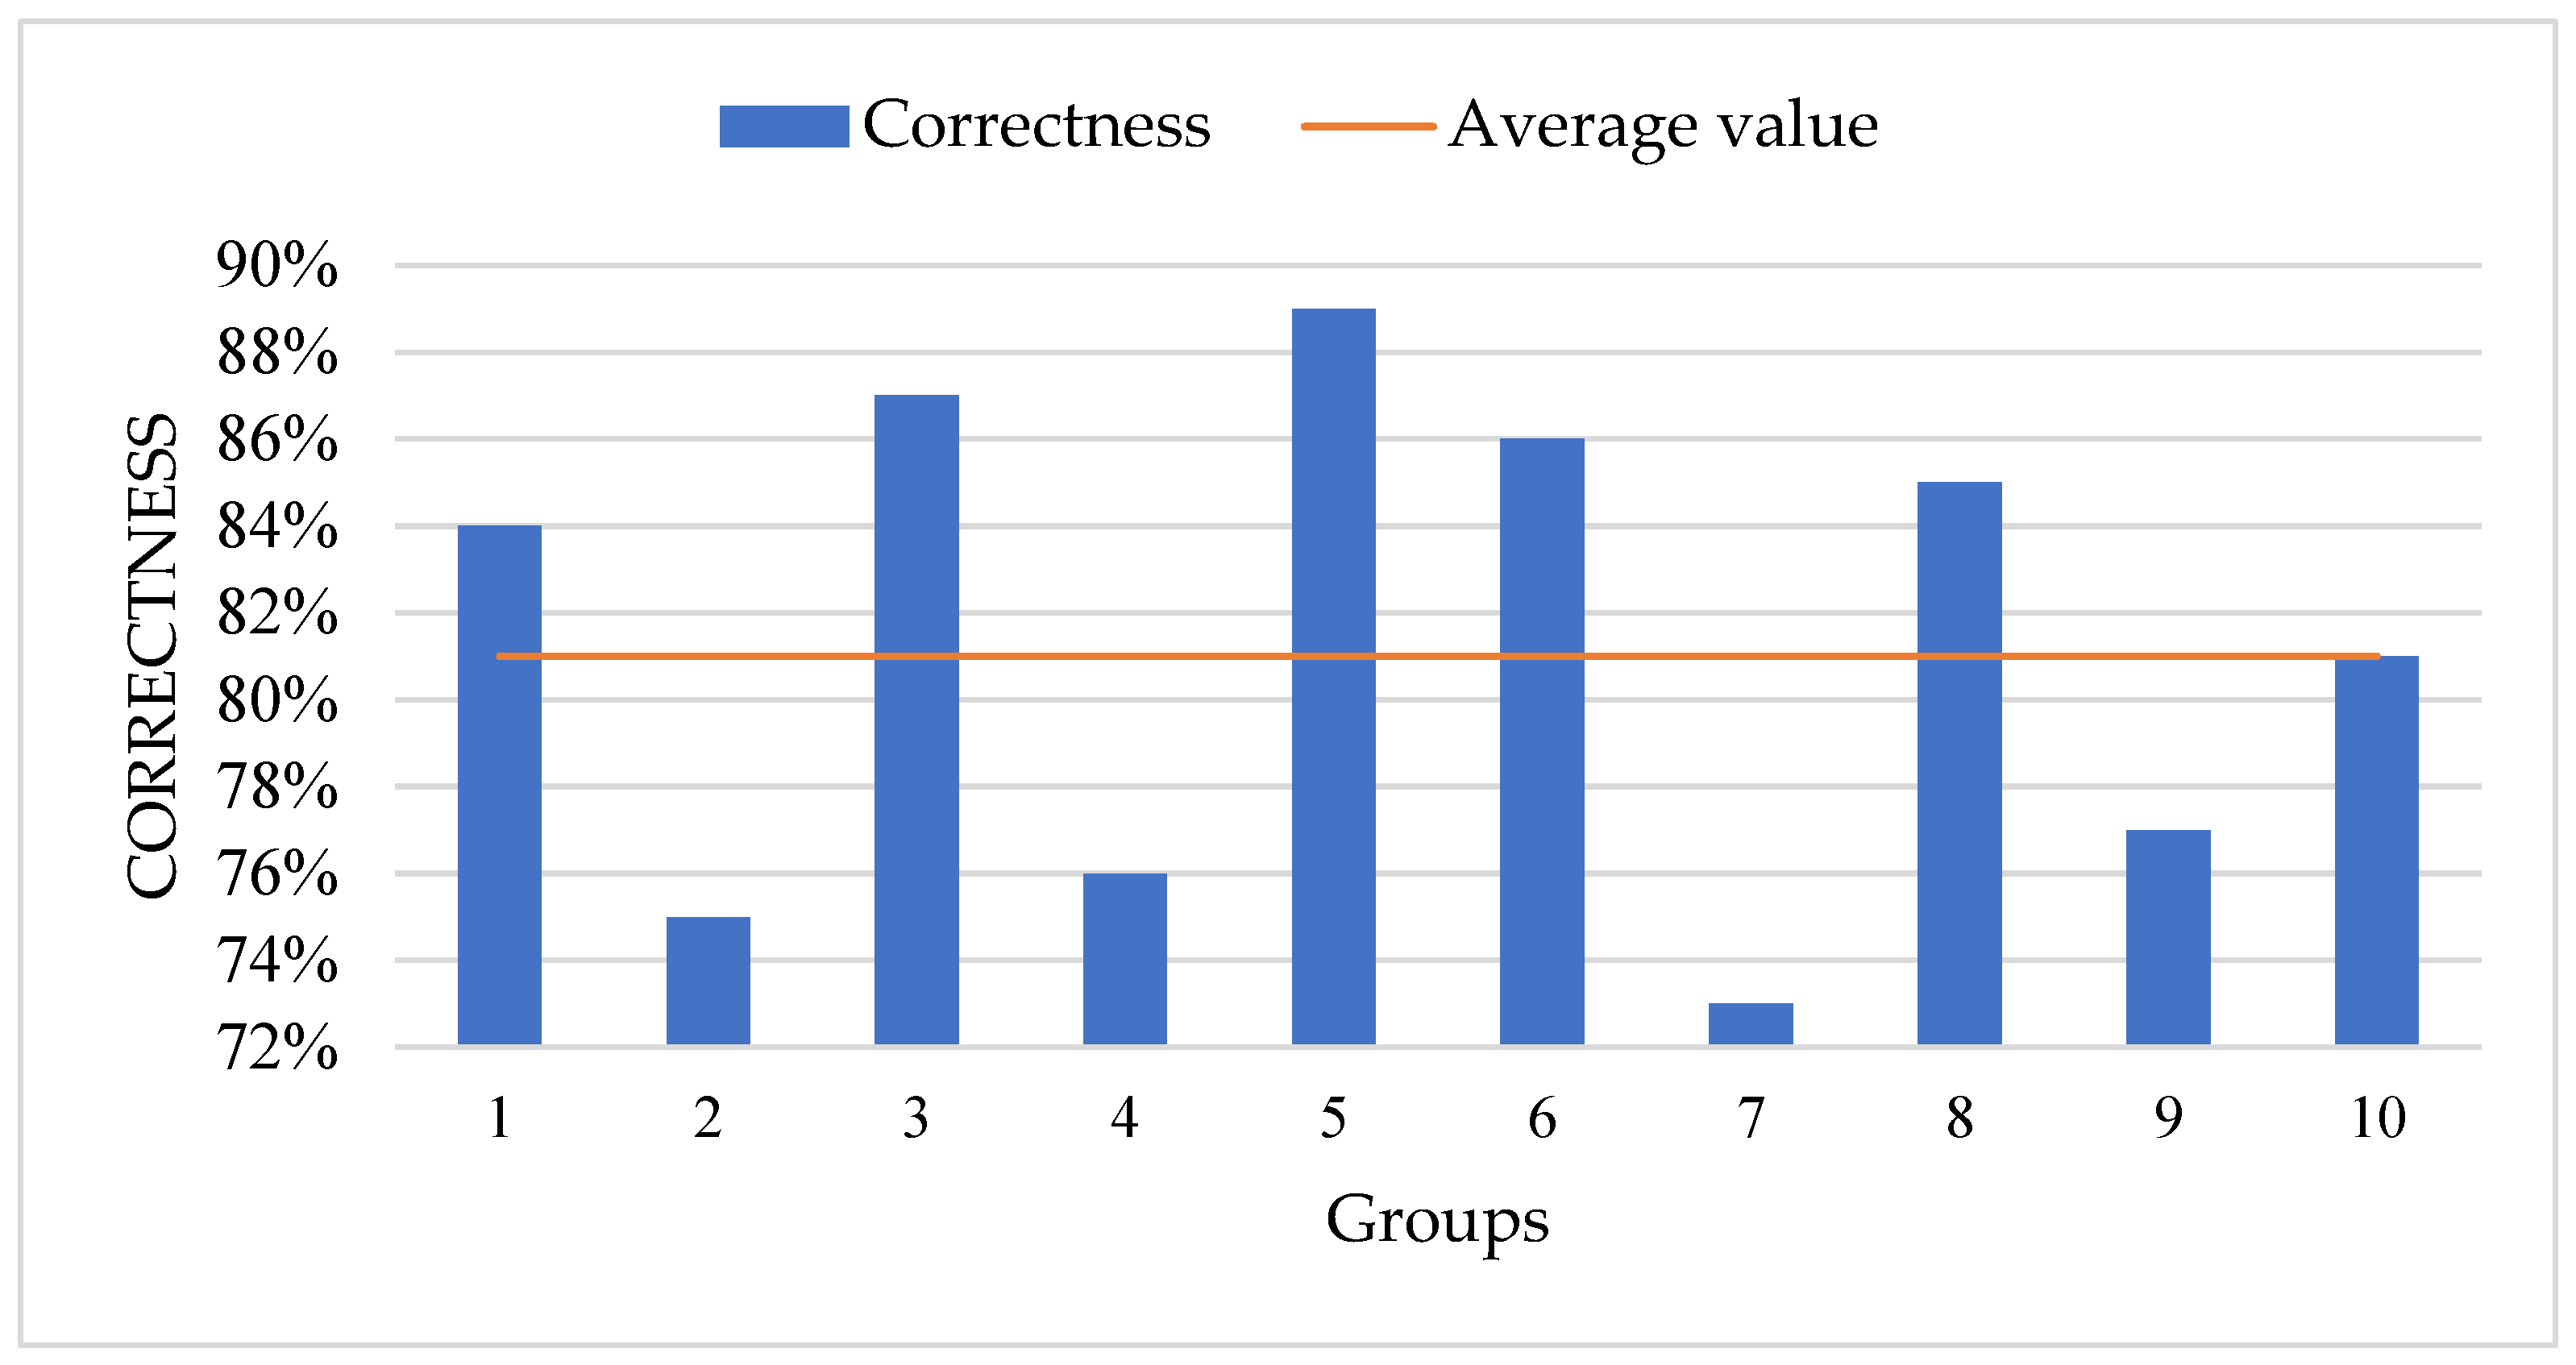
(1) Correctness assessment: In the correctness assessment, 300 entities are randomly selected, which involve a total of 1638 triples. In our random selection process, we strive to ensure that these entities can cover different types of nodes and diverse relationships. These triples are divided equally into 10 groups to be manually labeled and compared with the original data. The results of the assessment are shown in Table 7 and Figure 10, in which the highest correctness rate is 89%, the lowest is 73%, and the average correctness rate is 81%.
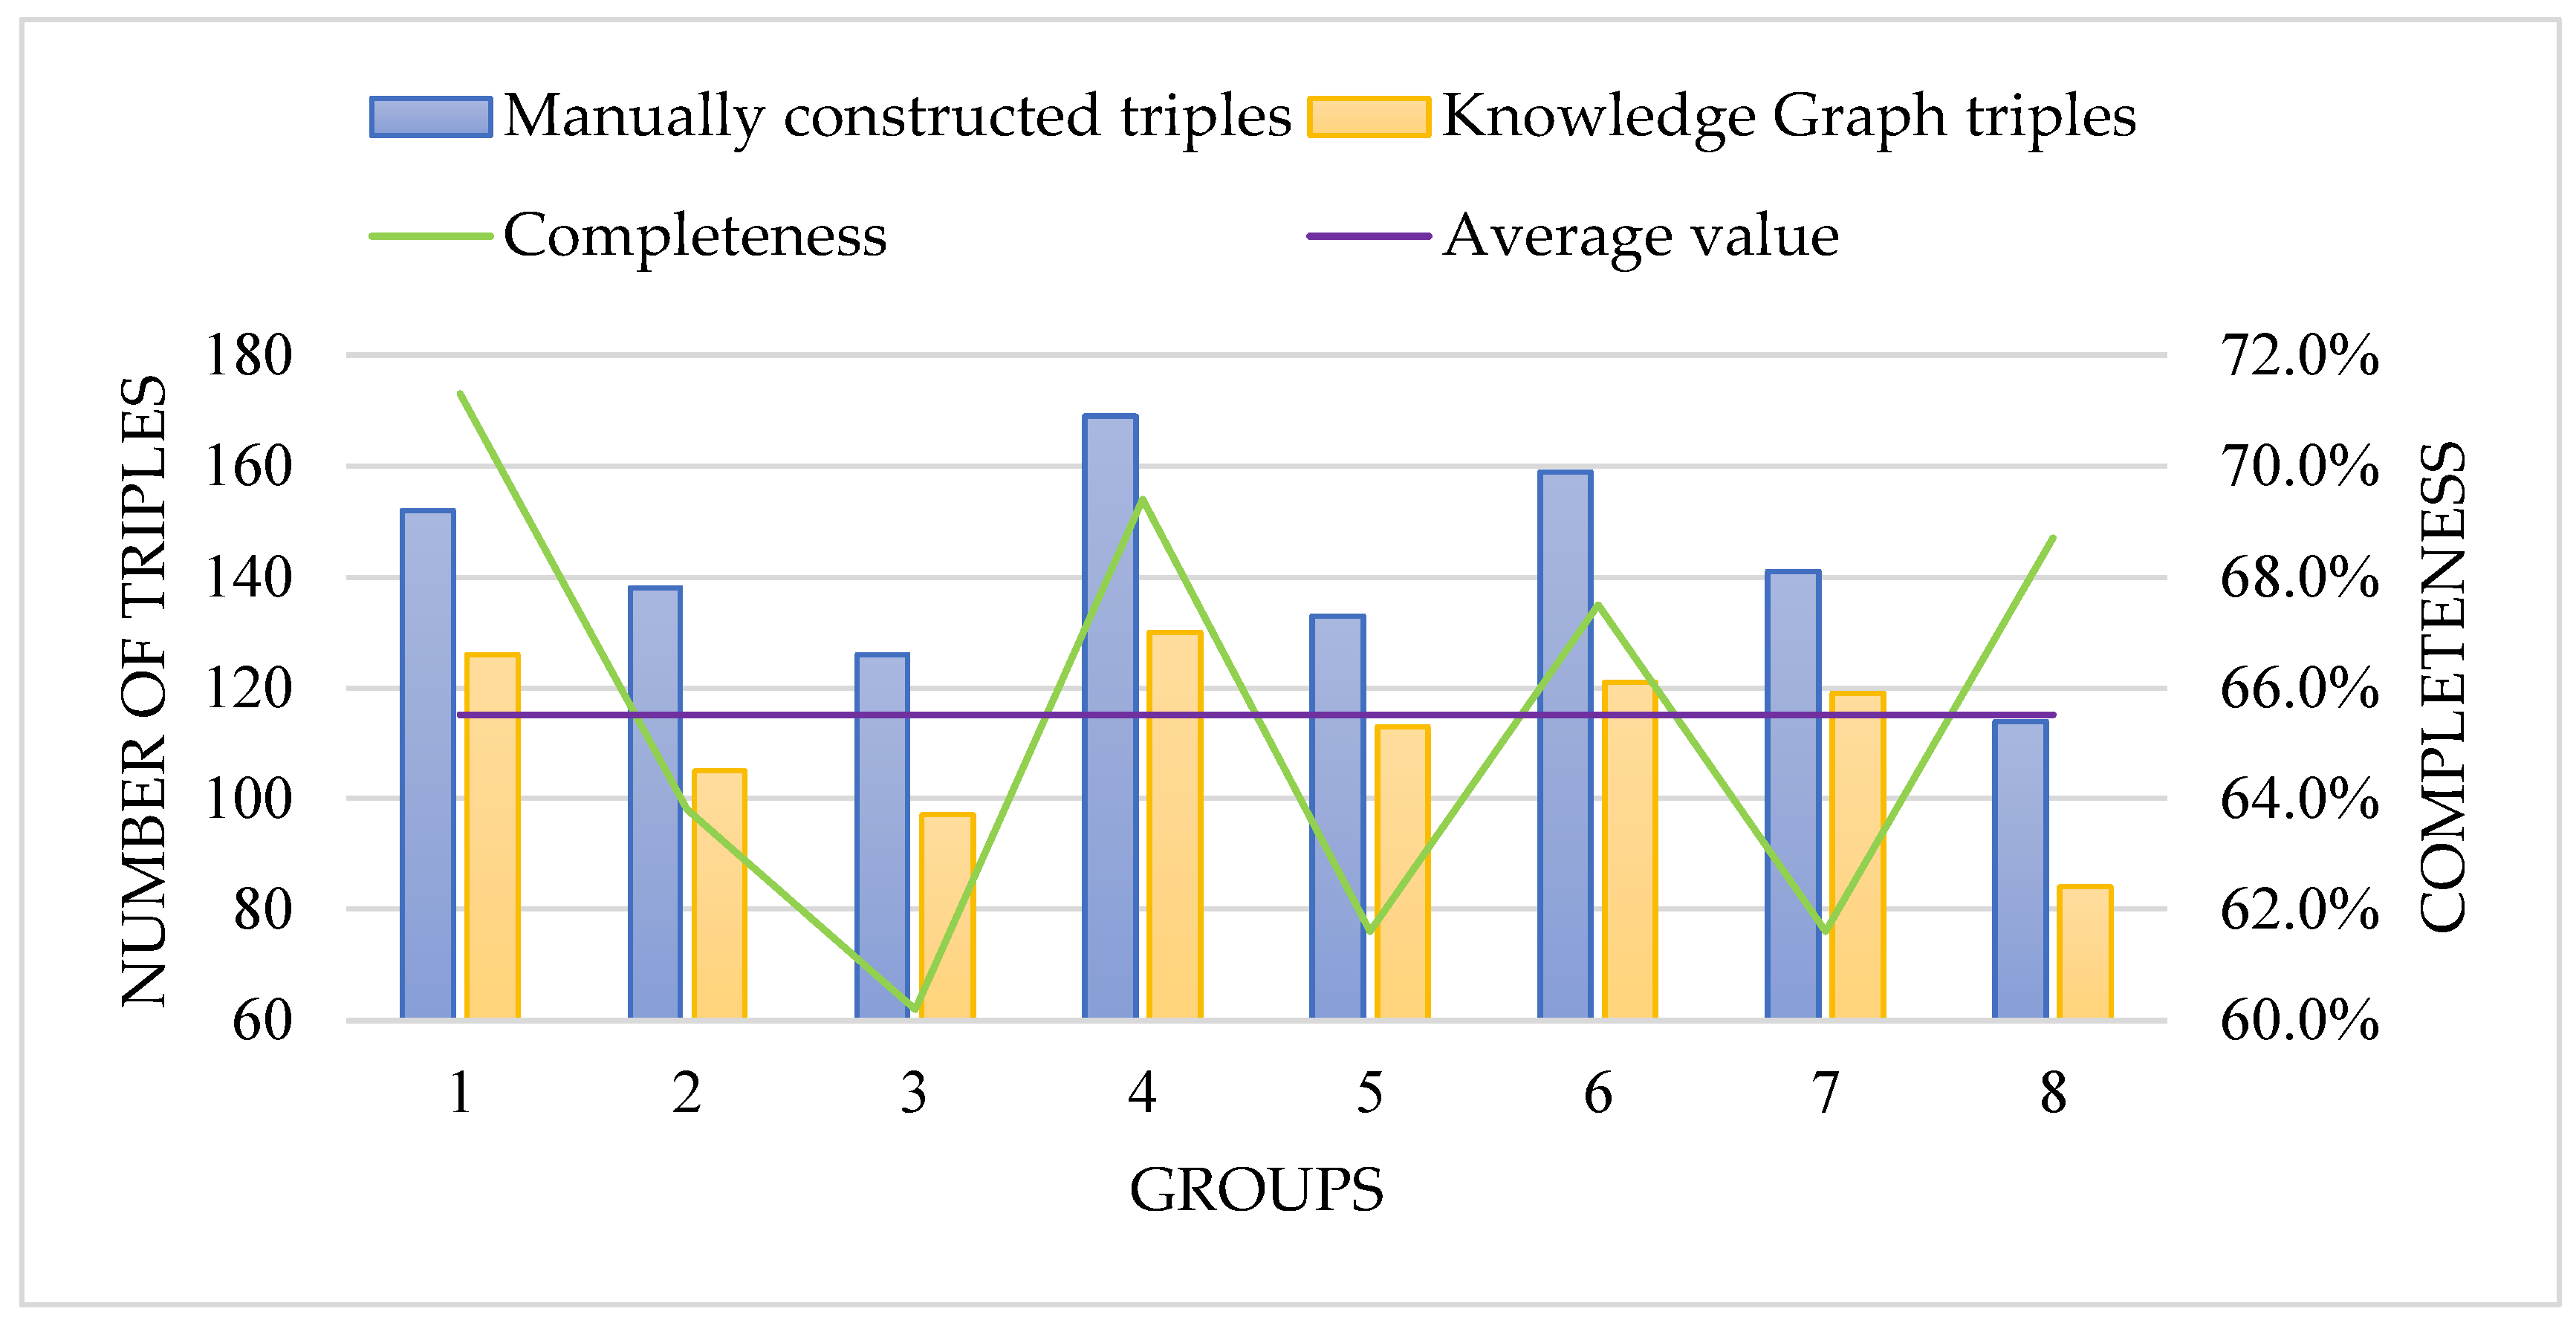
(2) Completeness assessment: In the completeness assessment, divided into eight groups, each group randomly selected 20 raw data and manually constructed knowledge triples. To calculate the completeness, they were compared with the corresponding triples in the automatically generated knowledge graph for urban waterlogging emergency. The assessment results are shown in Figure 11, where the highest completeness is 71.3%, the lowest is 60.2%, and the average completeness is 65.5%.
(3) Conciseness assessment: A total of 1638 triples and 742 entities in them were labeled for redundancy, with 126 and 179 redundant entities and relationships, respectively, and 37 entities unrelated to the urban waterlogging emergency domain were labeled, resulting in a calculated entity redundancy of 17.0%, a relationship redundancy of 10.9%, and a data conciseness of 95%.
This shows that in the evaluation experiment, the correctness is 81%, completeness is 65.5%, entity redundancy is 17.0%, relationship redundancy is 10.9%, and data concise-ness is 95%. To summarize, most of the triples in this graph are accurate, but there are still some relevant triples that are not covered, which may be due to the insufficient data sources for the construction of the knowledge graph, or the failure to extract all the knowledge during the construction process. The knowledge graph needs to be constantly updated and supplemented with new knowledge to achieve satisfactory results.

4.4. Application of Knowledge Graph for Urban Waterlogging Emergency

4.4.1. Query and Visualization

(1) Event query
By querying the records of historical waterlogging events, the pattern of waterlogging occurrence is analyzed. This allows the government to make scientific decisions and helps to improve emergency management capabilities. We can use the Cypher query language for querying and analysis, as well as the visualization tools provided by Neo4j, such as Neo4j Browser or Neo4j Bloom. In Neo4j-based Cypher query, MATCH, WHERE, and RETURN are commonly used keywords to specify the query’s schema, filter conditions, and return results. By specifying different query statements, temporal distribution queries, spatial distribution queries, and impact factor queries can be executed. The query results should meet the following requirements:
Accuracy and reliability: Query results should be constructed based on trusted data and authoritative sources to ensure the accuracy and reliability of information.
Space coverage: Query results should cover a wide geographical area, ensuring that queries and analysis can be conducted for different cities and regions.
Diversified query methods: Query results should support different types of query requirements, such as multi-dimensional queries based on geographic location, time range, degree of influence.
User friendliness: The interface design should be simple and clear and easy to operate, and users should be able to find the information they need quickly and understand the meaning of the query results.
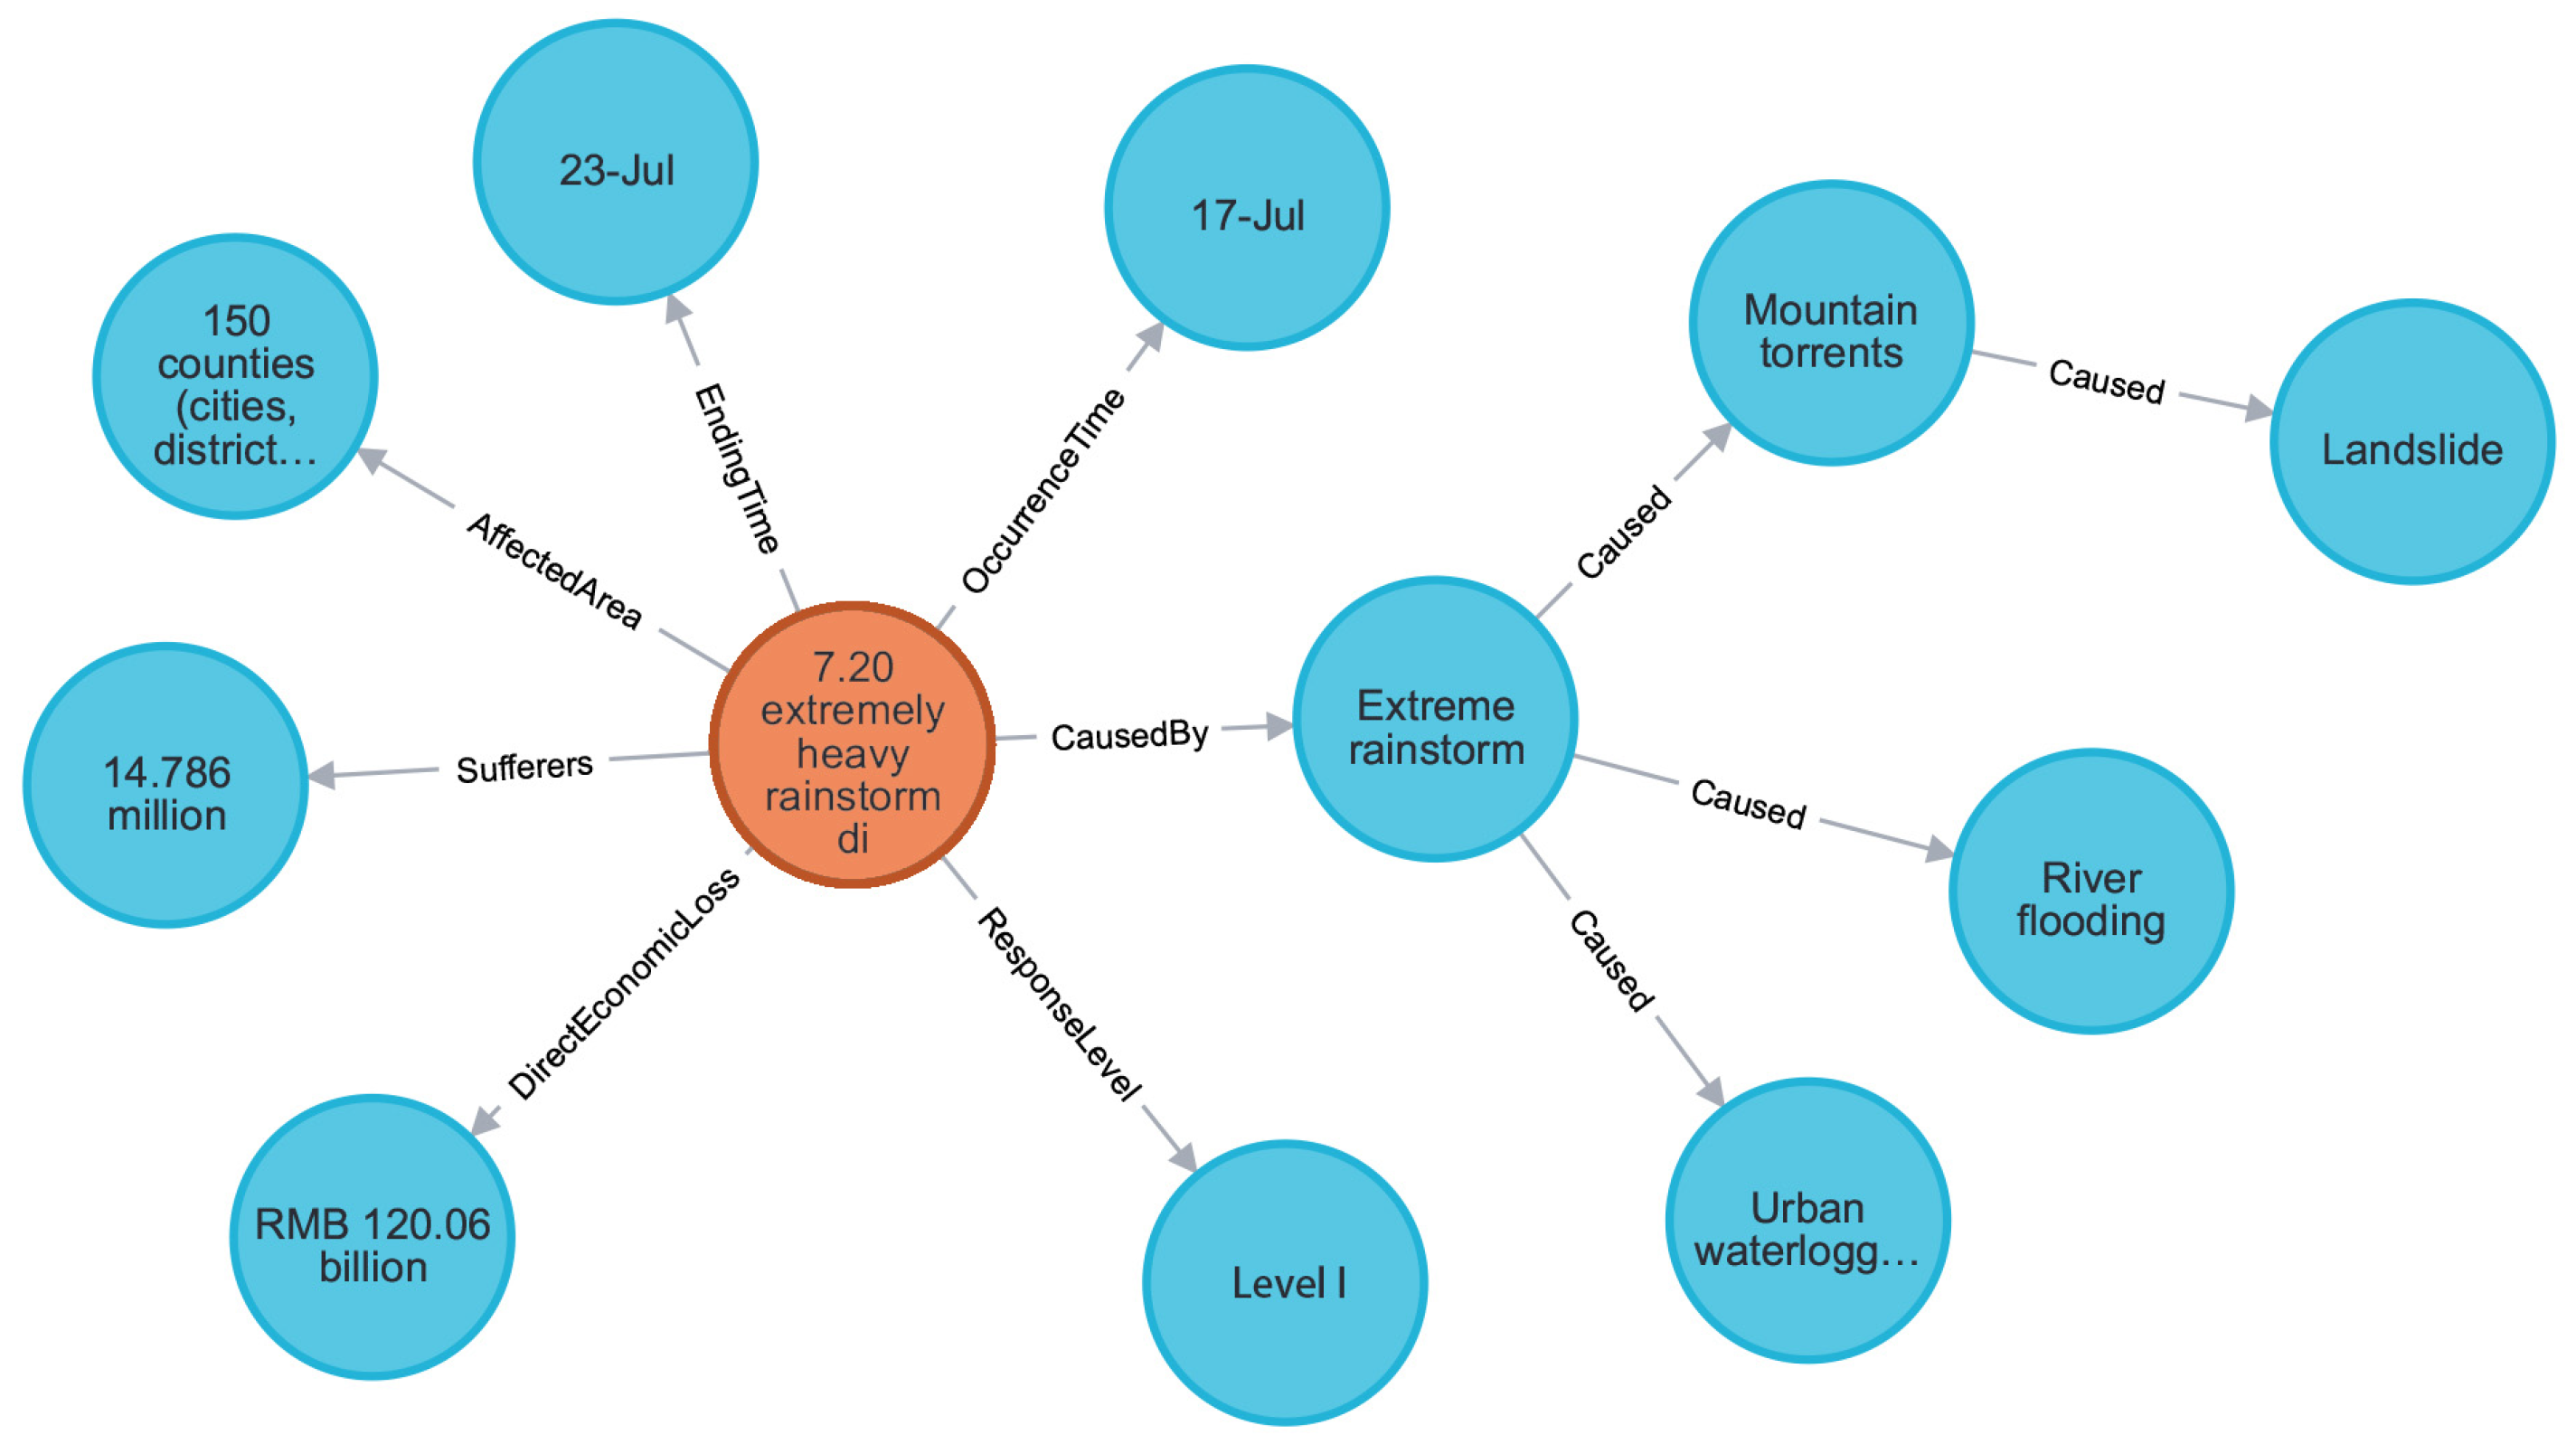
Using the Cypher language, we can query urban waterlogging events in a given city. For example, we query an urban waterlogging event that occurred in Henan Province, specifying the name of the city as “Henan” through the “city” entity, and the relationship as “HAS_FLOODING_EVENT”, returning the waterlogging event. The following are the steps for querying.
MATCH (c:City {name:” city name “})-[:HAS_FLOODING_EVENT]->(e:Event)
RETURN e
This query statement returns the urban waterlogging events for the specified city, as shown in Figure 12. This query result is accurate and able to query different cities by defining query statements. By analyzing the query results, we can see the statistics of specific data such as the affected area, the number of people affected, and the economic loss. These data intuitively reflect the severity and scope of influence of the rainstorm event. The cause analysis reveals the background and conditions under which the rainstorm event occurred. The triggering and evolution of subsequent disasters are also closely related to the spatial and temporal context, with torrential rains leading to secondary disasters such as river flooding and landslides.
(2) Query using geospatial functions
Neo4j’s Geospatial plugin provides a series of geospatial functions, such as distance, withinDistance, withinRadius, for performing geospatial queries.
Example 1: Finding locations within a certain range from a specific point.
MATCH (n:Location)
WHERE geo.distance(n.location, point({x: 34.804909, y: 113.300109})) < 10,000
RETURN n.name, n.location, geo.distance(n.location, point({x: 34.804909, y: 113.300109})) AS distance
ORDER BY distance
This query returns all locations within 10 km of Zhengzhou city (latitude and longitude: 34.804909, 113.300109) and their distance from Zhengzhou city center.
Example 2: Finding locations within a polygon.
MATCH (n:Location)
WHERE geo.withinPolygon(n.location, [[34.17, 112.42], [34.17, 114.14], [34.45, 114.14], [34.45, 112.42], [34.17, 112.42]])
RETURN n.name, n.location
This query returns all locations that lie within the specified polygon. The polygon is defined by a series of points (latitude/longitude pairs) that are arranged in a clockwise or a counterclockwise order.

4.4.2. Analysis of Urban Waterlogging Emergency Events

(1) Event correlation analysis
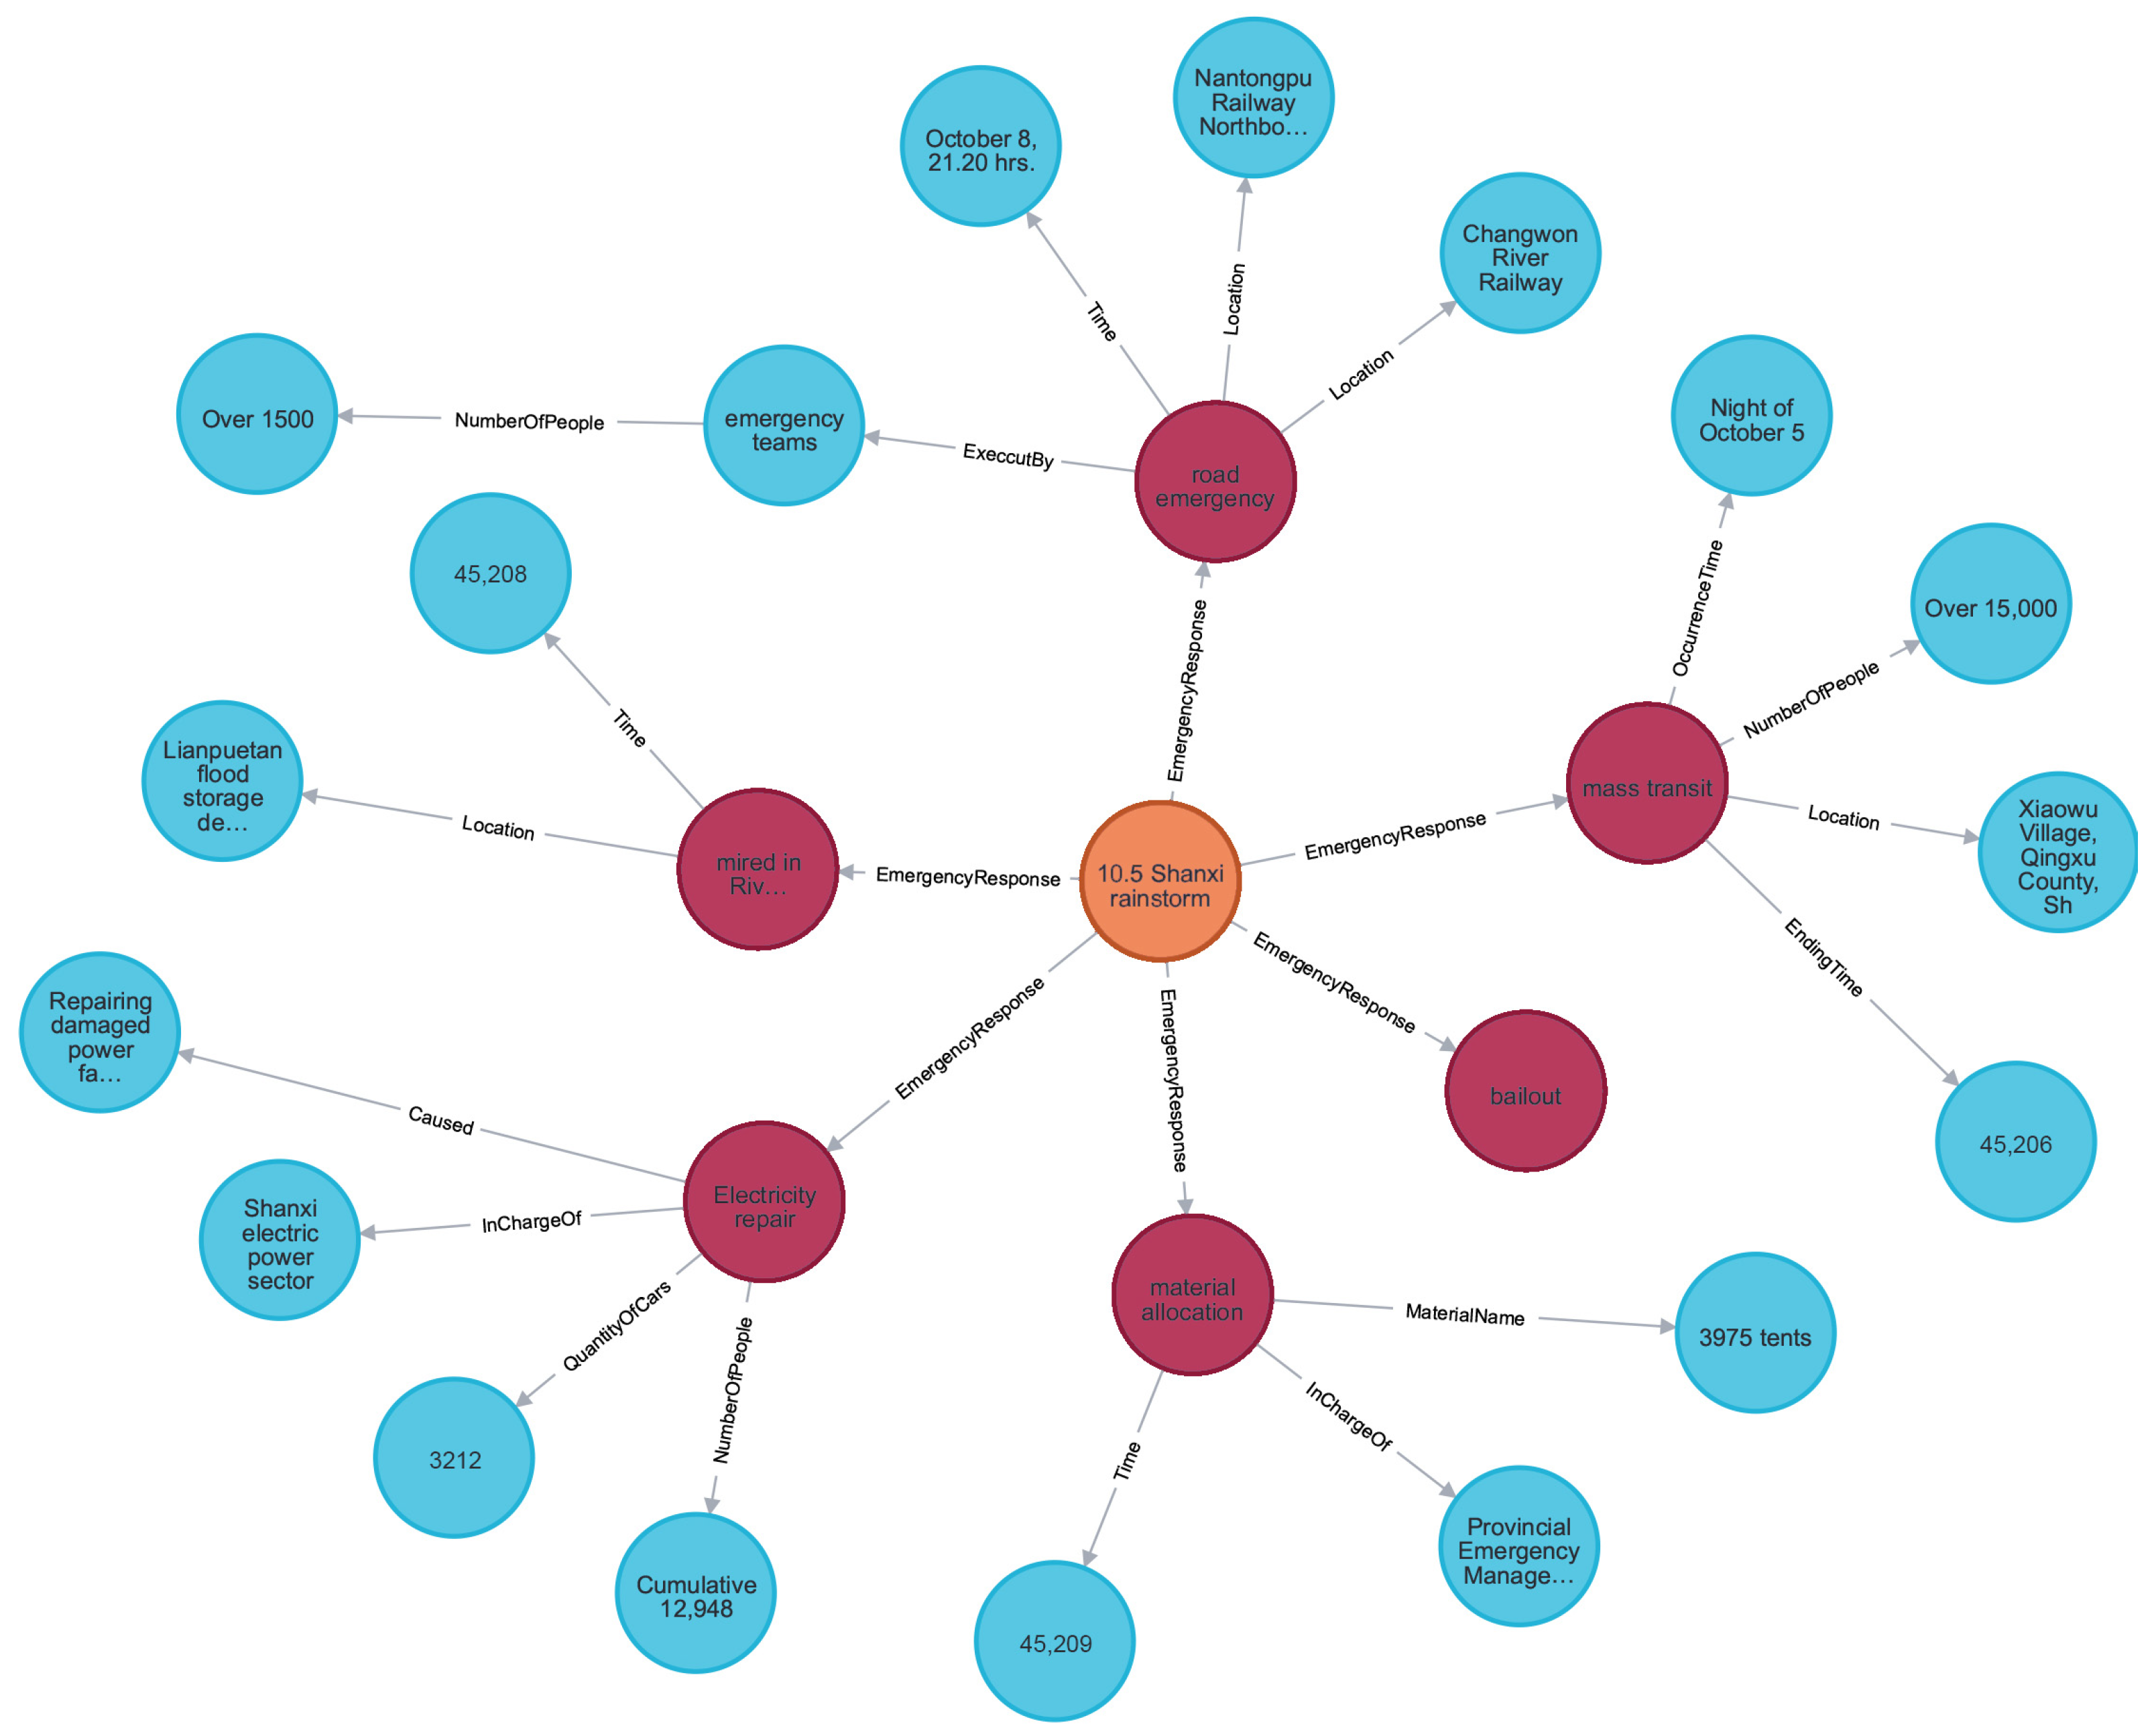
The relationship between the waterlogging event and the emergency response plan can be queried through the MATCH and WHERE statements to better understand the cause of the event and the response measures. The following is a sample Cypher query statement.
MATCH (n:Event)-[r:RELATED_TO]->(m:ResponsePlan)
WHERE n.name = “October 2021 Shanxi rainstorms “ AND r.relation_type = “emergency_response”
RETURN n,r,m
Through the above Cypher query statement, we can obtain the emergency response plans related to the “October 2021 Shanxi rainstorm” event, as shown in Figure 13, and further analyze whether these emergency response plans are effective and need to be improved. In this way, we can better understand the relationship between the flooding event and the emergency response plan and provide a reference basis for the development of a more effective emergency response strategy.
(2) Event Evolution Analysis
With the MATCH and WHERE statements, it is possible to query the evolutionary relationships of waterlogging events in time and space to better understand the evolutionary patterns of the events. For example, we can query the waterlogging events that occurred in Jiangsu Province within the past year to understand their occurrence time and duration. The query statement can be shown as follows.
MATCH (n: WaterloggingEvent)
WHERE n. occurrence time >= date(“2022-01-01”) AND n. occurrence time < date(“2022-12-31”)
RETURN n. event name, n. occurrence time, n. duration, n. occurrence area, n. response level
At the same time, in the urban waterlogging emergency knowledge graph, the event evolution analysis algorithm can be used to analyze the evolution of waterlogging events in time and space quantitatively, such as the change of the outbreak timing, the duration, and the influence range of the event. As shown in Figure 14, based on the results of the event evolution analysis, it can be seen that the occurrence time of rainstorms and waterlogging disasters in Jiangsu Province in 2022 is mostly concentrated in the period from June to September, and the duration is mostly 2–3 days. The causes of rainstorms and waterlogging are twice as many as those of typhoons, and the affected areas are mainly located in the Huaibei and Huaibei regions. Therefore, event evolution analysis can better understand the development process of waterlogging events and provide a reference for formulating emergency response strategies.

5. Discussion

Most of the current research on geographic ontologies and knowledge graphs focuses on the overall characteristics of geographic elements and tends to ignore domain-specific spatial characteristics. However, emergency response to urban waterlogging requires a conceptual framework that integrates general geographic properties and domain-specific spatial knowledge rules. Our approach addresses this gap by integrating the influencing factors and property features related to urban waterlogging into the knowledge graph construction. Existing knowledge maps in geography and disaster domains mainly describe static facts and relationships between geographic entities or events. They largely neglect the characterization of spatiotemporal process knowledge, which is critical for understanding urban flood dynamics and emergency response. This limitation highlights the urgent need for methods that can effectively capture and analyze spatiotemporal process knowledge in knowledge graphs. This study proposes a timeline-based representation of urban waterlogging emergency processes. In order to represent the spatiotemporal characteristics and evolutionary patterns of urban waterlogging more comprehensively, we further constructed an ontology conceptual model based on spatiotemporal processes. The model abstractly defines the concepts of urban waterlogging events, emergency response measures, and related geographic objects and establishes the hierarchical structure, attributes, and spatiotemporal semantic relationships among these concepts. By using a hybrid top-down and bottom-up approach, we successfully modeled the spatiotemporal processes associated with urban waterlogging and emergency response.
However, due to the complexity of the problem, some shortcomings still remain. First, more elements need to be considered to further summarize the refinement of concept descriptions in the ontology library, as well as to expand and refine the axioms and the semantic constraint rules in order to improve the effectiveness of its comprehensive application. Second, when conducting the completeness assessment, the average completeness is 65.5%, which may be due to the insufficient data sources of the knowledge graph construction, so the data scope can be further expanded to include pictures, videos, and other data sources to improve its practicability. Third, in the section on entity and relationship extraction, we adopt the model architecture of XLNet BiLSTM CRF, a combination that has demonstrated excellent performance in the paper [12] and performs equally well in the application scenario of this paper. However, given the space limitation, we were not able to analyze it in an exhaustive comparison with other state-of-the-art models, which, to some extent, constitutes a limitation of this study. Finally, during the practical application, it is very inconvenient for people who are not familiar with Neo4j and do not have a programming foundation; this is because we are using Cypher language for querying. Therefore, further designing a Q&A form for querying and analyzing the knowledge graph will be needed in future research.

6. Conclusions and Future Directions

In this paper, we studied the method of constructing a knowledge graph for urban waterlogging emergencies based on spatiotemporal processes. Extreme events like urban waterlogging are dynamic and evolve over time, so we proposed a timeline-based representation of the urban waterlogging emergency response process. In addition, various factors, such as the topography, the urban drainage system, and the rainfall intensity during inundation, which are constantly evolving during the flooding continuum, have an impact on this dynamic evolving behavior. We have explored and analyzed these factors and investigated the conceptual framework of urban waterlogging emergency ontology and its construction method. A conceptual model of urban waterlogging emergency ontology based on spatiotemporal processes is proposed, and an ontology including conceptual hierarchies, attributes, and relationships is constructed. Then, we carried out the instance supplementation of the knowledge graph, including entity identification, relationship extraction, knowledge fusion, and knowledge storage, and elaborated the specific operation methods and technical means of each link. The knowledge graph is visualized, quality-assessed, and applied through specific experiments, which verifies the effectiveness and application value of the proposed method.
In the future, we will consider introducing more experts in the field to conduct collaborative research to build a more comprehensive, accurate, and practical knowledge graph for urban waterlogging emergencies. We will further study how to integrate the knowledge graph for an urban waterlogging emergency with pictures, videos, and existing data on urban waterlogging monitoring and early warning to achieve better results. We will further study the entity and relationship extraction methods in the urban waterlogging emergency domain to improve the correctness and efficiency of the extraction. In addition, we will conduct a study based on urban waterlogging emergency knowledge graphs and determine how the knowledge graph query method can improve the efficiency of urban waterlogging emergency knowledge query and analysis.

Author Contributions

Conceptualization, Wei Mao and Jie Shen; data curation, Sihu Liu; formal analysis, Jie Shen and Qian Su; investigation, Wei Mao and Saied Pirasteh; methodology, Wei Mao, Qian Su and Sihu Liu; project administration, Jie Shen and Kunihiro Ishii; resources, Jie Shen, Qian Su and Kunihiro Ishii; writing—original draft, Wei Mao; writing—review and editing, Wei Mao, Jie Shen, Qian Su, Sihu Liu and Saied Pirasteh All authors have read and agreed to the published version of the manuscript.

Funding

This research was funded by the National Key R&D Program of China (Grant No. 2021YFE0112300) and the National Natural Science Foundation of China (Grant No. 42371444).

Data Availability Statement

Dataset available on request from the authors.

Acknowledgments

The authors would like to express special thanks to the editor and all the anonymous reviewers for their constructive suggestions that helped improve this manuscript.

Conflicts of Interest

Author Qian Su was employed by ShanDong EastDawn Corporation, and Kunihiro Ishii was employed by Asia Air Survey Co., Ltd., the remaining authors declare that the research was conducted in the absence of any commercial or financial relationships that could be construed as a potential conflict of interest.

References

  1. Zhang, Q.; Wu, Z.; Zhang, H.; Dalla Fontana, G.; Tarolli, P. Identifying dominant factors of waterlogging events in metropolitan coastal cities: The case study of Guangzhou, China. J. Environ. Manag. 2020, 271, 110951. [Google Scholar] [CrossRef] [PubMed]
  2. Li, W.; Zhu, J.; Pirasteh, S.; Zhu, Q.; Guo, Y.; Luo, L.; Dehbi, Y. A 3D virtual geographic environment for flood representation towards risk communication. Int. J. Appl. Earth Obs. Geoinf. 2024, 128, 103757. [Google Scholar] [CrossRef]
  3. Li, W.; Zhu, J.; Pirasteh, S.; Zhu, Q.; Fu, L.; Wu, J.; Hu, Y.; Dehbi, Y. Investigations of disaster information representation from a geospatial perspective: Progress, challenges and recommendations. Trans. GIS 2022, 26, 1376–1398. [Google Scholar] [CrossRef]
  4. Li, S.; Dragicevic, S.; Castro, F.A.; Sester, M.; Winter, S.; Coltekin, A.; Pettit, C.; Jiang, B.; Haworth, J.; Stein, A. Geospatial big data handling theory and methods: A review and research challenges. ISPRS J. Photogramm. Remote Sens. 2016, 115, 119–133. [Google Scholar] [CrossRef]
  5. Wang, S.; Zhang, X.; Ye, P.; Du, M.; Lu, Y.; Xue, H. Geographic knowledge graph (GeoKG): A formalized geographic knowledge representation. ISPRS Int. J. Geo-Inf. 2019, 8, 184. [Google Scholar] [CrossRef]
  6. Du, J.; Wang, S.; Ye, X.; Sinton, D.S.; Kemp, K. GIS-KG: Building a large-scale hierarchical knowledge graph for geographic information science. Int. J. Geogr. Inf. Sci. 2022, 36, 873–897. [Google Scholar] [CrossRef]
  7. Jiang, B.; Tan, L.; Ren, Y.; Li, F. Intelligent interaction with virtual geographical environments based on geographic knowledge graph. ISPRS Int. J. Geo-Inf. 2019, 8, 428. [Google Scholar] [CrossRef]
  8. Mai, G.; Janowicz, K.; Cai, L.; Zhu, R.; Regalia, B.; Yan, B.; Shi, M.; Lao, N. SE-KGE: A location-aware knowledge graph embedding model for geographic question answering and spatial semantic lifting. Trans. GIS 2020, 24, 623–655. [Google Scholar] [CrossRef]
  9. Zheng, K.; Xie, M.H.; Zhang, J.B.; Xie, J.; Xia, S.H. A knowledge representation model based on the geographic spatiotemporal process. Int. J. Geogr. Inf. Sci. 2022, 36, 674–691. [Google Scholar] [CrossRef]
  10. Zhou, C.; Wang, H.; Wang, C.; Hou, Z.; Zheng, Z.; Shen, S.; Cheng, Q.; Feng, Z.; Wang, X.; Lv, H. Geoscience knowledge graph in the big data era. Sci. China Earth Sci. 2021, 64, 1105–1114. [Google Scholar] [CrossRef]
  11. Sun, S.; Dustdar, S.; Ranjan, R.; Morgan, G.; Dong, Y.; Wang, L. Remote sensing image interpretation with semantic graph-based methods: A survey. IEEE J. Sel. Top. Appl. Earth Obs. Remote Sens. 2022, 15, 4544–4558. [Google Scholar] [CrossRef]
  12. Wu, X.; Gao, J.; Bilal, M.; Dai, F.; Xu, X.; Qi, L.; Dou, W. Federated learning-based private medical knowledge graph for epidemic surveillance in internet of things. Expert Syst. 2023, e13372. [Google Scholar] [CrossRef]
  13. Cao, Q.; Jiang, R.; Yang, C.; Fan, Z.; Song, X.; Shibasaki, R. Mepognn: Metapopulation epidemic forecasting with graph neural networks. In Proceedings of the Joint European Conference on Machine Learning and Knowledge Discovery in Databases, Grenoble, France, 19–23 September 2022; pp. 453–468. [Google Scholar]
  14. Li, W.; Wang, S.; Chen, X.; Tian, Y.; Gu, Z.; Lopez-Carr, A.; Schroeder, A.; Currier, K.; Schildhauer, M.; Zhu, R. Geographvis: A knowledge graph and geovisualization empowered cyberinfrastructure to support disaster response and humanitarian aid. ISPRS Int. J. Geo-Inf. 2023, 12, 112. [Google Scholar] [CrossRef]
  15. Liu, J.; Li, T.; Ji, S.; Xie, P.; Du, S.; Teng, F.; Zhang, J. Urban flow pattern mining based on multi-source heterogeneous data fusion and knowledge graph embedding. IEEE Trans. Knowl. Data Eng. 2021, 35, 2133–2146. [Google Scholar] [CrossRef]
  16. Qun, Y.; Linfu, X.; Yongsheng, L.; Rui, W.; Bo, W.; Ke, D.; Jianbang, W. Mineral prospectivity mapping integrated with geological map Knowledge graph and geochemical data: A Case Study of gold deposits at Raofeng area, Shaanxi Province. Ore Geol. Rev. 2023, 105651. [Google Scholar]
  17. Ma, C.; Kale, A.S.; Zhang, J.; Ma, X. A knowledge graph and service for regional geologic time standards. Geosci. Front. 2023, 14, 101453. [Google Scholar] [CrossRef]
  18. Li, W.; Zhu, J.; Zhang, Y.; Fu, L.; Gong, Y.; Hu, Y.; Cao, Y. An on-demand construction method of disaster scenes for multilevel users. Nat. Hazards 2020, 101, 409–428. [Google Scholar] [CrossRef]
  19. Rondón Díaz, J.D.; Vilches-Blázquez, L.M. Characterizing water quality datasets through multi-dimensional knowledge graphs: A case study of the Bogota river basin. J. Hydroinform. 2022, 24, 295–314. [Google Scholar] [CrossRef]
  20. Zhang, Y.; Zhu, J.; Zhu, Q.; Xie, Y.; Li, W.; Fu, L.; Zhang, J.; Tan, J. The construction of personalized virtual landslide disaster environments based on knowledge graphs and deep neural networks. Int. J. Digit. Earth 2020, 13, 1637–1655. [Google Scholar] [CrossRef]
  21. Yu, L.; Qiu, P.; Gao, J.; Lu, F. A knowledge-based filtering method for open relations among geo-entities. ISPRS Int. J. Geo-Inf. 2019, 8, 59. [Google Scholar] [CrossRef]
  22. Qiu, P.; Gao, J.; Yu, L.; Lu, F. Knowledge embedding with geospatial distance restriction for geographic knowledge graph completion. ISPRS Int. J. Geo-Inf. 2019, 8, 254. [Google Scholar] [CrossRef]
  23. Qiu, P.; Yu, L.; Gao, J.; Lu, F. Detecting geo-relation phrases from web texts for triplet extraction of geographic knowledge: A context-enhanced method. Big Earth Data 2019, 3, 297–314. [Google Scholar] [CrossRef]
  24. Nguyen, H.L.; Vu, D.T.; Jung, J.J. Knowledge graph fusion for smart systems: A survey. Inf. Fusion 2020, 61, 56–70. [Google Scholar] [CrossRef]
  25. Wang, H.; Fang, Z.; Zhang, L.; Pan, J.Z.; Ruan, T. Effective online knowledge graph fusion. In Proceedings of the International Semantic Web Conference, Bethlehem, PA, USA, 11–15 October 2015; pp. 286–302. [Google Scholar]
  26. Huang, Z.; Qiu, P.; Yu, L.; Lu, F. MSEN-GRP: A Geographic Relations Prediction Model Based on Multi-Layer Similarity Enhanced Networks for Geographic Relations Completion. ISPRS Int. J. Geo-Inf. 2022, 11, 493. [Google Scholar] [CrossRef]
  27. Wang, J.; Hu, Y.; Joseph, K. NeuroTPR: A neuro-net toponym recognition model for extracting locations from social media messages. Trans. GIS 2020, 24, 719–735. [Google Scholar] [CrossRef]
  28. Ding, L.; Xiao, G.; Pano, A.; Fumagalli, M.; Chen, D.; Feng, Y.; Calvanese, D.; Fan, H.; Meng, L. Integrating 3D city data through knowledge graphs. Geo-Spat. Inf. Sci. 2024, 27, 1–20. [Google Scholar] [CrossRef]
  29. Ding, L.; Xiao, G.; Pano, A.; Stadler, C.; Calvanese, D. Towards the next generation of the LinkedGeoData project using virtual knowledge graphs. J. Web Semant. 2021, 71, 100662. [Google Scholar] [CrossRef]
  30. Zou, Y.; Huang, Y.; Wang, Y.; Zhou, F.; Xia, Y.; Shen, Z. The construction of urban rainstorm disaster event knowledge graph considering evolutionary processes. Water 2024, 16, 942. [Google Scholar] [CrossRef]
  31. Berragan, C.; Singleton, A.; Calafiore, A.; Morley, J. Transformer based named entity recognition for place name extraction from unstructured text. Int. J. Geogr. Inf. Sci. 2023, 37, 747–766. [Google Scholar] [CrossRef]
  32. Li, W.; Sun, K.; Wang, S.; Zhu, Y.; Dai, X.; Hu, L. DePNR: A DeBERTa-based deep learning model with complete position embedding for place name recognition from geographical literature. Trans. GIS 2024, 28, 993–1020. [Google Scholar] [CrossRef]
  33. Trisedya, B.D.; Qi, J.; Zhang, R. Entity alignment between knowledge graphs using attribute embeddings. In Proceedings of the AAAI Conference on Artificial Intelligence, Honolulu, HI, USA, 27 January–1 February 2019; pp. 297–304. [Google Scholar]
  34. Yu, L.; Qiu, P.; Liu, X.; Lu, F.; Wan, B. A holistic approach to aligning geospatial data with multidimensional similarity measuring. Int. J. Digit. Earth 2018, 11, 845–862. [Google Scholar] [CrossRef]
  35. Worboys, M.F. A generic model for planar geographical objects. Int. J. Geogr. Inf. Syst. 1992, 6, 353–372. [Google Scholar] [CrossRef]
  36. Yi, J.; Du, Y.; Liang, F.; Zhou, C.; Wu, D.; Mo, Y. A representation framework for studying spatiotemporal changes and interactions of dynamic geographic phenomena. Int. J. Geogr. Inf. Sci. 2014, 28, 1010–1027. [Google Scholar] [CrossRef]
  37. Xue, C.; Wu, C.; Liu, J.; Su, F. A novel process-oriented graph Storage for dynamic geographic phenomena. ISPRS Int. J. Geo-Inf. 2019, 8, 100. [Google Scholar] [CrossRef]
  38. Zheng, L.; Zhou, L.; Zhao, X.; Liao, L.; Liu, W. The spatio-temporal data modeling and application based on graph database. In Proceedings of the 2017 4th International Conference on Information Science and Control Engineering (ICISCE), Changsha, China, 21–23 July 2017; pp. 741–746. [Google Scholar]
  39. Yu, B.; Zhang, C.; Sun, J.; Zhang, Y. Massive GIS spatio-temporal data storage method in cloud environment. In Proceedings of the 2018 2nd International Conference on Computer Science and Artificial Intelligence, Chengdu, China, 25–26 March 2018; pp. 105–109. [Google Scholar]
  40. Gruber, T.R. Toward principles for the design of ontologies used for knowledge sharing? Int. J. Hum.-Comput. Stud. 1995, 43, 907–928. [Google Scholar] [CrossRef]
  41. Alirezaie, M.; Kiselev, A.; Längkvist, M.; Klügl, F.; Loutfi, A. An ontology-based reasoning framework for querying satellite images for disaster monitoring. Sensors 2017, 17, 2545. [Google Scholar] [CrossRef]
  42. Giupponi, C.; Mojtahed, V.; Gain, A.K.; Biscaro, C.; Balbi, S. Integrated risk assessment of water-related disasters. In Hydro-Meteorological Hazards, Risks and Disasters; Elsevier: Amsterdam, The Netherlands, 2015; pp. 163–200. [Google Scholar]
  43. Jung, H.; Chung, K. Ontology-driven slope modeling for disaster management service. Clust. Comput. 2015, 18, 677–692. [Google Scholar] [CrossRef]
  44. De Wrachien, D.; Garrido, J.; Mambretti, S.; Requena, I. Ontology for flood management: A proposal. WIT Trans. Ecol. Environ. 2012, 159, 3–13. [Google Scholar]
  45. Wu, Z.; Shen, Y.; Wang, H.; Wu, M. An ontology-based framework for heterogeneous data management and its application for urban flood disasters. Earth Sci. Inform. 2020, 13, 377–390. [Google Scholar] [CrossRef]
  46. Parsons, S.; Atkinson, P.M.; Simperl, E.; Weal, M. Thematically analysing social network content during disasters through the lens of the disaster management lifecycle. In Proceedings of the 24th International Conference on World Wide Web, Florence, Italy, 18–22 May 2015; pp. 1221–1226. [Google Scholar]
  47. Matsuo, I.; Kuribayashi, T.; Kamura, K. Disaster Reduction Measures Against Inundation in Underground Area and Development of Disaster Prevention Action Plan Using TimeLine. J. Disaster Res. 2016, 11, 322–333. [Google Scholar] [CrossRef]
  48. Satomura, S.; Sutou, J.; Itou, K.; Hiraide, R.; Kandatsu, T.; Mizokami, H.; Kobayashi, H.; Kawashima, H.; Shirakawa, N.; Ito, T. Social Experiment for My-Timeline Development to Improve Residents’awareness of Flood Disaster Prevention. J. JSCE 2020, 8, 261–273. [Google Scholar] [CrossRef] [PubMed]
  49. Leijie, F.; Yv, B.; Zhenyuan, Z. Constructing a vertical knowledge graph for non-traditional machining industry. In Proceedings of the 2018 IEEE 15th International Conference on Networking, Sensing and Control (ICNSC), Zhuhai, China, 27–29 March 2018; pp. 1–5. [Google Scholar]
  50. Grüninger, M. Verification of the OWL-time ontology. In Proceedings of the International Semantic Web Conference, Bonn, Germany, 23–27 October 2011; pp. 225–240. [Google Scholar]
  51. Sun, J.; Liu, Y.; Cui, J.; He, H. Deep learning-based methods for natural hazard named entity recognition. Sci. Rep. 2022, 12, 4598. [Google Scholar] [CrossRef] [PubMed]
  52. Huaman, E.; Fensel, D. Knowledge graph curation: A practical framework. In Proceedings of the 10th International Joint Conference on Knowledge Graphs, Online, 6–8 December 2021; pp. 166–171. [Google Scholar]
  53. Chen, H.; Cao, G.; Chen, J.; Ding, J. A practical framework for evaluating the quality of knowledge graph. In Proceedings of the Knowledge Graph and Semantic Computing: Knowledge Computing and Language Understanding: 4th China Conference, CCKS 2019, Hangzhou, China, 24–27 August 2019; Revised Selected Papers 4, 2019. pp. 111–122. [Google Scholar]
  54. Xue, B.; Zou, L. Knowledge graph quality management: A comprehensive survey. IEEE Trans. Knowl. Data Eng. 2022, 35, 4969–4988. [Google Scholar] [CrossRef]
  55. Paulheim, H. Knowledge graph refinement: A survey of approaches and evaluation methods. Semant. Web 2017, 8, 489–508. [Google Scholar] [CrossRef]
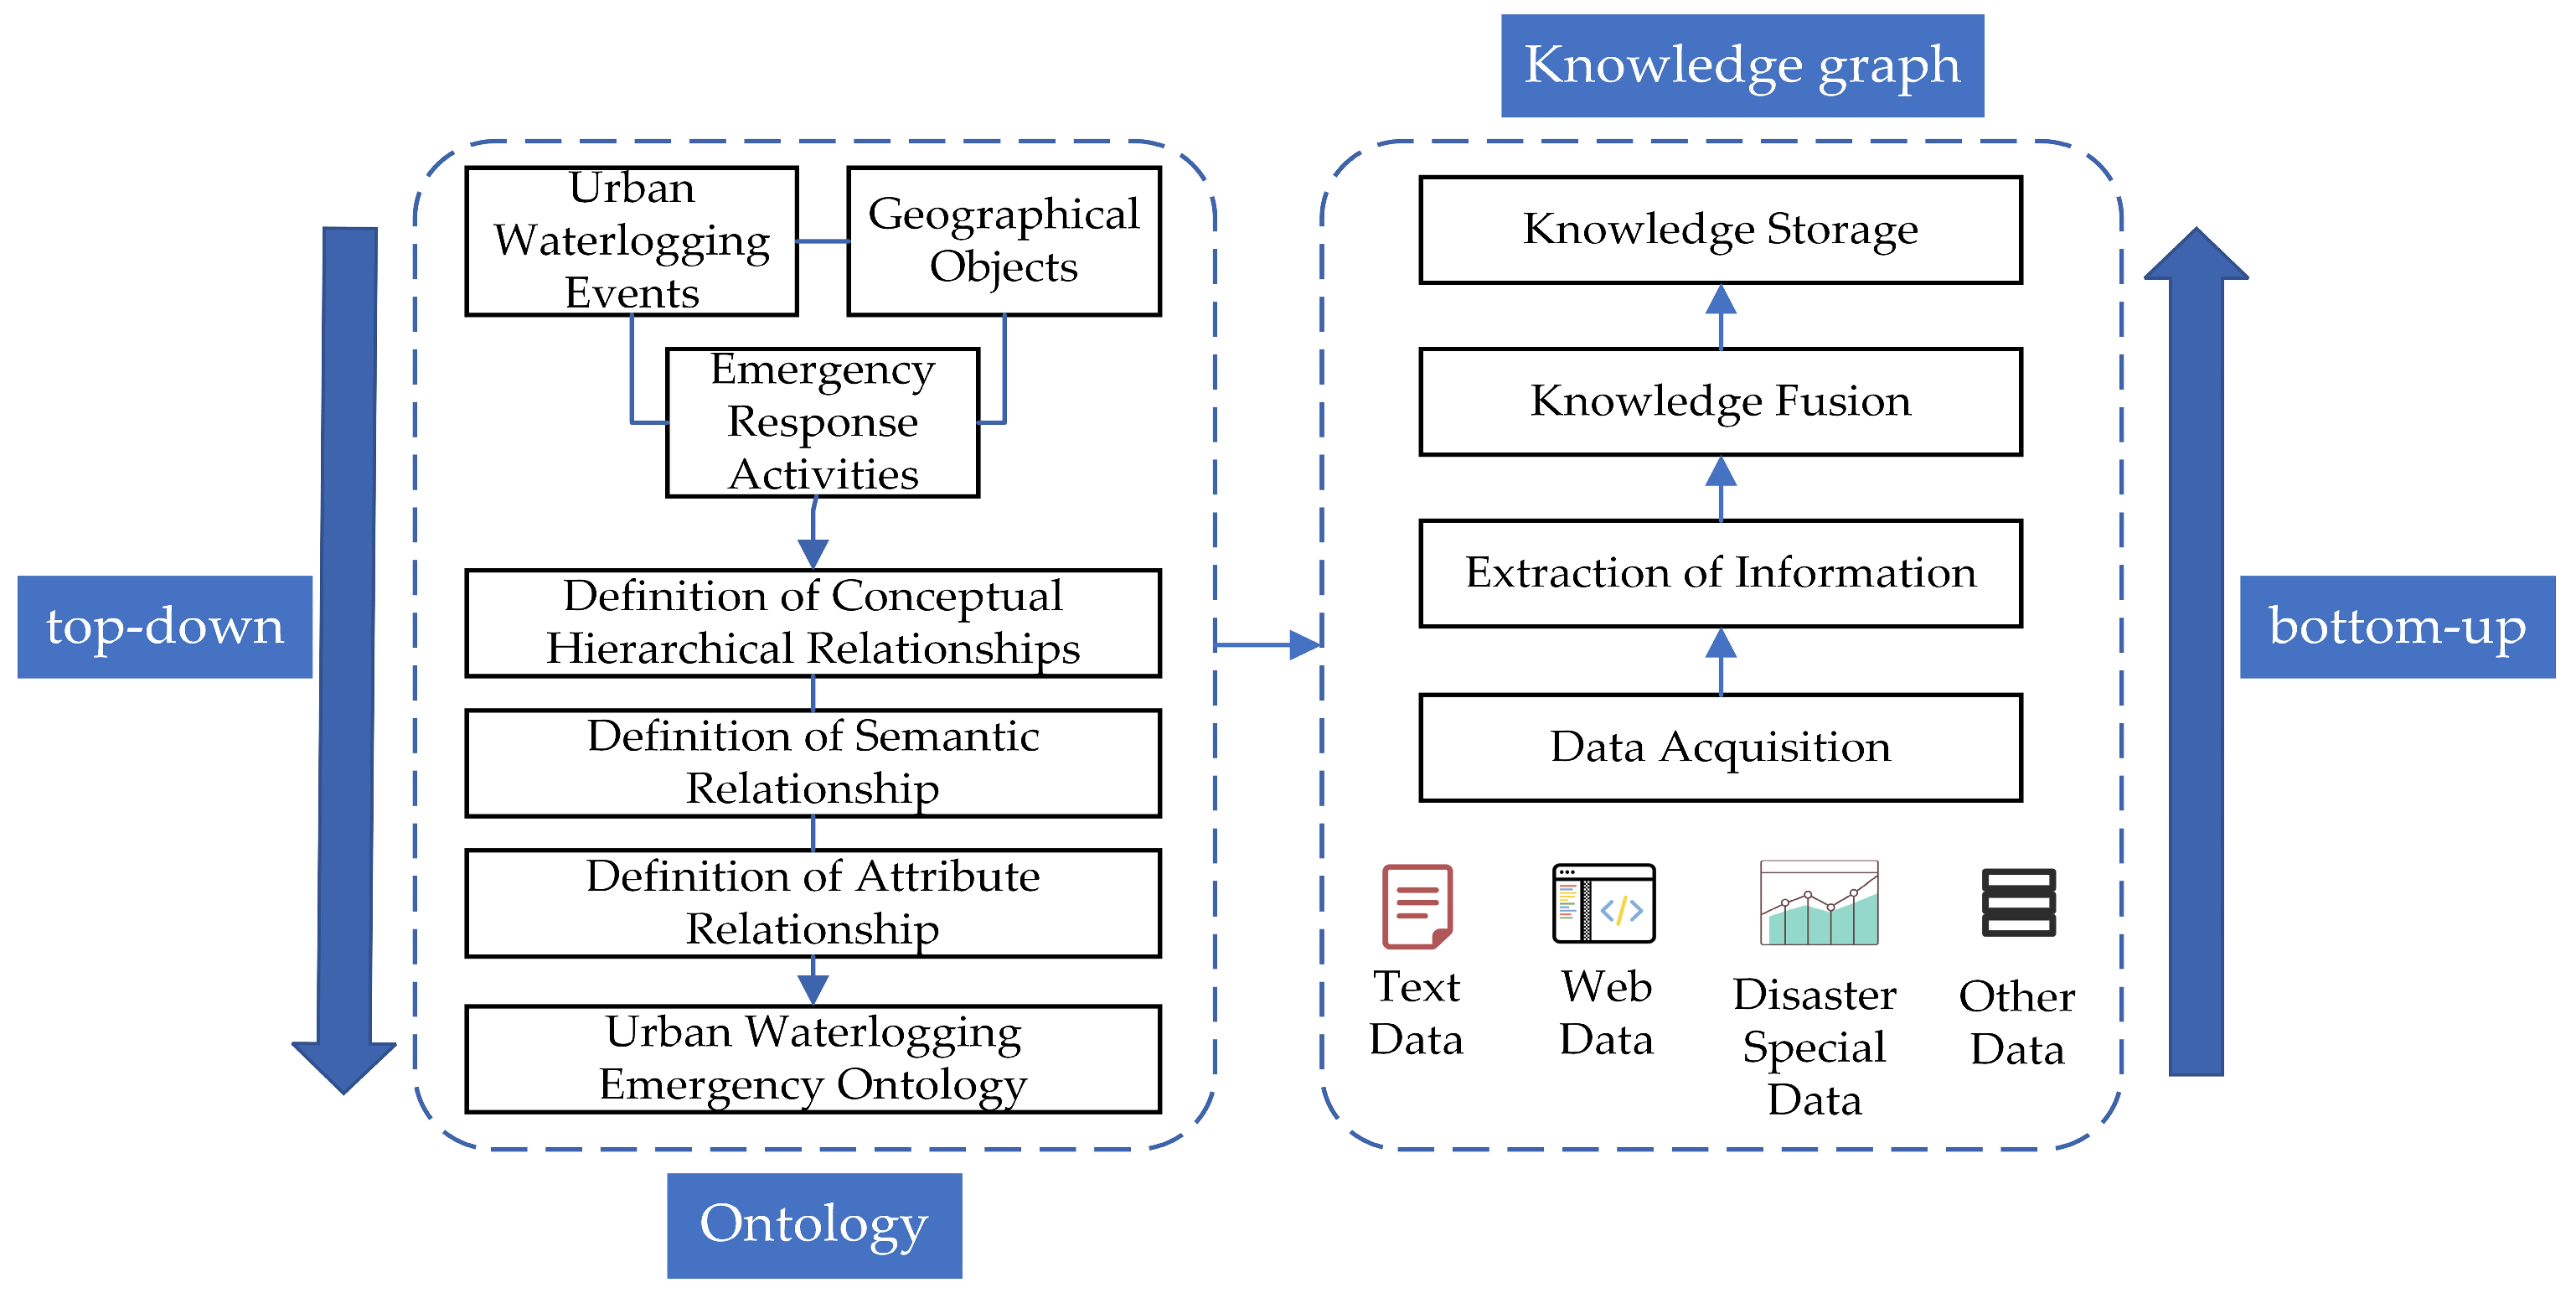
Figure 1. The overall process of constructing the urban waterlogging emergency knowledge graph.
Ijgi 13 00349 g001
Figure 2. Schematic diagram of urban waterlogging disaster chain process.
Ijgi 13 00349 g002
Figure 3. Conceptual model of urban waterlogging emergency ontology.
Ijgi 13 00349 g003
Figure 4. Urban waterlogging emergency ontology.
Ijgi 13 00349 g004
Figure 5. Flowchart for constructing knowledge graph for urban waterlogging emergency response.
Ijgi 13 00349 g005
Figure 6. Structure of the BiLSTM model.
Ijgi 13 00349 g006
Figure 7. Entity alignment methods based on the attribute–structure similarity approach.
Ijgi 13 00349 g007
Figure 8. Representation of knowledge triples.
Ijgi 13 00349 g008
Figure 9. Urban waterlogging emergency knowledge graph quality assessment framework.
Ijgi 13 00349 g009
Figure 10. Results of correctness assessment of urban waterlogging emergency knowledge graph.
Ijgi 13 00349 g010
Figure 11. Results of urban waterlogging emergency knowledge graph completeness assessment.
Ijgi 13 00349 g011
Figure 12. “7.20” rainstorm and waterlogging event in Henan.
Ijgi 13 00349 g012
Figure 13. “October 2021 rainstorm in Shanxi” event.
Ijgi 13 00349 g013
Figure 14. Analysis of rainfall event evolution in Jiangsu Province in 2022.
Ijgi 13 00349 g014
Table 1. Properties of urban waterlogging events.
CategoryPropertyDescription
Time propertyStart timeEvent start time
End timeEvent end time
Spatial propertyLocation (latitude and longitude)The latitude and longitude coordinates of the disaster event
Location (administrative division)Indicates the administrative division where the waterlogging event occurred
Morphological propertiesScope of disasterRefers to the extent of the area involved in an urban waterlogging event, usually expressed in km2
Depth of waterloggingRefers to the depth to which waterlogged ground is submerged during an urban waterlogging event, usually expressed in cm
Waterlogging flow rateRefers to the velocity of waterlogged water flow during an urban waterlogging event, usually expressed in units of m/s
Disaster PropertyIntensity of disasterRefers to the severity of urban waterlogging events, which are generally categorized as light, medium, or heavy
Damage to buildingsRefers to the extent of damage to buildings during urban waterlogging events, e.g., number of collapsed houses, number of severely damaged houses, etc.
Damage to the transportation systemDocumentation of damage to the transportation system caused by urban waterlogging events
CasualtiesDescribes the human casualties of a disaster event, including the number of people killed, injured, and missing
Economic lossThis attribute describes the economic damage caused by the disaster event
Other lossesDescribed other losses that may be caused by urban waterlogging events, such as the area of crops affected, the number of livestock affected, etc.
Table 2. Description of emergency response properties.
CategoryPropertyDescription
Pre-, During, and Post-disasterMission nameRefers to the name of a specific mission developed in response to urban waterlogging, e.g., “Drainage Pumping Station Activation Mission”, “Leakage Plugging Mission”, etc.
Type of missionRefers to the categorization of urban waterlogging emergency response missions, e.g., drainage missions, rescue missions, flood control missions, etc.
Mission levelAttributes that describe the urgency and importance of the urban waterlogging emergency response mission
Name of emergency response organizationIndicates the name of the agency that performs the emergency response mission, e.g., a city’s Emergency Management Agency, or a county’s Flood Control Office
emergency workerRecords information on personnel involved in emergency response
Description of emergency actionRefers to the description of specific actions taken by emergency response agencies and personnel in response to an urban waterlogging event, such as evacuation of people and deployment of materials
Table 3. Semantic relations of the urban waterlogging emergency ontology.
Relationship ClassRelationship NameRelationship Description
Implementation relationshipIn Charge OfA in charge of B
Executed ByA executed by B
Has ParticipantA has participant B
Containment relationshipIs Part OfA is part of B
Has ComponentA has component B
logical relationshipCausedA caused B to respond
Caused ByA’s response is caused by B
FollowA follows the onset of B
Table 4. Examples of knowledge fusion.
Entity 1Entity 2After Fusion
Urban drainage systemUrban wastewater treatment systemsUrban wastewater treatment systems -> Urban drainage system
SewerDrainage pipeSewer -> Drainage pipe
Drainage pumping stationDrainage engine roomDrainage pumping station -> Drainage engine room
Rainwater wellDrainage wellRainwater well -> Drainage well
Table 5. Data introduction.
Data TypeData SourceData Description
Structured dataDisaster thematic dataNational Earth System Science Data CenterContains basic geographic, sociodemographic, and flood prediction and forecasting data of the affected area in its thematic data
Unstructured dataSearch engineWikipediaUsing waterlogging disaster events as key words to search, including basic information
Disaster public announcementNational Disaster Reduction Official Website (NDRCC)With a high degree of authority and credibility, it can quickly release disaster-related information, including the time, place, and scope of impact of the disaster
News mediaCCTVDisaster-related information is provided through news reports and special programs
Huanqiu netNot only provides coverage of news events but also provides in-depth analysis and commentary
Table 6. Example entity extraction results.
Original TextExtraction Result
A historically rare rainstorm occurred in Zhengzhou, Henan Province, China, on 20 July 2021. The rain lasted for 24 h, flooding subway lines and bringing traffic to a standstill. Citizens were trapped in subway cars and flooded homes. The local government launched an emergency plan, and emergency rescue teams and volunteers rushed to the scene to carry out rescue work. In dozens of hours of struggle, rescue workers moved scores of stranded citizens and took steps to unblock drainage systems. The storm has killed at least 300 people, left more than 50 missing and caused direct economic losses of more than 10 billion yuan.EntityRelation/propertyEntity/property value
Urban waterloggingStart time20 July 2021
Urban waterloggingLocationZhengzhou, Henan Province, China
Urban waterloggingDurationLasted for 24 h
Urban waterloggingCausedFlooding subway lines
Urban waterloggingCausedTraffic to a standstill
Urban waterloggingCausedCitizens are trapped
Local governmentLaunchedAn emergency plan
Emergency rescue teamsCarry outRescue work
Emergency rescue teamsMovedScores of stranded citizens
Emergency rescue teamsUnblockDrainage systems
Urban waterloggingCasualtiesAt least 300 people
Urban waterloggingEconomic lossMore than 10 billion yuan
Table 7. Nodal and relational correctness assessment.
Node or Relationship TypeNumber of Nodes or RelationshipsNumber of ErrorsCorrectness
Event nodes58591.4%
Emergency response nodes1172677.8%
Geographic object nodes742171.6%
Time attribute nodes36586.1%
Spatial attribute nodes15286.7%
Composition97217981.6%
Association3775286.2%
Generalization1664572.9%
Aggregation1232778.0%
Disclaimer/Publisher’s Note: The statements, opinions and data contained in all publications are solely those of the individual author(s) and contributor(s) and not of MDPI and/or the editor(s). MDPI and/or the editor(s) disclaim responsibility for any injury to people or property resulting from any ideas, methods, instructions or products referred to in the content.