Article

Dynamics and Predictions of Urban Expansion in Java, Indonesia: Continuity and Change in Mega-Urbanization

by
Andrea Emma Pravitasari
1,2,*,
Galuh Syahbana Indraprahasta
2,3,
Ernan Rustiadi
1,2,
Vely Brian Rosandi
1,2,
Yuri Ardhya Stanny
2,
Siti Wulandari
2,
Rista Ardy Priatama
2 and
Alfin Murtadho
2
1
Division of Regional Development Planning, Department of Soil Science and Land Resources, Faculty of Agriculture, IPB University, Bogor 16680, Indonesia
2
Center for Regional System Analysis, Planning, and Development (CRESTPENT), IPB University, Bogor 16127, Indonesia
3
Research Center for Population, National Research and Innovation Agency (BRIN), Jakarta 12710, Indonesia
*
Author to whom correspondence should be addressed.
ISPRS Int. J. Geo-Inf. 2024, 13(3), 102; https://doi.org/10.3390/ijgi13030102
Submission received: 29 December 2023 / Revised: 12 March 2024 / Accepted: 17 March 2024 / Published: 20 March 2024

Abstract

:
This paper is situated within the discussion of mega-urbanization, a particular urbanization process that entails a large-scale agglomeration. In this paper, our focus is on urbanization in Java, Indonesia’s most dynamic region. We add to the literature by investigating the change and prediction of the land use/land cover (LULC) of mega-urbanization in Java. This research uses a vector machine approach to support the classification of land cover change dynamics, cellular automata-Markov (CA Markov), and the Klassen typology technique. This paper indicates that major metropolitan areas are still expanding in terms of built-up areas, generating a larger urban agglomeration. However, attention should be also given to the urbanization process outside existing metropolis’ boundaries given that more than half of the built-up land coverage in Java is located in non-metropolitan areas. In terms of future direction, the projection results for 2032 show that the Conservative scenario can reduce and slow down the increase in built-up land on the island of Java. On the other hand, the Spatial Plan (RTRW) scenario facilitates a rapid increase in the LULC of built-up land from 2019. The urban spatial dynamics in Java raises challenges for urban and regional planning as the process is taking place across multiple administrative authorities.

1. Introduction

The world urban population is projected to reach 68% by 2050, with much of this increase taking place in Asia and Africa [1]. Southeast Asia, in particular, has seen considerable population and physical growth in the areas surrounding large cities [2,3,4]. Following the spillover process of urban economic development, built-up areas of urban centers have also expanded in all directions beyond the administrative boundaries of a traditional core–suburb agglomeration, with agricultural and non-agricultural activities frequently coexisting in places adjacent to urban centers [5,6]. This formation of a larger urban–rural agglomeration has been greatly intensified by the rising economic globalization, backed up by the expansion of motor transportation and highway systems, often referred to as “mega-urbanization” [5].
Within the international literature, the emergence of a large urban agglomeration has been recognized with different lexicons. Apart from the notion of mega-urban regions that has been more often used in the context of Southeast Asia, other similar concepts have come to the fore of academic discussions, including, but not limited to, megaregions [7], mega-city regions [8,9,10,11], megalopolis [12,13,14,15], polycentric metropolis [16,17,18,19,20], and mega-conurbations [21,22,23,24]. While there are inherent differences between these different labels (see for instance [25]) (see also Table 1), large urban agglomerations are commonly identified as contemporary spatial manifestations of economic globalization [26]. Some have also emphasized that this spatial form is an unintended expression of uncontrolled urbanization [8,27]. It should be noted, however, that mega-urbanization in developing and transition economies differs from urbanization in developed nations as the former has experienced urban growth at an unprecedented level [28], generating more complex challenges for urban and regional planning [26].
In this paper, our focus is on urbanization in Java, Indonesia. Despite covering about 6% of the total land area of Indonesia, Java serves as the country’s heartbeat. In terms of the economy, 59% of Indonesia’s Gross Domestic Product (GDP) comes from Java [28]. It houses 60% of the country’s inhabitants [29], about 70% of which are urban residents [30]. Java’s centrality has been a direct consequence of the country’s imbalance concentration of economic, industrial, and infrastructure development [31,32,33], which has accumulated for a long time, especially before the 2001 decentralization system [31,34], and even since the late Dutch Colonial rule [35,36,37].
Although Java is dubbed as the “island of mega-urban regions”, studies on mega-urbanization have long focused on single and multiple case studies, particularly concerning the merging of the Jakarta Metropolitan Area (JMA) with the Bandung Metropolitan Area (BMA) [28,38,39,40,41] and megaproject-driven mega-regionalization in Java’s North Coast [42,43]. Meanwhile, the literature on Java-level contemporary urbanization tends to be approached from a demographic perspective [27] that obscures the island’s morphological organization of mega-urban regions, notably manifested in the expansion of built-up areas. In this paper, we add to this literature by investigating the change and prediction of the land use/land cover (LULC) of mega-urbanization in Java. To this end, the objectives of this paper are threefold: (1) uncovering the trends and patterns of built-up areas’ expansion in Java; (2) defining different typologies of urbanization in Java; (3) understanding the dynamics of mega-urbanization in Java.

2. Research Location and Methods

In this section, we first outline our research location and then the methods we used for addressing the research objectives.

2.1. Research Location

The location of this research is Java Island, which consists of 6 provinces (Banten, Jakarta, West Java, Central Java, Yogyakarta, and East Java), as well as 118 regencies (kabupaten) and cities (kota). In this research, we use the most recent number of metropolitan areas in Java, which are the following: Jabodetabek (Jakarta Metropolitan Area/JMA); Cekungan Bandung (Bandung Metropolitan Area/BMA); Kedungsepur (Semarang Metropolitan Area/SeMA); Kartamantul (Yogyakarta Metropolitan Area/YMA); Gerbangkertosusila (Surabaya Metropolitan Area/SuMA); Malang Raya (Greater Malang/GM); Subosukowonosraten (Greater Surakarta/GS); and Rebana (Greater Cirebon/GC). The location of each metropolitan area is illustrated in Figure 1, while the members of each metropolitan area are presented in Table 2.

2.2. Land Cover Prediction

In this study, land cover predictions were analyzed using the Land Change Modeler (LCM) from IDRISI Selva 17.0 software with the Multi-Layer Perceptron Neural Network (MLPNN) modeling method. The MLPNN consists of change analysis, land cover change modeling (transition potential), and land cover prediction (change prediction). MLPNN has the ability to look for relationships between factors that influence land use change and is able to overcome the complexity of independent variables that are nonlinear and not affected by multicollinearity [44].
The “Change Analysis” stage analyzes changes in land cover that have occurred during two points of the year and produces a class of land cover change transitions. This class in land cover prediction is the dependent variable that will be used in subsequent analysis. The “Transition Potentials” stage predicts locations that have the potential to experience land cover changes. In this stage, all change transitions are modeled one by one with independent variables. However, before being added to the model, the independent variables need to be tested for Cramer’s V values to see the relationship between the independent variables and the dependent variable. The Cramer’s V value ranges between 0 and 1, where a value of 0 indicates no relationship and a value of 1 indicates a very close relationship [45]. In the “Change Prediction” stage, land cover predictions are made using Markov chains. At this stage, a matrix of opportunities for change is generated based on land cover changes in the first and second year, then the land cover prediction is carried out using 3 scenarios, namely: (1) Business as Usual (changes follow historical patterns that have occurred/trend based); (2) the Java-Bali Island Spatial Plan (RTRW) scenario (implementation according to the spatial plan); (3) the Conservative scenario (considering carrying capacity/land capability analysis).
The LULC data used in this study are secondary data in the form of ready-to-process LULC shapefiles sourced from the Ministry of Environment and Forestry. The data for the Regional Spatial Plan used in this research are the 2012–2032 Java-Bali Island Spatial Plan, sourced from the Ministry of Agrarian Affairs and Spatial Planning/National Land Agency.
The process of analyzing changes in land use/cover in existing conditions is generally carried out by comparing area sizes and spatial distribution maps, while in future conditions it is carried out by analyzing predictions of land use/cover. Land cover predictions are carried out using the Cellular Automata-Markov Chain (CA-Markov) modeling method in TerrSet software 2020. Cellular Automata is a dynamic spatial model for simulating future land use that consists of a grid or raster space, a set of states that characterize the grid cells, and definitions for the cell’s neighborhood [30]. The basic principle of Cellular Automata is that changes in land use/cover for each location (cell) can be explained by its current state and changes in neighboring cells as a result of neighborhood interactions [46]. The Markov Chain determines how much land is expected to change from the existing year to the future year/predicted year [47]. The output of the Markov Chain is a transition probability matrix and has a record of the probability that each land use/cover class will change to every other class [47].
The integration of Cellular Automata models with Markov Chain models (CA–Markov) is considered valuable for modeling land use/cover changes and can simulate and predict change [46,47,48]. The CA–Markov model is a combination of Cellular Automata and a transition probability matrix generated by the cross-tabulation of two different images [47]. The CA–Markov model represents land use/cover whose changes depend on neighboring land use/cover [49]. The basic principle of CA–Markov is to measure the probability of a series of events in the present to predict future events [50] with a transition probability matrix that describes the probability of change in each pixel from one land use/cover to another category between two time points [44,45].
CA–Markov was analyzed by building two models to run the CA–Markov validation scheme [51,52], namely: Model 1 to predict land use/cover at the last existing year point used in the analysis and Model 2 to predict land use/cover in the coming year. In simulating changes in land use/cover in this research, predictions of changes in 2019 were carried out as a model validation process based on land use/cover data for 2006 and 2013, then predictions for land use/cover in 2032 were made based on land cover data for 2006 and 2019. In [49], the authors conducted a CA–Markov analysis using land use data in 2000 and 2007 to predict the existing model in 2014 as a model validation process, then carried out future model predictions in 2025 using land use data in 2000 and 2014.
The process of validating the predicted results of changes in land use/cover is carried out using the Kappa accuracy test to compare the predicted 2019 land use/cover map with the actual 2019 land use/cover map. According to [53], the kappa value is one technique for validating the results of land use/cover predictions from CA–Markov modeling. The higher the kappa value means the higher the level of accuracy of the predicted land use/cover. The Kappa value is classified as substantial if it is between 0.61 and 0.80 and is classified as near perfect if it is between 0.81 and 1.00 [53,54]. If the prediction results for 2019 are valid, then they can then be used to predict land use/cover maps for 2032.

2.3. Klassen Typology

In this research, we use Klassen typology analysis to identify the position of the urbanization level and urban growth rate for each regency/city in Java. In this research, we made 4 Klassen typologies to compare the conditions of the urbanization level (the percentage of built-up area) and the urban growth rate for each regency and city in Java based on the spatial data of built-up area in 2006–2019 as well as the projected land of built-up area in 2019–2032 using 3 scenarios (BaU, Conservative, and RTRW). The rule for the Klassen typology of the urbanization level and urban growth rate in Java can be seen in Table 3.
The four quadrants in Klassen Typology consist of:
(1)
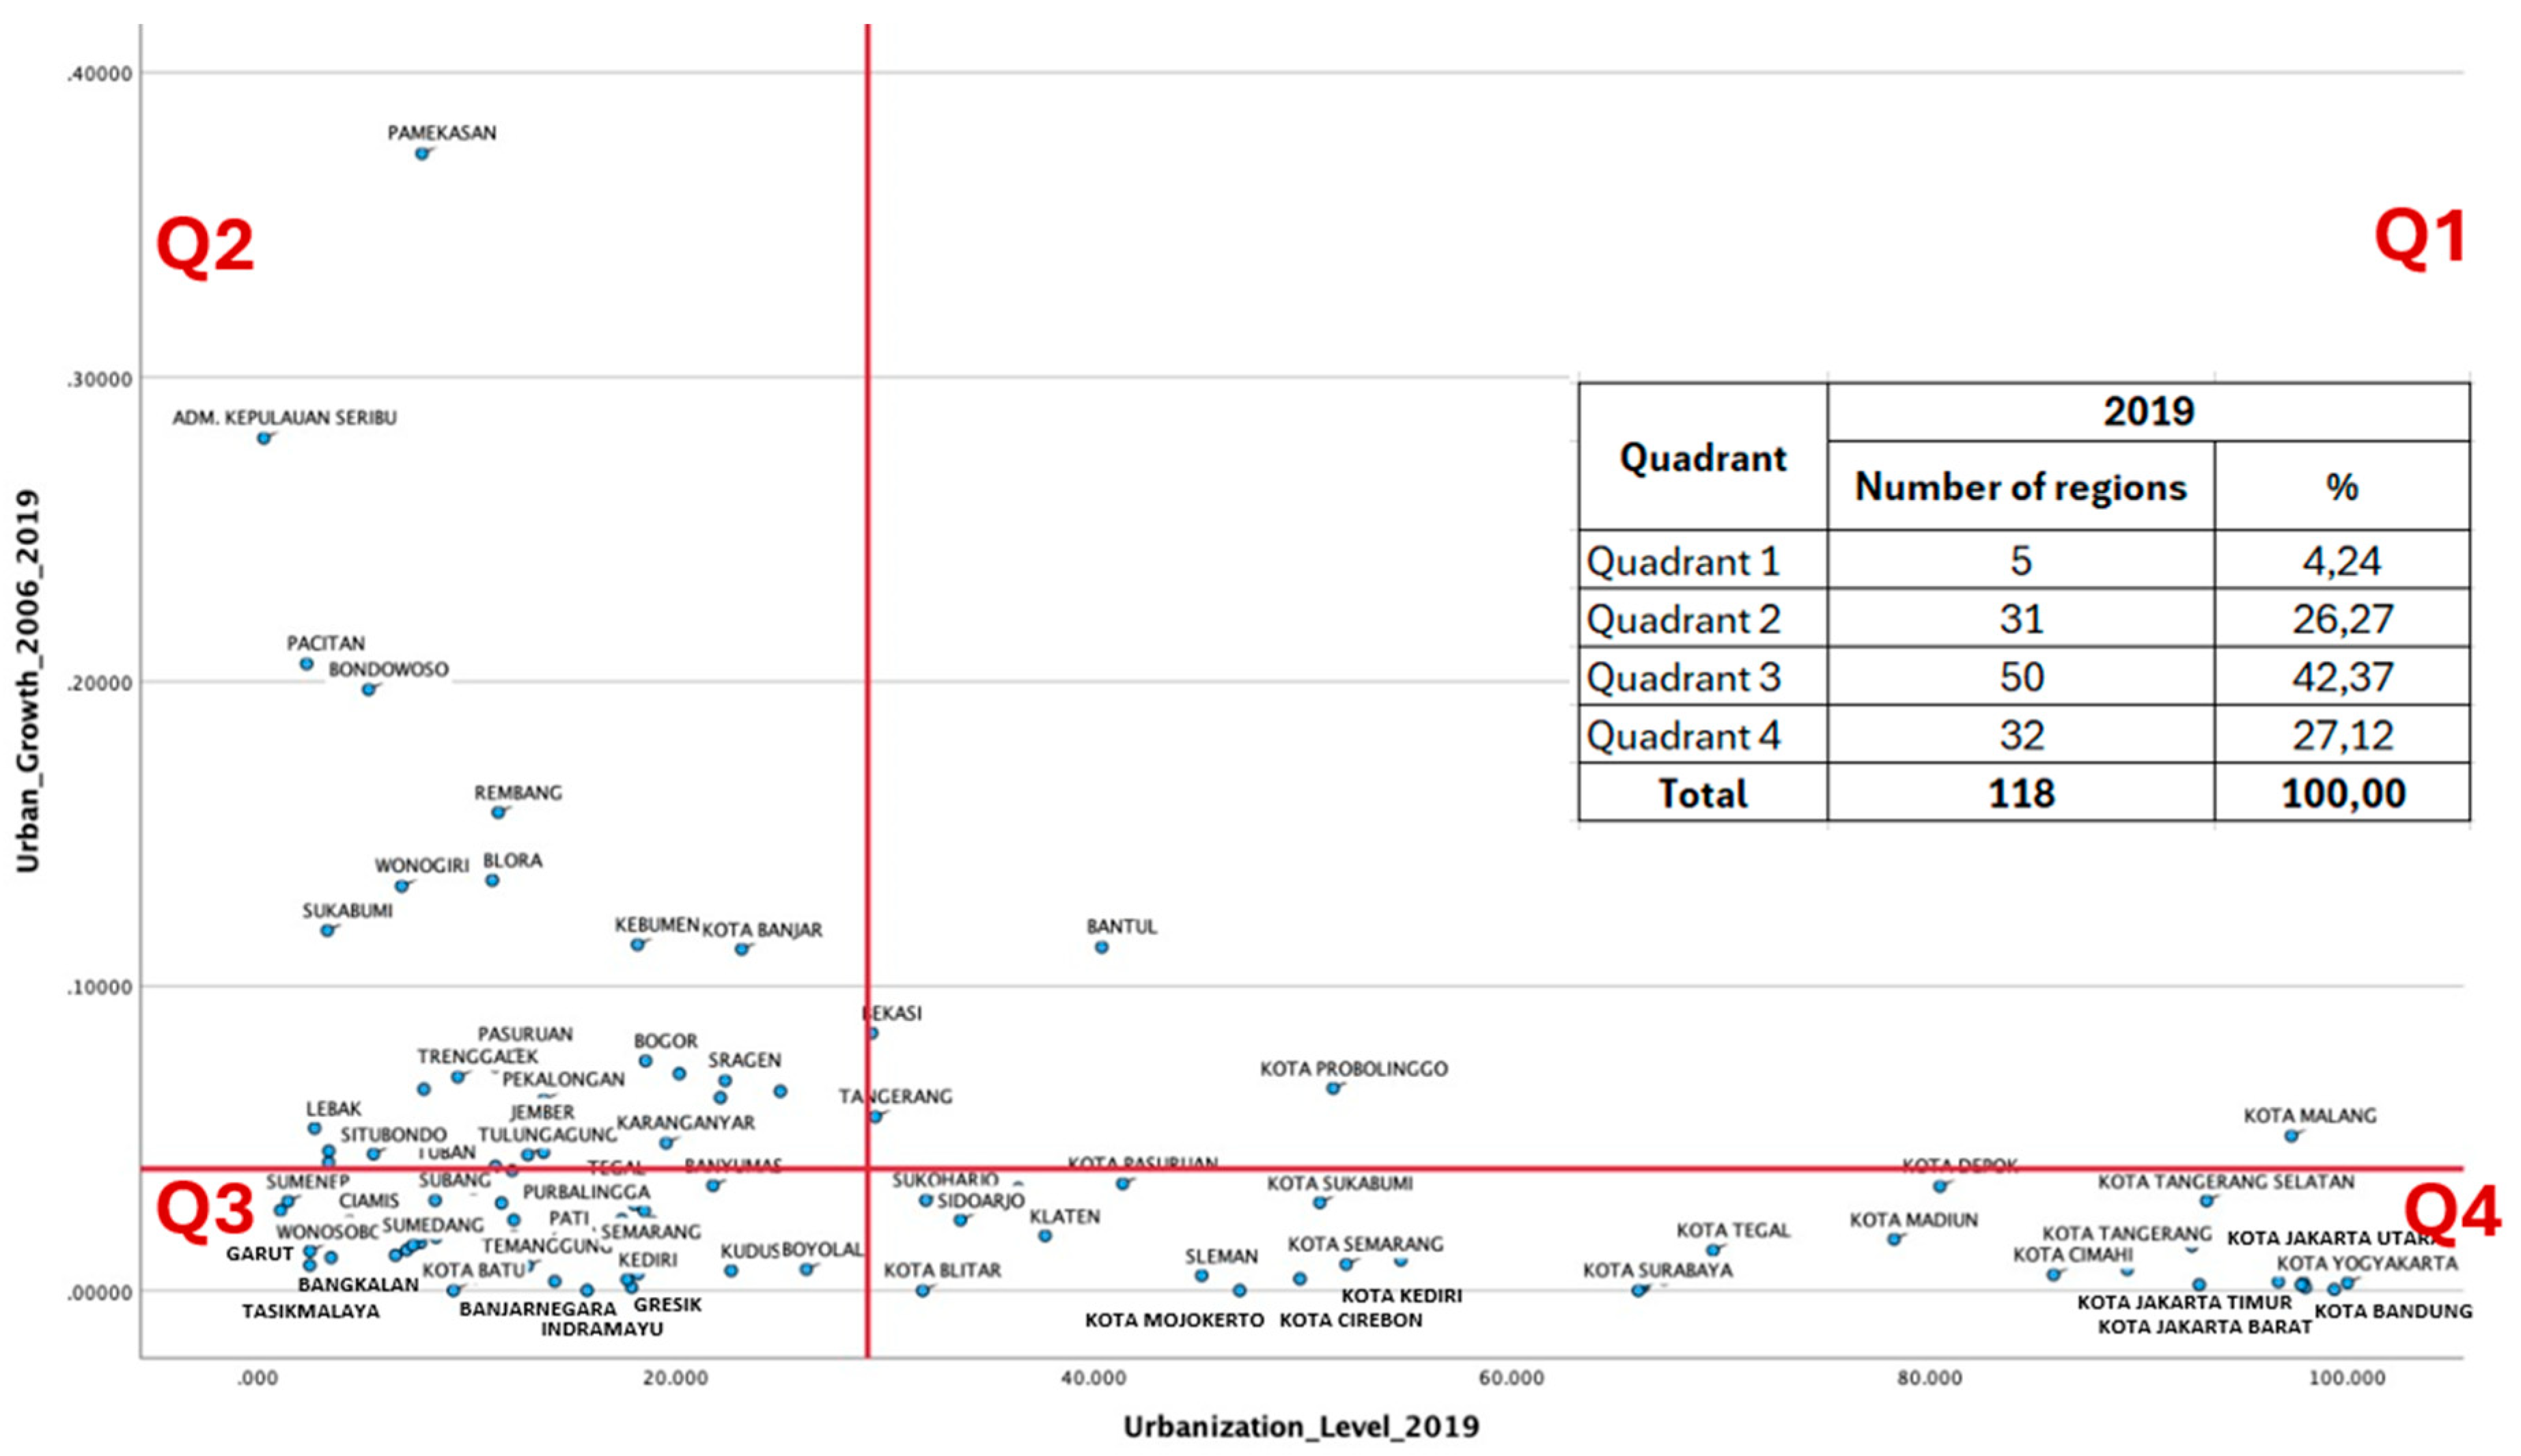
Quadrant 1 (Q1): The cities/regencies in Quadrant 1 are categorized as “Fast Growing—Urbanized Regions”. The urbanization level of the region is higher than the average urbanization level in Java, and the urban growth rate of the region is also faster than the average urban growth rate in Java. The city/regency in Quadrant 1 can be called a developed/mature region.
(2)
Quadrant 2 (Q2): The cities/regencies in Quadrant 2 are categorized as “Fast Growing—Less Urbanized Regions”. The urbanization level of the region is lower than the average urbanization level in Java, but the urban growth rate of the region is faster than the average urban growth rate in Java. The city/regency in Quadrant 2 can be called a potential/developing region.
(3)
Quadrant 3 (Q3): The cities/regencies in Quadrant 3 are categorized as “Slow Growing—Less Urbanized Regions”. The urbanization level of the region is lower than the average urbanization level in Java, and the urban growth rate of the region is also slower than the average urban growth rate in Java. The city/regency in Quadrant 3 can be called an undeveloped region.
(4)
Quadrant 4 (Q4): The cities/regencies in Quadrant 4 are categorized as “Slow Growing—Urbanized Regions”. The urbanization level of the region is higher than the average urbanization level in Java, but the urban growth rate of the region is slower than the average urban growth rate in Java. The city/regency in Quadrant 4 can be called a saturated region.

3. Results

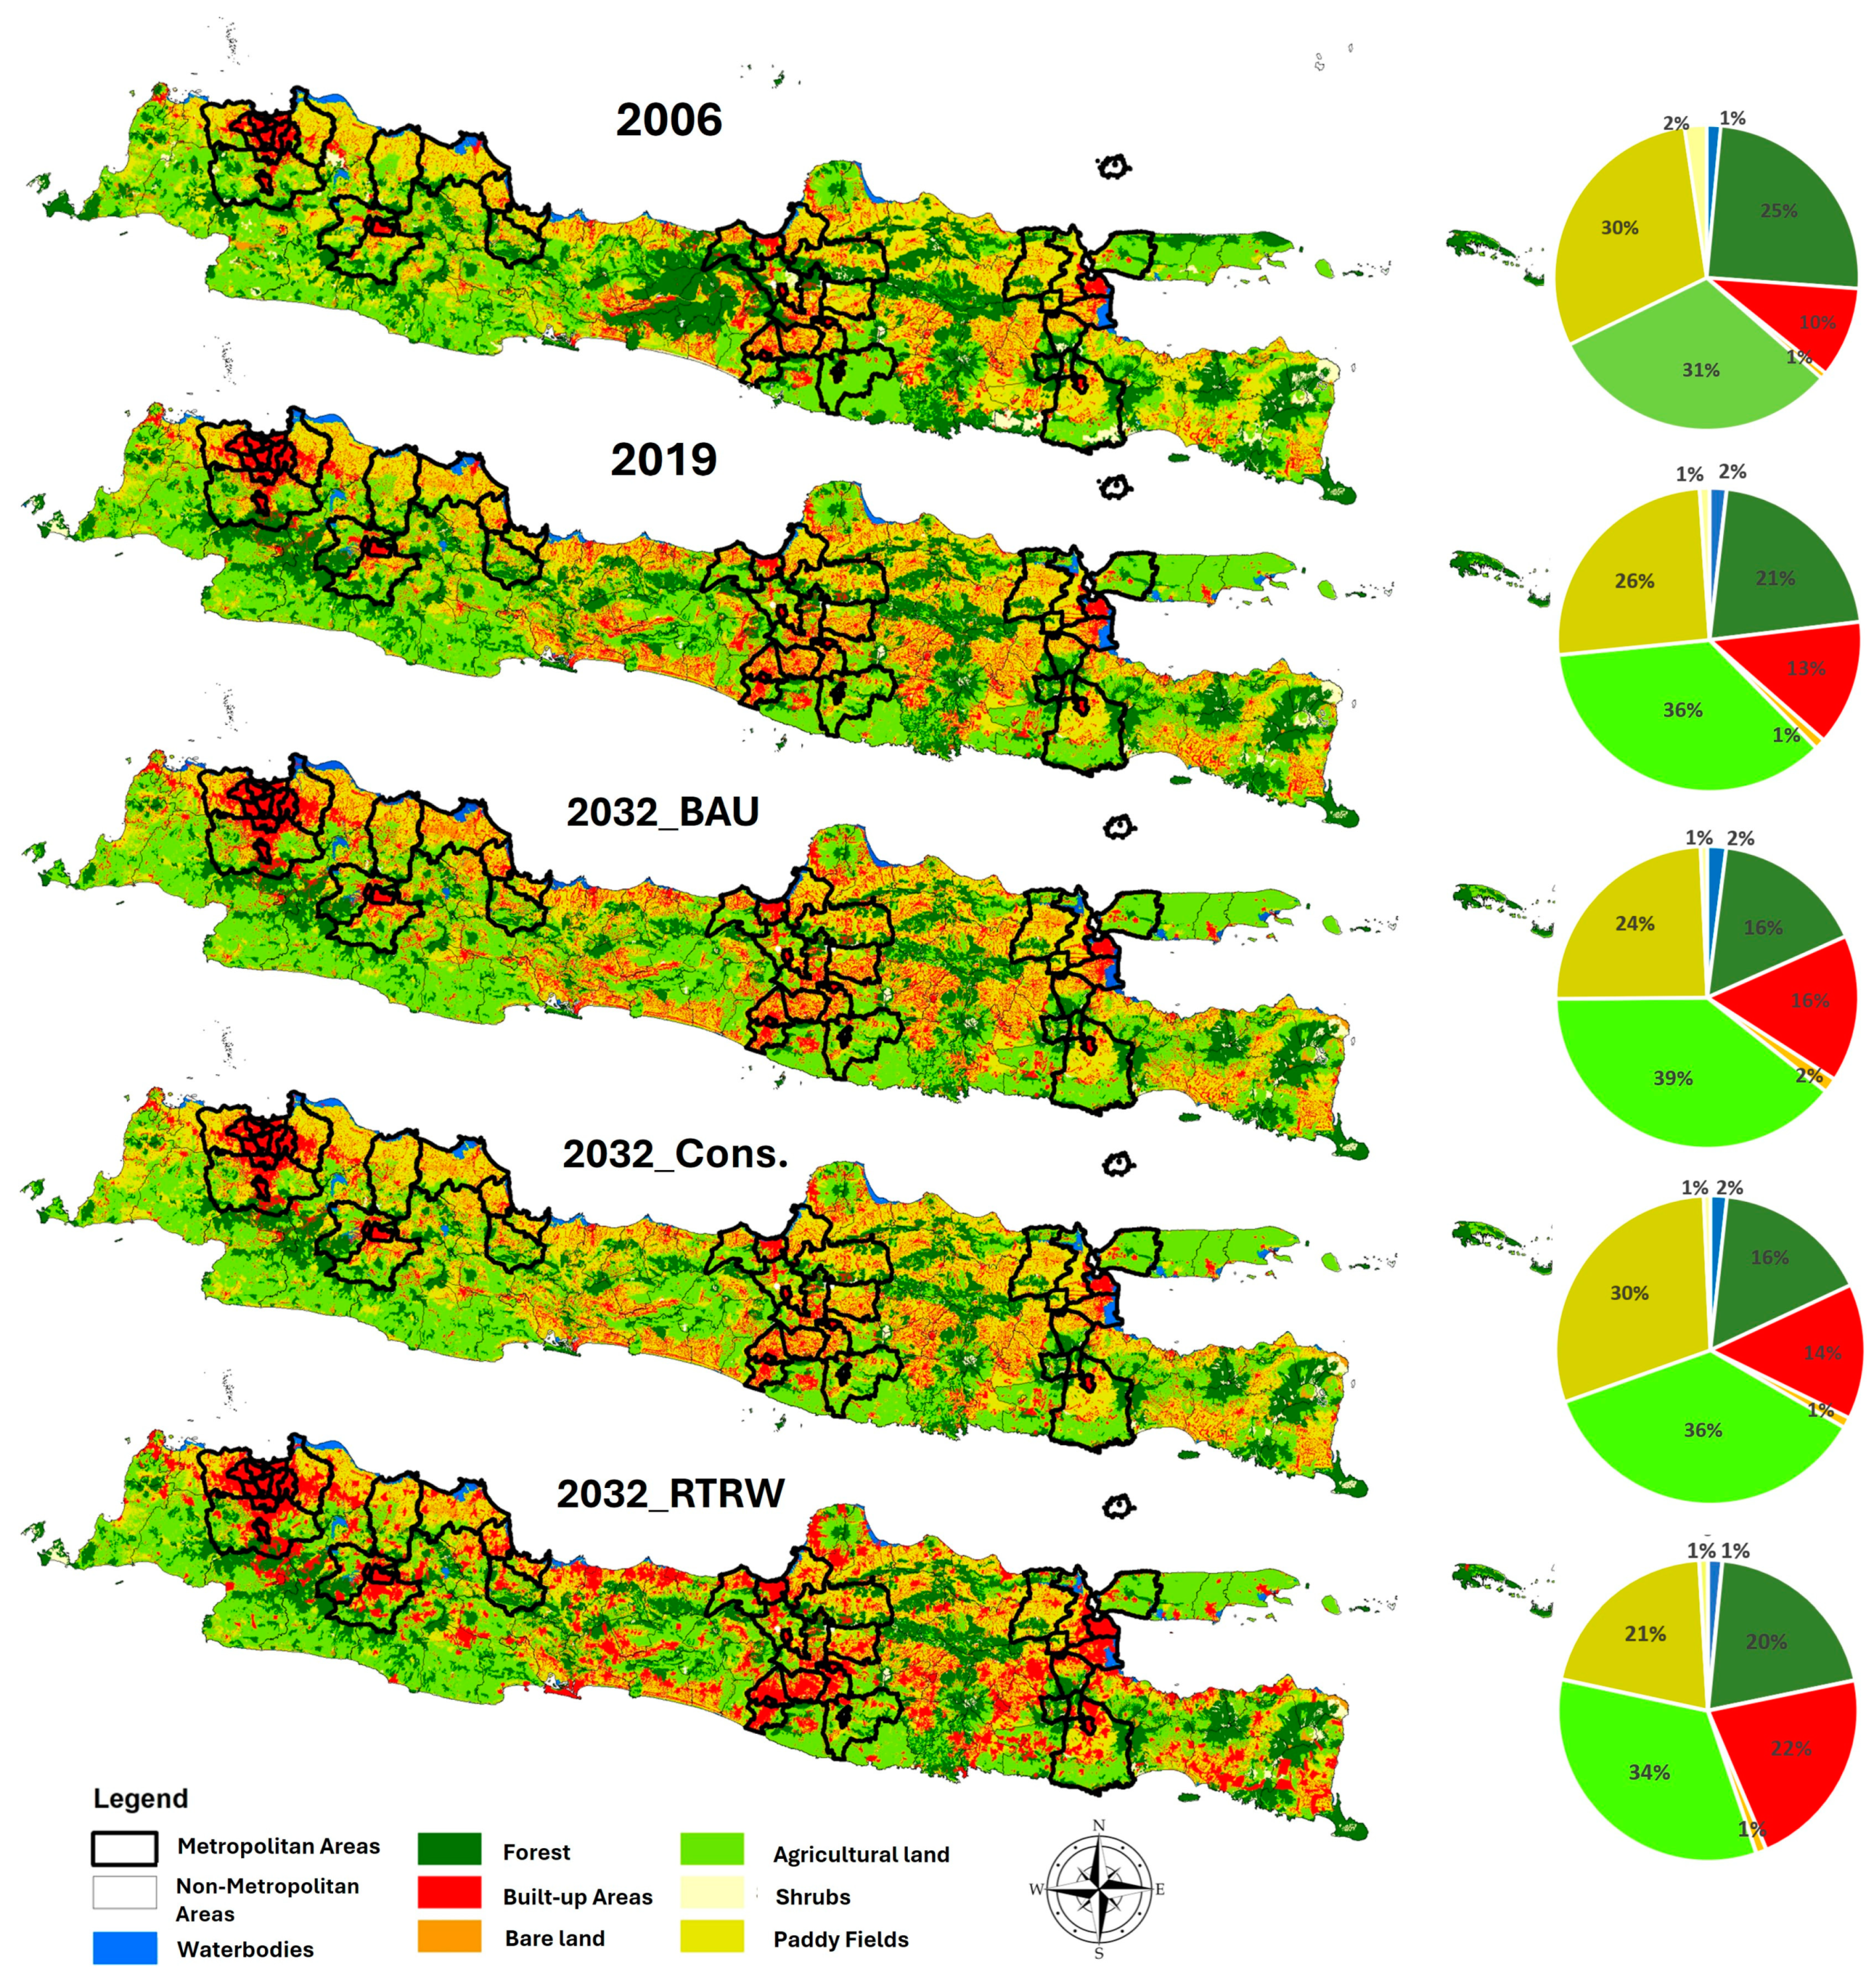
3.1. Land Cover Change and Its Predictions

Land cover change in Java, Indonesia, is characterized by rapid urbanization [55], agricultural expansion, and deforestation [56], leading to significant economic, social, and ecological consequences. Figure 2 and Figure 3 and Table 4 provide a general overview of the land cover change patterns in Java, especially during the period from 2006 to 2019. During this timeframe, it is evident that there was an increase in built-up areas and a decrease in rice fields which also can be seen in some previous research [51,57,58,59,60,61,62,63,64,65,66,67,68]. Rice fields are more susceptible to conversion into built-up areas as they are often located in regions highly coveted for urban development or infrastructure projects [33,63,69,70,71,72]. Consequently, the economic value of these lands tends to rise, driving the conversion into built-up areas [73]. On the other hand, the decline in rice fields is accompanied by the expansion of dryland agriculture, which generally has a lower land capability compared to the former. For instance, [74] demonstrated this phenomenon around Jabodetabek, where losses of farmland due to the urbanization process were compensated by the development of new farmland in more distant and marginal areas that were previously covered by forests and shrubs.
The predicted land cover outcomes for the year 2032 are also illustrated in Figure 2 and Figure 3 and Table 4. The land cover predictions for the year 2032 under the Business as Usual (BaU) and Conservative scenarios were conducted using the Cellular Automata-Markov Chain (CA–Markov) modeling method. In the Business as Usual scenario (2032 BaU), it is observed that the trend of land cover change remains consistent with the 2006–2019 pattern, with built-up areas, water bodies, open land, and agricultural land increasing, and forest cover, rice fields, and shrubland decreasing. These results indicate that the dynamics demonstrated by [74] are likely to persist. Built-up areas are predicted to change from 13% in 2019 to 16% in 2032, while rice fields are expected to decrease from 26% in 2019 to 24% in 2032 (Figure 3).
The Conservative scenario (2032-Cons. scenario), a proactive approach aimed at preventing the conversion of paddy fields, generates a trend similar to the 2032-BaU scenario, except for paddy fields, where land coverage predictably increases to nearly the same level as in 2006. The Conservative scenario implements limitations on potential land use and land cover (LULC) changes in the probability transition matrix of the model, with a focus on reducing and controlling the growth of built-up areas, particularly by preserving and protecting rice fields to prevent their conversion. On one hand, this scenario successfully enhances rice paddy fields (Figure 2) by slowing down the growth of built-up areas and dryland agriculture. On the other hand, forest cover is expected to continue decreasing to 16% by 2032, similar to the 2032-BaU scenario. However, the preservation of rice fields is crucial, considering rice is a staple food for the Indonesian population.
The third scenario, the Spatial Planning-based scenario (2032-RTRW scenario; RTRW stands for Rencana Tata Ruang Wilayah or Spatial Planning), yields a relatively different trend compared to the two previous scenarios. The 2032-RTRW scenario is an LULC prediction based on the existing built-up area and settlement spatial pattern outlined in the Spatial Planning for the Java–Bali Region from 2012 to 2032. In this scenario, land coverage slightly decreases, from 21% in 2019 to 20% in 2032, while the built-up area sharply increases from 13% in 2019 to 22% in 2032. Under the RTRW plan, numerous existing agricultural lands are designated for non-agricultural purposes, potentially leading to a more extensive conversion of agricultural land into built-up areas. This is evident in the predicted outcomes for agricultural and rice paddy land coverage, which are projected to be 34% and 21%, respectively, by 2032.

3.2. Urban Growth between Metropolitan and Non-Metropolitan Areas

Figure 4 and Table 5 illustrate the extent of the built-up land coverage in both metropolitan and non-metropolitan areas. Examining the distribution, more than half of the built-up land coverage in Java is located in non-metropolitan regions, covering an area of 830,337.83 hectares or 52.25% in 2019. The growth of the existing built-up areas in non-metropolitan areas (2% per year) also occurred at a faster rate during the period of 2006–2019 compared to metropolitan areas (1.7% per year). This indicates that, while urban areas are concentrated in core metropolitan zones, urban areas at lower density levels are also quite substantial and spatially dispersed. These urban areas serve as hubs for the surrounding rural regions while also acting as connectors to more densely populated urban areas.
In 2032, it is predicted that built-up land will continue to increase both in metropolitan and non-metropolitan areas. Among the three applied scenarios, the 2032-RTRW scenario is expected to result in the largest expansion of new built-up areas. In this scenario, the built-up land in metropolitan areas is projected to increase from 758,708.24 hectares in 2019 to 1,319,825.92 hectares in 2032, while that of non-metropolitan areas will rise from 830,337.83 hectares in 2019 to 1,593,512.90 hectares in 2032 (Table 2). The scenario with the least creation of new built-up land is the 2032-Conservative scenario, where metropolitan areas will have a total of 878,916.69 hectares of built-up land, and non-metropolitan areas will have 1,007,863.32 hectares. The 2032-BaU scenario will generate built-up land values between the other two scenarios. Furthermore, in terms of built-up land growth, across all three scenarios, the growth in non-metropolitan areas is higher compared to that in metropolitan areas.

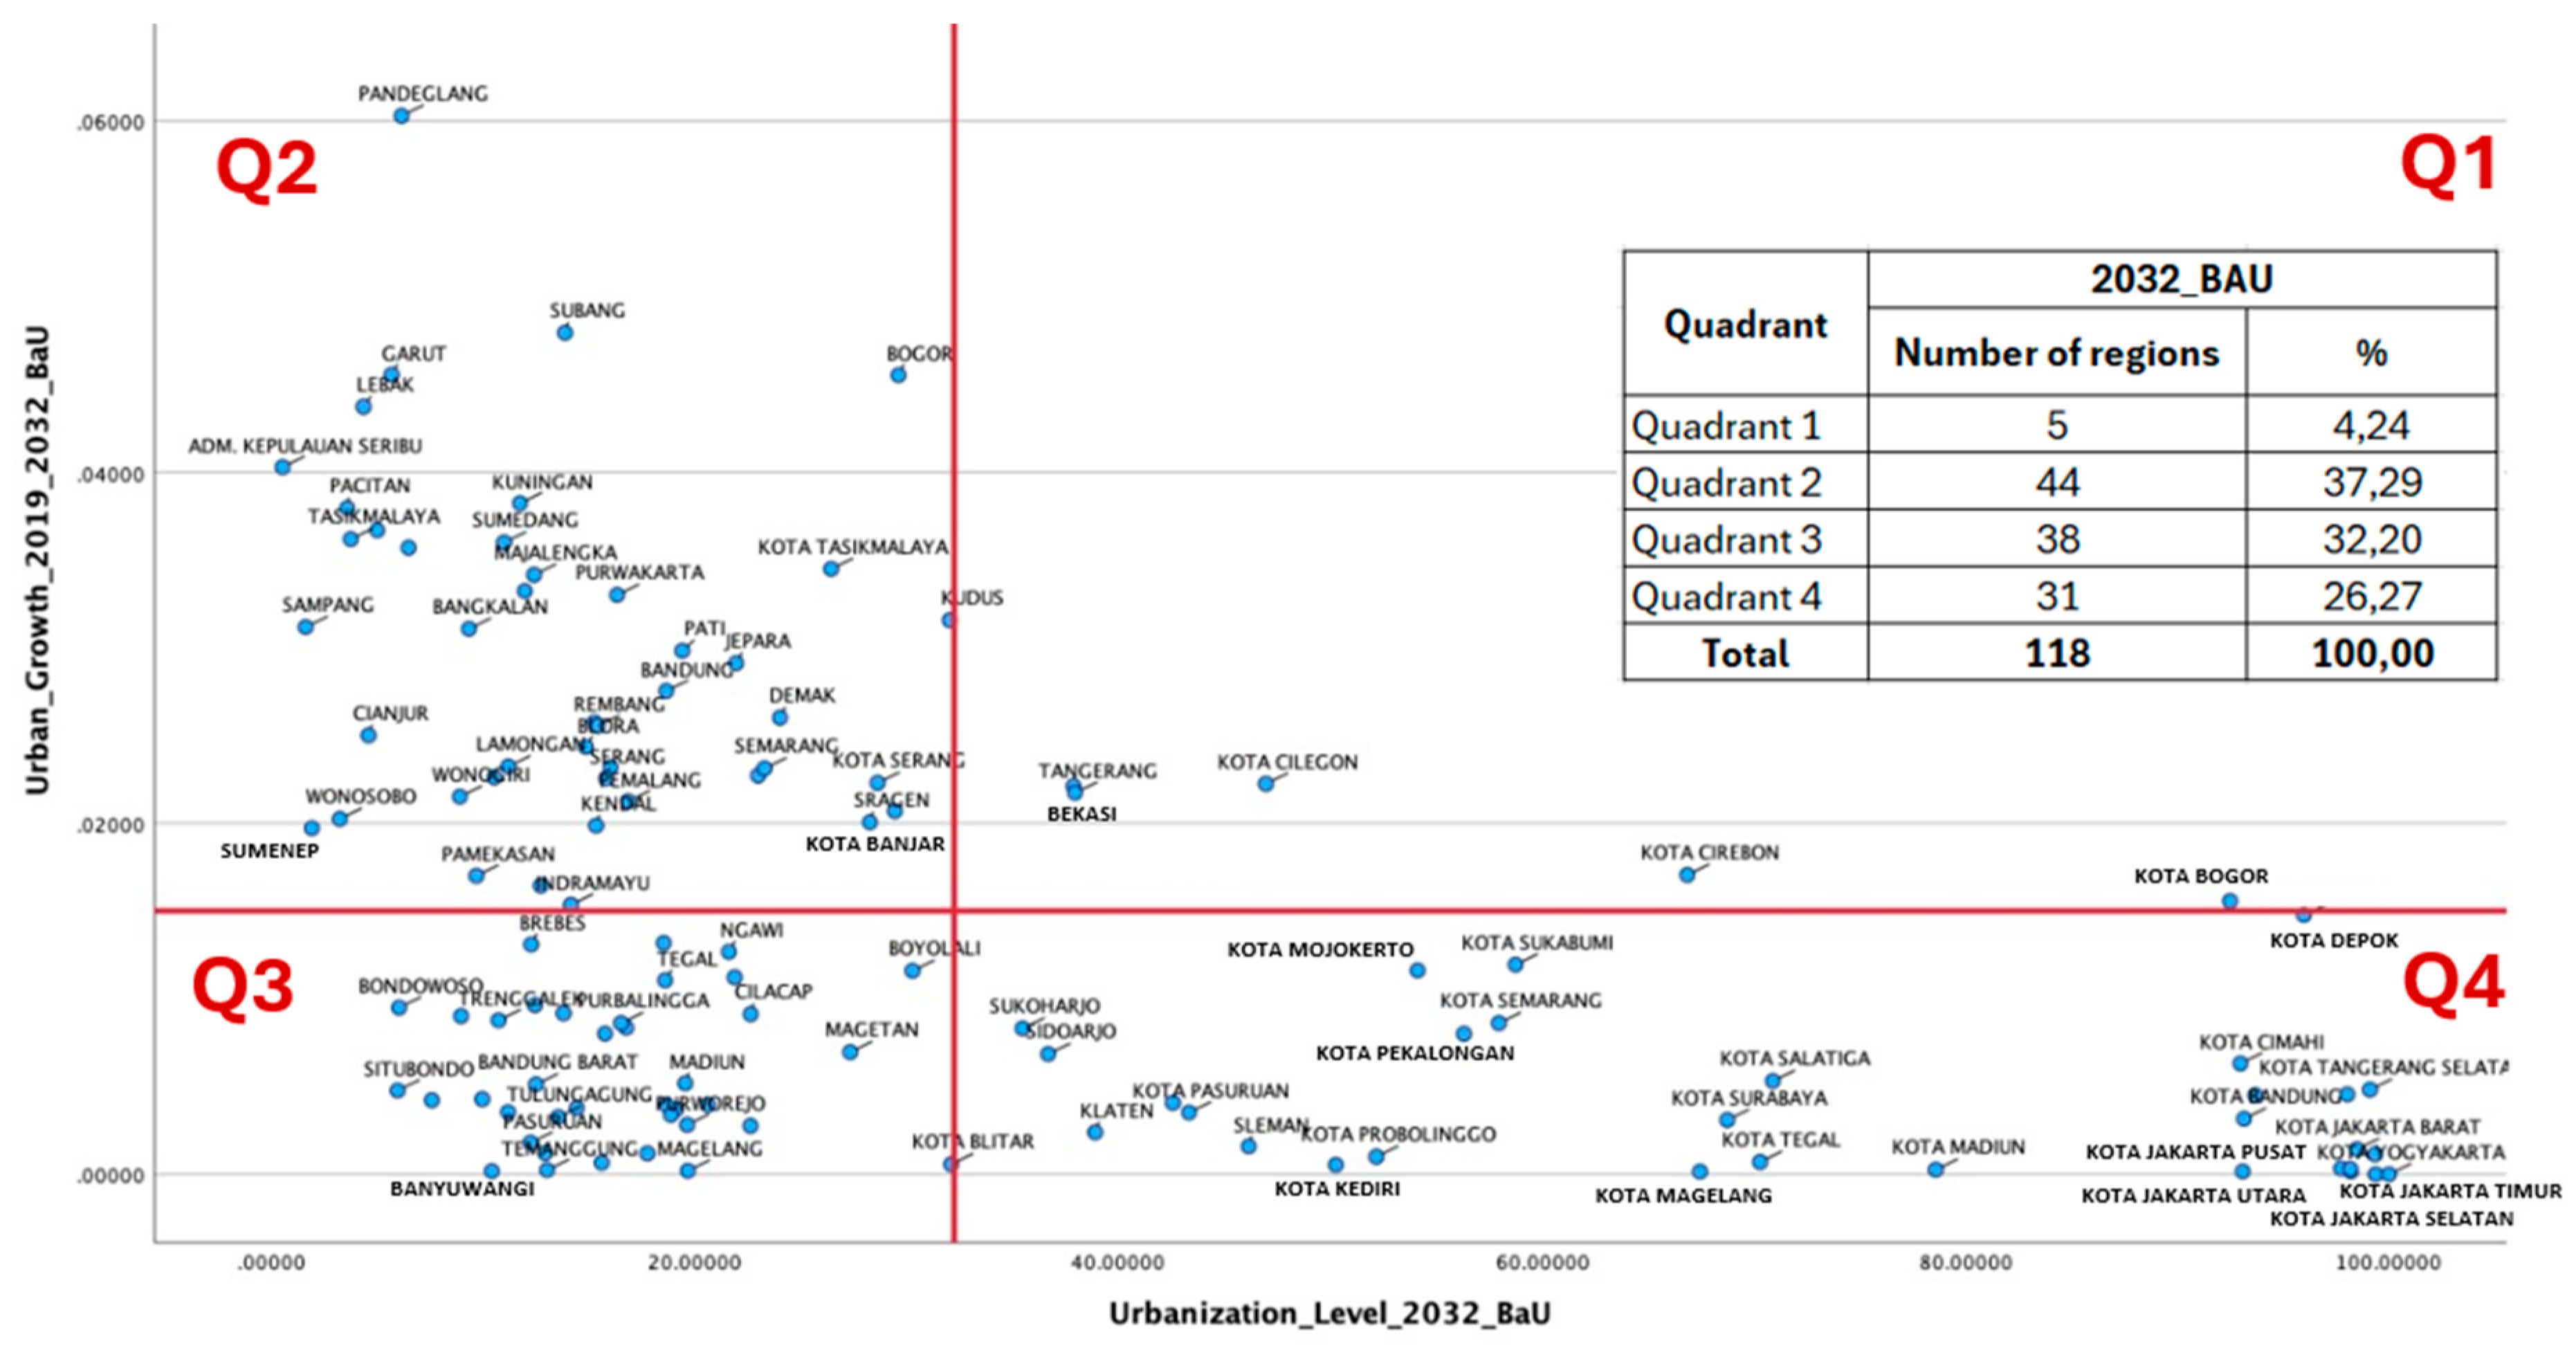
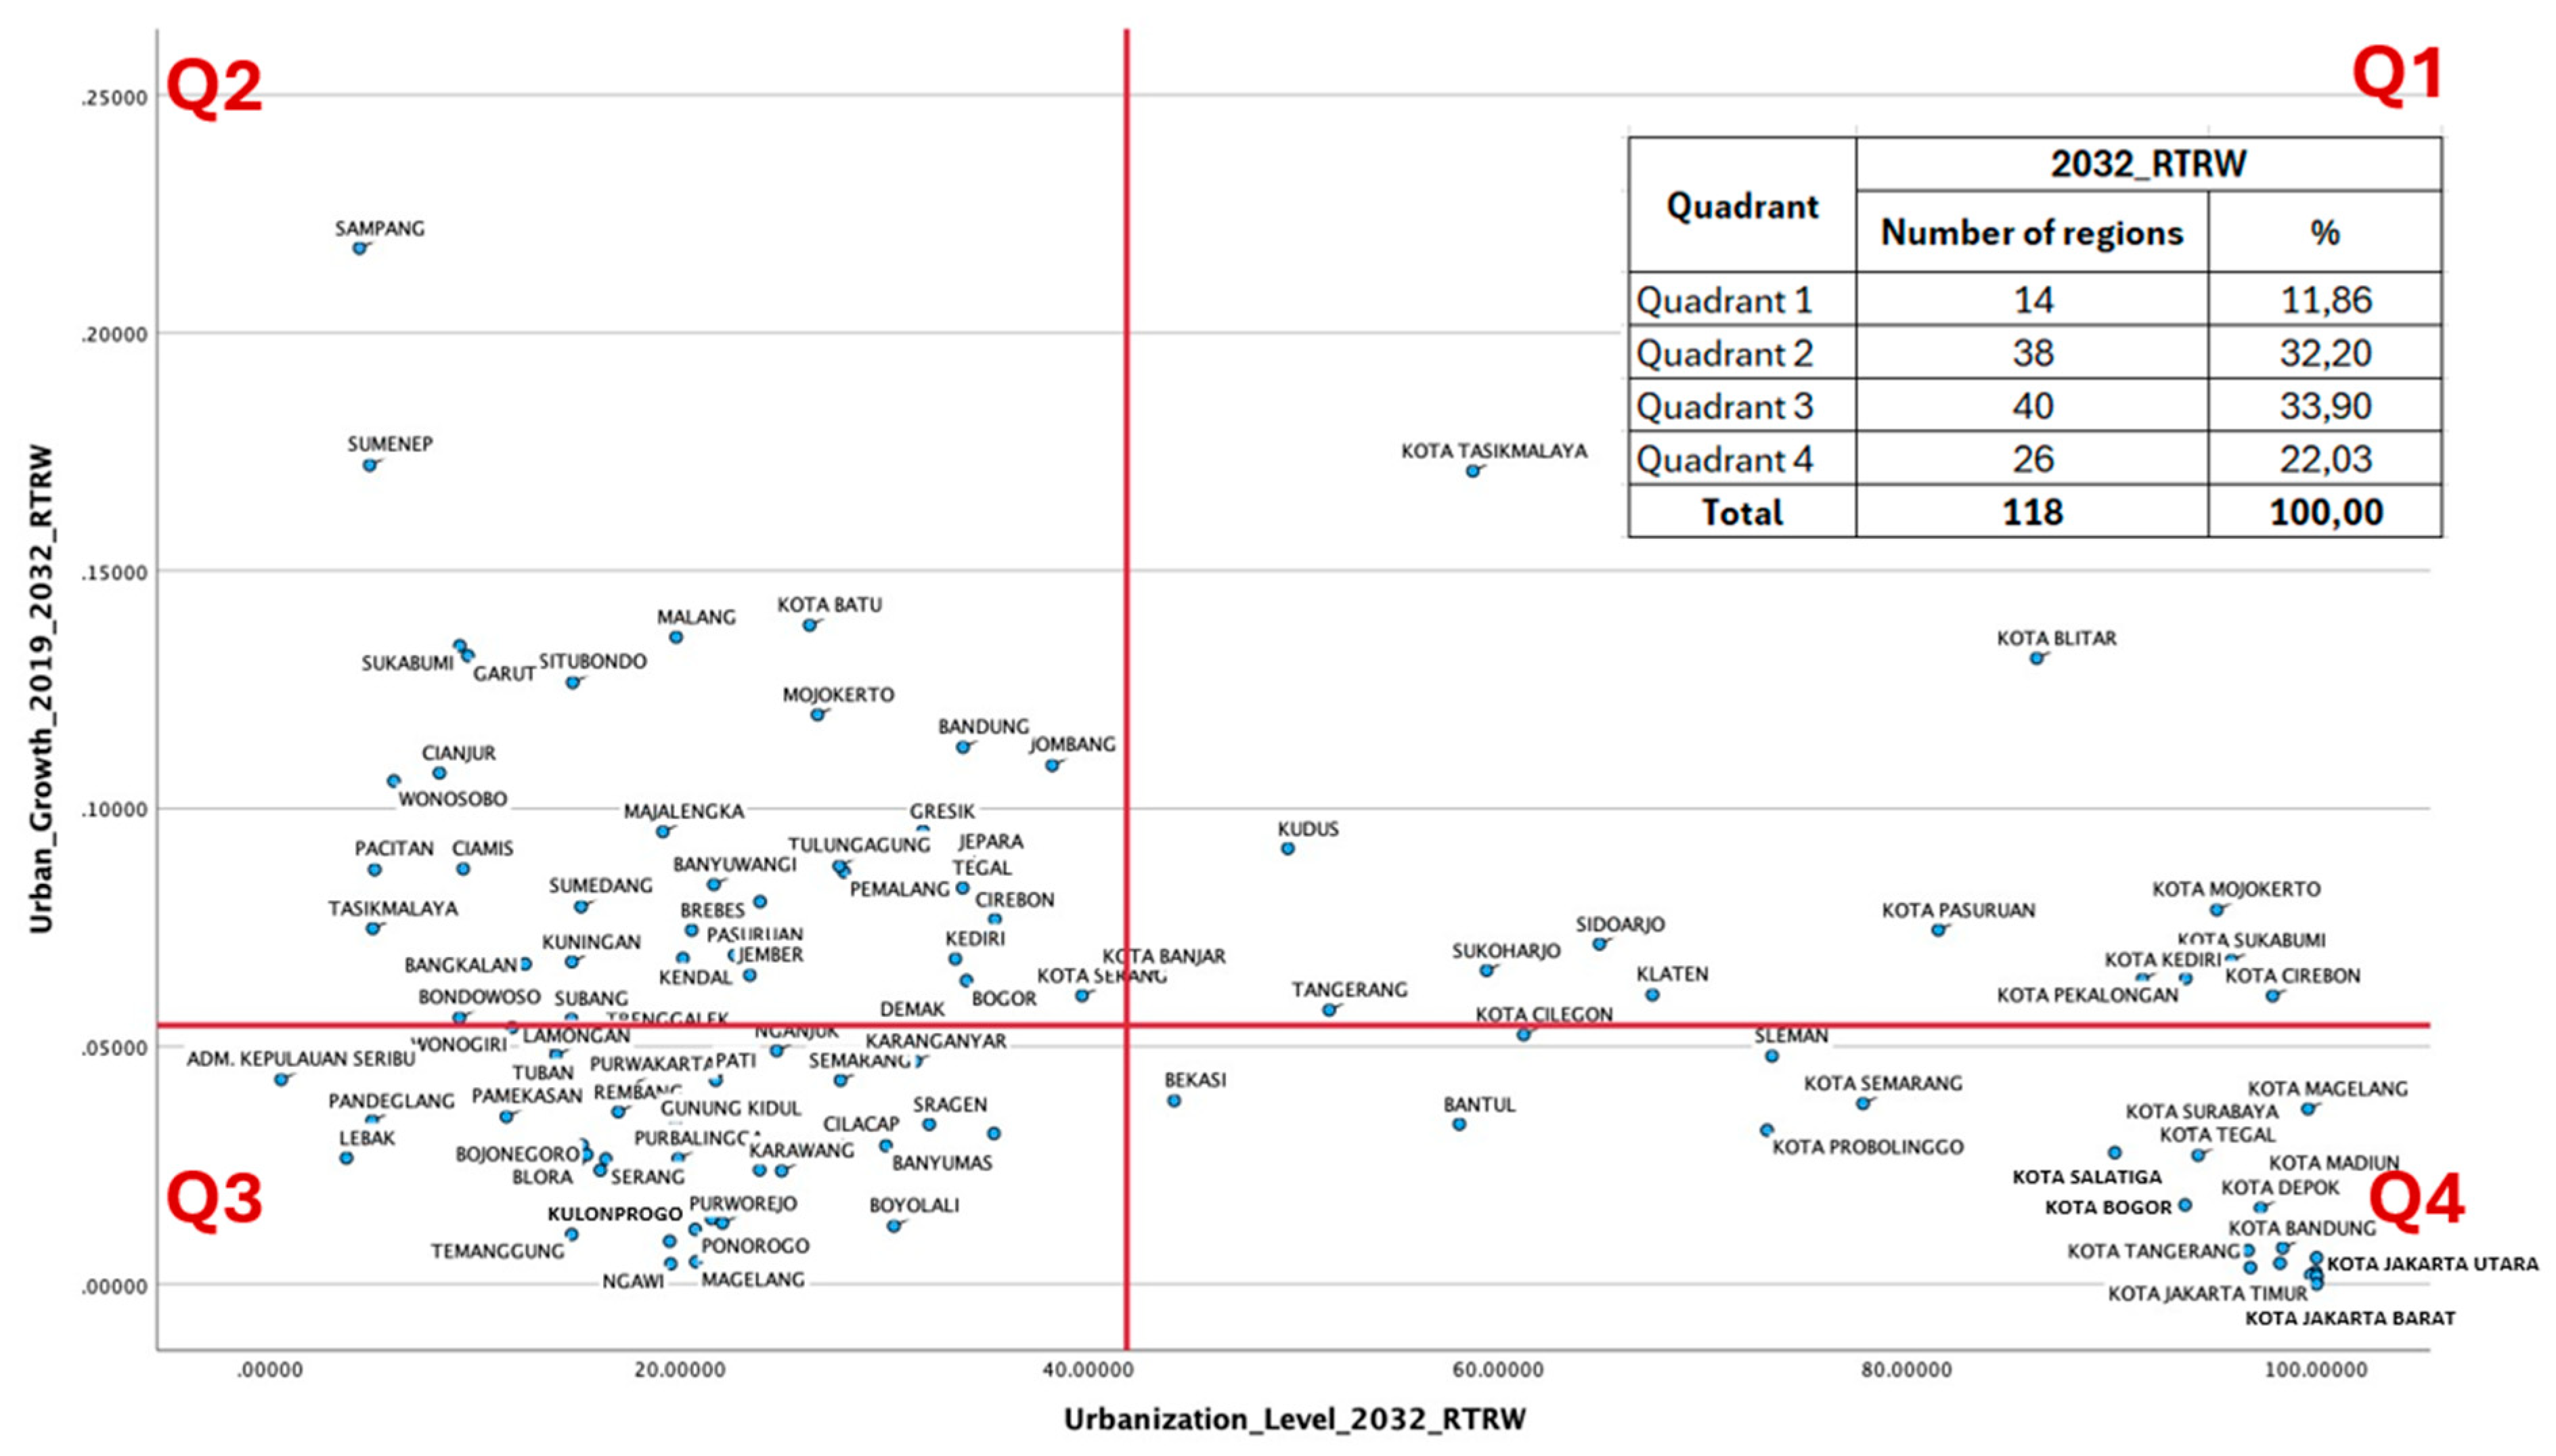
3.3. Klassen Typology of Urbanization Level and Urban Growth

We sought to capture the relationship between the level of urbanization and urban growth, categorizing regions into four quadrants. In 2019, 4.24% of the regions fell into Quadrant I, signifying that despite having a high level of urbanization, the rate of urban area growth remained high (Figure 5 and Table 6). Quadrant II represents regions that have low existing urbanization levels but are experiencing substantial urban area growth. In 2019, regions with such conditions accounted for 31%. Moving on to Quadrant III, comprising 42.37% of the regions in 2019, it represents the least developed areas due to both low urbanization levels and the slow growth in built-up land. Quadrant IV encompasses regions with high urbanization levels showing a deceleration in built-up land growth, termed as saturated, and in 2019, it covered 27.12% of the regions.
The scenarios in the prediction of built-up land growth have consequences for the dynamics of regional typologies. The distribution details of the regions in the classes of each scenario are illustrated in Figure 6, Figure 7 and Figure 8, while their spatial distribution is depicted in Figure 9. The 2032-BaU scenario yields a similar number of members in Quadrant I as in 2019. A noticeable difference appears in Quadrant II and Quadrant III, where in the 2032-BaU scenario, the members in Quadrant II outnumber those in Quadrant III (Table 6). In this scenario, the areas with the potential for development are mostly concentrated in western Java and the northern coast of eastern Java. The 2032-Conservative scenario produces a typology not significantly different from its original form in 2019 (Table 6). The differentiating factors between the two scenarios lie in their members and spatial distribution in each quadrant (Figure 9).
The 2032-RTRW scenario results in a regional typology that is considerably different from its original typology in 2019. In this scenario, the members in Quadrant I make up 11.86%. Although Quadrant III remains the most numerous, it is only at 33.9%, not significantly different from the members in Quadrant II, which stand at 32.20%. Lastly, there is a consistent trend across all the scenarios tested, where the members in Quadrant IV in all scenarios are regions located in metropolitan areas.

4. Discussion

4.1. New Centralities of Spatial Dynamics?

Jakarta and Surabaya have long been the two main urban centers of Java, where the first has increasingly surpassed the latter [35]. Since the 1980s, the development of both cities has expanded beyond the urban core boundary, generating the formation of the two largest metropolitan areas in the island that connect the main urban cores to their surrounding peripheries, i.e., JMA and SuMA. The pattern of JMA’s domination (over other metropolitan areas) continues to occur between 2006 and 2019, notably seen from its urban expansion. While the urban land ratio of Jakarta City and its urban peripheries (Bogor City, Depok City, Tangerang City, South Tangerang City) has relatively saturated, a massive expansion of built-up areas is clearly seen in all of its rural peripheries. Quite the contrary, the urban expansion of SuMA is only noticeable in the peripheries situated to the south of Surabaya City, following the existing main transportation corridor.
While the centrality of JMA is projected to continue over the next 10 years, there is a possibility that the spatial dynamics of other metropolitan areas will challenge the one of SuMA. A potential candidate would be BMA and YMA (see also [75]). BMA together with JMA and SuMA are traditionally the main growth centers of Java. In the case of YMA, between 2006 and 2019, this metropolis’ peripheries, notably Bantul, experienced a massive built-up area expansion. Based on our analysis, this trend is projected to continue over the next 10 years. With the development of a new airport located to the south of Bantul, new economic opportunities will potentially arise that may further stimulate urbanization process.

4.2. Mega-Urbanization beyond Existing Metropolitan Boundaries

Current studies have focused on the merging of JMA and BMA as Java’s mega-urban region, dubbed as JBMUR. However, during 2006–2019, it is clear that urban expansion also took place in regions located to the East (notably Karawang and Purwakarta) and to the West (notably Serang and Cilegon) of JMA, indicating urban conurbation along the main transportation corridors beyond the metropolis’ administrative boundary. Over the next 10 years, it is projected that such conurbation continues to manifest. This merging of JBMUR with farther regions has generated a larger agglomeration, cementing JMA and its surroundings as Java’s largest mega-urban region.
Other fusions of existing metropolises are also detected in the case of SeMA-GS-YM and SuMA-GM. With the new expressway connecting SeMA and GS (and later YM), the urban expansion within this large urban agglomeration will continue to take place. Meanwhile, in the case of SuMA-GM, its urban expansion in the future may also entail regions outside SuMA-GM’s administrative boundary, including Jombang and Pasuruan.
Other forms of mega-urbanization in Java have also taken place, most notably urban conurbation, which is situated outside the existing metropolitan areas. This can be seen along the North Coast of Central Java. The existing main transportation corridor coupled with new investment opportunities have stimulated urbanization in smaller urban centers.
A more dispersed urbanization pattern outside the existing metropolitan areas and the urban conurbation of the North Coast of Central Java (as well as West Java-Banten) has also emerged. The expansion of smaller urban centers in various regencies such as Pacitan, Bondowoso, Rembang, Blora, and Kebumen are some examples of less-urbanized regions experiencing fast urbanization growth. This pattern indicates that urbanization in Java does not only entail the formation of mega-urban regions. It also chimes with recent discussions on the growing significance of small towns and medium cities in Java [76,77]. However, further studies are needed to better understand the factors underlying their growth.

5. Conclusions

In this paper, we have investigated the urbanization in Java and developed a prediction model based on three scenarios. We have added a new literature of urbanization and mega-urbanization in Java by uncovering the trends and patterns of built-up areas’ expansion, the typologies of urbanization, and the dynamics of mega-urbanization. First, the expansion of built-up areas in non-metropolitan areas has occurred (and will continue to occur) more rapidly than in metropolitan areas. Second, recalling the four Klassen urbanization typologies that we defined, during the 2006–2019 period, despite the rapid urban growth of non-metropolitan areas, some localities located within metropolitan areas still exhibited high urban growth. Meanwhile, referring to the three scenarios that we developed, the RTRW scenario is the one that will generate the larger urban expansion of metropolitan and non-metropolitan areas in Java. This indicates that the current spatial policy tends to facilitate more massive urbanization than the existing historical trend, potentially causing a higher pressure to Java’s environmental conditions. Third, mega-urbanization centered on existing metropolitan areas still marks a noticeable pattern in Java. However, the merging of two metropolitan areas (and more) has also emerged, notably facilitated by the existing transportation corridors. Meanwhile, the presence of such transportation networks has also formed urban conurbation outside existing metropolitan areas. All in all, the urban spatial dynamics in Java thus raise challenges for urban and regional planning as the urbanization process is taking place across multiple and multilevel jurisdictions.

Author Contributions

Conceptualization, Andrea Emma Pravitasari, Ernan Rustiadi and Galuh Syahbana Indraprahasta; data curation, Siti Wulandari; formal analysis, Alfin Murtadho, Vely Brian Rosandi, Yuri Ardhya Stanny and Siti Wulandari; methodology, Andrea Emma Pravitasari and Ernan Rustiadi; supervision, Andrea Emma Pravitasari; writing—original draft, Rista Ardy Priatama, Vely Brian Rosandi, Yuri Ardhya Stanny and Siti Wulandari; writing—review and editing, Andrea Emma Pravitasari, Ernan Rustiadi and Galuh Syahbana Indraprahasta. All authors have read and agreed to the published version of the manuscript.

Funding

This research and the APC were funded by the Directorate of Research and Community Service (DPRM), Ministry of Education, Culture, Research, and Technology, Republic of Indonesia. (Contract no: 102/E5/PG.02.00.PL/2023).

Data Availability Statement

The data presented in this study are available upon request from the corresponding author. The data, indeed, can be accessed on the website of Statistics Agency—precisely on the provincial, regency, and municipality Statistics Agencies’ websites. The data available online have not been unified in a single dataset. To obtain the data of individual cases, e.g., of Bogor Regency, one may search on https://jabar.bps.go.id, accessed on 18 November 2021 (Statistics Agency of West Java Province) or https://bogorkab.bps.go.id, accessed on 15 November 2021 (Statistics Agency of Bogor Regency). Our data are not publicly available because the data were obtained by an agreement between the Department of Soil Science and Land Resource (IPB University) and the Indonesia Statistics Agency.

Conflicts of Interest

The authors declare no conflicts of interest. The funders had no role in (a) the design of the study; (b) the collection, analyses, or interpretation of data; (c) the writing of the manuscript; or (d) the decision to publish the results.

References

  1. McGee, T.; Greenberg, C. The emergence of extended metropolitan regions in ASEAN: Towards the Year. Asean Econ. Bull. 1992, 9, 22–44. [Google Scholar] [CrossRef]
  2. Jones, G.W. Southeast Asian urbanization and the growth of mega-urban regions. J. Popul. Res. 2002, 19, 119–136. [Google Scholar] [CrossRef]
  3. Jones, G.W.; Douglass, M. (Eds.) Mega-Urban Regions in Pacific Asia: Urban Dynamics in a Global Era; Nus Press: Singapore, 2008. [Google Scholar]
  4. McGee, T.G.; Robinson, I.M. (Eds.) The Mega-Urban Regions of Southeast Asia; UBC Press: Toronto, ON, Canada, 1995. [Google Scholar]
  5. McGee, T. Deconstructing the mega-city: A case study of the Jakarta mega-urban region(Jabodetabek) in the first decade of the 21st Century; Preliminary Draft; Kyoto University: Kyoto, Japan, 2012. [Google Scholar]
  6. Champion, T.; Hugo, G. Introduction: Moving beyond the urban-rural dichotomy. In New Form of Urbanisation; Champion, T., Hugo, G., Eds.; Ashgate Publishing Company: Hants, UK, 2004; pp. 3–24. [Google Scholar]
  7. Harrison, J.; Hoyler, M. (Eds.) Megaregions: Globalization s New Urban Form? Edward Elgar Publishing: Cheltenham, UK, 2015. [Google Scholar]
  8. Yeh, A.G.-O.; Chen, Z. From cities to super mega city regions in China in a new wave of urbanisation and economic transition: Issues and challenges. Urban Stud. 2019, 57, 636–654. [Google Scholar] [CrossRef]
  9. Lu, H.; de Jong, M.; Song, Y.; Zhao, M. The multi-level governance of formulating regional brand identities: Evidence from three Mega City Regions in China. Cities 2020, 100, 102668. [Google Scholar] [CrossRef]
  10. Priemus, H.; Hall, P. Multifunctional urban planning of mega-city-regions. Built Environ. 2004, 30, 338–349. [Google Scholar] [CrossRef]
  11. Xu, J.; Yeh, A. Governance and Planning of Mega-City Regions. In An International Comparative Perspective; Routledge Studies in Human Geography: Devon, UK, 2011. [Google Scholar]
  12. Lang, R.; Knox, P.K. The new metropolis: Rethinking megalopolis. Reg. Stud. 2009, 43, 789–802. [Google Scholar] [CrossRef]
  13. Mori, T. A Modeling of megalopolis formation: The maturing of city systems. J. Urban Econ. 1997, 42, 133–157. [Google Scholar] [CrossRef]
  14. Vicino, T.J.; Hanlon, B.; Short, J.R. Megalopolis 50 years on: The Transformation of a city region. Int. J. Urban Reg. Res. 2007, 31, 344–367. [Google Scholar] [CrossRef]
  15. McGrath, B.; Shane, D.G. Metropolis, megalopolis and metacity. In The Sage Handbook of Architectural Theory; Sage: London, UK, 2012; pp. 641–657. [Google Scholar]
  16. Hall, P.G.; Pain, K. (Eds.) The Polycentric Metropolis: Learning from Mega-City Regions in Europe; Routledge: London, UK, 2006. [Google Scholar]
  17. Halbert, L.; Convery, F.J.; Thierstein, A. Reflections on the polycentric metropolis. Built Environ. 2006, 32, 110–113. [Google Scholar] [CrossRef]
  18. Hall, P. The polycentric metropolis: A western European perspective on mega-city regions. In Governance and Planning of Mega-City Regions; Routledge: London, UK, 2010; pp. 45–66. [Google Scholar]
  19. Liu, Z.; Liu, S. Polycentric Development and the role of urban polycentric planning in China’s mega cities: An examination of Beijing’s metropolitan area. Sustainability 2018, 10, 1588. [Google Scholar] [CrossRef]
  20. Zhao, M.; Derudder, B.; Huang, J. Polycentric development in China’s mega-city regions, 2001–2008: A comparison of the Yangtze and Pearl River Deltas. J. Geogr. Soc. Berl. 2017, 148, 1–13. [Google Scholar]
  21. Friedmann, J.; Sorensen, A. City unbound: Emerging mega-conurbations in Asia. Int. Plan. Stud. 2019, 24, 1–12. [Google Scholar] [CrossRef]
  22. Friedmann, J. Thinking about mega-conurbations and planning1. In Handbook of Megacities and Megacity-Regions; Edward Elgar Publishing: Cheltenham, UK, 2020; pp. 21–32. [Google Scholar]
  23. Shatkin, G. The planning of Asia’s mega-conurbations: Contradiction and contestation in extended urbanization. Int. Plan. Stud. 2019, 24, 68–80. [Google Scholar] [CrossRef]
  24. Friedmann, J. Thinking about complexity and planning. Int. Plan. Stud. 2019, 24, 13–22. [Google Scholar] [CrossRef]
  25. Octifanny, Y.; Hudalah, D. Urban Agglomeration and extension in northern coast of west java: A transformation into mega region. IOP Conf. Ser. Earth Environ. Sci. 2017, 79, 012011. [Google Scholar] [CrossRef]
  26. Harrison, J.; Gu, H. Planning megaregional futures: Spatial imaginaries and megaregion formation in China. Reg. Stud. 2019, 55, 77–89. [Google Scholar] [CrossRef]
  27. Firman, T.; Fahmi, F.Z. The Privatization of Metropolitan Jakarta’s (Jabodetabek) urban fringes: The early stages of “post-suburbanization” in Indonesia. J. Am. Plan. Assoc. 2017, 83, 68–79. [Google Scholar] [CrossRef]
  28. Rustiadi, E.; Pravitasari, A.E.; Setiawan, Y.; Mulya, S.P.; Pribadi, D.O.; Tsutsumida, N. Impact of continuous Jakarta megacity urban expansion on the formation of the Jakarta-Bandung conurbation over the rice farm regions. Cities 2020, 111, 103000. [Google Scholar] [CrossRef]
  29. Pravitasari, A.E.; Rustiadi, E.; Mulya, S.P.; Widodo, C.E.; Indraprahasta, G.S.; Fuadina, L.N.; Karyati, N.E.; Murtadho, A. Measuring urban and regional sustainability performance in Java: A comparison study between 6 metropolitan areas. IOP Conf. Ser. Earth Environ. Sci. 2020, 556, 012004. [Google Scholar] [CrossRef]
  30. Badan Pusat Statistik. Indeks Pembangunan Manusia Jakarta (ID). Available online: https://www.bps.go.id/publication/2020/08/28/a180fbf968ecf6fc9fde1d2a/indeks-pembangunan-manusia-2019.html (accessed on 15 November 2023).
  31. Pravitasari, A.E.; Rustiadi, E.; Priatama, R.A.; Murtadho, A.; Kurnia, A.A.; Mulya, S.P.; Saizen, I.; Widodo, C.E.; Wulandari, S. Spatiotemporal distribution patterns and local driving factors of regional development in Java. ISPRS Int. J. Geo-Inf. 2021, 10, 812. [Google Scholar] [CrossRef]
  32. Gong, J.; Hu, Z.; Chen, W.; Liu, Y.; Wang, J. Urban Expansion Dynamics and Modes in Metropolitan Guangzhou, China. Land Use Policy 2018, 72, 100–109. [Google Scholar] [CrossRef]
  33. Shofy, Y.F.; Wibowo, A. The Impact of the Trans-Java Toll Road Development on Spatial Planning in the Northern Region of Java Island: A Study Utilizing NDBI and Google Earth Images. Indones. J. Earth Sci. 2023, 3, A611. [Google Scholar] [CrossRef]
  34. Hill, H. Globalization, inequality, and local-level dynamics: Indonesia and the Philippines. Asian Econ. Policy Rev. 2008, 3, 42–61. [Google Scholar] [CrossRef]
  35. Indraprahasta, G.S.; Derudder, B. World City-ness in a historical perspective: Probing the long-term evolution of the Jakarta metropolitan area. Habitat Int. 2019, 89, 102000. [Google Scholar] [CrossRef]
  36. Nas, P.J. Pratiwo Java and de groote postweg, la grande route, the great mail road, Jalan Raya Pos. Bijdr. Tot De Taal-Land-En Volkenkd. 2002, 158, 707–725. [Google Scholar] [CrossRef]
  37. Octifanny, Y. The history of urbanization in Java Island: Path to contemporary urbanization. TATA LOKA 2020, 22, 474–485. [Google Scholar] [CrossRef]
  38. Firman, T. The continuity and change in mega-urbanization in Indonesia: A survey of Jakarta–Bandung Region (JBR) development. Habitat Int. 2009, 33, 327–339. [Google Scholar] [CrossRef]
  39. Firman, T.; Dharmapatni, I.A.I. The emergence of extended metropolitan regions in Indonesia: Jabotabek and Bandung Metropolitan Area. Rev. Urban Reg. Dev. Stud. 1995, 7, 167–188. [Google Scholar] [CrossRef]
  40. Fuadina, L.N.; Rustiadi, E.; Pravitasari, A.E. The Dynamic of Land Use Changes and Regional Development in Bandung Metropolitan Area. IOP Conf. Ser. Earth Environ. Sci. 2020, 556, 012002. [Google Scholar] [CrossRef]
  41. Pravitasari, A.E.; Rustiadi, E.; Mulya, S.P.; Setiawan, Y.; Fuadina, L.N.; Murtadho, A. Identifying the driving forces of urban expansion and its environmental impact in Jakarta-Bandung mega urban region. IOP Conf. Ser. Earth Environ. Sci. 2018, 149, 012044. [Google Scholar] [CrossRef]
  42. Hudalah, D.; Octifanny, Y.; Talitha, T.; Firman, T.; Phelps, N.A. From metropolitanization to megaregionalization: Intentionality in the urban restructuring of Java’s North Coast, Indonesia. J. Plan. Educ. Res. 2020, 44, 292–306. [Google Scholar] [CrossRef]
  43. Hudalah, D.; Talitha, T.; Lestari, S.F. Pragmatic state rescaling: The dynamics and diversity of state space in Indonesian megaproject planning and governance. Environ. Plan. C Politi-Space 2021, 40, 481–501. [Google Scholar] [CrossRef]
  44. Nadoushan, M.A.; Soffianian, A.; Alebrahim, A. Modelling land use/cover changes by the combination of markov chain and cellular automata markov (CA-Markov) models. J. Earth Environ. Health Sci. 2015, 1, 16. [Google Scholar] [CrossRef]
  45. Siddiqui, A.; Siddiqui, A.; Maithani, S.; Jha, A.K.; Kumar, P.; Srivastav, S. Urban growth dynamics of an Indian metropolitan using CA Markov and Logistic Regression. Egypt. J. Remote Sens. Space Sci. 2018, 21, 229–236. [Google Scholar] [CrossRef]
  46. Parsa, V.A.; Yavari, A.; Nejadi, A. Spatio-Temporal Analysis of Land Use/Land Cover Pattern Changes in Arasbaran Biosphere Reserve: Iran. Model. Earth Syst. Environ. 2016, 2, 1–13. [Google Scholar] [CrossRef]
  47. Hamad, R.; Balzter, H.; Kolo, K. Predicting land use/land cover changes using a CA-Markov model under two different scenarios. Sustainability 2018, 10, 3421. [Google Scholar] [CrossRef]
  48. Singh, S.K.; Mustak, S.; Srivastava, P.K.; Szabó, S.; Islam, T. Predicting spatial and decadal LULC changes through cellular automata Markov chain models using earth observation datasets and geo-information. Environ. Process. 2015, 2, 61–78. [Google Scholar] [CrossRef]
  49. Yudarwati, R.; Sitorus, S.R.; Munibah, K. Arahan pengendalian perubahan penggunaan lahan menggunakan Markov –Cellular automata di Kabupaten Cianjur. Tataloka 2017, 18, 211. [Google Scholar] [CrossRef]
  50. Fitriyanto, B.R.; Helmi, M.; Hadiyanto. Model prediksi perubahan penggunaan lahan dengan pendekatan sistem informasi geografis dan Cellular Automata Markov Chain: Studi kasus Kabupaten Rokan Hulu, Provinsi Riau. J. Teknol. Technoscientia 2019, 11, 137–147. [Google Scholar]
  51. Jaya, B.; Rustiadi, E.; Fauzi, A.; Pravitasari, A.E. Land conversion and availability of agricultural land in 2035 in Puncak Area Bogor Regency. IOP Conf. Ser. Earth Environ. Sci. 2021, 694, 012052. [Google Scholar] [CrossRef]
  52. Murtadho, A.; Wulandari, S.; Wahid, M.; Rustiadi, E. Perkembangan Wilayah dan Perubahan Tutupan Lahan di Kabupaten Purwakarta sebagai Dampak dari Proses Konurbasi Jakarta-Bandung. J. Reg. Rural. Dev. Plan. 2018, 2, 195–208. [Google Scholar] [CrossRef]
  53. Ghosh, P.; Mukhopadhyay, A.; Chanda, A.; Mondal, P.; Akhand, A.; Mukherjee, S.; Nayak, S.; Ghosh, S.; Mitra, D.; Ghosh, T.; et al. Application of Cellular Automata and Markov-Chain Model in Geospatial Environmental Modeling—A Review. Remote Sens. Appl. Soc. Environ. 2017, 5, 64–77. [Google Scholar] [CrossRef]
  54. Landis, J.R.; Koch, G.G. The Measurement of Observer Agreement for Categorical Data. Biometrics 1977, 33, 159–174. [Google Scholar] [CrossRef]
  55. Wilonoyudho, S. Urbanization and Regional Imbalances in Indonesia. Indones. J. Geogr. 2017, 49, 125–132. [Google Scholar] [CrossRef]
  56. Dewi, R.S.; Handayani, W.; Rudiarto, I. Artiningsih Understanding the Connection between Urbanization and Hydrometeorological Disasters: An Experience from Central Java Province, Indonesia. IOP Conf. Ser. Earth Environ. Sci. 2022, 1039, 012015. [Google Scholar] [CrossRef]
  57. Mardiansjah, F.H.; Sugiri, A.; Ma’rif, S. Peri-urbanization of small cities in Java and its impacts on paddy fields: The case of Tegal Urban Region, Indonesia. IOP Conf. Ser. Earth Environ. Sci. 2021, 724, 012023. [Google Scholar] [CrossRef]
  58. Pravitasari, A.E.; Suhada, A.; Mulya, S.P.; Rustiadi, E.; Murtadho, A.; Wulandari, S.; Widodo, C.E. Land use/cover changes and spatial distribution pattern of rice field decreasing trend in Serang Regency, Banten Province. IOP Conf. Ser. Earth Environ. Sci. 2019, 399, 012033. [Google Scholar] [CrossRef]
  59. Daris, E.; Aminudin, I.; Feriansyah, A. Determinants of Paddy Fields Conversion in Java Island, Indonesia. In Proceedings of the International Conference on Science and Technology (ICOSAT 2017)-Promoting Sustainable Agriculture, Food Security, Energy, and Environment Through Science and Technology for Development, Ancol, Indonesia, 10 August 2017; Atlantis Press: Amsterdam, The Netherlands, 2017; pp. 95–98. [Google Scholar]
  60. Pravitasari, A.E.; Yudja, F.P.; Mulya, S.P.; Stanny, Y.A. Land cover changes and spatial planning alignment in Ciamis Regency and its proliferated regions. IOP Conf. Ser. Earth Environ. Sci. 2021, 694, 012065. [Google Scholar] [CrossRef]
  61. Harjanti, L.T.; Hara, Y. The Determinants of Paddy Fields Conversion in Java and Sumatra [Faktor-Faktor Penentu Konversi Luas Lahan Sawah di Jawa dan Sumatera]. J. Èkon. Dan Kebijak. Publik 2020, 11, 39–52. [Google Scholar] [CrossRef]
  62. Fitri, T.Y.; Adiwibowo, S.; Pravitasari, A.E. The impact of land-use changes and economic losses of paddy field conversion: A case study of Ciampea Sub-district, Bogor Regency, West Java Province. IOP Conf. Ser. Earth Environ. Sci. 2022, 950, 012104. [Google Scholar] [CrossRef]
  63. Gandharum, L.; Hartono, D.M.; Karsidi, A.; Ahmad, M. Monitoring urban expansion and loss of agriculture on the north coast of west java province, Indonesia, using Google Earth engine and intensity analysis. Sci. World J. 2022, 1–16. [Google Scholar] [CrossRef]
  64. Shrestha, R.P. Partoyo Monitoring farmland loss and projecting the future land use of an urbanized watershed in Yogyakarta, Indonesia. J. Land Use Sci. 2013, 8, 59–84. [Google Scholar] [CrossRef]
  65. Maryati, S.; Humaira, A.N.S.; Pratiwi, F. Spatial pattern of agricultural land conversion in West Java Province. IOP Conf. Ser. Earth Environ. Sci. 2018, 131, 012034. [Google Scholar] [CrossRef]
  66. Saputro, B.; Priatna, D.; Rosadi, R.; Miyazawa, N. Spatial analysis of paddy field conversion in Purwakarta Regency, West Java, Indonesia. Appl. Environ. Stud. 2023, 4, 22–29. [Google Scholar]
  67. Damayanti, A.; Setiadi, A.; Febrianti, A.; Setyawan, B.A.; Angelika, P.; Setiadi, R.P. Spatial and Temporal Patterns of the Decreasing Rice Field in Sidorejo Sub-district, Salatiga City, Central Java Province, Indonesia. IOP Conf. Ser. Earth Environ. Sci. 2019, 328, 012057. [Google Scholar] [CrossRef]
  68. Rahayu, P.; Werdiningtyas, R.; Suminar, L. The Challenge of Rice Farming in Urbanized Region: The case of Sragen District, Central Java. IOP Conf. Ser. Earth Environ. Sci. 2023, 1186, 012013. [Google Scholar] [CrossRef]
  69. Fiqriyati, A.R.; Panuju, D.R.; Mulya, S.P. The dynamics of rice-field conversion in the surroundings Cipali toll-roads of Subang Regency. IOP Conf. Ser. Earth Environ. Sci. 2022, 950, 012094. [Google Scholar] [CrossRef]
  70. Novira, N.; Dalimunthe, S.A.; Pinem, M.; Elfayetti; Pinem, K. Rice field conversion and urban agglomeration in Indonesia: Between power and options. J. Phys. Conf. Ser. 2019, 1175, 012184. [Google Scholar] [CrossRef]
  71. Firmansyah, I.; Yusuf, D.N.; Arumasmawati, A.B. Spatial dynamics of agricultural lands in regions with high pressure land use change (Case study of Purwakarta Regency). IOP Conf. Ser. Earth Environ. Sci. 2019, 363, 012010. [Google Scholar] [CrossRef]
  72. Mardiansjah, F.H.; Sugiri, A.; Sari, G.P. Urban population growth and their implication to agricultural land in the process of metropolitanization: The case of kabupaten sukoharjo, in metropolitan surakarta. IOP Conf. Ser. Earth Environ. Sci. 2019, 328, 012064. [Google Scholar] [CrossRef]
  73. Rondhi, M.; Pratiwi, P.A.; Handini, V.T.; Sunartomo, A.F.; Budiman, S.A. Agricultural land conversion, land economic value, and sustainable agriculture: A case study in East Java, Indonesia. Land 2018, 7, 148. [Google Scholar] [CrossRef]
  74. Pribadi, D.O.; Pauleit, S. The dynamics of peri-urban agriculture during rapid urbanization of Jabodetabek Metropolitan Area. Land Use Policy 2015, 48, 13–24. [Google Scholar] [CrossRef]
  75. Buchori, I.; Sugiri, A.; Maryono, M.; Pramitasari, A.; Pamungkas, I.T. Theorizing spatial dynamics of metropolitan regions: A preliminary study in Java and Madura Islands, Indonesia. Sustain. Cities Soc. 2017, 35, 468–482. [Google Scholar] [CrossRef]
  76. Fahmi, F.Z.; Hudalah, D.; Rahayu, P.; Woltjer, J. Extended urbanization in small and medium-sized cities: The case of Cirebon, Indonesia. Habitat Int. 2014, 42, 1–10. [Google Scholar] [CrossRef]
  77. Mardiansjah, F.H.; Sugiri, A.; Ma’Rif, S. Examining small-town growth and expansion in peri-urban areas of small cities: Evidence from peripheries of three small cities in central java. J. Reg. City Plan. 2021, 32, 216–232. [Google Scholar] [CrossRef]
Figure 1. Research location: Java by cities and regencies and their metropolitan areas.
Ijgi 13 00102 g001
Figure 2. Graph of the percentage area of LULC in Java at various points in the existing and predicted years.
Ijgi 13 00102 g002
Figure 3. Land use/land cover map of Java in 2006, 2019, and land use/cover projection in 2032 based on 3 scenarios (BAU, Conservative, and RTRW).
Ijgi 13 00102 g003
Figure 4. Increasing of built-up area in Java 2006–2019.
Ijgi 13 00102 g004
Figure 5. Klassen typology of urbanization level and urban growth in Java 2006–2019. Notes: red lines represent the average of urban growth and urbanization level in Java.
Ijgi 13 00102 g005
Figure 6. Klassen typology of urbanization level and urban growth in Java 2019–2032 based on Business as Usual (BAU) scenarios. Notes: red lines represent the average of urban growth and urbanization level in Java.
Ijgi 13 00102 g006
Figure 7. Klassen typology of urbanization level and urban growth in Java 2019–2032 based on Conservative (CONS) scenarios. Notes: red lines represent the average of urban growth and urbanization level in Java.
Ijgi 13 00102 g007
Figure 8. Klassen typology of urbanization level and urban growth in Java 2019–2032 based on Spatial Planning (RTRW) scenarios. Notes: red lines represent the average of urban growth and urbanization level in Java.
Ijgi 13 00102 g008
Figure 9. Klassen typology map of urbanization level and urban growth of Java in 2019 and 2032 based on 3 scenarios (BAU, Conservative, and RTRW).
Ijgi 13 00102 g009
Table 1. Different notions concerning large-scale urban agglomeration.
ConceptDefinitionSource
MegaregionMegaregions refer to large, interconnected networks of metropolitan areas or cities that are economically and socially integrated. They often transcend traditional political boundaries and encompass multiple urban centers, as well as their surrounding suburban and rural areas. Megaregions are characterized by a high population density, significant economic
activity, and shared infrastructure and resources.
[7]
Mega-City
Region
Mega-city regions are urban agglomerations characterized by extremely high population densities and intense economic activity. These regions typically consist of one or more large metropolitan areas, along with their surrounding suburbs and satellite cities. Mega-city regions are often centers of commerce, industry, and culture, and they exert a significant influence on regional and global affairs.[8,9,10,11]
MegalopolisA megalopolis is a vast urban region characterized by the continuous expansion and merging of multiple metropolitan areas or cities into a single, densely populated and interconnected urban sprawl. Megalopolises often form along transportation corridors or in areas of high economic activity, and they may encompass several states or even entire countries.[12,13,14,15]
Polycentric
Metropolis
A polycentric metropolis is a metropolitan area characterized by the presence of multiple centers of economic activity and urban development, rather than a single dominant city center. In a polycentric metropolis, several smaller cities or urban nodes function as hubs for commerce, industry, and culture, and they are interconnected by transportation networks and shared infrastructure. Polycentric metropolises are often more resilient and sustainable than monocentric cities, as they distribute economic activity and populations across multiple locations.[16,17,18,19,20]
Mega-
conurbation
Mega-conurbations are vast urban regions characterized by the continuous expansion and merging of multiple metropolitan areas or urban agglo-
merations into a single, highly interconnected, and densely populated urban complex. Mega-conurbations typically encompass large areas of land and are home to millions of people. They may exhibit features of both megalopolises and megaregions, with intense economic activity, significant infrastructure development, and complex social dynamics.
[21,22,23,24]
Table 2. List of metropolitan areas in Java and their member of localities.
No.Metropolitan AreaOfficial
Acronym
LocalitiesProvince
1Jakarta
Metropolitan Area (JMA)
JabodetabekNorth Jakarta City, West Jakarta City, East Jakarta City, South Jakarta City, and Central Jakarta City. Bogor Regency, Bogor City, Depok City, Bekasi Regency, and Bekasi City. Tangerang Regency, Tangerang City, and South Tangerang City.Jakarta,
West Java,
Banten
2Bandung
Metropolitan Area (BMA)
Cekungan
Bandung
Bandung City, Bandung Regency, Cimahi City, and
West Bandung Regency.
West Java
3Semarang
Metropolitan Area (SeMA)
KedungsepurSemarang City, Semarang Regency, Salatiga City, Kendal
Regency, Grobogan Regency, and Demak Regency.
Central Java
4Yogyakarta
Metropolitan Area (YMA)
KartamantulYogyakarta City, Sleman Regency, and Bantul Regency.Yogyakarta
5Surabaya
Metropolitan Area (SuMA)
GerbangkertosusilaSurabaya City, Gresik Regency, Bangkalan Regency,
Mojokerto City, Mojokerto Regency, Sidoarjo Regency,
and Lamongan Regency.
East Java
6Greater
Malang (GM)
Malang RayaMalang City, Malang Regency, and Batu City.East Java
7Greater
Surakarta (GS)
Subosuko-
wonosraten
Surakarta City, Boyolali Regency, Sukoharjo Regency,
Wonogiri Regency, Sragen Regency, and Klaten Regency.
Central Java
8Greater
Cirebon (GC)
RebanaCirebon City, Cirebon Regency, Subang Regency,
Indramayu Regency, and Kuningan Regency.
West Java
Table 3. Klassen typology of urbanization level and urban growth rate in Java.
Urbanization Level (UL) *
UL region is lower than average UL in Java (ULi < UL)UL region is higher than average UL in Java (ULi > UL)
Urban Growth (UG) **UG region is faster than average UG in Java (UGi < UG)Quadrant II
(Potential/Developing)

(Fast Growing
Less Urbanized Region)
ULi < UL; UGi > UG
Quadrant I
(Developed/Mature)

(Fast Growing
Urbanized Region)
ULi > UL; UGi > UG
UG region is slower than average UG in Java (UGi < UG)Quadrant III
(Undeveloped)

(Slow Growing
Less Urbanized Region)
ULi < UL; UGi < UG
Quadrant IV
(Saturated)

(Slow Growing
Urbanized Region)
ULi > UL; UGi < UG
Note: * Urbanization level = percentage of built-up area in t1. ** Urban growth = ((total built-up area in t1 − total of built-up area in t0)/total of built-up area in t0)/t1 − t0.
Table 4. LULC area on Java Island (ha) at various points in the existing and predicted years.
Land Use/
Land Cover Types
Total Area (ha)
200620192032 BaU2032 Cons.2032 RTRW
Waterbodies196,894.33240,842.38267,064.83228,708.13205,751.70
Forest3,279,449.772,829,767.552,174,162.742,174,153.652,689,300.07
Built-Up Areas1,280,710.831,781,914.482,095,146.421,887,120.302,913,440.08
Bare land90,435.27149,663.19219,787.54147,444.37148,694.50
Agricultural Land4,165,734.114,765,025.135,211,341.784,822,531.884,473,852.48
Paddy Fields3,974,675.083,395,623.733,246,336.503,954,184.042,753,385.17
Shrubs320,856.04145,918.9894,915.6294,613.06124,331.43
13,308,755.4313,308,755.4313,308,755.4313,308,755.4313,308,755.43
Table 5. Built-up area of Metropolitan and Non-Metropolitan in Java and their average urban growth per year.
YearMetropolitanNon-Metropolitan
Built-up
area (ha)
2006620,837.98659,894.38
2019758,708.24830,337.83
2032 * _BAU969,826.411,124,988.63
2032 * _CONS878,916.691,007,863.32
2032 * _RTRW1,319,825.921,593,512.90
Percentage
of built-up
area (%)
200648.4851.52
201947.7552.25
2032 * _BAU46.3053.70
2032 * _CONS46.5853.42
2032 * _RTRW45.3054.70
Average
urban growth
per year
2006–20190.0170.020
2019–2032 * BAU0.0210.027
2019–2032 * CONS0.0120.016
2019–2032 * RTRW0.0570.071
Note: * based on land cover prediction.
Table 6. Recapitulation of Klassen typology of urbanization level and urban growth in Java 2019–2032 based on 3 scenarios.
Quadrant20192032_BAU2032_CONS2032_RTRW
Number of Regions%Number of Regions%Number of Regions%Number of Regions%
Quadrant 154.2454.2443.391411.86
Quadrant 23126.274437.293327.973832.20
Quadrant 35042.373832.204840.684033.90
Quadrant 43227.123126.273327.972622.03
Total118100.00118100.00118100.00118100.00
Disclaimer/Publisher’s Note: The statements, opinions and data contained in all publications are solely those of the individual author(s) and contributor(s) and not of MDPI and/or the editor(s). MDPI and/or the editor(s) disclaim responsibility for any injury to people or property resulting from any ideas, methods, instructions or products referred to in the content.

