1. Introduction
Farmlands are a fundamental unit of agricultural production and important for ensuring food security and maintaining societal stability [
1,
2,
3]. Farmland landscape patterns show the ecological status of and spatial variations in farmland within a region [
4,
5]. Several studies from Europe, Asia and Africa have shown that the evolution of farmland landscape patterns has a profound impact on farmland biodiversity, ecosystem services, human–wildlife conflicts and food security [
6,
7,
8,
9,
10,
11,
12]. A loss of farmland exacerbates the fragmentation of farmland landscapes, leading to a decrease in agricultural production potential and threats to food production security [
13,
14]. The systematic and effective restoration of farmland can increase the scale of agricultural production and alleviate pressures on food production [
15,
16]. Quantitatively analyzing the dynamic evolution patterns of farmland landscapes helps decision makers understand the process of farmland resource development and formulate reasonable farmland management strategies [
5].
Research on the evolution of farmland landscape patterns is mostly carried out for specific static time nodes and uses landscape indices, comprehensive landscape evaluation models and other methods to explore the distribution characteristics of farmland landscapes at the national, provincial, municipal and county levels [
17,
18,
19,
20,
21,
22,
23]. This type of research cannot provide a systematic description of the dynamic patterns in farmland evolution between time nodes; therefore, it cannot show the patterns of farmland landscape evolution. The theory of the landscape process in landscape ecology can make up for the deficiencies mentioned above. A landscape process model was validated in quantifying the spatial evolution of landscapes in the United States, Nepal, China and other countries [
24,
25,
26,
27,
28]. Based on topology theory, landscape fragmentation models, landscape restoration process models and other models have been used to classify the evolution of landscapes over a period of time. The classification results reflect the specific patterns of landscape evolution during a period and have clear spatial implications.
Spatial analysis is an important means to study geospatial phenomena. It can realize the visualization of geospatial data and identify patterns and spatial relationships that are not easy to find using traditional data analysis methods. Geospatial analysis methods, such as the gravity center model, superposition analysis, correlation analysis and geoscience information Tupu, have been applied and verified in the fields of farmland environment, farmland quality evaluation, farmland preservation policy and land use transitions [
6,
29,
30,
31,
32]. Farmland landscapes may have different evolution patterns and development trends in different periods and regions. The advantages of geospatial methods help them to mine spatial information related to farmland landscape evolution and statistically analyze the spatial law of evolution.
China’s challenge of balancing a large population with limited land resources underscores the value of agricultural landscapes as essential assets. The current understanding of the spatiotemporal trends and drivers behind China’s farmland landscape evolution remains inadequate. By leveraging multi-temporal farmland cover data and employing landscape process models across various scales and periods, this study aims to dissect the evolution of China’s farmland landscape. It endeavors to map the zoning of farmland evolution from diverse angles to illuminate regional discrepancies. Through the analysis of natural and socioeconomic factors in correlation with different evolutionary processes, this research seeks to determine the mechanisms driving farmland changes, offering insights to refine farmland management practices.
2. Materials and Methods
2.1. Data Source and Preprocessing
The data used in this article include land cover data, environmental data, such as elevation, annual temperature and annual precipitation, and social and economic statistical data for Chinese cities.
The land cover maps for 1980, 1990, 2000, 2010 and 2020 were obtained from the Resource and Environment Data Cloud Platform (
http://www.resdc.cn (accessed on 1 December 2023)). The dataset was generated by human visual interpretation on Landsat TM images from the United States Landsat, with a spatial resolution of 1000 m. The maps include 6 primary types and 25 secondary types of farmland, forestland, grassland, water area, construction land and unused land. To provide a basis for subsequent data analysis, the 25 subcategories of the land cover map were first reclassified into two categories: farmland and non-farmland. The sources of environmental data and socioeconomic statistical data are shown in
Table 1.
2.2. Assessment of the Spatial Process of Farmland Change
During the evolution process, farmland change is generally categorized into three states: lost farmland, gained farmland and remaining farmland [
25]. The types of lost farmland include perforation, subdivision, shrinkage and attrition. Perforation means that a lost patch is adjacent to only one remaining patch. Subdivision means that a lost patch is adjacent to at least two remaining patches and adjacent to a non-farmland patch. Shrinkage means that a lost patch is adjacent to only one remaining patch and is also adjacent to a non-farmland patch. Attrition means that a lost patch is only adjacent to a non-farmland patch. These types can cause the fragmentation of farmland and are not conducive to large-scale agricultural production. The types of gained farmland include increment and expansion. Expansion means that a gained patch is adjacent to a remaining patch. Increment means that a gained patch is surrounded by patches of non-farmland. These types are effective measures for farmland conservation. Expansion can significantly increase the connectivity among patches of farmland. Increments can ensure the quantity and quality of stable farmland resources to a certain extent. The remaining farmland can be of three types: core, edge and scattered areas. Core means that the remaining farmland is adjacent only to the remaining farmland grid. The core provides suitable conditions for large-scale production. Edge refers to a grid of remaining farmland adjacent to both core and non-farmland. It is a transition zone between agricultural production and non-agricultural activities, which can effectively buffer the impact of non-agricultural production on agricultural production. The concept of scattered areas refers to the remaining farmland grids that are adjacent only to non-farmland. The topological relationships and definitions of the evolution patterns of farmland are shown in
Figure 1. Green represents remaining farmland patches, blue represents lost farmland patches, orange represents gained farmland patches and gray represents non-farmland patches.
The spatial process of farmland change was realized using ArcMap 10.5 software. The process is shown in
Figure 2. Land cover map I and land cover map II represent two datasets at different time points. By overlaying the two farmland maps, we identified the lost farmland (LF), the remaining farmland (RF), the gained farmland (GF) and the non-farmland (NF). Then, using the regional group tool, we merged the four types of farmland pixels into lost farmland patches (LFPs), remaining farmland patches (RFPs), gaining farmland patches (GFPs) and non-farmland patches (NFPs). Each patch had a unique ID. With the neighborhood analysis tool, we further obtained the adjacency relationships between the LFP and the RFP, between the LFP and NFP, between the GFP and RFP, and between the GFP and the NFP. Based on the classification principle, the final classification results for farmland change were obtained. In this way, we generated a series of maps showing farmland fragmentation and restoration processes.
2.3. Multiangle Zoning of Farmland Landscapes
To better characterize the regional differences in the evolution of farmland landscapes and to provide a decision-making tool for farmland management, in this study, we dynamically divided the farmland landscapes into remaining farmland composition, gained farmland composition and lost farmland. In China, a county is the smallest unit that can be analyzed to regulate agricultural production and formulate farmland management plans, so the zoning units were based on counties. The scale advantage index was calculated for nine types of cultivated land [
33]. The formula is as follows:
where
is the scale advantage index of farmland type
j in county
i;
is the area of farmland type
j in county
i;
is the total area of farmland type
J in county
i;
is the total area of farmland type
j in China; and
is the total area of farmland type
J in the country.
The specific zoning principles are as follows:
- (I)
Considering the impacts of core, edge and scattered-type landscapes on agricultural production, we divided agricultural production zoning into hierarchical levels. First, counties with a core scale index greater than 1 were classified as agricultural core areas (ACAs). Second, counties with an edge scale index greater than 1 were defined as agricultural protected areas (APAs). Then, counties with a scattered scale index greater than 1 were defined as agricultural improvement areas (AIAs). Finally, counties in which all three scale indices were less than 1 were defined as general agricultural areas (GAAs).
- (II)
Considering the means of farmland restoration, counties with an increase in the advantage index greater than 1 were defined as increment advantage areas (IAAs). Counties with an expansion advantage index greater than 1 were defined as expansion advantage areas (EAAs). Counties in which both advantage indices were less than 1 were defined as general restoration areas (GRAs).
- (III)
The more types of lost farmland there are, the more complex the fragmentation process of farmland in the county. If the advantage index of three or more types of lost farmland in a county was greater than 1, the county was defined as an area of extremely complex fragmentation (ECAF). If the advantage index of two types of lost farmland in the county was greater than 1, the county was defined as an area of complex fragmentation (CAF). If there was only one type of farmland loss with an advantage index greater than 1 in a county, it was defined as a fragmented area (AF). If the four lost farmland advantage indices were less than 1, then the county was classified as a generally fragmented area (GAF).
2.4. Correlation Analysis
To further explore the process of spatial changes of farmland, socioeconomic statistics and environmental factors were selected for correlation analysis. Prefecture-level cities are the basic unit for specifying agricultural policies. Considering the availability of data, we chose prefecture-level cities as the analysis unit. The administrative boundaries of the prefecture-level cities were used to extract the proportions of the nine farmland change processes in each city. We calculated the Spearman correlation coefficient between the percentages of different farmland changes and the impact factors. The greater the absolute value of the Spearman coefficient, the stronger the correlation between two factors, and the sign of the value indicates the direction of the correlation [
34]. The calculation formula is as follows:
where
is the rank difference in each pair of observations after XY is deranked, and
n is the number of all observation pairs.
3. Results
3.1. Multiscale Analysis of the Dynamic Evolution of Farmland
3.1.1. Country Level
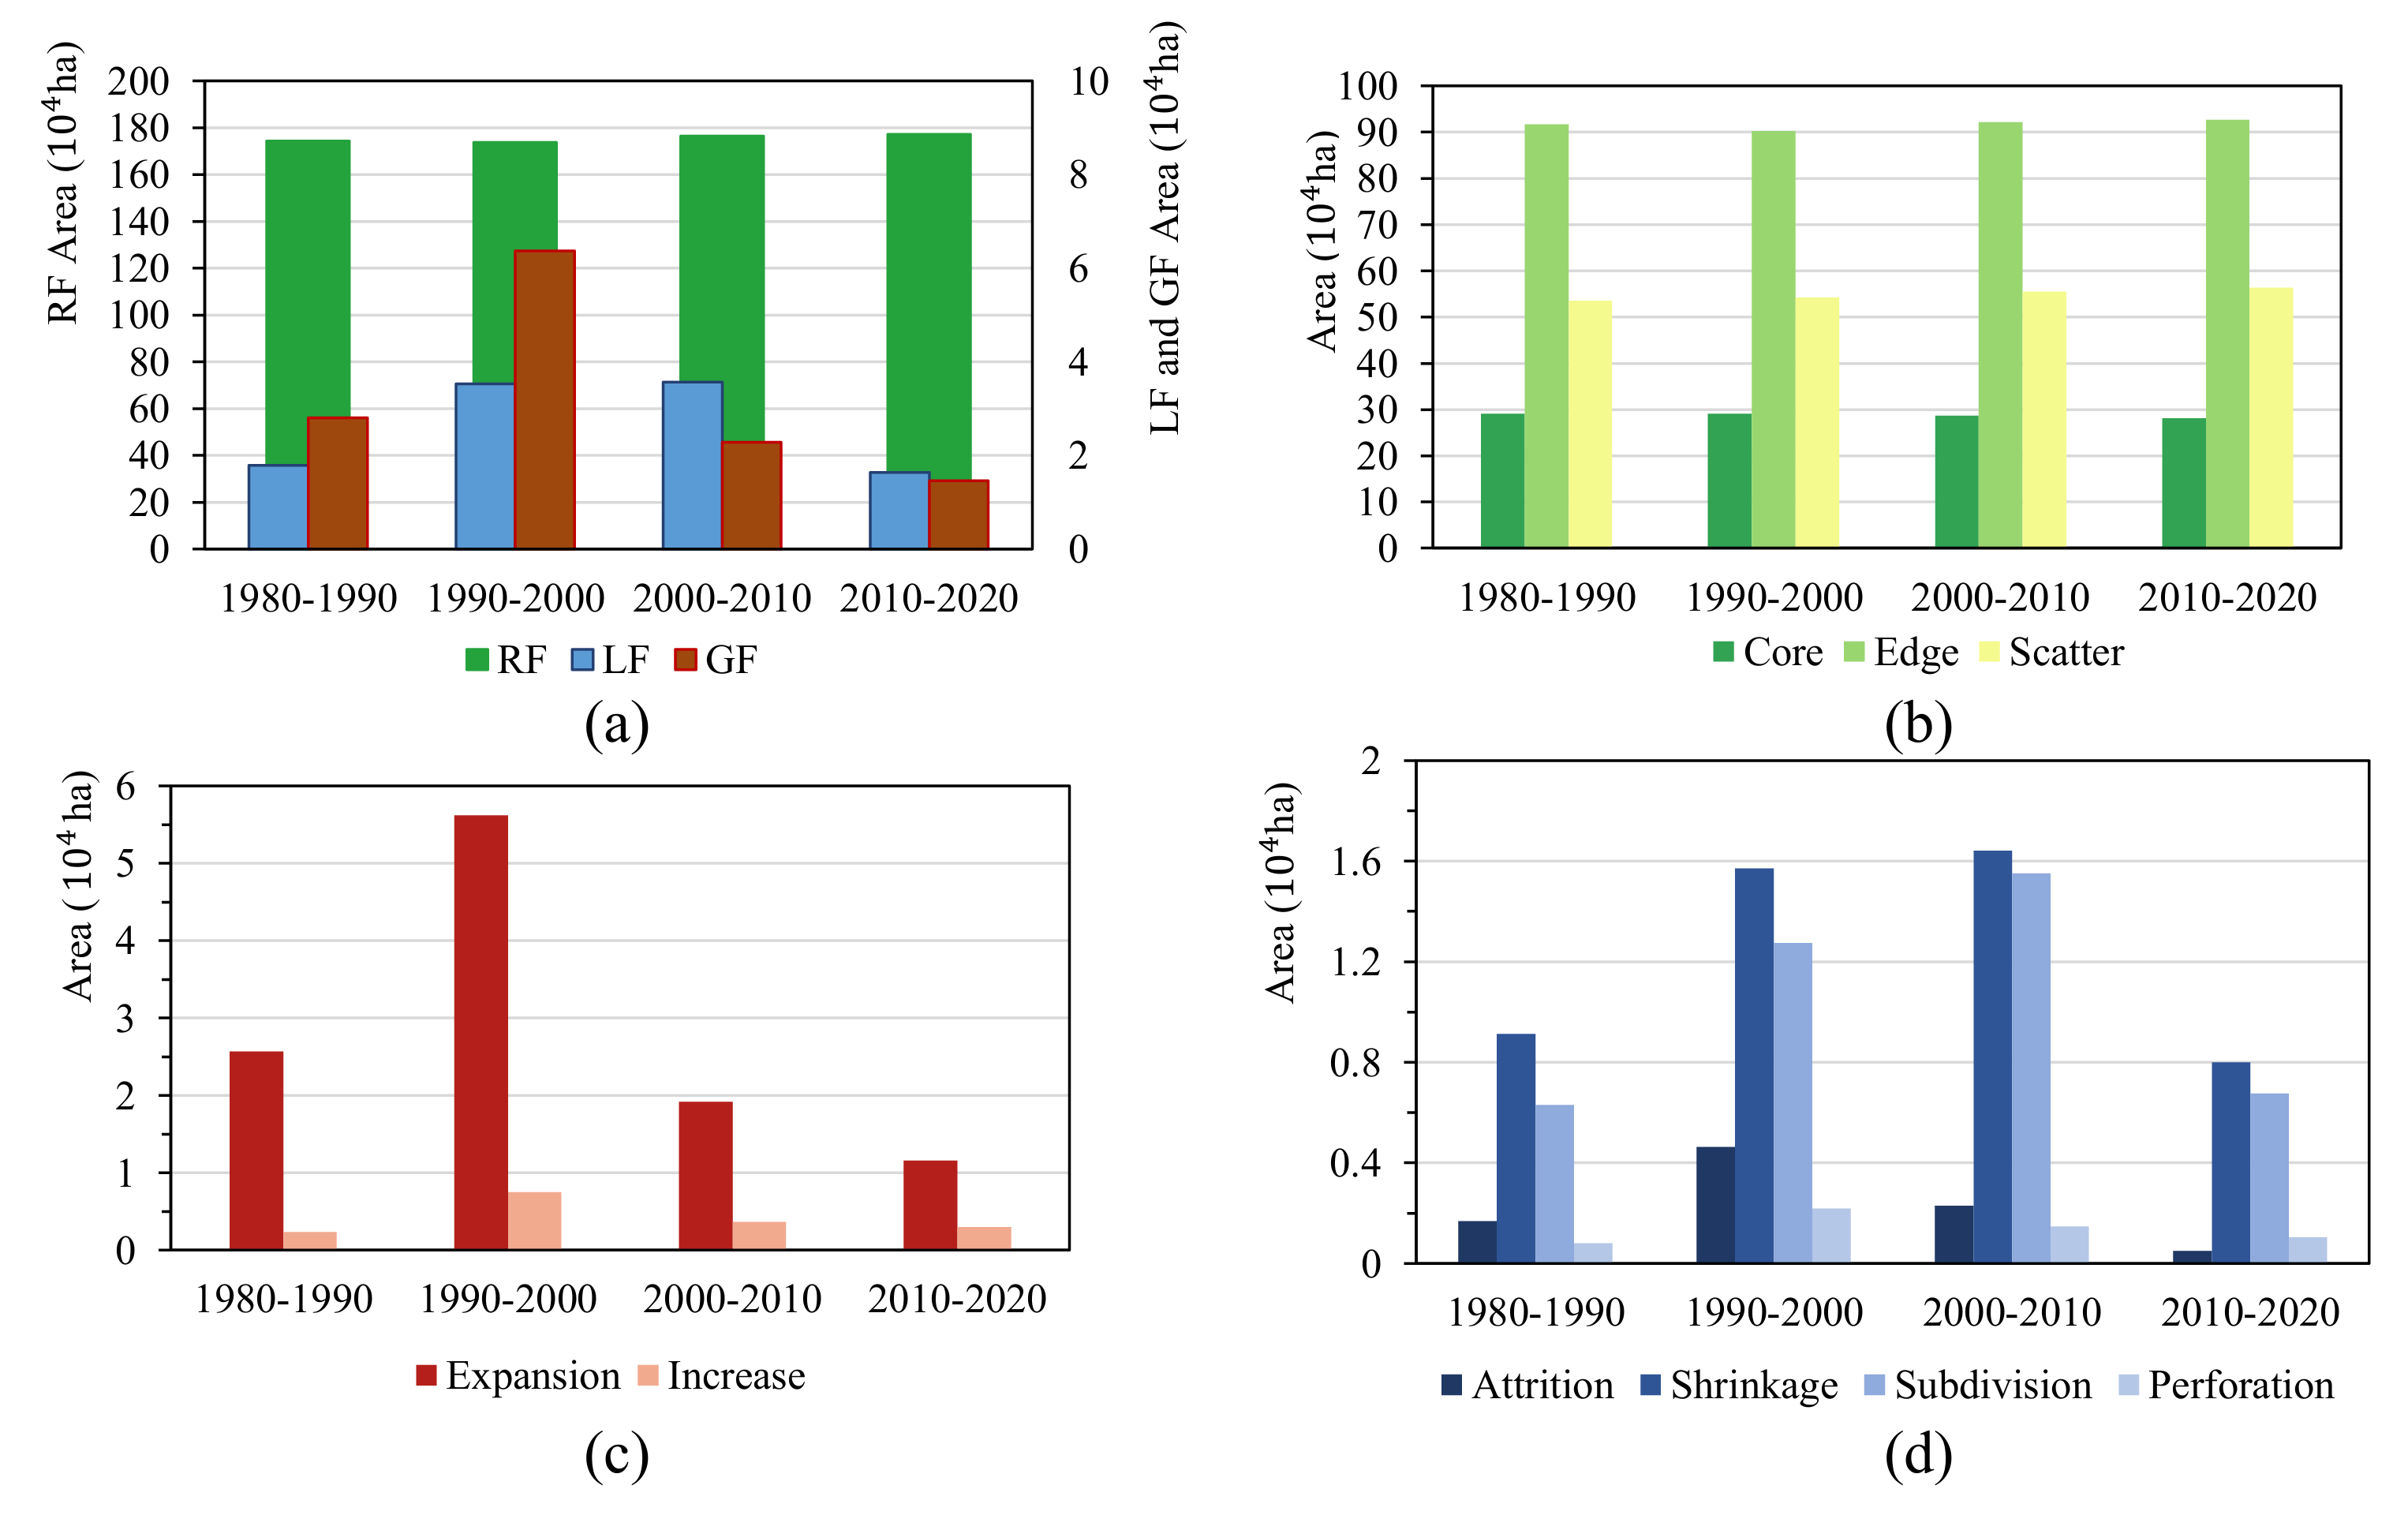
Using the farmland reclassification data from the fifth period, we obtained a process map for spatial change and a statistical map of farmland landscape, as shown in
Figure 3 and
Figure 4, respectively. During the four periods, the quantity of remaining farmland in China was relatively stable, at 1,750,000 square kilometers. The remaining farmland was mainly marginal farmland. The amount of gained farmland showed a trend of first increasing and then decreasing. The greatest amount of gained farmland was present between 1999 and 2000, at 64,000 square kilometers. Farmland expansion was the main cause of farmland gain. Although the proportion has gradually decreased, it still exceeds 75%. The area of farmland loss remained relatively high for a long period of time. From 1990 to 2010, China lost approximately 70,000 square kilometers of farmland resources. After 2010, the area of loss decreased. Farmland loss occurred in the four periods mainly due to shrinkage and subdivision. During the period of 2000–2010, the proportions of shrinkage and subdivision reached 46% and 43%, respectively.
Figure 4 shows the center of gravity distribution of various types of farmland. The center of gravity movement path for expansion and increment was “northwest—south—north”. The center of gravity movement path for the core areas was distributed in the North China Plain, and the scatter was distributed in the northern region of Hubei Province. The center of gravity of edges underwent a significant change, with a path of “northwest—southwest—northeast”. The four types of LF have similar paths of center of gravity movement, which were “southwest—south—northeast”.
3.1.2. Provincial Level
Figure 5 shows the composition of various types of farmland areas based on provincial statistical units. During the four periods, the proportions of the three types of RF remained relatively stable in each province. Traditional agricultural provinces, such as Heilongjiang, Shandong, Henan, Sichuan and other provinces, had combined proportions of cores and edges exceeding 75%. These regions are the main grain production bases in China and have specific requirements for maintaining contiguous farmland. The RF types in the northwestern provinces, such as the Inner Mongolia Autonomous Region, Gansu and Xinjiang Uygur Autonomous Region, are mainly edge and scatter. Among the provinces in southwestern and southeastern China, such as Yunnan, Guangxi, Guangdong, Hunan, Fujian and Hainan, the proportion of scattered area is the highest, exceeding 50%. From 1980 to 2020, the Northeast and Northwest regions of China were the main areas of farmland restoration. The main method of farmland restoration in each province is expansion. The proportion of increment is relatively high in the northeast, northwest and southern regions. From 1990 to 2000, the GF area in 26 provinces exceeded 1000 square kilometers. This period was the most active time for farmland restoration. Shrinkage and subdivision are the main ways in which farmland is lost in various provinces. Perforation mainly occurs in provinces in Northeast China, North China and the Yangtze River Basin. From 1980 to 2020, the number of provinces with LF areas exceeding 10,000 square kilometers increased from 7 to 20. The scope of farmland loss in China has expanded over time.
3.2. Zoning Based on the Dynamic Evolution Patterns of Farmlands
According to the combination of core, edge and scatter areas, China’s agricultural counties were divided into agricultural core areas, agricultural protected areas, agricultural improvement areas and general agricultural areas. The results are shown in
Figure 6. The Northeast Plain, North China Plain and Sichuan Basin are typical ACAs, which are related to the local topographical and geomorphological conditions. The APAs are mainly distributed around the core areas. Due to the large number of hills and mountains in Southern China, there is no scale advantage for agriculture in this area. With time, the ACAs and APAs expanded significantly, which was caused by local agricultural development policies.
According to the difference between the proportion of increment and expansion, the agricultural counties in China were divided into increment advantage areas, expansion advantage areas and general restoration areas. The results are shown in
Figure 7. The northwest, northeast and southeast regions of China were the regions with the greatest distributions of IAA and EAA. During the period from 1980 to 2020, the IAA and EAA regions in Central China first expanded and then contracted. The scales of IAAs and EAAs in the Yunnan–Guizhou Plateau gradually decreased.
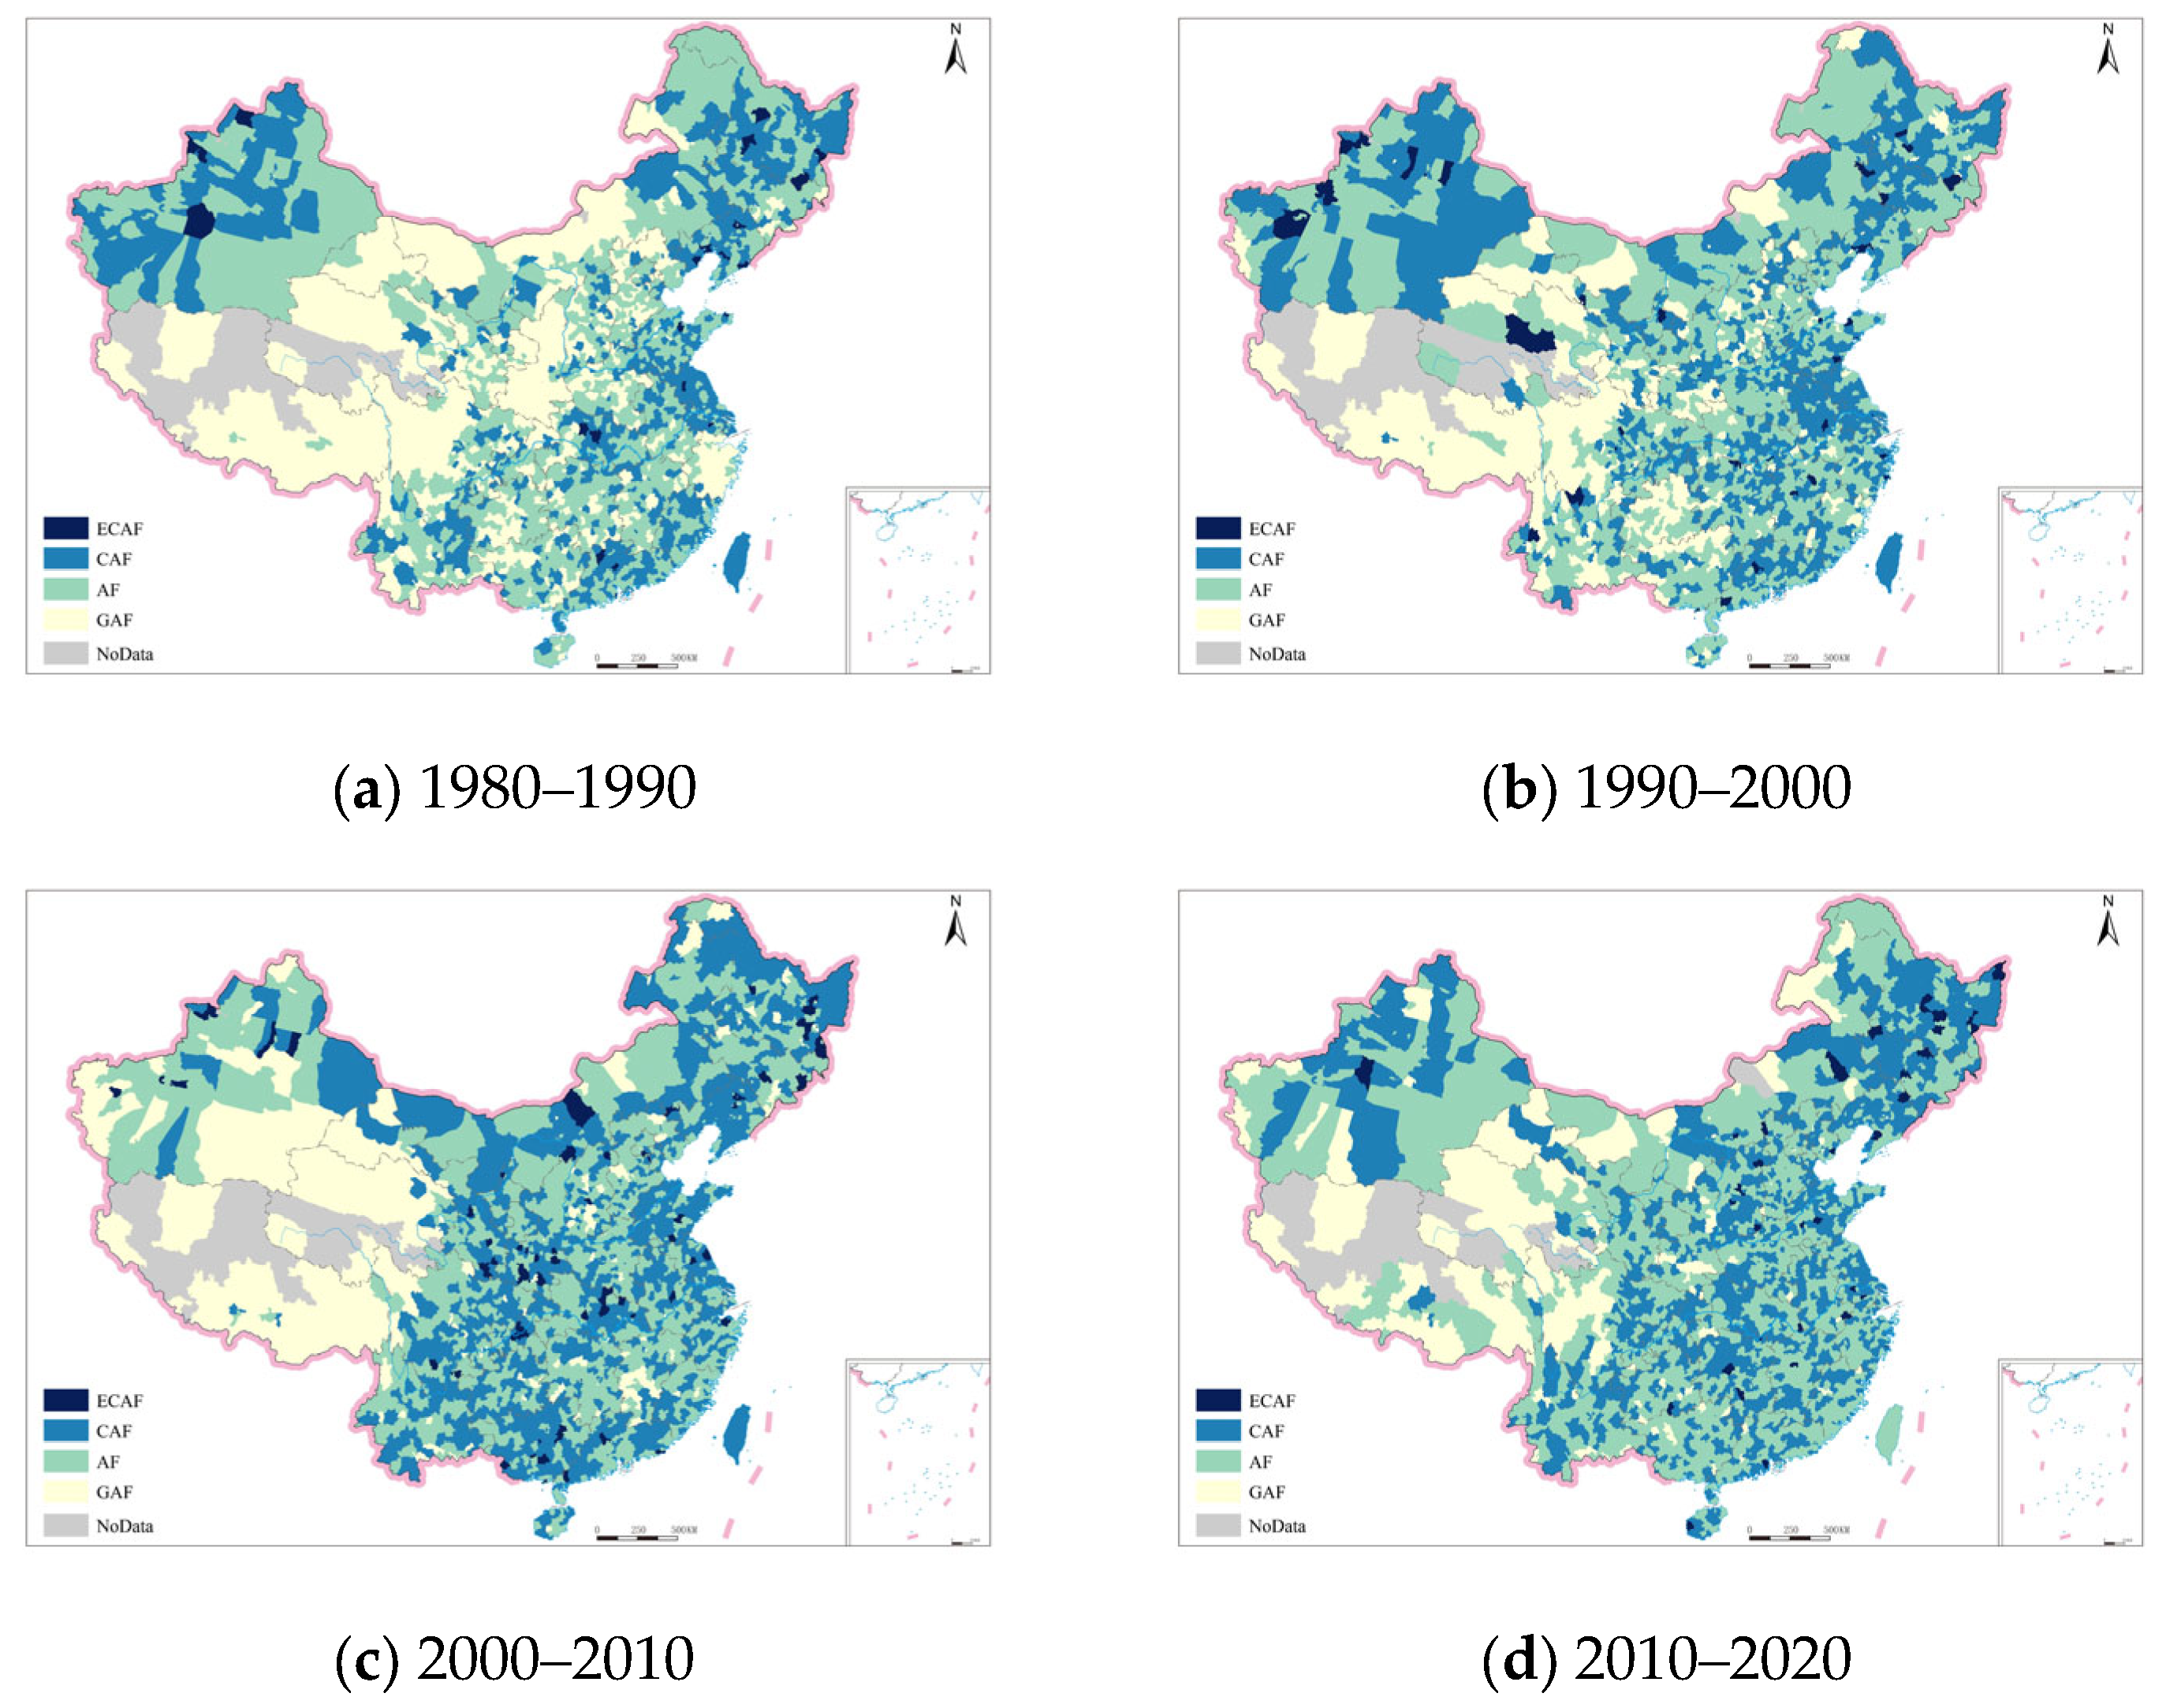
For the four loss processes based on area, the agricultural counties in China were divided into extremely complex areas of fragmentation, complex areas of fragmentation, fragmented areas and general areas of fragmentation. The fragmentation status of farmland in the four periods is shown in
Figure 8. There were relatively few counties in China of the ECAF type; most were of the CAF and AF types. Over time, the scope of CAFs and AFs gradually expanded. By 2020, most counties in China showed farmland fragmentation. In traditional agricultural areas, such as the Northeast Plain, North China Plain and Sichuan Basin, there were many counties of the CAF type. This indicates that the fragmentation of farmland in traditional agricultural areas has complex characteristics.
3.3. Correlation Analysis of Processes of Farmland Changes
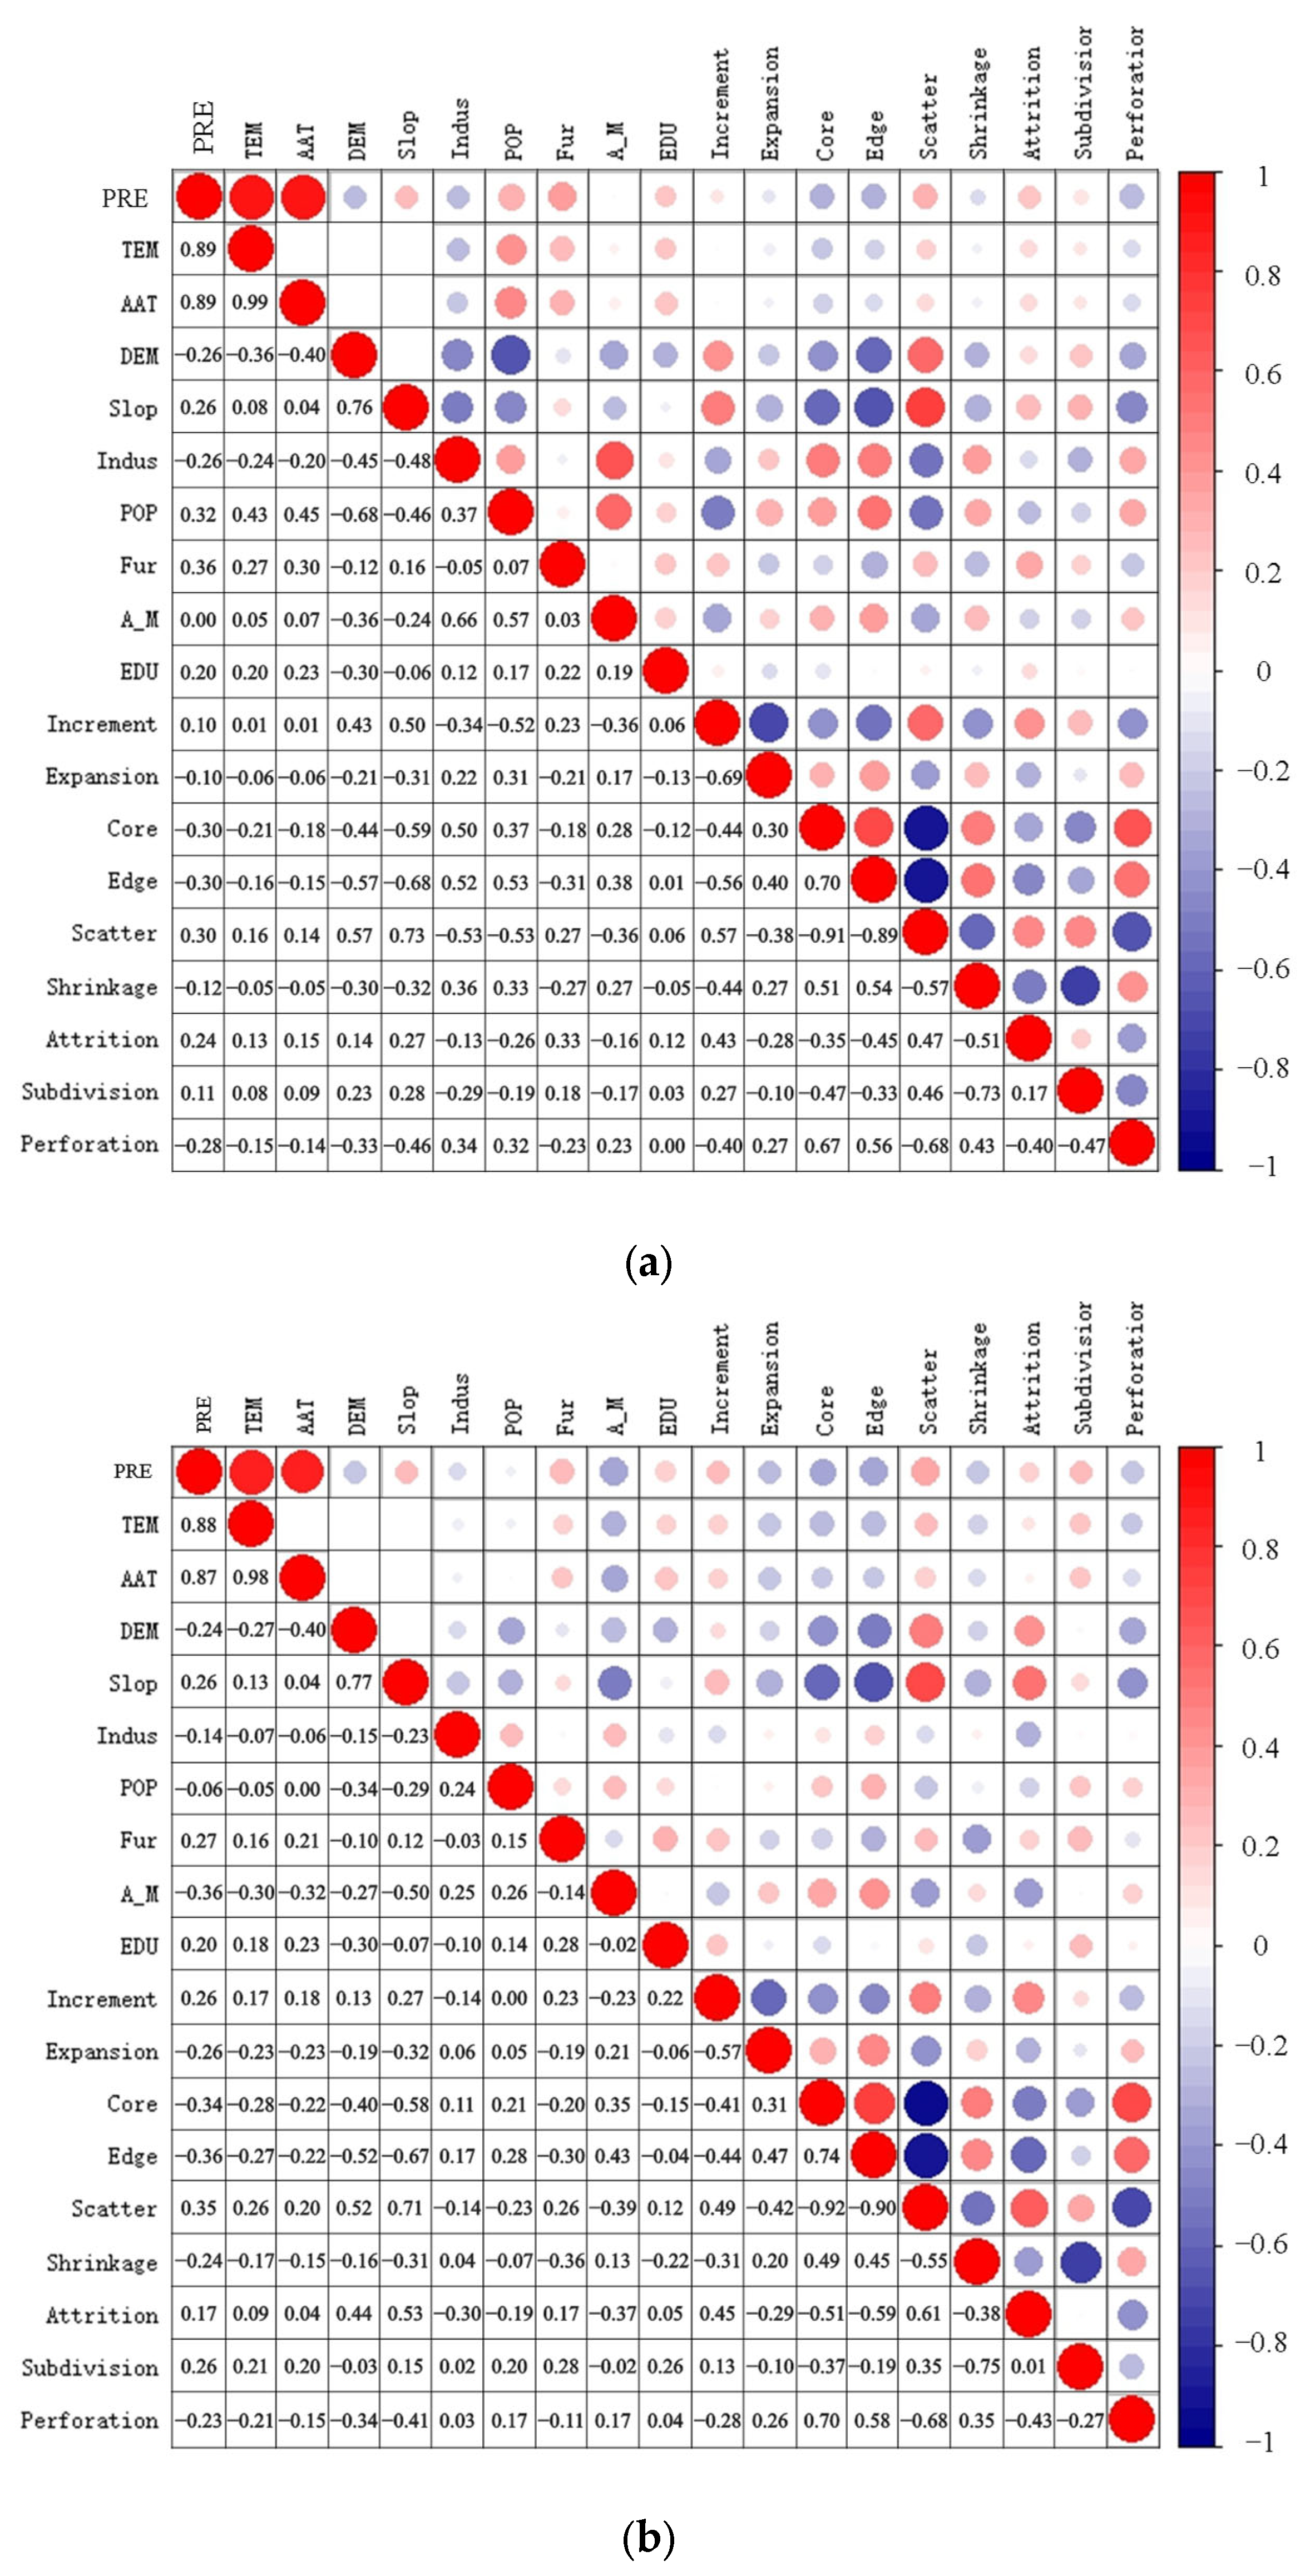
Due to a lack of statistical data in earlier yearbooks, correlation analysis was carried out to analyze the process of spatial changes of farmland for 1990–2000, 2000–2010 and 2010–2020. The results are shown in
Figure 9. During all time periods, the precipitation, temperature, accumulated temperature, fertilizer utilization efficiency and education level exhibited weak correlations with the various types of cultivated land. Terrain factors such as DEM and slope were positively correlated with increment, scatter, attrition and subdivision. The terrain factor was negatively correlated with expansion, core, edge, shrinkage and perforation. The levels of industrialization and population density were negatively correlated with increment, scatter, attrition and subdivision but were positively correlated with expansion, core, edge, shrinkage and perforation. The level of agricultural mechanization was negatively correlated with increment, scatter and attrition but positively correlated with expansion, core and edge. The correlation coefficient values between farmland and related factors varied during different time periods. From 1990 to 2000, terrain factors had strong correlations with increment, core, edge, scatter and perforation. Industrialization and population density exhibited strong correlations with increment, core, edge and scatter. From 2000 to 2010, terrain factors showed strong correlations with core, edge, scatter and attrition. The correlations between industrialization, population density and farmland weakened. The correlations between agricultural mechanization level and core, edge and scatter grew stronger. From 2010 to 2020, terrain factors showed strong correlations with core, edge and scatter. There was almost no correlation between industrialization and farmland. The correlation between population density and edge and scatter grew stronger.
4. Discussion
4.1. Spatiotemporal Distribution Pattern of Farmland Landscape Evolution
The remaining farmlands in China have a relatively stable distribution pattern, but there is still clear evolution in terms of farmland gains and losses. The remaining farmland is mainly edges and scattered areas. Although the core has the smallest proportion of area, there are central agricultural production areas, which is consistent with the current distribution of China’s main agricultural production areas. Terrain factors significantly limit the distribution of remaining farmland. Core and edge are widely distributed in areas with low altitudes and small slopes, while scattered areas are more likely to be distributed in areas with slightly higher altitudes and steep slopes.
Expansion is the main means of farmland restoration. When a large number of expansions occurred in a previous period, these areas were often transformed into edge areas in the next period. The correlations between gained farmland and the factors selected in this article were weak, indicating that the process of farmland restoration is strongly related to governmental policies [
35].
The fragmentation of farmland landscapes is a typical problem in agricultural development, especially in traditional Chinese agricultural production. With respect to farmland loss, the processes of subdivision and shrinkage accounted for more than 80% of the total lost land area and showed an increasing trend. This shows that the fragmentation of China’s farmland increased during the study period. This finding is consistent with the results of other scholars [
36]. The famous landscape ecologist Forman once proposed that the perforation process represents the beginning stage of landscape fragmentation. The process of subdivision and shrinkage is a manifestation of a further increase in the degree of fragmentation. Attrition is the final stage. From 1980 to 2020, the fragmentation process of farmland landscapes in China indicated mid-stage landscape evolution.
4.2. Policy Implications
Based on the patterns of farmland evolution, we should strictly adhere to the red line of 1.8 billion mu of cultivated land [
37]. We need to ensure the scale advantage of the core and refer to edges to establish the protection boundary for core agricultural areas. We should firmly adhere to the strategy of balancing gains and losses of arable land. We can use measures such as supplementation and expansion to restore arable land, reduce the impact of shrinkage and subdivision on the scale of farmland and achieve a dynamic balance and sustainable development in agricultural spaces. There is much evidence that blindly expanding farmland causes great challenges for the protection of agricultural biodiversity [
11]. Only when the agricultural ecosystem is healthy can agricultural production obtain the optimal effect. Therefore, farmland protection needs to pay equal attention to quantity, quality and ecology. Farmland with stable natural ecology that is suitable for crop growth should be chosen to supplement the amount of cultivated land.
According to the zoning results, there are significant differences in the evolution of farmland among different regions in China. The utilization of arable land in each region should be based on the local conditions. The scale advantage of core and edge areas in major agricultural production areas should be ensured, and farmland fragmentation due to land shrinkage, perforation and other factors should be prevented. We must adhere to the principle of “equal emphasis on quality” when adding advantageous areas of cultivated land. Pursuing only quantity goals while neglecting the quality of cultivated land may lead to increases in later stages.
From the correlation analysis results, it can be seen that the distribution of farmland should be determined based on the natural conditions and local socioeconomic factors. On the one hand, it is necessary to improve existing farmland. We need to level fields, improve the connectivity of cultivated land and enhance the suitability of agricultural production methods for cultivated land. On the other hand, we need to strictly implement the farmland supervision system and stop the conversion of farmland into nonagricultural land due to societal and economic development.
5. Conclusions
This study is based on a land cover dataset from 1980 to 2020, and landscape process modeling theory and related methods were used to reveal the spatiotemporal distribution patterns of farmland evolution in China. We used the advantage scale index to partition the evolution patterns of cultivated land. We analyzed the distribution patterns of cultivated land evolution based on natural and socioeconomic factors.
From 1980 to 2020, many types of farmland evolution patterns were found in China. The center of gravity of various cultivated lands has shifted significantly. The remaining farmland is mainly composed of edges and scatters, with core areas showing the lowest proportion. Farmland loss showed an increasing trend, with shrinkage and subdivision being the main types. Farmland evolution in China has long been in the mid-stage of fragmentation. The restoration of arable land has mainly occurred via expansion.
The agricultural core areas and agricultural protection areas were similar to the main agricultural production areas in China, and they were concentrated in the Northeast Plain, North China Plain, Sichuan Basin, the Middle and Lower Yangtze Valley Plain and other areas. The northwest and northeast regions have consistently been advantageous areas for increment and expansion. Complex areas of fragmented farmland are gradually expanding and are widely found in agricultural production areas, requiring key prevention measures.
The impact of different factors on the evolution of cultivated land varies. DEM and slope had a strong correlation with farmland evolution. In areas with low altitudes and small slopes, cores, edges, expansions and shrinkages were widely distributed. Increasing industrialization levels and a rapid increase in population led to an increase in the demand for food production in cities. Therefore, there was a greater distribution of farmland consisting of core and edge areas within regions.
The farmland process model used in this study can fully reflect the dynamic pattern of farmland changes over a period of time. The obtained results clearly demonstrate the spatial differences in the regional clustering of farmland evolution processes. A discussion of the relevant factors involved in the different processes of change is conducive to understanding the internal mechanism of farmland change and has practical significance for maintaining a dynamic balance on farmland. Because of the difficulties associated with data acquisition, some limitations exist in this study, especially in terms of the discussion of relevant factors involved in farmland changes. The factors affecting changes in farmland are complex. The current summary is not comprehensive, and it is necessary to quantify more factors for better correlation analysis.
Author Contributions
Conceptualization, Lili Jiang and Yan Fu; methodology, Yan Fu and Lili Jiang; software, Yan Fu and Yapeng Zhao; validation, Yan Fu, Yapeng Zhao and Lili Jiang; formal analysis, Yan Fu and Qingwen Qi; investigation, Yan Fu and Qingwen Qi; resources, Qingwen Qi and Lili Jiang; data curation, Yan Fu and Yapeng Zhao; writing—original draft preparation, Yan Fu and Yapeng Zhao; writing—review and editing, Lili Jiang and Yan Fu; visualization, Yan Fu and Yapeng Zhao; supervision, Lili Jiang and Qingwen Qi; project administration, Lili Jiang and Qingwen Qi; funding acquisition, Lili Jiang. All authors have read and agreed to the published version of the manuscript.
Funding
This research was funded by the Third Xinjiang Scientific Expedition Program, grant number 2021xjkk0303.
Data Availability Statement
The data presented in this study are available upon request from the corresponding author.
Acknowledgments
The authors thank the reviewers and editors for their valuable comments and suggestions.
Conflicts of Interest
The authors declare no conflicts of interest.
References
- Cheng, L.; Jiang, P.; Chen, W.; Li, M.; Wang, L.; Gong, Y.; Pian, Y.; Xia, N.; Duan, Y.; Huang, Q. Farmland protection policies and rapid urbanization in China: A case study for Changzhou City. Land Use Policy 2015, 48, 552–566. [Google Scholar] [CrossRef]
- Lichtenberg, E.; Ding, C. Assessing farmland protection policy in China. Land Use Policy 2008, 25, 59–68. [Google Scholar] [CrossRef]
- Xin, L.; Li, X. China should not massively reclaim new farmland. Land Use Policy 2018, 72, 12–15. [Google Scholar] [CrossRef]
- Fu, M.; Hu, Z.; Wu, G. Analysis of evolutionary law rule of farmland landscape. Trans. Chin. Soc. Agric. Eng. 2005, 21, 54–58. [Google Scholar]
- Jiang, P.; Li, M.; Cheng, L. Dynamic response of agricultural productivity to landscape structure changes and its policy implications of Chinese farmland conservation. Resour. Conserv. Recycl. 2020, 156, 104724. [Google Scholar] [CrossRef]
- Chen, W.X.; Wang, G.Z.; Cai, W.N.; Che, X.Y.; Zhou, W.H.; Zhang, C.; Zeng, J. Spatiotemporal mismatch of global grain production and farmland and its influencing factors. Resour. Conserv. Recycl. 2023, 194, 107008. [Google Scholar] [CrossRef]
- Li, T.T.; Long, H.L.; Zhang, Y.N.; Tu, S.S.; Ge, D.Z.; Li, Y.R.; Hu, B.Q. Analysis of the spatial mismatch of grain production and farmland resources in China based on the potential crop rotation system. Land Use Policy 2017, 60, 26–36. [Google Scholar] [CrossRef]
- Ma, Q.; Han, W.T.; Huang, S.J.; Dong, S.D.; Li, G.; Chen, H.P. Distinguishing Planting Structures of Different Complexity from UAV Multispectral Images. Sensors 2021, 21, 1994. [Google Scholar] [CrossRef] [PubMed]
- Ng, K.; Barton, P.S.; Blanchard, W.; Evans, M.J.; Lindenmayer, D.B.; Macfadyen, S.; McIntyre, S.; Driscoll, D.A. Disentangling the effects of farmland use, habitat edges, and vegetation structure on ground beetle morphological traits. Oecologia 2018, 188, 645–657. [Google Scholar] [CrossRef] [PubMed]
- Yu, P.H.; Fennell, S.; Chen, Y.Y.; Liu, H.; Xu, L.; Pan, J.W.; Bai, S.Y.; Gu, S.X. Positive impacts of farmland fragmentation on agricultural production efficiency in Qilu Lake watershed: Implications for appropriate scale management. Land Use Policy 2022, 117, 106108. [Google Scholar] [CrossRef]
- Clough, Y.; Kirchweger, S.; Kantelhardt, J. Field sizes and the future of farmland biodiversity in European landscapes. Conserv. Lett. 2020, 13, e12752. [Google Scholar] [CrossRef]
- Siljander, M.; Kuronen, T.; Johansson, T.; Munyao, M.N.; Pellikka, P.K.E. Primates on the farm—Spatial patterns of human-wildlife conflict in forest-agricultural landscape mosaic in Taita Hills, Kenya. Appl. Geogr. 2020, 117, 102185. [Google Scholar] [CrossRef]
- Liu, X.N.; Zhang, W.W.; Li, H.; Sun, D.F. Modeling patch characteristics of farmland loss for site assessment in urban fringe of Beijing, China. Chin. Geogr. Sci. 2013, 23, 365–377. [Google Scholar] [CrossRef]
- Zou, L.L.; Liang, Y.F.; Hu, X.D.; Bai, M.D.; Wen, Q. A multidimensional assessment and analysis of farmland fragmentation in the southeast coastal area of China. Land Degrad. Dev. 2023, 34, 4021–4034. [Google Scholar] [CrossRef]
- Finch, T. Restoring farmlands for food and nature. One Earth 2020, 3, 665–668. [Google Scholar] [CrossRef]
- Yu, Y.; Zhang, J.; Zhang, K.; Xu, D.; Qi, Y.; Deng, X. The impacts of farmer ageing on farmland ecological restoration technology adoption: Empirical evidence from rural China. J. Clean. Prod. 2023, 430, 139648. [Google Scholar] [CrossRef]
- Cheng, L.; Xia, N.; Jiang, P.; Zhong, L.; Pian, Y.; Duan, Y.; Huang, Q.; Li, M. Analysis of farmland fragmentation in China Modernization Demonstration Zone since “Reform and Openness”: A case study of South Jiangsu Province. Sci. Rep. 2015, 5, 11797. [Google Scholar] [CrossRef] [PubMed]
- Fu, M.; Hu, Z.; Wu, G. Analysis of farmland landscape pattern evolvement rule on Zhongjie Friendship Farm. Trans. Chin. Soc. Agric. Eng. 2006, 22, 63–67. [Google Scholar]
- Jiao, F.; Wen, Z.; Wang, F.; Zhang, X.; Yang, Q.; Li, R. Analysis of Landscape Structure at County Scale in Loess Hilly Region. J. Soil Water Conserv. 2005, 19, 167–170. [Google Scholar]
- Liu, J.; Jin, X.; Xu, W.; Sun, R.; Han, B.; Yang, X.; Gu, Z.; Xu, C.; Sui, X.; Zhou, Y. Influential factors and classification of cultivated land fragmentation, and implications for future land consolidation: A case study of Jiangsu Province in eastern China. Land Use Policy 2019, 88, 104185. [Google Scholar] [CrossRef]
- Liu, X.; Bian, Z.; Sun, Z.; Wang, C.; Sun, Z.; Wang, S.; Wang, G. Integrating Landscape Pattern Metrics to Map Spatial Distribution of Farmland Soil Organic Carbon on Lower Liaohe Plain of Northeast China. Land 2023, 12, 1344. [Google Scholar] [CrossRef]
- Xu, W.; Jin, X.; Liu, J.; Zhou, Y. Impact of cultivated land fragmentation on spatial heterogeneity of agricultural agglomeration in China. J. Geogr. Sci. 2020, 30, 1571–1589. [Google Scholar] [CrossRef]
- Zhang, J.; Rao, W.; Xiao, H.; Zhou, Q. Change of farmland landscape pattern in urbanization process based on RS and GIS technologies. J. South China Agric. Univ. Nat. Sci. Ed. 2005, 26, 106–109. [Google Scholar]
- Zhang, Y.; Sharma, S.; Bista, M.; Li, M. Characterizing changes in land cover and forest fragmentation from multitemporal Landsat observations (1993–2018) in the Dhorpatan Hunting Reserve, Nepal. J. For. Res. 2022, 33, 159–170. [Google Scholar] [CrossRef]
- Li, S.; Yang, B. Introducing a new method for assessing spatially explicit processes of landscape fragmentation. Ecol. Indic. 2015, 56, 116–124. [Google Scholar] [CrossRef]
- Li, X.; Weng, W.; Li, M. Assessing natural forest fragmentation process dynamics and its drivers in the Pacific northwest region, USA. J. Nanjing For. Univ. Nat. Sci. Ed. 2021, 45, 174–182. [Google Scholar]
- Lu, Y.; Wang, Z.; Xia, X.; Yuan, H.; Li, M.; Xu, W. Spatiotemporal evolutions and spatial processes of cultivated land landscape in Daxinganling forest-grass ecotone in the Inner Mongonia. Acta Ecol. Sin. 2023, 43, 1209–1218. [Google Scholar]
- Zhang, Y.; Li, X.; Li, M. Assessing Spatio-Temporal Variation and Associated Factors of Forest Fragmentation from Morphological Spatial Pattern Analysis and Geo-Detector Analyses: A Case Study of Xinyu City, Jiangxi Province of Eastern China. Forests 2023, 14, 2376. [Google Scholar] [CrossRef]
- Baek, S.; Yoon, H.; Hahm, Y. Assessment of spatial interactions in farmland abandonment: A case study of Gwangyang City, Jeollanam-do Province, South Korea. Habitat Int. 2022, 129, 102670. [Google Scholar] [CrossRef]
- Chang, H.S.; Chen, T.L. Exploring spatial patterns of farmland transactions and farmland use changes. Environ. Monit. Assess. 2015, 187, 596. [Google Scholar] [CrossRef]
- Li, D.J.; Zhang, H.Q.; Xu, E.Q. A spatial directivity-based sensitivity analysis to farmland quality evaluation in arid areas. Environ. Sci. Pollut. Res. 2022, 29, 66359–66372. [Google Scholar] [CrossRef] [PubMed]
- Thompson, A.W.; Prokopy, L.S. Tracking urban sprawl: Using spatial data to inform farmland preservation policy. Land Use Policy 2009, 26, 194–202. [Google Scholar] [CrossRef]
- Jiang, Q.; Zhao, Z.; Mu, Y.; Zhao, D.; Wu, B. A study on the agglomeration characteristics of the scallop aquaculture industry in China. Isr. J. Aquac. Bamidgeh 2022, 74, 1–14. [Google Scholar] [CrossRef]
- Zhang, W.-Y.; Wei, Z.-W.; Wang, B.-H.; Han, X.-P. Measuring mixing patterns in complex networks by Spearman rank correlation coefficient. Phys. A Stat. Mech. Appl. 2016, 451, 440–450. [Google Scholar] [CrossRef]
- Cao, Y.; Kong, L.; Zhang, L.; Ouyang, Z. Spatial characteristics of ecological degradation and restoration in China from 2000 to 2015 using remote sensing. Restor. Ecol. 2020, 28, 1419–1430. [Google Scholar] [CrossRef]
- Gu, T.; Chen, W.; Liang, J.; Pan, S.; Ye, X. Identifying the driving forces of cultivated land fragmentation in China. Environ. Sci. Pollut. Res. 2023, 30, 105275–105292. [Google Scholar] [CrossRef] [PubMed]
- Men, K.; Zhu, H.; Jiang, L. Can the Baseline of 1.8 Billion Mu Cultivated Land be Retained in China?—A Macro Approach to Land Reservation from Improved-MGM Model. In Proceedings of the Conference of the International-Institute-of-Applied-Statistics-Studies, Yantai, China, 13–15 August 2008; pp. 1565–1569. [Google Scholar]
| Disclaimer/Publisher’s Note: The statements, opinions and data contained in all publications are solely those of the individual author(s) and contributor(s) and not of MDPI and/or the editor(s). MDPI and/or the editor(s) disclaim responsibility for any injury to people or property resulting from any ideas, methods, instructions or products referred to in the content. |
© 2024 by the authors. Licensee MDPI, Basel, Switzerland. This article is an open access article distributed under the terms and conditions of the Creative Commons Attribution (CC BY) license (https://creativecommons.org/licenses/by/4.0/).


