Article

Sustainable and Resilient Land Use Planning: A Multi-Objective Optimization Approach

1
Department of Physical Geography and Ecosystem Science, Lund University, SE-221 00 Lund, Sweden
2
Department of Mathematics and Informatics, Faculty of Science, Eduardo Mondlane University, Julius Nyerere Avenue, Nr. 3453, Maputo 257, Mozambique
*
Author to whom correspondence should be addressed.
ISPRS Int. J. Geo-Inf. 2024, 13(3), 99; https://doi.org/10.3390/ijgi13030099
Submission received: 8 January 2024 / Revised: 12 February 2024 / Accepted: 12 March 2024 / Published: 18 March 2024

Abstract

:
Land use allocation (LUA) is of prime importance for the development of urban sustainability and resilience. Since the process of planning and managing land use requires balancing different conflicting social, economic, and environmental factors, it has become a complex and significant issue in urban planning worldwide. LUA is usually regarded as a spatial multi-objective optimization (MOO) problem in previous studies. In this paper, we develop an MOO approach for tackling the LUA problem, in which maximum economy, minimum carbon emissions, maximum accessibility, maximum integration, and maximum compactness are formulated as optimal objectives. To solve the MOO problem, an improved non-dominated sorting genetic algorithm III (NSGA-III) is proposed in terms of mutation and crossover operations by preserving the constraints on the sizes for each land use type. The proposed approach was applied to KaMavota district, Maputo City, Mozambique, to generate a proper land use plan. The results showed that the improved NSGA-III yielded better performance than the standard NSGA-III. The optimal solutions produced by the MOO approach provide good trade-offs between the conflicting objectives. This research is beneficial for policymakers and city planners by providing alternative land use allocation plans for urban sustainability and resilience.

1. Introduction

Land resources play a crucial role in social and economic development. The rational use of land resources has been demonstrated to be a key factor in achieving sustainability and resilience. Along with the urbanization process and the development of the economy, land use allocation has become increasingly important and attracted notable attention [1,2]. In a sustainable development environment, the land use allocation problem involves the allotment of different competitive land uses to different units of a land area in order to meet the desired objectives of land managers [3]. It requires land use planners to obtain the optimal spatial allocation of different types of land use units. The process of land use allocation is essentially a combinatorial optimization problem with a large number of potential combinations within the solution space [4].
In addition, various conflicting objectives have emerged during this process that the planners should satisfy while dealing with a large set of data and variables [5]. This characteristic has made land use allocation be regarded as a multi-objective Nondeterministic Polynomial-hard (NP-hard) optimization problem in many studies [6]. A typical output of multi-objective optimization is the Pareto front, which includes a set of solutions that satisfy trade-offs between different objective functions [7]. The Pareto front identifies solutions where an improvement in one objective comes at the expense of another, yet these solutions remain optimal. A solution set is generated because there is typically no single solution that optimally satisfies all objectives simultaneously due to their conflicting nature in multi-objective optimization.

1.1. Motivation

Various meta-heuristics algorithms have been developed and applied to optimize the search process in multi-objective optimization problems, such as the simulated annealing (SA) algorithm [8] and genetic algorithm (GA) [9]. From the mechanistic perspective, GA has been identified to be an appropriate choice for the process of land use optimization [1]. Over the past decade, a series of multi-objective evolutionary algorithms (MOEAs) has been proposed due to their ability to find multiple Pareto-optimal solutions in a single run [10]. The Non-dominated Sorting Genetic Algorithm (NSGA), proposed by Srinivas and Deb (1994) [11], is one of the early developed evolutionary algorithms. In the NSGA family, NSGA-I was the pioneering algorithm, but it has limitations in terms of convergence and diversity [12]. NSGA-II addressed these issues and became a popular choice for multi-objective optimization. NSGA-III is a state-of-the-art evolutionary algorithm, which is an extension of NSGA-II. It incorporates advanced techniques to maintain diversity in high-dimensional objective spaces [13]. The choice of which algorithm to use depends on the specific problem and the number of objectives one needs to optimize.
Maputo, the capital city of Mozambique, is under special consideration for land use allocation. Mozambique’s economic gains are significantly impaired by recurrent climatic induced catastrophes that cause economic losses estimated to reach an average of 1.1 percent of the Gross Domestic Product (GDP) per year. Even more aggravating is that natural disasters such as floods and cyclones have a long-lasting impact that disproportionately affects the poorest, where more than half of Maputo’s population is poor, as annotated by Jenkins (2000) [14]. The urban growth and the lack of a rational land use plan make Mozambique cities, including Maputo, vulnerable to climate change problems. Therefore, there is a necessity to optimize land use to build sustainable and resilient cities to overcome or mitigate poverty and the challenges of climate change in Mozambican cities. This is also in line with sustainable development goal (SDG) 1 formulated by the United Nations (UN), i.e., “end poverty in all its forms everywhere”.
The aim of this study is to develop a spatial multi-objective optimization approach for land use allocation using NSGA-III, which seeks a trade-off among environmental protection, economic development, resource utilization, and other regional development goals. Considering the complicated process and computational challenges, we further improve the performance of NSGA-III, adapting it to the problem in question. The developed approach is applied to KaMavota district, Maputo City.

1.2. Contributions

The contributions of this paper are threefold. First, we propose a spatial multi-objective optimization approach for land use allocation based on the state-of-the-art evolutionary algorithm NSGA-III. Secondly, an improved NSGA-III algorithm is developed in terms of mutation and crossover operations by preserving the constraints on the sizes for each land use type. In particular, the constraint-preserved mutation and crossover operations guarantee the completeness of the land use types that consist of more than one cell in the optimization process. Thirdly, the five optimization objectives of maximum economy, minimum carbon emissions, maximum accessibility, maximum integration, and maximum compactness are formulated to solve the land use allocation problem and build sustainable and resilient cities in developing countries.

1.3. Organization

The organization of this study is outlined as follows. Section 2 introduces the works related to the applications of multi-objective optimization in urban planning and provides an overview of non-dominated sorting genetic algorithms. Section 3 elaborates on the materials and methods utilized, including the study area and data, the steps of the multi-objective optimization approach, and the improved NSGA-III algorithm. In Section 4, the results are presented, including the implementation of NSGA-III for land use allocation and the convergence analysis. Section 5 further discusses the results in terms of performance comparison and solution diversity analysis. Finally, the key findings and conclusions are provided in Section 6.

2. Literature Review

2.1. Applications of Multi-Objective Optimization in Urban Planning

Urban planning is a technical and political process that focuses on the development and design of land use and the built environment, such as transportation, infrastructures, green spaces, and accessibility. The lack of urban planning affects the transportation system, infrastructure, layout, prescribed density of residences, commerce, and industrial areas [15]. Multi-objective optimization has been commonly used in urban planning. For instance, Deb et al. [15] developed a Geographical Information System (GIS) based on MOEA and applied it to the Mediterranean landscape of Southern Portugal for land use management, with three objective functions: maximization of economic return, maximization of carbon sequestration, and minimization of soil erosion. In Baboldasht, a district of Isfahan in Iran, Sahebgharani [16] developed a novel meta-heuristic algorithm named parallel particle swarm to allocate seven land types (residential, commercial, cultural, educational, medical, sportive, and green space) in order to maximize compactness, compatibility, and suitability objective functions. Compared with the results performed by GA in other studies, it was found that both the quality and convergence time of the parallel particle swarm optimization are better than GA. Liu and Xi [17] investigated multi-objective optimization of the spatial structure and layout of a protected area using the NSGA-II algorithm and four objective functions maximizing the value of ecosystem services: provisioning, supporting, regulating, and cultural. García et al. [18] proposed a multi-objective optimization model for sustainable land use allocation in the Plains of San Juan, Puebla, Mexico, and searched for the optimal solution using NSGA-II. Zhao et al. [19] developed a gray multi-objective dynamic programming (GMDP) model and the ant colony optimization (ACO) algorithm for land use optimization in Lancang County, China. The maximization of social, economic, and ecological benefits is used as the optimization objective in the model. Caparros and Dawson [20] developed a spatial optimization framework to optimize the location of future residential development against several sustainability objectives, and conducted a case study of Middlesbrough in the northeast United Kingdom. Shifa et al. [21] carried out a study to optimize the allocation of land resources, including the optimization of quantity and space, to bring forward the land use space optimization model based on the particle swarm evolutionary algorithm. The results showed that the model could analyze the data of multi-dimensional discrete decision space with good space search features and high accuracy in parallel.
Table 1 summarizes the applications of multi-objective optimization techniques in sustainable and resilient urban planning, addressing crucial objectives, such as compactness, flood impact mitigation, carbon emission reduction, economic benefits, and sustainable development [22,23,24,25,26]. The utilization of various optimization methods reflects the interdisciplinary nature of the field and the diverse approaches employed to tackle complex urban planning challenges. NSGA-II, known for its efficiency and effectiveness in handling multi-objective optimization problems, emerges as a prominent choice among the optimization methods utilized in these studies.
The objective functions considered in the studies encompass various aspects of sustainable and resilient urban planning, including compactness, flood impact minimization, carbon emission reduction, economic benefits, and sustainable development. Each objective reflects different dimensions of urban planning, such as environmental, social, and economic sustainability. Several optimization methods have been applied in these studies, demonstrating the diversity of approaches used to address the multi-objective nature of urban planning problems. These methods include multi-objective spatial optimization, Artificial Neural Network (ANN), Rhino, Grasshopper, and NSGA-II. Among the optimization methods mentioned, NSGA-II stands out as the most utilized. Its efficiency and ability to efficiently explore the solution space while maintaining a diverse set of solutions make it well-suited for complex urban planning problems. The prevalence of NSGA-II in these studies indicates a growing trend in its usage for sustainable and resilient urban planning. This trend underscores the recognition of NSGA-II as a reliable and effective tool for finding optimal solutions that balance multiple conflicting objectives in urban planning decision-making.
Overall, the application of multi-objective optimization techniques, particularly using NSGA-II, in sustainable and resilient urban planning demonstrates a concerted effort to address the multifaceted challenges of urbanization while promoting sustainability and resilience in urban environments. Each of these optimization methods presents a set of reasons [22] behind its use. On the one hand, such reasons aggregate robustness and efficiency, intelligent ranking of the Pareto solutions, and less computational time. On the other hand, they guarantee an optimal solution, better performance in spatial data, and low computational cost. This trend reflects the increasing importance of optimization-based approaches in shaping future urban development strategies.

2.2. An Overview of Non-Dominated Sorting Genetic Algorithms

This section provides an overview of NSGA algorithms commonly used in multi-objective optimization, namely, NSGA-II, R-NSGA-II, NSGA-III, U-NSGA-III, and R-NSGA-III. These algorithms are used to find solutions that are not dominated by others in a multi-objective optimization problem. In NSGA-II, individuals are selected front-wise, and fronts may need to be split if not all individuals can survive. Solutions in splitting fronts are selected based on crowding distance that helps maintain diversity by favoring solutions in less crowded areas of the objective space [37]. The R-NSGA-II (Reference point-based NSGA-II) is similar to NSGA-II; individuals are selected front-wise, and fronts may need to be split. Solutions in splitting fronts are selected based on rank, which is calculated as the Euclidean distance to each reference point. The solution closest to a reference point is assigned a rank of 1, and the best rank for each solution is selected as its rank [38]. NSGA-III is based on provided reference directions when initializing the algorithm, and it first performs non-dominated sorting as in NSGA-II. From the splitting front, solutions need to be selected based on reference directions [39]. NSGA-III prioritizes underrepresented reference directions first, and if a reference direction has no solution assigned, the solution with the smallest perpendicular distance in the normalized objective space survives. If a second solution for a reference line is added, it is assigned randomly. NSGA-III selects parents randomly for mating, but it is noted that tournament selection performs better than random selection [40], and the “U” in “U-NSGA-III” refers to “unified,” which may involve incorporating tournament pressure to improve performance. R-NSGA-III (Reference line-based NSGA-III) operates based on reference line generation and survival selection. Before executing R-NSGA-III, it is necessary to define a set of reference lines or directions [41]. These reference lines represent different trade-offs among the multiple objectives of the optimization problem. R-NSGA-III follows the general procedure of NSGA-III, which includes non-dominated sorting of the population. This step organizes individuals into non-dominated fronts, where individuals in higher fronts are better solutions. After non-dominated sorting, R-NSGA-III focuses on selecting solutions from the splitting (final) front for survival. Solutions are associated with reference directions based on their perpendicular distance to these directions. R-NSGA-III prioritizes selecting solutions from underrepresented reference directions. This ensures that each reference line aims to identify a representative non-dominated solution.

3. Materials and Methods

3.1. Study Area and Data

Mozambique is an African country located in the southeast of the continent, bathed to the east by the Indian Ocean and sharing borders with Tanzania in the north, Malawi in the northwest, Zambia and Zimbabwe in the west, Swaziland and South Africa in the southwest, and South Africa in the south. Maputo City is the capital city of Mozambique, located in Maputo province in the south of the country [42]. This study was carried out in one of the seven districts of Maputo City, KaMavota district, as shown in Figure 1. To localize the study area, we used a top–down approach, which begins with the location of the country and goes down to the province level, from this ends up in the district level, where we find KaMavota district. KaMavota district faces accelerated growth and is prone to natural disasters and climate change events due to its geographical location, as well as weak management in land use and urban planning. The population growth of Maputo City has been extremely fast, about 600% between 1960 and 2023, which has resulted in the emission of huge amounts of carbon dioxide in the city. The Pearson correlation test showed that there has been a directly proportional relation between carbon dioxide emission and population growth since 1990 [43]. In the last two decades, the population growth has been low, and the increase in emission of carbon dioxide is more irregular. As climate change increases, Maputo’s city population will be more exposed to many of its impacts, including sea level rise, urban heating, more intense storms and rainfall events, bushfires, and drought.
The land use in the study area is classified into seven categories: water body, trees, flooded vegetation, agriculture, built area, bare ground, and rangeland (Figure 1). Water body comprises areas where water is predominantly present throughout the year. Trees include any significant clustering of tall (~15 feet or higher) dense vegetation, typically with a closed or dense canopy. Flooded vegetation aggregates areas of any type of vegetation with obvious intermixing of water throughout the majority of the year. Agriculture comprises human-planted cereals, grasses, and crops not at tree height. The built area includes human-made structures, major road and rail networks, and large homogenous impervious surfaces including parking structures, office buildings, and residential housing. Bare ground aggregates areas of rock or soil with very sparse-to-no vegetation for the entire year, large areas of sand, and deserts with no-to-little vegetation. Rangeland comprises open areas covered by homogenous grasses with little-to-no taller vegetation, wild cereals, and grasses with no obvious human plotting.
The land use data were downloaded from a global map of land use/land cover derived from Environmentally Sensitive Areas Project (ESA) Sentinel-2 imagery at 10 m resolution. These data were generated from the Impact Observatory’s deep learning-based land classification model using a massive training dataset of billions of human-labeled image pixels, developed by the National Geographic Society. The global maps were produced by applying this model to the Sentinel-2 scene collection on Microsoft’s Planetary Computer, processing over 400,000 Earth observations per year. Table 2 provides the summary of land use types. To implement the land use allocation, we divide the study area into 50 m × 50 m grids. The number of cells per unit is provided for each land use type. The number of cells and the proportion for each land use type are also calculated. The highest proportion comprises the residential area, while the lowest proportion of the land use comprises the fire services.
Table 3 provides detailed information about different land use classes in the study area. The table consists of eight attributes: (1) the land use types; (2) the area of one unit in square meters for each land use type; (3) the weight of the land use that represents the fraction of each land use type; (4) the recommended minimum travel distance between residential and other land use types by the Minister of Environment, Science and Technology (2011) and United Nations Human Settlements Programme (2015); (5) the weight ( w j ) of the land use distance that represents the fraction of the distance between the residential and other land use types; (6) the average value for each land use type; (7) the maximum capacity representing the maximum number of persons that can be allocated to each land use type; and (8) the average carbon emission that represents the amount of carbon emitted in each land use type [44,45].

3.2. Multi-Objective Optimization

Multi-objective optimization has been applied to model land use problems in which the objective functions usually conflict with each other, along with several constraints and diverse variables. This kind of problem, described by many objective functions, characterizes the branch of multi-objective optimization [46]. Such a problem, with m objectives ( f 1 x , f 3 x , f 3 x , , f m ( x ) ) , n decision variables x = ( x 1 , x 2 , x 3 , , x n ) , and k constraints, is as depicted in Equation (1).
M i n i m i z e ( M a x i m i z e )   F = ( f 1 x , f 3 x , f 3 x , , f m ( x ) )
g i x   | | =   0 ,                 i = 1,2 , 3 , k

3.2.1. Objectives of the Multi-Objective Optimization Model

The multi-objective optimization for the land use allocation problem aims to provide sustainable territorial exploitation at the sub-region scale considering economic, environmental, and social factors leading to low carbon emission, maximum population capacity, maximum total income, high accessibility, and high compactness. In this study, all the objectives are chosen from the perspective of sustainable and resilient land use planning. The five objectives are described as follows:
  • Objective 1: Maximization of the economic objective
The economic objective aims to maximize the total land use economy. The value is a measure of how much a property is worth excluding any structure built on the land [47]. This valuation includes the value of the raw land and additional values (e.g., better accessibility). When demand exceeds supply, the value of land will increase. The same is true if a particular piece of land has intrinsic value, for instance, if it is found that the land contains oil reserves. Note that the assessed value of the land and any structure may not reflect the current market price of the property, as the selling price for a property is dependent on market conditions.
Kamavota district consists of 5% fourth-floor buildings, 10% third-floor buildings, 15% second-floor buildings, and 40% first-floor buildings, and 20% of the land is open space. For all buildings, each floor has its economic value. The economic value for each building is determined as the sum of the economic value for each floor multiplied by the proportion of the land use type. To obtain the total economic land use value of the study area, we sum up the economic value for each cell, as described in Equation (2).
f 1 x = m a x i = 1 N j = 1 M k = 0 K E i j ( k ) · μ i j ,
where E i j ( k ) is the annual land value of the property in the cell i , j ,   μ i j is the weight of land use type (see Table 2), i is the i th row in the grid cell of the study area, N represents the total number of rows, j is the j th column in the grid, M is the total number of columns, k is the number of floors of the building on the land, and K is the maximum number of floors (max height) allowed to be built, which is equal to five in this study. As different land use configurations yield different economic benefits, optimizing the structure and layout of different land uses to maximize economic benefit is crucial.
  • Objective 2: Minimization of the carbon emission objective
The range of human activity now exerts a strong effect on the climate system. The change in greenhouse gases caused by human activity changes the energy flow in the climate system and creates a forcing on the system [48]. Understanding the emissions embodied in existing infrastructure stocks is fundamental to estimating future emissions from infrastructures to be built in developing countries and identifying effective strategies for reducing indirect emissions. Identifying strategies for reconciling human development and climate change mitigation requires an adequate understanding of how infrastructures contribute to well-being and greenhouse gas emission [49]. While indirect emissions from infrastructure use are well-known, information about indirect emissions from their construction is highly fragmented [50].
For each building, the carbon emission of each floor can be estimated as the sum of the amount of carbon emitted by each floor times the proportion of the land use type. To obtain the total amount of carbon emission of the study area, we summed up the amount of carbon emission for each cell, as described in Equation (3).
f 2 x = m i n i = 1 N j = 1 M k = 0 K C i j ( k ) · μ i j ,
where N represents the number of rows, i is the i th row, M is the number of columns, j is the j th column, k is the floor, K is the number of floors, C i j k is the carbon emitted by building in the cell i , j , and μ i j is the weight of the land use type.
  • Objective 3: Maximization of the accessibility objective
The built environment must be accessible for the desired and intended use. This objective function focuses on the easy access of residential areas to other non-residential public spaces, such as parks, schools, and hospitals, as suggested by [51]. Accessibility has been widely used to measure the ease of access to a place. Good accessibility provides more mixed use of the public spaces [52], which is an advantage in modern urban planning. Here, we estimate the accessibility of each residential cell to other land use cells.
For each residential cell i and for other land use j , the weighted distances between i and j are the Euclidian distances between the cells times the weight of the land use j . So, the total distance between each residential cell and the cells of other land use types is computed as the sum of the distances from each residential cell i to other land use cells. Considering the above, this objective function consists of maximizing the accessibility by minimizing the total distance between residential cells and other land use cells, as presented in Equation (4).
f 3 x = m i n i = 1 N j = 1 M d i j · w j ,
where i represents the residential cells, N is the total number of residential cells, j represents other land use cells, M is the total number of cells of other land uses, and d i j is the minimum distance between the residential cell i and a land use cell j . w j is the weight of the land use distance to the facility (see Table 2).
  • Objective 4: Maximization of the space syntax integration objective
Space syntax is a science-based, human-focused approach that investigates relationships between different spaces, or interactions between space and society [53]. Axial lines have been commonly used for the representation of an urban structure in space syntax, which represent the longest visibility lines in two-dimensional urban spaces. In terms of the axial line-based representation, global and local integration are two of the typical morphological parameters for the analysis of urban structure. Figure 2 displays the maps of global and local integration values in the study area. Integration measures the amount of street-to-street transitions needed from a street segment to reach all other street segments in the network using shortest paths [54]. In urban land use planning, it is important to guarantee the public facilities close to streets.
This objective function aims to maximize the closeness between cells that represent non-residential public facilities (e.g., markets and shops), and the streets that have high local integration values. To achieve this goal, the Euclidian distance between the streets with high integration values and the nearest non-residential land use types is calculated for each axial line segment i with high integration and for each cell j of a public facility. The distance between i and j is the Euclidian distance between the line segment with high integration and a public facility. So, the total distance between each line segment with high integration and for each public facility cell is computed as the sum of the distances from each line segment with high integration i , which is the total distance between this and all public facilities cells, as described in Equation (5).
f 4 x = m i n i = 1 S j = 1 N d i j ,
where i represents the axial line segment with high integration, S is the total number of segments with high integration, j represents a cell of land use target that comprises public facilities, N is the number of cells of land use target, and d i j is the minimum distance from segment i to the nearest cell j .
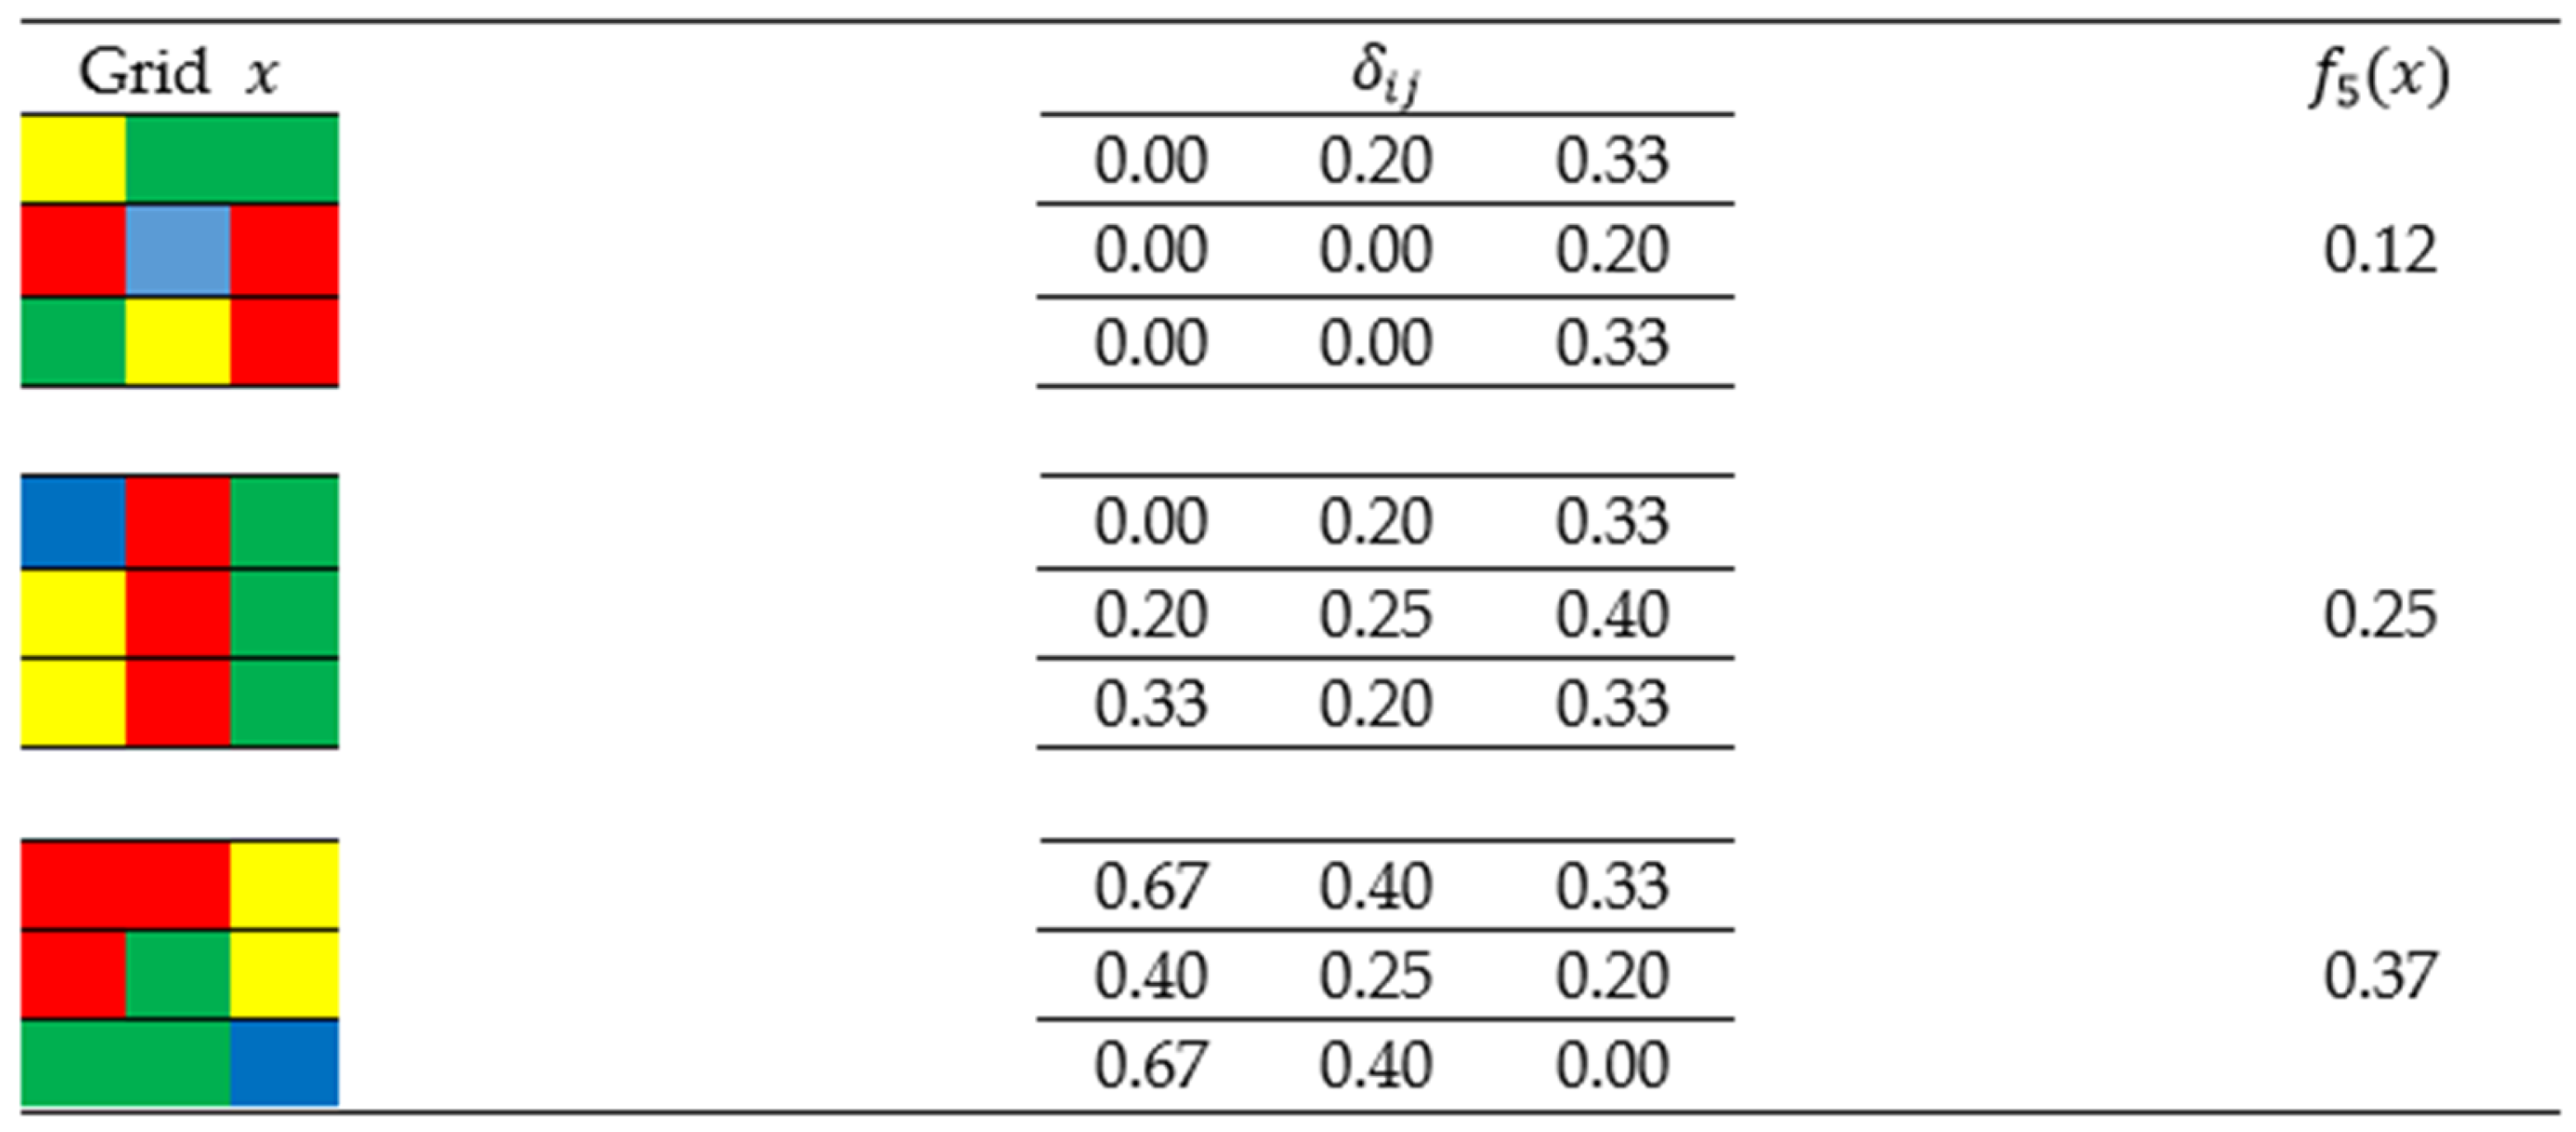
  • Objective 5: Maximization of the compactness objective
The global trend of urbanization leads to environmental degradation and the emergence of the compact city concept as a potential solution. Compact cities have been indicated to be able to offer significant advantages in terms of suitable urban form and urban sustainability [55,56]. One of the principles of urban sustainability is that more compact urban forms are more efficient in their overall use of space and energy. In many designs, this has been translated into high-rise buildings, with a focus on energy management at their outer envelopes. Compact cities also provide all one needs to live in one community, including work opportunities. A citizen who works in a compact city can walk or bike a short distance to work instead of driving. This reduces fossil fuel consumption, emissions, and pollutants, as well as traffic density [57]. Generally, compactness suggests efficient land planning, high density of the built environment, and intensification of its activities.
This objective aims to maximize the compactness for the sustainability of the city. In this study, we use the basic eight-neighbor method to measure compactness [1]. For each cell in the land use grid, we compute its radio δ i j that corresponds to the quotient between the number of neighborhood cells with the same type and the total number of neighborhood cells. Figure 3 shows examples of the compactness calculation for different cells. The objective compactness is expressed as:
f 5 x = 1 T i = 1 N j = 1 M δ i j ,
where δ i j is the ratio of cells allocated for the same land use type in each cell’s eight neighboring cells, j represents the j th row, N is the number of rows, i represents the i th column, M is the number of columns, and T is the total number of cells in the study area.

3.2.2. Constraints

This section provides the constraints of the multi-objective model since the number of cells is constant for each land use type and is in agreement with Table 1. Therefore, Equation (7) defines the restrictions of the model as follows:
i j x i , j ( k ) = N ( k ) ,                 k = 1,2 , 3 , , 8 ,
where N ( k ) is the total number of cells in the study area of type k ; this represents the code for land use type. x i , j ( k ) is the i th and j th cell of land use type k .

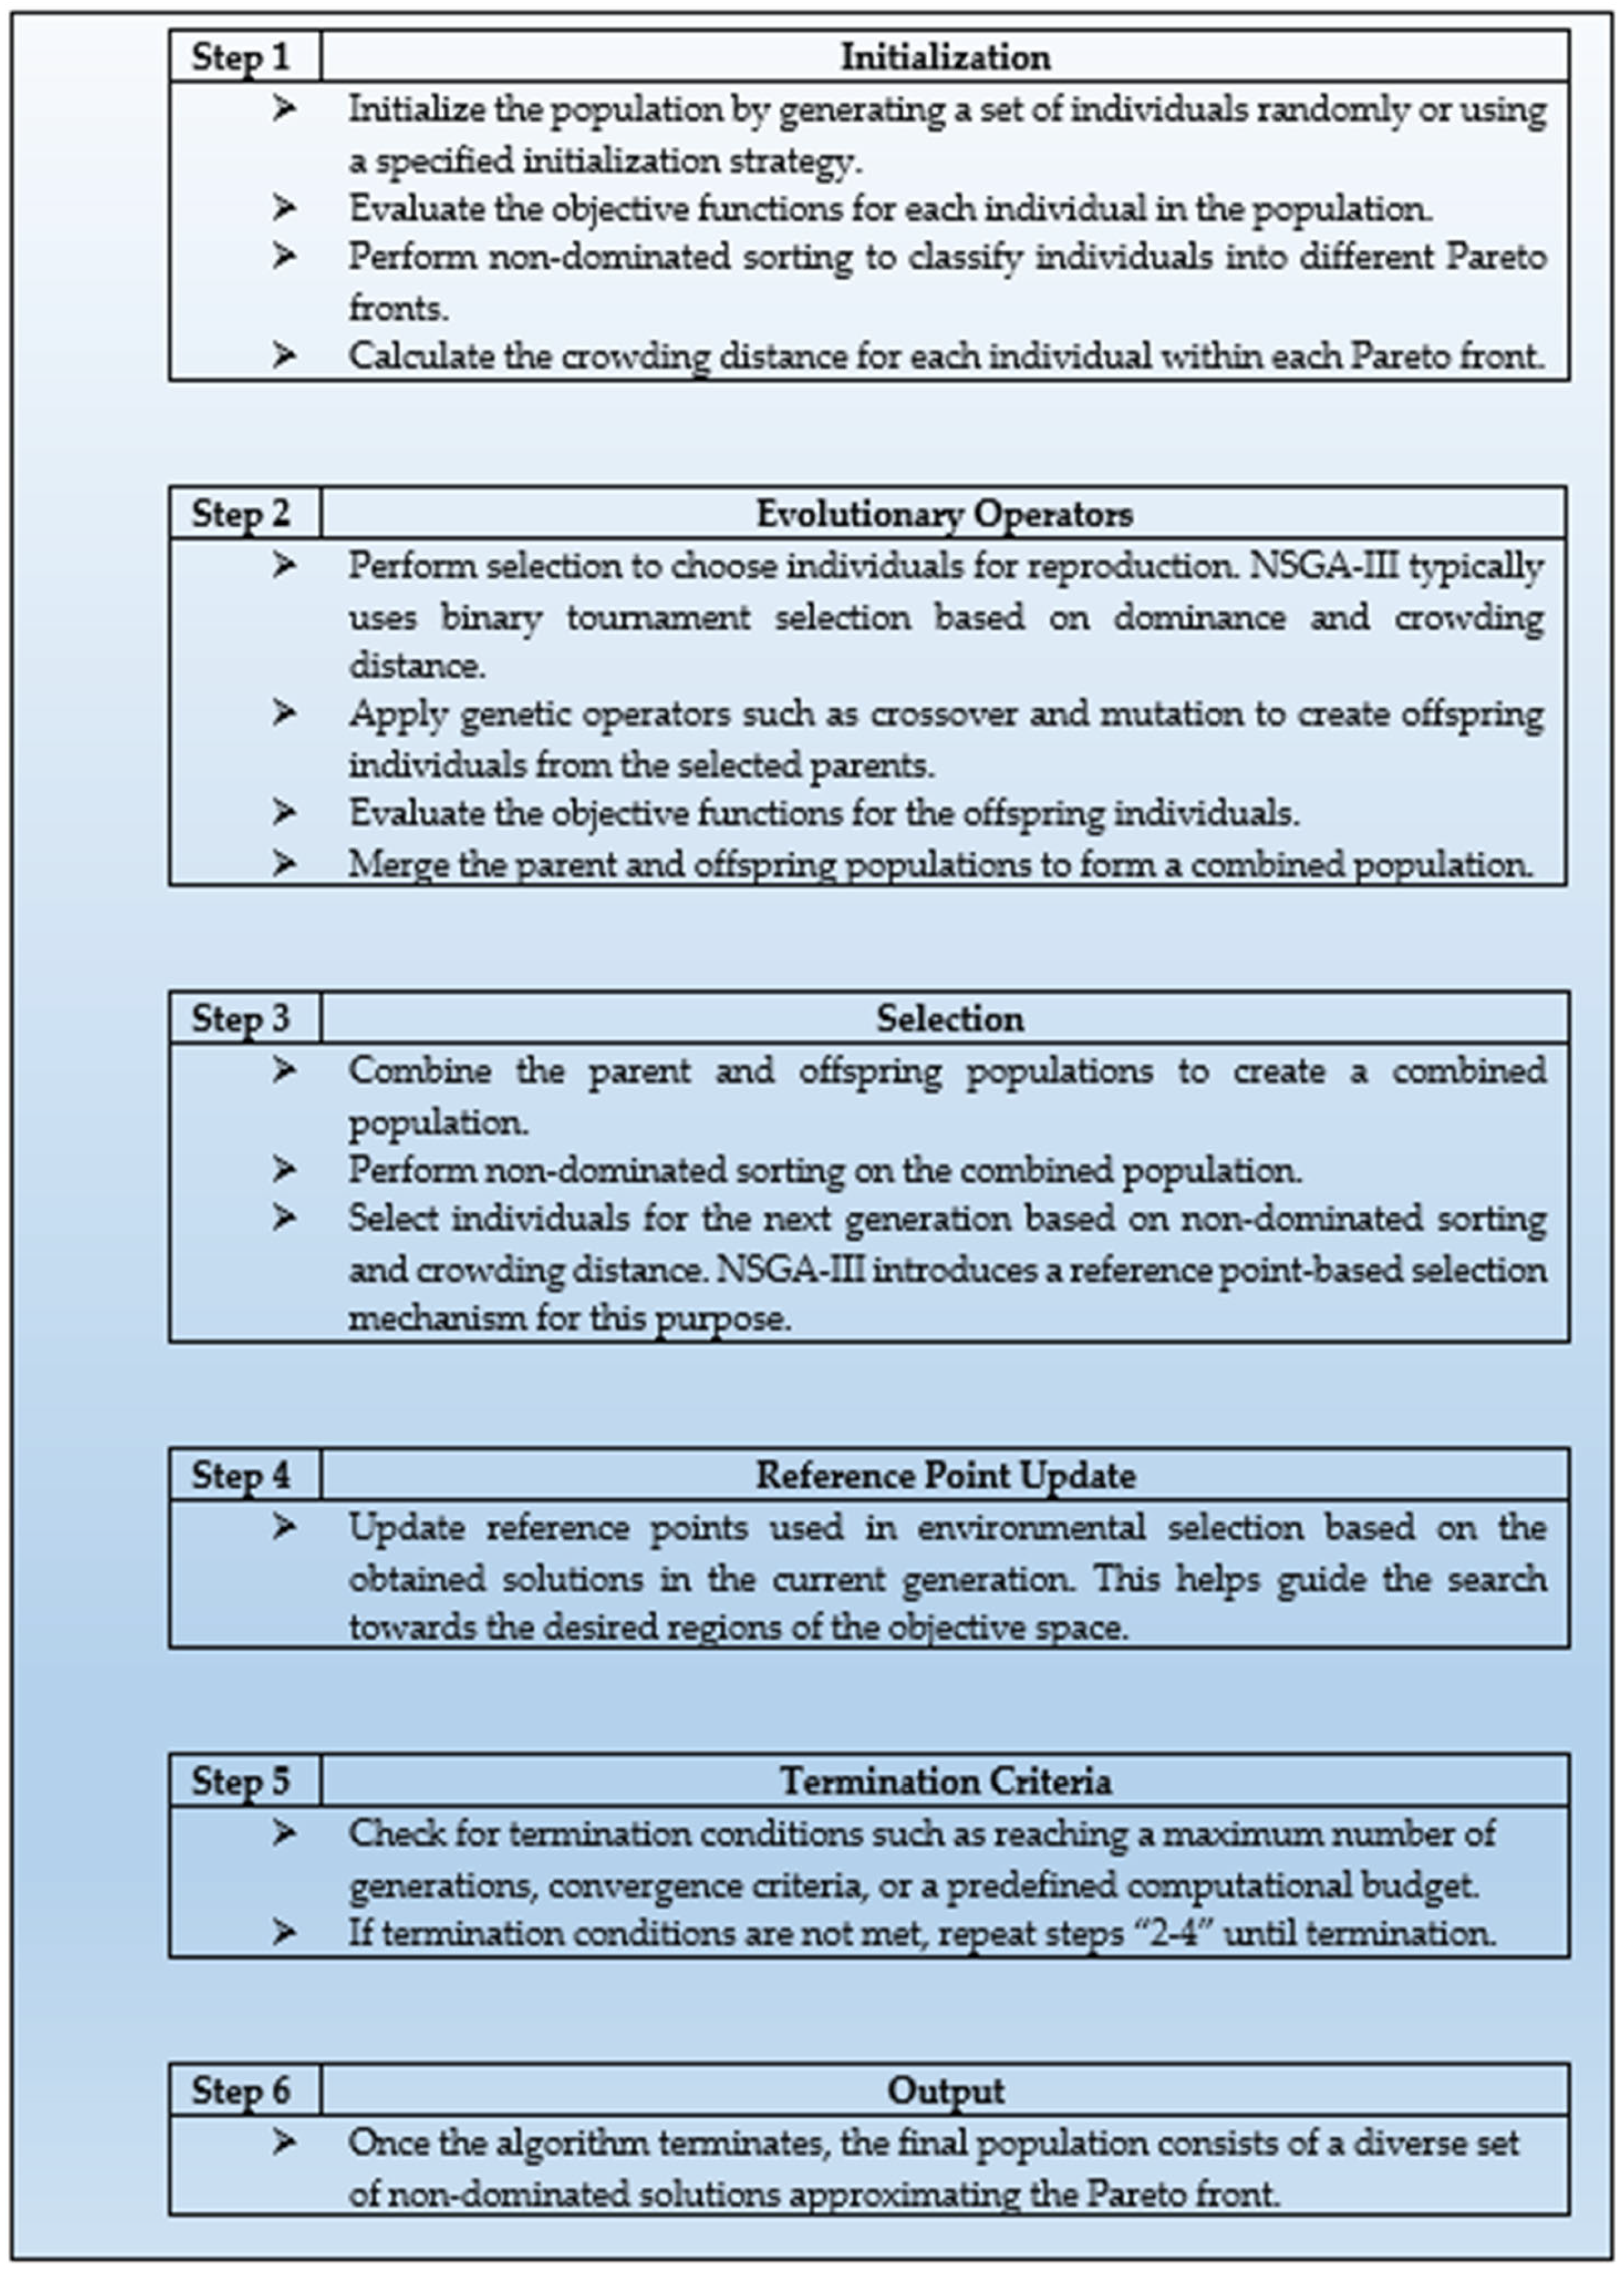
3.3. Improved NSGA-III

NSGA-III is a powerful algorithm for solving MOO problems by efficiently exploring and approximating the Pareto front using non-dominated sorting and reference points. It provides a set of diverse and high-quality solutions that allow decision-makers to make informed choices based on their preferences for different objectives. Figure 4 shows the procedure of NSGA-III. The NSGA-III begins with population initialization based on the problem range and constraint, then follows the sorting process based on non-domination criteria of the initialized population. Once the sorting is complete, the crowding distance value is assigned front-wise. The individuals in the population are selected based on rank and crowding distance. The selection of individuals is carried out using a binary tournament selection with a crowded-comparison operator. The real coded genetic algorithm implements genetic operators using simulated binary crossover and polynomial mutation [58]. The NSGA-III combines offspring population and current generation population, and the individuals of the next generation are set by selection. The new generation is filled by each front subsequently, until the population size exceeds the current population size.
In this study, we improve NSGA-III in terms of mutation and crossover operations by preserving the constraints on the sizes for each land use type. As shown in Table 1, the land use types display different sizes, such as one cell for residential area, four cells for fire services, twenty cells for urban, etc. According to the space syntax analysis, public facilities should be established in the cells with high integration. Therefore, although the public facilities have 10 cells for each, it is not mandatory to group the 10 cells by following the distribution of cells with high integration. A major challenge related to mutation and crossover operations in optimizing land use allocation is to assure the completeness of the land use types that consist of more than one cell in the optimization process.

3.3.1. Constraint-Preserved Mutation Operation

Mutation is the change in the structure of a gene, resulting in a variant form that may be transmitted to offspring, caused by a change in the sequence of genes or the deletion, insertion, or rearrangement of larger sections of genes or chromosomes [59]. Mutations generate solution diversity by making changes to genes in the chromosome. Mutation operators are important tools in generating good offspring. In spatial mutations, there are many kinds of mutation operators to generate solutions diversities, such as two-step spatial mutation, which avoid local optimum traps and promote the compactness of land use.
According to the above-mentioned constraints, we developed a constraint-preserved mutation operation approach. Since there are eight land use types in this study, each land use type has a probability of 0.125 to be chosen. Considering that only the residential land use type contains one cell for each unit, all the mutation operations will be implemented between the residential land use type and the other seven land use types. If a land use type different from residential is selected, we re-allocate it to its nearest available space consisting of residential cells. In this way, it ensures that each mutation operation adheres to the predefined constraints on the sizes of land use types.

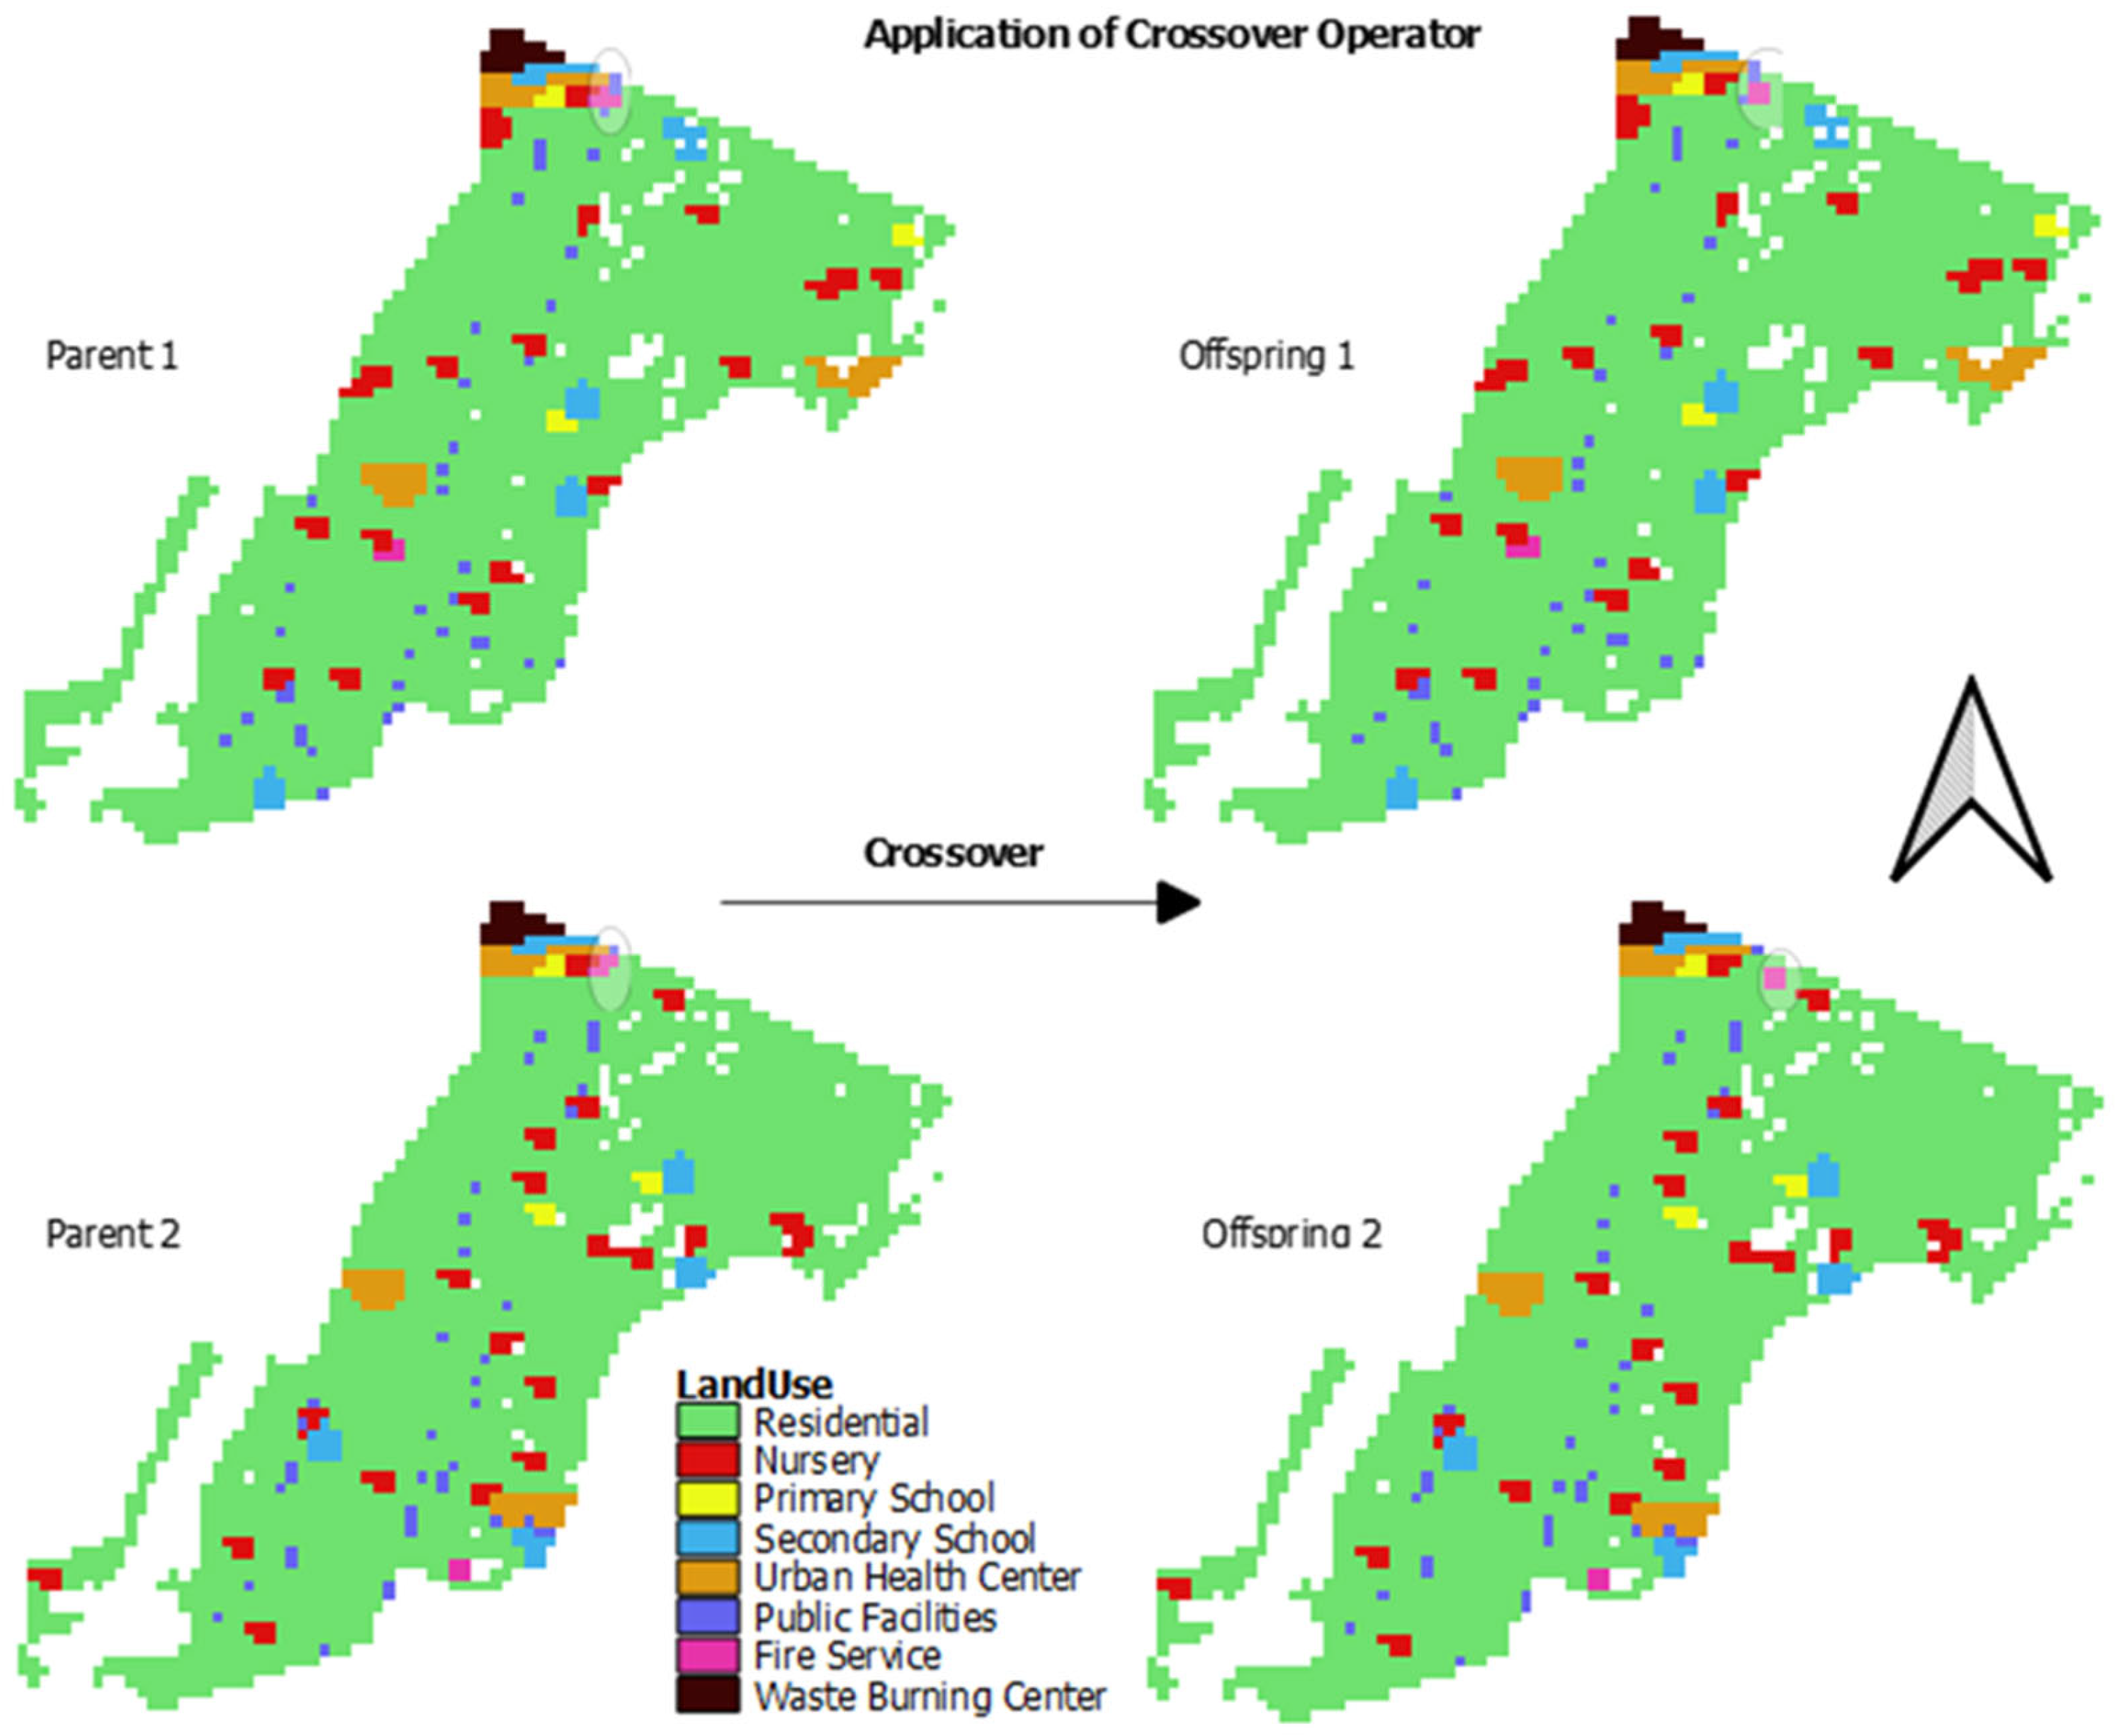
3.3.2. Constraint-Preserved Crossover Operation

Crossover interchanges the sections between pairing homologous chromosomes during the genetic algorithm execution [60]. A crossover operation creates a new gene combination by swapping genes from different chromosomes in accordance with a certain or adaptive probability. Since the land use types except residential contain more than one cell, swapping the genes may destroy the completeness of some land use types. In this study, we improve the traditional crossover operator to preserve the above-mentioned constraint. Concretely, the units of land use types are randomly selected from parent 1 and 2 for each crossover operation. If the two units have the same land use types, the new offspring will be yielded by the crossover. Otherwise, the neighboring cells of the selected land use unit from parent 1 will be considered until the crossover operation is finished.

4. Results

In this study, the Python Multi-Objective Optimization (PYMOO) framework was used for NSGA-III implementation. PYMOO is a Python library specifically designed for multi-objective optimization. It provides tools for visualizing the Pareto front and analyzing the trade-offs between objectives using matplotlib [61] and other plotting libraries. The output of the analysis is the determination of the optimal allocation of the eight land use types in the study area, applying the five objectives presented in Section 4.2. As mentioned above, there is no best solution but a set of optimal solutions for an MOO problem. The concept of an optimal solution is defined as a non-dominated (efficient, or Pareto-optimal) solution. Each run in MOO returns a non-dominated set of solutions and compares sets of solutions.

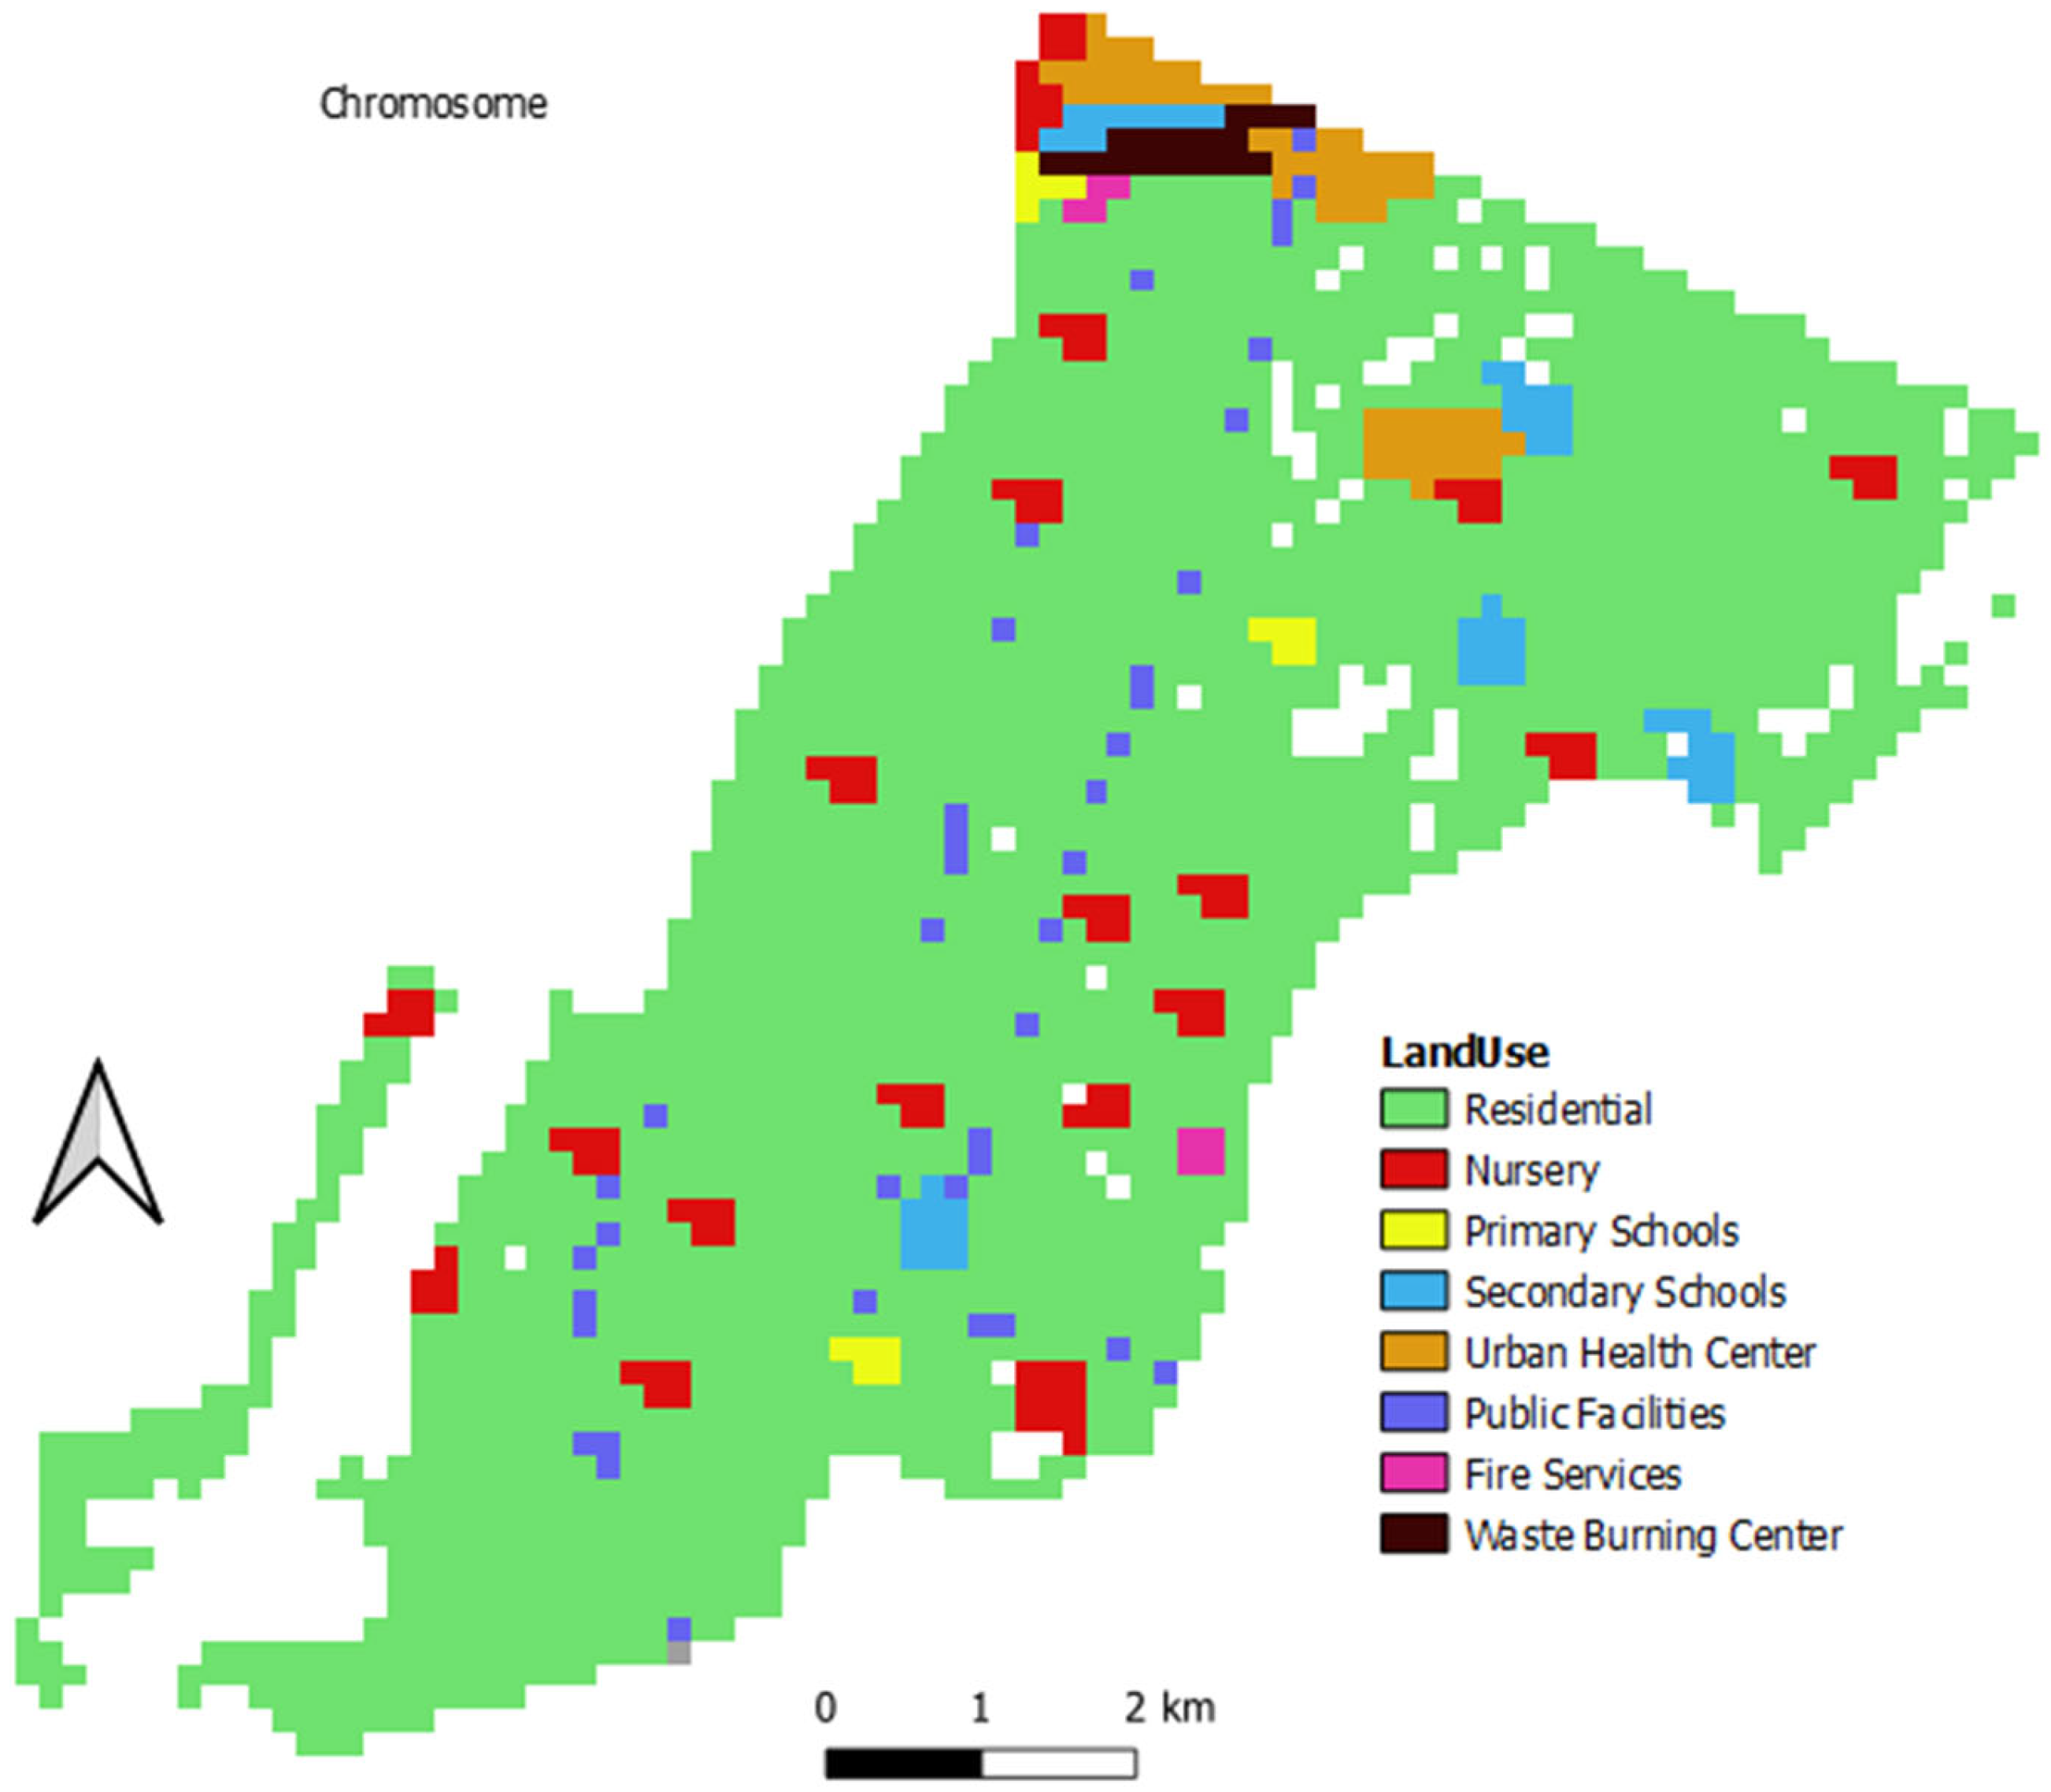
4.1. The Implementation of NSGA-III for Land Use Allocation

As mentioned in Section 3, the study area is divided into 50 m × 50 m cells to implement land use allocation. There are 2348 cells in total, including all land use types, as shown in Table 1. Solving the optimization problem of land use allocation using NSGA-III involves encoding land use types in the form of a chromosome. This representation can be a grid of genes, where the position of each gene represents a cell, and the land use type of the unit is determined by a value. To run NSGA-III, we created a chromosome consisting of 2348 genes. Then, we assigned random values to each gene, according to the percentages listed in Table 1. Figure 5 shows the land use allocation based on the first chromosome.
Based on the constraint-preserved mutation operation depicted in Section 3.3.1, Figure 6 shows an application of the mutation operations. For example, after several times of mutation operations for public facilities, there are some changes in the spatial distribution of land use types by comparing the parent and offspring chromosomes (i.e., the black circle areas). By applying constraint-preserved mutation, the method ensures that each mutated solution adheres to the predefined constraints.
Figure 7 shows an application of crossover operations. Taking the fire services in the parent chromosomes as an example, the fire services in the offspring are displayed after crossover operations. This form of crossover is designed to maintain some of the genetic diversity of both parents while ensuring that the number of land use types is constant.

4.2. Convergence Analysis
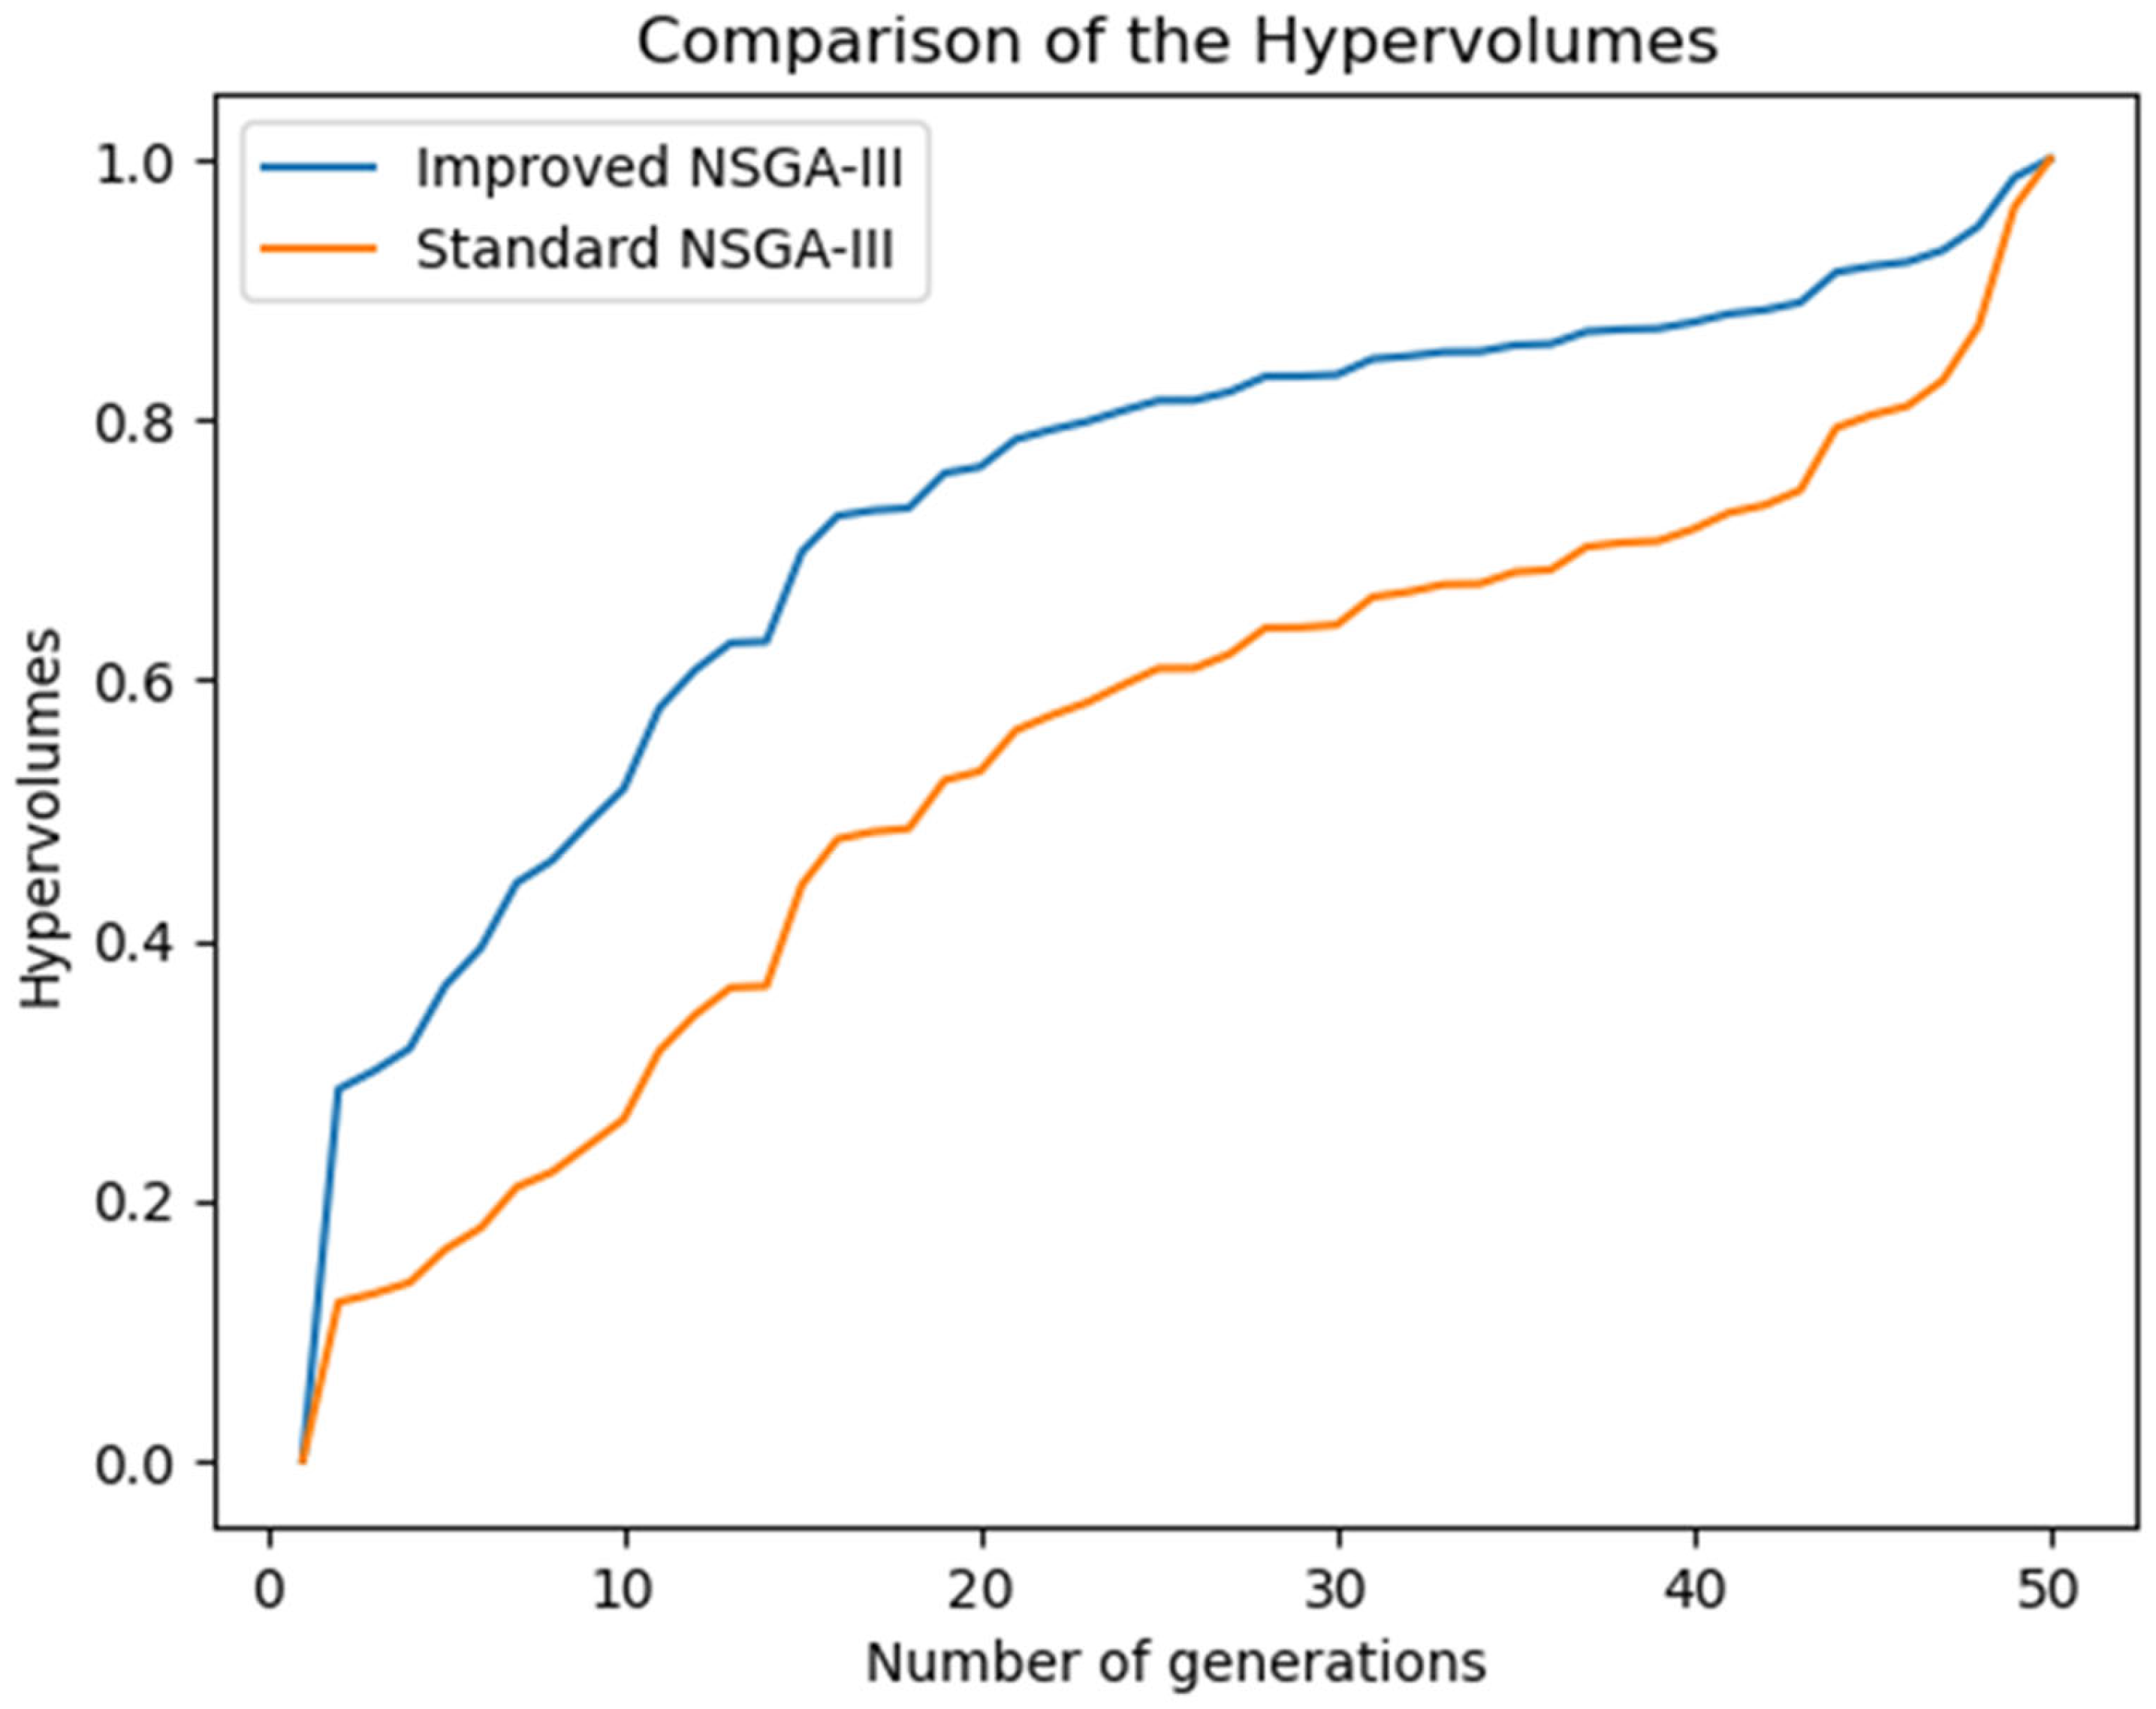
In this subsection, we present some basic metrics to evaluate the quality of the optimal Pareto front solutions, between the standard and improved NSGA-III, using the Hypervolume metric. In addition, we present the running metric and the constraint satisfaction.

4.2.1. Hypervolume

For convergence analysis, we used the well-known performance indicator called Hypervolume for multi-objective problems [62]. Hypervolume is a valuable metric evaluating the quality of solutions in MOO. Since the goal of MOO is usually to find a set of solutions that cover as much of the objective space as possible, the Hypervolume indicator measures the volume of the objective space that is dominated by a given Pareto front. A larger Hypervolume generally indicates a better Pareto front. It is usually used in conjunction with other performance metrics to gain a comprehensive understanding of how well an algorithm is performing in multi-objective optimization.
The analysis was implemented using the Hypervolume package from R software, version 4.3.1. That package constructs the Hypervolume using one of the several possible methods, such as box–kernel density estimation, Gaussian kernel density estimation, or the one-class support vector machine, after error-checking input data [63]. Moreover, the dominated portion of the objective space can be used to measure the quality of non-dominated solutions [64]. Figure 8 displays the comparison between the standard and the improved NSGA-III in terms of the Hypervolume indicator. In Figure 8, the Hypervolume values are normalized for the standard and improved NSGA-III to make the range between 0 and 1 for better comparison. It can be observed that the Pareto front from the improved NSGA-III has a higher Hypervolume, which indicates that it offers better trade-offs among conflicting objectives. In addition, the quality of the solutions increases simultaneously with the growth of the generation number, and the improved NSGA-III keeps its superiority in terms of solutions quality in the land use allocation problem of this study.

4.2.2. Running Metric

Another way of analyzing convergence is the running metric. When the change becomes very small or reaches a predefined threshold, it suggests convergence. A convergence plot shows how the objective function or other relevant metrics change over iterations. This visual representation helps identify trends and convergence behavior. The running metric illustrates the variation in the objective space between successive generations and uses the algorithm’s survival to visualize the improvement [65]. It is capable of evaluating the performance of NSGA algorithms at different generations. This metric is also being used in PYMOO to determine the termination of a MOO algorithm if termination criteria have not been defined in advance.
Figure 9 shows the running performance metric Δf at generations t between 10 and 50 with an interval of 10. The plot shows that the performance is steadily improving with generation. For instance, this analysis reveals that the algorithm improved significantly from the 6th to the 10th generation, at t = 10. Regarding t = 20, the algorithm showed an improvement from the 18th to the 20th generation. With regards to t = 30, from the 20th to the 30th generations, the algorithm presented an improvement from the 23rd to the 30th generation. From the 30th to the 40th generation, the algorithm presented an improvement from the 38th to the 40th generation. Regarding the plot t = 50, the algorithm showed an improvement from the 48th to the 50th generation.

4.2.3. Constraints Satisfaction

Convergence analysis in the context of constraint satisfaction problems (CSPs) focuses on determining whether an algorithm is making progress toward finding a solution that satisfies all the given constraints. The convergence analysis for CSPs can, however, be challenging because the focus is on finding a feasible solution rather than optimizing an objective function. Therefore, it is essential to tailor the convergence metrics to the specific constraints and goals of the problem. Additionally, considering the trade-off between finding a solution quickly and finding an optimal solution, different algorithms may prioritize one over the other. Figure 10 presents the convergence process across the function evaluations. It can be observed that the whole population became feasible in generation 12 after 1512 evaluations.

5. Discussion

In this section, we discuss the results, starting from the performance comparison of the standard and improved NSGA-III algorithms. The improved NSGA-III was demonstrated to outperform the standard NSGA-III in terms of the quality of the Pareto front and efficiency. In addition, the analysis of the diversity of the Optimal Pareto front applied to the KaMavota district.

5.1. Performance Comparison

In this section, we conduct a performance comparison between the standard (orange line) and improved NSGA-III (blue line) in terms of the computation time, as show in Figure 11. Both algorithms were run over 500 generations. It can be observed that the computation time (in hours) of the improved NSGA-III is less than that of the standard NSGA-III at different generations. With the number of generations increasing, the computation time of the improved NSGA-III grows slower than that of the standard NSGA-III.
The computational efficiency of the improved NSGA-III is a crucial aspect to consider when assessing its performance in solving multi-objective optimization problems. Several factors influence the computation efficiency of NSGA-III, such as Time Complexity, Pareto Front Approximation, Convergence Speed, Scalability, Handling Constraints, and Parameter Sensitivity [66]. Regarding time complexity, efficiency is often measured in terms of time complexity, indicating how the algorithm’s execution time scales with the size of the problem; for this case, when we increase the number of generations, the computation time increases as well. The improved NSGA-III aims to reduce the time complexity associated with non-dominated sorting, which is a key operation in multi-objective optimization. Another factor considered is Handling Constraints, which shows the ability of the improved NSGA-III to handle constraint optimization problems efficiently. Efficient handling of constraints ensures that the algorithm can explore feasible regions effectively. It is important to note that the computational efficiency of the improved NSGA-III is often assessed through empirical studies and benchmarking against other multi-objective optimization algorithms. Researchers and practitioners typically analyze its performance on various problem instances to understand its strengths and limitations in different scenarios.

5.2. Solution Diversity Analysis

The model was executed for 50 iterations based on the five objectives. Figure 12 presents five optimal land use allocation maps. Considering the maximum economic objective, the non-residential land use is shifted to the center and north of the Kamavota district (see Figure 12a). When the carbon emission objective is at minimum, all the land use types are well distributed over the entire Kamavota district (see Figure 12b). Regarding the importance of the accessibility objective, which minimizes the distance from residential to other land use, Figure 12c shows adequate access to essential urban and social resources, e.g., employment, education, medical treatment, and public facilities. The space syntax integration objective used spatial analysis to uncover patterns of urban segregation within the Kamavota district. The analysis focused on the layout of the district, its core and integration patterns, and the presence of isolated areas, providing valuable insights into the spatial dynamics of segregation in the district (see Figure 12d). In the compactness development, the major objective is that the district should solve its own problems within its own limits, avoiding the consumption of more lands. In addition, the intention is to reduce distances between residences, schools, and public facilities, which could only be achieved through the combination of higher densities. The goal is to enhance functional and social diversity while revitalizing neglected areas in the Kamavota district. The ultimate aim is to establish a multimodal accessible district, emphasizing proximity between activities and land uses, thereby transforming car usage into an option rather than a necessity (see Figure 12e). The land use study of the Kamavota district involves using an optimization approach to generate planning support scenarios. This approach is deemed valuable because it allows for quantitative trade-off analysis and accommodates different user preferences, leading to various optimized solutions. The optimal solution reflects a balanced consideration of multiple objectives during the optimization process.
We further used Petal diagrams to compare different categories of solutions from the Pareto front set. The Petal diagram is a pie diagram, where the objective value is represented by the colored area of each sector. Colors are used to further distinguish the sectors, which correspond to different objectives. It has been commonly used in decision-making and governance to help managers and decision-makers assess and balance various objectives or criteria. These diagrams provide a graphical representation of how different objectives or criteria relate to each other and how they can be prioritized based on the goals and values of the organization or individual. This trade-off is a common aspect of decision-making and strategic planning.
In this study, we created multiple Petal diagrams for different solutions and compared them to identify the similarities or differences (see Figure 13). This provides policy-makers a wide space of choice for the best solution. For example, as can be seen from Figure 13 (S13), the decision-makers can choose to maximize land use economy and accessibility. However, this may come at the expense of other objectives that are not prioritized in this particular context. In the case of Figure 13 (S23), the focus is on maximizing space syntax integration and compactness, and other objectives may be sacrificed to achieve these specific goals.
The key to using Petal diagrams effectively is to have a clear understanding of the objectives, their relative importance, and how they are interrelated. This allows decision-makers to make informed choices and strike a balance that aligns with the overall goals and governance of the organization. It is also important to consider the potential consequences of sacrificing certain objectives, as there may be trade-offs and unintended outcomes to consider.

6. Conclusions

The optimal layout of land resources is of paramount importance to reach sustainability and resilience in response to climate change and natural disasters in land use planning. The aim of this paper is to develop an MOO model to obtain optimized solutions for land use allocation based on eight simplified land use types: residential, nursery, primary school, secondary school, urban health center, public facility, fire service, and waste burning center. A multi-objective approach is used to specify the fitness functions. The five objectives were devised based on the notion of sustainability and resilience to climate change and natural disasters of land use: Maximization of economic objective, Minimization of carbon emission, Maximization of the accessibility objective, Maximization of space syntax integration, and Maximization of compactness objective. In addition, an improved NSGA-III algorithm is developed to solve the land use allocation problem in the Kamavota district, Maputo City, Mozambique. According to the results of convergence analysis and performance comparison, it is found that the improved NSGA-III shows a better performance than the standard NSGA-III. Although the proposed approach has been applied to Maputo, as a case study, it can also be applied for land use planning in other cities in Africa and elsewhere that are under development when the required data are available.
A few limitations remain in research that could be implemented in future studies. First, it is interesting to conduct a comparative analysis between the improved NSGA-III and alternative algorithms, and evaluate their performance and quality of the Pareto front. Second, we use Petal diagrams to display the Pareto front derived by the NSGA-III in this study. Some other ways can be attempted to display the Pareto front in the context of multi-objective optimization in future work, such as Parallel Coordinate Plots, Scatter Plots, etc. Lastly, 50 m × 50 m cells were chosen as the basic units to implement land use allocation. The cell size was determined based on the characteristics of the infrastructures in Maputo City. Exploring the impact of cell size on the quality of the Pareto front could be another direction of our future research on this subject.

Author Contributions

Tomé Sicuaio was responsible for methodology, implementation, testing and analysis, and writing; Pengxiang Zhao contributed to formal analysis, reconstruction, and editing; Petter Pilesjo was responsible for supervision, conceptualization, and writing; Andrey Shindyapin contributed to supervision and conceptualization; Ali Mansourian was responsible for idea development and conceptualization, coordination, supervision, reconstruction, and editing the manuscript. All authors have read and agreed to the published version of the manuscript.

Funding

This research was funded by the Swedish International Development Agency (SIDA) through Eduardo Mondlane University of the Mozambique-Sweden Program, GIS Sub-Program 1.3.1, Grant Agreement between Sweden, the Government of Mozambique, and Eduardo Mondlane University regarding the “Eduardo Mondlane University and Sweden Research Partnership 2017–2022”.

Data Availability Statement

The main data of the road network, places, and buildings are available at http://download.geofabrik.de/africa/mozambique-latest-free.shp.zip, created from OpenStreetMap accessed on 5 January 2023. The land use data were downloaded from a global map of land use/land cover derived from Environmentally Sensitive Areas Project (ESA) Sentinel-2 imagery at 10 m resolution.

Acknowledgments

The authors would like to express their thanks to Eduardo Mondlane University, Lund University, and the SIDA Partnership Program for their financial support of this research.

Conflicts of Interest

The authors declare no conflicts of interest.

References

  1. Cao, K.; Huang, B.; Wang, S.; Lin, H. Sustainable land use optimization using Boundary-based Fast Genetic Algorithm. Comput. Environ. Urban Syst. 2012, 36, 257–269. [Google Scholar] [CrossRef]
  2. Haque, A.; Asami, Y. Optimizing urban land use allocation for planners and real estate developers. Comput. Environ. Urban Syst. 2014, 46, 57–69. [Google Scholar] [CrossRef]
  3. Vaggione, P. Urban Planning for City Leaders, 2nd ed.; UN-Habitat: Nairobi, Kenya, 2014. [Google Scholar]
  4. Huang, T.-W.; Kuo, H.-F.; Tsou, K.-W. A Multi-Objective Spatial Optimization Method for Land Use Allocation in High Flood Risk Areas. Int. J. Biosci. Biochem. Bioinform. 2013, 201–205. [Google Scholar] [CrossRef]
  5. Bruno, M.; Henderson, K.; Kim, H.M. Multi-Objective Optimization in Urban Design. In Proceedings of the 2011 Symposium on Simulation for Architecture and Urban Design, Boston, MA, USA, 4–7 April 2011. [Google Scholar]
  6. Liu, Z.; Yan, Y.; Qu, X.; Zhang, Y. Bus stop-skipping scheme with random travel time. Transp. Res. Part C Emerg. Technol. 2013, 35, 46–56. [Google Scholar] [CrossRef]
  7. Veldhuizen, D.A.V.; Lamont, G.B. Evolutionary Computation and Convergence to a Pareto Front. In Proceedings of the Late Breaking Papers at The Genetic Programming 1998 Conference, Madison, WI, USA, 22–25 July 1998. [Google Scholar]
  8. Serafini, P. Simulated Annealing for Multi Objective Optimization Problems. In Multiple Criteria Decision Making; Tzeng, G.H., Wang, H.F., Wen, U.P., Yu, P.L., Eds.; Springer: New York, NY, USA, 1994; pp. 283–292. [Google Scholar]
  9. Holland, J.H. Genetic Algorithms. Sci. Am. 1992, 267, 66–73. [Google Scholar] [CrossRef]
  10. Deb, K.; Agrawal, S.; Pratap, A.; Meyarivan, T. A Fast Elitist Non-dominated Sorting Genetic Algorithm for Multi-objective Optimization: NSGA-II. In Parallel Problem Solving from Nature PPSN VI; Schoenauer, M., Deb, K., Rudolph, G., Yao, X., Lutton, E., Merelo, J.J., Schwefel, H.-P., Eds.; Springer: Berlin/Heidelberg, Germany, 2000; pp. 849–858. [Google Scholar]
  11. Srinivas, N.; Deb, K. Multiobjective Function Optimization Using Nondominated Sorting Genetic Algorithms; New Jersey Institute of Technology: New Jersey, NY, USA, 1995. [Google Scholar]
  12. Hobbie, J.G.; Gandomi, A.H.; Rahimi, I. A Comparison of Constraint Handling Techniques on NSGA-II. Arch. Comput. Methods Eng. 2021, 28, 3475–3490. [Google Scholar] [CrossRef]
  13. Bi, X.; Wang, C. An improved NSGA-III algorithm based on objective space decomposition for many-objective optimization. Soft Comput. 2017, 21, 4269–4296. [Google Scholar] [CrossRef]
  14. Jenkins, P. Urban management, urban poverty and urban governance: Planning and land management in Maputo. SAGE J. 2000, 12, 1. [Google Scholar] [CrossRef]
  15. Deb, K.; Sindhya, K.; Okabe, T. Self-adaptive simulated binary crossover for real-parameter optimization. In Proceedings of the 9th Annual Conference on Genetic and Evolutionary Computation, London, UK, 7–11 July 2007; pp. 1187–1194. [Google Scholar]
  16. Sahebgharani, A. Multi-Objective Land Use Optimization through Parallel Particle Swarm Algorithm: Case Study Baboldasht District of Isfahan, Iran. J. Urban Environ. Eng. 2016, 10, 42–49. [Google Scholar] [CrossRef]
  17. Liu, M.; Xi, J. Multi-Objective Optimization of the Spatial Structure and Layout of the Protected Area Based on Ecosystem Services: A Case Study of the Yellow River’s Headwaters Region in the Three-River-Source National Park. Chin. J. Urban Environ. Stud. 2021, 9, 2150016. [Google Scholar] [CrossRef]
  18. Medrano-García, J.D.; Ruiz-Femenia, R.; Caballero, J.A. Multi-objective optimization of combined synthesis gas reforming technologies. J. CO2 Util. 2017, 22, 355–373. [Google Scholar] [CrossRef]
  19. Zhao, X.; Tan, K.; Xie, P.; Chen, B.; Pu, J. Multiobjective Land-Use Optimization Allocation in Eucalyptus-Introduced Regions Based on the GMDP–ACO Model. J. Urban Plan. Dev. 2021, 147, 05021004. [Google Scholar] [CrossRef]
  20. Caparros-Midwood, D.; Barr, S.; Dawson, R. Optimised spatial planning to meet long term urban sustainability objectives. Comput. Environ. Urban Syst. 2015, 54, 154–164. [Google Scholar] [CrossRef]
  21. Ma, S.; He, J.; Liu, F. Land-use spatial optimization model based on particle swarm optimization. Geo-Spat. Inf. Sci. 2011, 14, 54–61. [Google Scholar] [CrossRef]
  22. She, L.; Wei, M.; You, X. Multi-objective layout optimization for sponge city by annealing algorithm and its environmental benefits analysis. Sustain. Cities Soc. 2021, 66, 102706. [Google Scholar] [CrossRef]
  23. Pan, T.; Su, F.; Yan, F.; Lyne, V.; Wang, Z.; Xu, L. Optimization of multi-objective multi-functional landuse zoning using a vector-based genetic algorithm. Cities 2023, 137, 104256. [Google Scholar] [CrossRef]
  24. Liu, K.; Xu, X.; Huang, W.; Zhang, R.; Kong, L.; Wang, X. A multi-objective optimization framework for designing urban block forms considering daylight, energy consumption, and photovoltaic energy potential. Build. Environ. 2023, 242, 110585. [Google Scholar] [CrossRef]
  25. Kirimtat, A.; Fatih Tasgetiren, M.; Krejcar, O.; Buyukdagli, O.; Maresova, P. A multi-objective optimization framework for functional arrangement in smart floating cities. Expert Syst. Appl. 2024, 237, 121476. [Google Scholar] [CrossRef]
  26. Meng, F.; Zhou, Z.; Zhang, P. Multi-Objective Optimization of Land Use in the Beijing–Tianjin–Hebei Region of China Based on the GMOP-PLUS Coupling Model. Sustainability 2023, 15, 3977. [Google Scholar] [CrossRef]
  27. Zhu, Y.; Xu, C.; Liu, Z.; Yin, D.; Jia, H.; Guan, Y. Spatial layout optimization of green infrastructure based on life-cycle multi-objective optimization algorithm and SWMM model. Resour. Conserv. Recycl. 2023, 191, 106906. [Google Scholar] [CrossRef]
  28. Yoon, E.J.; Kim, B.; Lee, D.K. Multi-objective planning model for urban greening based on optimization algorithms. Urban For. Urban Green. 2019, 40, 183–194. [Google Scholar] [CrossRef]
  29. Yang, S.; Ruangpan, L.; Torres, A.S.; Vojinovic, Z. Multi-objective Optimisation Framework for Assessment of Trade-Offs between Benefits and Co-benefits of Nature-based Solutions. Water Resour. Manag. 2023, 37, 2325–2345. [Google Scholar] [CrossRef]
  30. Wicki, S.; Schwaab, J.; Perhac, J.; Grêt-Regamey, A. Participatory multi-objective optimization for planning dense and green cities. J. Environ. Plan. Manag. 2021, 64, 2532–2551. [Google Scholar] [CrossRef]
  31. Wan, S.; Xu, L.; Qi, Q.; Yang, H.; Zhou, Y. Building a multi-objective optimization model for Sponge City projects. Urban Clim. 2022, 43, 101171. [Google Scholar] [CrossRef]
  32. Tregonning, G.; Barr, S.; Dawson, R.; Ranjan, R. A multi-objective spatial optimization framework for sustainable urban development. In Proceedings of the 2nd International Conference on Natural Hazards & Infrastructure, Chania, Greece, 23–26 June 2019. [Google Scholar]
  33. Showkatbakhsh, M.; Makki, M. Multi-Objective Optimisation of Urban Form: A Framework for Selecting the Optimal Solution. Buildings 2022, 12, 1473. [Google Scholar] [CrossRef]
  34. Schwaab, J.; Deb, K.; Goodman, E.; Kool, S.; Lautenbach, S.; Ryffel, A.; Van Strien, M.J.; Grêt-Regamey, A. Using multi-objective optimization to secure fertile soils across municipalities. Appl. Geogr. 2018, 97, 75–84. [Google Scholar] [CrossRef]
  35. Qi, J.; Ding, L.; Lim, S. Application of a decision-making framework for multi-objective optimisation of urban heat mitigation strategies. Urban Clim. 2023, 47, 101372. [Google Scholar] [CrossRef]
  36. Cao, K.; Liu, M.; Wang, S.; Liu, M.; Zhang, W.; Meng, Q.; Huang, B. Spatial Multi-Objective Land Use Optimization toward Livability Based on Boundary-Based Genetic Algorithm: A Case Study in Singapore. ISPRS Int. J. Geo-Inf. 2020, 9, 40. [Google Scholar] [CrossRef]
  37. Verma, S.; Pant, M.; Snasel, V. A Comprehensive Review on NSGA-II for Multi-Objective Combinatorial Optimization Problems. IEEE Access 2021, 9, 57757–57791. [Google Scholar] [CrossRef]
  38. Tang, R.; Li, K.; Ding, W.; Wang, Y.; Zhou, H.; Fu, G. Reference Point Based Multi-Objective Optimization of Reservoir Operation: A Comparison of Three Algorithms. Water Resour. Manag. 2020, 34, 1005–1020. [Google Scholar] [CrossRef]
  39. Gu, Z.-M.; Wang, G.-G. Improving NSGA-III algorithms with information feedback models for large-scale many-objective optimization. Future Gener. Comput. Syst. 2020, 107, 49–69. [Google Scholar] [CrossRef]
  40. Jain, H.; Deb, K. An Evolutionary Many-Objective Optimization Algorithm Using Reference-Point Based Nondominated Sorting Approach, Part II: Handling Constraints and Extending to an Adaptive Approach. IEEE Trans. Evol. Comput. 2014, 18, 602–622. [Google Scholar] [CrossRef]
  41. Vesikar, Y.; Deb, K.; Blank, J. Reference Point Based NSGA-III for Preferred Solutions. In Proceedings of the 2018 IEEE Symposium Series on Computational Intelligence (SSCI), Bengaluru, India, 18–21 November 2018; pp. 1587–1594. [Google Scholar]
  42. Vicente, E.M.; Jermy, C.A.; Schreiner, H.D. Urban Geology of Maputo, Mozambique. In Engeneering Geology of Tomorrow’s Cities; Geological Society: London, UK, 2009. [Google Scholar]
  43. Isaac, E. Test for Significance of Pearson’s Correlation Coefficient (r). Int. J. Innov. Math. Stat. Energy Policies 2018, 6, 11–23. [Google Scholar]
  44. Mulrow, J.; Machaj, K.; Deanes, J.; Derrible, S. The state of carbon footprint calculators: An evaluation of calculator design and user interaction features. Sustain. Prod. Consum. 2019, 18, 33–40. [Google Scholar] [CrossRef]
  45. The World Bank Group. Mozambique Urban Development and Decentralization Project; The World Bank: Maputo, Mozambique, 2020. [Google Scholar]
  46. Coello, C.A.C.; Lamont, G.B.; Veldhuizen, D.A.V. Evolutionary Algorithms for Solving Multi-Objective Problems, 2nd ed.; Springer: New York, NY, USA, 2007; p. 810. [Google Scholar]
  47. Mohammad, S.I.; Graham, D.J.; Melo, P.C.; Anderson, R.J. A meta-analysis of the impact of rail projects on land and property values. Transp. Res. Part A Policy Pract. 2013, 50, 158–170. [Google Scholar] [CrossRef]
  48. Gettelman, A.; Rood, R.B. Demystifying Climate Models; Springer: Berlin/Heidelberg, Germany, 2016. [Google Scholar] [CrossRef]
  49. Müller, D.B.; Liu, G.; Løvik, A.N.; Modaresi, R.; Pauliuk, S.; Steinhoff, F.S.; Brattebø, H. Carbon Emissions of Infrastructure Development. Environ. Sci. Technol. 2013, 47, 11739–11746. [Google Scholar] [CrossRef] [PubMed]
  50. Liu, Z. China’s Carbon Emissions Report 2016; Harvard DASH: Cambridge, MA, USA, 2016. [Google Scholar]
  51. Evans, G. Accessibility, Urban Design and the Whole Journey Environment. Built Environ. 2009, 35, 366–385. [Google Scholar] [CrossRef]
  52. Koohsari, M.J.; Mavoa, S.; Villanueva, K.; Sugiyama, T.; Badland, H.; Kaczynski, A.T.; Owen, N.; Giles-Corti, B. Public open space, physical activity, urban design and public health: Concepts, methods and research agenda. Health Place 2015, 33, 75–82. [Google Scholar] [CrossRef]
  53. Jiang, B.; Claramunt, C.; Klarqvist, B. An integration of space syntax into GIS for modelling urban spaces. Int. J. Appl. Earth Obs. Geoinf. 2000, 2, 161–171. [Google Scholar] [CrossRef]
  54. Yamu, C.; Van Nes, A. An Integrated Modeling Approach Combining Multifractal Urban Planning with a Space Syntax Perspective. Urban Sci. 2017, 1, 37. [Google Scholar] [CrossRef]
  55. Burton, E. Measuring Urban Compactness in UK Towns and Cities. Environ. Plan. B Plan. Des. 2002, 29, 219–250. [Google Scholar] [CrossRef]
  56. Ben-Hamouche, M. Climate, cities and sustainability in the arabian region: Compactness as a new paradigm in urban design and planning. Int. J. Archit. Res. Archnet-IJAR 2008, 2, 241. [Google Scholar] [CrossRef]
  57. Bibri, S.E.; Krogstie, J.; Kärrholm, M. Compact city planning and development: Emerging practices and strategies for achieving the goals of sustainability. Dev. Built Environ. 2020, 4, 100021. [Google Scholar] [CrossRef]
  58. Emmerich, M.T.M.; Deutz, A.H. A tutorial on multiobjective optimization: Fundamentals and evolutionary methods. Nat. Comput. 2018, 17, 585–609. [Google Scholar] [CrossRef] [PubMed]
  59. Black, P.E.; Okun, V.; Yesha, Y. Mutation operators for specifications. In Proceedings of the ASE 2000, Fifteenth IEEE International Conference on Automated Software Engineering, Grenoble, France, 11–15 September 2000; pp. 81–88. [Google Scholar]
  60. Pavai, G.; Geetha, T.V. A Survey on Crossover Operators. ACM Comput. Surv. 2017, 49, 72. [Google Scholar] [CrossRef]
  61. Ari, N.; Ustazhanov, M. Matplotlib in python. In Proceedings of the 2014 11th International Conference on Electronics, Computer and Computation (ICECCO), Abuja, Nigeria, 29 September–1 October 2014; pp. 1–6. [Google Scholar]
  62. Guerreiro, A.P.; Fonseca, C.M.; Paquete, L. The Hypervolume Indicator: Problems and Algorithms. ACM Comput. Surv. 2022, 54, 119. [Google Scholar] [CrossRef]
  63. Blonder, B.; Lamanna, C.; Violle, C.; Enquist, B.J. The n-dimensional hypervolume: The n-dimensional hypervolume. Glob. Ecol. Biogeogr. 2014, 23, 595–609. [Google Scholar] [CrossRef]
  64. Zitzler, E.; Brockhoff, D.; Thiele, L. The Hypervolume Indicator Revisited: On the Design of Pareto-compliant Indicators Via Weighted Integration. In Evolutionary Multi-Criterion Optimization; Obayashi, S., Deb, K., Poloni, C., Hiroyasu, T., Murata, T., Eds.; Springer: Berlin/Heidelberg, Germany, 2007; pp. 862–876. [Google Scholar]
  65. Blank, J.; Deb, K. A Running Performance Metric and Termination Criterion for Evaluating Evolutionary Multi- and Many-objective Optimization Algorithms. In Proceedings of the 2020 IEEE Congress on Evolutionary Computation (CEC), Glasgow, UK, 19–24 July 2020; pp. 1–8. [Google Scholar]
  66. Gupta, R.; Nanda, S.J. Solving time varying many-objective TSP with dynamic θ-NSGA-III algorithm. Appl. Soft Comput. 2022, 118, 108493. [Google Scholar] [CrossRef]
Figure 1. Geographical locations showing the land use classes in the KaMavota district, Maputo City, Mozambique.
Ijgi 13 00099 g001
Figure 2. Space syntax integration measurements.
Ijgi 13 00099 g002
Figure 3. Examples of compactness calculation. Each color on grid represents a given land use type.
Ijgi 13 00099 g003
Figure 4. The procedure of NSGA-III.
Ijgi 13 00099 g004
Figure 5. Individual chromosome with 8 types of genes.
Ijgi 13 00099 g005
Figure 6. Application of mutation operation—left: parent chromosome and right: offspring chromosome. The ovals in the figures represent the regions where there were changes in land use type.
Ijgi 13 00099 g006
Figure 7. Application of crossover operations.
Ijgi 13 00099 g007
Figure 8. Comparison in terms of the Hypervolume indicator.
Ijgi 13 00099 g008
Figure 9. Running metrics across different generations. The * represents the curve constructed with the minimum of all solutions.
Ijgi 13 00099 g009
Figure 10. Convergence analysis based on constraint satisfaction.
Ijgi 13 00099 g010
Figure 11. Comparison between the improved and standard NSGA-III in terms of computation time.
Ijgi 13 00099 g011
Figure 12. Optimal maps: (a) preferred economic income, (b) preferred carbon emission, (c) preferred accessibility, (d) preferred space syntax integration, and (e) preferred compactness.
Ijgi 13 00099 g012
Figure 13. Optimal Pareto front set with petal diagrams: f 1 —Economy, f 2 —Carbon emission, f 3 —Accessibility, f 4 —Space syntax integration, and f 5 —Compactness. S i , i = 1 , 2 , 3 , , 24 represents each optimal solution in optimal Pareto front set.
Ijgi 13 00099 g013
Table 1. Summary of studies in sustainable urban land use planning.
ReferenceApplicationObjective FunctionsOptimization Objective ApproachOptimization MethodsSpatial Data TypeData ModelStudy Area
[27]Sustainable Urban PlanningMinimize investment cost, maximize economic–environmental–social monetarization benefits, Maximize ran off control capacityPareto front-based methodNSGA-IIPipe network system data, Land use type, Rainfall monitoring data Not identifiedBeijing, China
[28]Sustainable Urban PlanningMaximize cooling effect, Maximize connectivity, minimize cost Pareto front-based methodNSGA-IIDEMRasterSouth Korea
[29]Sustainable Urban PlanningMaximize urban flood reduction, maximize total benefits, minimize costPareto front-based methodNSGA-IIRainfall monitoring dataNot identifiedCul de Sac area on Sint Maarten Island
[30]Sustainable Urban PlanningMinimize urban ecosystem service, minimize compactnessPareto front-based methodNSGA-IILand cover map, Leaf Area Index, Vegetation Height, DEM, Master Plan, Building floor planRasterSouth of the Malayan Peninsula
[31]Sustainable Urban PlanningMinimize the cost of the SPC project, minimize the inlet and outlet volume ratio, minimize the peak reduction ratio, maximize the peak delay ratio, maximize the landscape quality of the sponge facilitiesPareto front-based methodNSGA-IIRainfall monitoring data, DEMRasterMiddle school campus in Tongzhou District, Beijing
[32]Sustainable and Resilient Urban PlanningReducing urban sprawl, reducing risk from flood events, restricting greenspace development, reducing risk from heatwaves, prioritizing brownfield development, and improving public transport accessPareto front-based methodMulti-objective spatial optimizationUrban sprawl, Flood zones, Land use, Heat waves, and Transport accessRasterGreater Manchester
[33]Sustainable Urban PlanningSolar gain, length, and distribution of spatial interventions, and volumetric mass of the spatial interventionsPareto front-based methodMulti-objective evolutionary algorithms Not identified
[22]Sustainable and Resilient Urban PlanningRunoff reduction, pollution control, environmental benefitsPareto front-based methodNSGA-IISurface, Soil, Storage, Drain, and PavementNot identifiedNorthern China
[34]Sustainable Urban PlanningTotal edge length, loss of agricultural productivityPareto front-based methodNSGA-IIDEM, Land coverRasterZürich, Switzerland
[35]Sustainable Urban PlanningMinimum Tair and LST at 2 pm, minimum UTCI at 2 pm and daily HRM, and minimum daily EPL, daily EB, and ICWeighted sum methodGenetic algorithmLand coverRasterGreater Sydney region
[23]Sustainable Urban PlanningMaximize the gray zones, maximize the green zones, and maximize the connectednessPareto front-based methodNSGA-IILand coverRasterShenzhen in China
[36]Sustainable and Resilient Urban PlanningCarbon emission, ecological benefit, economic benefit, sustainable development Weighted sum methodANNDEM, GDP, population, Land cover, precipitation, night lightRasterBeijing–Tianjin–Hebei Region of China
[24]Sustainable and Resilient Urban PlanningEnergy consumption, photovoltaic energy potential, and sunlight hoursPareto front-based methodRhino & GrasshopperLand coverRasterJianhu City, China
[25]Sustainable and Resilient Urban PlanningScenery and walkabilityPareto front-based methodNSGA-IISafety-index mapNot identifiedYork City
Table 2. Summary of land use types. The 2348 is the total number of cells in the map, excluding no data, 100% is the total proportion of land use types.
CodeLand UseNumber of Cells per Unit of Land UseNumber of Cells in the MapProportionLand Use Value
1Residential1205587.52%859 MZM
2Nursery51004.26%5689 MZM
3Primary schools5150.64%13,813 MZM
4Secondary schools10502.13%27,640 MZM
5Urban health center20602.56%58,889 MZM
6Public facilities1401.70%1889 MZM
7Fire services480.34%2889 MZM
8Waste burning centers20200.85%40,819 MZM
Total2348100.00%
Table 3. Information about different land use classes in Maputo.
Land Use TypesArea for Each UnitWeight of the Land Use ( μ j )Recommended Minimum Travel DistanceWeight of the Land Use Distance ( w j )Average Value (Thousand MZM)Maximum Capacity (Person)Average Carbon Emission (Million Tons)
Residential500 m20.00280 m085950.0210
Nursery5000 m20.0283800 m0.0298568910000.0012
Primary School12,140 m20.0686800 m0.029813,81315000.0018
Secondary School24,300 m20.13731250 m0.046627,64050000.0260
Urban Health Center50,000 m20.28262500 m0.093158,88925,0000.0410
Public Facilities25,000 m20.14133000 m0.111718895000.0320
Fire Service10,000 m20.05657500 m0.27932889500.0220
Waste Burning Center50,000 m20.282611,000 m0.409740,819400.4000
Disclaimer/Publisher’s Note: The statements, opinions and data contained in all publications are solely those of the individual author(s) and contributor(s) and not of MDPI and/or the editor(s). MDPI and/or the editor(s) disclaim responsibility for any injury to people or property resulting from any ideas, methods, instructions or products referred to in the content.

