

An Integrated Duranton and Overman Index and Local Duranton and Overman Index Framework for Industrial Spatial Agglomeration Pattern Analysis

Abstract
1. Introduction
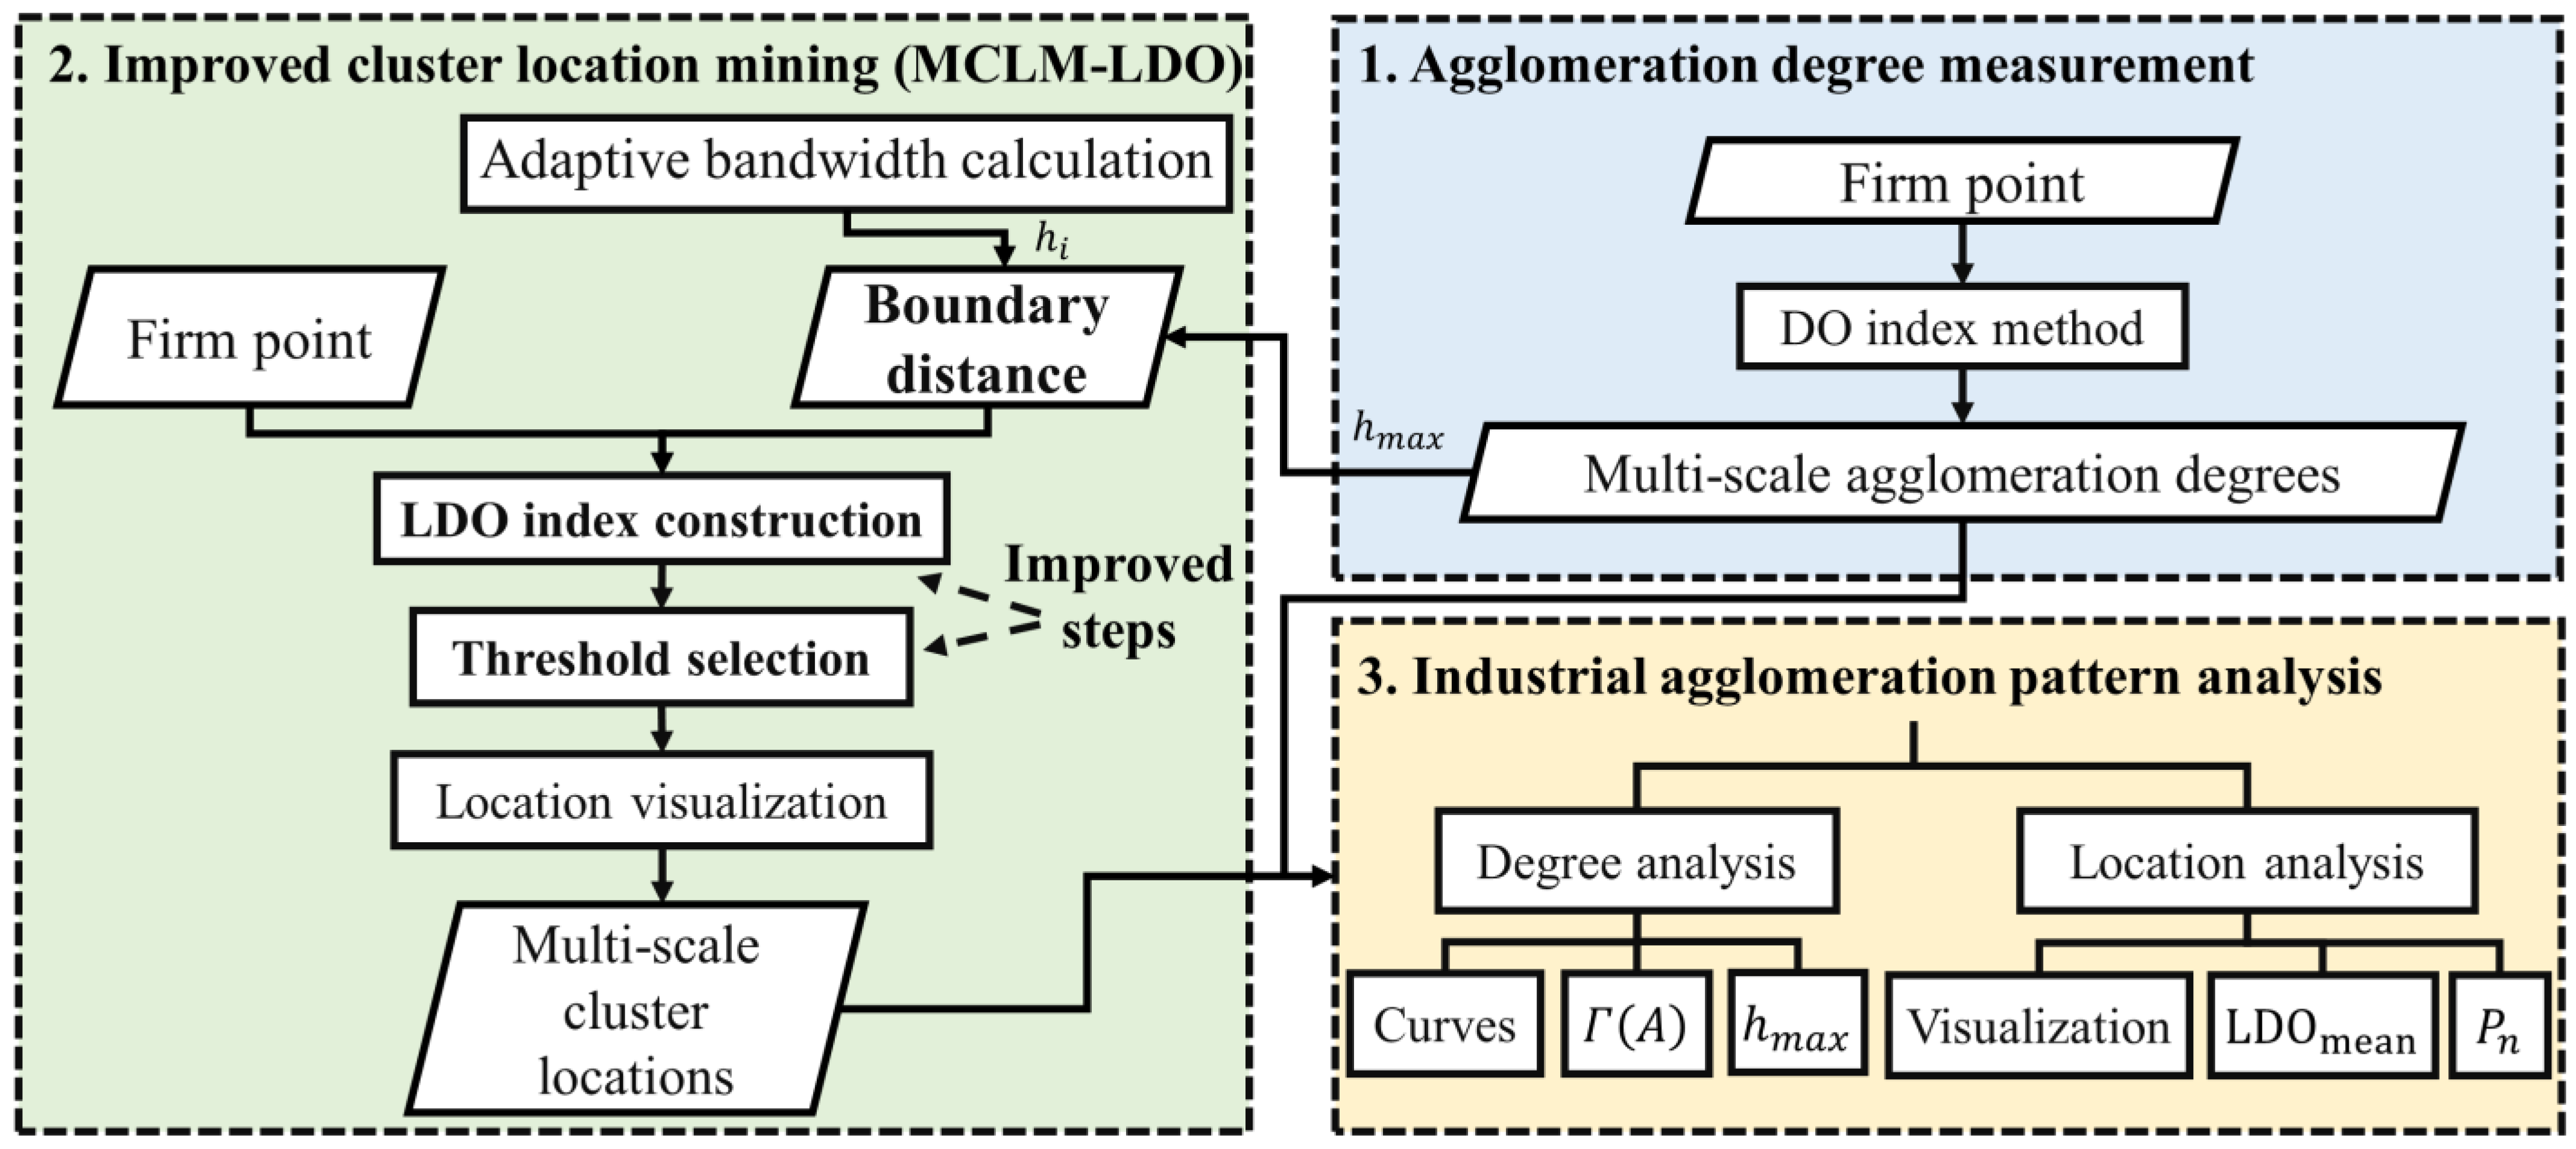
2. Methodology
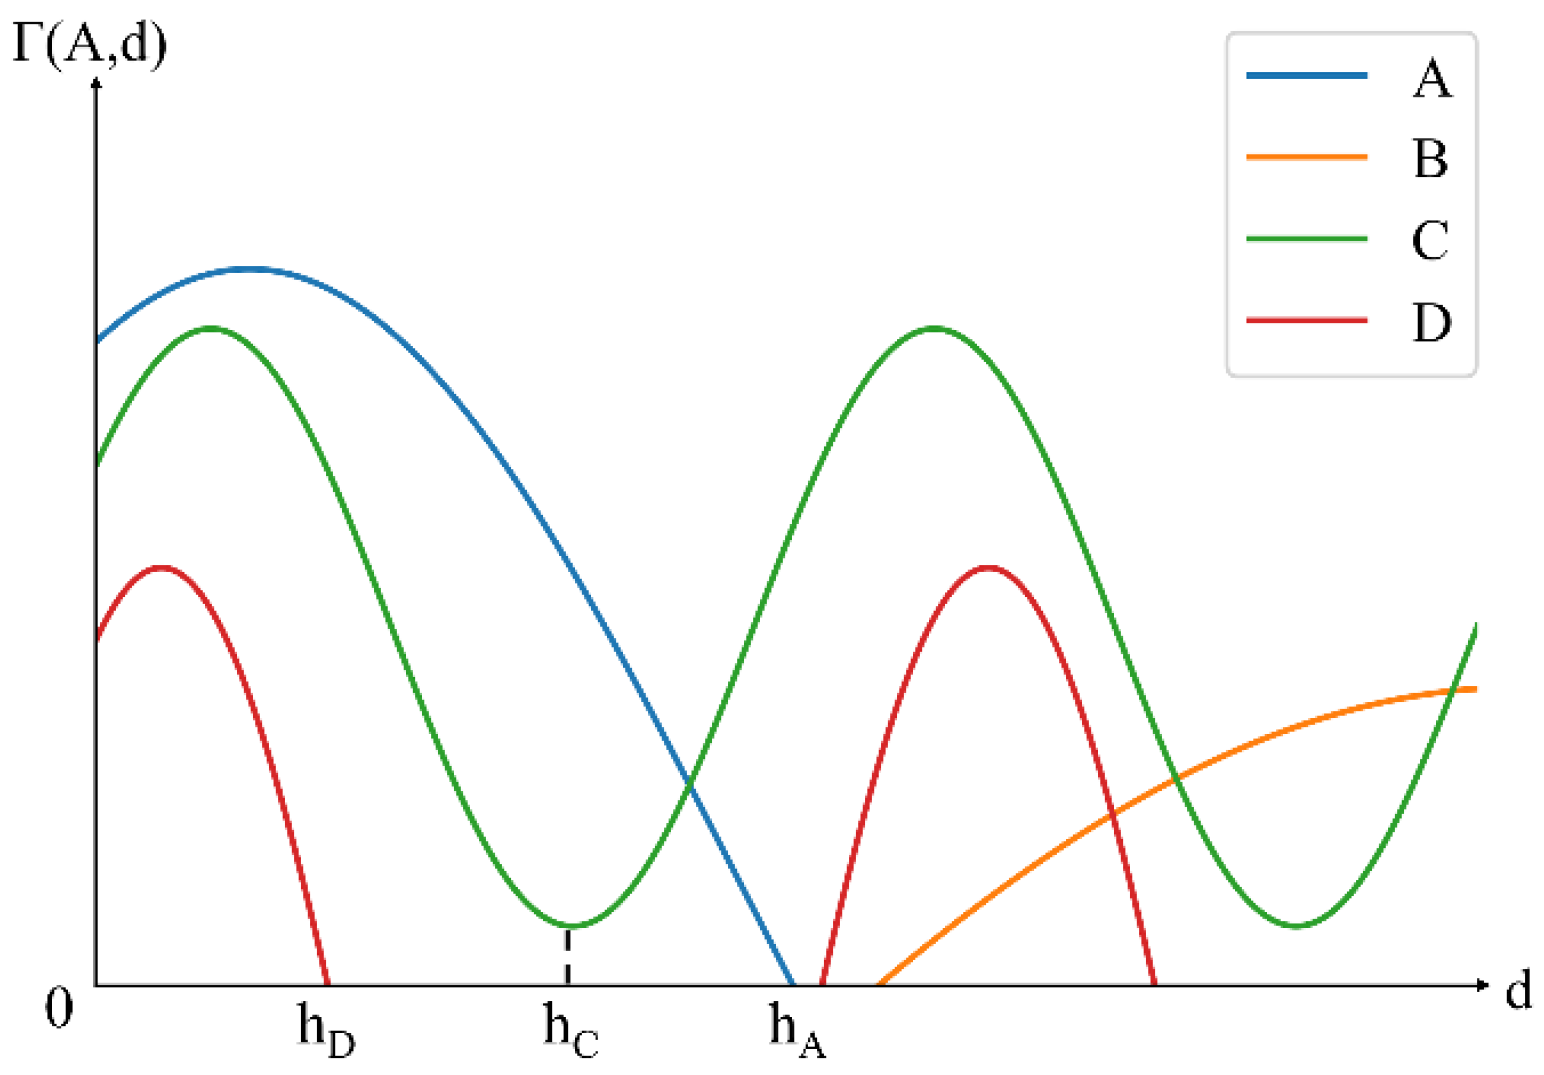
2.1. Multi-Scale Agglomeration Degree Measurement Based on DO Index Method
2.2. LDO Index Construction for MCLM-LDO Method
2.2.1. Construction of LDO Index
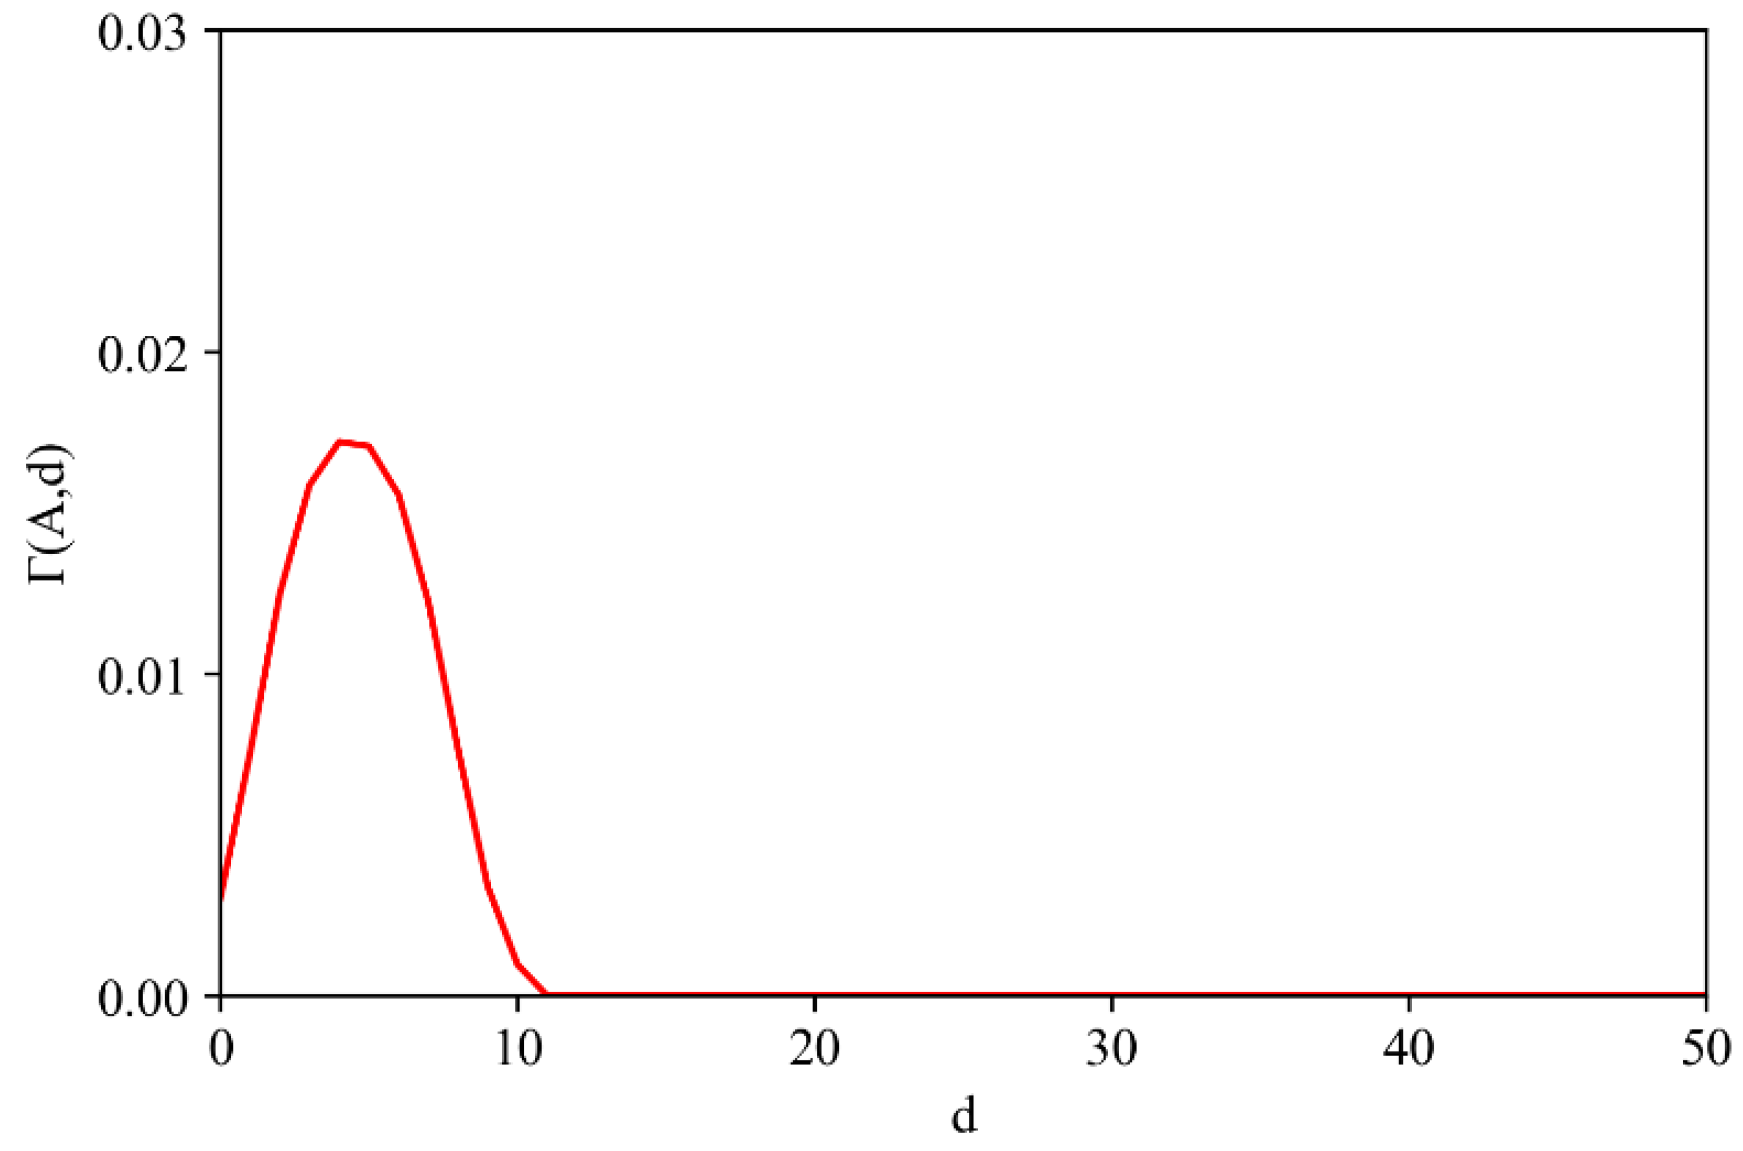
2.2.2. Determination of Boundary Distance Parameters
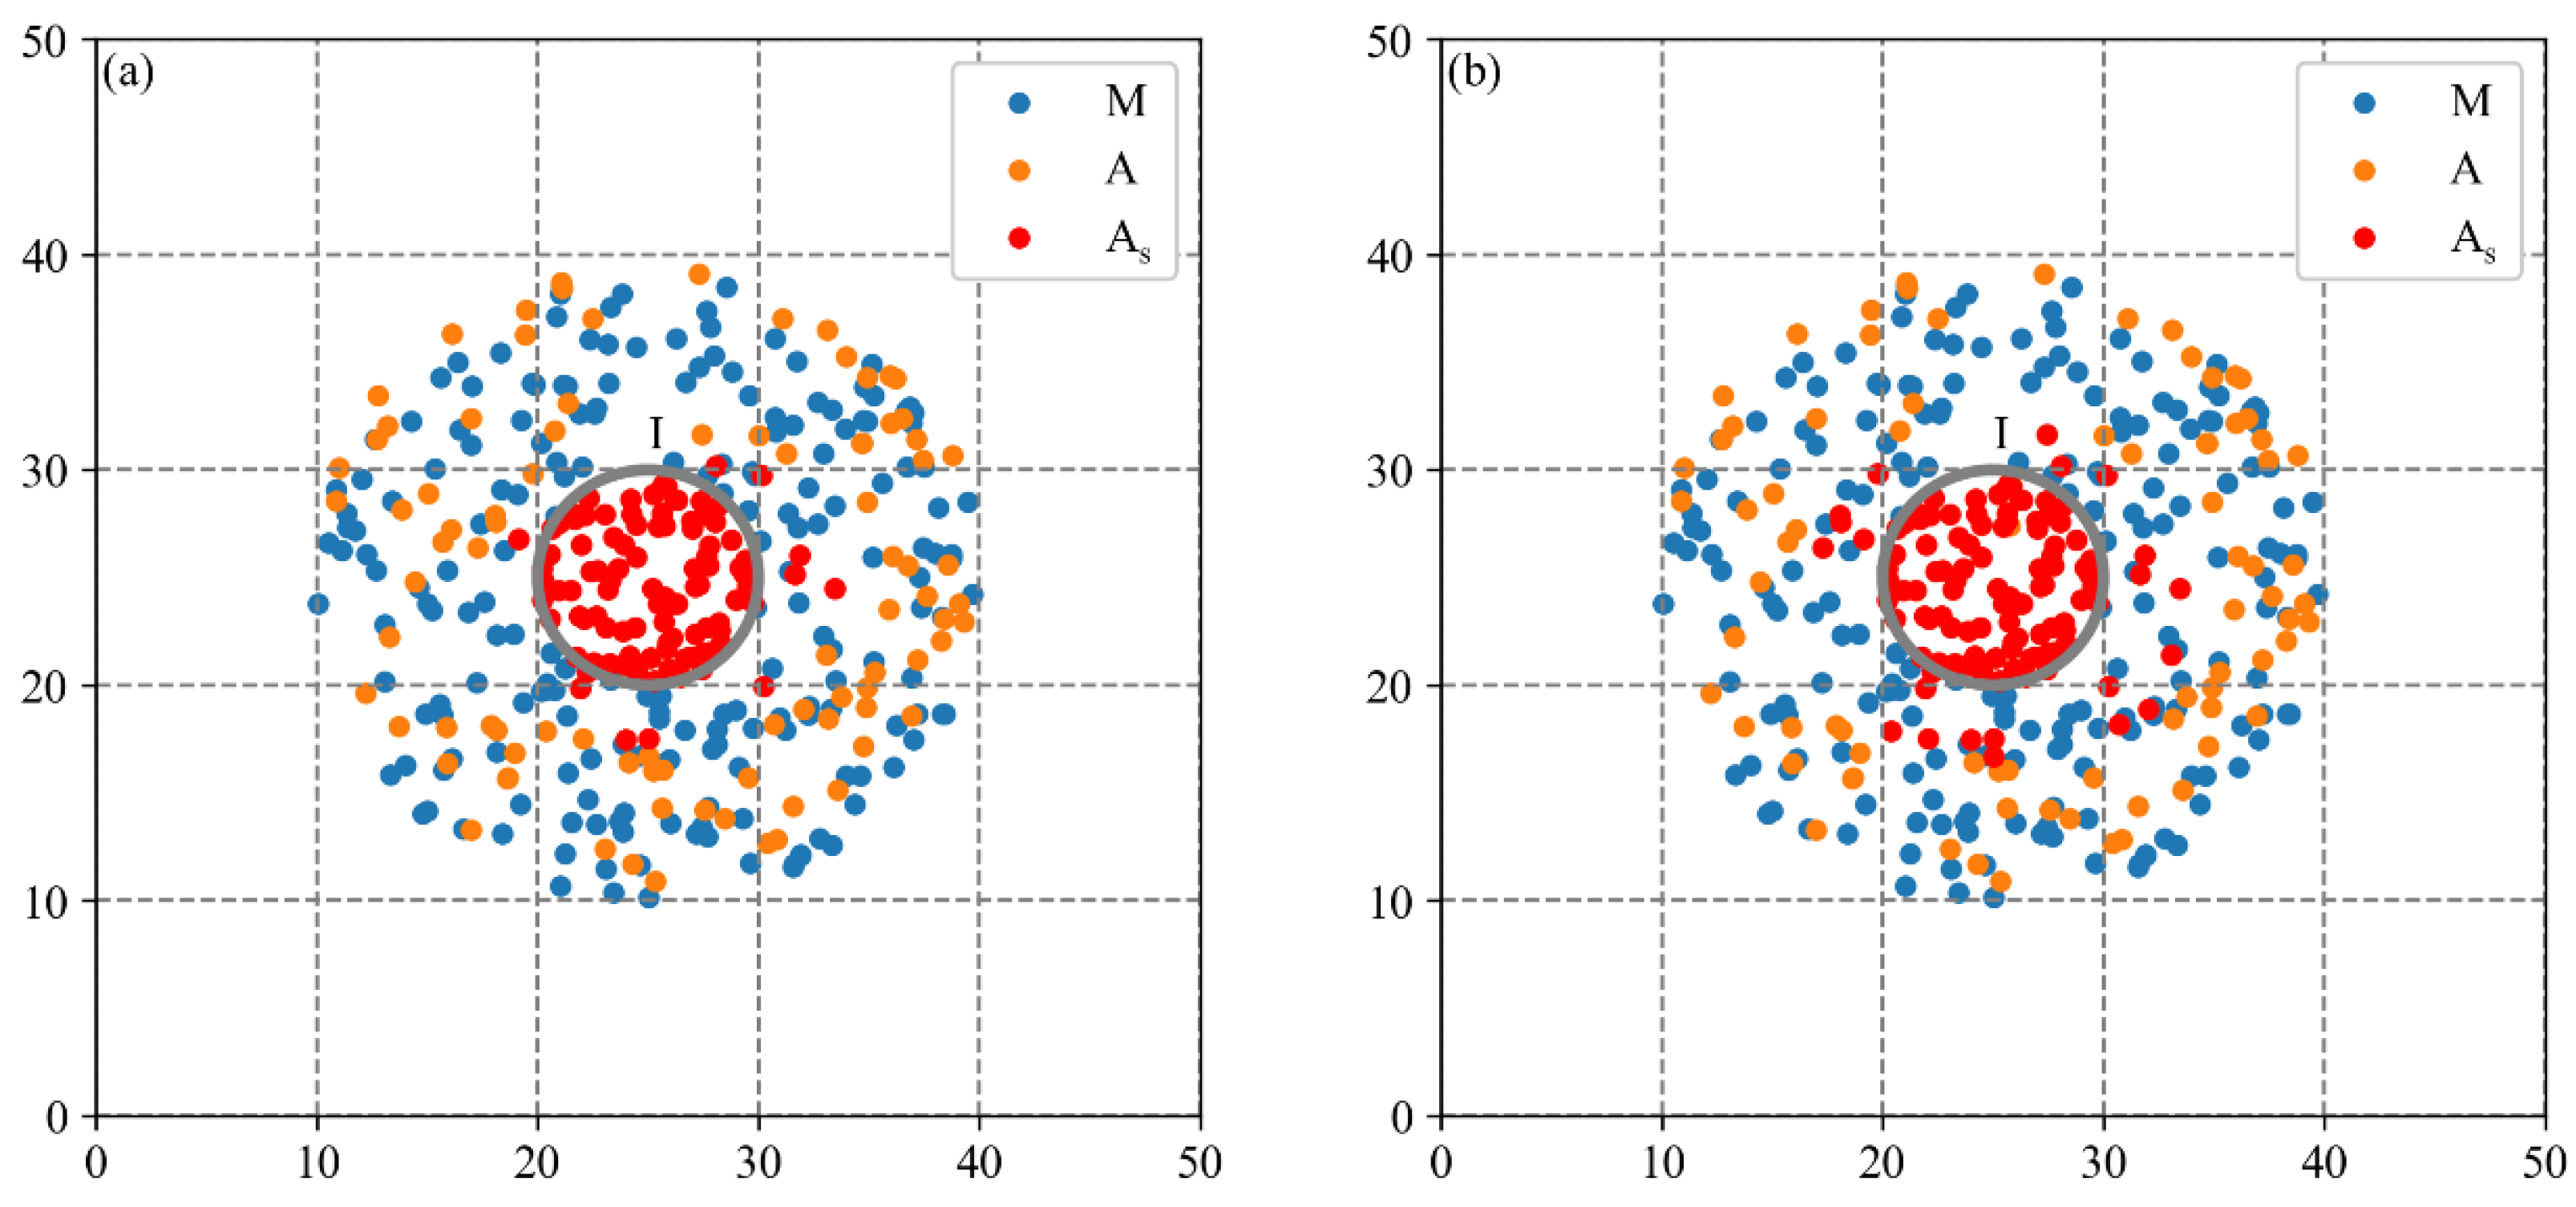
2.2.3. Core Firm Identification Based on Threshold Selection
2.2.4. Cluster Location Visualization
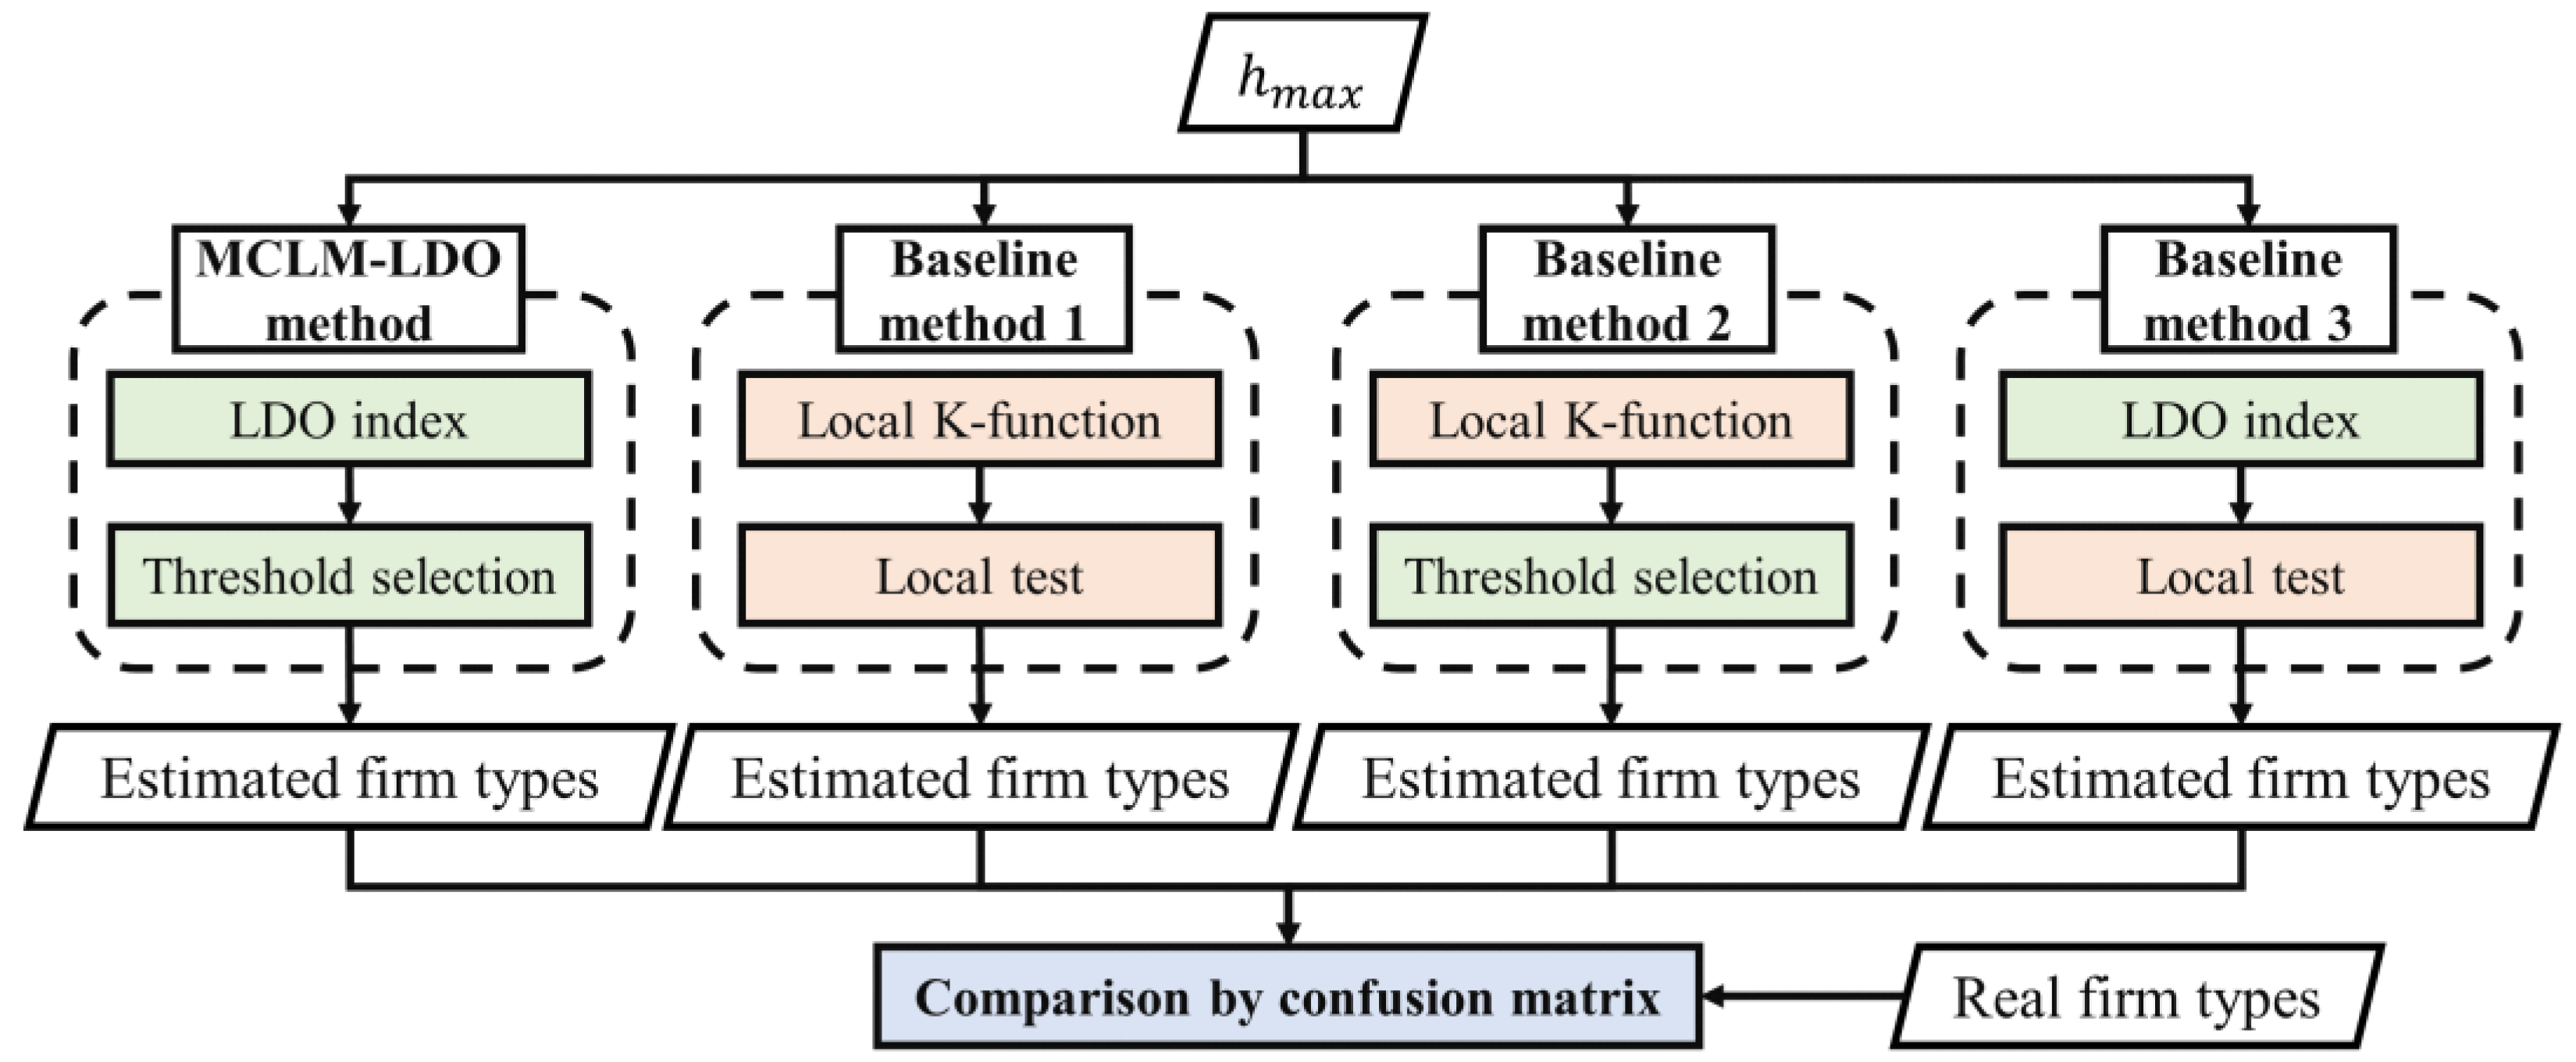
2.2.5. Performance Evaluation of MCLM-LDO Method
2.3. Industrial Spatial Agglomeration Pattern Analysis from Dual Perspectives
3. Experiments and Analysis
3.1. Datasets
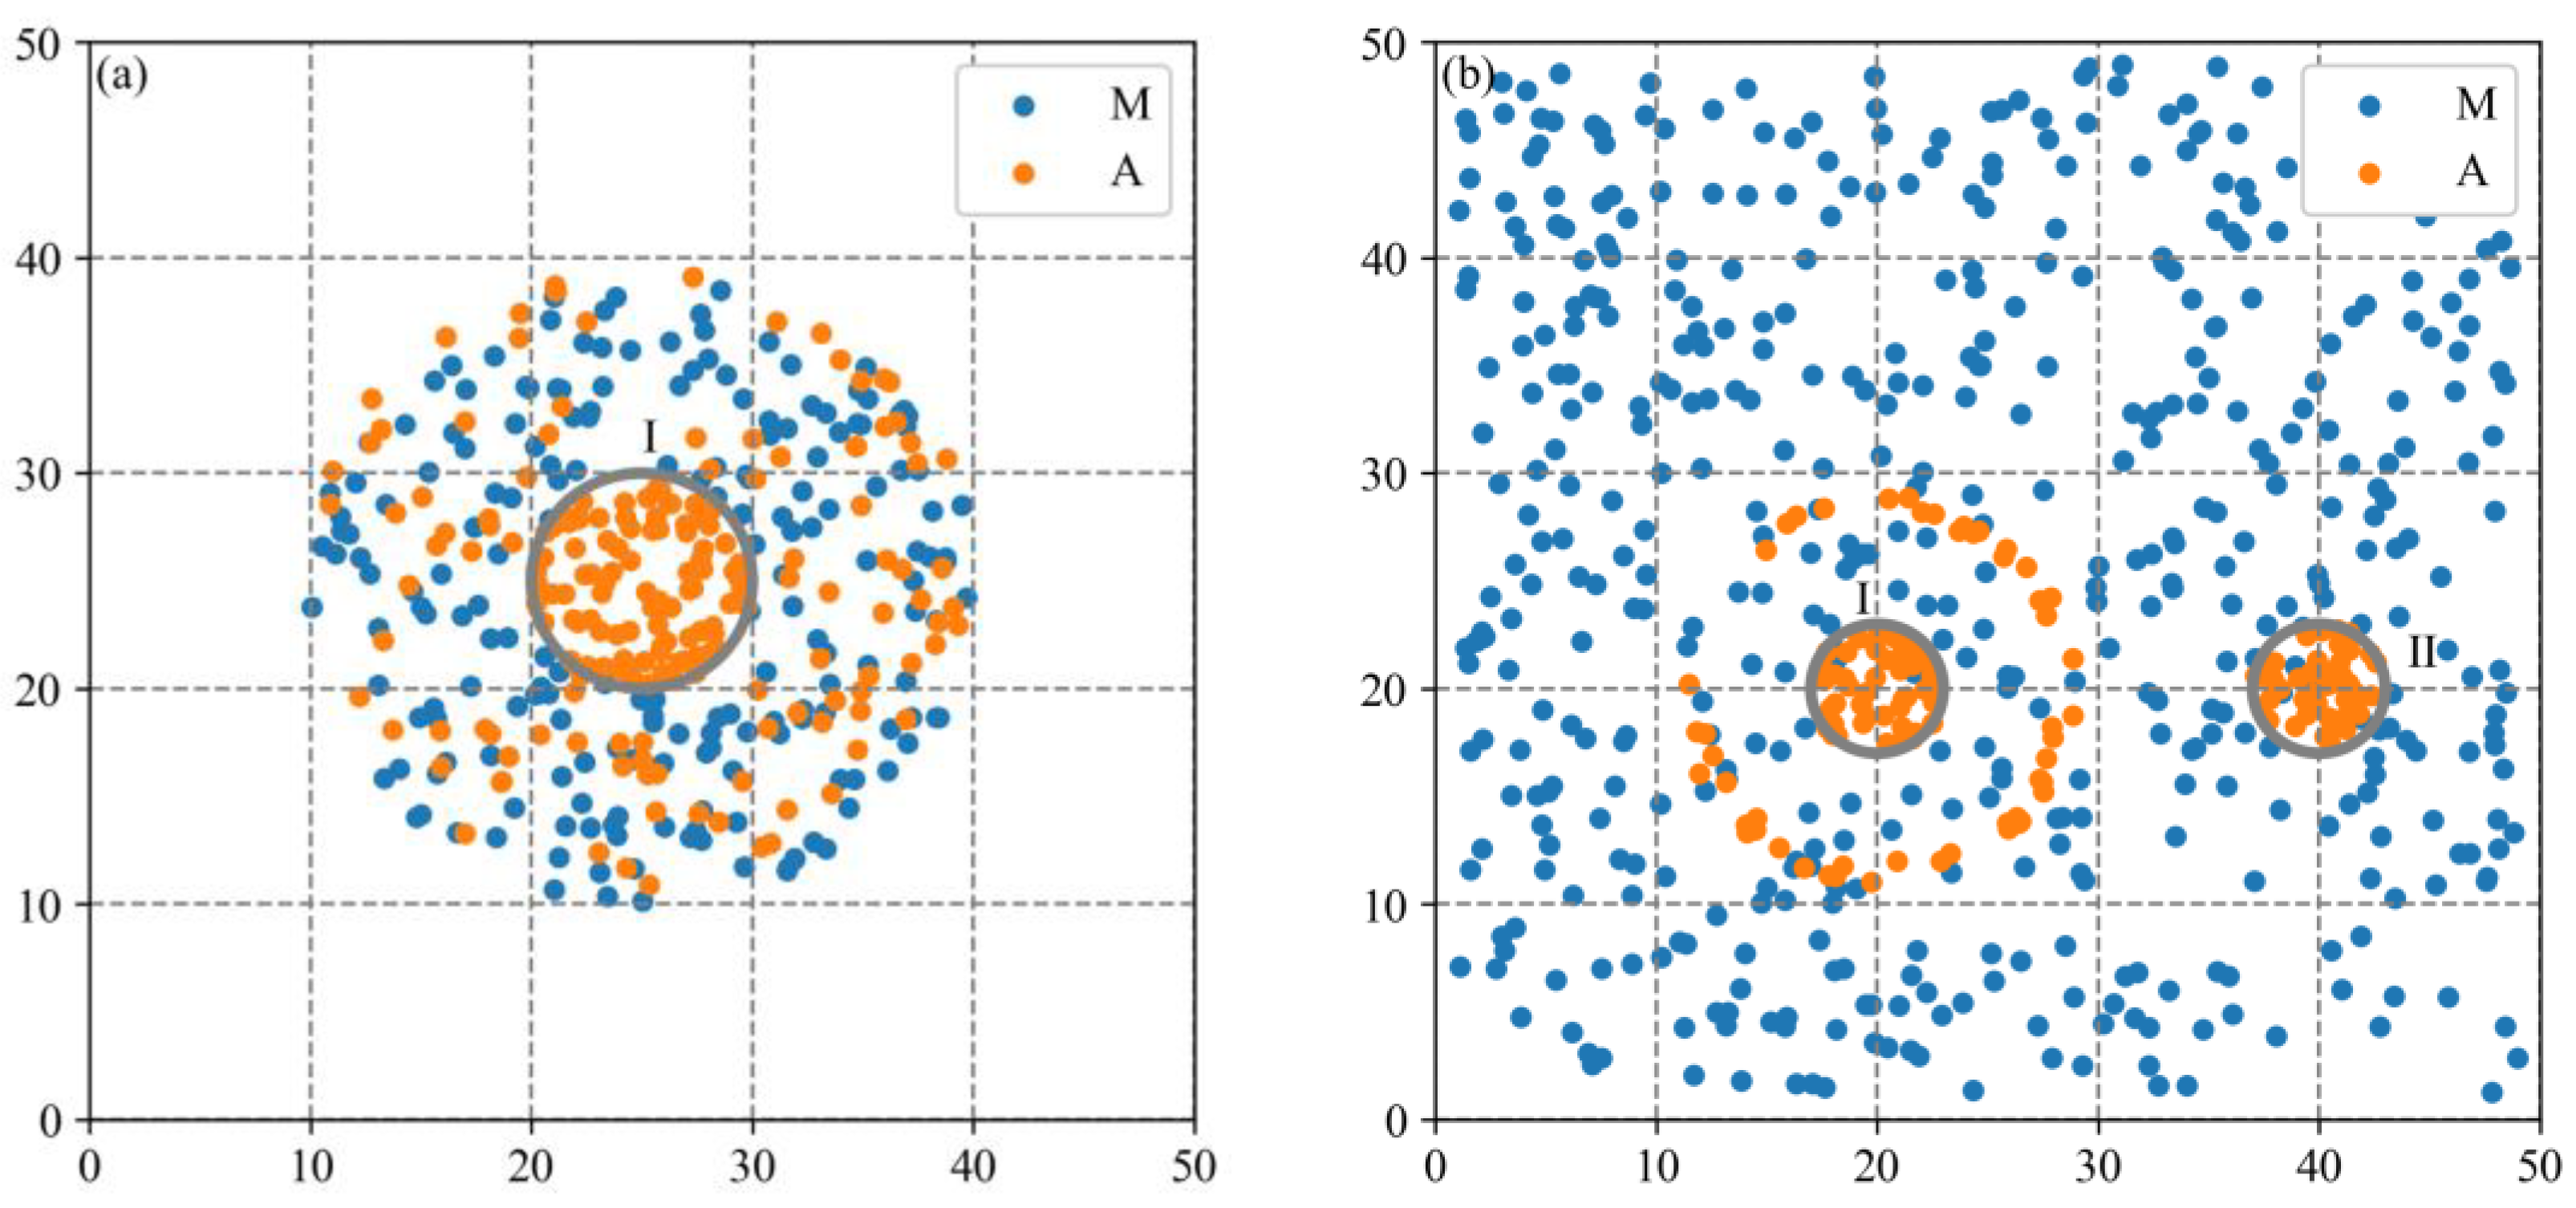
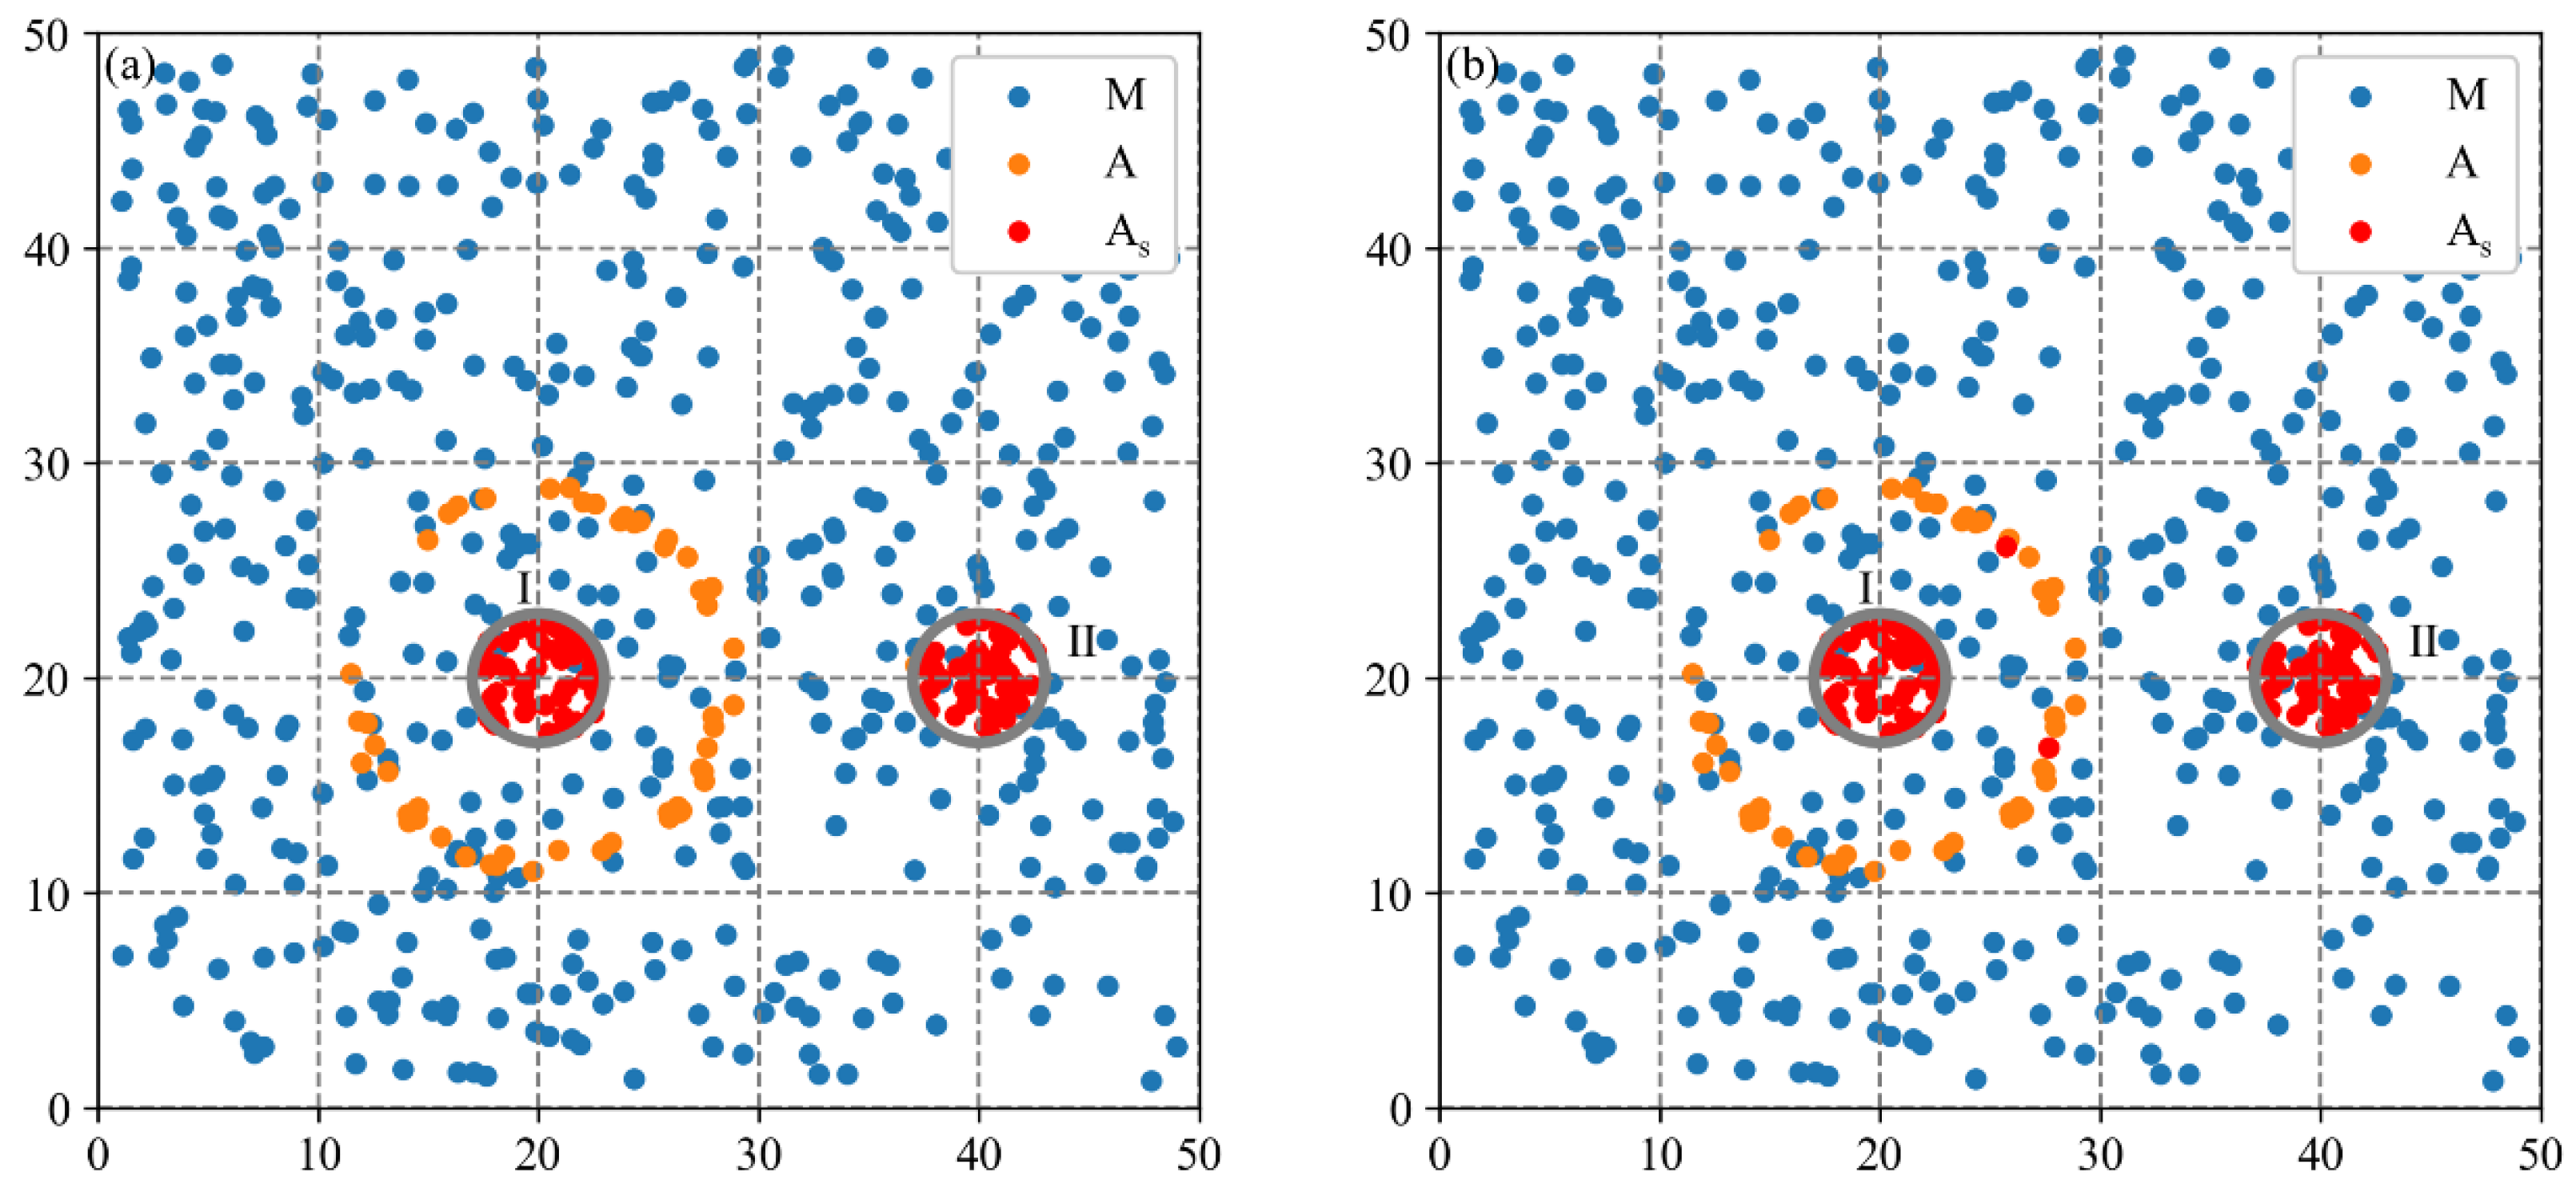
3.1.1. Synthetic Datasets
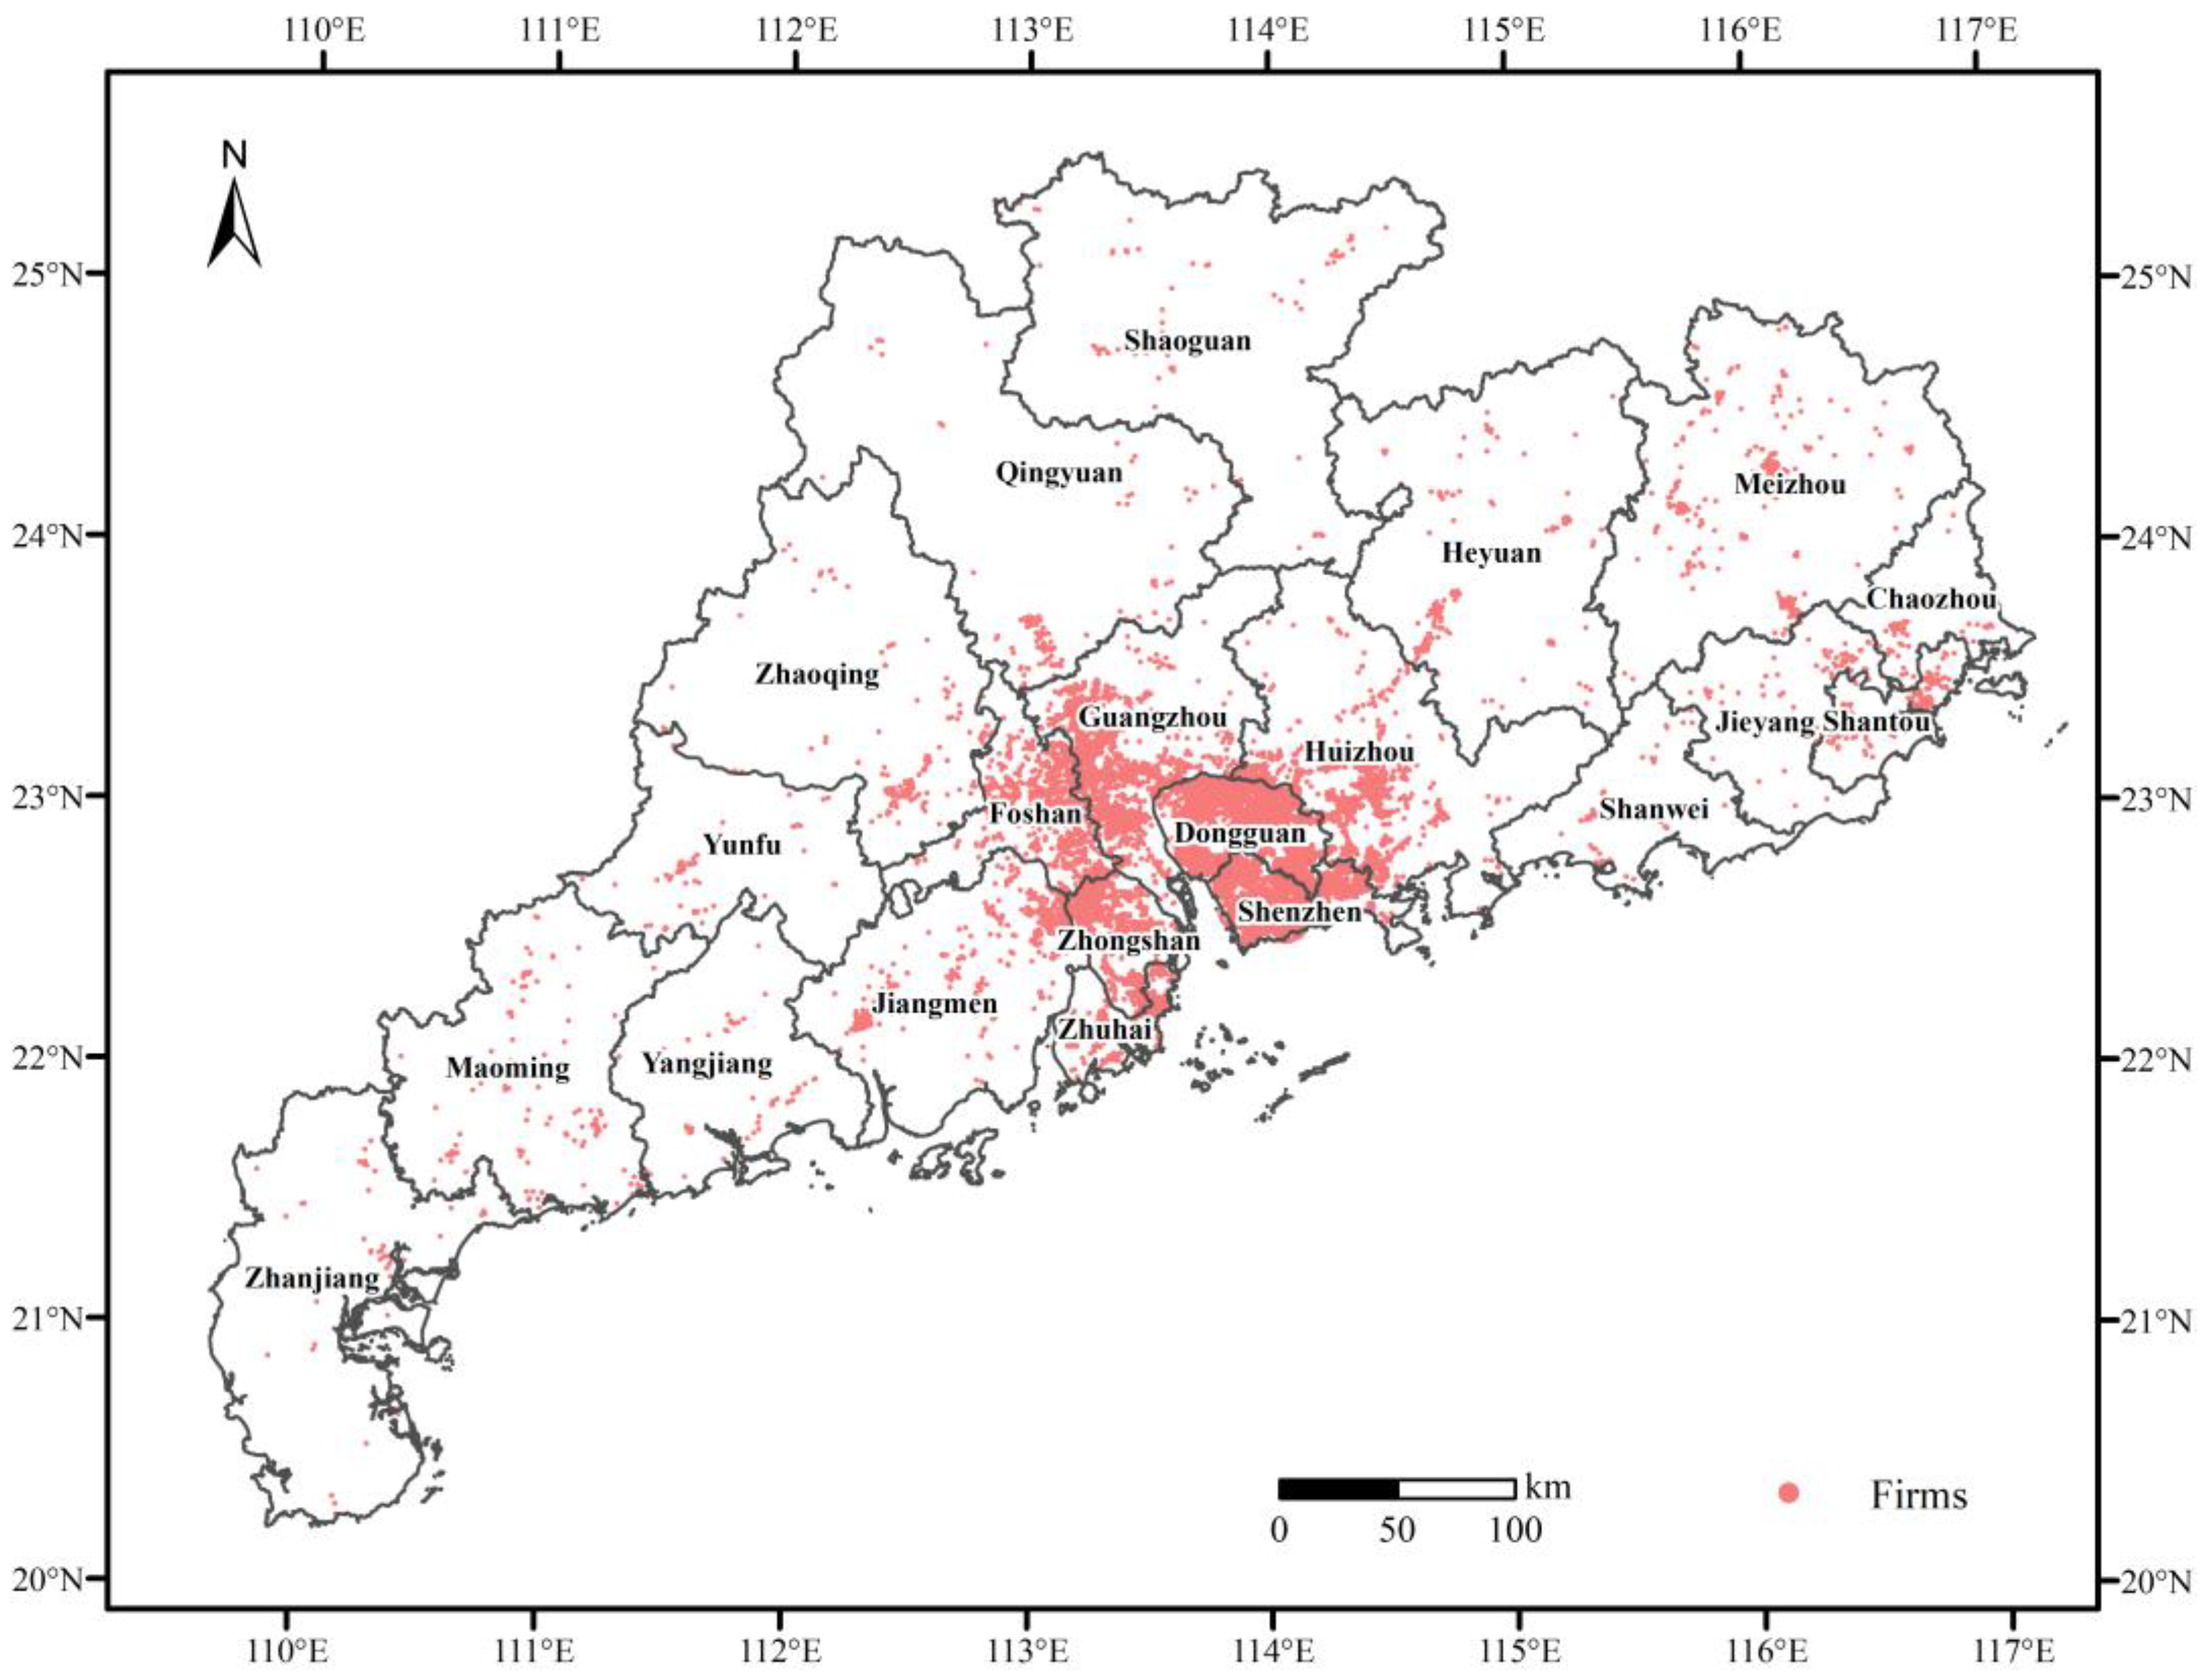
3.1.2. Actual Dataset
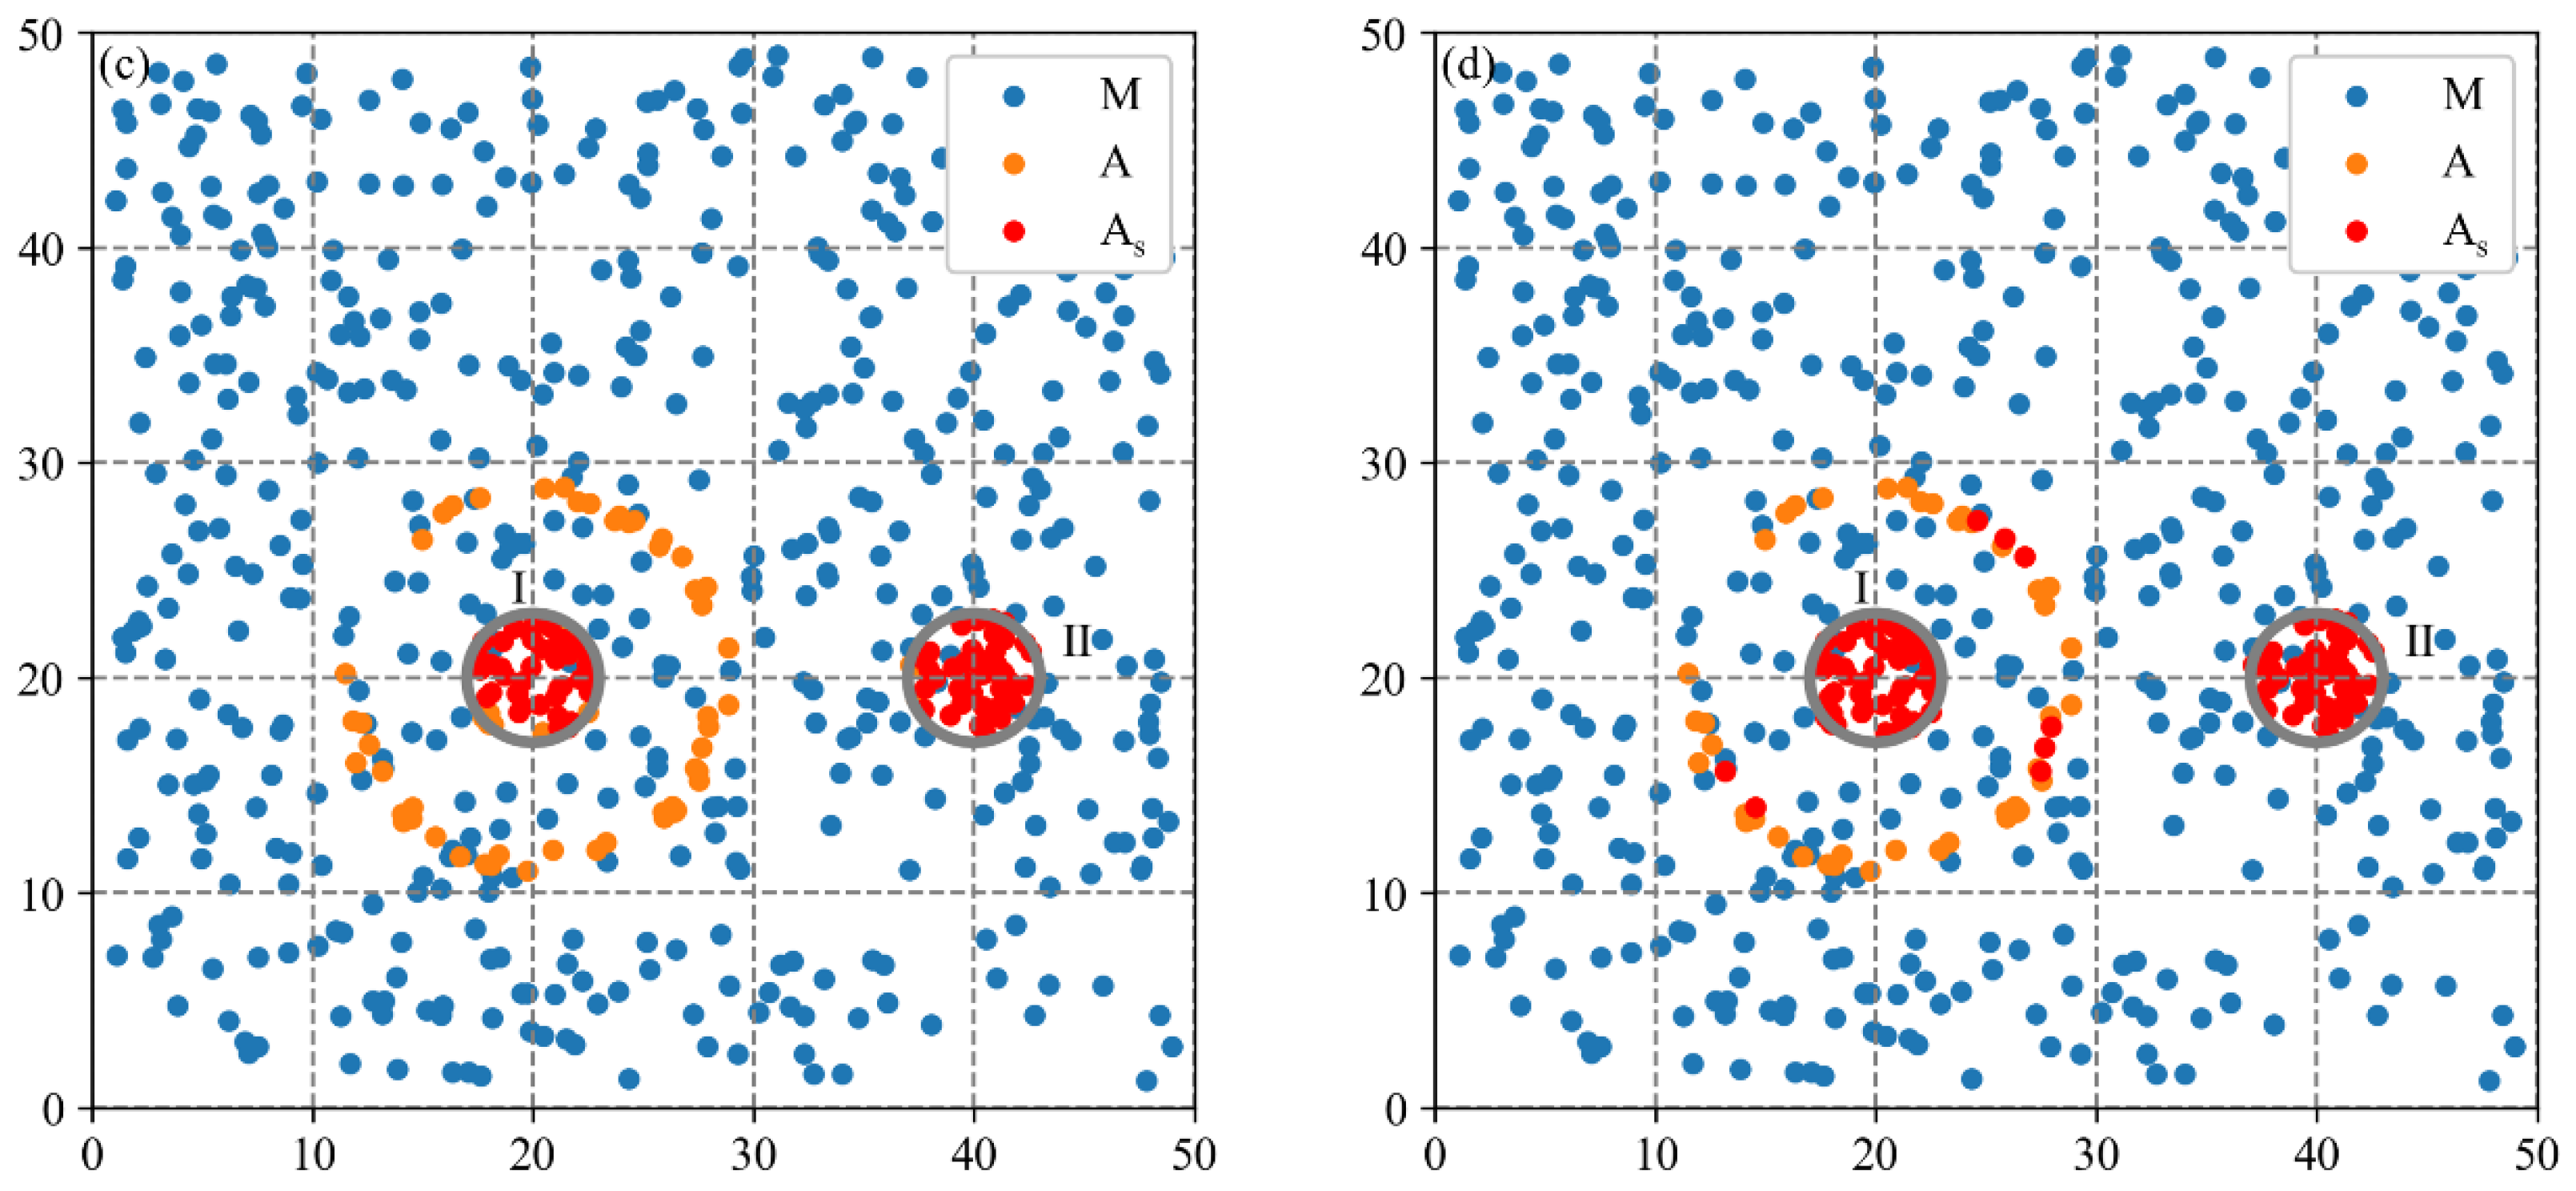
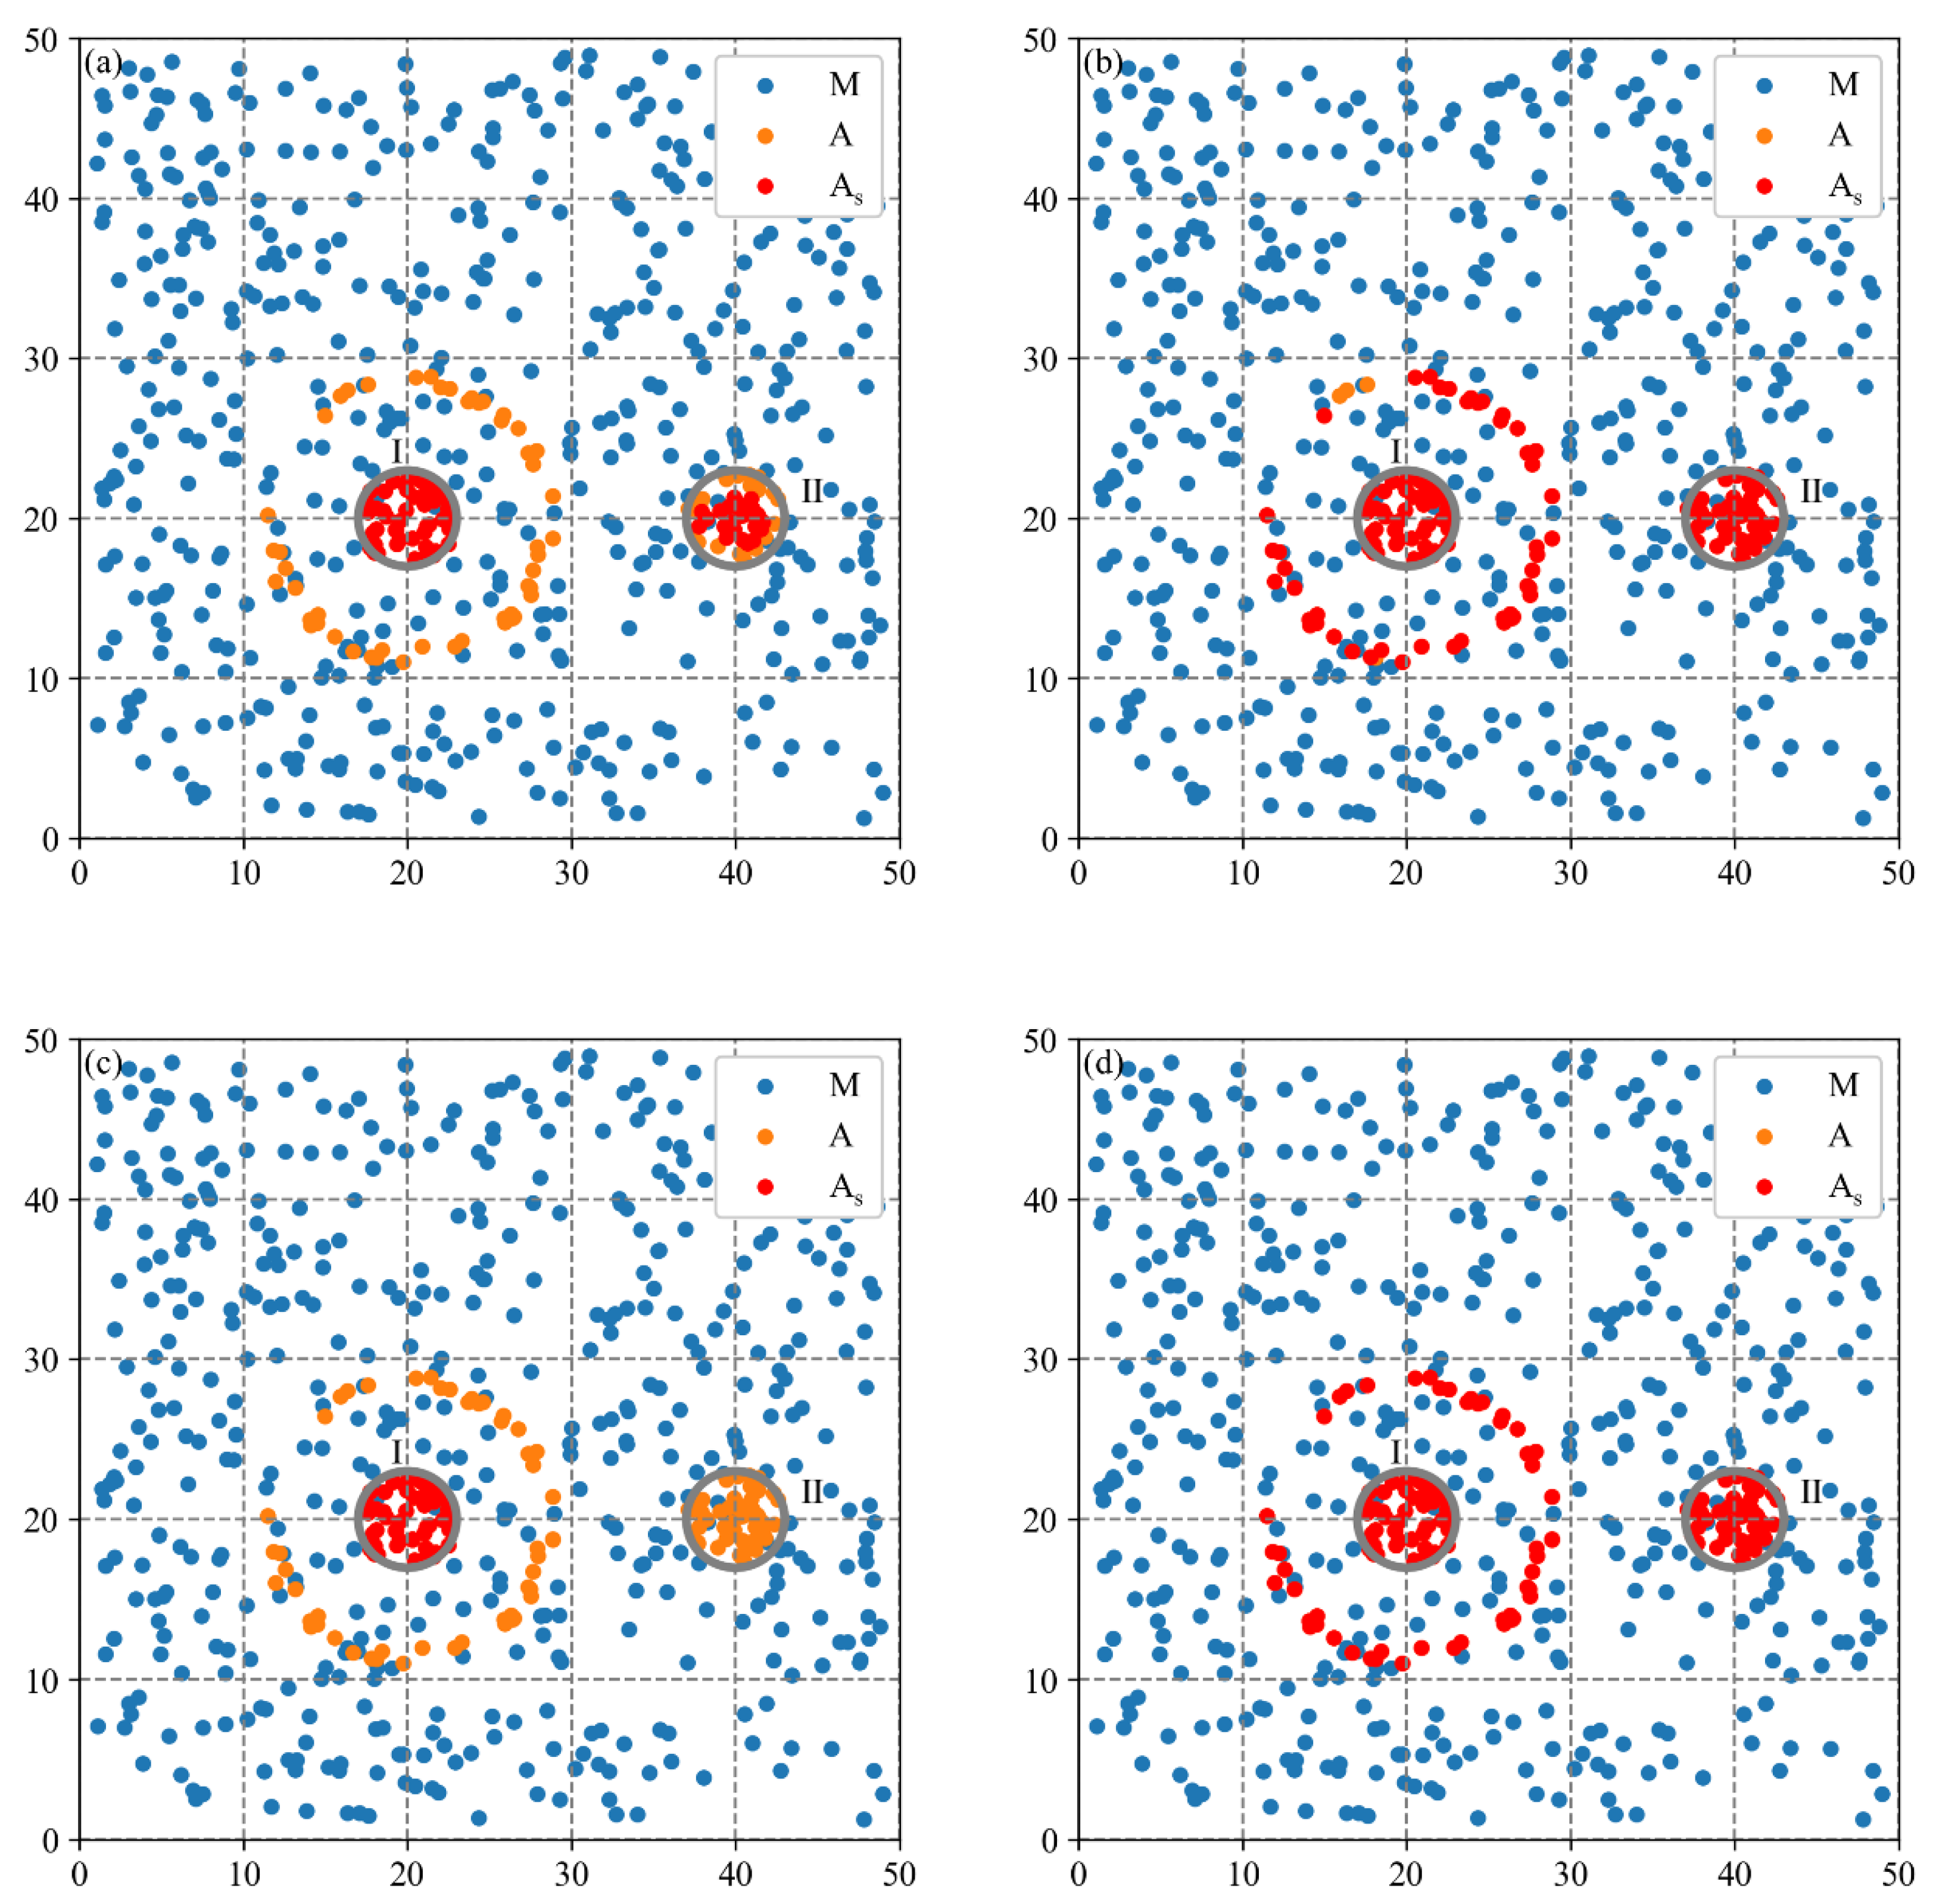
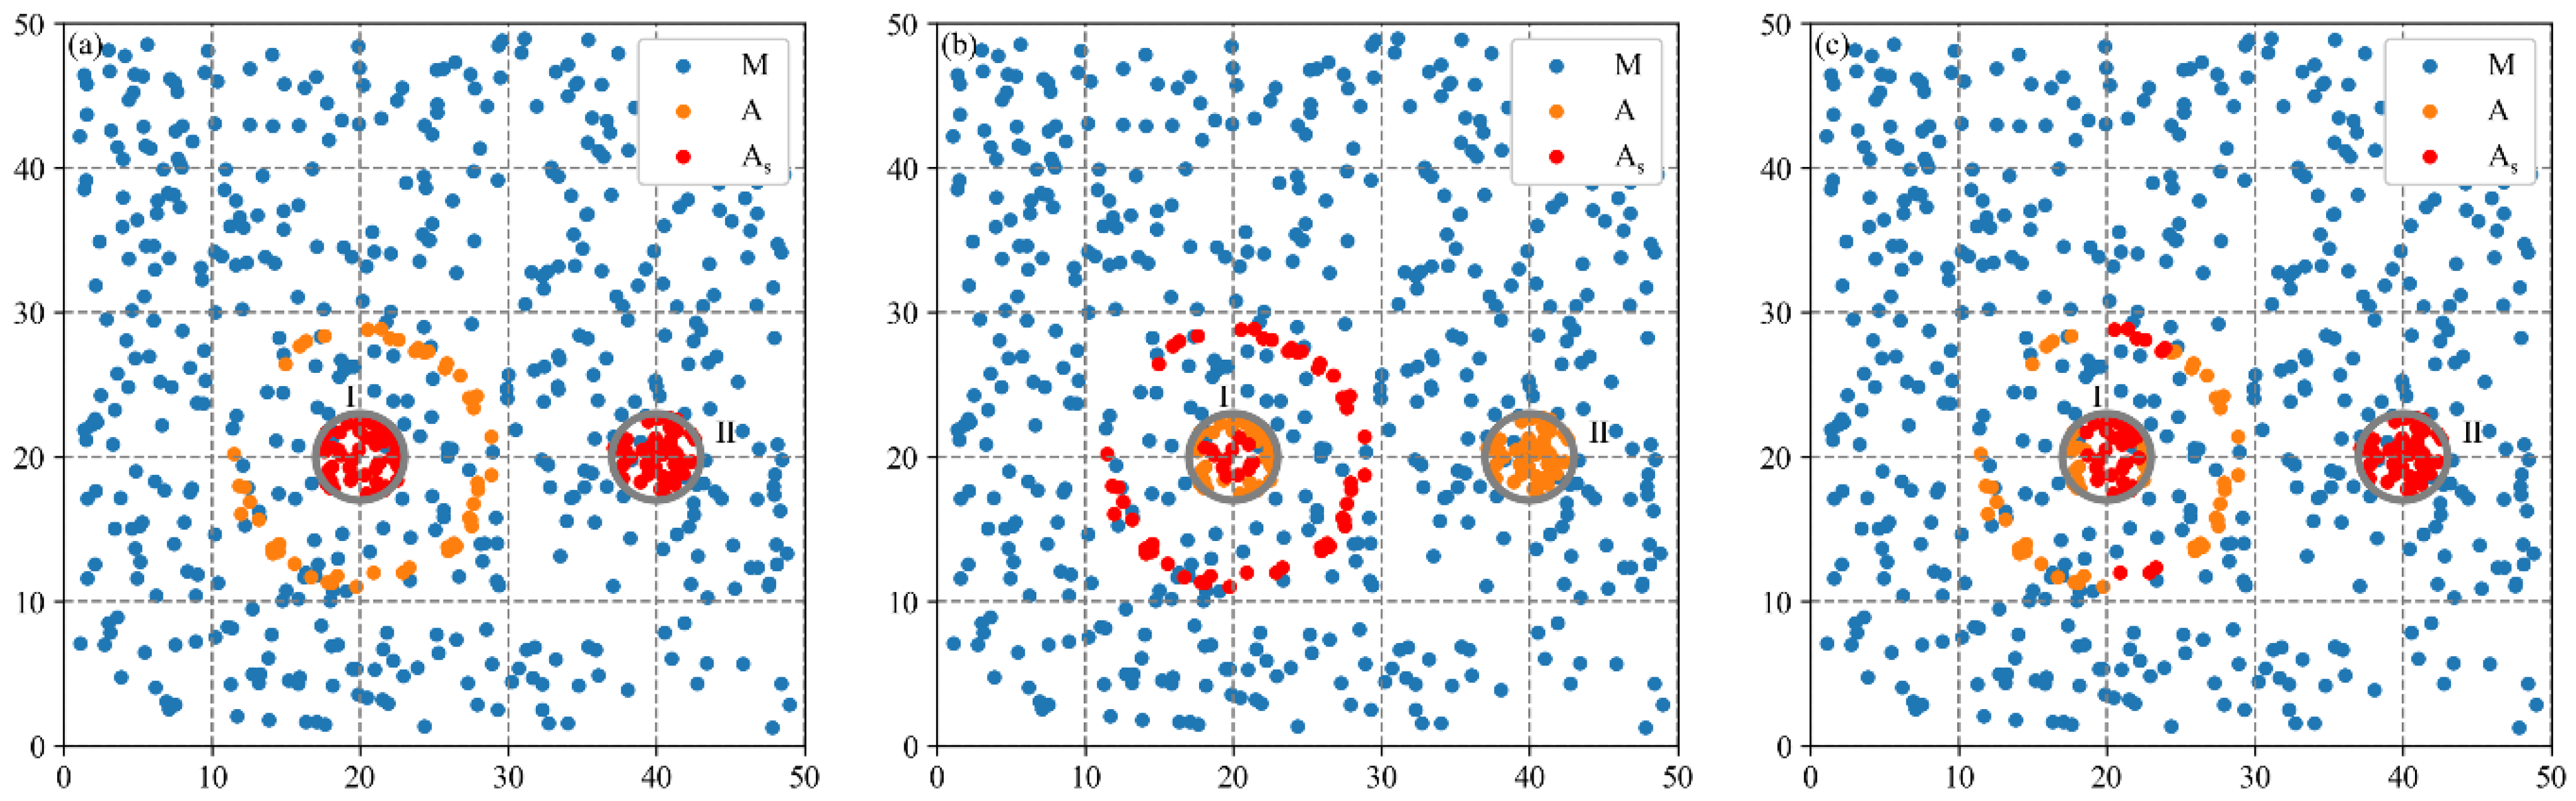
3.2. Performance Analysis of MCLM-LDO Method on Synthetic Data
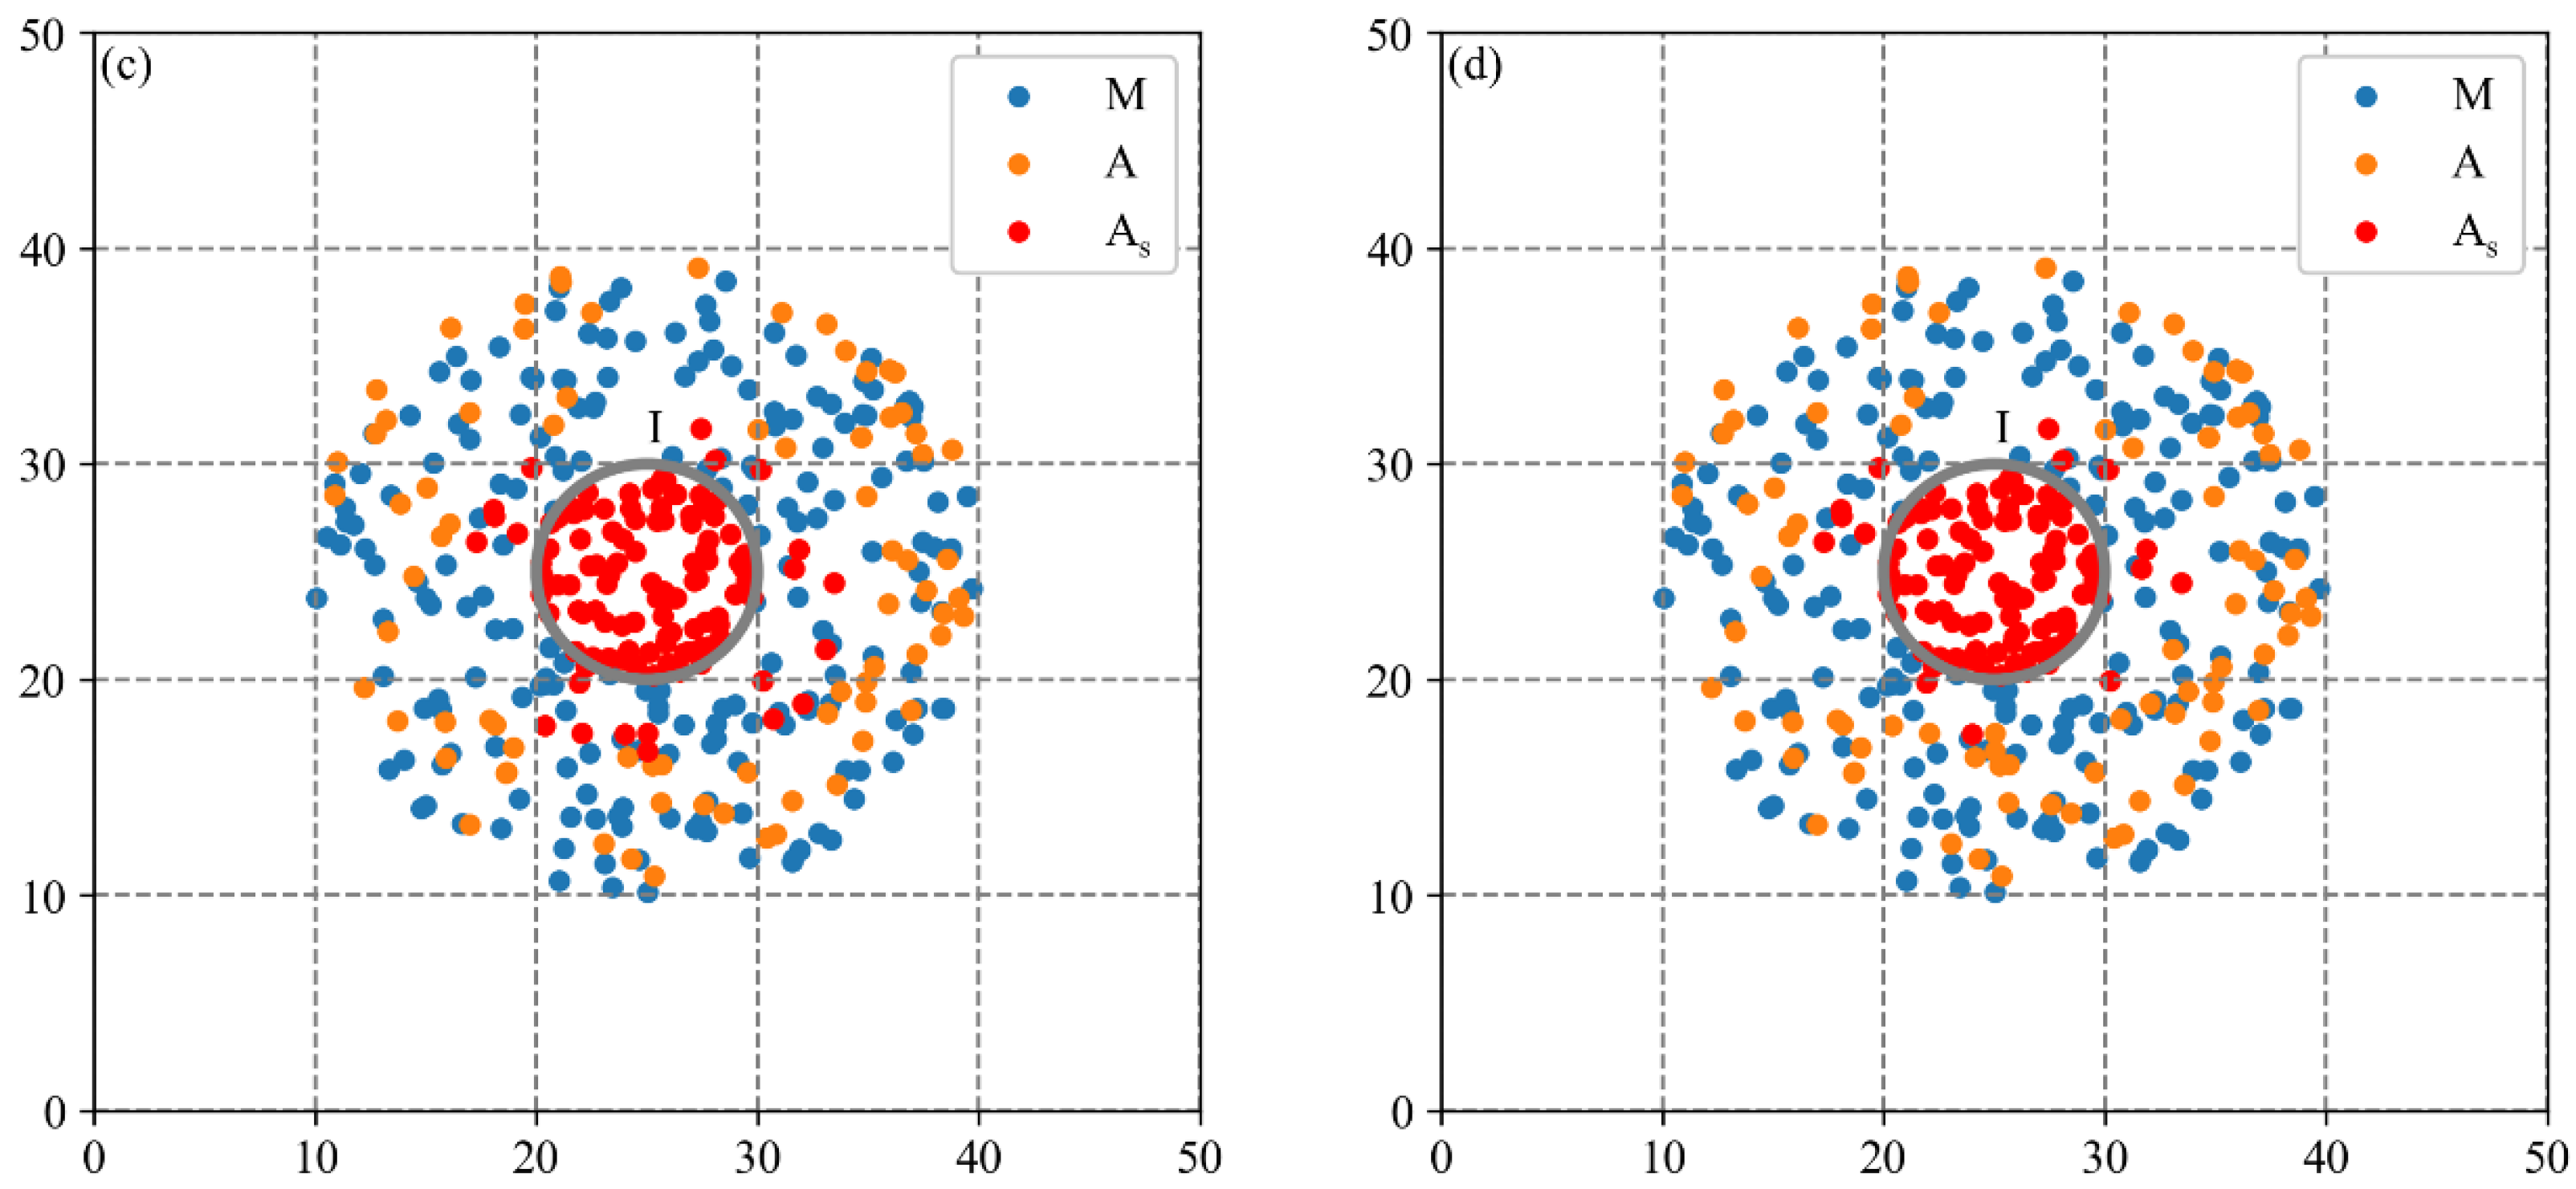
3.2.1. Spatial Agglomeration Analysis on Synthetic Dataset 1
3.2.2. Spatial Agglomeration Analysis on Synthetic Dataset 2
3.3. Application of Integrated DO Index and LDO Index Framework on Actual Dataset
3.3.1. Industrial Agglomeration Degree Analysis of Guangdong Province
3.3.2. Industrial Cluster Location Analysis of Guangdong Province
4. Discussion
4.1. Sensitivity Analysis of Distance Parameters
4.2. Improvement of the MCLM-LDO Method
4.3. Applicability of the DO-LDO Framework
4.4. Extensibility, Limitations, and Future Work
5. Conclusions
Author Contributions
Funding
Data Availability Statement
Acknowledgments
Conflicts of Interest
References
- Martin, R.; Sunley, P. Deconstructing Clusters: Chaotic Concept or Policy Panacea? J. Econ. Geogr. 2003, 3, 5–35. [Google Scholar] [CrossRef]
- Glaeser, E.L.; Kallal, H.D.; Scheinkman, J.A.; Shleifer, A. Growth in Cities. J. Polit. Econ. 1992, 100, 1126–1152. [Google Scholar] [CrossRef]
- Guo, D.; Jiang, K.; Xu, C.; Yang, X. Industrial Clustering, Income and Inequality in Rural China. World Dev. 2022, 154, 105878. [Google Scholar] [CrossRef]
- Porter, M.E. Competitive Advantage, Agglomeration Economies, and Regional Policy. Int. Reg. Sci. Rev. 1996, 19, 85–90. [Google Scholar] [CrossRef]
- Steijn, M.P.A.; Koster, H.R.A.; Van Oort, F.G. The Dynamics of Industry Agglomeration: Evidence from 44 Years of Coagglomeration Patterns. J. Urban Econ. 2022, 130, 103456. [Google Scholar] [CrossRef]
- Fang, L.; Drucker, J. How Spatially Concentrated Are Industrial Clusters?: A Meta-Analysis. J. Plan. Lit. 2021, 36, 526–542. [Google Scholar] [CrossRef]
- de Groot, H.L.F.; Poot, J.; Smit, M.J. Which Agglomeration Externalities Matter Most and Why? J. Econ. Surv. 2016, 30, 756–782. [Google Scholar] [CrossRef]
- Peng, C.; Elahi, E.; Fan, B.; Li, Z. Effect of High-Tech Manufacturing Co-Agglomeration and Producer Service Industry on Regional Innovation Efficiency. Front. Environ. Sci. 2022, 10, 942057. [Google Scholar] [CrossRef]
- Xu, D.; Yu, B.; Liang, L. High-Tech Industrial Agglomeration and Urban Innovation in China’s Yangtze River Delta Urban Agglomeration: From the Perspective of Industrial Structure Optimization and Industrial Attributes. Complexity 2022, 2022, 2555182. [Google Scholar] [CrossRef]
- Guo, X.; Guo, K.; Zheng, H. Industrial Agglomeration and Enterprise Innovation Sustainability: Empirical Evidence from the Chinese A-Share Market. Sustainability 2023, 15, 11660. [Google Scholar] [CrossRef]
- Du, H.; Ji, X.; Chuai, X. Spatial Differentiation and Influencing Factors of Water Pollution-Intensive Industries in the Yellow River Basin, China. Int. J. Environ. Res. Public Health 2022, 19, 497. [Google Scholar] [CrossRef] [PubMed]
- Zheng, H.; He, Y. How Does Industrial Co-Agglomeration Affect High-Quality Economic Development? Evidence from Chengdu-Chongqing Economic Circle in China. J. Clean Prod. 2022, 371, 133485. [Google Scholar] [CrossRef]
- Zhang, H.; Zhang, J.; Song, J. Analysis of the Threshold Effect of Agricultural Industrial Agglomeration and Industrial Structure Upgrading on Sustainable Agricultural Development in China. J. Clean Prod. 2022, 341, 130818. [Google Scholar] [CrossRef]
- Zhang, L.; Mu, R.; Hu, S.; Zhang, Q.; Wang, S. Impacts of Manufacturing Specialized and Diversified Agglomeration on the Eco-Innovation Efficiency—A Nonlinear Test from Dynamic Perspective. Sustainability 2021, 13, 3809. [Google Scholar] [CrossRef]
- Liu, X.; Zhang, X.; Sun, W. Does the Agglomeration of Urban Producer Services Promote Carbon Efficiency of Manufacturing Industry? Land Use Pol. 2022, 120, 106264. [Google Scholar] [CrossRef]
- Chen, Z.; Xu, W.; Zhao, Z. The Assessment of Industrial Agglomeration in China Based on NPP-VIIRS Nighttime Light Imagery and POI Data. Remote Sens. 2024, 16, 417. [Google Scholar] [CrossRef]
- Chain, C.P.; Santos, A.C.D.; Castro, L.G.D.; Prado, J.W.D. Bibliometric Analysis of The Quantitative Methods Applied to The Measurement of Industrial Clusters. J. Econ. Surv. 2019, 33, 60–84. [Google Scholar] [CrossRef]
- Borana, S.L.; Yadav, S.K. Urban Land-Use Susceptibility and Sustainability—Case Study. In Water, Land, and Forest Susceptibility and Sustainability; Chatterjee, U., Pradhan, B., Kumar, S., Saha, S., Zakwan, M., Fath, B.D., Fiscus, D., Eds.; Academic Press: Cambridge, MA, USA, 2023; Volume 2, pp. 261–286. [Google Scholar]
- Brakman, S.; Garretsen, H.; Zhao, Z. Spatial Concentration of Manufacturing Firms in China. Pap. Reg. Sci. 2017, 96, S179–S205. [Google Scholar] [CrossRef]
- Duranton, G.; Overman, H.G. Testing for Localization Using Micro-Geographic Data. Rev. Econ. Stud. 2005, 72, 1077–1106. [Google Scholar] [CrossRef]
- Zhang, X.; Yao, J.; Sila-Nowicka, K.; Song, C. Geographic Concentration of Industries in Jiangsu, China: A Spatial Point Pattern Analysis Using Micro-Geographic Data. Ann. Reg. Sci. 2021, 66, 439–461. [Google Scholar] [CrossRef]
- Marcon, E.; Puech, F. A Typology of Distance-Based Measures of Spatial Concentration. Reg. Sci. Urban Econ. 2017, 62, 56–67. [Google Scholar] [CrossRef]
- Huang, Y.; Sheng, K.; Sun, W. Influencing Factors of Manufacturing Agglomeration in the Beijing-Tianjin-Hebei Region Based on Enterprise Big Data. Acta Geogr. Sin. 2022, 77, 1953–1970. [Google Scholar] [CrossRef]
- Rosenthal, S.S.; Strange, W.C. How Close Is Close? The Spatial Reach of Agglomeration Economies. J. Econ. Perspect. 2020, 34, 27–49. [Google Scholar] [CrossRef]
- Verstraten, P.; Verweij, G.; Zwaneveld, P.J. Complexities in the Spatial Scope of Agglomeration Economies. J. Reg. Sci. 2019, 59, 29–55. [Google Scholar] [CrossRef]
- Cainelli, G.; Ganau, R. Distance-Based Agglomeration Externalities and Neighbouring Firms’ Characteristics. Reg. Stud. 2018, 52, 922–933. [Google Scholar] [CrossRef]
- Shao, S.; Tian, Z.; Yang, L. High Speed Rail and Urban Service Industry Agglomeration: Evidence from China’s Yangtze River Delta Region. J. Transp. Geogr. 2017, 64, 174–183. [Google Scholar] [CrossRef]
- Chen, Y.; Zhu, Z.; Cheng, S. Industrial Agglomeration and Haze Pollution: Evidence from China. Sci. Total Environ. 2022, 845, 157392. [Google Scholar] [CrossRef] [PubMed]
- Wei, W.; Zhao, L.; Liu, Z. How Does Industrial Agglomeration Affect Firms’ Energy Consumption? Empirical Evidence from China. Indoor Built Environ. 2023, 32, 1523–1536. [Google Scholar] [CrossRef]
- Hu, S.; Song, W.; Li, C.; Zhang, C.H. The Evolution of Industrial Agglomerations and Specialization in the Yangtze River Delta from 1990–2018: An Analysis Based on Firm-Level Big Data. Sustainability 2019, 11, 5811. [Google Scholar] [CrossRef]
- Chen, W.; Zhang, S.; Kong, D.; Zou, T.; Zhang, Y.; Cheshmehzangi, A. Spatio-Temporal Evolution and Influencing Factors of China’s ICT Service Industry. Sci. Rep. 2023, 13, 9703. [Google Scholar] [CrossRef]
- Briant, A.; Combes, P.P.; Lafourcade, M. Dots to Boxes: Do the Size and Shape of Spatial Units Jeopardize Economic Geography Estimations? J. Urban Econ. 2010, 67, 287–302. [Google Scholar] [CrossRef]
- Lennert, M. The Use of Exhaustive Micro-Data Firm Databases for Economic Geography: The Issues of Geocoding and Usability in the Case of the Amadeus Database. ISPRS Int. J. Geo-Inf. 2015, 4, 62–86. [Google Scholar] [CrossRef]
- Marcon, E.; Puech, F. Evaluating the Geographic Concentration of Industries Using Distance-Based Methods. J. Econ. Geogr. 2003, 3, 409–428. [Google Scholar] [CrossRef]
- Buzard, K.; Carlino, G.A.; Hunt, R.M.; Carr, J.K.; Smith, T.E. The Agglomeration of American R&D Labs. J. Urban Econ. 2017, 101, 14–26. [Google Scholar] [CrossRef]
- Ripley, B.D. The Second-Order Analysis of Stationary Point Process. J. Appl. Probab. 1976, 13, 255–266. [Google Scholar] [CrossRef]
- Besag, J.E. Comments on Ripley’s Paper. J. R. Stat. Soc. B 1977, 39, 193–195. [Google Scholar]
- Barff, R.A. Industrial Clustering and the Organization of Production: A Point Pattern Analysis of Manufacturing in Cincinnati, Ohio. Ann. Assoc. Am. Geogr. 1987, 77, 89–103. [Google Scholar] [CrossRef]
- Duranton, G.; Overman, H.G. Exploring the Detailed Location Patterns of U.K. Manufacturing Industries Using MicroGeographic Data. J. Reg. Sci. 2008, 48, 213–243. [Google Scholar] [CrossRef]
- Marcon, E.; Puech, F. Measures of the Geographic Concentration of Industries: Improving Distance-Based Methods. J. Econ. Geogr. 2010, 10, 745–762. [Google Scholar] [CrossRef]
- Lang, G.; Marcon, E.; Puech, F. Distance-Based Measures of Spatial Concentration: Introducing a Relative Density Function. Ann. Reg. Sci. 2020, 64, 243–265. [Google Scholar] [CrossRef]
- Kukuliač, P.; Horák, J. W Function: A New Distance-Based Measure of Spatial Distribution of Economic Activities. Geogr. Anal. 2017, 49, 199–214. [Google Scholar] [CrossRef]
- Li, J.; Zhang, W.; Yu, J.; Chen, H. Industrial Spatial Agglomeration Using Distance-Based Approach in Beijing, China. Chin. Geogr. Sci. 2015, 25, 698–712. [Google Scholar] [CrossRef]
- Laajimi, R.; Le Gallo, J.; Benammou, S. What Geographical Concentration of Industries in the Tunisian Sahel? Empirical Evidence Using Distance-Based Measures. Tijdschr. Econ. Soc. Geogr. 2020, 111, 738–757. [Google Scholar] [CrossRef]
- Huang, Y.; Sun, W. Spatiotemporal Change Characteristics and Differences of Manufacturing Industry Agglomeration in the Beijing-Tianjin-Hebei Region. Prog. Geogr. 2021, 40, 2011–2024. [Google Scholar] [CrossRef]
- Yang, S.; Ma, D.; Shen, Z.; Wen, L.; Dong, L. The Impact of Artificial Intelligence Industry Agglomeration on Economic Complexity. Ekon. Istraz. 2023, 36, 1420–1448. [Google Scholar] [CrossRef]
- Barlet, M.; Briant, A.; Crusson, L. Location Patterns of Service Industries in France: A Distance-Based Approach. Reg. Sci. Urban Econ. 2013, 43, 338–351. [Google Scholar] [CrossRef]
- Behrens, K.; Bougna, T. An Anatomy of the Geographical Concentration of Canadian Manufacturing Industries. Reg. Sci. Urban Econ. 2015, 51, 47–69. [Google Scholar] [CrossRef]
- Aleksandrova, E.; Behrens, K.; Kuznetsova, M. Manufacturing (Co)Agglomeration in a Transition Country: Evidence from Russia. J. Reg. Sci. 2019, 60, 88–128. [Google Scholar] [CrossRef]
- de Almeida, E.T.; Da Mota Silveira Neto, R.; de Moraes Rocha, R. Manufacturing Location Patterns in Brazil. Pap. Reg. Sci. 2022, 101, 839–873. [Google Scholar] [CrossRef]
- de Almeida, E.T.; Neto, R.D.M.S.; Rocha, R.D.M. The Spatial Scope of Agglomeration Economies in Brazil. J. Reg. Sci. 2023, 63, 820–863. [Google Scholar] [CrossRef]
- Mori, T.; Smith, T.E. A Probabilistic Modeling Approach to the Detection of Industrial Agglomerations. J. Econ. Geogr. 2014, 14, 547–588. [Google Scholar] [CrossRef]
- Maddah, L.; Arauzo-Carod, J.-M.; López, F.A. Detection of Geographical Clustering: Cultural and Creative Industries in Barcelona. Eur. Plan. Stud. 2023, 31, 554–575. [Google Scholar] [CrossRef]
- Yu, Z.; Zu, J.; Xu, Y.; Chen, Y.; Liu, X. Spatial and Functional Organizations of Industrial Agglomerations in China’s Greater Bay Area. Env. Plan. B-Urban Anal. City Sci. 2022, 49, 1995–2010. [Google Scholar] [CrossRef]
- Yu, Z.; Xiao, Z.; Liu, X. Characterizing the Spatial-Functional Network of Regional Industrial Agglomerations: A Data-Driven Case Study in China’s Greater Bay Area. Appl. Geogr. 2023, 152, 102901. [Google Scholar] [CrossRef]
- Lu, C.; Yu, C.; Xin, Y.; Zhang, W. Spatial Distribution Characteristics and Influencing Factors on the Retail Industry in the Central Urban Area of Lanzhou City at the Scale of Daily Living Circles. ISPRS Int. J. Geo-Inf. 2023, 12, 344. [Google Scholar] [CrossRef]
- Carr, J.K.; Fontanella, S.A.; Tribby, C.P. Identifying American Beer Geographies: A Multiscale Core-Cluster Analysis of U.S. Breweries. Prof. Geogr. 2019, 71, 185–196. [Google Scholar] [CrossRef]
- Buzard, K.; Carlino, G.A.; Hunt, R.M.; Carr, J.K.; Smith, T.E. Localized Knowledge Spillovers: Evidence from the Spatial Clustering of R&D Labs and Patent Citations. Reg. Sci. Urban Econ. 2020, 81, 103490. [Google Scholar] [CrossRef]
- Silverman, B.W. Density Estimation for Statistics and Data Analysis, 1st ed.; Routledge: London, UK, 2018; ISBN 978-1-315-14091-9. [Google Scholar]
- National Public Service Platform for Standards Information. Available online: https://openstd.samr.gov.cn/ (accessed on 2 March 2023).
- Wu, K.; Wang, Y.; Zhang, H.; Liu, Y.; Ye, Y.; Yue, X. The Pattern, Evolution, and Mechanism of Venture Capital Flows in the Guangdong-Hong Kong-Macao Greater Bay Area, China. J. Geogr. Sci. 2022, 32, 2085–2104. [Google Scholar] [CrossRef]
- Hui, E.C.M.; Li, X.; Chen, T.; Lang, W. Deciphering the Spatial Structure of China’s Megacity Region: A New Bay Area—The Guangdong-Hong Kong-Macao Greater Bay Area in the Making. Cities 2020, 105, 102168. [Google Scholar] [CrossRef]
- Chen, S.; Zhang, F.; Zhang, Z.; Yu, S.; Qiu, A.; Liu, S.; Zhao, X. Multi-Scale Massive Points Fast Clustering Based on Hierarchical Density Spanning Tree. ISPRS Int. J. Geo-Inf. 2023, 12, 24. [Google Scholar] [CrossRef]


| Datasets | Number of Clusters | Scale of Clusters | Number of Core Firms | Number of Sparse Firms |
|---|---|---|---|---|
| Dataset 1 | 1 | 10 | 100 | 100 |
| Dataset 2 | 2 | 6 | 100 | 50 |
| Indicators | Baseline Method 1 | Baseline Method 2 | Baseline Method 3 | MCLM-LDO Method |
|---|---|---|---|---|
| 0.99 | 1 | 1 | 1 | |
| 0.78 | 0.78 | 0.85 | 0.89 | |
| 0.885 | 0.89 | 0.925 | 0.945 | |
| Computational time (s) | 24.21 | 0.16 | 24.82 | 0.15 |
| Indicators | Baseline Method 1 | Baseline Method 2 | Baseline Method 3 | MCLM-LDO Method |
|---|---|---|---|---|
| 1 | 1 | 1 | 1 | |
| 0.9 | 1 | 0.22 | 1 | |
| 0.967 | 1 | 0.74 | 1 | |
| Computational time (s) | 18.6 | 0.12 | 19.1 | 0.11 |
| Indicators | 2000 | 2005 | 2010 | 2015 | 2020 | 2022 |
|---|---|---|---|---|---|---|
| 0.58 | 0.68 | 0.67 | 0.58 | 0.47 | 0.38 | |
| (km) | 45 | 46 | 54 | 57 | 57 | 55 |
| Cluster Numbers | (%) | |||||||||||
|---|---|---|---|---|---|---|---|---|---|---|---|---|
| 2000 | 2005 | 2010 | 2015 | 2020 | 2022 | 2000 | 2005 | 2010 | 2015 | 2020 | 2022 | |
| I | 0.0287 | 0.0435 | 0.0347 | 0.0210 | 0.0124 | 0.0108 | 7.45 | 6.97 | 5.90 | 4.24 | 3.26 | 3.26 |
| II | - | - | - | 0.0096 | 0.0068 | 0.0062 | - | - | - | 1.08 | 2.91 | 2.64 |
| III | - | - | - | - | - | 0.0049 | - | - | - | - | - | 0.60 |
| IV | - | - | - | - | - | 0.0049 | - | - | - | - | - | 0.58 |
| V | 0.0203 | - | - | - | - | - | 3.66 | - | - | - | - | - |
| Indicators | ||||||||
|---|---|---|---|---|---|---|---|---|
| Baseline Method 1 | Baseline Method 2 | Baseline Method 3 | MCLM-LDO Method | Baseline Method 1 | Baseline Method 2 | Baseline Method 3 | MCLM-LDO Method | |
| 1 | 0.89 | 1 | 0.99 | 1 | 0.5 | 1 | 0.77 | |
| 0.96 | 1 | 0.84 | 1 | 0.08 | 1 | 0 | 1 | |
| 0.987 | 0.927 | 0.947 | 0.993 | 0.693 | 0.67 | 0.667 | 0.85 | |
Disclaimer/Publisher’s Note: The statements, opinions and data contained in all publications are solely those of the individual author(s) and contributor(s) and not of MDPI and/or the editor(s). MDPI and/or the editor(s) disclaim responsibility for any injury to people or property resulting from any ideas, methods, instructions or products referred to in the content. |
© 2024 by the authors. Licensee MDPI, Basel, Switzerland. This article is an open access article distributed under the terms and conditions of the Creative Commons Attribution (CC BY) license (https://creativecommons.org/licenses/by/4.0/).
Share and Cite
Huang, Y.; Zhuo, L.; Cao, J. An Integrated Duranton and Overman Index and Local Duranton and Overman Index Framework for Industrial Spatial Agglomeration Pattern Analysis. ISPRS Int. J. Geo-Inf. 2024, 13, 116. https://doi.org/10.3390/ijgi13040116
Huang Y, Zhuo L, Cao J. An Integrated Duranton and Overman Index and Local Duranton and Overman Index Framework for Industrial Spatial Agglomeration Pattern Analysis. ISPRS International Journal of Geo-Information. 2024; 13(4):116. https://doi.org/10.3390/ijgi13040116
Chicago/Turabian StyleHuang, Yupu, Li Zhuo, and Jingjing Cao. 2024. "An Integrated Duranton and Overman Index and Local Duranton and Overman Index Framework for Industrial Spatial Agglomeration Pattern Analysis" ISPRS International Journal of Geo-Information 13, no. 4: 116. https://doi.org/10.3390/ijgi13040116
APA StyleHuang, Y., Zhuo, L., & Cao, J. (2024). An Integrated Duranton and Overman Index and Local Duranton and Overman Index Framework for Industrial Spatial Agglomeration Pattern Analysis. ISPRS International Journal of Geo-Information, 13(4), 116. https://doi.org/10.3390/ijgi13040116