
Mapmaking Process Reading from Local Distortions in Historical Maps: A Geographically Weighted Bidimensional Regression Analysis of a Japanese Castle Map

Abstract
:1. Introduction
1.1. Background
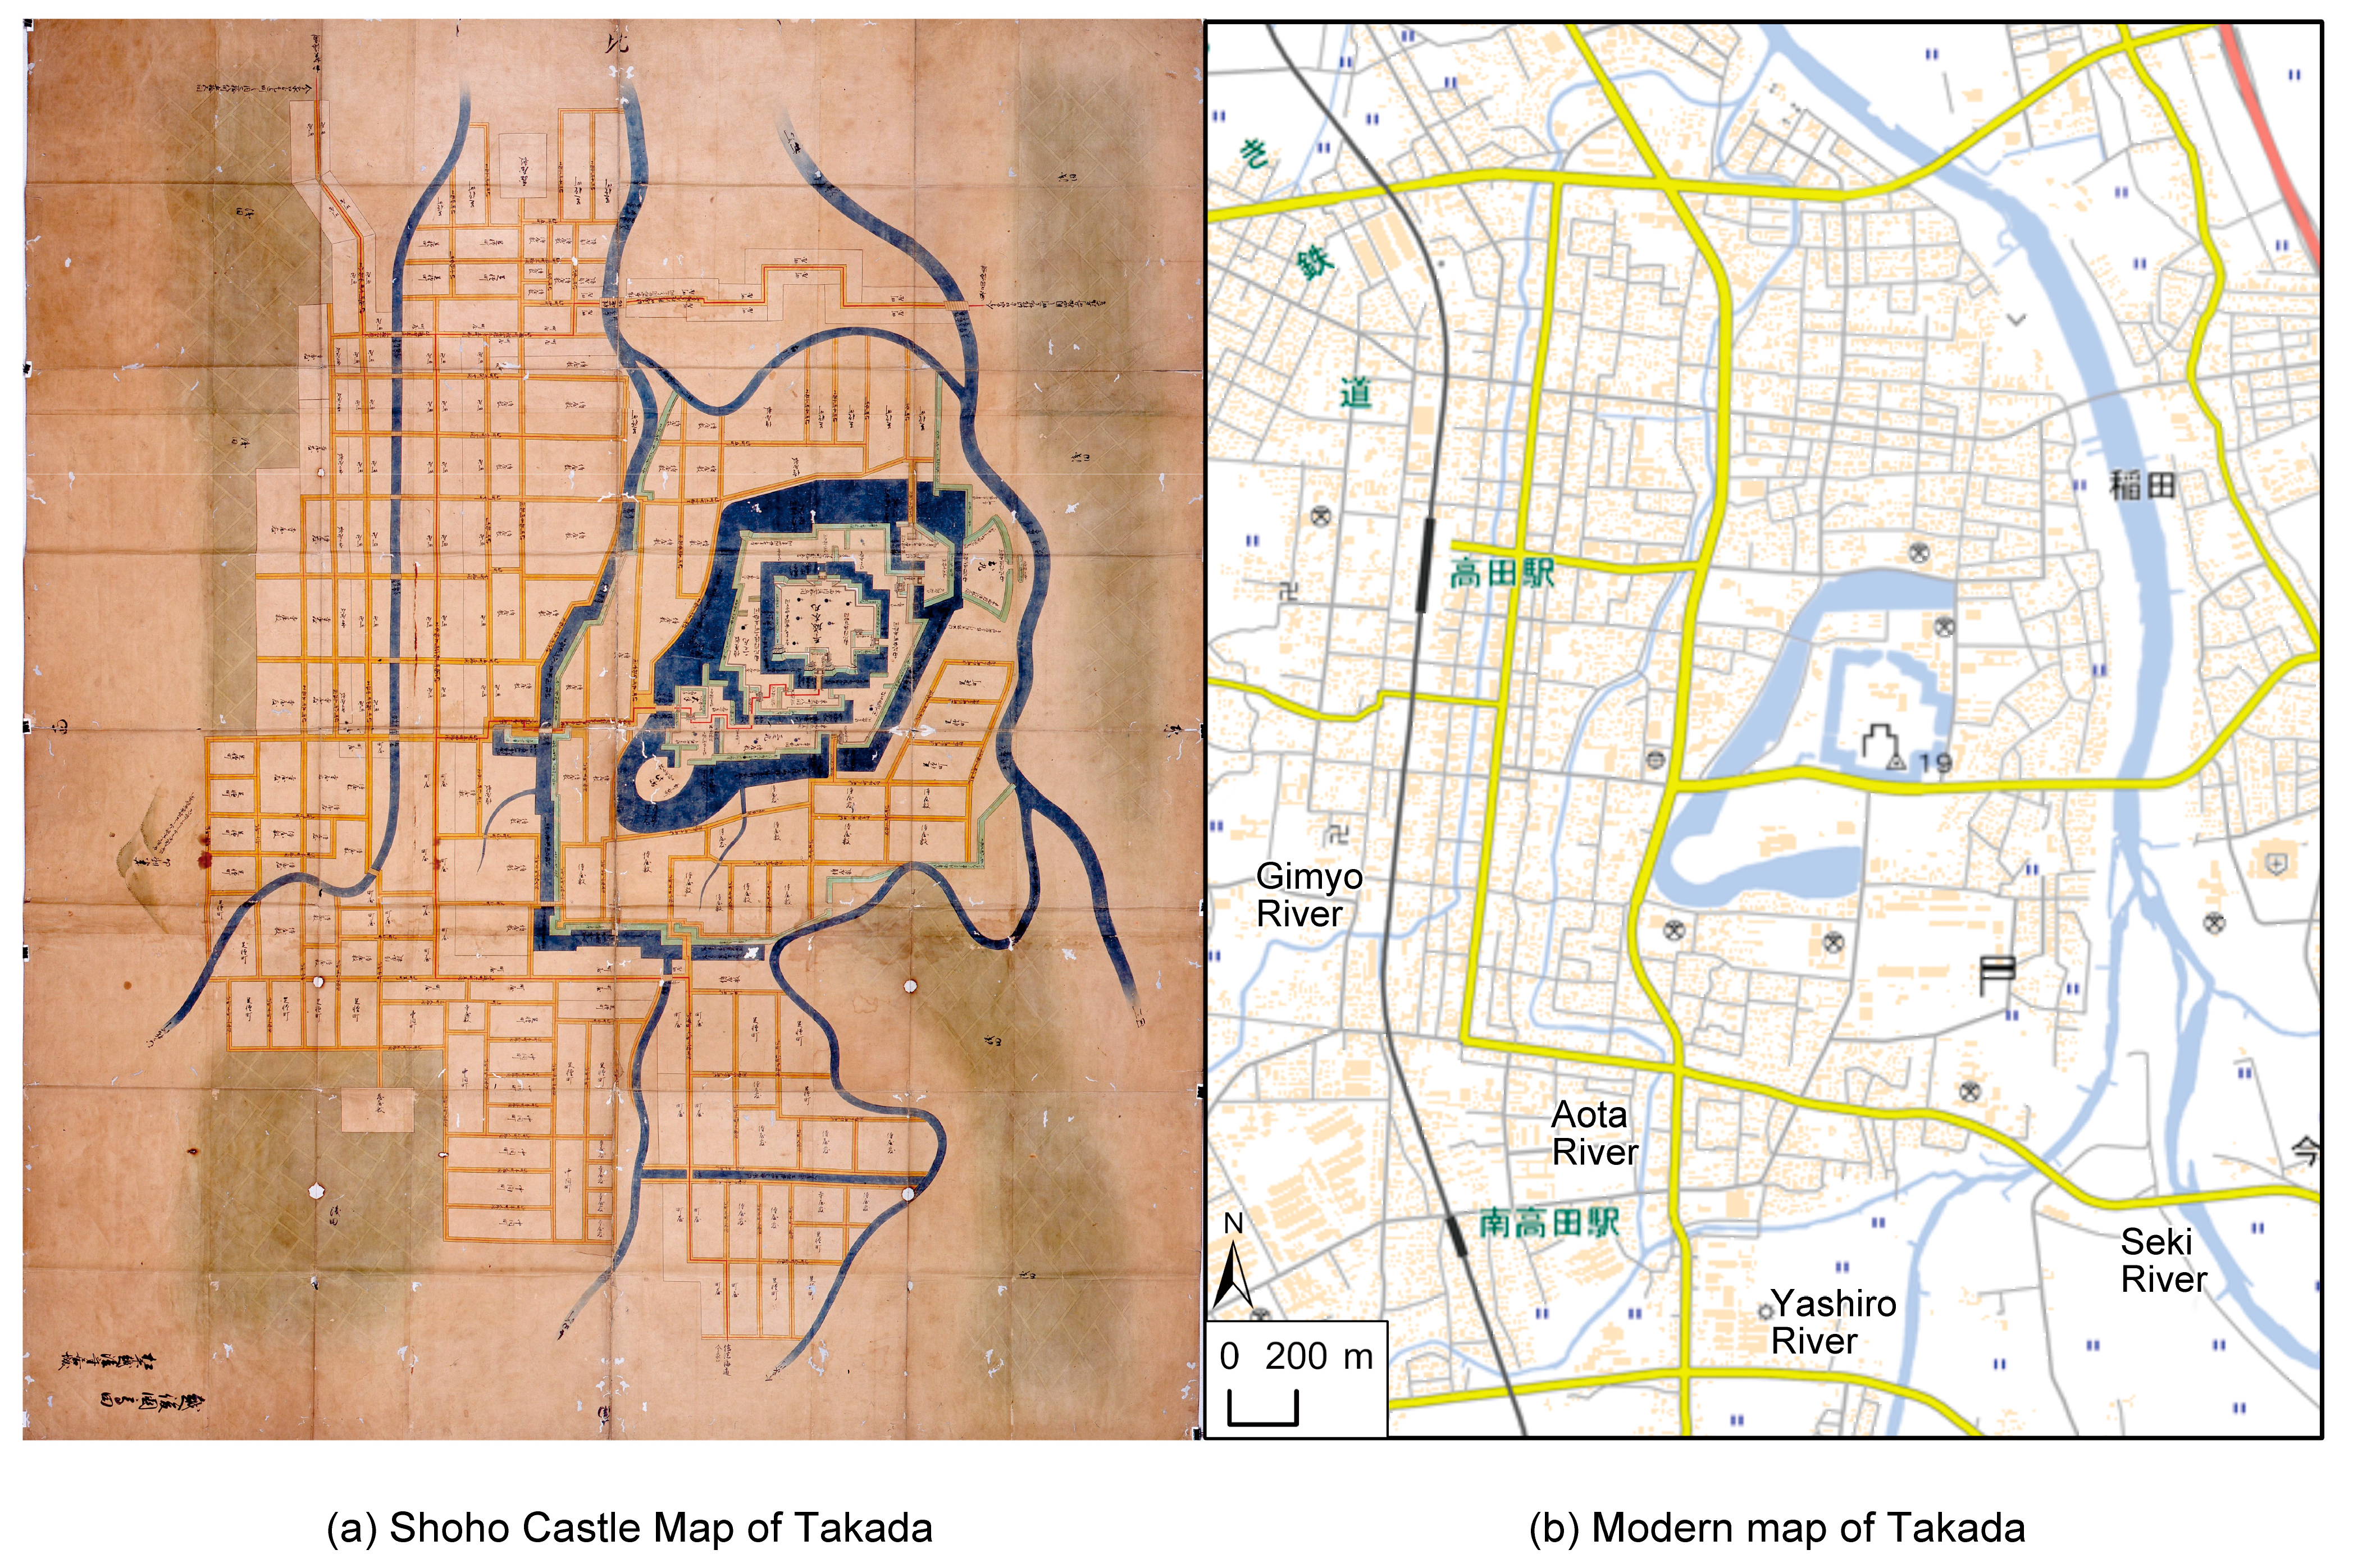
1.2. Shoho Castle Maps
1.3. Distortion of the Shoho Castle Maps
2. Materials and Methods
2.1. Materials
2.2. Methods
3. Results
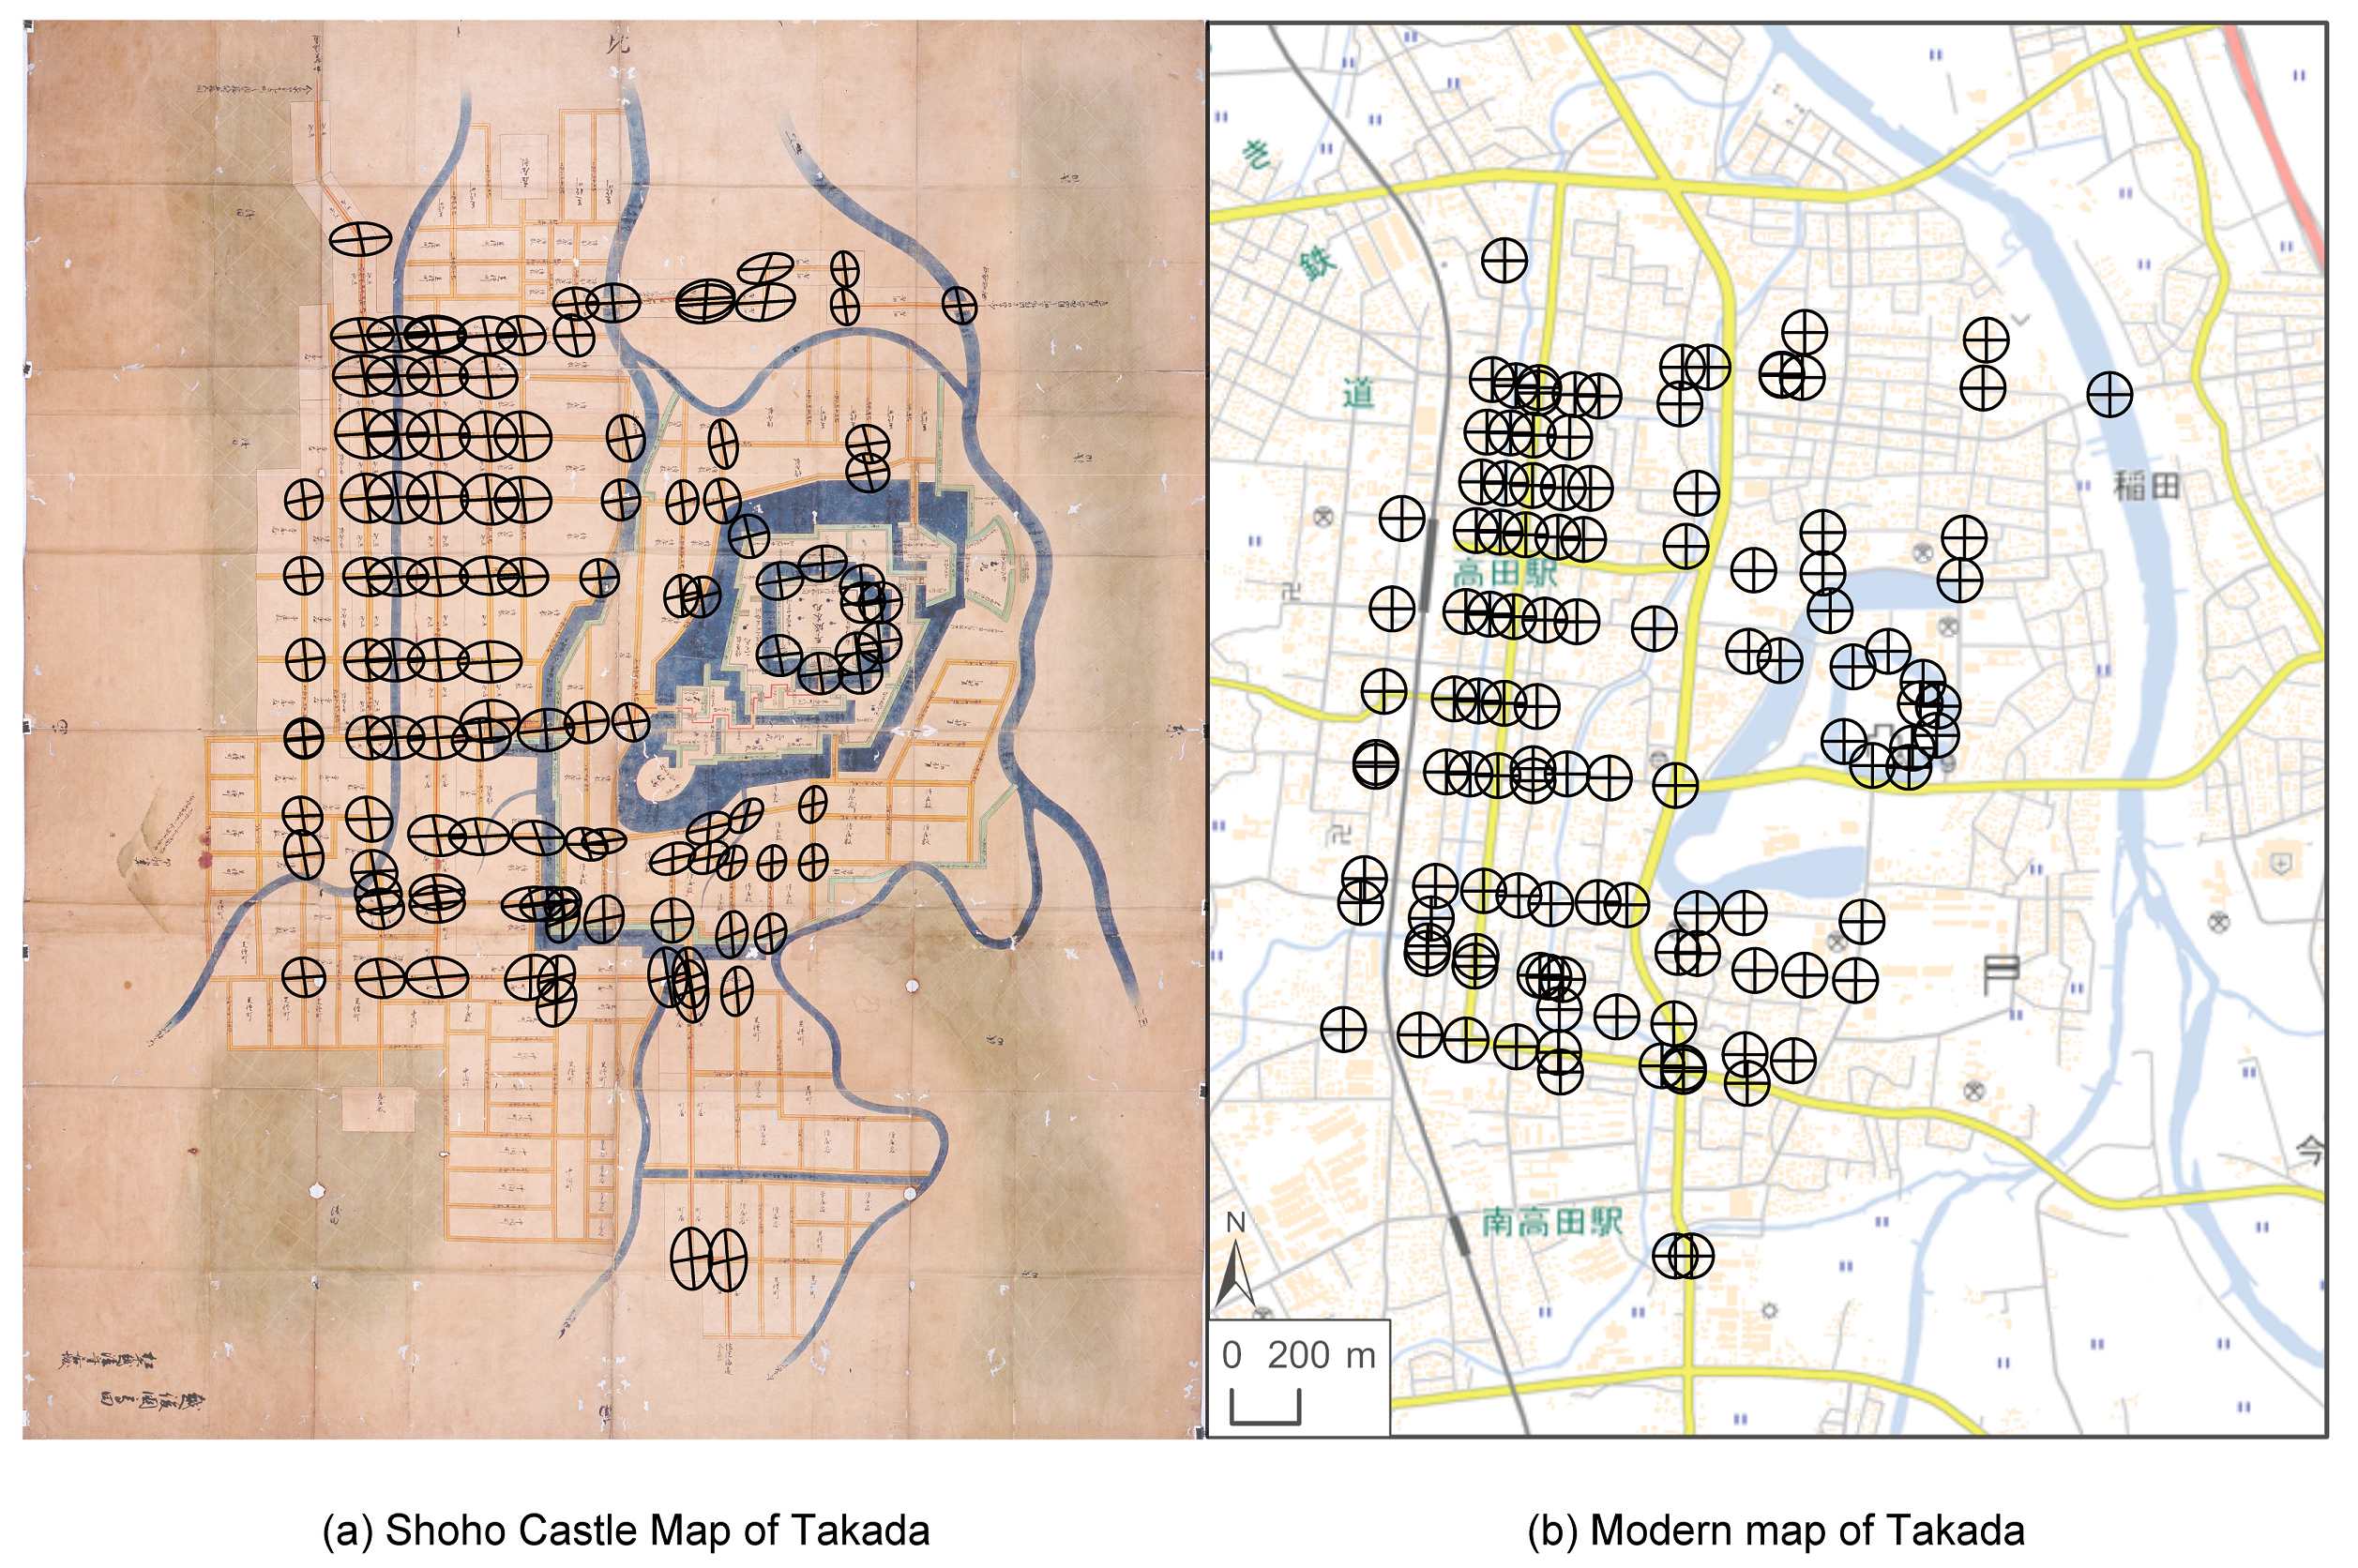
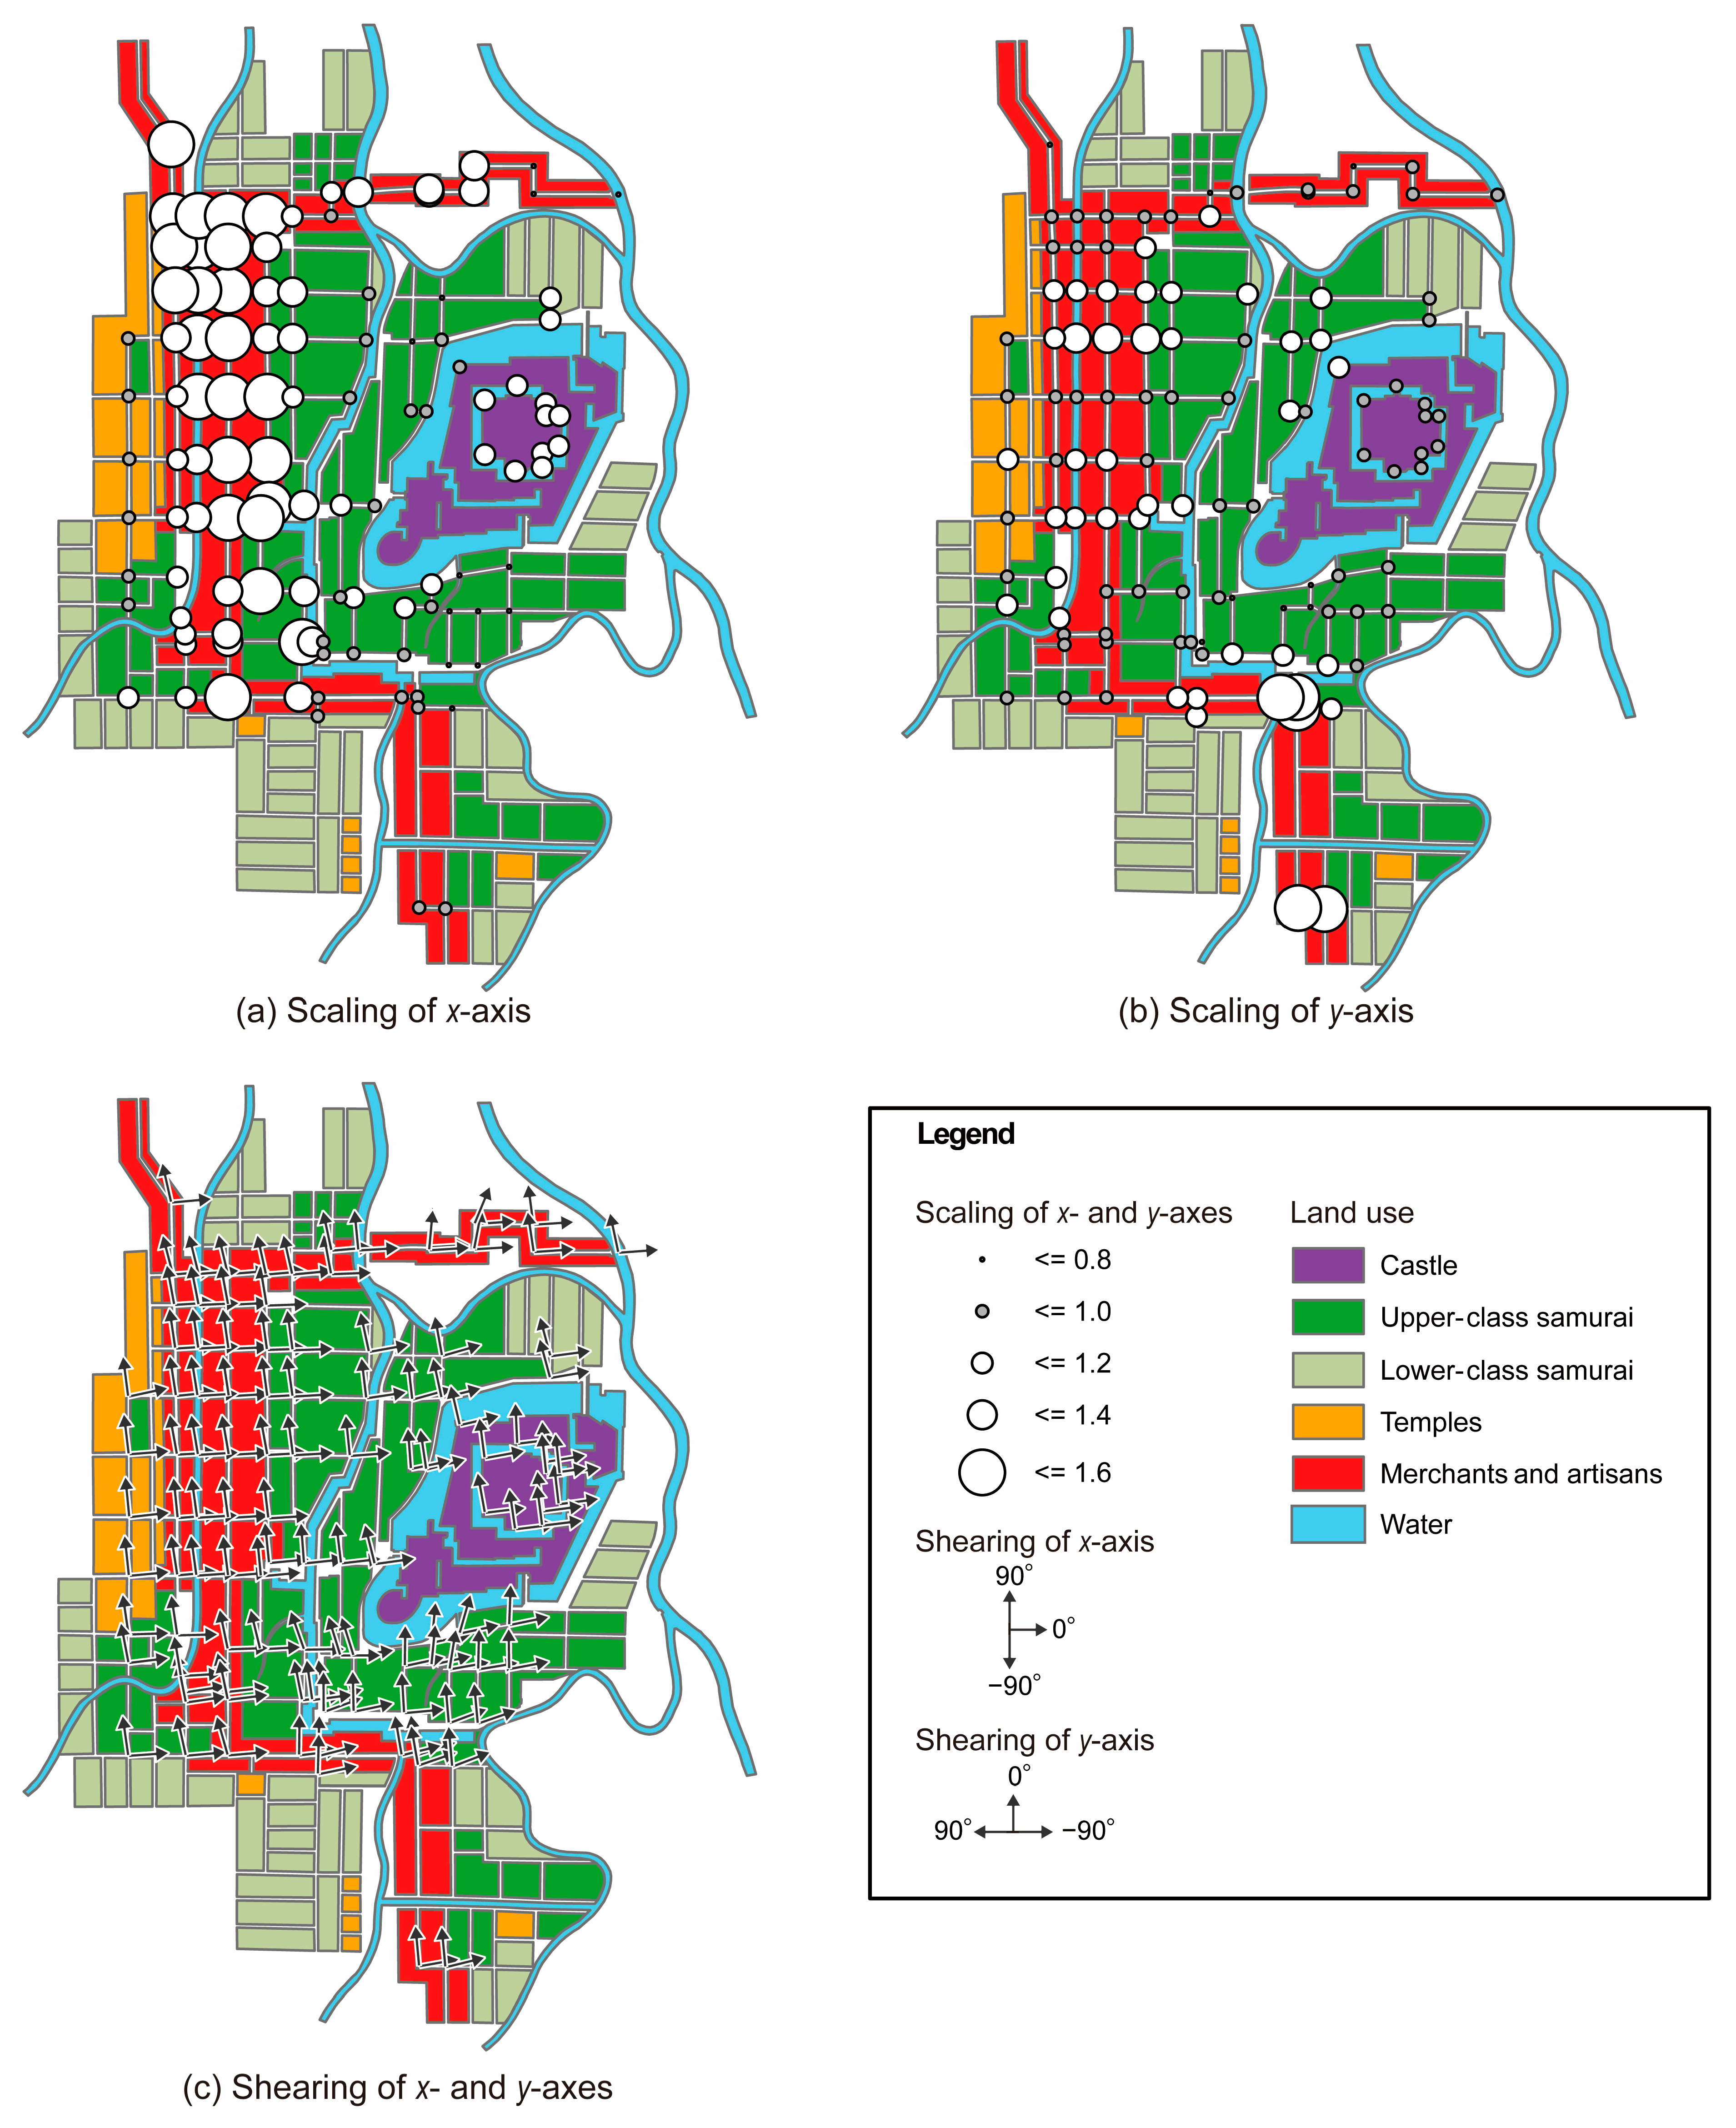
3.1. Visualization of Local Distortions
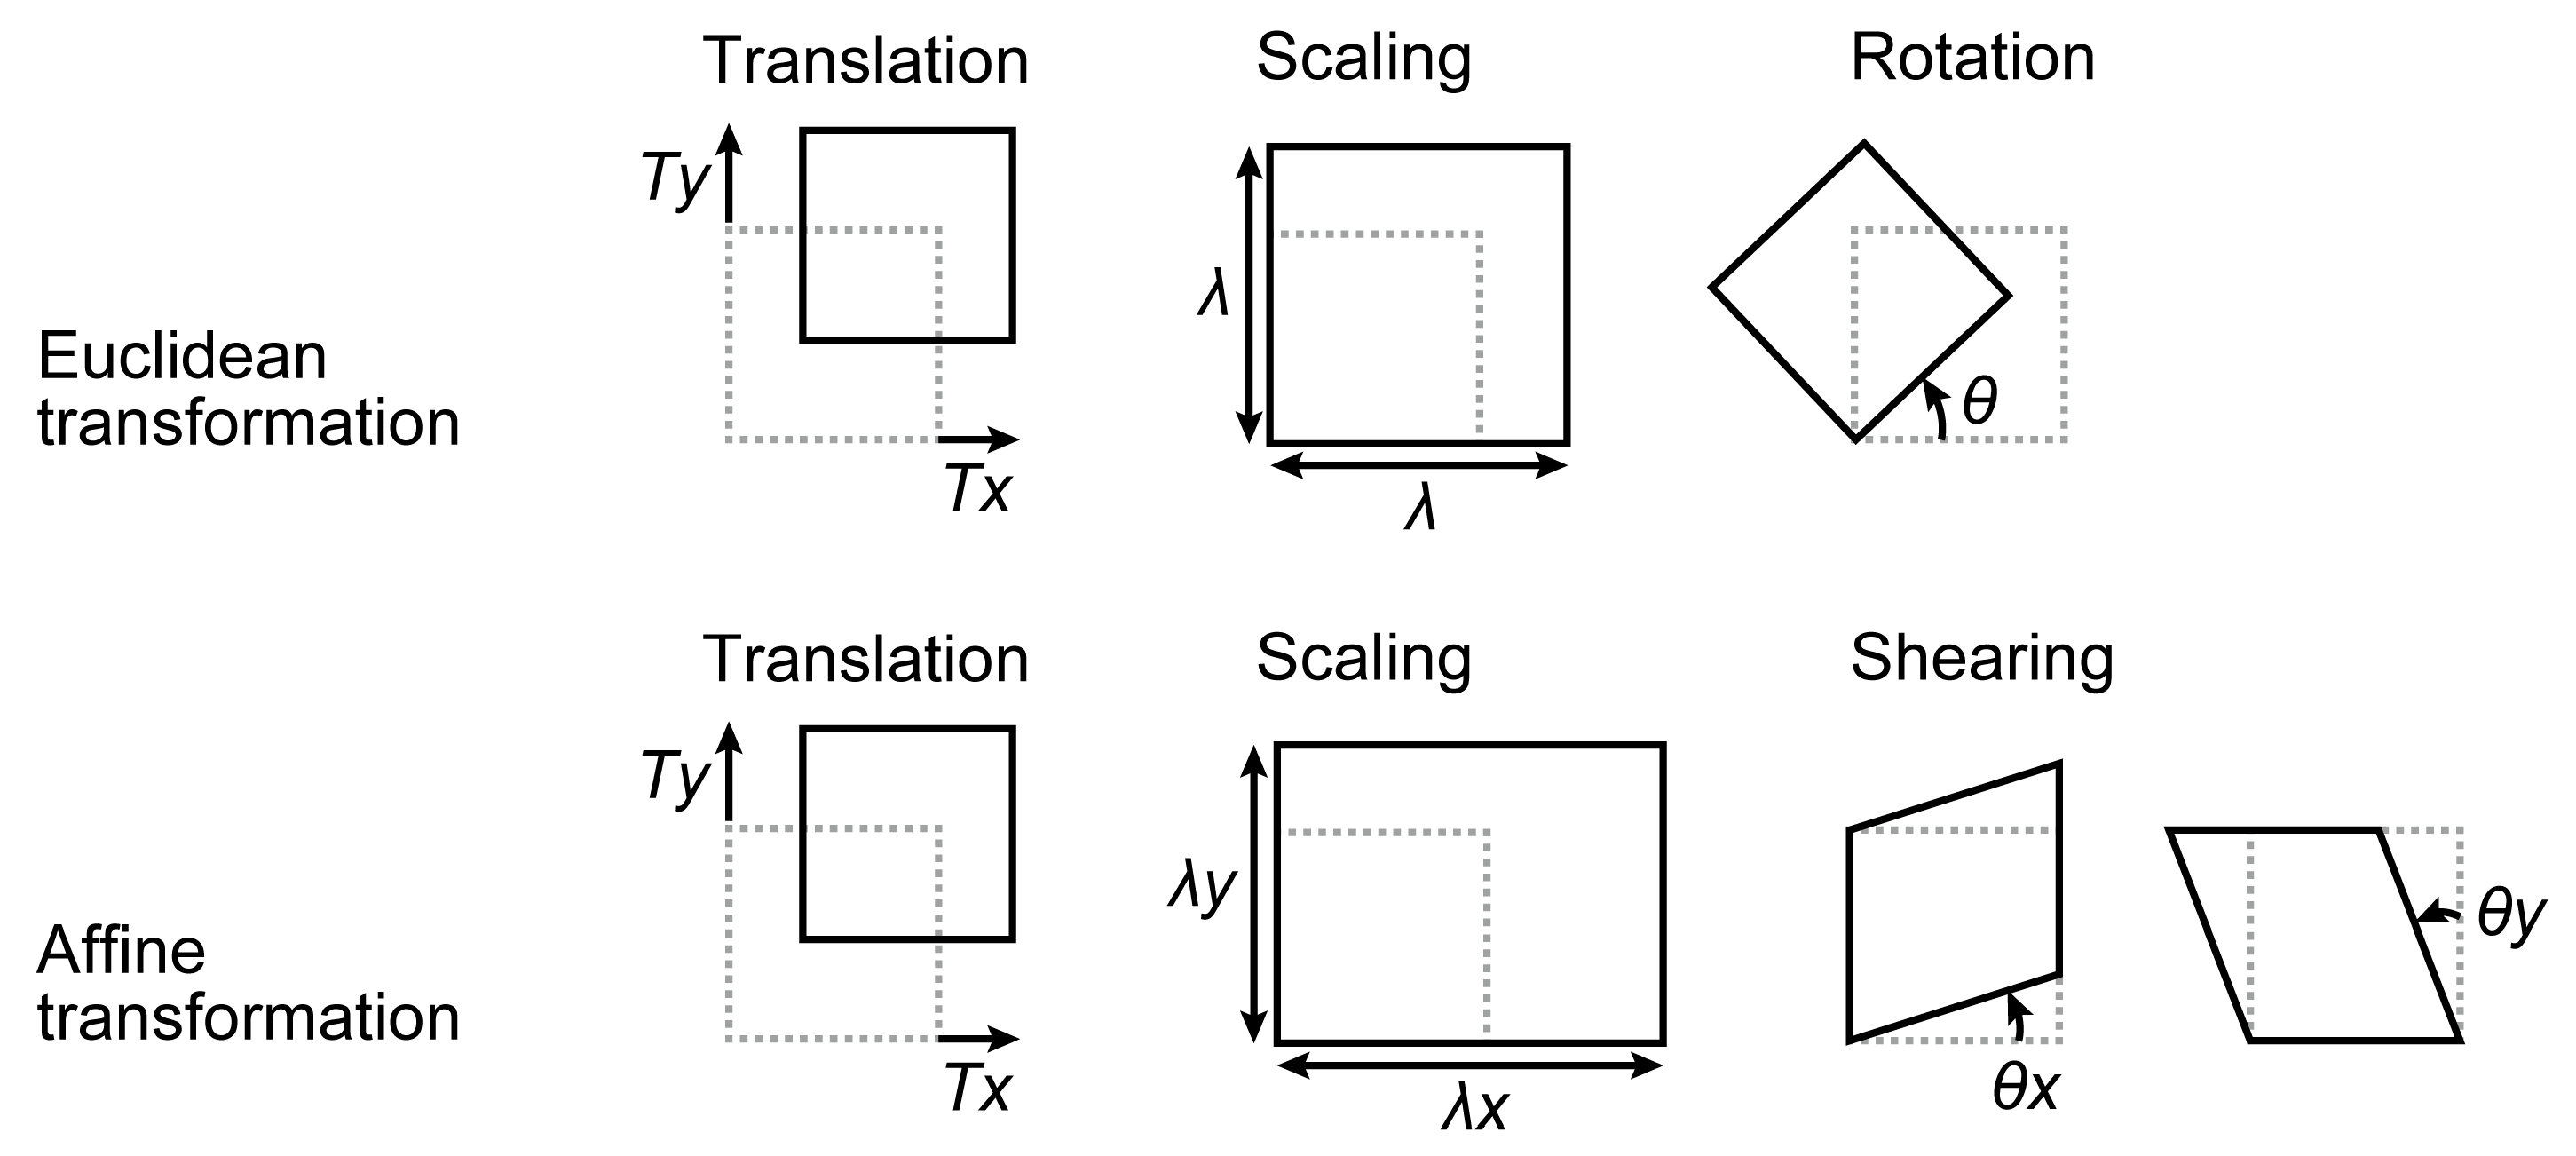
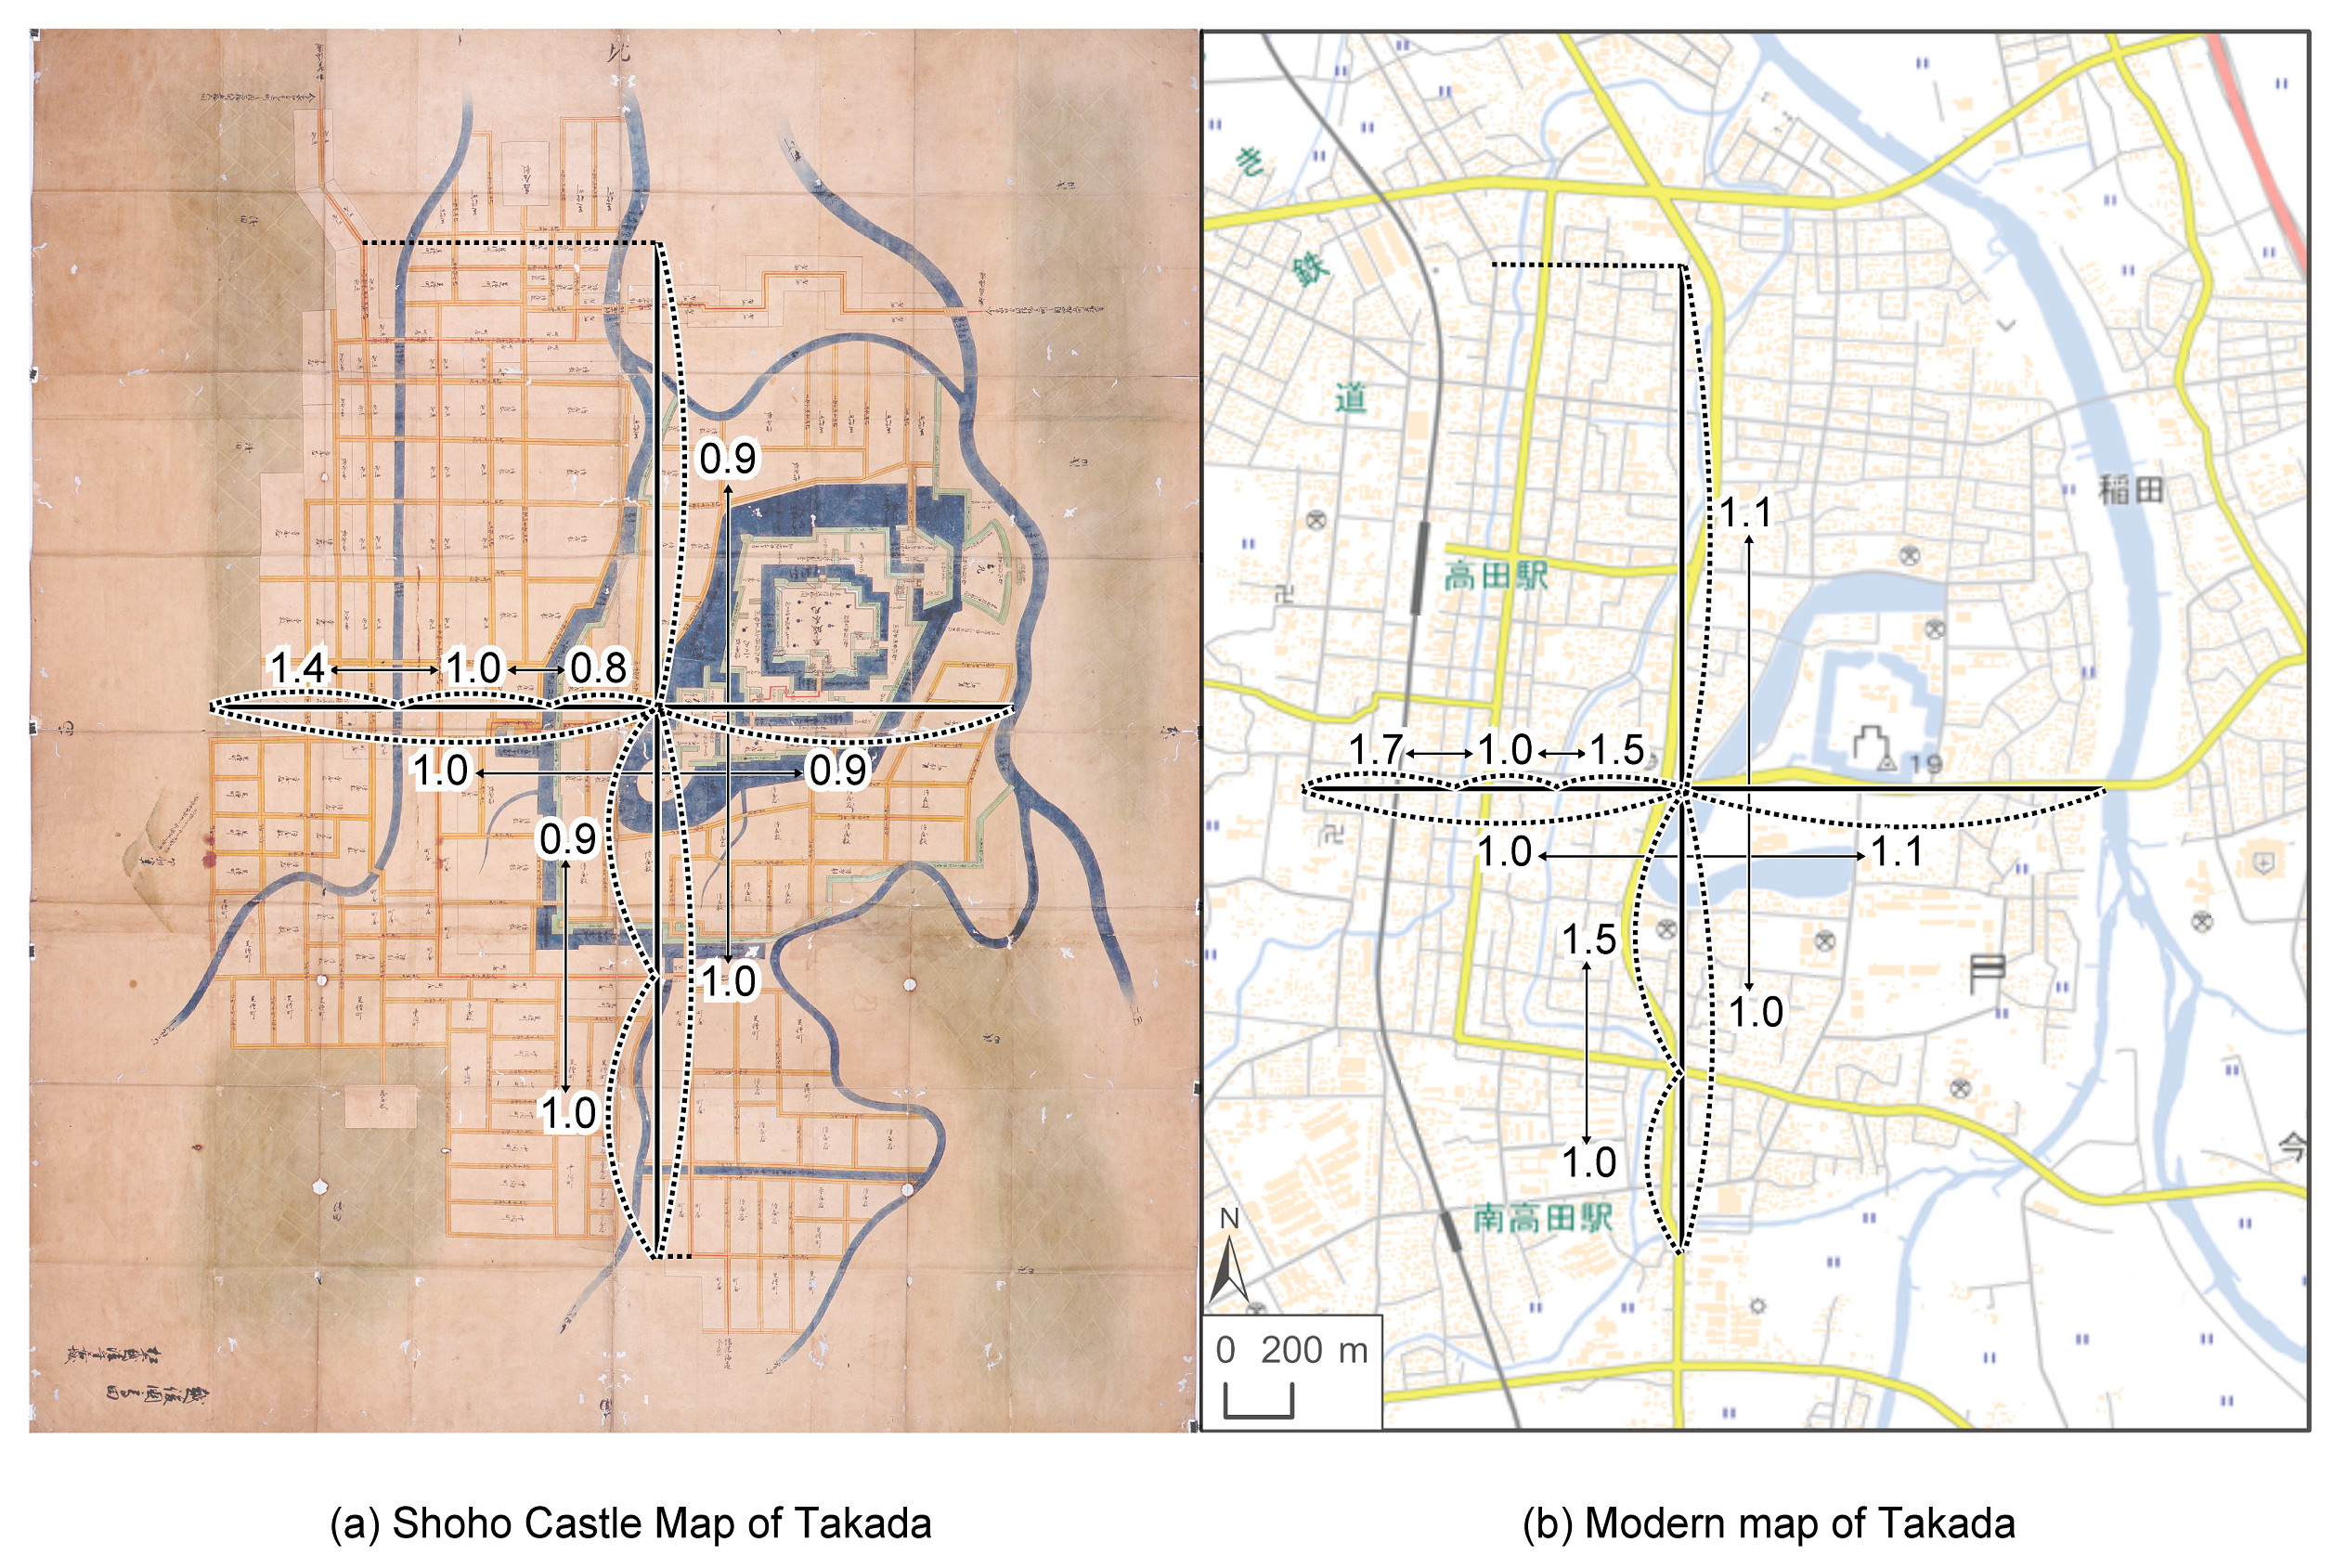
3.2. Scaling
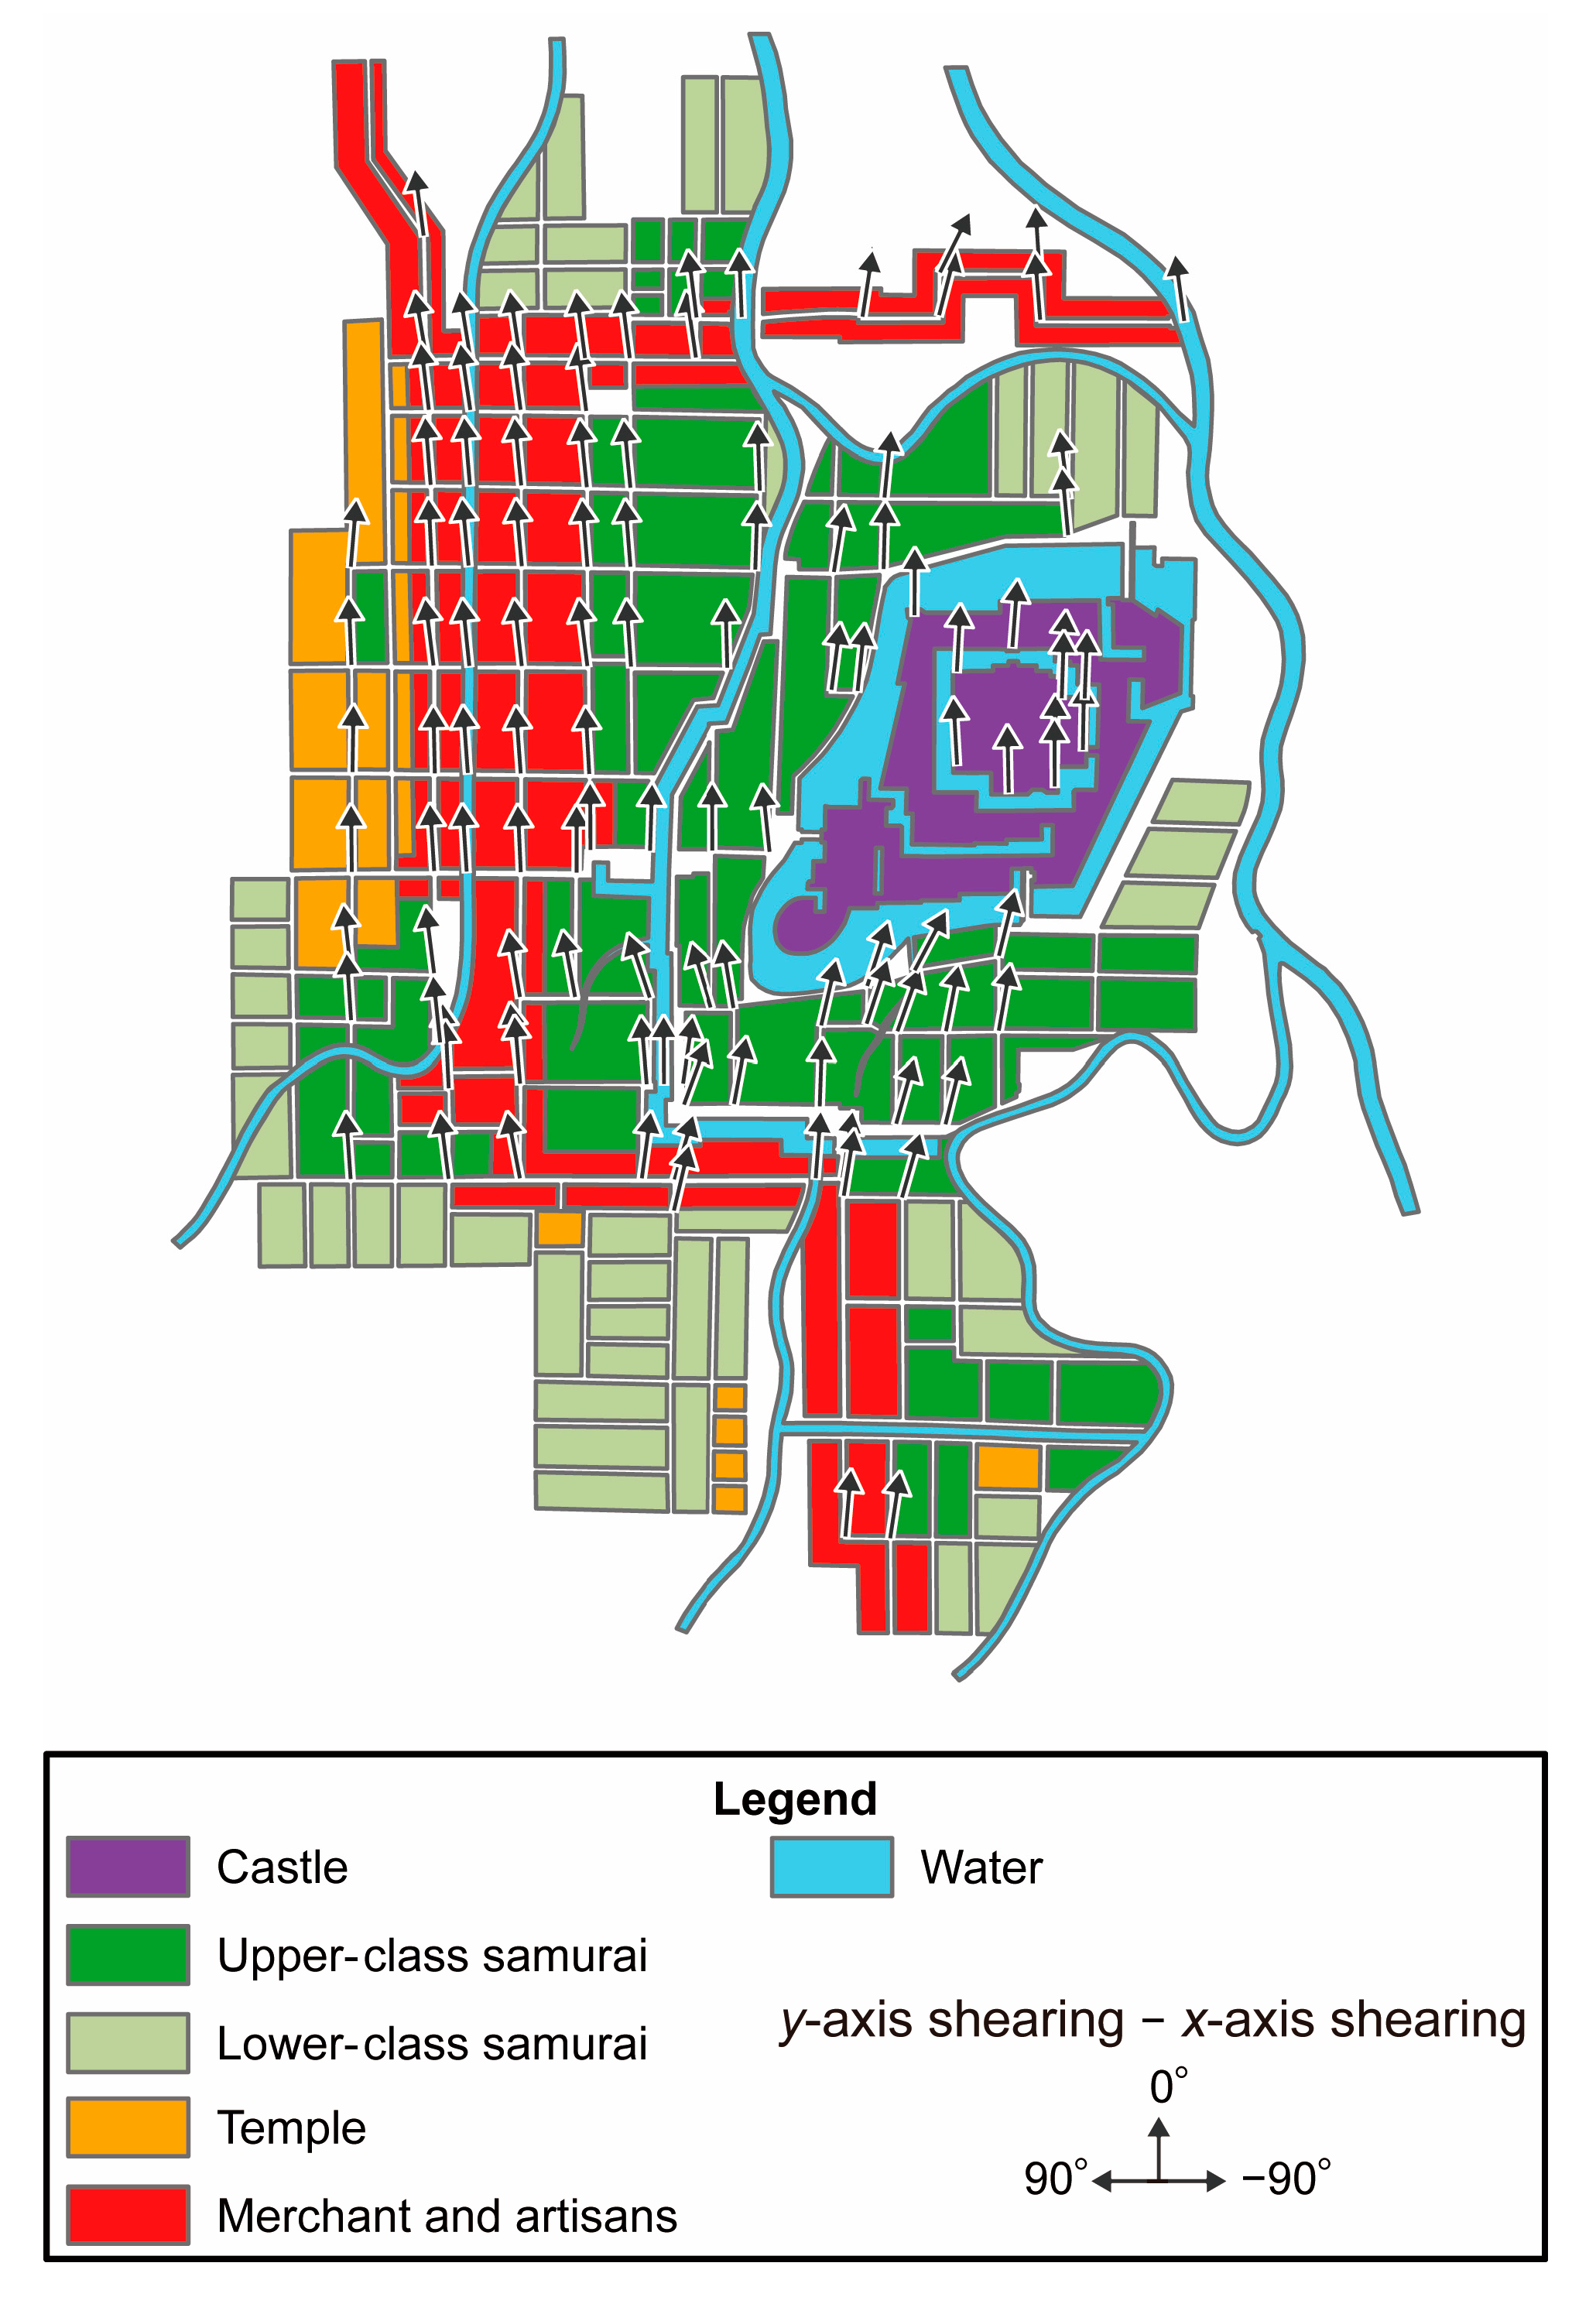
3.3. Shearing
4. Discussion
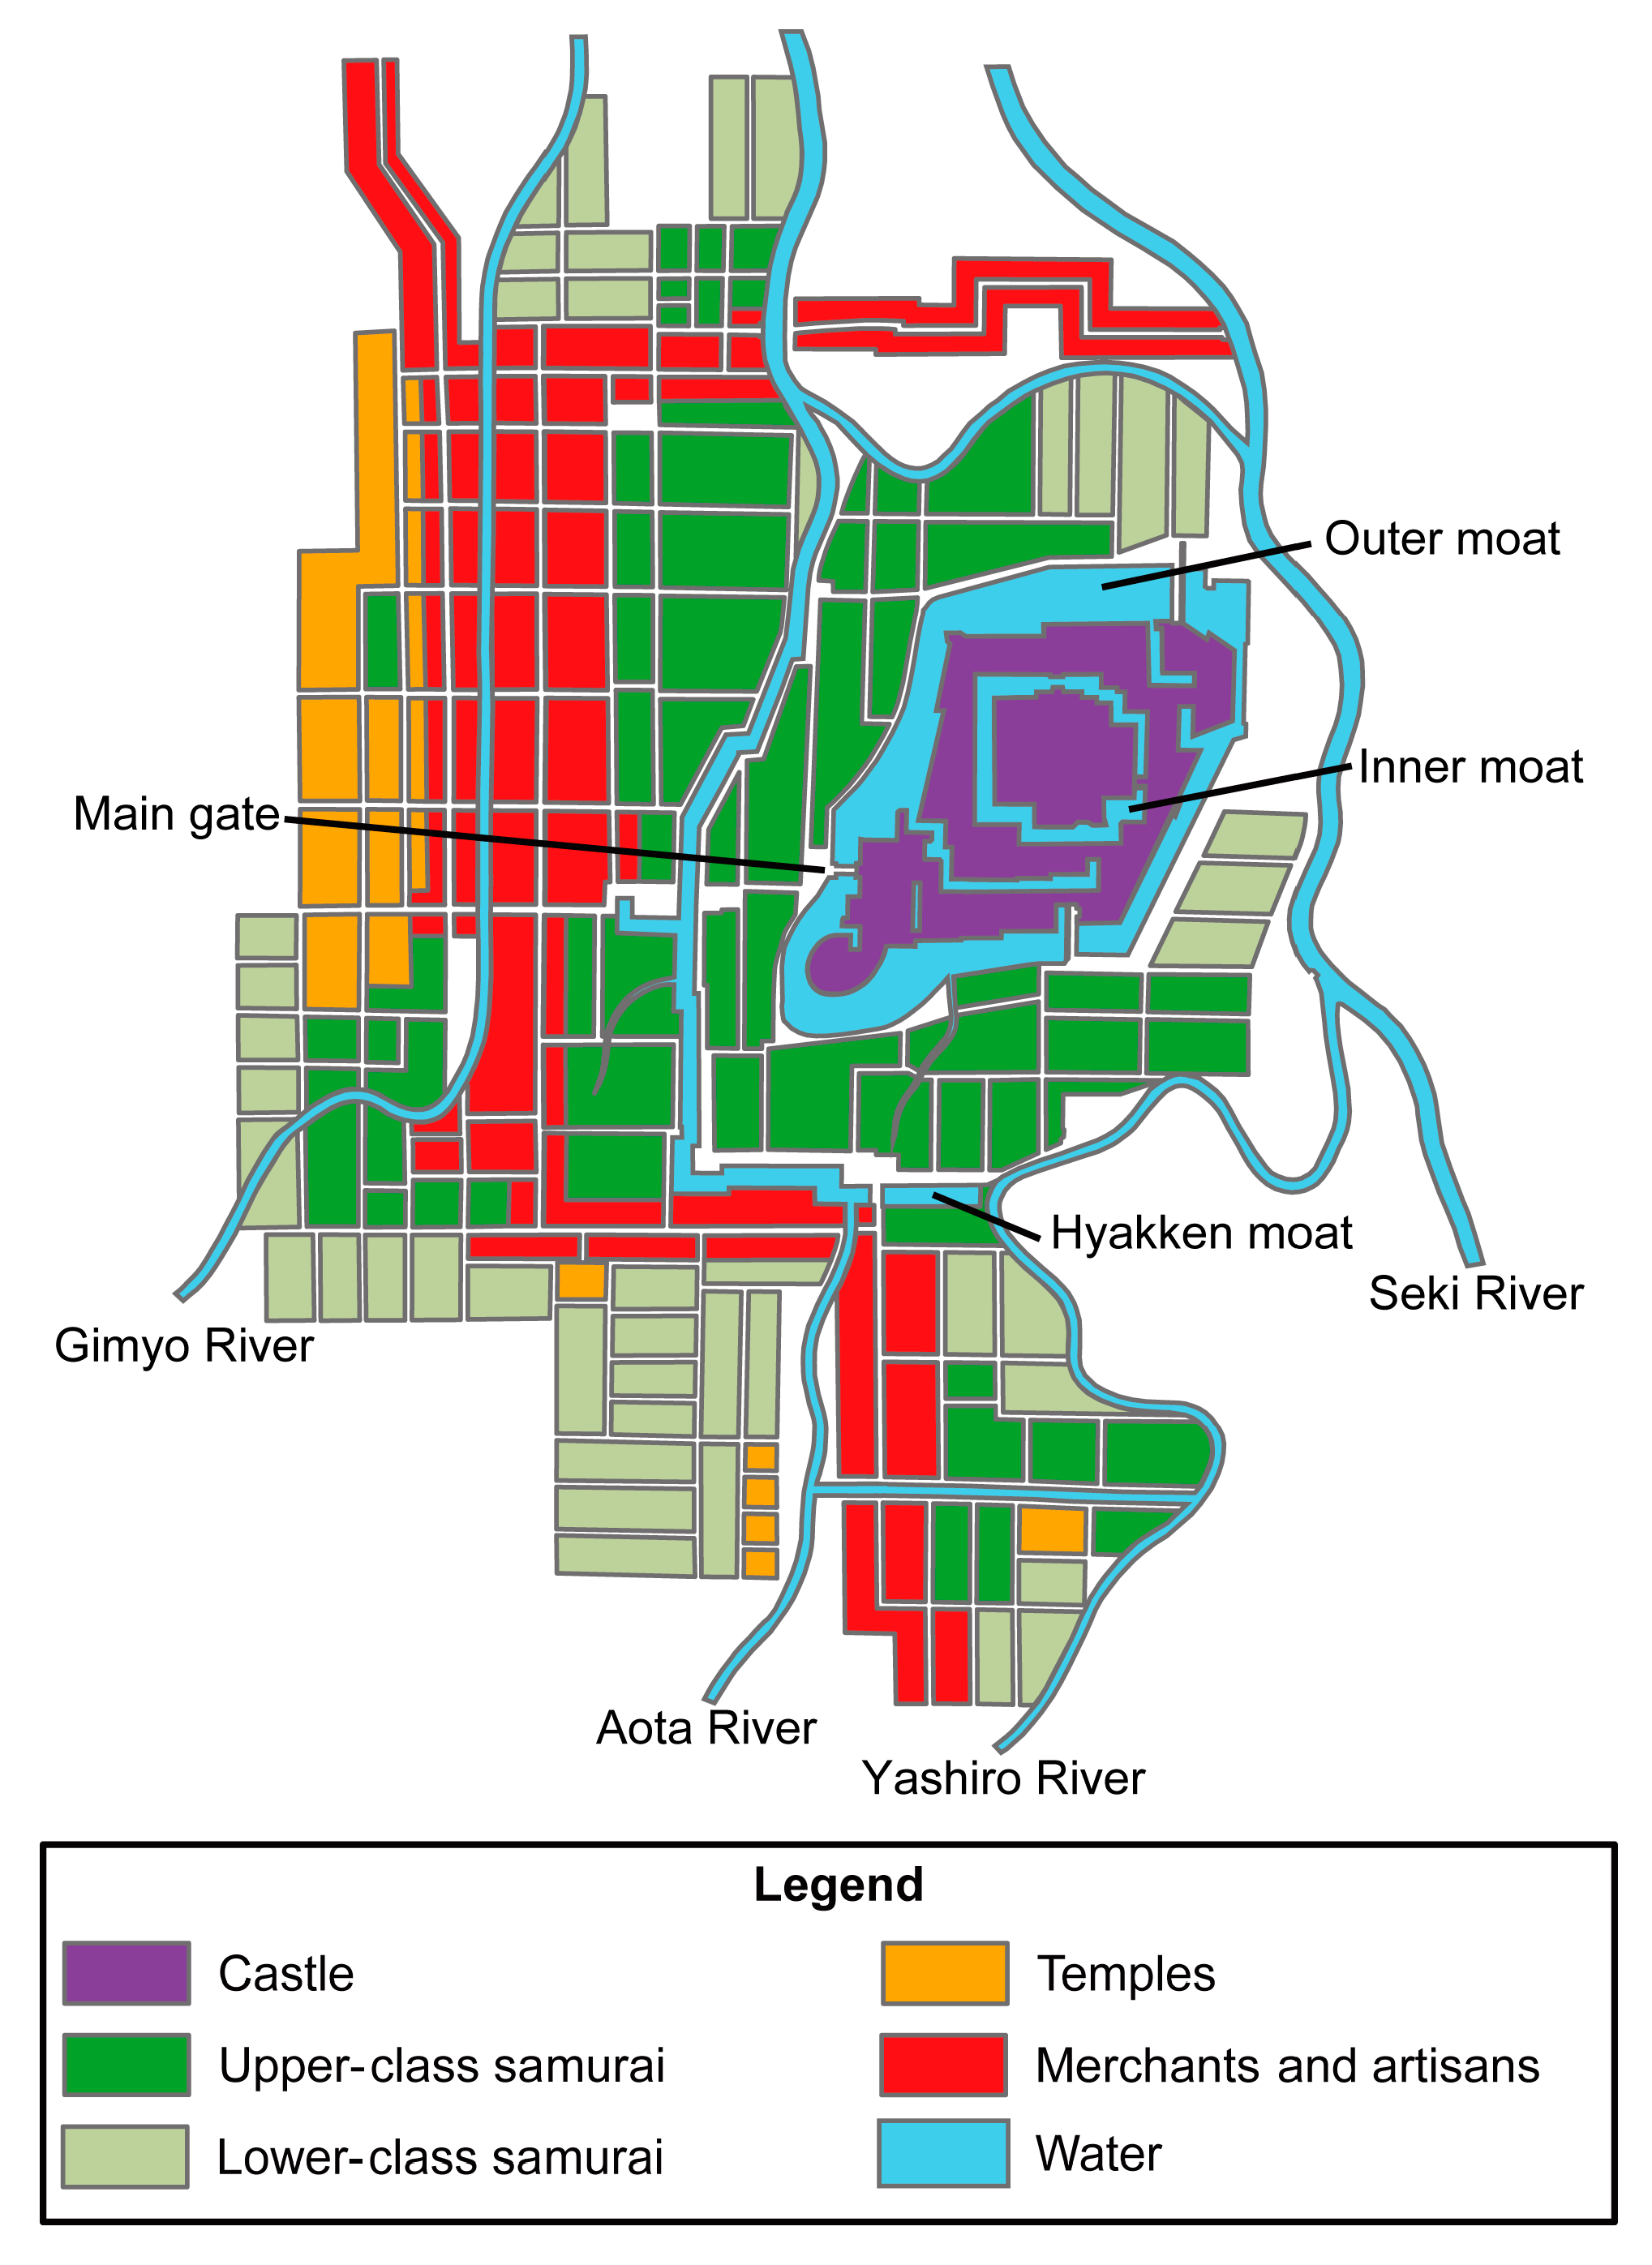
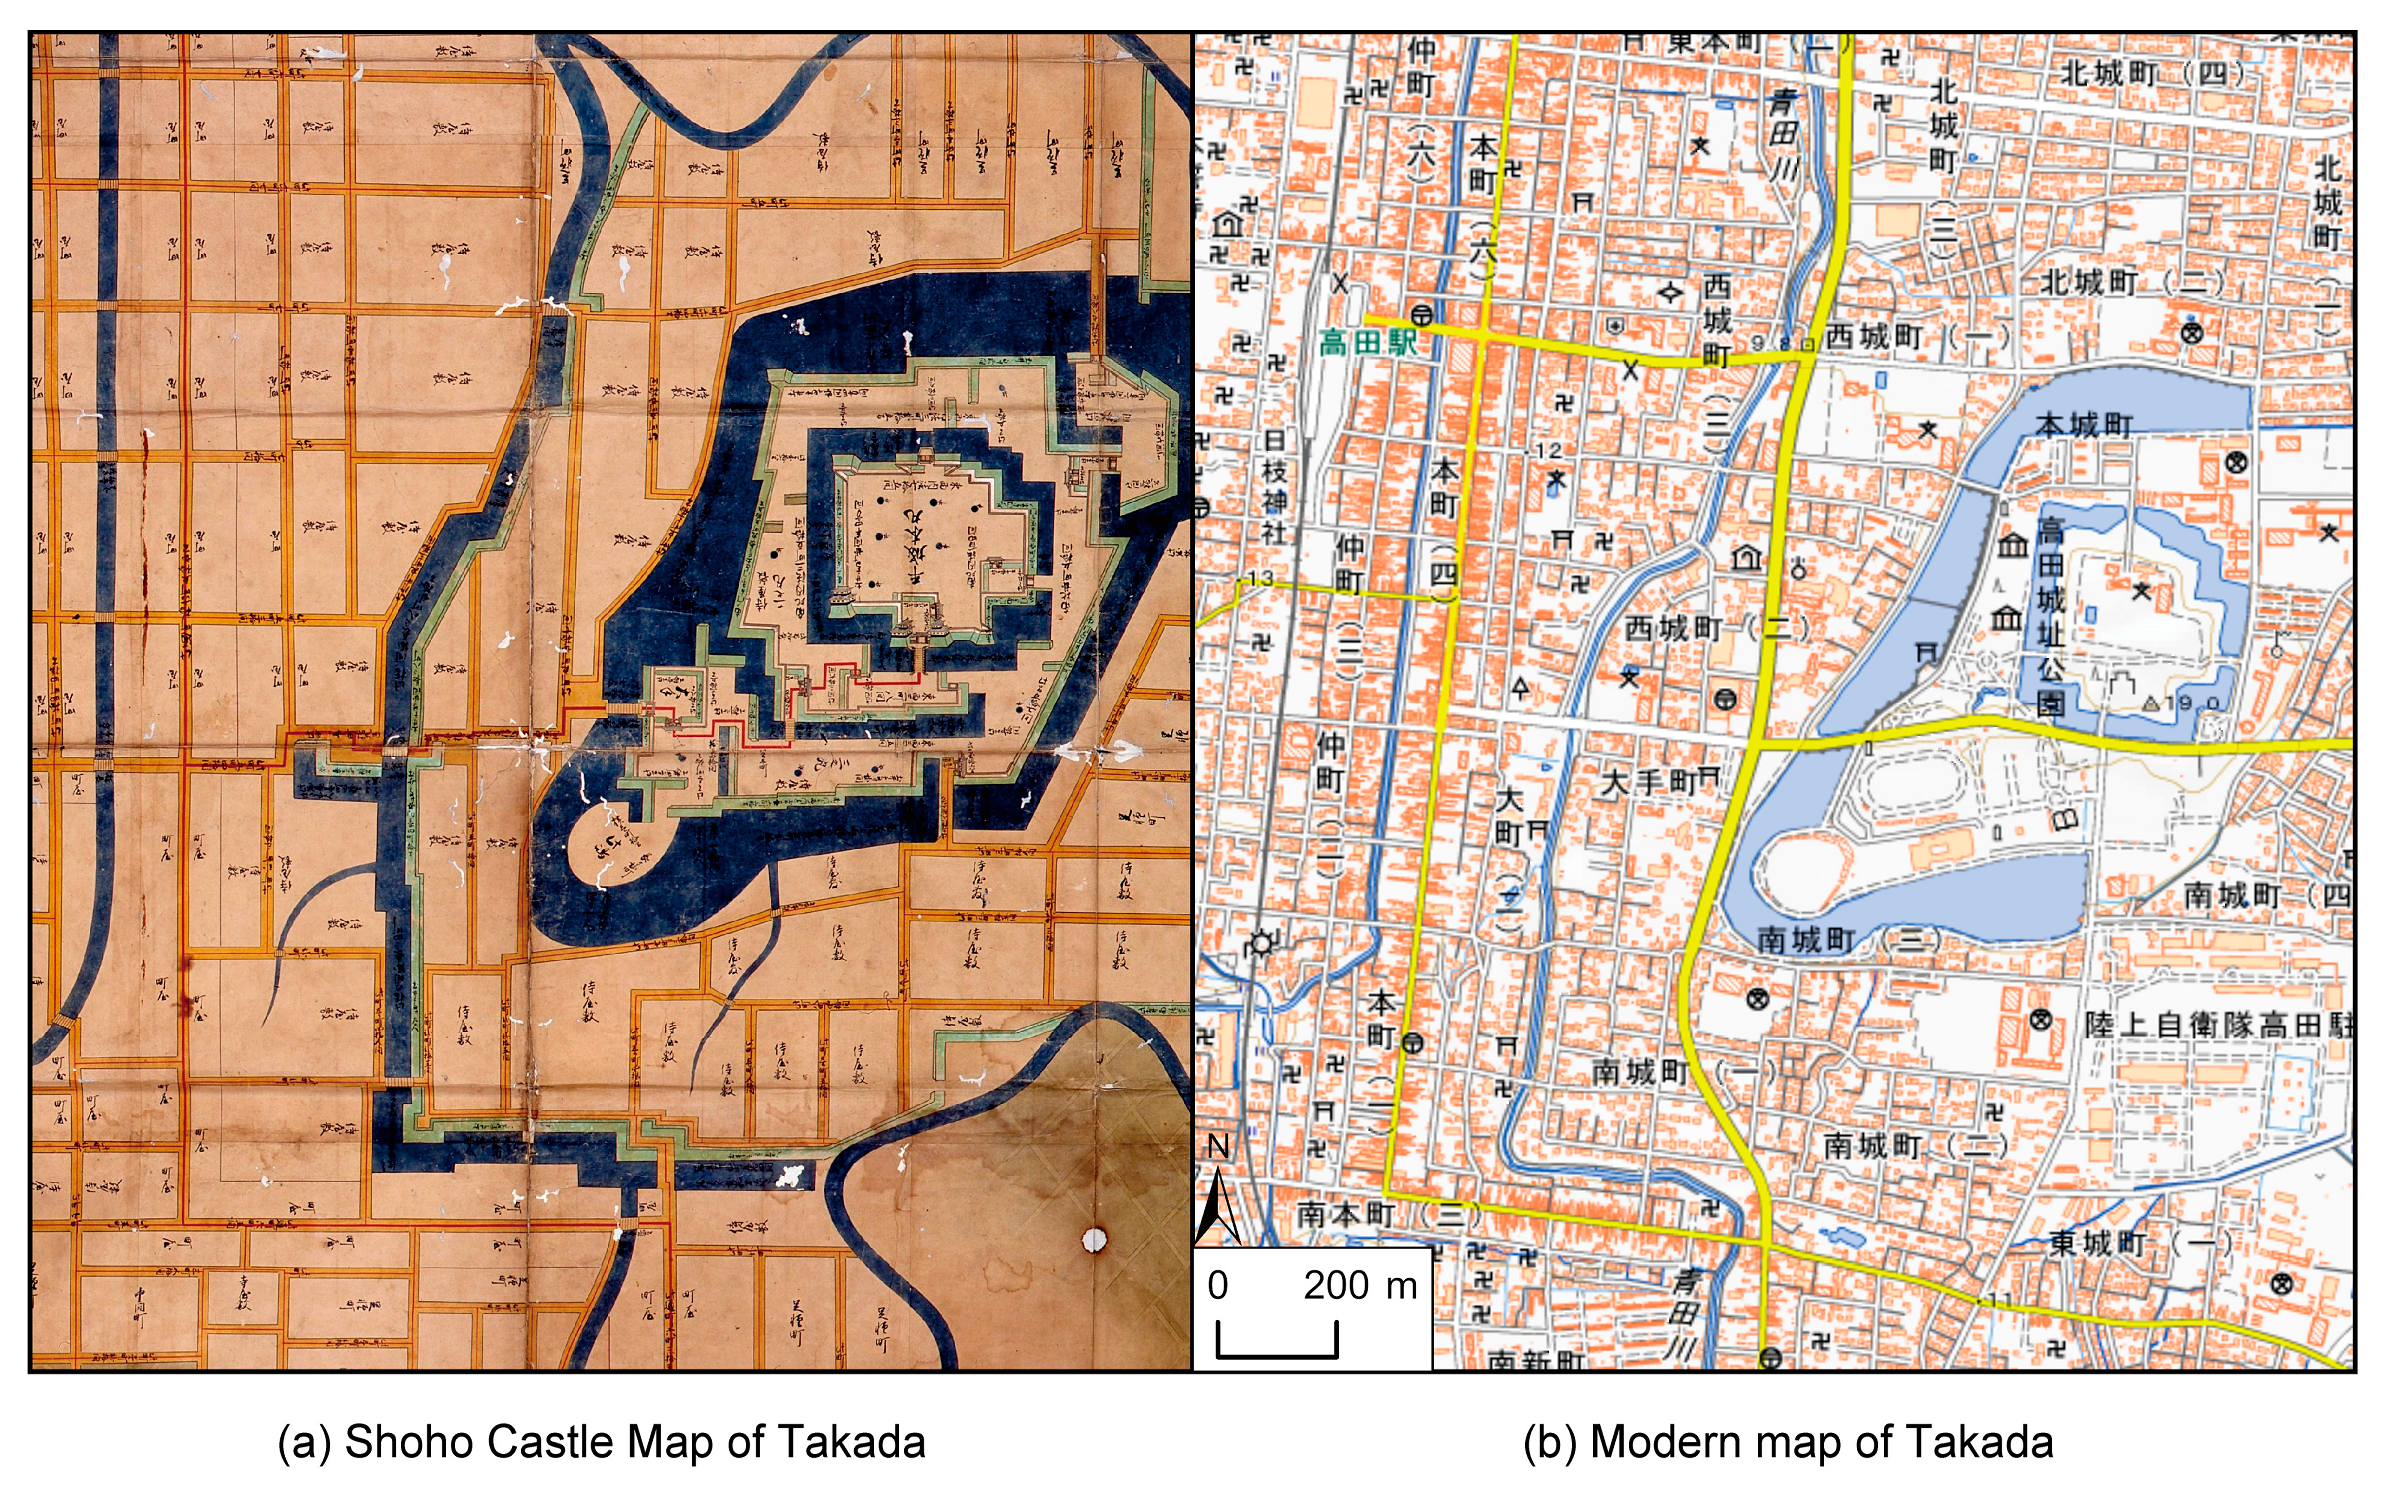
4.1. Composition of the Takada Shoho Castle Map
4.2. Limitations and Future Plan
5. Conclusions
Funding
Data Availability Statement
Acknowledgments
Conflicts of Interest
Appendix A
Appendix A.1. Global Bidimensional Regression
Appendix A.2. Geographically Weighted Bidimensional Regression (GWBR)
References
- Harley, J.B. Uncultivated fields in the history of British cartography. Cartogr. J. 1967, 4, 7–11. [Google Scholar] [CrossRef]
- Harley, J.B. The evaluation of early maps: Towards a methodology. Imago Mundi 1968, 22, 62–74. [Google Scholar] [CrossRef]
- Blakemore, M.J.; Harley, J.B. Concepts in the History of Cartography: A Review and Perspective; University of Toronto Press: Toronto, ON, Canada, 1980. [Google Scholar]
- Tobler, W. Medieval distortions: The projections of ancient maps. Ann. Assoc. Am. Geogr. 1966, 56, 351–360. [Google Scholar] [CrossRef]
- Ravenhill, W.; Gilg, A. The accuracy of early maps? Towards a computer aided method. Cartogr. J. 1974, 11, 48–52. [Google Scholar] [CrossRef]
- Stone, J.C.; Gemmell, A.M.D. An experiment in the comparative analysis of distortion on historical maps. Cartogr. J. 1977, 14, 7–11. [Google Scholar] [CrossRef]
- Murphy, J. Measures of map accuracy assessment and some early Ulster maps. Ir. Geogr. 1978, 11, 88–101. [Google Scholar] [CrossRef]
- Boutoura, C.; Livieratos, E. Strain analysis for geometric comparisons of maps. Cartogr. J. 1986, 23, 27–34. [Google Scholar] [CrossRef]
- Locke, W.W.; Wyckoff, W.K. A method for assessing the planimetric accuracy of historical maps: The case of the Colorado-Green River system. Prof. Geogr. 1993, 45, 416–424. [Google Scholar] [CrossRef]
- Fuse, T.; Shimizu, E.; Morichi, S. A study on geometric correction of historical maps. Int. Arch. Photogramm. Remote Sens. 1998, XXXII, 543–548. [Google Scholar]
- Symington, A.; Charlton, M.E.; Brunsdon, C.F. Using bidimensional regression to explore map lineage. Comput. Environ. Urban Syst. 2002, 26, 201–218. [Google Scholar] [CrossRef]
- Pearson, B.C. Comparative accuracy in four civil war maps of the Shenandoah Valley: A GIS analysis. Prof. Geogr. 2005, 57, 376–394. [Google Scholar] [CrossRef]
- Balletti, C. Georeference in the analysis of the geometric content of early maps. e-Perimetron 2006, 1, 32–42. [Google Scholar]
- Livieratos, E. On the study of the geometric properties of historical cartographic representations. Cartographica 2006, 41, 165–175. [Google Scholar] [CrossRef]
- Knowles, A.K. Placing History: How Maps, Spatial Data, and GIS are Changing Historical Scholarship; ESRI Press: Redlands, CA, USA, 2008. [Google Scholar]
- Onoda, K.; Miyamoto, S.; Fujita, H.; Komeie, T.; Kawahara, N.; Kawaguchi, H. Historical geography in Japan since 1980. Jpn. J. Hum. Geogr. 2013, 65, 1–28. [Google Scholar] [CrossRef]
- Jenny, B. MapAnalyst: A digital tool for the analysis of the planimetric accuracy of historical maps. e-Perimetron 2006, 1, 239–245. [Google Scholar]
- Jenny, B.; Weber, A.; Hurni, L. Visualizing the planimetric accuracy of historical maps with MapAnalyst. Cartographica 2007, 42, 89–94. [Google Scholar] [CrossRef]
- Jenny, B.; Hurni, L. Studying cartographic heritage: Analysis and visualization of geometric distortions. Comput. Graph. 2011, 35, 402–411. [Google Scholar] [CrossRef]
- Kojima, T.; Tamagawa, H. A basic study on providing meanings to distortions in historical maps and construction of their correction models. Theory Appl. GIS 2004, 12, 23–33. [Google Scholar] [CrossRef]
- Tsukamoto, A.; Isoda, Y. Analysis of local distortions in a historical map “Rakuchu-Ezu”. Theory Appl. GIS 2007, 15, 111–121. [Google Scholar] [CrossRef]
- Lloyd, C.D.; Lilley, K.D. Cartographic veracity in medieval mapping: Analyzing geographical variation in the Gough Map of Great Britain. Ann. Assoc. Am. Geogr. 2009, 99, 27–48. [Google Scholar] [CrossRef]
- Perthus, S.; Faehndrich, J. Visualizing the map-making process: Studying 19th century Holy Land cartography with MapAnalyst. e-Perimetron 2013, 8, 60–84. [Google Scholar]
- Schaffer, G.; Peer, M.; Levin, N. Quantifying the completeness of and correspondence between two historical maps: A case study from nineteenth-century Palestine. Cartogr. Geogr. Inf. Sci. 2016, 43, 154–175. [Google Scholar] [CrossRef]
- Iwai, Y.; Murayama, Y. Geographical analysis on the projection and distortion of INŌ’s Tokyo map in 1817. ISPRS Int. J. Geo-Inf. 2019, 8, 452. [Google Scholar] [CrossRef]
- Iwai, Y.; Murayama, Y. Geospatial analysis of the non-surveyed (estimated) coastlines in Inoh’s map, 1821. ISPRS Int. J. Geo-Inf. 2021, 10, 580. [Google Scholar] [CrossRef]
- Ostafin, K.; Pietrzak, M.; Kaim, D. Impact of the cartographer’s position and topographic accessibility on the accuracy of historical land use information: Case of the second military survey maps of the Habsburg empire. ISPRS Int. J. Geo-Inf. 2021, 10, 820. [Google Scholar] [CrossRef]
- Hu, B. Assessing the accuracy of the map of the prefectural capital of 1261 using geographic information systems. Prof. Geogr. 2001, 53, 32–44. [Google Scholar] [CrossRef]
- Jupp, D.L.B. Projection, scale, and accuracy in the 1721 Kangxi maps. Cartographica 2017, 52, 215–232. [Google Scholar] [CrossRef]
- Polo-Martin, B. The Accuracy of urban maps in Spain through GIS: The example of Burgos from the nineteenth to the twentieth century. Cartographica 2021, 56, 236–250. [Google Scholar] [CrossRef]
- Iju, T. Shuri kochizu no seisakuseido. In Chizu to Rekishikukan; Ashikaga Kensuke Sensei Tsuitoronbunshu Hensaniinkai, Ed.; Taimeido: Tokyo, Japan, 2000; pp. 403–416. [Google Scholar]
- Timár, G. Possible projection of the first military survey of the Habsburg empire in lower Austria and Hungary (late 18th Century): An improvement in fitting historical topographic maps to modern cartographic systems. ISPRS Int. J. Geo-Inf. 2023, 12, 220. [Google Scholar] [CrossRef]
- Timár, G.; Biszak, S.; Székely, B.; Molnár, G. Digitized maps of the Habsburg military surveys: Overview of the project of ARCANUM Ltd. (Hungary). In Preservation in Digital Cartography: Archiving Aspects; Jobst, M., Ed.; Springer: Berlin/Heidelberg, Germany, 2010; pp. 273–283. [Google Scholar]
- Vuksanovic-Macura, Z.; Jevtić-Novaković, K. Surveying of Belgrade: Technical background of Emilijan Josimović plan from 1867. Matica Srp. J. Fine Arts 2020, 48, 73–87. [Google Scholar]
- Ballon, H.; Friedman, D. Portraying the city in early modern Europe: Measurement, representation, and plannning. In History of Cartography III Cartography in the European Renaissance; Woodward, D., Ed.; University of Chicago Press: Chicago, IL, USA, 2007. [Google Scholar]
- Jongepier, I.; Soens, T.; Temmerman, S.; Missiaen, T. Assessing the planimetric accuracy of historical maps (sixteenth to nineteenth centuries): New methods and potential for coastal landscape reconstruction. Cartogr. J. 2016, 53, 114–132. [Google Scholar] [CrossRef]
- Granado-Castro, G.; Aguilar-Camacho, J. Cartographic style in the first urban maps of Cadiz, Spain: A technique in transition. Cartogr. J. 2019, 56, 18–41. [Google Scholar] [CrossRef]
- Yamori, K. Toshizu No Rekishi: Sekaihen; Kodansha: Tokyo, Japan, 1975. [Google Scholar]
- Unno, K. Cartography in Japan. In History of Cartography II Cartography in the Traditional East and Southeast Asian Societies; Harley, J.B., Woodward, D., Eds.; University of Chicago Press: Chicago, IL, USA, 1994. [Google Scholar]
- Yamori, K. Meijyo Ezu Shusei; Kodansha: Tokyo, Japan, 1986. [Google Scholar]
- Senda, Y. Zusetsu Shoho Shiroezu; Shin-Jinbutsuoraisha: Tokyo, Japan, 2001. [Google Scholar]
- Owada, T. Kinseishoki jokamachiezu no ichikosatsu. In Owada Tetsuo Chosakushu; Owada, T., Ed.; Seibundo: Osaka, Japan, 2002; pp. 346–366. [Google Scholar]
- Kawamura, H. Edobakufu No Nihonchizu: Kuniezu, Shiroezu, Nihonzu; Yoshikawa Kobunkan: Tokyo, Japan, 2010. [Google Scholar]
- Kamiyama, H. Edojidaishoki no jokakuezu. Jokakushikenkyu 1997, 17, 80–87. [Google Scholar]
- Yuasa, K. The some consideration on the scattered “Shoho Shiro Ezu” (the maps of castle and castle town compiled by the order of the Tokugawa Shogunate, 1644) of Aizu, Sendai and Takada of former the “Momijiyama Bunko” (The Tokugawa Shogunate library, in the Edo castle). Trans. Archit. Inst. Jpn. J. Archit. Plan. Environ. Eng. 1987, 377, 119–128. [Google Scholar]
- Inoue, M. Shoho shiroezu tenmatsu. In Shoho Shiroezu Tenmatsu; Inoue, M., Ed.; Bungeishunju: Tokyo, Japan, 1989; pp. 201–230. [Google Scholar]
- Atouda, R. Sendai Jokaezu No Kenkyu; Saito Houonkai: Sendai, Japan, 1936. [Google Scholar]
- Gutschow, N. Die Japanische Burgstadt; Ferdinand Schoningh: Paderborn, Germany, 1976. [Google Scholar]
- Yuasa, K. Some consideration about the contents of drawing and writing of “Shoho Shiro Ezu” (the maps of castle and castle town compiled by the order of the Tokugawa Shogunate, 1644). Bull. Nagoya Inst. Technol. 1983, 35, 233–242. [Google Scholar]
- Takaya, M. 3D-CG wo mochiita moshikikaniyoru Shoho Shiroezu no keikanmoderu no kentou. J. Tokyo Zokei Univ. 2016, 17, 129–139. [Google Scholar]
- Ideta, K. An preliminary study on the accuracy of the Shoho-Shiroezu map: A case study of Kokura castle map. Geogr. Rep. Osaka Kyoiku Univ. 2013, 37, 139–150. [Google Scholar]
- Goto, Y. Sendai no jokaezu nitsuite. In Nishimura Kasuke Sensei Taikankinen Chirigaku Ronbunshu; Jikkoiinkai, N.K.T., Ed.; Kokon Shoin: Tokyo, Japan, 1980; pp. 596–601. [Google Scholar]
- Yabe, N. Takada no jokamachiezu no tanoshimikata. In Bura Takada; Asakura, Y., Shimura, T., Ibaraki, S., Yamagata, K., Yabe, N., Hanaoka, K., Arakawa, M., Izumi, Y., Eds.; Hokuetsu Publishing: Joetsu, Japan, 2014; pp. 6–13. [Google Scholar]
- Yuasa, K. Echigonokuni Takada shiroezu nitsuite. In Proceedings of the Architectural Institute of Japan, Summaries of Technical Papers of Annual Meeting, Tokai, Japan, October 1976; pp. 1711–1712. [Google Scholar]
- Tsukamoto, A.; Narumi, K. Toshi no sokuryozu to GIS niyoru seidokensho. In Nihon Toshishi Kenchikushi Jiten; History, Society of Urban and Territorial History, Ed.; Maruzen Publishing: Tokyo, Japan, 2018; pp. 570–571. [Google Scholar]
- Watanabe, M. GIS kaisekijiniokeru ezubunseki no kadai. In Kinsei Sokuryo Ezu No GIS Bunseki; Hirai, S., Asato, S., Watanabe, M., Eds.; Kokon Shoin: Tokyo, Japan, 2014; pp. 257–264. [Google Scholar]
- Sugimoto, F. Ezu No Shigaku; The University of Nagoya Press: Nagoya, Japan, 2022. [Google Scholar]
- Kawamura, H. Kinseiezu To Sokuryojutsu; Kokon Shoin: Tokyo, Japan, 1992. [Google Scholar]
- Matsuzaki, T. Edojidai No Sokuryojutsu; Sogo Kagaku Publishing: Tokyo, Japan, 1979. [Google Scholar]
- Boutoura, C.; Livieratos, E. Some fundamentals for the study of the geometry of early maps by comparative methods. e-Perimetron 2006, 1, 60–70. [Google Scholar]
- Tobler, W. Computation of the correspondence of geographical patterns. Pap. Reg. Sci. Assoc. 1965, 15, 131–139. [Google Scholar] [CrossRef]
- Tobler, W. Bidimensional regression. Geogr. Anal. 1994, 26, 187–212. [Google Scholar] [CrossRef]
- Nakaya, T. Statistical inferences in bidimensional regression models. Geogr. Anal. 1997, 29, 169–186. [Google Scholar] [CrossRef]
- Schmid, K.K.; Marx, D.B.; Samal, A. Weighted bidimensional regression. Geogr. Anal. 2011, 43, 1–13. [Google Scholar] [CrossRef]
- Tanaka, K. GIS wo enyoshita jissokuzu no seidohyokaho nitsuiteno ichikosatsu. In Kinsei Sokuryo Ezu No GIS Bunseki; Hirai, S., Asato, S., Watanabe, M., Eds.; Kokon Shoin: Tokyo, Japan, 2014; pp. 273–282. [Google Scholar]
- Boùùaert, M.C.; De Baets, B.; Vervust, S.; Neutens, T.; De Maeyer, P.; Van de Weghe, N. Computation and visualisation of the accuracy of old maps using differential distortion analysis. Int. J. Geogr. Inf. Sci. 2016, 30, 1255–1280. [Google Scholar] [CrossRef]
- Vervust, S.; Boùùaert, M.C.; De Baets, B.; Van de Weghe, N.; De Maeyer, P. A study of the local geometric accuracy of Count de Ferraris’s Carte de cabinet (1770s) using differential distortion analysis. Cartogr. J. 2018, 55, 16–35. [Google Scholar] [CrossRef]
- Fotheringham, A.S.; Brunsdon, C.F.; Charlton, M. Geographically Weighted Regression: The Analysis of Spatially Varying Relationships; Wiley: West Sussex, England, 2002. [Google Scholar]
- Tsutsumida, N.; Yoshida, T.; Murakami, D.; Nakaya, T. A review on geographically weighted methods and their future directions. Theory Appl. GIS 2021, 29, 11–21. [Google Scholar] [CrossRef]
- De La Hoz-M, J.; Fernandez-Gómez, M.J.; Mendes, S. Trends and topics in geographically weighted regression research from 1996 to 2019. Area 2022, 54, 105–117. [Google Scholar] [CrossRef]
- Manzano-Agugliaro, F.; Fernández-Sánchez, J.S.; San-Antonio-Gómez, C. Mapping the whole errors of Tomas Lopez’s geographic atlas of Spain (1804). J. Maps 2013, 9, 617–622. [Google Scholar] [CrossRef]
- Japan Meteorological Agency. Chijiki No Kisochishiki. Available online: https://www.kakioka-jma.go.jp/knowledge/mg_bg.html (accessed on 25 March 2024).
- Brown, P.C. Never the twain shall meet: European land survey techniques in Tokugawa Japan. Chin. Sci. 1989, 9, 53–79. [Google Scholar] [CrossRef]
- Sato, K. Kouryoikisokuryo to sokuryojutsu no shoryuha. In Ezugaku Nyumon; Sugimoto, F., Isonaga, K., Onodera, A., Ronald, T., Nakano, H., Hirai, S., Eds.; University of Tokyo Press: Tokyo, Japan, 2011. [Google Scholar]
- Sugimoto, F. Political Cartography in the Tokugawa Period. Oxford Research Encyclopedia of Asian History. 2020. Available online: https://oxfordre.com/asianhistory/view/10.1093/acrefore/9780190277727.001.0001/acrefore-9780190277727-e-106 (accessed on 5 April 2024).
- Takeda, T. Kanoha Kaigashi; Yoshikawa Koubunkan: Tokyo, Japan, 1995. [Google Scholar]
- Wu, B.; Yan, J.; Lin, H. A cost-effective algorithm for calibrating multiscale geographically weighted regression models. Int. J. Geogr. Inf. Sci. 2021, 36, 898–917. [Google Scholar] [CrossRef]


Disclaimer/Publisher’s Note: The statements, opinions and data contained in all publications are solely those of the individual author(s) and contributor(s) and not of MDPI and/or the editor(s). MDPI and/or the editor(s) disclaim responsibility for any injury to people or property resulting from any ideas, methods, instructions or products referred to in the content. |
© 2024 by the author. Licensee MDPI, Basel, Switzerland. This article is an open access article distributed under the terms and conditions of the Creative Commons Attribution (CC BY) license (https://creativecommons.org/licenses/by/4.0/).
Share and Cite
Yabe, N. Mapmaking Process Reading from Local Distortions in Historical Maps: A Geographically Weighted Bidimensional Regression Analysis of a Japanese Castle Map. ISPRS Int. J. Geo-Inf. 2024, 13, 124. https://doi.org/10.3390/ijgi13040124
Yabe N. Mapmaking Process Reading from Local Distortions in Historical Maps: A Geographically Weighted Bidimensional Regression Analysis of a Japanese Castle Map. ISPRS International Journal of Geo-Information. 2024; 13(4):124. https://doi.org/10.3390/ijgi13040124
Chicago/Turabian StyleYabe, Naoto. 2024. "Mapmaking Process Reading from Local Distortions in Historical Maps: A Geographically Weighted Bidimensional Regression Analysis of a Japanese Castle Map" ISPRS International Journal of Geo-Information 13, no. 4: 124. https://doi.org/10.3390/ijgi13040124