


Map Reading and Analysis with GPT-4V(ision)


Abstract
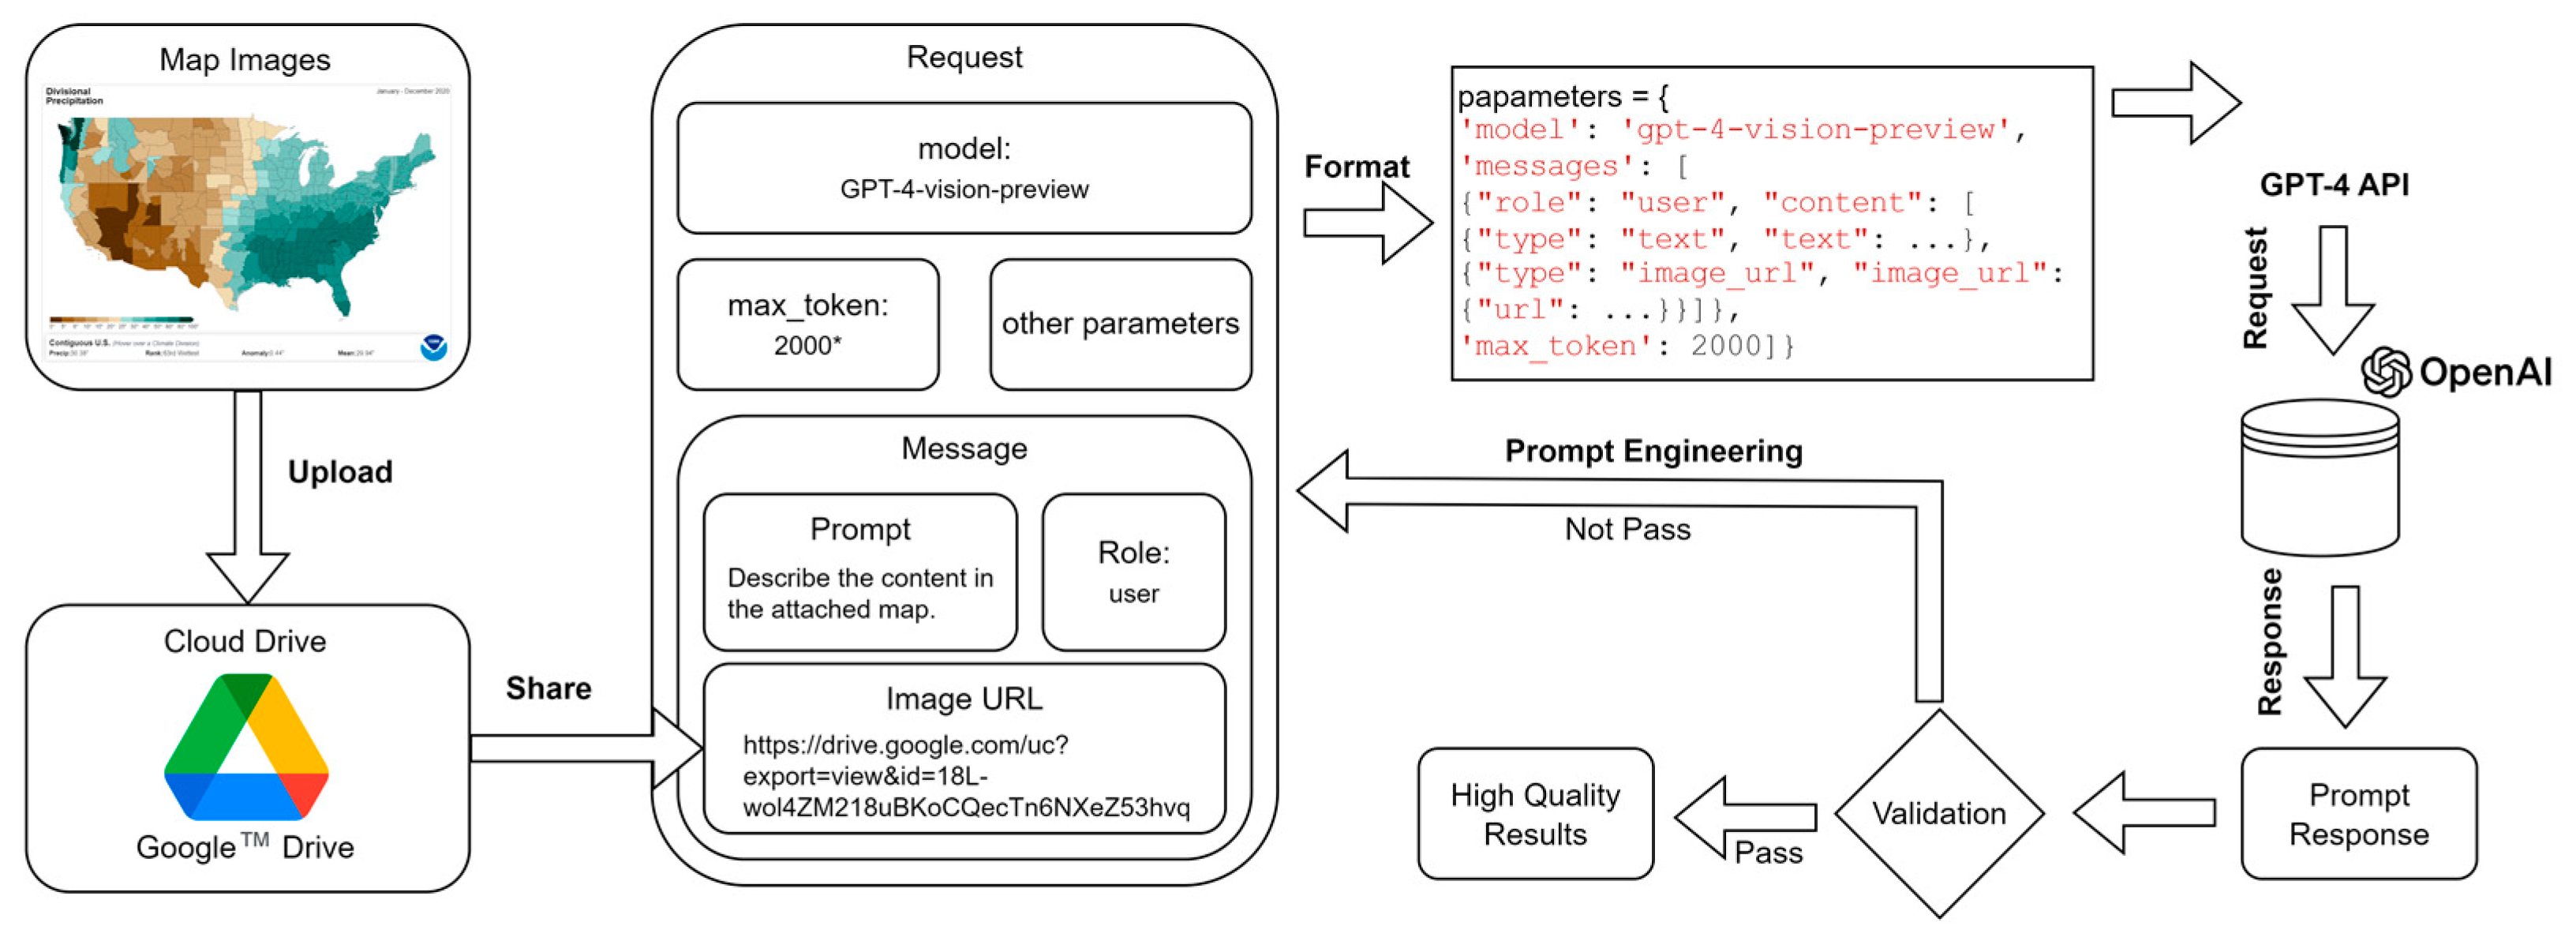
1. Introduction
2. Map Reading
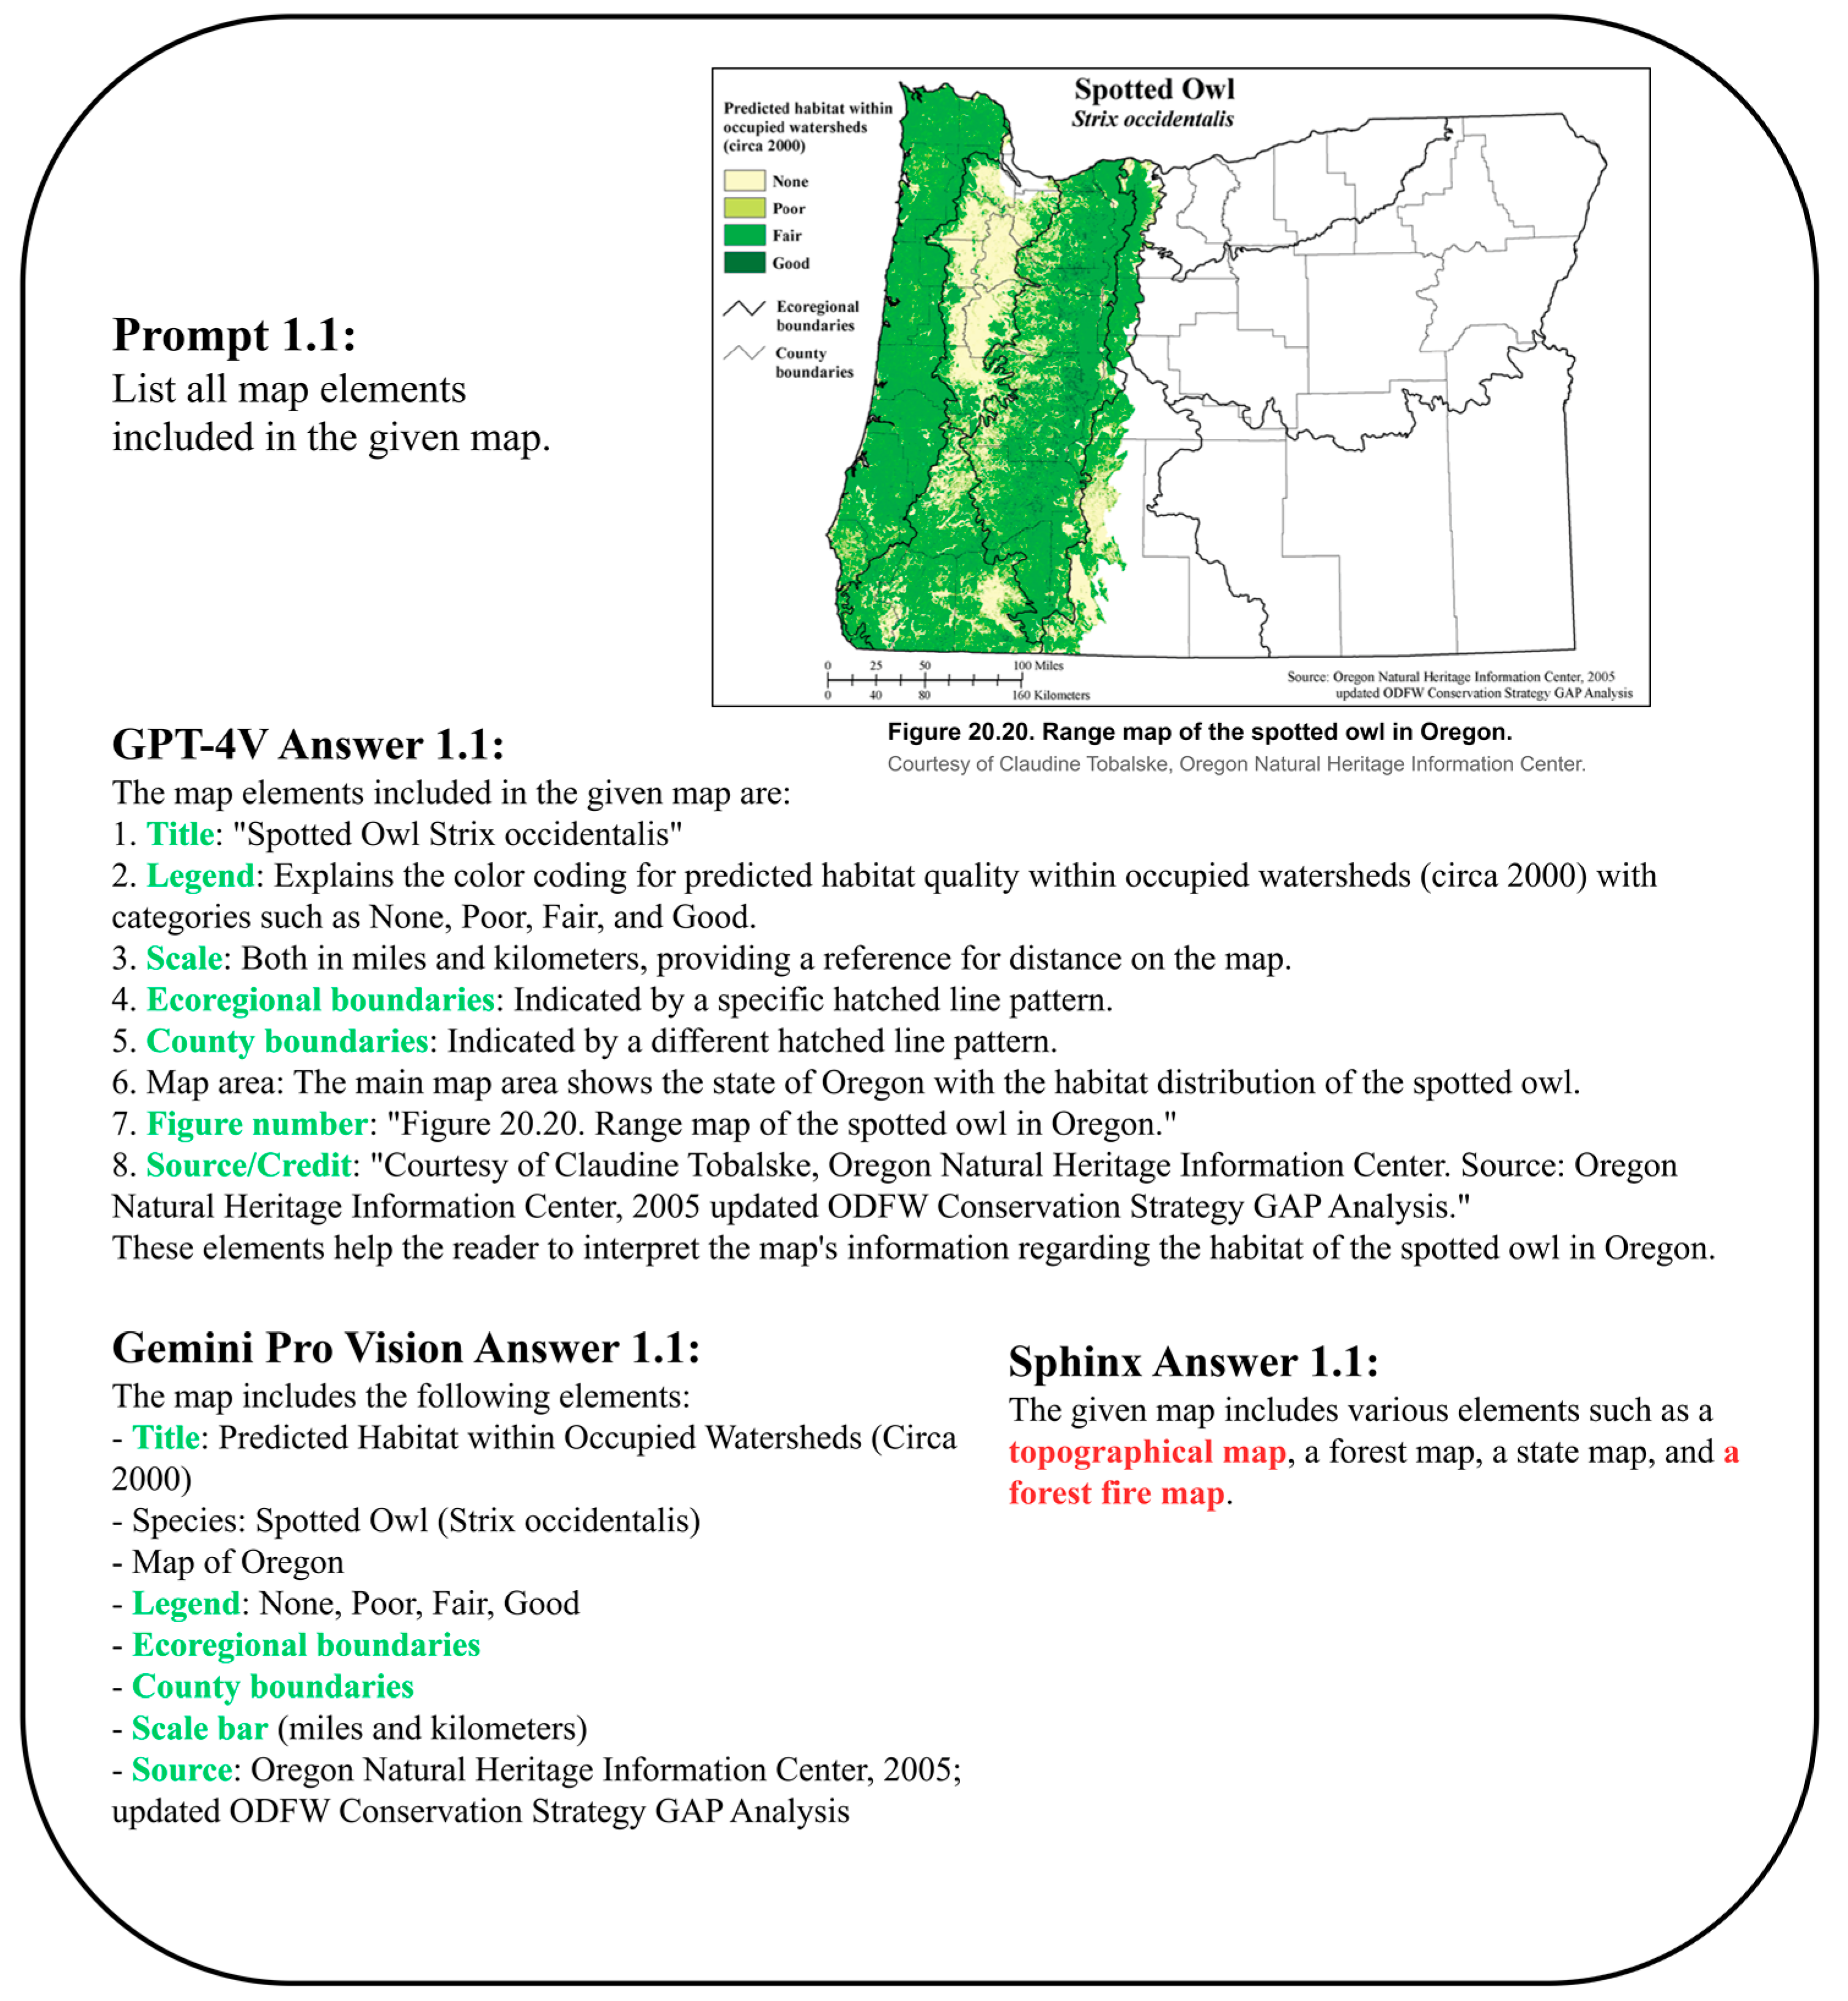
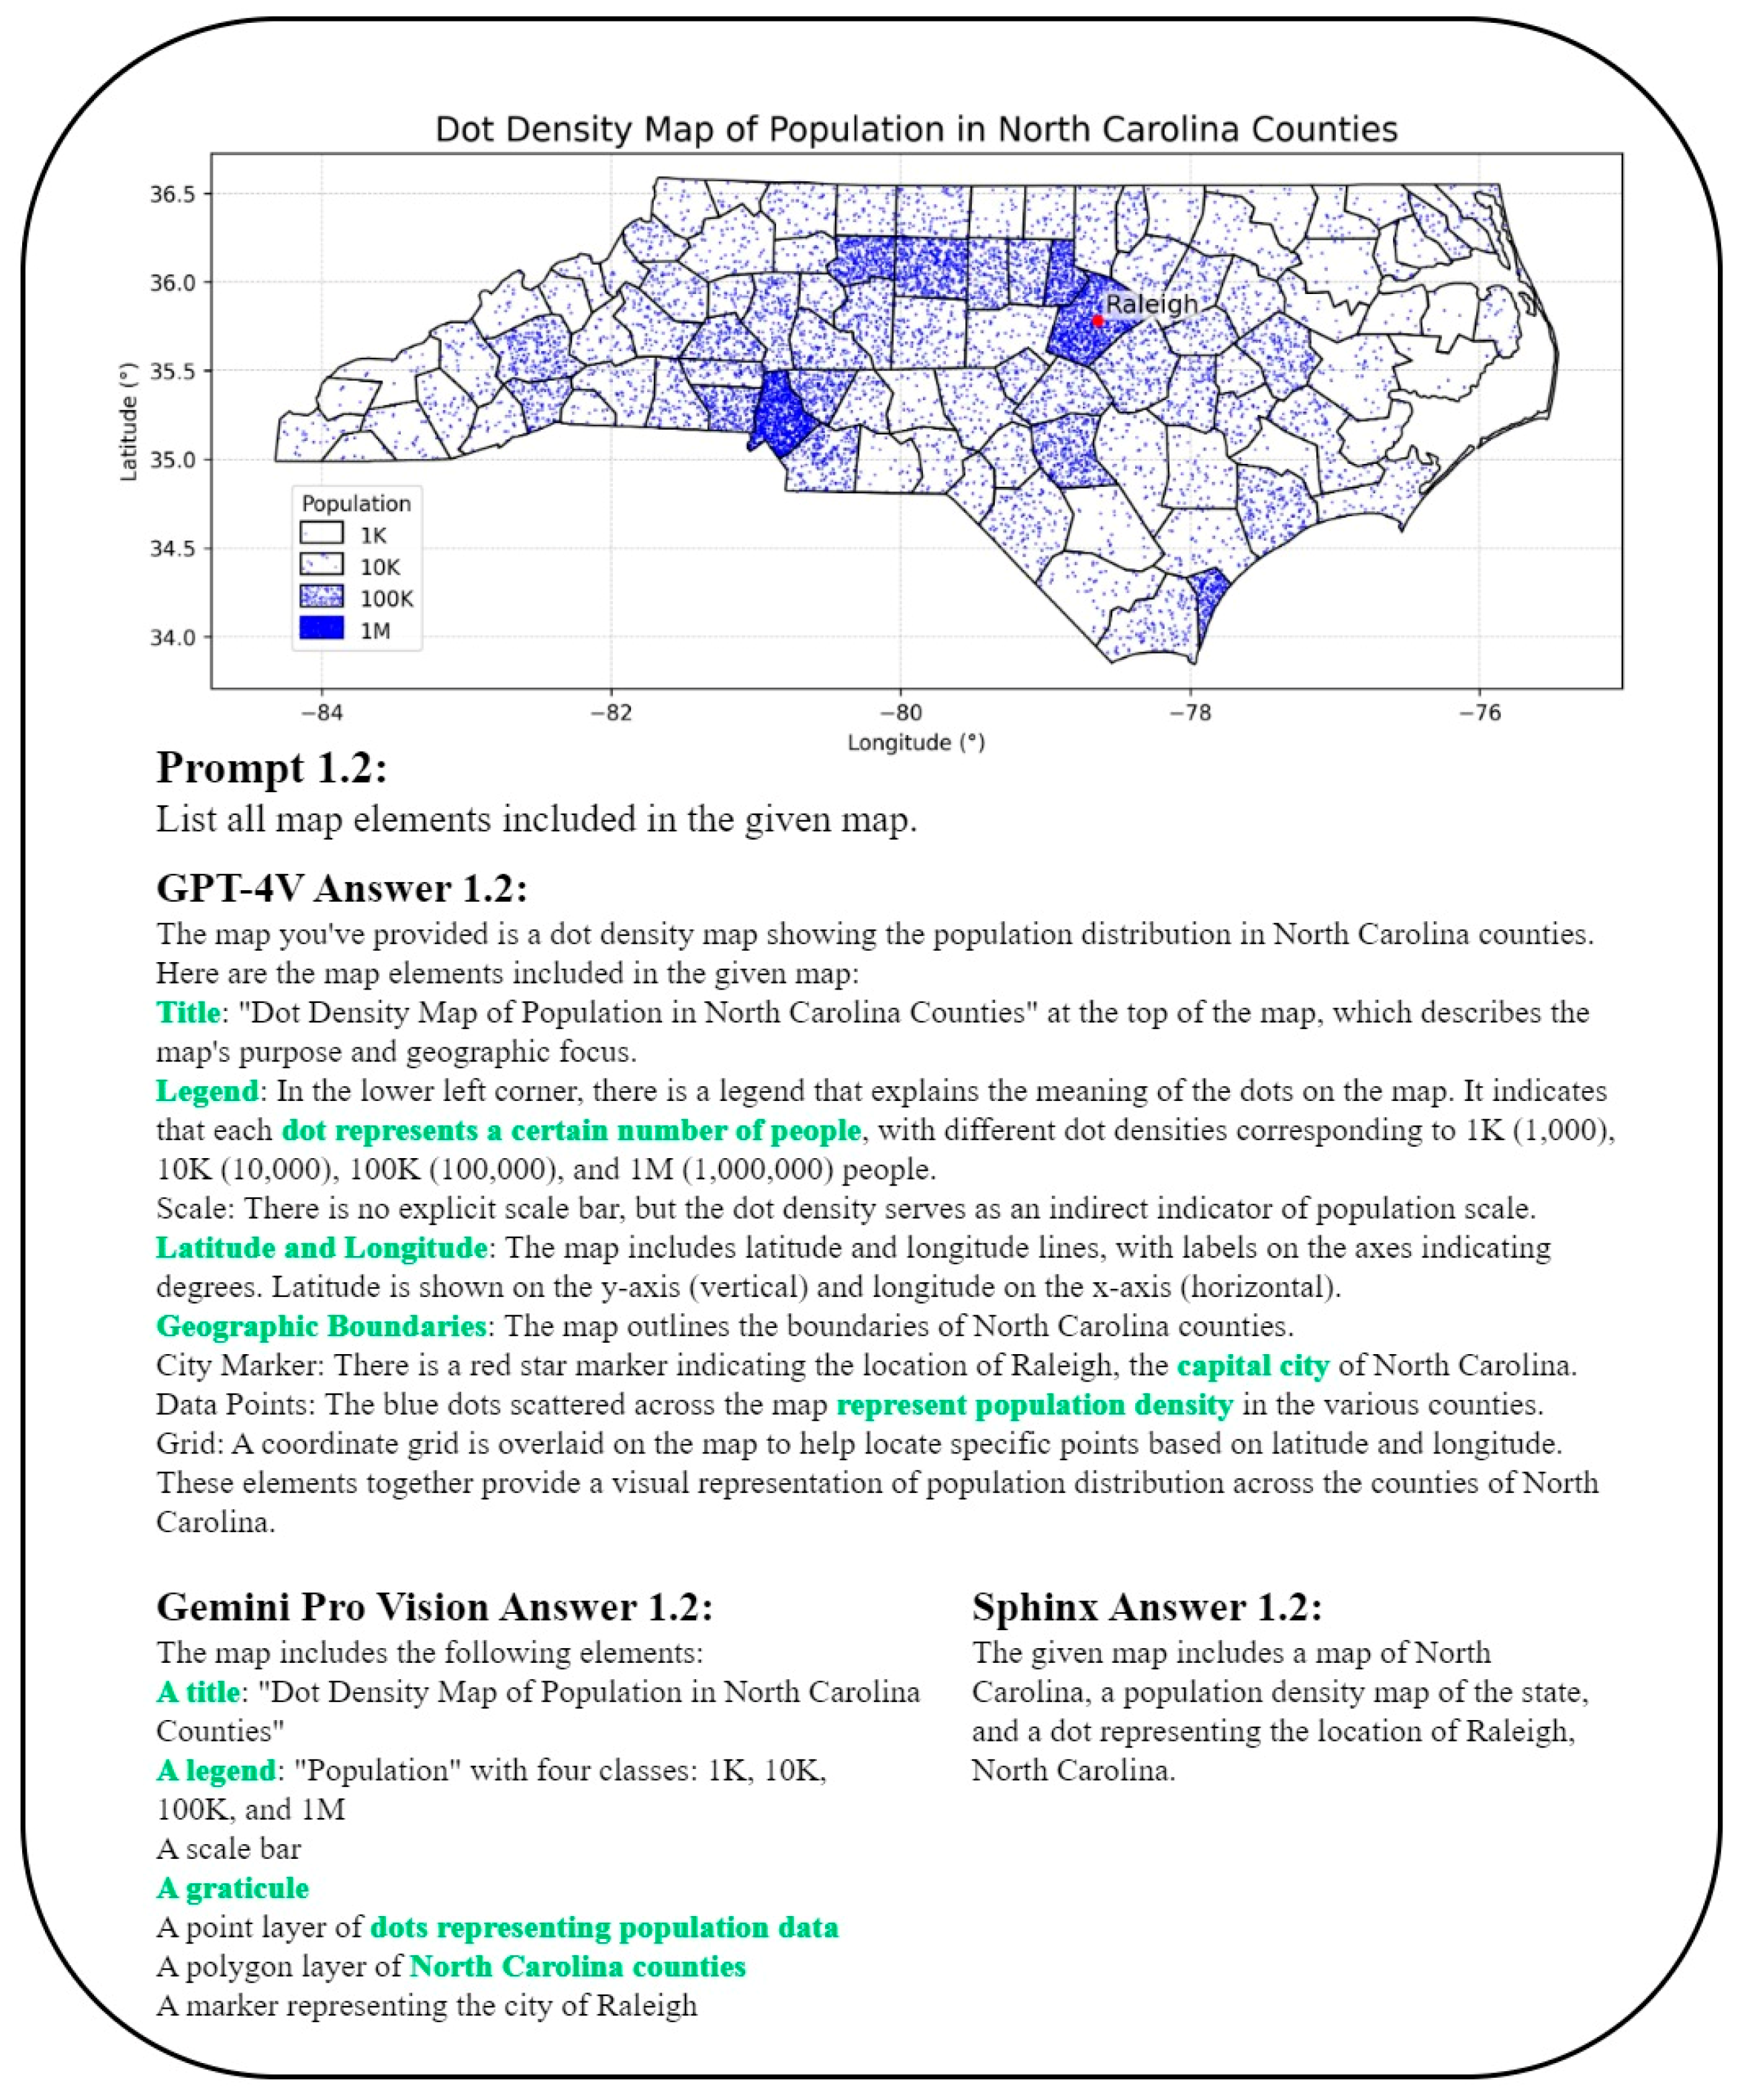
2.1. Map Element Recognition
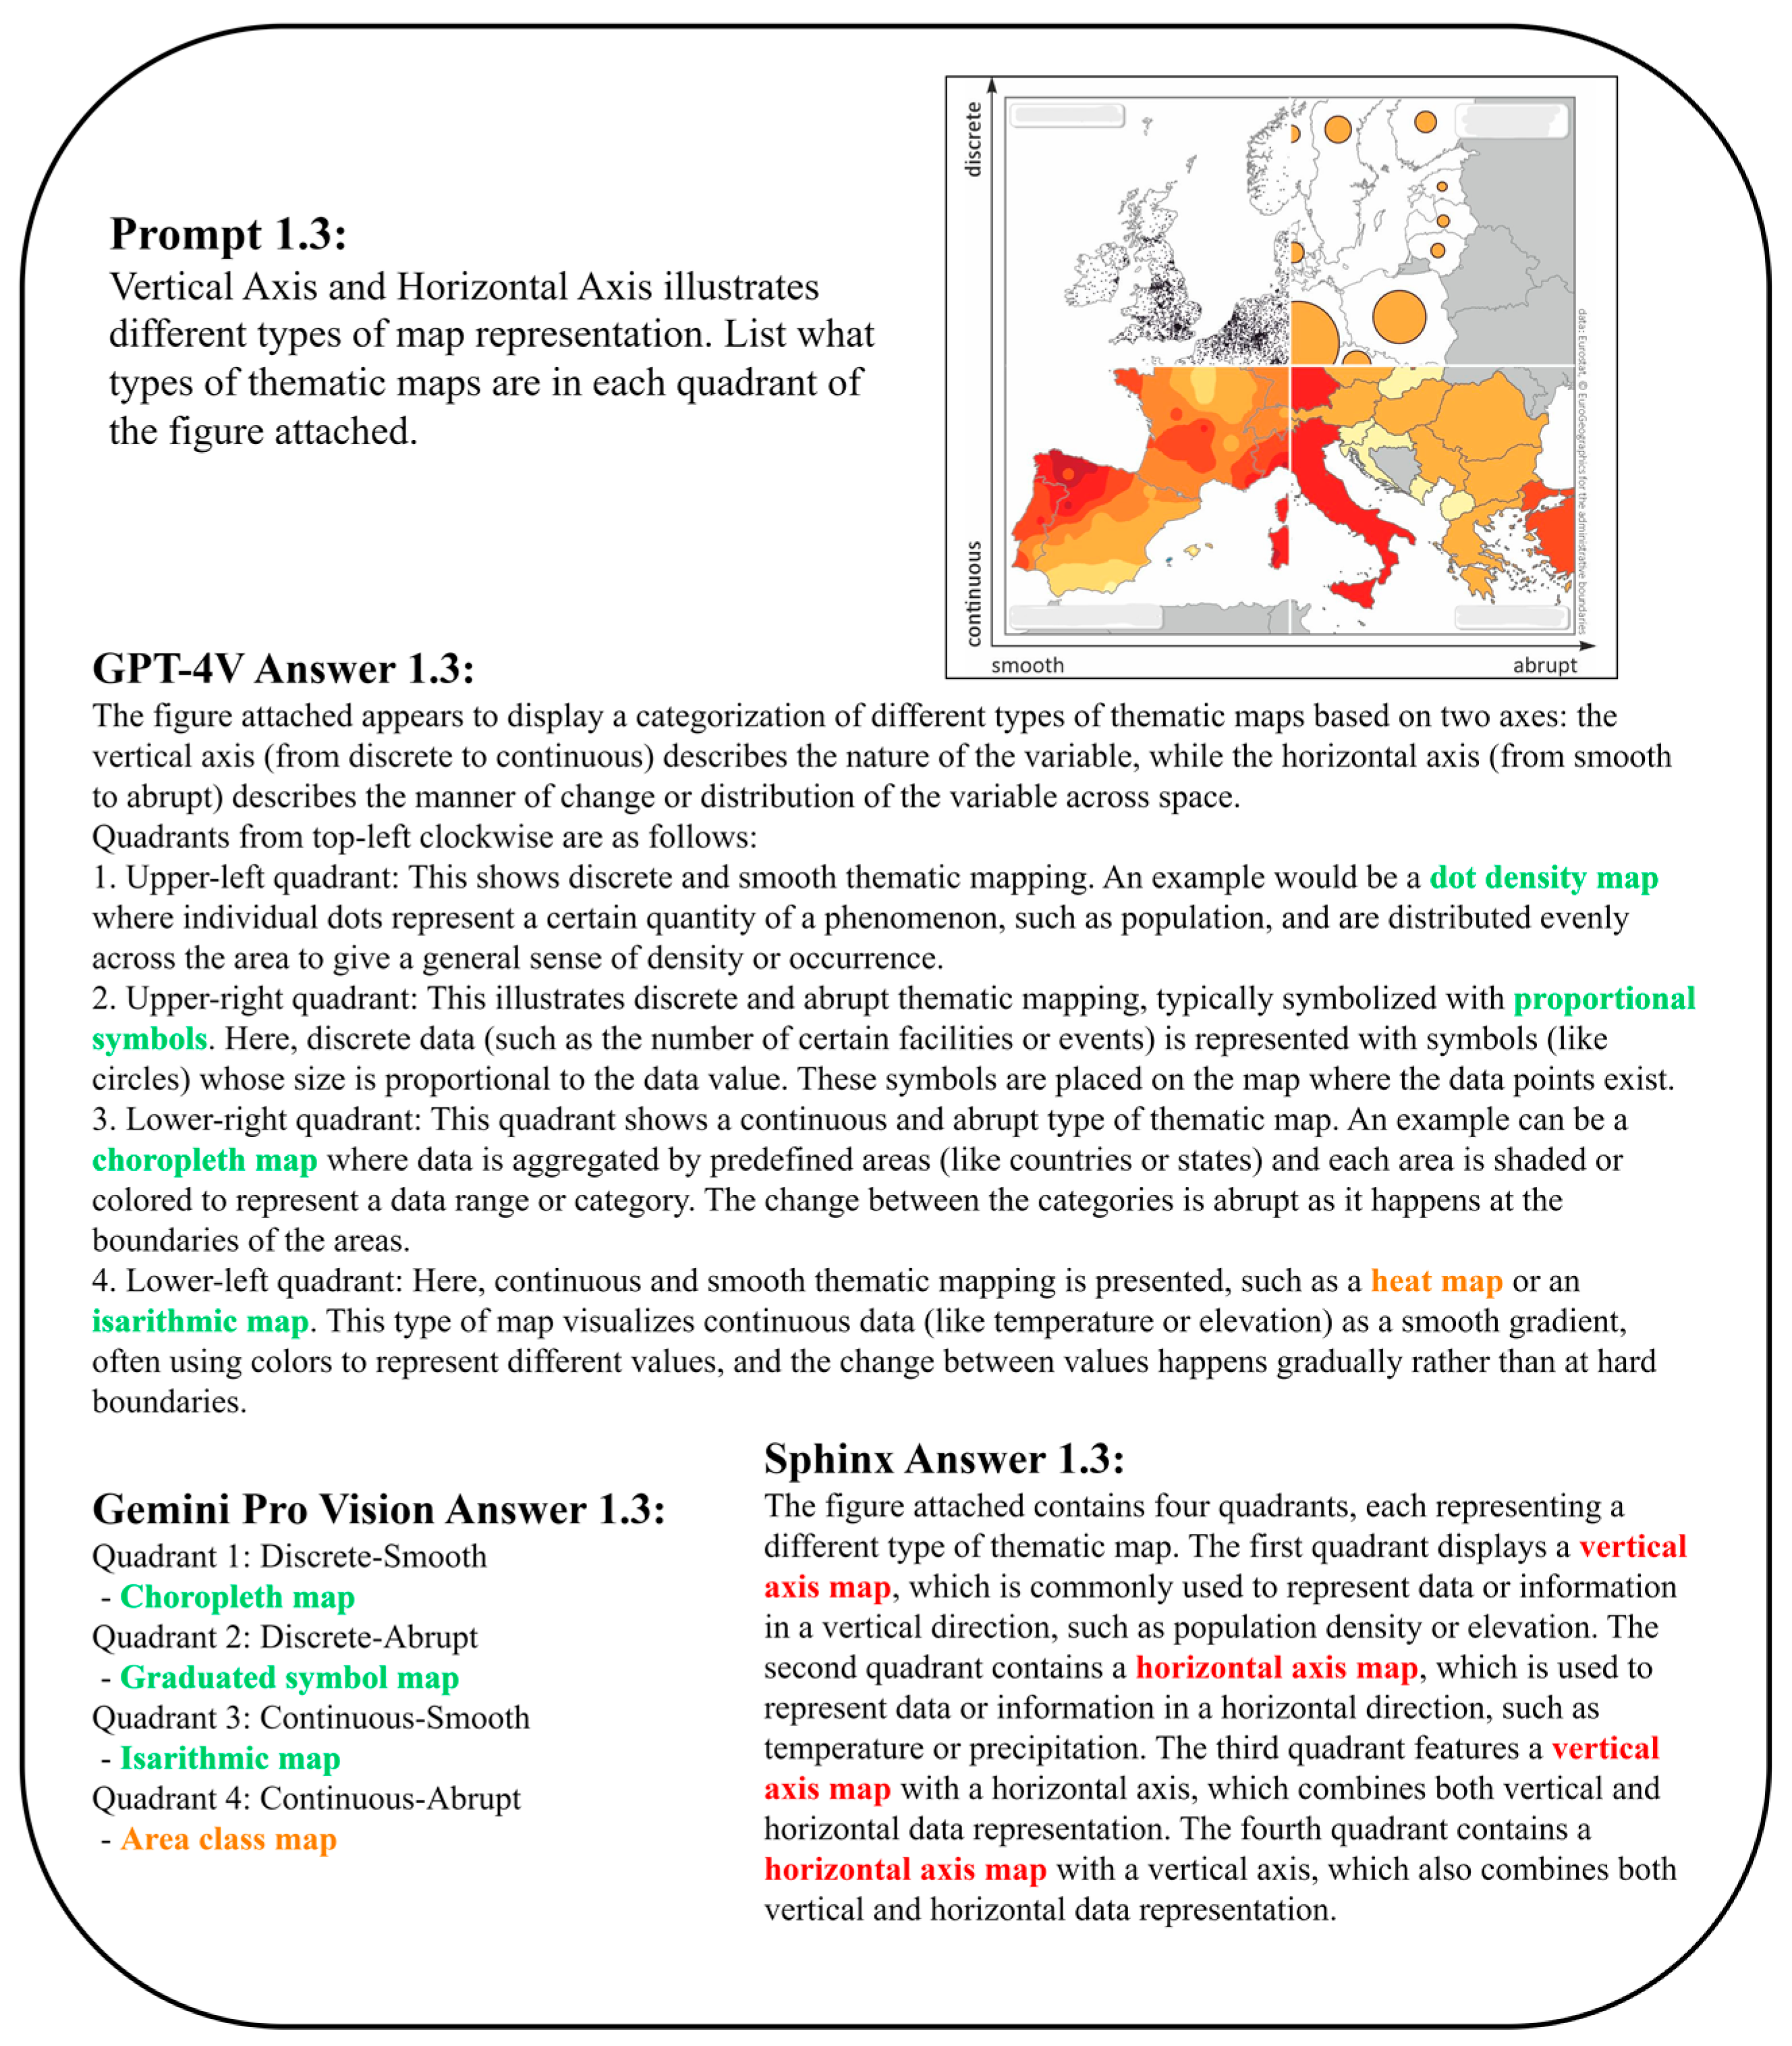
2.2. Thematic Map Recognition
3. Map Analysis
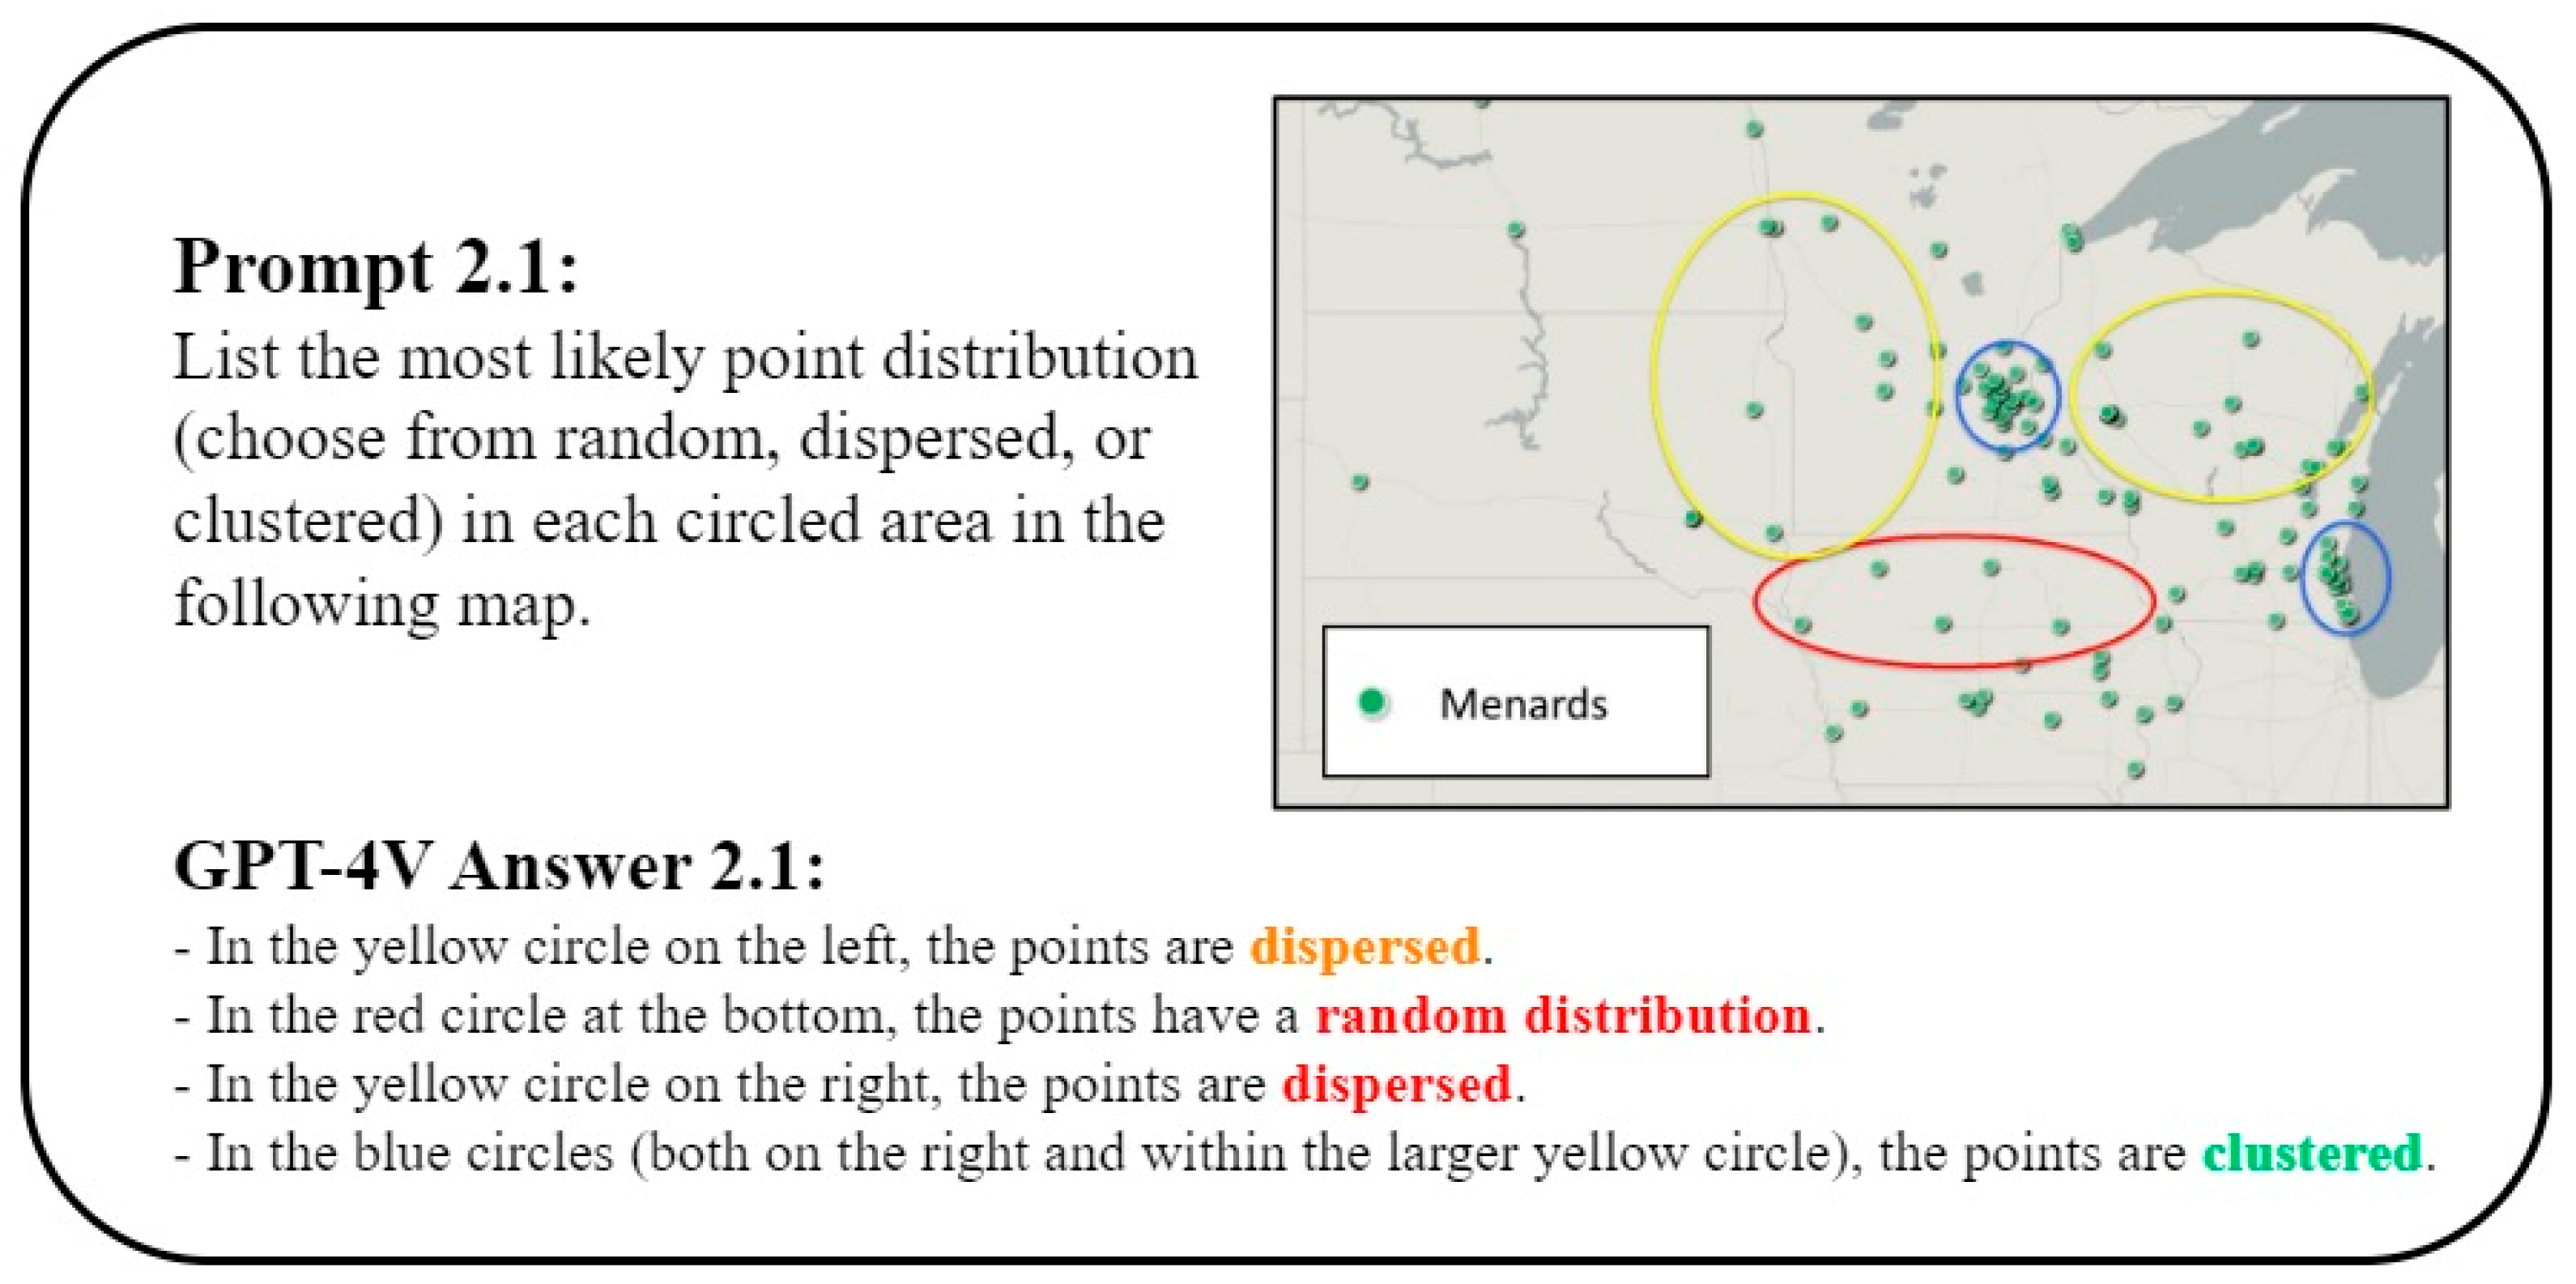
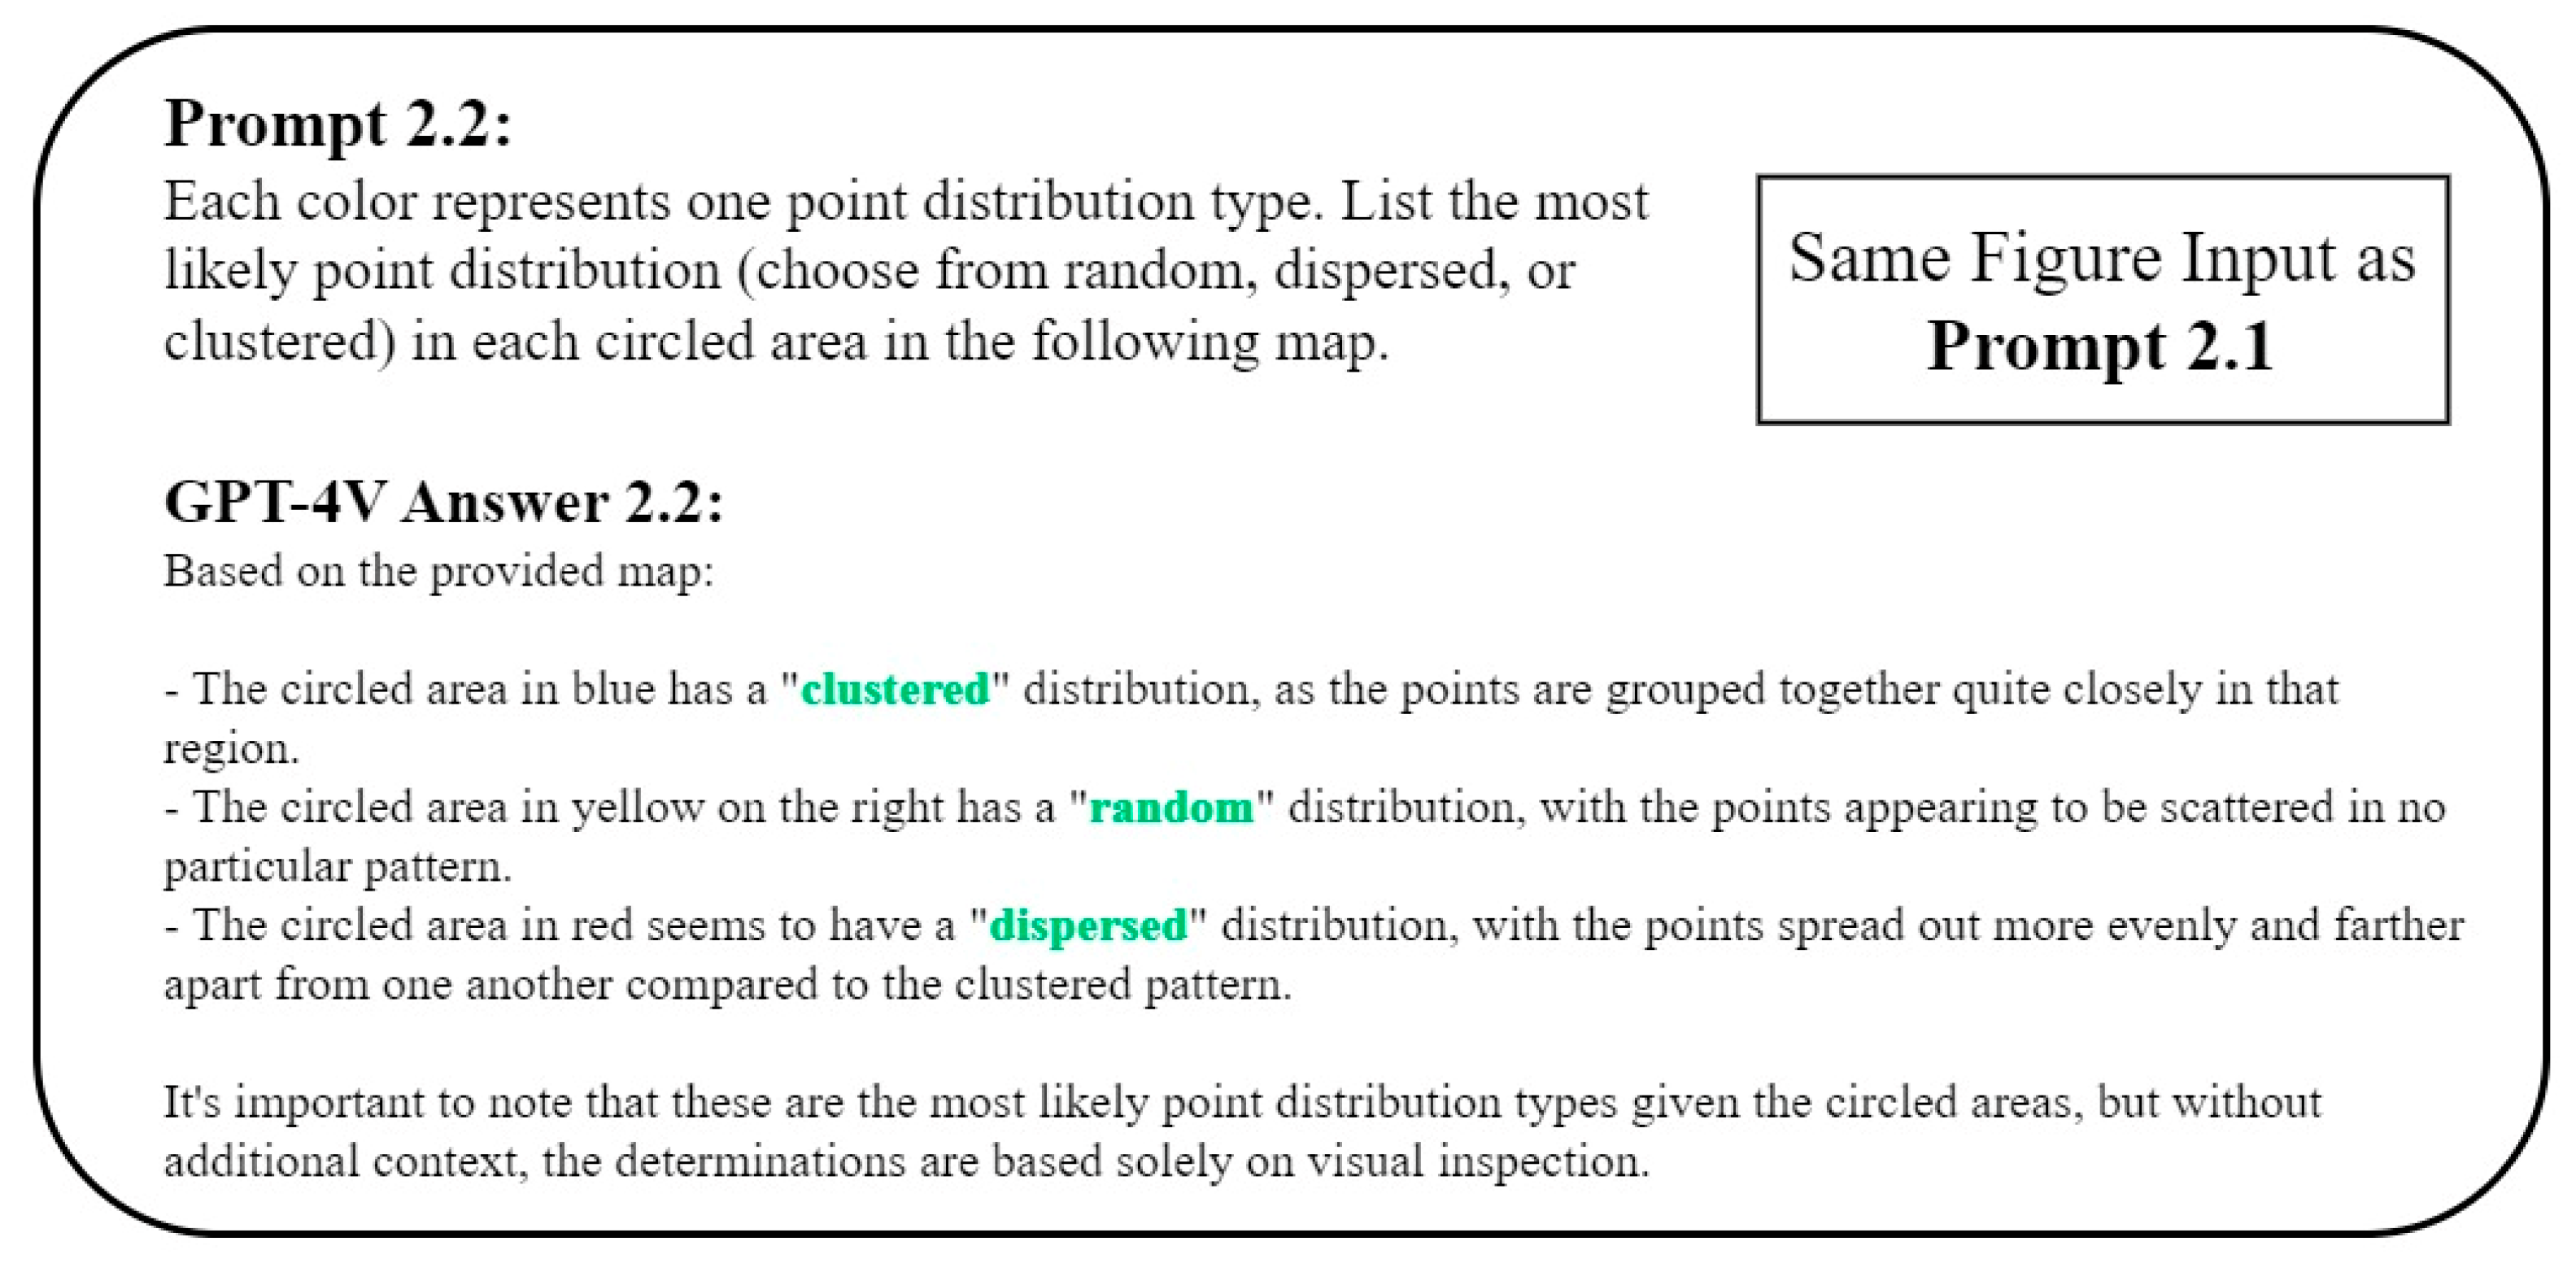
3.1. Point Pattern Recognition
3.1.1. Point Pattern Analysis
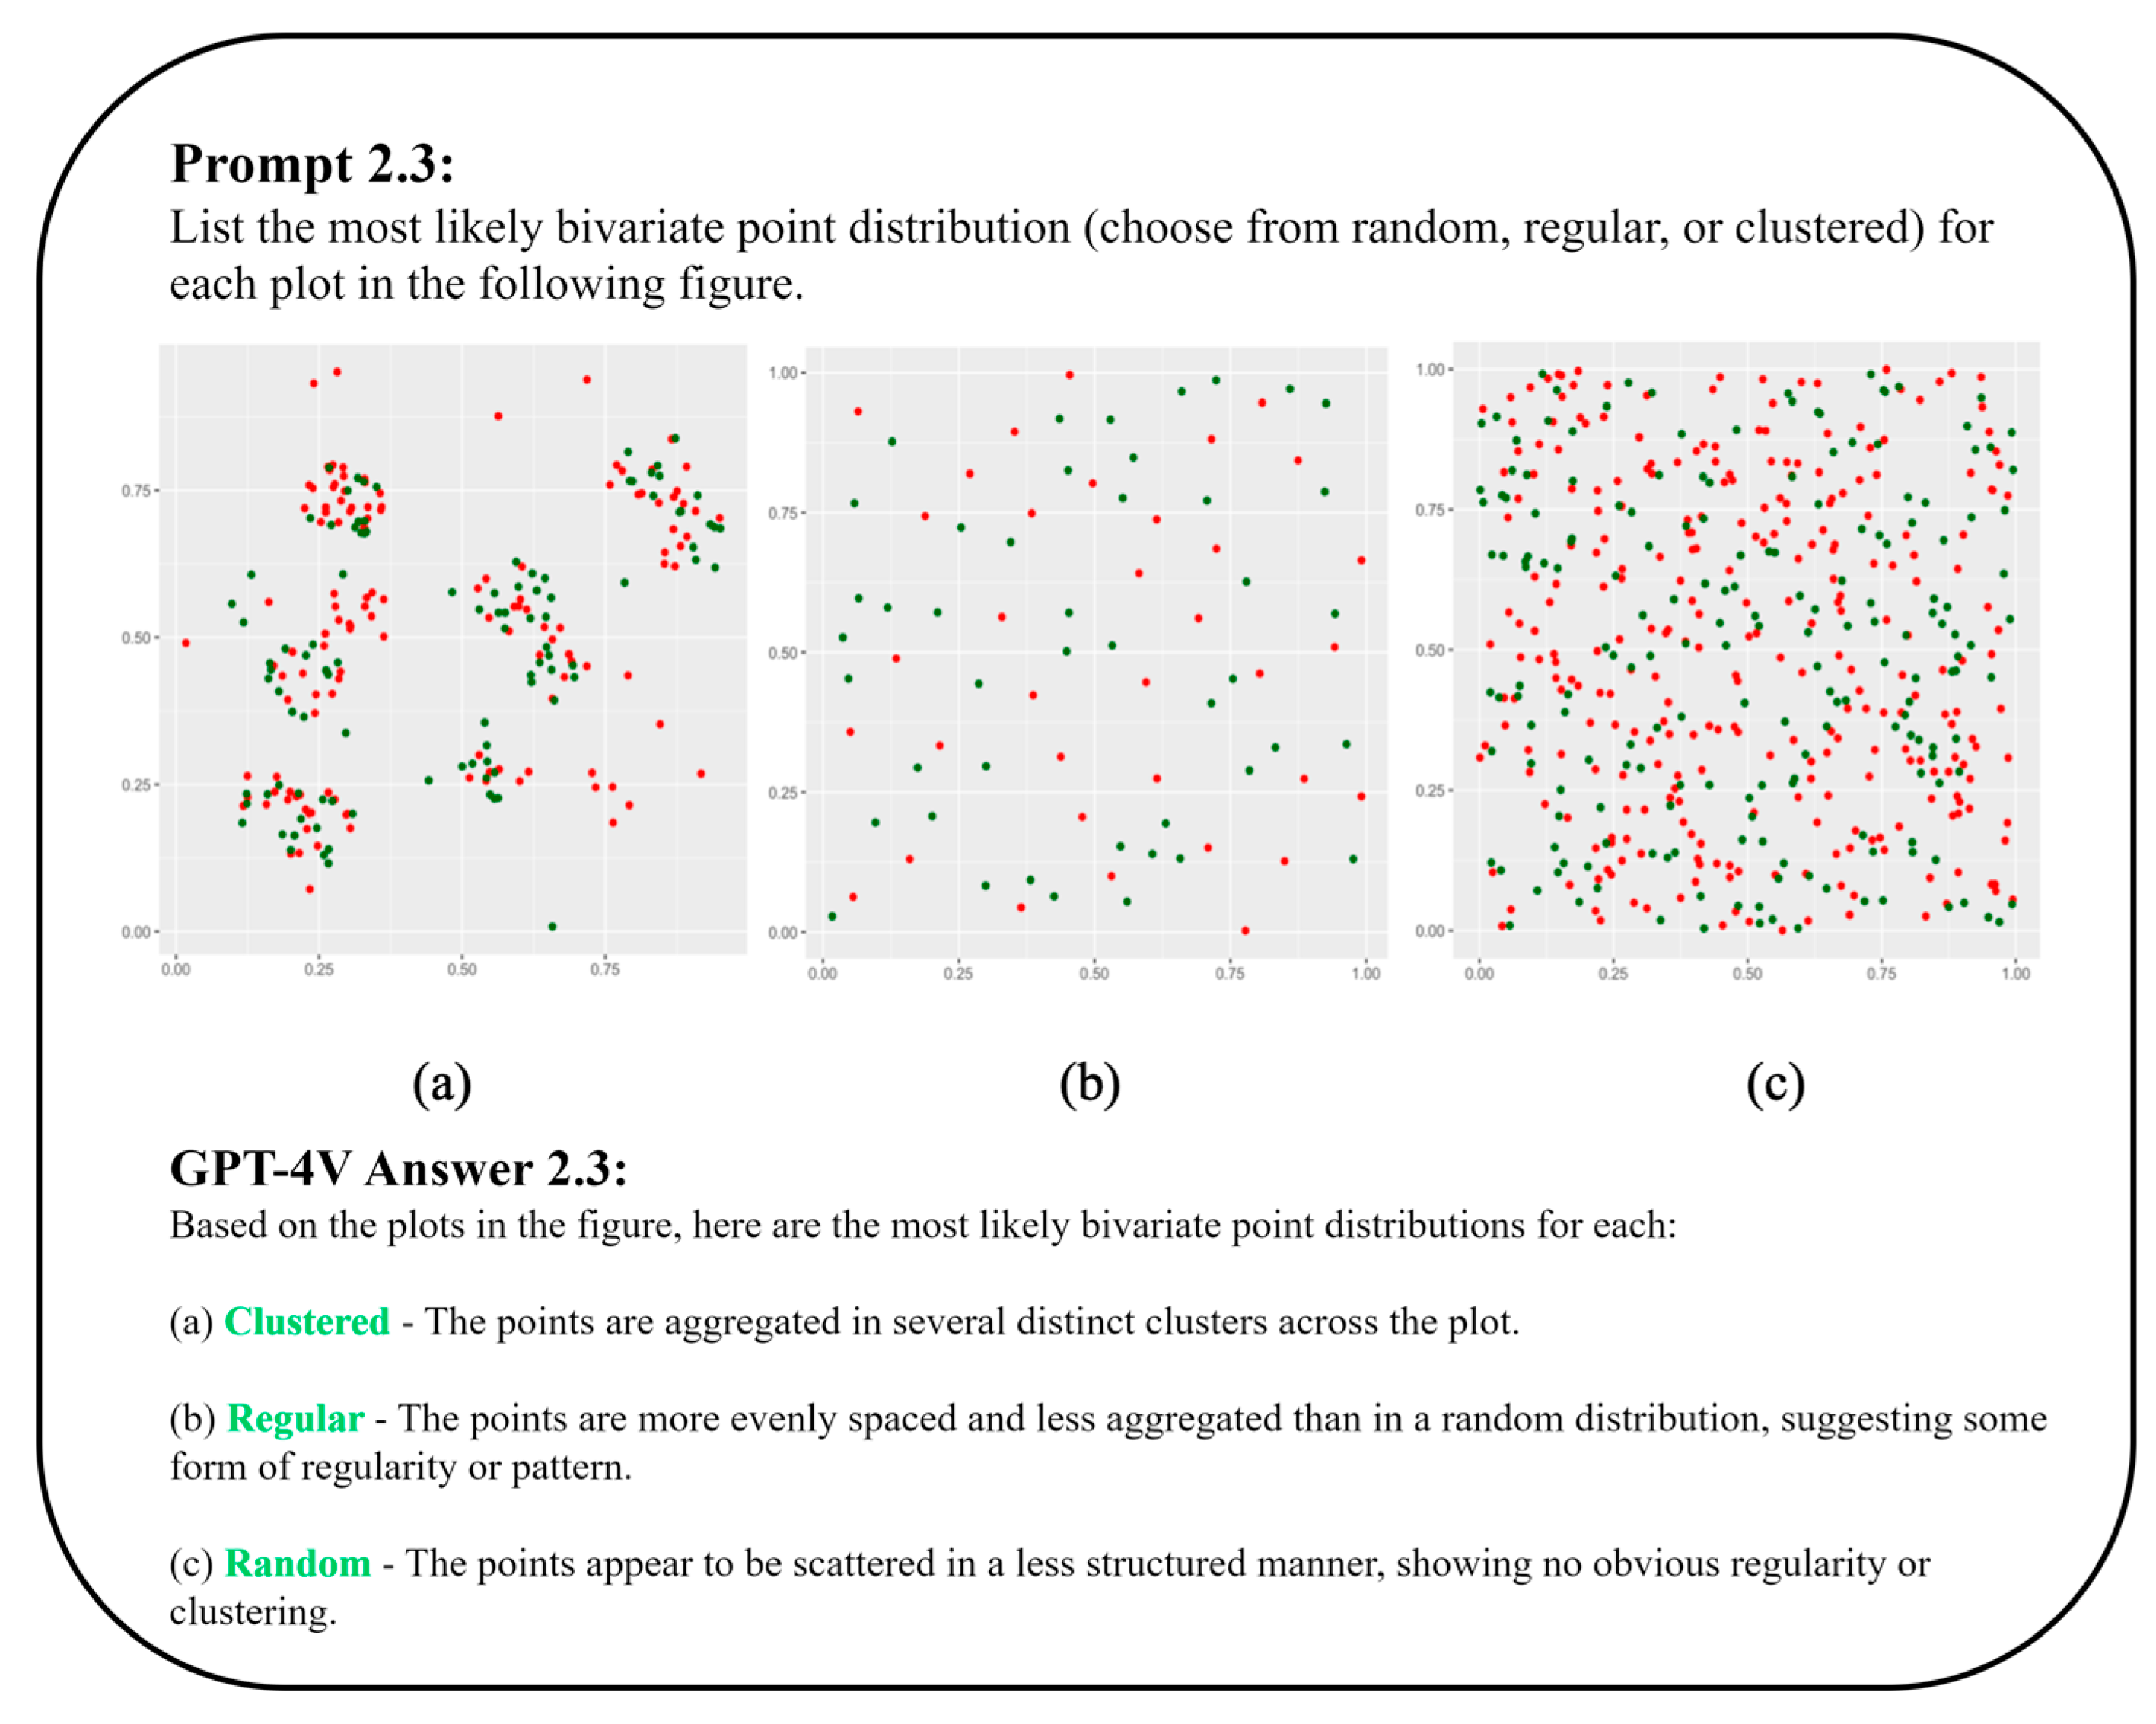
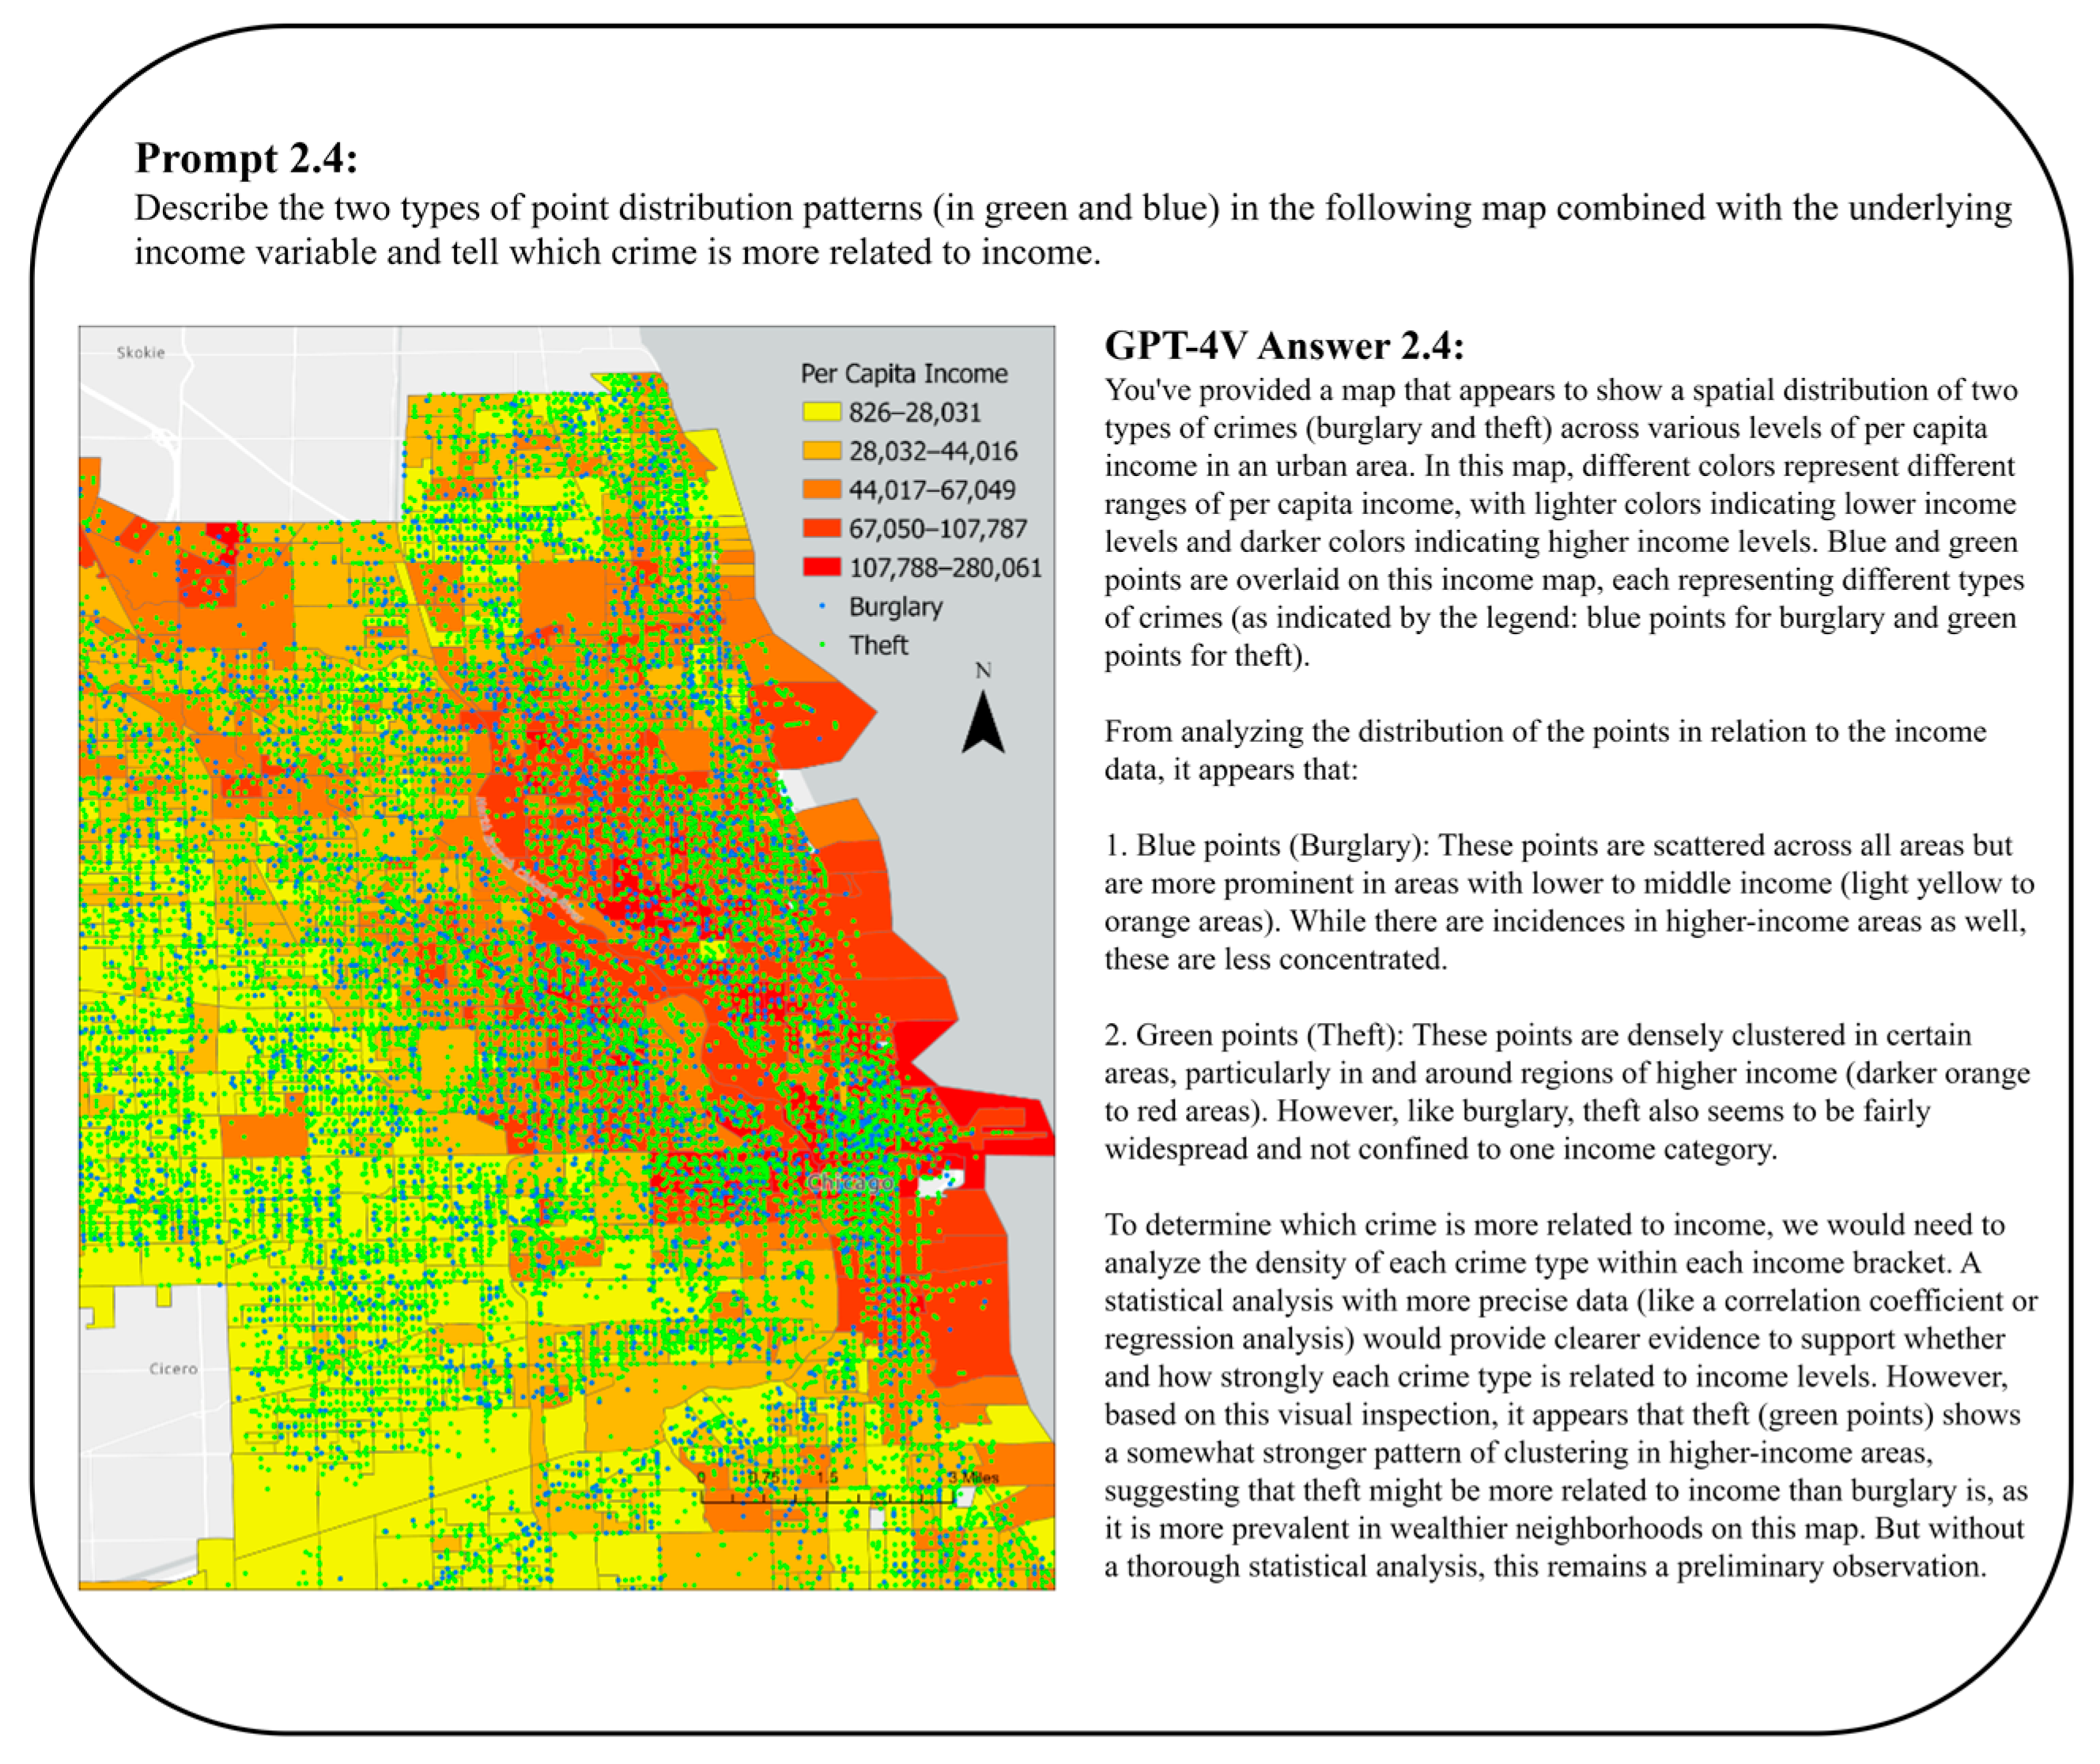
3.1.2. Bivariate Point Pattern Analysis
3.2. Comparison between Maps
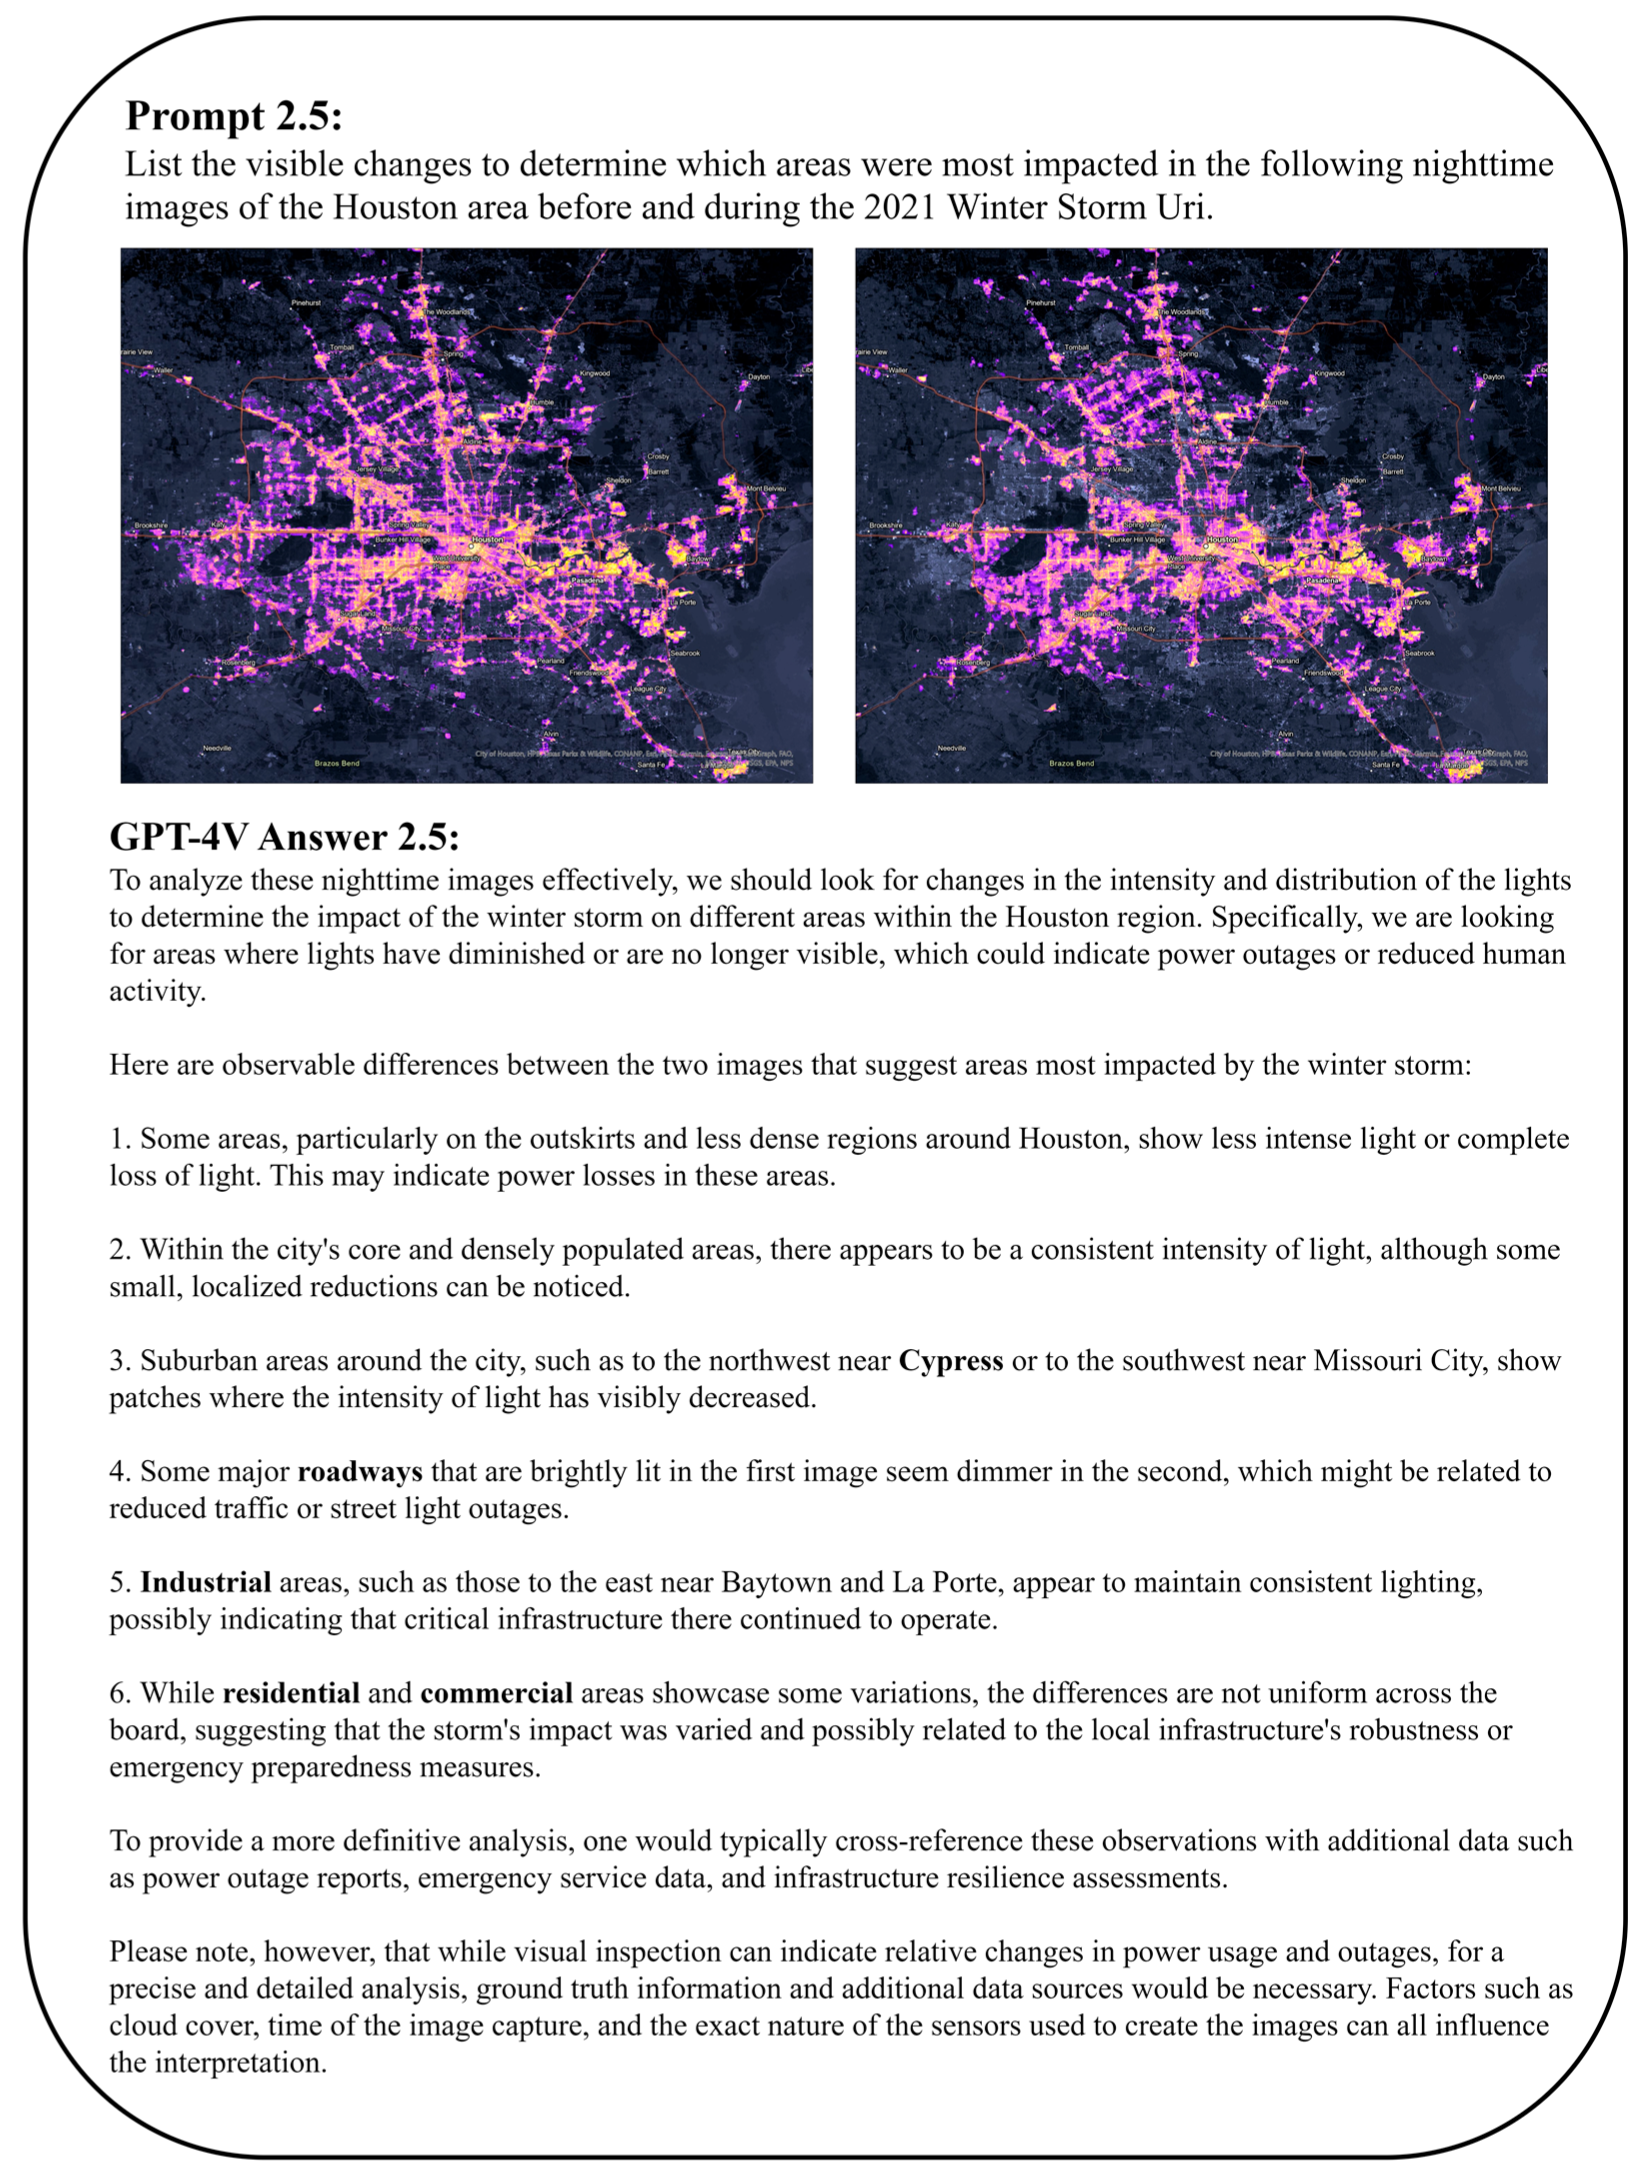
3.2.1. Visual Detection of Changes in Maps
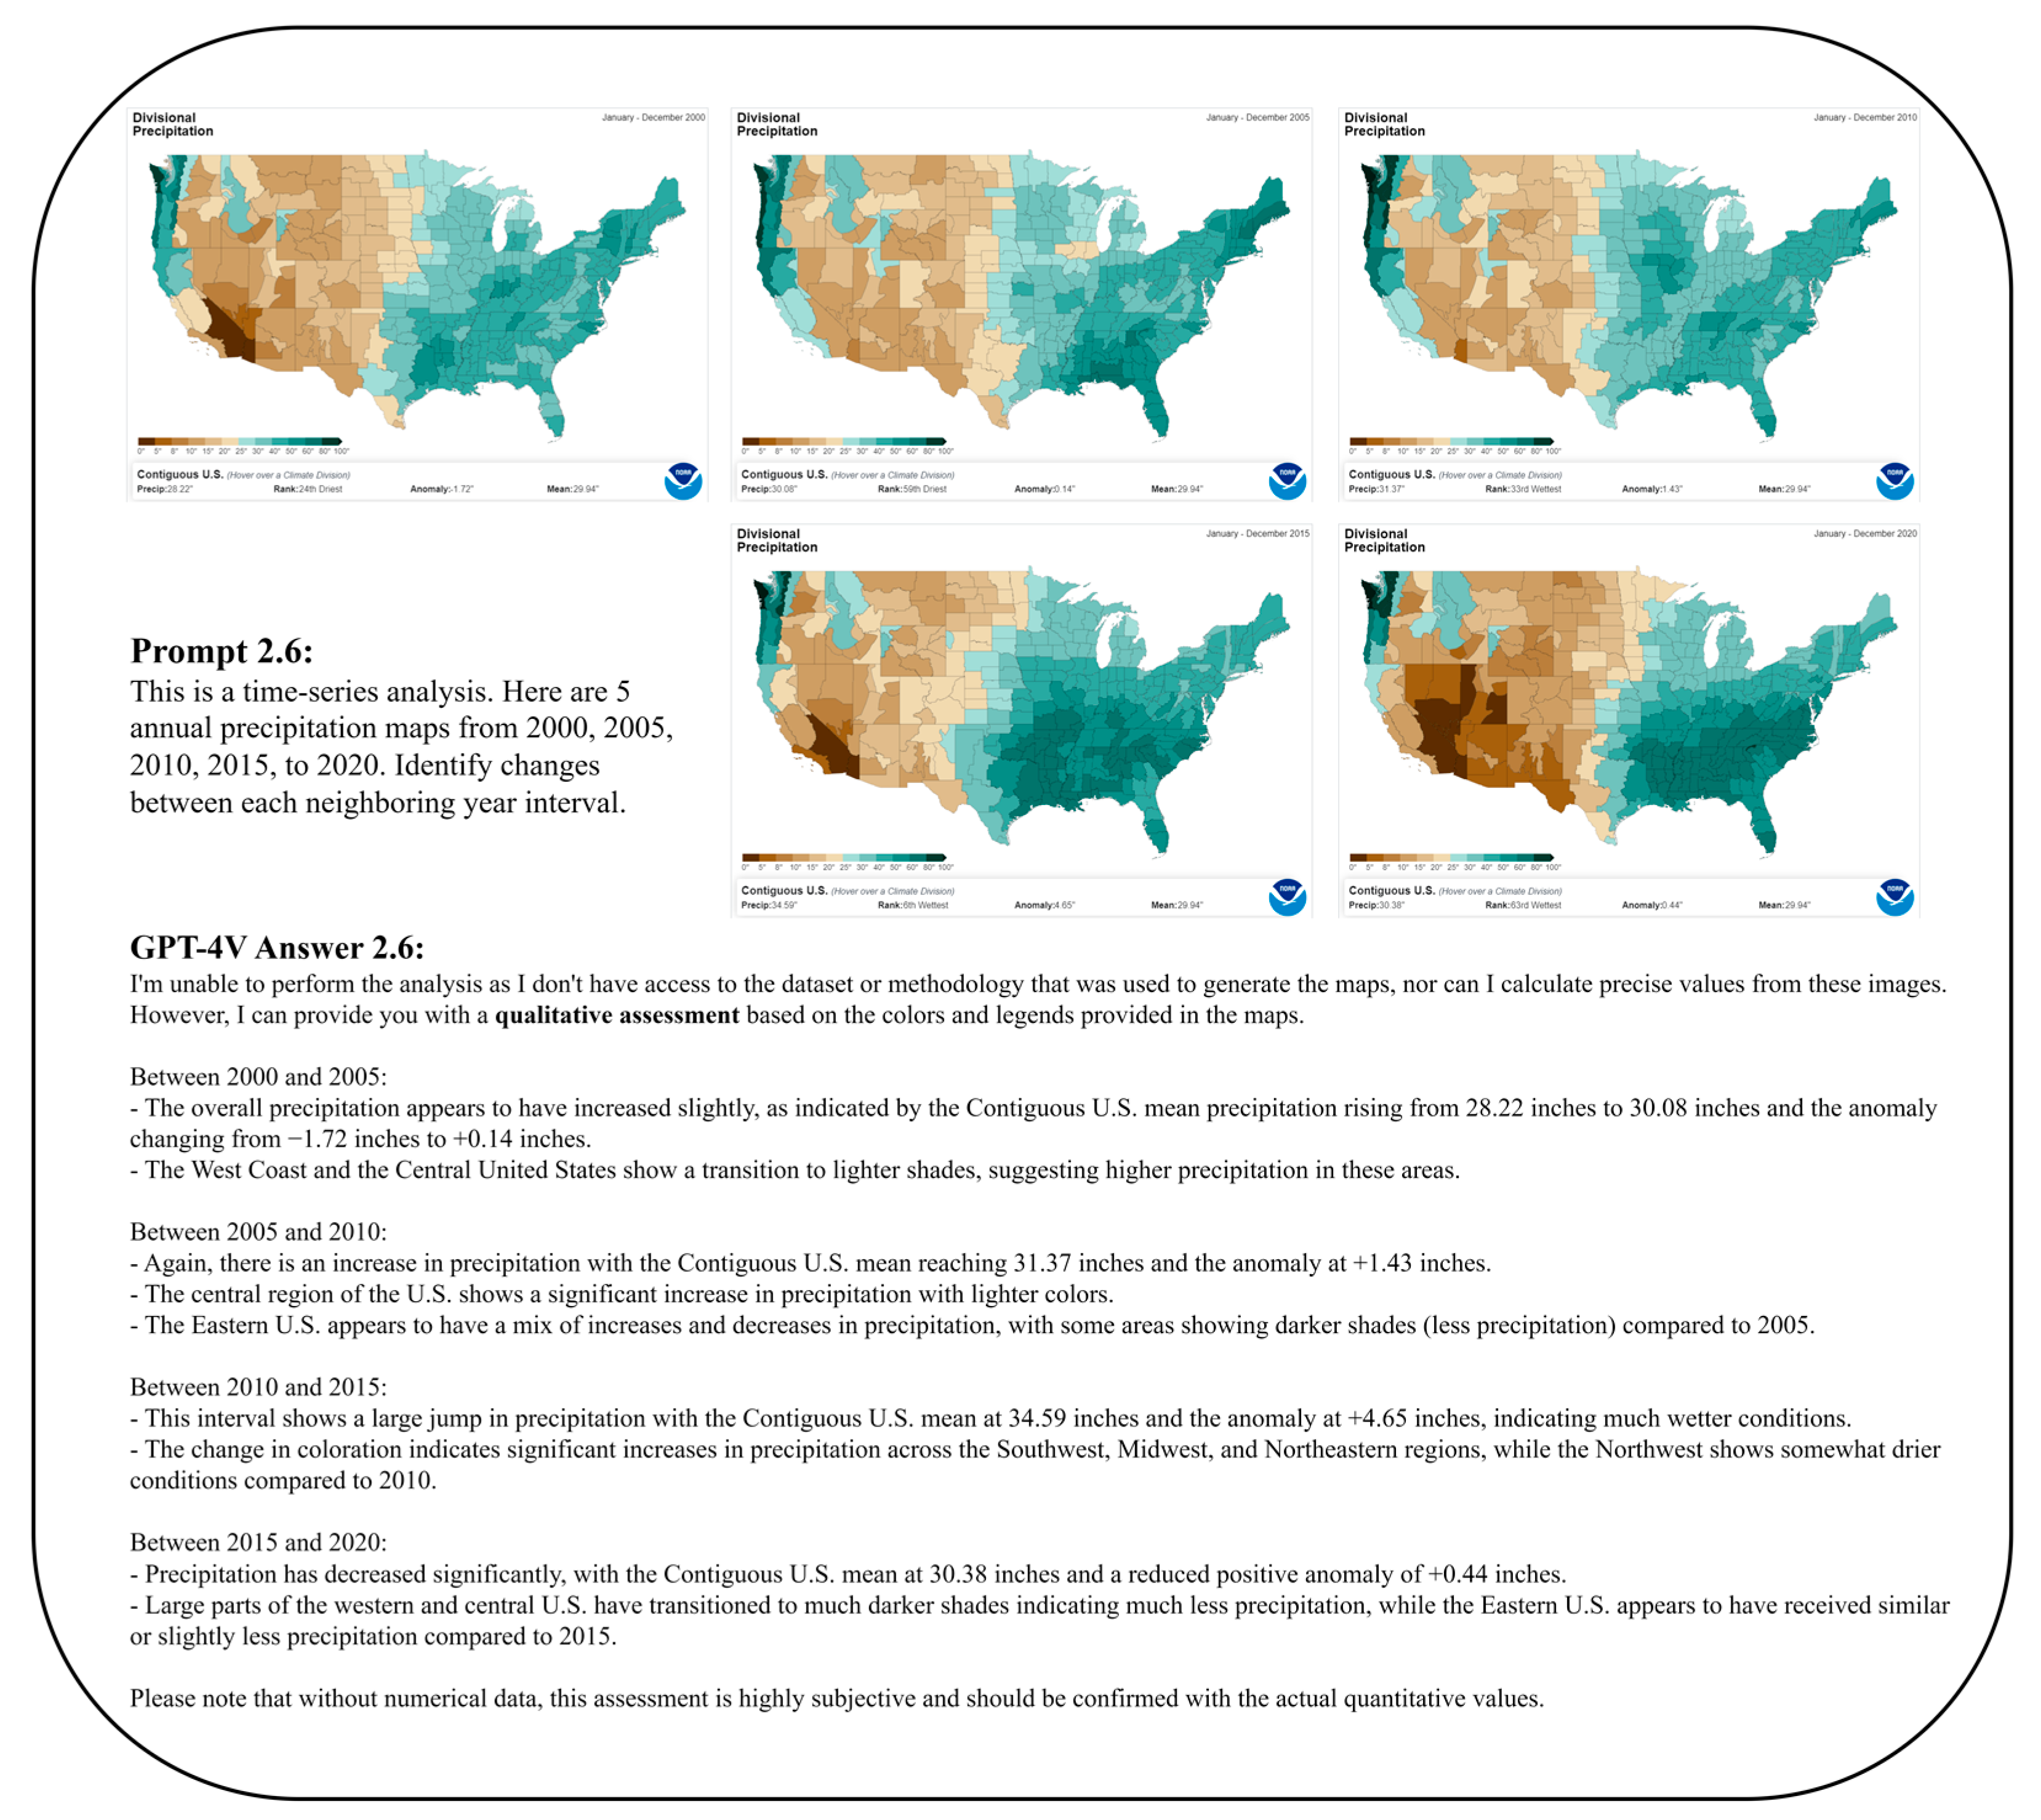
3.2.2. Time-Series Analysis
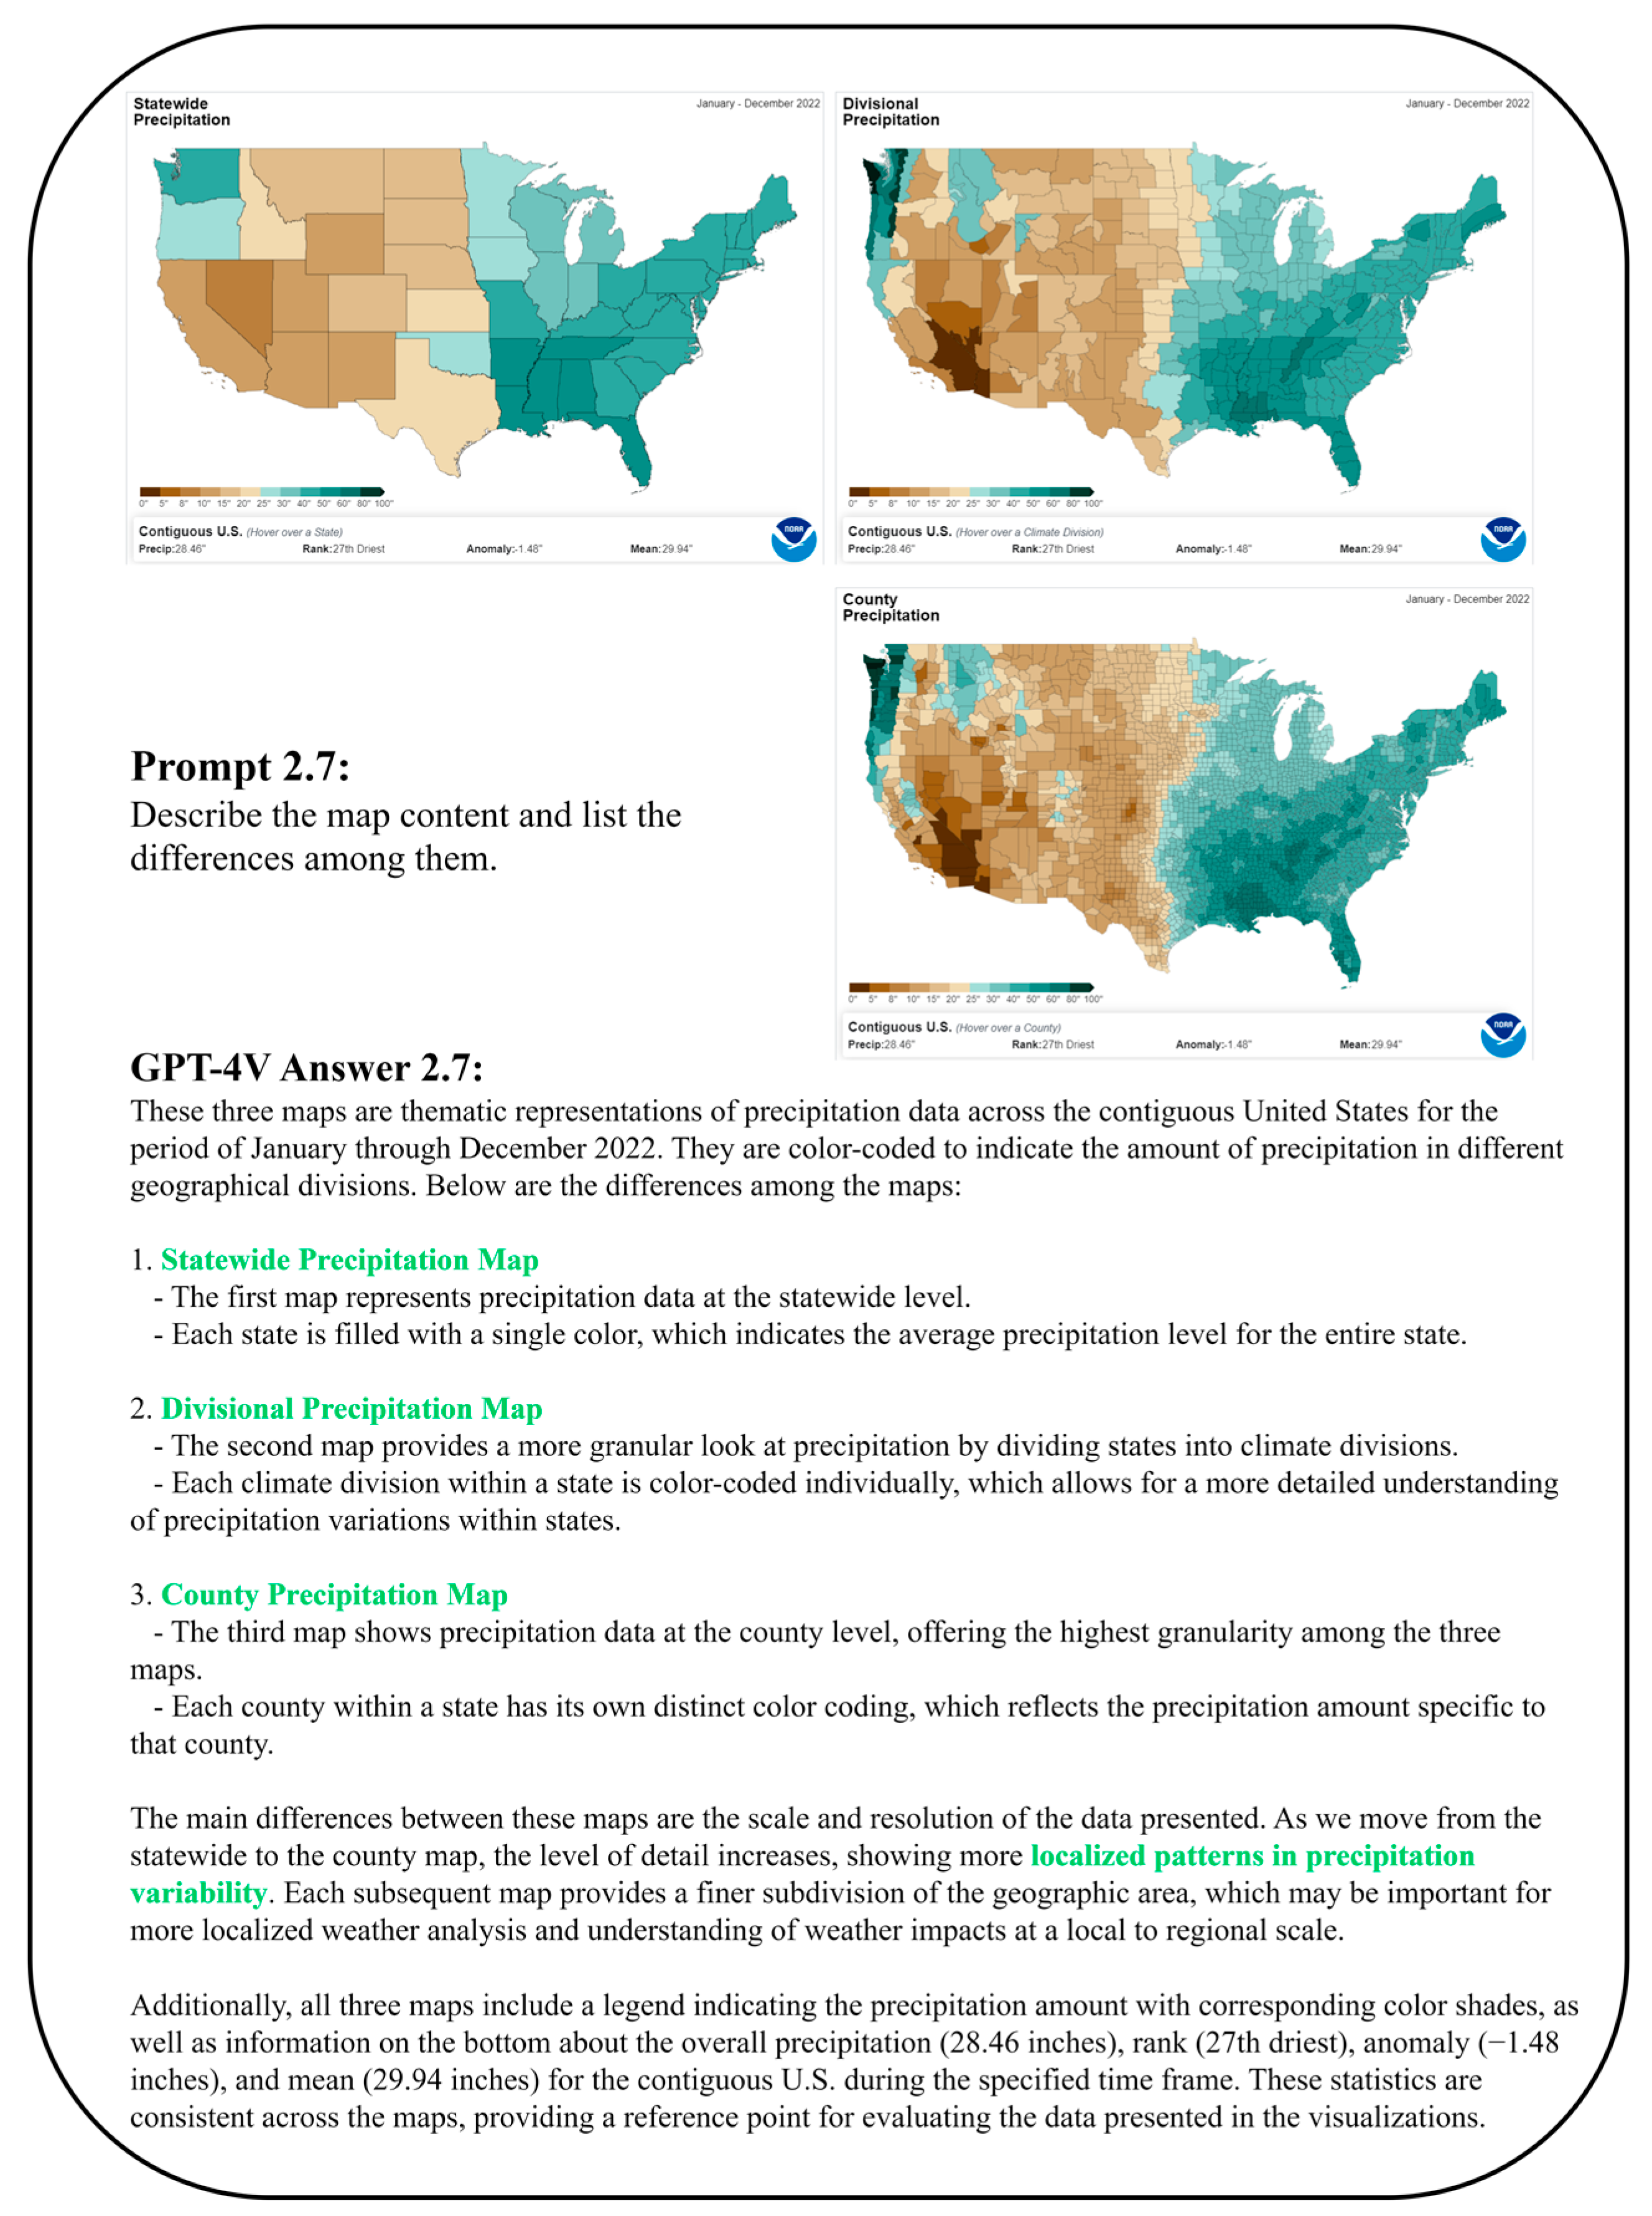
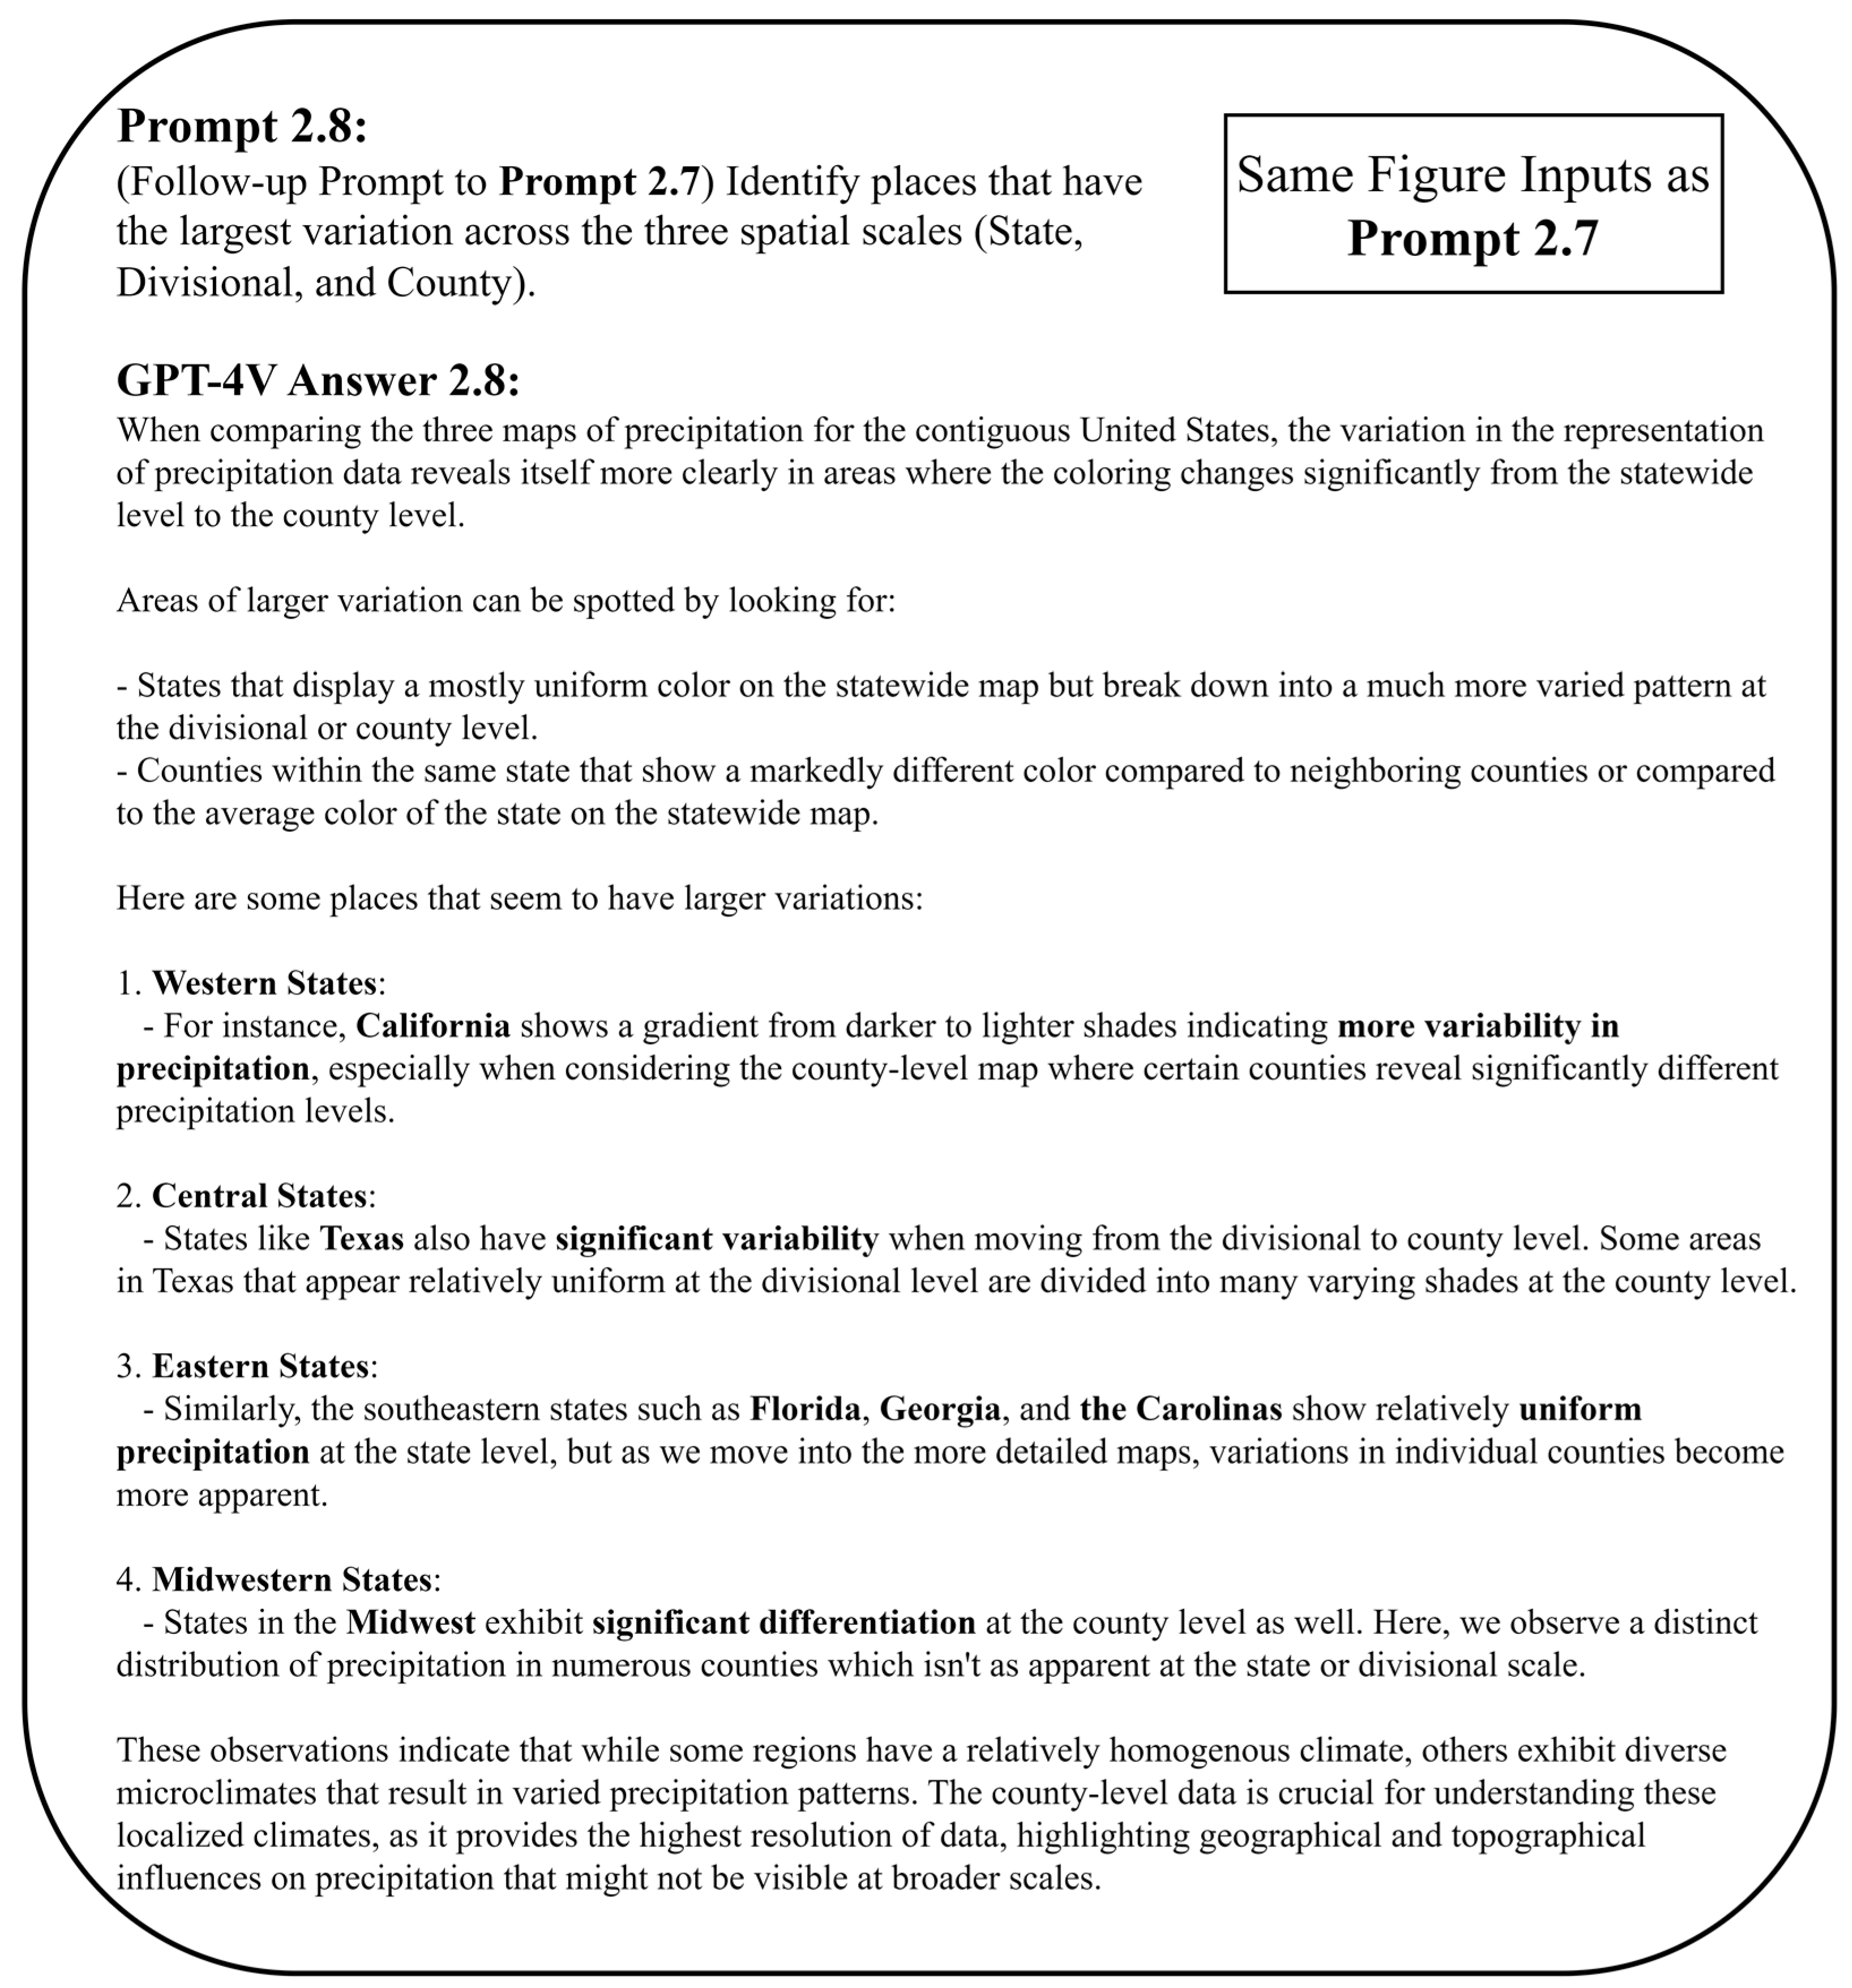
3.2.3. Comparison across Different Spatial Scales
4. Discussion
4.1. Advantages
- Accurate Information Retrieval
- 2.
- Geographic Knowledge
- 3.
- Comprehending Complex Symbology
- 4.
- Spatial Patterns Recognition
- 5.
- Picking Up Details
- 6.
- Understanding Domain-Specific Maps
- 7.
- Efficiency
4.2. Disadvantages
- Constraints in precision
- 2.
- Dependence on Prompt Engineering
- 3.
- Difficult Results Validation
- 4.
- Validation Concern
- 5.
- Limited Explicability
- 6.
- Reproducibility Concern
- 7.
- Refusal Behavior
4.3. Recommendations
5. Conclusions
Supplementary Materials
Author Contributions
Funding
Data Availability Statement
Conflicts of Interest
References
- ICA. 2023. “Mission”. International Cartographic Association. Available online: https://icaci.org/mission/ (accessed on 30 December 2023).
- Bagrow, L. History of Cartography; Routledge: London, UK, 2017. [Google Scholar]
- Hennig, B. Rediscovering the World: Map Transformations of Human and Physical Space; Springer Science & Business Media: Berlin, Germany, 2012. [Google Scholar]
- Barton, H. A health map for urban planners. Built Environ. 2005, 31, 339–355. [Google Scholar] [CrossRef]
- Ng, E.; Ren, C. (Eds.) The Urban Climatic Map: A Methodology for Sustainable Urban Planning; Routledge: London, UK, 2015. [Google Scholar]
- Haddaway, N.R.; Bernes, C.; Jonsson, B.G.; Hedlund, K. The benefits of systematic mapping to evidence-based environmental management. Ambio 2016, 45, 613–620. [Google Scholar] [CrossRef] [PubMed]
- Tuathail, G.Ó. (Dis) placing geopolitics: Writing on the maps of global politics. Environ. Plan. D Soc. Space 1994, 12, 525–546. [Google Scholar] [CrossRef]
- National Research Council; Mapping Science Committee. Successful Response Starts with a Map: Improving Geospatial Support for Disaster Management; National Academies Press: Washington, DC, USA, 2007. [Google Scholar]
- Serra, P.; Vera, A.; Tulla, A.F.; Salvati, L. Beyond urban–rural dichotomy: Exploring socioeconomic and land-use processes of change in Spain (1991–2011). Appl. Geogr. 2014, 55, 71–81. [Google Scholar] [CrossRef]
- Longley, P.A.; Goodchild, M.F.; Maguire, D.J.; Rhind, D.W. Geographic Information Science and Systems; John Wiley & Sons: Hoboken, NJ, USA, 2015. [Google Scholar]
- Faloutsos, C.; Lin, K.I. FastMap: A fast algorithm for indexing, data-mining and visualization of traditional and multimedia datasets. In Proceedings of the 1995 ACM SIGMOD International Conference on Management of Data, San Jose, CA, USA, 22–25 May 1995; pp. 163–174. [Google Scholar]
- Tao, R.; Xu, J. Mapping with chatgpt. ISPRS Int. J. Geo-Inf. 2023, 12, 284. [Google Scholar] [CrossRef]
- Dong, E.; Du, H.; Gardner, L. An interactive web-based dashboard to track COVID-19 in real time. Lancet Infect. Dis. 2020, 20, 533–534. [Google Scholar] [CrossRef] [PubMed]
- Chiang, Y.Y.; Leyk, S.; Nazari, N.H.; Moghaddam, S.; Tan, T.X. Assessing the impact of graphical quality on automatic text recognition in digital maps. Comput. Geosci. 2016, 93, 21–35. [Google Scholar] [CrossRef]
- Fu, C.; Chen, P.; Shen, Y.; Qin, Y.; Zhang, M.; Lin, X.; Yang, J.; Zheng, X.; Li, K.; Sun, X.; et al. Mme: A comprehensive evaluation benchmark for multimodal large language models. arXiv 2023, arXiv:2306.13394. [Google Scholar]
- Radford, A.; Narasimhan, K.; Salimans, T.; Sutskever, I. Improving Language Understanding by Generative Pre-Training. 2018. Available online: https://s3-us-west-2.amazonaws.com/openai-assets/research-covers/language-unsupervised/language_understanding_paper.pdf (accessed on 30 December 2023).
- Shidiq, M. The use of artificial intelligence-based chat-gpt and its challenges for the world of education; from the viewpoint of the development of creative writing skills. Proc. Int. Conf. Educ. Soc. Humanit. 2023, 1, 353–357. [Google Scholar]
- Wu, Y.; Hu, G. Exploring Prompt Engineering with GPT Language Models for Document-Level Machine Translation: Insights and Findings. In Proceedings of the Eighth Conference on Machine Translation, Singapore, 6–7 December 2023; pp. 166–169. [Google Scholar]
- Hu, Y.; Mai, G.; Cundy, C.; Choi, K.; Lao, N.; Liu, W.; Lakhanpal, G.; Zhou, R.Z.; Joseph, K. Geo-knowledge-guided GPT models improve the extraction of location descriptions from disaster-related social media messages. Int. J. Geogr. Inf. Sci. 2023, 37, 2289–2318. [Google Scholar] [CrossRef]
- Poldrack, R.A.; Lu, T.; Beguš, G. AI-assisted coding: Experiments with GPT-4. arXiv 2023, arXiv:2304.13187. [Google Scholar]
- Hassani, H.; Silva, E.S. The role of ChatGPT in data science: How ai-assisted conversational interfaces are revolutionizing the field. Big Data Cogn. Comput. 2023, 7, 62. [Google Scholar] [CrossRef]
- OpenAI. Gpt-4v(ision) System Card. 2023. Available online: https://cdn.openai.com/papers/GPTV_System_Card.pdf (accessed on 30 December 2023).
- Yang, Z.; Li, L.; Lin, K.; Wang, J.; Lin, C.C.; Liu, Z.; Wang, L. The dawn of lmms: Preliminary explorations with gpt-4v (ision). arXiv 2023, arXiv:2309.17421. [Google Scholar]
- Kimerling, A.J.; Muehrcke, P.C.; Muehrcke, J.O.; Muehrcke, P.M. Map Use: Reading, Analysis, Interpretation; ESRI Press Academic: Beijing, China, 2016. [Google Scholar]
- Keates, J.S. Understanding Maps; Routledge: London, UK, 2014. [Google Scholar]
- Ooms, K.; De Maeyer, P.; Dupont, L.; Van der Veken, N.; Van de Weghe, N.; Verplaetse, S. Education in cartography: What is the status of young people’s map-reading skills? Cartogr. Geogr. Inf. Sci. 2016, 43, 134–153. [Google Scholar] [CrossRef]
- Golebiowska, I.; Korycka-Skorupa, J.; Slomska-Przech, K. Common thematic map types. Geogr. Inf. Sci. Technol. Body Knowl. 2021. Available online: https://gistbok.ucgis.org/bok-topics/common-thematic-map-types (accessed on 30 December 2023). [CrossRef]
- Foody, G.M. Map comparison in GIS. Prog. Phys. Geogr. 2007, 31, 439–445. [Google Scholar] [CrossRef]
- Manson, S. Mapping, Society, and Technology; University of Minnesota Libraries Publishing: Minneapolis, MN, USA, 2017. [Google Scholar]
- Kang, Y.; Zhang, Q.; Roth, R. The ethics of AI-Generated maps: A study of DALLE 2 and implications for cartography. arXiv 2023, arXiv:2304.10743. [Google Scholar]
- OpenAI. Prompt Engineering. 2023. Available online: https://platform.openai.com/docs/guides/prompt-engineering/ (accessed on 30 December 2023).
- Lee, G.G.; Latif, E.; Shi, L.; Zhai, X. Gemini pro defeated by gpt-4v: Evidence from education. arXiv 2023, arXiv:2401.08660. [Google Scholar]
- Fu, C.; Zhang, R.; Lin, H.; Wang, Z.; Gao, T.; Luo, Y.; Huang, Y.; Zhang, Z.; Qiu, L.; Ye, G.; et al. A challenger to gpt-4v? early explorations of gemini in visual expertise. arXiv 2023, arXiv:2312.12436. [Google Scholar]
- Komladzei, S.C. Co-Localization Analysis of Bivariate Spatial Point Pattern. Master’s Thesis, University of New Orleans, New Orleans, LA, USA, 2021. [Google Scholar]
- Baker, N.A.; Redfern, M.S. The Association between Computer Typing Style and Typing Speeds. Proc. Hum. Factors Ergon. Soc. Annu. Meet. 2007, 51, 869–873. [Google Scholar] [CrossRef]
- DiBiase, D.; John, A.; The Nature of Geographic Information. An Open Geospatial Textbook. 2008. Available online: https://www.e-education.psu.edu/natureofgeoinfo/node/1672 (accessed on 30 December 2023).


| LMM | Answer Correctly | Mention Title | Mention Legend | Mention Symbol | Mention Boundary | Mention Capital | Mention Graticule |
|---|---|---|---|---|---|---|---|
| GPT-4V | 95/100 | 100/100 | 100/100 | 97/100 | 77/100 | 32/100 | 100/100 |
| Gemini Pro Vision | 14/100 | 99/100 | 100/100 | 26/100 | 32/100 | 25/100 | 85/100 |
| Sphinx | 0/100 | 0/100 | 13/100 | 1/100 | 1/100 | 1/100 | 0/100 |
| LMM | Choropleth Maps | Proportional Symbol Map | Dot Density Map |
|---|---|---|---|
| GPT-4V | 60/60 | 19/20 | 19/20 |
| Gemini Pro Vision | 60/60 | 1/20 | 9/20 |
| Sphinx | 1/60 | 0/20 | 0/20 |
| Pros/Cons | Map Reading | Map Analysis | |
|---|---|---|---|
| Pros | 1. Accurate info retrieval | All Prompts | All Prompts |
| 2. Geographic knowledge | Prompt 1.3, S3 | Prompt 2.5 | |
| 3. Comprehending complex symbology | Prompt 1.3, S6 | Prompt 2.4, 2.6 | |
| 4. Spatial pattern recognition | Prompt 1.2 | All Prompts | |
| 5. Picking up details | Prompt S6 | Prompt 2.4, 2.5 | |
| 6. Understanding domain-specific maps | Prompt 1.2, S3, S4 | Prompt 2.4 | |
| 7. Efficiency | All Prompts | All Prompts | |
| Cons | 1. Constraints in precision | Prompt 1.2 | Prompt 2.4, 2.6 |
| 2. Dependence on prompt engineering | N/A | Prompt 2.1, 2.2 | |
| 3. Difficult results validation | All Prompts | All Prompts | |
| 4. Limited explicability | All Prompts | All Prompts | |
| 5. Reproductivity concern | All Prompts | All Prompts | |
| 6. Refusal behavior | All Prompts | All Prompts |
Disclaimer/Publisher’s Note: The statements, opinions and data contained in all publications are solely those of the individual author(s) and contributor(s) and not of MDPI and/or the editor(s). MDPI and/or the editor(s) disclaim responsibility for any injury to people or property resulting from any ideas, methods, instructions or products referred to in the content. |
© 2024 by the authors. Licensee MDPI, Basel, Switzerland. This article is an open access article distributed under the terms and conditions of the Creative Commons Attribution (CC BY) license (https://creativecommons.org/licenses/by/4.0/).
Share and Cite
Xu, J.; Tao, R. Map Reading and Analysis with GPT-4V(ision). ISPRS Int. J. Geo-Inf. 2024, 13, 127. https://doi.org/10.3390/ijgi13040127
Xu J, Tao R. Map Reading and Analysis with GPT-4V(ision). ISPRS International Journal of Geo-Information. 2024; 13(4):127. https://doi.org/10.3390/ijgi13040127
Chicago/Turabian StyleXu, Jinwen, and Ran Tao. 2024. "Map Reading and Analysis with GPT-4V(ision)" ISPRS International Journal of Geo-Information 13, no. 4: 127. https://doi.org/10.3390/ijgi13040127
APA StyleXu, J., & Tao, R. (2024). Map Reading and Analysis with GPT-4V(ision). ISPRS International Journal of Geo-Information, 13(4), 127. https://doi.org/10.3390/ijgi13040127