Article

Comparison of Different Green Space Measures and Their Impact on Dementia Cases in South Korea: A Spatial Panel Analysis

1
Department of Convergence and Fusion System Engineering, Kyungpook National University, Sangju 37224, Republic of Korea
2
Department of Location-Based Information System, Kyungpook National University, Sangju 37224, Republic of Korea
*
Author to whom correspondence should be addressed.
These authors contributed equally to this work.
ISPRS Int. J. Geo-Inf. 2024, 13(4), 126; https://doi.org/10.3390/ijgi13040126
Submission received: 30 January 2024 / Revised: 27 March 2024 / Accepted: 6 April 2024 / Published: 9 April 2024
(This article belongs to the Special Issue HealthScape: Intersections of Health, Environment, and GIS&T)

Abstract

:
Dementia has become a profound public health problem due to the number of patients increasing every year. Previous studies have reported that environmental factors, including greenness, may influence the development and progression of dementia. Studies have found that exposure to green space is associated with a lower incidence of dementia. However, many definitions of green space exist, and the effects of its use may differ with the type of green space. Therefore, two types of green space measures were considered in this study to assess the differences in their impact on the prevalence of dementia among females and males. This study used five years of data (2017–2021) from 235 districts in South Korea. The two green space measures used were open space density and normalized difference vegetation index (NDVI), which were derived from satellite images. The analysis utilized a combination of traditional and spatial panel analyses to account for the spatial and temporal effects of independent variables on dementia prevalence. The spatial autocorrelation results revealed that both measures of greenness were spatially correlated with dementia prevalence. The spatial panel regression results revealed a significant positive association between NDVI and dementia prevalence, and open space had a negative association with dementia prevalence in both genders. The difference in the findings can serve as the basis for further research when choosing a greenspace measure, as it affects the analysis results, depending on the objective of the study. This study adds to the knowledge regarding improving dementia studies and the application of spatial panel analysis in epidemiological studies.

1. Introduction

Aging is universal, and improving healthcare can increase life expectancy and improve the health of older people. Dementia is a cognitive disease that affects older people and leads to memory loss and reduced cognitive abilities. This impairment has a marked effect on the daily lives of patients and physical, psychological, social, and financial impacts on those affected and their families [1]. Additionally, the number of dementia cases in older people is increasing annually and is expected to triple in the next 30 years [2]. The public has limited information on whether dementia risk is clustered geographically [3], how this occurs, and how dementia may be related to sociodemographic and built environment factors [4]. In 2020, it was estimated that 10.25% of people over the age of 65 years have dementia, and this figure is expected to increase to approximately 15.91% by 2050. The rapid pace of aging suggests that the prevalence of dementia will increase significantly in the coming years [5].
Previous studies have demonstrated that environmental factors, such as air pollution and a lack of green spaces, are potential risk factors for cognitive impairment, including dementia [6,7,8]. Another study emphasized the important role that green space plays in preventing dementia [9]. Green spaces in residential areas can improve individuals’ physical health [10,11], reduce stress, and provide clean air [12]. Regarding recreation, green spaces provide space for the community and access to natural landscapes, potentially increasing physical activity and promoting healthy lifestyles to reduce the risk of dementia, brain atrophy, and cognitive decline [1,2,13]. The relationship between the environment and cognitive health is of growing interest, and previous studies have shown that spending time in green space can positively impact cognitive function, as well as reduce the risk of developing dementia [13].
In South Korea, studies on dementia cases have already been conducted to evaluate the association with health status [14], socioeconomic status, and healthcare accessibility [15]; gender-based analyses have also been conducted [16]. In addition, a spatial analysis was conducted to develop a predictive model for regional dementia in South Korea using a geographically weighted regression [3]. Geographic information systems (GISs) have been applied in several studies to investigate the relationship between dementia and the environment [12,17,18,19]. Another study investigated the insufficiency of assumptions regarding disease occurrence response in conventional spatial models [20]. Temporal and spatial changes in geographic data are essential for inferring the relationships between variables. Spatial panel analysis is recommended because of its ability to examine spatial and temporal effects. Panel and spatial panel regressions can be used to examine how variables, such as the environment, change over time and how they may affect health outcomes [18,21,22], considering the correlation between observations over time [23]. Moreover, panel data allow researchers to substantially increase statistical validity in policy analysis and program evaluation compared to statistical methods using cross-sectional data [24,25,26].
The normalized difference vegetation index (NDVI) and built green space, such as parks and open spaces, are commonly used as measures of greenness in epidemiology and environmental studies. NDVI data have been used to represent green space exposure [27,28], in combination with land cover data, in several studies on dementia [29]. In these studies, the NDVI values have differed depending on the scale and type of data used, such as buffer or distance data for individual studies, or aggregated NDVI values for population-level studies [30]. Additionally, open space is most commonly used to assess residential green space and its relationship with dementia [13]. Owing to differences in data types, the type of green space data used and how to capture their respective effects by analyzing the combination of green space data should be considered. We hypothesized that the difference in data entry between NDVI and open space density leads to different associations between dementia and green space exposure.
This study aims to compare the influence of two types of green space exposure—NDVI and open space—on the prevalence of dementia among different genders in South Korea from 2017 to 2021. Panel and spatial panel analyses were performed to investigate how green space affects dementia prevalence and reduces the spillover effect in aggregated data [31]. By comparing the impacts of different types of green space from the perspective of different genders, this study provides new insights into the risk factors for dementia and the application of greenness data to the study of cognitive diseases. Additionally, employing conventional panel and spatial panel analyses enhances the novelty of this study. The results of this study can support further research on the use of green space data in advanced dementia health studies.

2. Materials and Methods
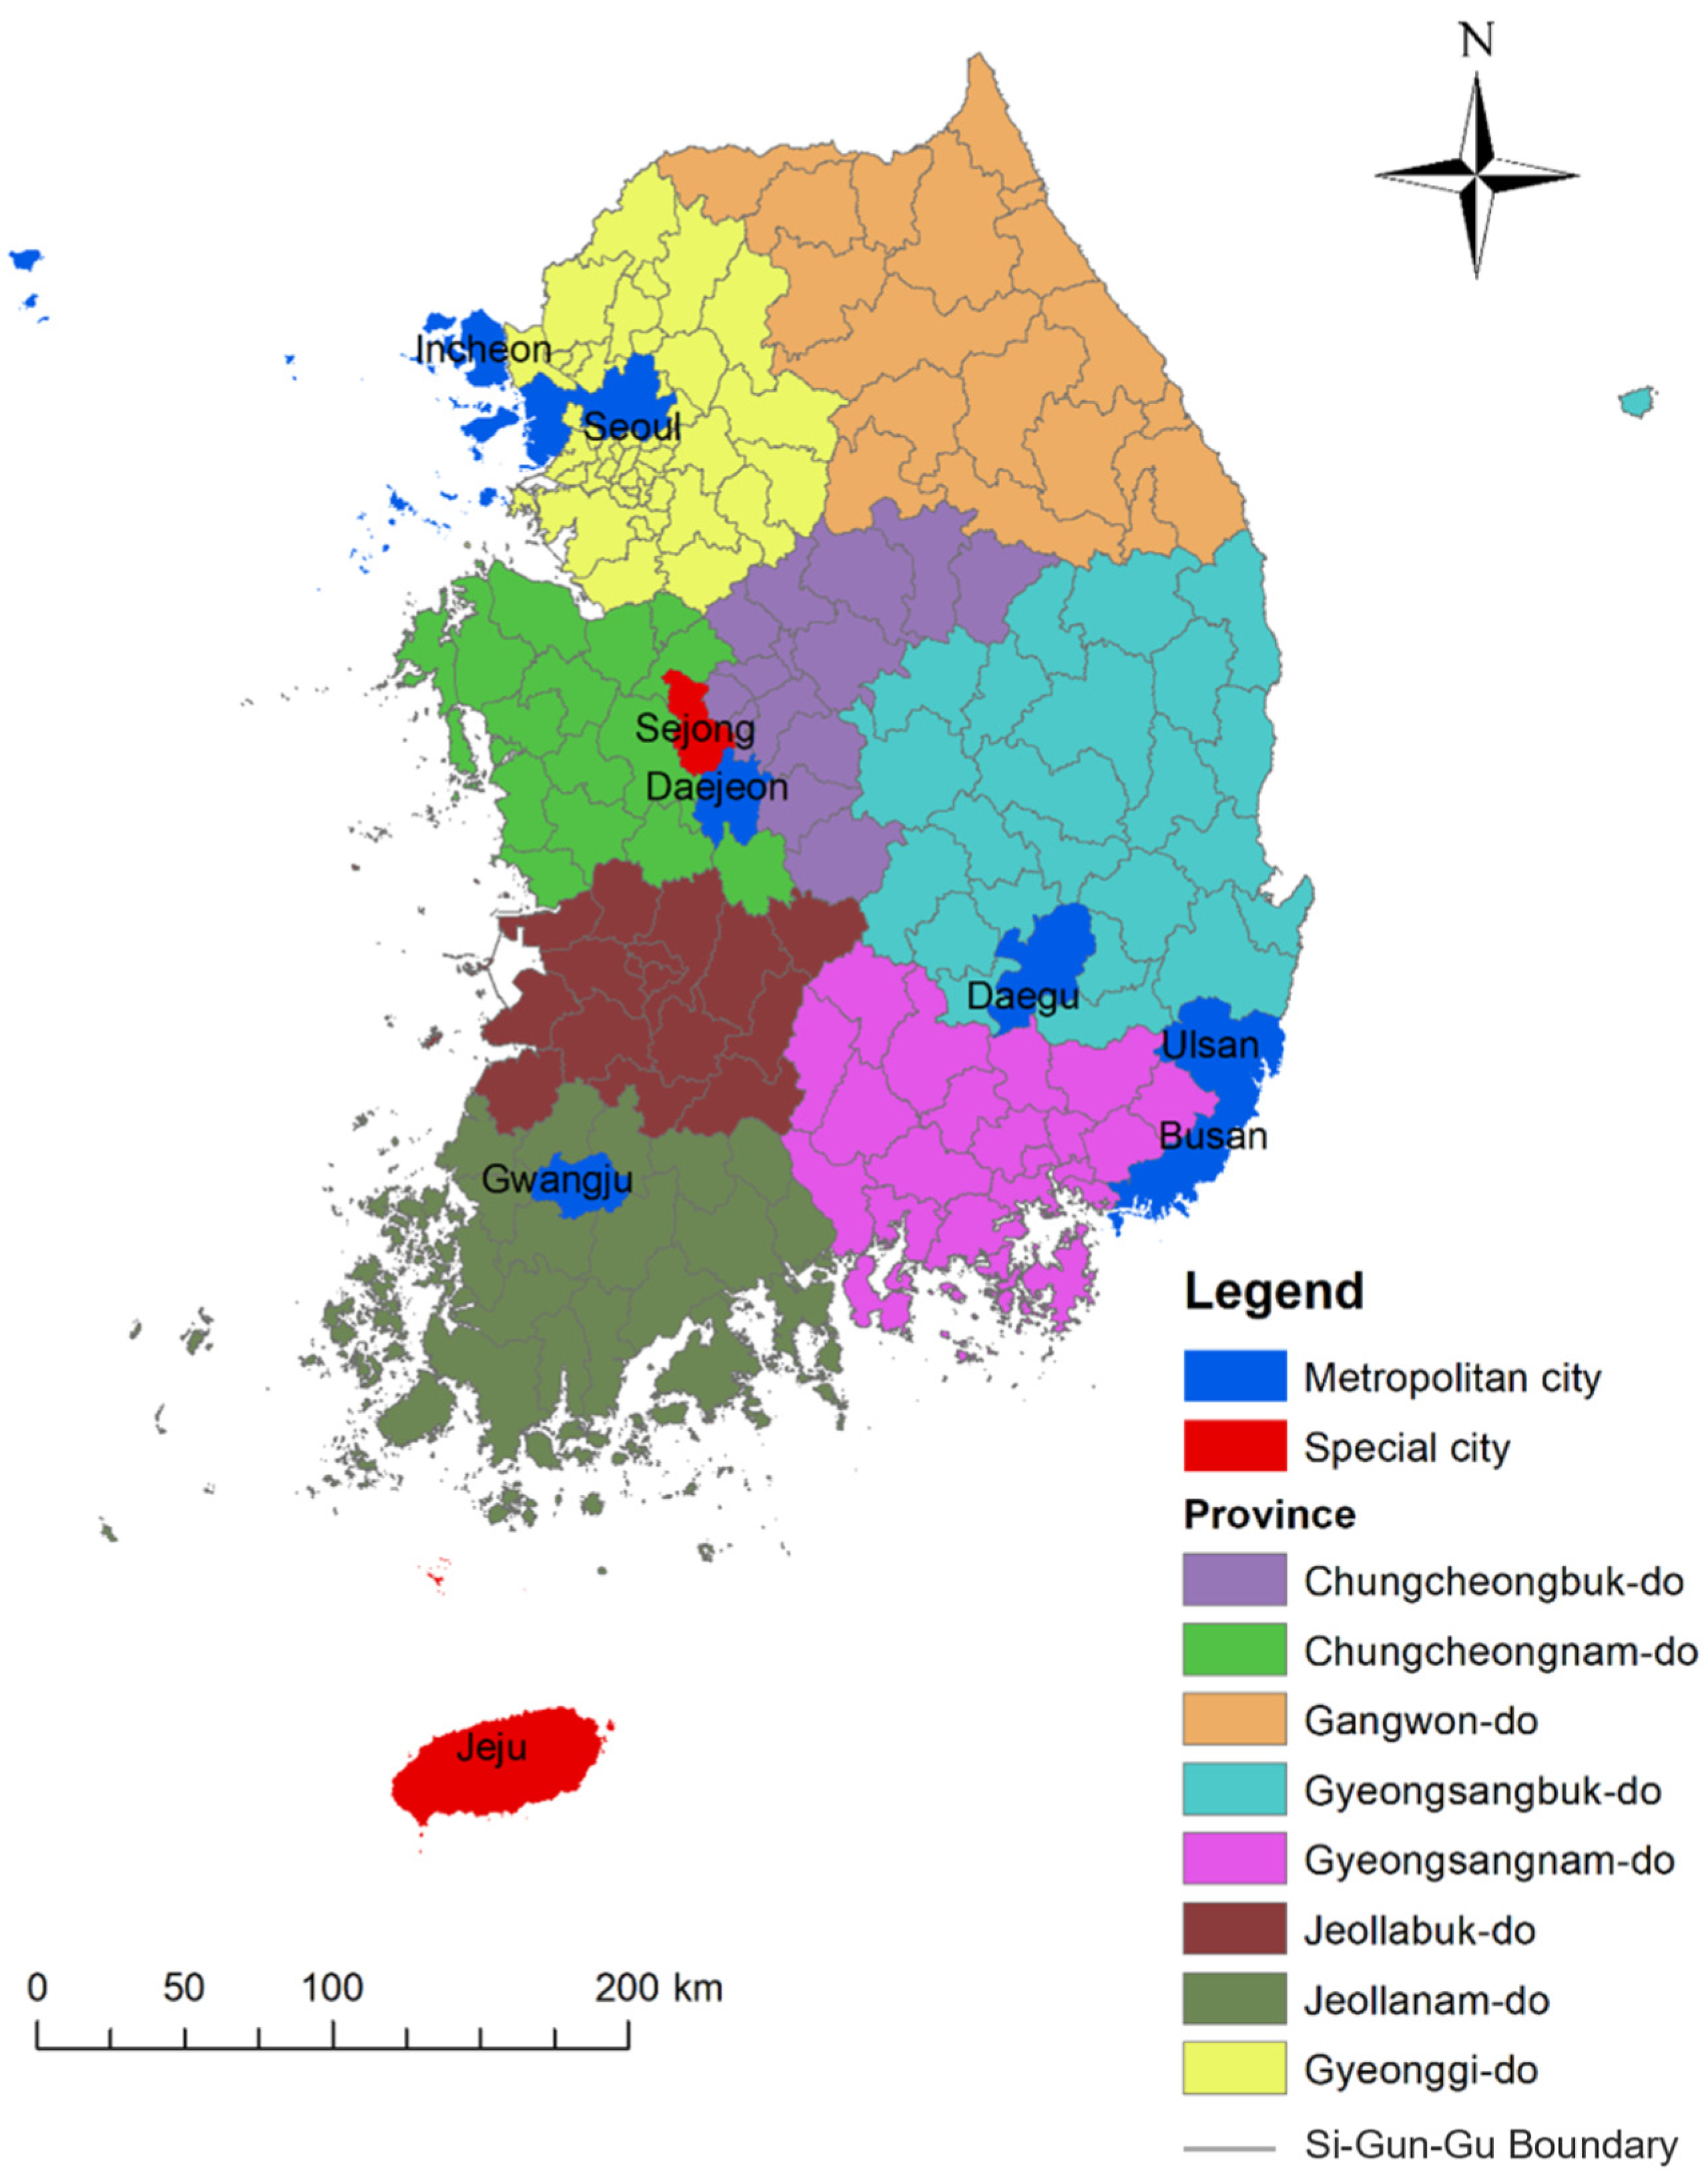
2.1. Study Area

This study focused on patients with dementia in South Korea. South Korea consists of eight provinces, seven metropolitan cities (Seoul, Daegu, Busan, Ulsan, Daejeon, Incheon, and Gwangju), two special autonomous cities (Sejong and Jeju), and has a total area of 250 si/gun/gu (http://nationalatlas.ngii.go.kr/, accessed on 7 July 2022) as shown in Figure 1. The metropolitan cities have a population of more than one million, whereas Sejong and Jeju are self-governing entities with populations of less than 500,000. In this study, data were obtained at the si/gun/gu level, which represents the primary administrative division of South Korea. This administrative level consists of municipal subdivisions, including cities (si), counties (gun), and districts (gu).

2.2. Data Collection

The spatial data in this study were derived from Korean shapefile datasets, which comprise polygon data uniquely identified by a “code” attribute within the dataset to represent each region. Dementia data were collected from the Ministry of Health and Welfare’s website (www.data.go.kr, accessed on 7 July 2022). Dementia prevalence was determined using the percentage of male and female patients with dementia aged 65–85 years out of the total population of the same age. Patients with dementia include both populations residing in their homes and those living in hospitals or nursing homes. Demographic information, including age and population, was obtained from the Korean Population and Housing Census data from 2017 to 2020, provided by Statistics Korea (https://sgis.kostat.go.kr/, accessed on 7 July 2022). We substituted the 2021 demographic information with 2020 data, as it was not yet available. The percentage of welfare recipients and their health status was calculated from the Community Health Survey data of the Korea Disease Control and Prevention Agency (https://chs.kdca.go.kr, accessed on 7 July 2022) from 2017 to 2021. Welfare recipients are defined by the Ministry of Health and Welfare and are under the Korean social welfare program, which provides subsistence support and opportunities for self-sufficiency to people living in extreme poverty [32]. Regarding health status, the lowest score of one indicates “very bad” and the highest value of five denotes “very good”.

Greenspace Measures

This study used two different types of green space exposure data sources: NDVI and density of open space from the built environment. Greenness was calculated from the NDVI using the Harmonized Sentinel-2 MSI: Multi-Spectral Instrument, Level-2A image collections. Using the Google Earth Engine, five-year images were collected by running a mosaicking and masking script to reduce cloud coverage from the satellite images. To avoid the change in leaf color during winter and fall, data were collected from May to September. Following the NDVI calculation, the 30 m2 pixel resolution of the NDVI values was reclassified to filter an area with an NDVI value of 0.3–1, which is defined as a green area. The intersection method was used to extract the NDVI values. Some studies have used this method to obtain a subset of NDVI values within the polygon [33,34]. The green space obtained from NDVI represents the average value at the district level, and its definition of green space is broader. Other measures of green space with specific land uses, such as parks and green spaces or places that the public can visit for physical activity, which are defined as open space in this study, were then used as comparative data. The data for open space were obtained from the spatial facilities website (http://data.nsdi.go.kr/, accessed on 7 July 2022), which provides spatial data for outdoor facilities developed by the government. This shapefile consists of a polygon geometry type. The data were filtered using only the attributes “park” with code “UQT200”, and “green space” with code “UQT300”, which include parks, recreational forests, and other built green spaces (including the trees along a street) from the dataset attributes. The district boundaries were then intersected to determine the distribution of the open space.
The preprocessed data results were collected and formatted into a comma-separated value table. The descriptive statistics of all variables are listed in Table 1. The dependent variable was the prevalence of female and male patients with dementia, and independent variables included the population of female patients, male patient populations, average age, population density, NDVI, open space, welfare receiver, and health status.

2.3. Analysis

2.3.1. Panel Model Estimation

A panel dataset includes information gathered by one uniquely defined “unit” across a predetermined number of periods. Panel data can be regarded as a combination of time-series and cross-sectional data. In cross-sectional data, each line represents different units, each column contains data from one of the variables measured for the unit, and the z-axis includes the order of the period in which the unit has been tracked [26]. This study utilized a balanced panel dataset, in which the total number of observations in the sample is similar across all periods. Panel data combine both qualities into a single model by gathering information from several identical objects over time. The ability to use more observations for analysis makes panel data beneficial. This finding is particularly valid for the pooled ordinary least square (OLS) model. Because observations are repeated over time, we reduced the standard errors compared with those predicted by cross-sectional data analysis. The following is the equation for estimating the OLS regression (pooled OLS):
y i t = β 0 + β 1 X 1 i t + β 2 X 2 i t + +   β k X k i t + ε i t
where y i t is the response variable, X i t is the regression variable, β 0 is the intercept, β k   is the coefficient of the explanatory variable, k is the order of the explanatory variable, and ε is an error term. Compared with that of the cross-sectional OLS, the bias is lower; however, the pooled OLS also includes a consideration of within-variation. Therefore, panel data alone do not address the unobserved heterogeneity problem [24]. One of the assumptions in an OLS regression is that there is no correlation between the independent variables (non-multicollinearity). The OLS regression model utilizes the inflation factor (VIF) variance value to detect non-multicollinearity. If the VIF value for all independent variables is <10, multicollinearity is not recorded in the OLS regression model [35].
In this study, pooled OLS was estimated along with fixed effect (FE). The individual impacts of unobserved independent variables were determined, using the FE model, to be constant over time. The link between endogeneity and unobserved independent variables can exist in the FE model. This approach assumes that the slope value of each variable is fixed; however, the intercept value is different for each cross-sectional dataset and is the same for each time-series dataset [25]. The equation for the FE regression model is as follows.
y i t = β 1 X 1 , i t + + β k X k , i t + α i + ε i t
where i   = 1, …. n is the observed entity; t   = 1, …. T is the year of the observed data; and α i is the entity-specific intercept. The next step is to confirm the existence of unobserved effects if the assumption of homogeneity over the coefficients is proven. This is performed by comparing the null of spherical residuals with the alternative group-specific effects in the error term. Thus, in comparing the two estimators under the null hypothesis to determine whether the difference is not substantial, Hausman-type tests are used to decide between fixed and random effects specifications [36], in which FE estimators are used to model the result.

2.3.2. Spatial Autocorrelation

Exploratory spatial data analysis (ESDA) has been used to assess spatial autocorrelation by detecting spatial dependency to determine the spatial properties of a dataset. The Global Moran’s I index is one of the most commonly used ESDA indices for determining spatial autocorrelation [37], and it ranges from −1 to 1. Spatial agglomeration is supported if the Global Moran’s I value is >0, indicating significant spatial clusters of attribution values with either higher or lower attribute values. Spatial dispersion is supported if the Global Moran’s I value is <0, which indicates a sizable spatial variation in the attribution values between the target city and its surroundings. A spatially random pattern is created when the Global Moran’s I value is close to 0, indicating that spatial autocorrelation is absent [38]. For comparison, from bivariate Moran’s I analysis, we subsequently generated the local patterns of spatial correlation between dementia prevalence and NDVI value using 5-year data. Owing to South Korea’s geography, which consists of islands, such as Ulleung-do and Jeju-do, the k-nearest neighbors (kNNs) were used to obtain the spatial weight matrix. The kNN algorithm has been used as a nonparametric method for pattern recognition in statistical predictions. In the context of regression problems, the estimated values are determined by calculating the average or centroid of the kNNs [39].

2.3.3. Spatial Panel Regression

In this study, the spatial data analysis using spatial autocorrelation produced bias owing to the spatial dependence and heterogeneity of geographical data. Previous studies have revealed that the health conditions that occur in an area are not only influenced by local risk factors but also by elements from neighboring areas. Panel data analysis can produce bias, as it does not include the results of the spillover effect [31,40,41]. Accordingly, spatial panel analysis can overcome the bias problem by identifying this effect throughout the region. This can be performed by observing how the relationship between the spatial data and other variables changes over time. The maximum likelihood (ML) estimator applies the fixed effects (FEs) method to the results of panel regression based on the Hausman test, and the FE method is more appropriate for this study. However, because OLS does not work with random effects models, even without spatial components, ML is a different (and better) way to estimate models [36]. The implementation of ML in the FE model only considers the spatial lag and error models.
This study used the spatial lag model (SLM) and spatial error model (SEM) to analyze and quantify potential spatial effects. The SEM process of adding the dependent variable to the spatial association of the covariables may result in the error term of the regression model being missed. Simultaneously, by adding a lagged dependent variable, the SLM combines the spatial dependency regression model [35]. The SLM accounts for spatial autocorrelation by incorporating a lagged version of the dependent variable. Simultaneously, by including a spatial error term in the model, the SEM addresses the dependence between omitted covariates and nearby values.
The following is the equation of the FE SLM:
y = λ ( I T   W N ) y + ( ι T     I N ) µ + X β + ε
where λ is the spatial autoregressive coefficient, W N is a spatial weight matrix, ι T is a column vector, and I N is an identity matrix [42].
The following is the equation of the FE SEM:
y = ι T     I N µ + X β + u u = ρ ( I T   W N ) u + ε
where ρ is the coefficient of spatial autocorrelation [43]. Finally, this study produced several results from different, although complementary, analyses, and we obtained results from the OLS regression analysis. By adding spatial aspects, panel regression results for nonspatial data can be used to obtain map results from spatial regression. The global and bivariate Moran’s I results were obtained, as map results were used to identify the significant map. Thus, from these results, data interpretation was performed to identify the relationship between the two types of green space and dementia at the regional level and their influence on other data variables. A significant map was obtained for regions with a significant number of dementia cases over five years.

3. Results

Only 235 si/gu/gun districts were considered for spatial panel analysis from a total of 250 districts because the 15 districts containing missing values were removed to avoid singularity errors when running the spatial weighted matrix. The spatial distributions of dementia prevalence from 2017 to 2021 are shown in Figure 2, whereas the spatial distributions of open space prevalence and NDVI values are shown in Figure 3. Table 1 presents the prevalence of dementia among females and males over 65 years, which corresponds to 6.2% and 4.5%, respectively. Meanwhile, differences were observed in the spatial pattern of the green data; a high NDVI value was distributed in the east and south sides of South Korea, mostly in rural areas. The open space prevalence was clustered in urban areas, such as Seoul, the Gyeonggi-do region, Daegu, Busan, Ulsan, Daejeon, Jeonju, and Gwangju.
Figure 4 compares dementia prevalence between female and male patients from 2017 to 2021. For both female and male patients, the prevalence increased from 2017 to 2018 and decreased from 2018 to 2021. In 2017, 2018, 2019, 2020, and 2021, the prevalence of dementia in females changed by 0.06%, −0.05%, −0.11%, and −0.12%, respectively, and data differences in the median value were observed. Conversely, for males, the prevalence changes were 0.07%, −0.02%, −0.04%, and −0.03%, respectively.

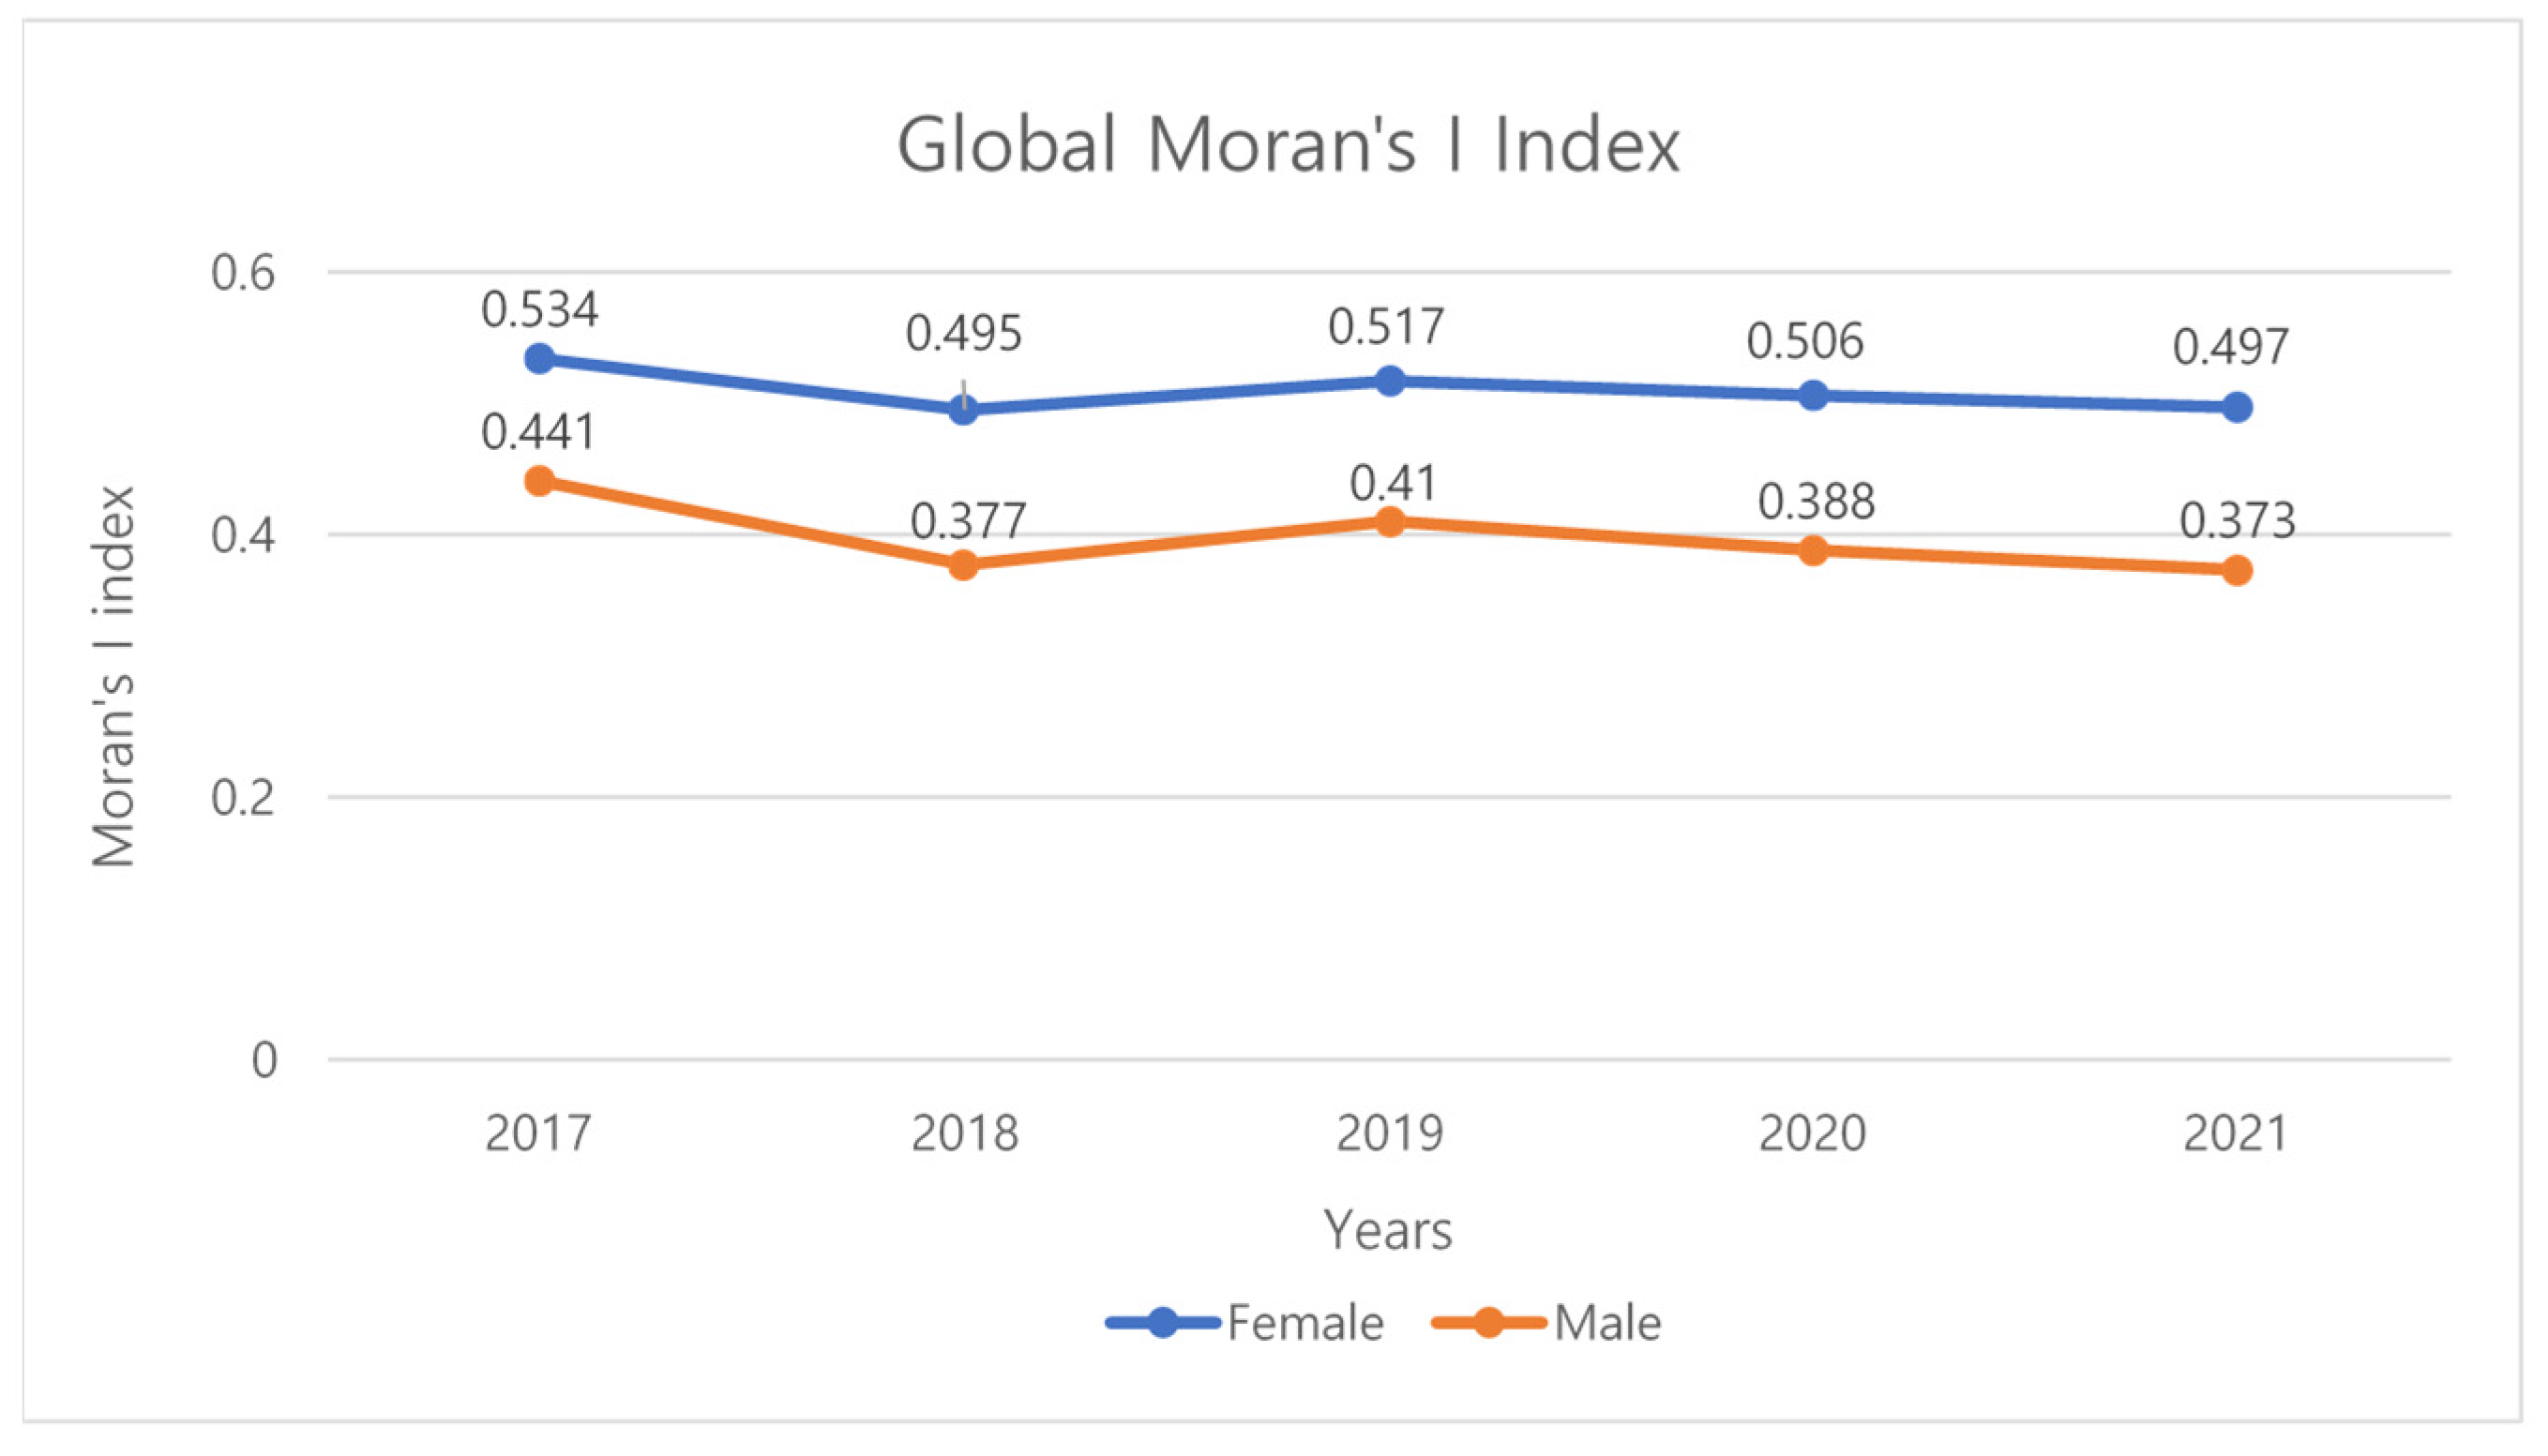
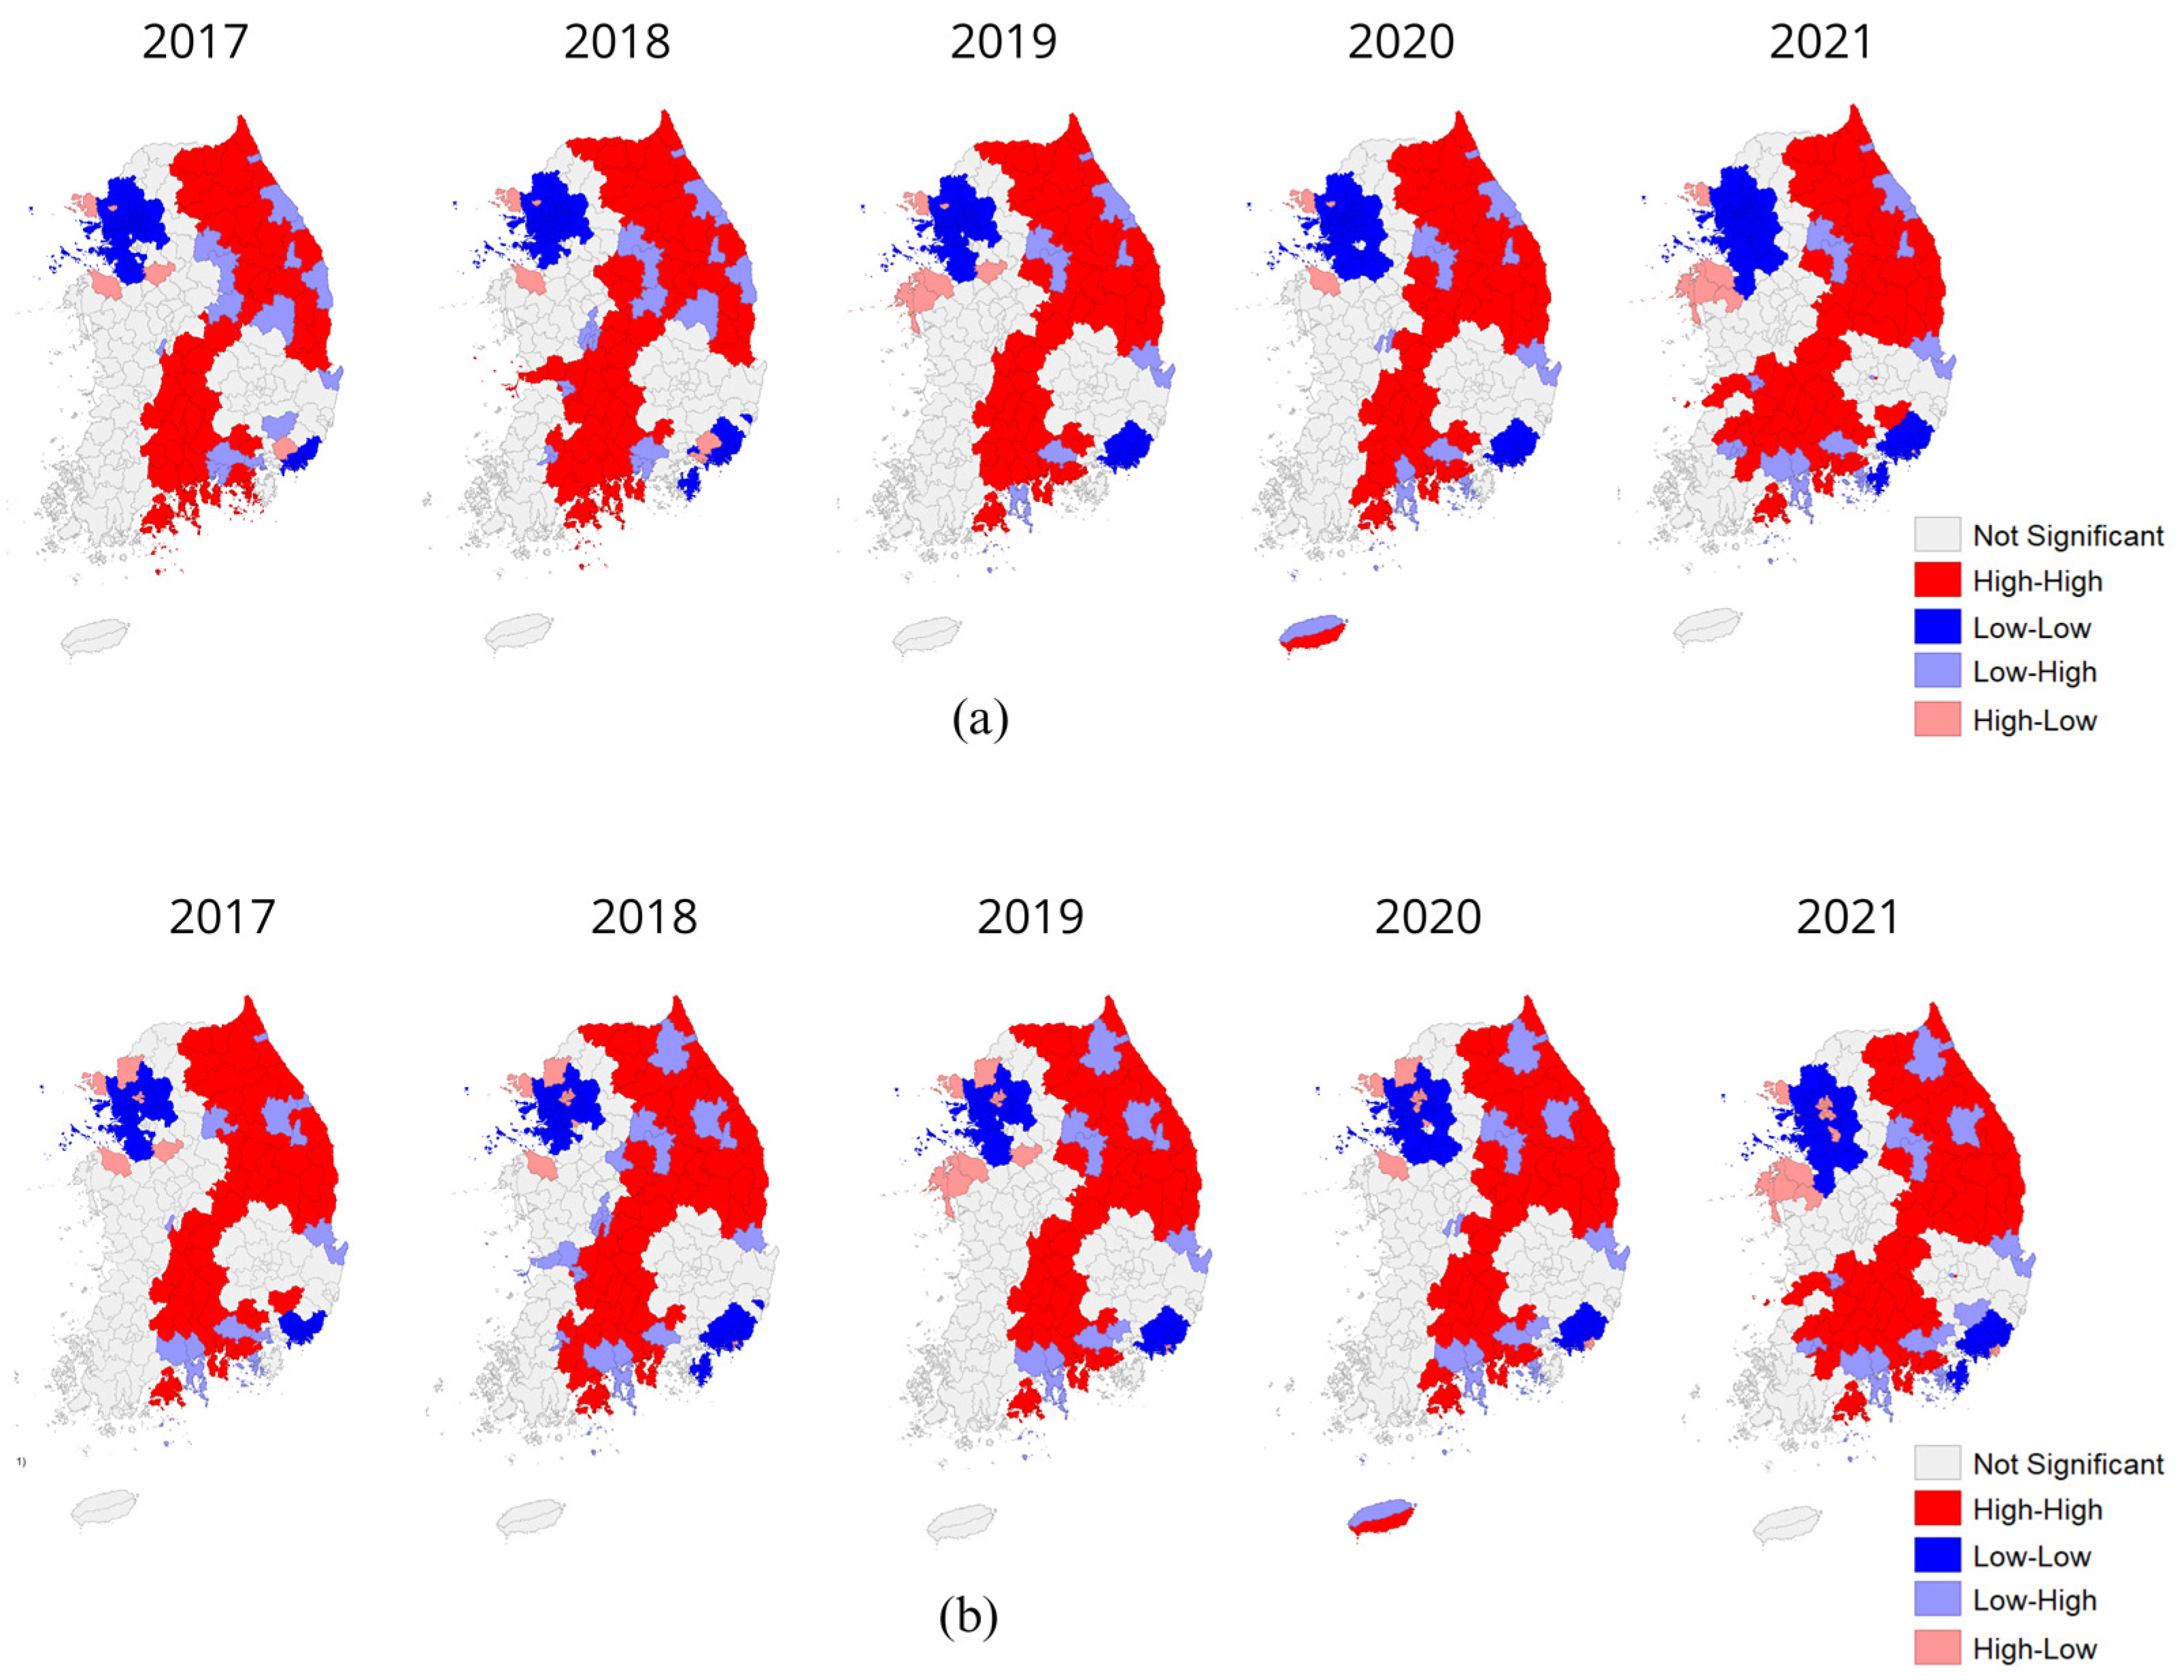
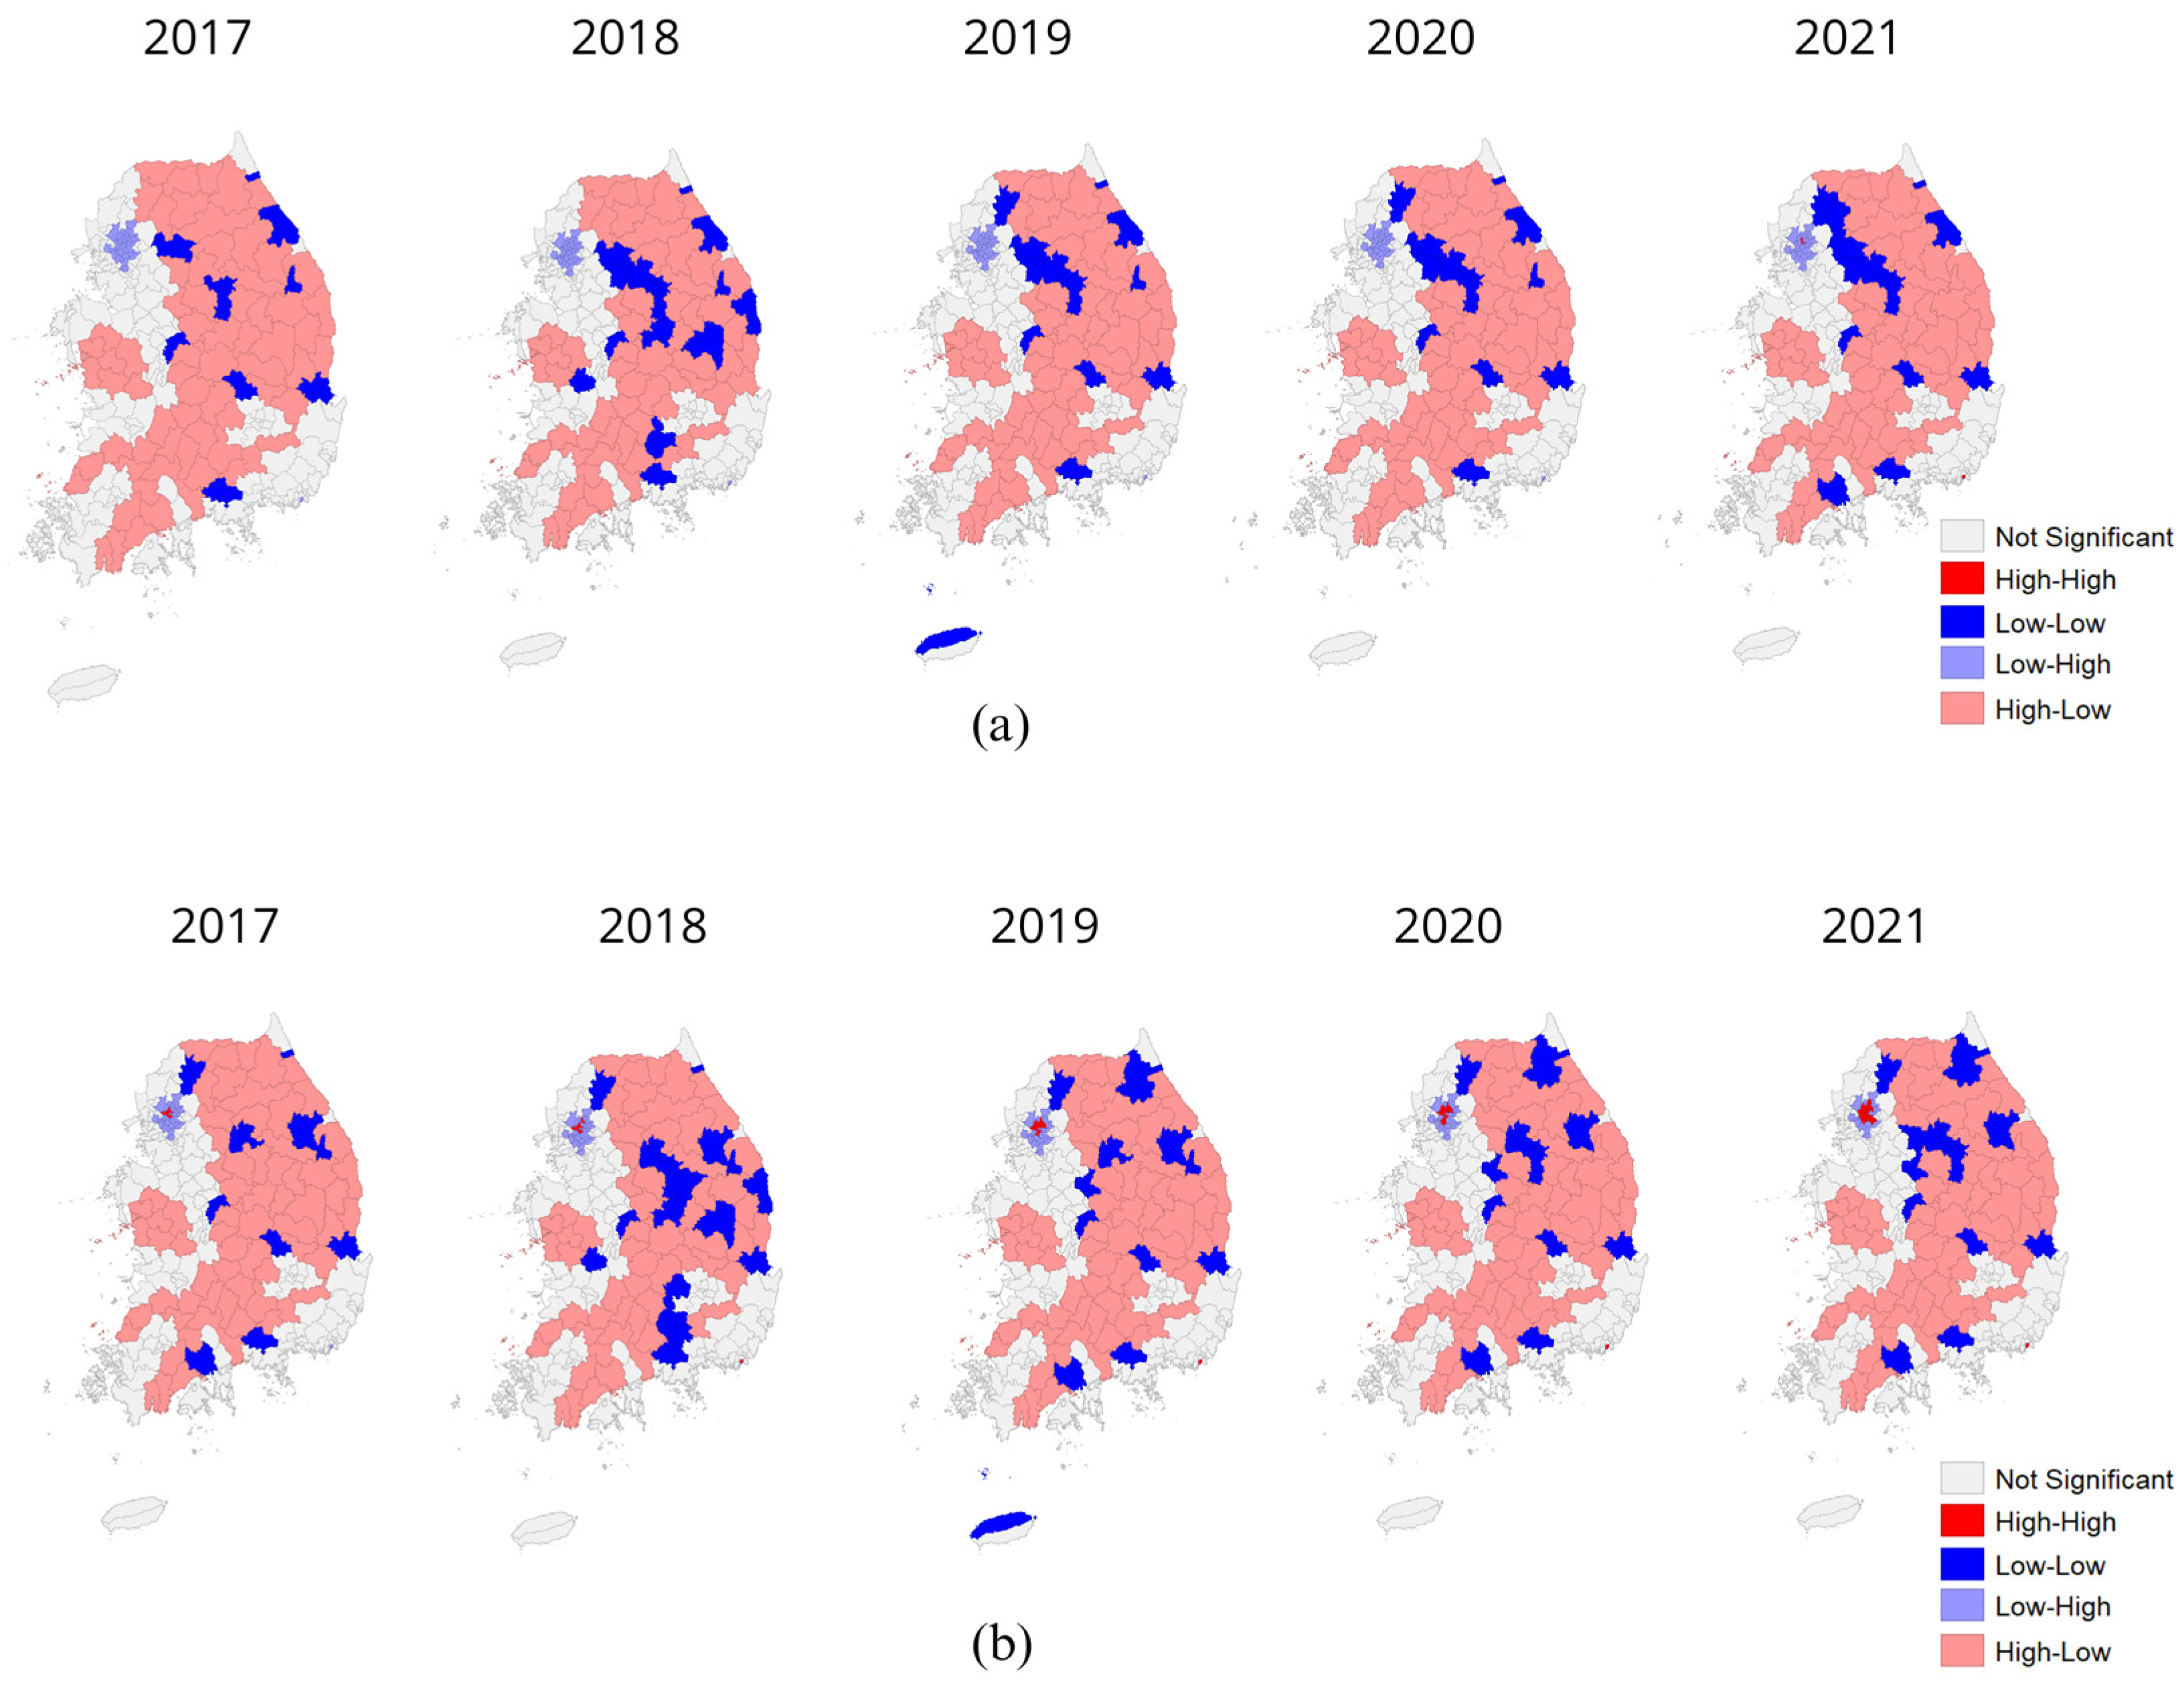
3.1. Spatial Autocorrelation

The Global Moran’s I result for the entire dataset of dementia prevalence in females and males from 2017 to 2021 is presented in Figure 5. The results indicate that all observed values for dementia prevalence in females and males were moderately positively associated based on the statistical range value. This finding suggests that the prevalence of dementia is spatially dependent. Additionally, local indicators of spatial association cluster maps were generated from the prevalence of dementia patients with NDVI and open spaces in each region from 2017 to 2021.
Figure 6 shows the spatial associations between the prevalence of dementia in females and males with NDVI from 2017 to 2021. These maps exhibit nearly identical spatial distribution patterns, with high–high (HH) and low–low (LL) patterns being prevalent. The HH patterns, characterized by high dementia prevalence and high NDVI, were clustered from the northeast to the southwest, which comprised almost all areas of Gangwon-do, the north side of Gyeongsangbuk-do, east side of Chungcheongbuk-do, east side of Jeollabuk-do, east side of Gyeongsangnam-do, and northeast of Jeollanam-do. The LL patterns were clustered in the Seoul area, several parts of Gyeonggi-do, and the Incheon area and are located on the south side of South Korea, specifically in the Busan area and several parts of the south side area of Gyeongsangnam-do. This suggests that the two big cities in South Korea have a spatial pattern with low dementia cases and low greenness values.
Figure 7 presents the LISA map of dementia patients and open space from 2017 to 2021. The results reveal spatial clusters between female and male dementia patients with dominant low–high and high–low associations. Specifically, in 2017, a low–high pattern was observed among both male and female patients in the Seoul city area and some parts of Busan. Conversely, a high–low pattern was observed in most areas of Gangwon-do, extending southwards to Gyeongsangnam-do, and clustered in several locations of Chungcheongnam-do. For the 2021 case, the cluster pattern for patients with dementia was almost identical to that observed in 2017. However, the association between male dementia patients and open space in 2021 was high in Busan.

3.2. Panel Regression

The aforementioned results suggest that this study has significant value in the context of spatial autoregression, and the relationship between dementia prevalence, NDVI, and open space data is substantial. The results of multicollinearity, assessed using VIFs, revealed that all the independent variables, namely, the female and male population, average age, density population, open space, NDVI, welfare recipients, and health condition, had low correlations or low multicollinearity, with the following results: 1.37, 1.37, 2.01, 3.45, 2.19, 2.33, 1.31, and 1.39, respectively. Subsequently, the panel regression methods, which included the common pooled OLS method, random effects model, and fixed effect model, are presented in Table 2.
According to the Chow and Hausman test in Table 3, the null hypotheses were rejected because the results exhibited autocorrelation and heteroscedasticity. The FE model was the preferable estimator because the p-values were smaller than 5%. Furthermore, the Akaike information criterion values of the FE model for females and males were lower than those of the pooled OLS, indicating that the FE model is a better fit. Therefore, based on the supported data, the test results determined that estimation obtained using the FE model is the best model to explain the panel regression results in this study.
As listed in Table 2, eight models of panel model estimation using the FE and pooled OLS were considered, and the classifications were based on the model using the NDVI and open space variables and stratified by gender in each specification. The results of NDVI in the fixed effects models revealed that the prevalence of female and male patients with dementia was statistically significant, and the relationship was positive. Comparatively, the results of the open space model in this analysis revealed that the open space density has a significant negative relationship with the prevalence of dementia in both genders in the fixed effect model.

3.3. Spatial Panel Regression

The results of the spatial FE estimations, which utilized maximum likelihood methods to estimate the spatial interactions of explanatory variables, are presented in Table 4. The estimation results for the spatial autoregressive of SLM (SAR-FE) and spatial error within a model (SEM-FE) include the individual and temporal effects in each NDVI and open space model, and the temporal effects are presented in Table 5. The ML estimations of SEM and SAR utilized individual effects in the model, in which individual data were aggregated at the regional level. The results of spatial autoregression in the NDVI model revealed that the NDVI variable had a positive and significant association with dementia prevalence in female and male patients. Next, the SEM results from the NDVI model exhibited a significant positive association between NDVI and dementia prevalence in female and male patients. Furthermore, the results obtained from the open-space model exhibited a contrast between the effect of NDVI and the prevalence of dementia. The results were obtained after conducting the SAR and SEM analyses of this model.
The results of generating the time effect from the SEM-FE estimators are listed in Table 5. The results were obtained from the estimation of the time effect in the SEM, which explains the changes in the estimation over time and provides information about the relationship between the time-period dummy variables and the dependent variable. The time effect from the NDVI and open space models generated similar estimations, but that from the open space was higher than that from NDVI. The outcome of the time-period estimation revealed that the period from 2017 to 2018 had a positive effect; however, the estimation in 2018 was lower than that in 2017. Subsequently, from 2019 to 2021, a negative influence of the time effect was observed, with the number of time estimations decreasing.

4. Discussion

Recent studies on dementia have reported that no definite factors cause dementia as a cognitive impairment disease [11]. However, dementia has been linked to physical activity, diet, congenital diseases, and environmental influences. Having a good environment and maintaining greenery can improve human quality of life and sustainability [4]. Several researchers have noted that individuals living in green neighborhoods have a lower dementia risk, lower rate of cognitive decline, and better mental health [6,9,21,44]. By utilizing a spatial panel data analysis using 5-year data, this study explained the existing pattern of the spread of dementia spatially and temporally at the district level, and its relationship with greenery exposure, with NDVI and open space serving as representations of green spaces. The spatial panel regression method modeled the variables based on the distance of regions by accounting for spatial dependencies and heterogeneity and spatial and time invariants [31], and controlling the potential confounding factors, such as socioeconomic status and health welfare, at the regional level that vary over time to improve the validity of the findings.
This study demonstrated the differences between NDVI and open space in terms of spatial distribution. The observed pattern indicates that rural areas are dominated by high NDVI values, and most urban areas have high concentrations of open space. Furthermore, a bivariate Moran’s I analysis revealed significant spatial autocorrelation between the two green space measures and the prevalence of dementia using five years of data. A previous cross-sectional analysis model of regional dementia in South Korea [3] reported that urban areas had a lower dementia prevalence than rural areas, based on 2020 data. Other studies [27,29] have shown that green spaces in cities improve health and reduce dementia. The different types of green space measures in this study refer to digitized green space areas with specific land use, such as parks and green space facilities, along with NDVI values converted to aggregated data at the regional level. The disadvantage of using aggregated NDVI data for health studies is that they generalize based on the green index for all areas without classifying them based on land use. This inability hinders a detailed explanation of the direct relationship between individuals and all green areas represented in NDVI. Therefore, caution should be exercised in future research when performing analyses of the relationship between green space and dementia at a national level, as such an ecological study relates to health risk factors that are susceptible to ecological fallacy [45].
This study found that the aggregated NDVI values had a positive relationship with the prevalence of dementia in all models. Specifically, in regional-level studies, areas with a high NDVI value have a high prevalence of dementia, and the percentage of open space has a negative relationship with the prevalence of dementia among both genders. This observed pattern indicates that a high NDVI value is associated with a high prevalence of dementia and a high percentage of open space in one area is associated with a low prevalence of dementia in both genders. The spatial distribution of open space areas in South Korea reveals that most cities have a high percentage of open space, and most rural areas have high NDVI values. To strengthen this finding, a study conducted a comparative analysis of dementia incidence rates between Seoul, a major city, and Gangwon-do, which represent city-side to rural areas with high NDVI values [46]. Surprisingly, the incidence of dementia in Gangwon-do was found to be higher than that in Seoul in 2017 and 2018. Following the implementation of dementia care strategies, the incidence rate in Seoul decreased but not in Gangwon-do.
The findings of this study revealed that open space and NDVI results differ from those of the analysis. This difference occurs because of differences in green space measurement, where the NDVI value in this study includes all greenness exposures, including forests, grass, bushes, shrubs, and others, without filtering out differences in land cover types. Meanwhile, the open space data in this study consist of built green space facility data for parks, recreational forests, and other built green spaces. Therefore, researchers who conduct epidemiological studies using green space data need to be cautious about the differences in the definition of green space because each type varies and can affect health differently, especially in ecological studies. This difference is essential because greenness exposure is sensitive to the spatial resolution, area-level data, and green values. Many researchers still use NDVI and open space interchangeably, and the NDVI value has been used as residential green space exposure and converted aggregated data [27,47,48]. In contrast, the findings from the present study demonstrated differences between the two green spaces and their relationship with the prevalence of dementia. Additionally, a systematic review of the association between greenness and dementia revealed that the misclassification of green spaces affects the results [6]. Several studies have also compared the results of comparative analyses using NDVI and built environments and defined them as distinct aspects of green space studies [49,50].
The spread of the coronavirus, which started in early 2020, has extended worldwide. One study found that patients with dementia who were infected with COVID-19 faced double threats [51]. Other studies have explained that lockdown strategies during the COVID-19 pandemic negatively impacted individuals by decreasing physical activity and social interaction, increasing stress, and worsening dementia [52,53,54]. The present study showed that the prevalence of dementia had decreased in both male and female patients by 2020 (Figure 4). Furthermore, the spatial panel analysis results for the time-period estimations of the relationship between dementia and NDVI and open space are presented in Table 5. The coefficients of time effects for the prevalence of female and male patients have decreased since 2019 and 2020, respectively. There was no strong reason for the decline in the prevalence of dementia during the COVID-19 pandemic. Although the number of patients with dementia has been increasing, the prevalence continues to decrease. Thus, further research is needed to determine the effects of the pandemic on the prevalence of patients with dementia and their interactions with the environment, especially greenness, because of the massive change between individuals and the surrounding environment due to activity restrictions during the pandemic. To explore the reasons behind the decline in dementia cases in 2020, research from South Korea has been conducted to explore steps for preventing and treating dementia patients. This has been conducted in keeping with the national dementia plans program implemented in 2020 based on the WHO action plan for prevention, diagnosis, awareness, health services, and others [55,56]. Thus, this aspect can be used to compare whether the decrease in the prevalence of dementia was due to the spread of COVID-19 or because the national dementia plans have been implemented.
This study has advantages in overcoming biased estimation by conducting two analyses in a traditional panel analysis, which is corroborated by spatial panel analysis because it considers the spillover effect. Subsequently, extensive data that covered five years can be updated throughout the most recent year to further analyze dementia or other health outcomes. Furthermore, the analysis results used two green space measures that could be selectively used in further studies. This study fills gaps in the application of spatial econometrics in health risk factor studies, especially in dementia research. However, this study had several limitations. First, aggregated data were used based on population at the regional level in this ecological study. Therefore, caution should be exercised when inferring a causal relationship between variables and using individual-level data for further studies, to avoid ecological fallacies. Second, in the demographic dataset, only data from 2017 to 2020 were available, and we could not access data for 2021. Therefore, we only used the same 2020 data in 2021. Therefore, we may have missed any changes in population trends or specific demographics in 2021 caused by the COVID-19 pandemic, which started in 2020. Third, because data collection in this study started in 2020 when the COVID-19 outbreak occurred worldwide, patients’ behavior and activity changes can affect the prevalence of dementia. However, this study did not add variables related to changes in activity during the pandemic, which may affect its conclusions. Therefore, future research should examine whether changes in regulations during a pandemic influence the prevalence of dementia and the environment. Moreover, to obtain more generalizable results and more complete models, data covering longer time spans, such as 10-year data, should be used, and additional environmental variables, such as air quality and noise pollution, which may be used as confounding factors, should be added.

5. Conclusions

Spatial panel regression can explain the relationship between dementia and greenness, demographic factors, and healthcare both spatially and temporally. The prevalence of dementia in South Korea had a statistically positive relationship with NDVI and a statistically negative relationship with open space data. The results for the greenness models were different because the green data had different types and sources. In future research, care will be needed when choosing the type of green space data in the analysis of studies on dementia or other epidemiological studies. This study emphasizes the importance of considering green space as a potential risk factor for dementia because the difference in green space data affects the estimation results. The findings of this study contribute to the existing literature on the relationship between green spaces and dementia using statistical techniques and longitudinal data. By highlighting the potential impact of green spaces on dementia, this study provides important insights into the prevention and management of the disease, particularly in urban and rural areas. Further research in this area could help in developing targeted interventions and policies to promote green spaces as a potential means to reduce the risk of developing dementia.

Author Contributions

Conceptualization, Wulan Salle Karurung and Kangjae Lee; methodology, Wulan Salle Karurung and Kangjae Lee; software, Wulan Salle Karurung; validation, Wulan Salle Karurung, Kangjae Lee and Wonhee Lee; formal analysis, Wulan Salle Karurung; data curation, Wulan Salle Karurung and Kangjae Lee; writing—original draft, Wulan Salle Karurung; writing—review and editing, Kangjae Lee; visualization, Wulan Salle Karurung; supervision, Kangjae Lee and Wonhee Lee; funding acquisition, Wonhee Lee. All authors have read and agreed to the published version of the manuscript.

Funding

This research was supported by the Basic Science Research Program through the National Research Foundation of Korea (NRF) funded by the Ministry of Education (NRF-2020R1I1A3061750), and a National Research Foundation of Korea (NRF) grant funded by the Korean government (MSIT) (no. NRF-2021R1A5A8033165).

Institutional Review Board Statement

Not applicable.

Informed Consent Statement

Not applicable.

Data Availability Statement

This can be provided upon request.

Conflicts of Interest

The authors declare no conflicts of interest.

References

  1. Van Der Flier, W.M.; Scheltens, P. Epidemiology and Risk Factors of Dementia. J. Neurol. Neurosurg. Psychiatry 2005, 76, V2–V7. [Google Scholar] [CrossRef] [PubMed]
  2. Dhana, K.; Evans, D.A.; Rajan, K.B.; Bennett, D.A.; Morris, M.C. Healthy Lifestyle and the Risk of Alzheimer Dementia: Findings from 2 Longitudinal Studies. Neurology 2020, 95, e374–e383. [Google Scholar] [CrossRef] [PubMed]
  3. Lim, J.; Park, J.-H. Predictive Model of Regional Dementia Prevalence Using Geographic Weighted Regression Analysis. J. Pers. Med. 2022, 12, 1388. [Google Scholar] [CrossRef] [PubMed]
  4. Besser, L. Outdoor Green Space Exposure and Brain Health Measures Related to Alzheimer’s Disease: A Rapid Review. BMJ Open 2021, 11, e043456. [Google Scholar] [CrossRef] [PubMed]
  5. Shon, C.; Yoon, H. Health-Economic Burden of Dementia in South Korea. BMC Geriatr. 2021, 21, 54. [Google Scholar] [CrossRef] [PubMed]
  6. Zagnoli, F.; Filippini, T.; Jimenez, M.P.; Wise, L.A.; Hatch, E.E.; Vinceti, M. Is Greenness Associated with Dementia? A Systematic Review and Dose–Response Meta-Analysis. Curr. Environ. Health Rep. 2022, 9, 574–590. [Google Scholar] [CrossRef] [PubMed]
  7. Astell-Burt, T.; Navakatikyan, M.A.; Feng, X. Urban Green Space, Tree Canopy and 11-Year Risk of Dementia in a Cohort of 109,688 Australians. Environ. Int. 2020, 145, 106102. [Google Scholar] [CrossRef]
  8. Rodriguez-Loureiro, L.; Gadeyne, S.; Bauwelinck, M.; Lefebvre, W.; Vanpoucke, C.; Casas, L. Long-Term Exposure to Residential Greenness and Neurodegenerative Disease Mortality among Older Adults: A 13-Year Follow-up Cohort Study. Environ. Health A Glob. Access Sci. Source 2022, 21, 49. [Google Scholar] [CrossRef]
  9. Hu, H.Y.; Ma, Y.H.; Deng, Y.T.; Ou, Y.N.; Cheng, W.; Feng, J.F.; Tan, L.; Yu, J.T. Residential Greenness and Risk of Incident Dementia: A Prospective Study of 375,342 Participants. Environ. Res. 2023, 216, 114703. [Google Scholar] [CrossRef]
  10. Browning, M.; Lee, K. Within What Distance Does “Greenness” Best Predict Physical Health? A Systematic Review of Articles with Gis Buffer Analyses across the Lifespan. Int. J. Environ. Res. Public Health 2017, 14, 675. [Google Scholar] [CrossRef]
  11. Dhana, K.; Franco, O.H.; Ritz, E.M.; Ford, C.N.; Desai, P.; Krueger, K.R.; Holland, T.M.; Dhana, A.; Liu, X.; Aggarwal, N.T.; et al. Healthy Lifestyle and Life Expectancy with and without Alzheimer’s Dementia: Population Based Cohort Study. BMJ 2022, 377, e068390. [Google Scholar] [CrossRef] [PubMed]
  12. Younan, D.; Wang, X.; Millstein, J.; Petkus, A.J.; Beavers, D.P.; Espeland, M.A.; Chui, H.C.; Resnick, S.M.; Gatz, M.; Kaufman, J.D.; et al. Air Quality Improvement and Cognitive Decline in Community-Dwelling Older Women in the United States: A Longitudinal Cohort Study. PLoS Med. 2022, 19, e1003893. [Google Scholar] [CrossRef] [PubMed]
  13. Mmako, N.J.; Courtney-Pratt, H.; Marsh, P. Green Spaces, Dementia and a Meaningful Life in the Community: A Mixed Studies Review. Health Place 2020, 63, 102344. [Google Scholar] [CrossRef]
  14. Choi, H.G.; Kim, J.H.; Kim, J.H.; Kim, E.S.; Park, H.Y.; Min, K.W.; Kwon, M.J. Associations between Proton Pump Inhibitors and Alzheimer’s Disease: A Nested Case–Control Study Using a Korean Nationwide Health Screening Cohort. Alzheimer’s Res. Ther. 2022, 14, 1–11. [Google Scholar] [CrossRef] [PubMed]
  15. Lee, S. Spatial and Socioeconomic Inequalities in Accessibility to Healthcare Services in South Korea. Healthcare 2022, 10, 2049. [Google Scholar] [CrossRef] [PubMed]
  16. Choi, J.; Kwon, L.; Lim, H.; Chun, H. Gender-Based Analysis of Risk Factors for Dementia Using Senior Cohort. Int. J. Environ. Res. Public Health 2020, 17, 7274. [Google Scholar] [CrossRef]
  17. Sun, H.; Wang, A.; He, S. Temporal and Spatial Analysis of Alzheimer’s Disease Based on an Improved Convolutional Neural Network and a Resting-State FMRI Brain Functional Network. Int. J. Environ. Res. Public Health 2022, 19, 4508. [Google Scholar] [CrossRef] [PubMed]
  18. Firouraghi, N.; Kiani, B.; Jafari, H.T.; Learnihan, V.; Salinas-Perez, J.A.; Raeesi, A.; Furst, M.A.; Salvador-Carulla, L.; Bagheri, N. The Role of Geographic Information System and Global Positioning System in Dementia Care and Research: A Scoping Review. Int. J. Health Geogr. 2022, 21, 8. [Google Scholar] [CrossRef] [PubMed]
  19. Scerpella, D.L.; Adam, A.; Marx, K.; Gitlin, L.N. Implications of Geographic Information Systems (GIS) for Targeted Recruitment of Older Adults with Dementia and Their Caregivers in the Community: A Retrospective Analysis. Contemp. Clin. Trials Commun. 2019, 14, 100338. [Google Scholar] [CrossRef]
  20. Su, C.; Lee, K.; Yen, C.; Wu, L.; Huang, C.; Lu, M. Use of Spatial Panel-Data Models to Investigate Factors Related to Incidence of End-Stage Renal Disease: A Nationwide Longitudinal Study in Taiwan. BMC Public Health. 2023, 23, 247. [Google Scholar] [CrossRef]
  21. Lee, K.; Browning, M.H.E.M.; Park, Y.M. Spatiotemporal Non-Stationarity in Green Space and Stress Relationships: Recent Evidence from South Korea. Environ. Res. 2023, 220, 115214. [Google Scholar] [CrossRef] [PubMed]
  22. Hirsch, J.A.; Michael, Y.L.; Moore, K.A.; Melly, S.; Hughes, T.M.; Hayden, K.; Luchsinger, J.A.; Jimenez, M.P.; James, P.; Besser, L.M.; et al. Longitudinal Neighbourhood Determinants with Cognitive Health and Dementia Disparities: Protocol of the Multi-Ethnic Study of Atherosclerosis Neighborhoods and Aging Prospective Cohort Study. BMJ Open 2022, 12, e066971. [Google Scholar] [CrossRef] [PubMed]
  23. Glaser, S.; Jung, R.C.; Schweikert, K. Spatial Panel Count Data: Modeling and Forecasting of Urban Crimes. J. Spat. Econom. 2022, 3, 2. [Google Scholar] [CrossRef]
  24. Eom, T.H.; Lee, S.H.; Xu, H. Introduction to Panel Data Analysis. In Handbook of Research Methods in Public Administration, 2nd ed.; Miller, G.J., Brandler, S., Roman, C.P., Yang, K., Eds.; CRC Press: Boca Raton, FL, USA, 2007; pp. 571–590. ISBN 978-042-924-549-7. [Google Scholar]
  25. Greene, W.H. Econometric Analysis, 4th ed.; Prentice Hall: New York, NY, USA, 2000. [Google Scholar]
  26. Salima, B.A.; Julie, L.G.; Lionel, V. Spatial Econometrics on Panel Data. In Handbook of Spatial Analysis: Theory and Practical Application with R; Institut National de la Statistique et des Études Économiques: Paris, France, 2018; pp. 179–203. [Google Scholar]
  27. Paul, L.A.; Hystad, P.; Burnett, R.T.; Kwong, J.C.; Crouse, D.L.; van Donkelaar, A.; Tu, K.; Lavigne, E.; Copes, R.; Martin, R.V.; et al. Urban Green Space and the Risks of Dementia and Stroke. Environ. Res. 2020, 186, 109520. [Google Scholar] [CrossRef]
  28. Bagheri, N.; Wangdi, K.; Cherbuin, N.; Anstey, K.J. Combining Geospatial Analysis With Dementia Risk Utilising General Practice Data: A Systematic Review. J. Prev. Alzheimer’s Dis. 2017, 5, 71–77. [Google Scholar] [CrossRef]
  29. Slawsky, E.D.; Hajat, A.; Rhew, I.C.; Russette, H.; Semmens, E.O.; Kaufman, J.D.; Leary, C.S.; Fitzpatrick, A.L. Neighborhood Greenspace Exposure as a Protective Factor in Dementia Risk among US Adults 75 Years or Older: A Cohort Study. Environ. Health 2022, 21, 14. [Google Scholar] [CrossRef] [PubMed]
  30. de la Iglesia Martinez, A.; Labib, S.M. Demystifying Normalized Difference Vegetation Index (NDVI) for Greenness Exposure Assessments and Policy Interventions in Urban Greening. Environ. Res. 2023, 220, 115155. [Google Scholar] [CrossRef]
  31. Elhorst, J.P. The Dynamic General Nesting Spatial Econometric Model for Spatial Panels with Common Factors: Further Raising the Bar. Rev. Reg. Res. 2022, 42, 249–267. [Google Scholar] [CrossRef]
  32. Jung, I. Explaining the Development and Adoption of Social Policy in Korea: The Case of the National Basic Livelihood Security Act. Heal. Soc. Welf. Rev. 2009, 29, 44–68. [Google Scholar] [CrossRef]
  33. Lu, M.; Chen, J.; Tang, H.; Rao, Y.; Yang, P.; Wu, W. Land Cover Change Detection by Integrating Object-Based Data Blending Model of Landsat and MODIS. Remote Sens. Environ. 2016, 184, 374–386. [Google Scholar] [CrossRef]
  34. Wang, Y.; Liu, Z.; Liao, H.; Li, C. Improving the Performance of GIS Polygon Overlay Computation with MapReduce for Spatial Big Data Processing. Clust. Comput. 2015, 18, 507–516. [Google Scholar] [CrossRef]
  35. Copeland, K.A.F. Applied Linear Statistical Models. J. Qual. Technol. 1997, 29, 233. [Google Scholar] [CrossRef]
  36. Croissant, Y.; Millo, G. Panel Data Econometrics in R: The Plm Package. J. Stat. Softw. 2008, 27, 1–43. [Google Scholar] [CrossRef]
  37. Feng, Y.; Wang, X.; Du, W.; Wu, H.; Wang, J. Effects of Environmental Regulation and FDI on Urban Innovation in China: A Spatial Durbin Econometric Analysis. J. Clean. Prod. 2019, 235, 210–224. [Google Scholar] [CrossRef]
  38. Liu, Q.; Wang, S.; Zhang, W.; Zhan, D.; Li, J. Does Foreign Direct Investment Affect Environmental Pollution in China’s Cities? A Spatial Econometric Perspective. Sci. Total Environ. 2018, 613, 521–529. [Google Scholar] [CrossRef] [PubMed]
  39. Tamamadin, M.; Lee, C.; Kee, S.H.; Yee, J.J. Regional Typhoon Track Prediction Using Ensemble K-Nearest Neighbor Machine Learning in the GIS Environment. Remote Sens. 2022, 14, 5292. [Google Scholar] [CrossRef]
  40. Xu, P.; Zhao, X.; Li, H.; Guo, S. Spatial Effect Analysis of Health Expenditure and Health Output in China From 2011 to 2018. Front. Public Health 2022, 10, 794177. [Google Scholar] [CrossRef] [PubMed]
  41. Chen, X.; Shao, S.; Tian, Z.; Xie, Z.; Yin, P. Impacts of Air Pollution and Its Spatial Spillover Effect on Public Health Based on China’s Big Data Sample. J. Clean. Prod. 2017, 142, 915–925. [Google Scholar] [CrossRef]
  42. Elhorst, J.P. Specification and Estimation of Spatial Panel Data Models. Int. Reg. Sci. Rev. 2003, 26, 244–268. [Google Scholar] [CrossRef]
  43. Millo, G.; Piras, G. Splm: Spatial Panel Data Models in R. J. Stat. Softw. 2012, 47, 1–38. [Google Scholar] [CrossRef]
  44. Lee, K. Association between depression and green space before and after the COVID-19: Panel data evidence in South Korea. J. Korean Soc. Surv. Geod. Photogramm. Cartogr. 2022, 40, 459–467. [Google Scholar] [CrossRef]
  45. Wakefield, J.; Lyons, H. Spatial Aggregation and the Ecological Fallacy. In Handbook of Spatial Statistics, 1st ed.; Gelfand, A.E., Diggle, P., Guttorp, P., Fuentes, M., Eds.; CRC Press: Boca Raton, FL, USA, 2010; pp. 541–558. ISBN 978-042-913-650-4. [Google Scholar]
  46. Byeon, G.; Kwon, S.O.; Jhoo, J.; Jang, J.-W.; Kim, Y. Dementia Incidence Rate Before and After Implementing the National Responsibility Policy for Dementia Care in Patients With Vascular Risk Factors in Korea. Dement. Neurocognitive Disord. 2023, 22, 49. [Google Scholar] [CrossRef] [PubMed]
  47. Gascon, M.; Cirach, M.; Martínez, D.; Dadvand, P.; Valentín, A.; Plasència, A.; Nieuwenhuijsen, M.J. Normalized Difference Vegetation Index (NDVI) as a Marker of Surrounding Greenness in Epidemiological Studies: The Case of Barcelona City. Urban For. Urban Green. 2016, 19, 88–94. [Google Scholar] [CrossRef]
  48. Barboza, E.P.; Cirach, M.; Khomenko, S.; Iungman, T.; Mueller, N.; Barrera-Gómez, J.; Rojas-Rueda, D.; Kondo, M.; Nieuwenhuijsen, M. Green Space and Mortality in European Cities: A Health Impact Assessment Study. Lancet Planet. Health 2021, 5, e718–e730. [Google Scholar] [CrossRef]
  49. Jimenez, R.B.; Lane, K.J.; Hutyra, L.R.; Fabian, M.P. Spatial Resolution of Normalized Difference Vegetation Index and Greenness Exposure Misclassification in an Urban Cohort. J. Expo. Sci. Environ. Epidemiol. 2022, 32, 213–222. [Google Scholar] [CrossRef] [PubMed]
  50. Vilcins, D.; Sly, P.D.; Scarth, P.; Mavoa, S. Green Space in Health Research: An Overview of Common Indicators of Greenness. Rev. Environ. Health 2022. [Google Scholar] [CrossRef] [PubMed]
  51. Kyoung, D.-S.; Lee, J.; Nam, H.; Park, M.H. Dementia and COVID-19 Mortality in South Korea. Dement. Neurocognitive Disord. 2021, 20, 38. [Google Scholar] [CrossRef]
  52. Chen, Z.C.; Liu, S.; Gan, J.; Ma, L.; Du, X.; Zhu, H.; Han, J.; Xu, J.; Wu, H.; Fei, M.; et al. The Impact of the COVID-19 Pandemic and Lockdown on Mild Cognitive Impairment, Alzheimer’s Disease and Dementia With Lewy Bodies in China: A 1-Year Follow-Up Study. Front. Psychiatry 2021, 12, 711658. [Google Scholar] [CrossRef]
  53. Axenhus, M.; Schedin-Weiss, S.; Tjernberg, L.; Wimo, A.; Eriksdotter, M.; Bucht, G.; Winblad, B. Changes in Dementia Diagnoses in Sweden during the COVID-19 Pandemic. BMC Geriatr. 2022, 22, 365. [Google Scholar] [CrossRef]
  54. Gaigher, J.M.; Lacerda, I.B.; Dourado, M.C.N. Dementia and Mental Health During the COVID-19 Pandemic: A Systematic Review. Front. Psychiatry 2022, 13, 879598. [Google Scholar] [CrossRef]
  55. Choi, Y.J.; Kim, S.; Hwang, Y.J.; Kim, C. Prevalence of Dementia in Korea Based on Hospital Utilization Data from 2008 to 2016. Yonsei Med. J. 2021, 62, 948–953. [Google Scholar] [CrossRef] [PubMed]
  56. Seong, S.J.; Kim, B.N.; Kim, K.W. Comparative Analysis on the Policy Approaches in the National Dementia Plans of G7 Countries and Korea and Their Implementation. J. Korean Med. Sci. 2023, 38, e227. [Google Scholar] [CrossRef] [PubMed]
Figure 1. Map of the study area.
Ijgi 13 00126 g001
Figure 2. Spatial distribution of prevalence of dementia from 2017 to 2021: (a) prevalence of female dementia; (b) prevalence of male dementia.
Ijgi 13 00126 g002
Figure 3. Spatial distribution of NDVI and open space from 2017 to 2021: (a) prevalence of open space; (b) NDVI value.
Ijgi 13 00126 g003
Figure 4. Boxplot of dementia prevalence in females and males from 2017 to 2021.
Ijgi 13 00126 g004
Figure 5. Statistics value of global Moran’s I of the dementia prevalence in female and male patients from 2017 to 2021.
Ijgi 13 00126 g005
Figure 6. Cluster map of the result of bivariate Moran’s I between dementia patients and NDVI from 2017 to 2021: (a) female dementia and NDVI; (b) male dementia and NDVI.
Ijgi 13 00126 g006
Figure 7. Cluster map of the result of bivariate Moran’s I between dementia patients and open space: (a) female dementia and open space; (b) male dementia and open space.
Ijgi 13 00126 g007
Table 1. Definitions and descriptive statistics of the dependent and independent variables.
VariableMeanSDMinMax
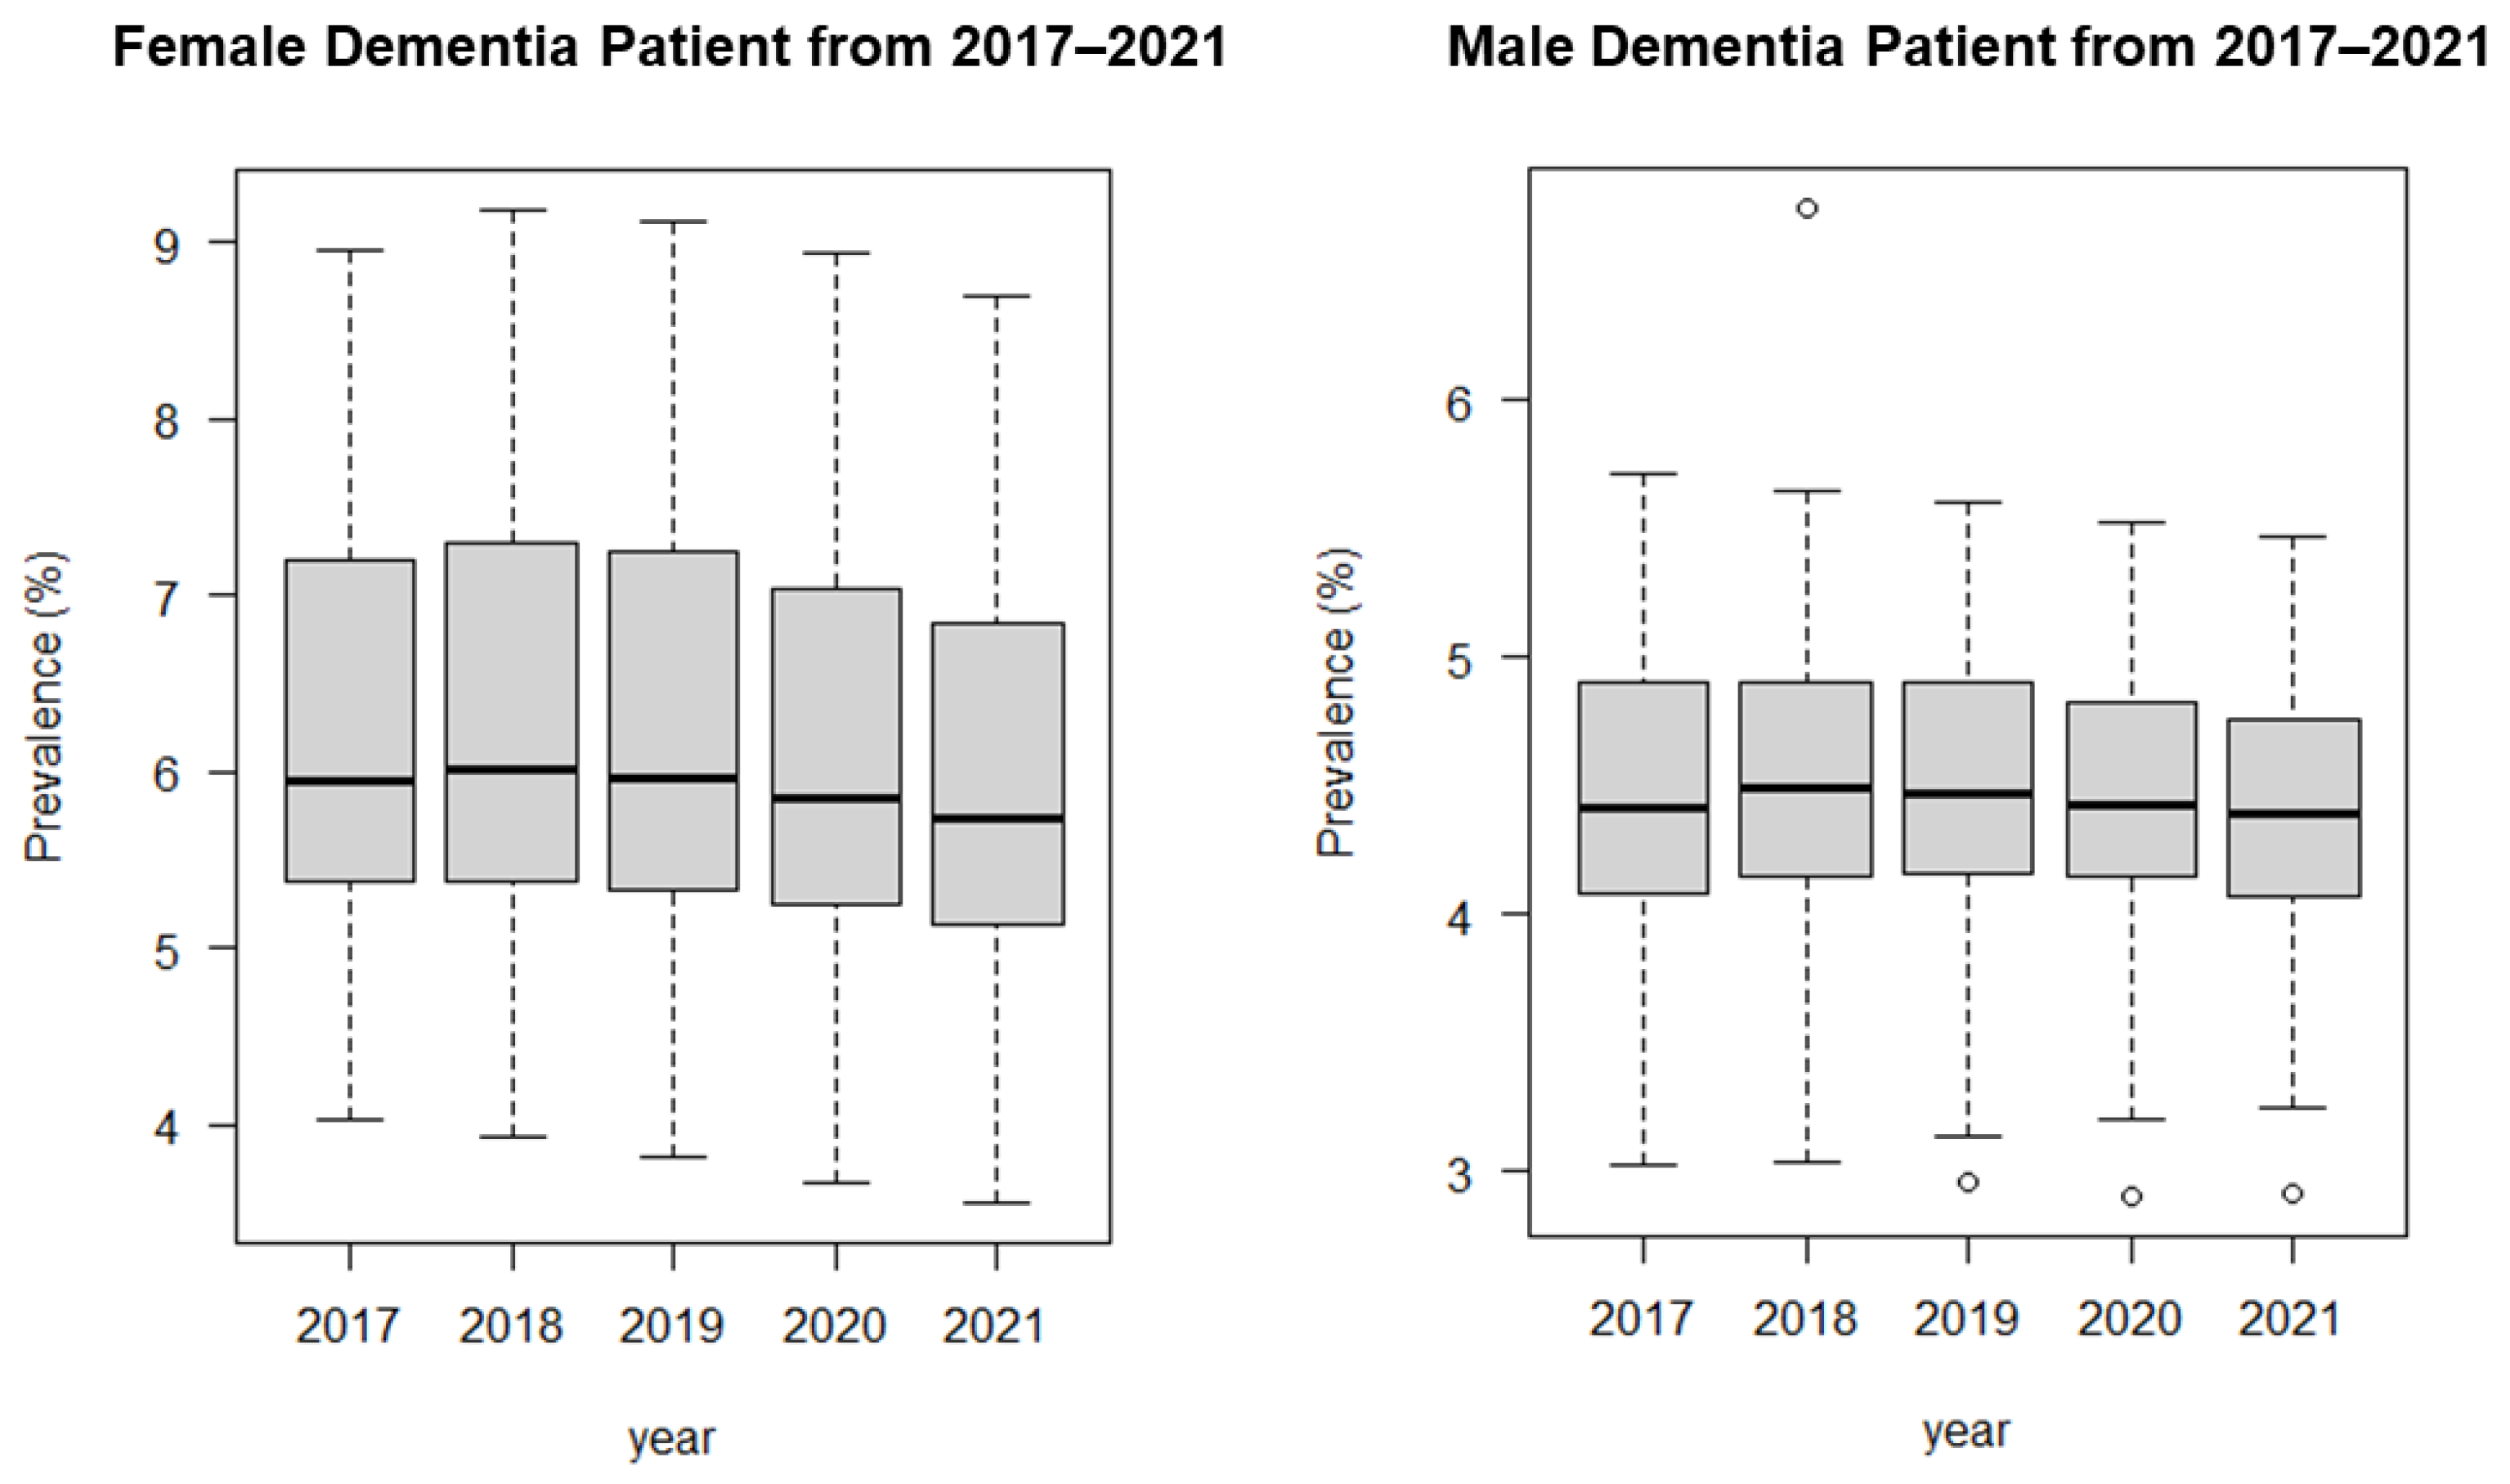
Prevalence of female patients with
dementia over 65 years (%)
6.271.123.559.18
Prevalence of male patients with
dementia over 65 years (%)
4.510.533.036.74
Female patient population (%)50.351.3943.6253.49
Male patient population (%)49.651.3946.5156.38
Age (mean age of population)45.214.9534.9357.35
Population density (individuals/km2)3666.085513.5017.0024,588.00
Green-area (NDVI value)0.470.150.090.75
Open space (%)4.867.710.0058.64
Welfare recipients (%)3.161.550.1310.59
Health status3.300.162.853.81
Table 2. Estimation of the panel model (nonspatial data).
VariablesNDVIOpen Space
Pooled OLSFixed-EffectPooled OLSFixed-Effect
FemaleMaleFemaleMaleFemaleMaleFemaleMale
Female patient pop.0.107 *** 0.072 0.109 *** 0.045
Male patient pop. −0.084 *** −0.098 *** −0.084 *** −0.094 ***
Age0.129 ***0.062 ***−0.069 ***−0.026 ***0.134 ***0.065 ***0.048−0.012
Population density−0.0001 ***−0.00002 ***−0.0003 ***−0.0002 ***−0.0001 ***−0.00002 ***−0.0003 ***−0.0002 ***
NDVI0.805 ***0.300 ***1.381 ***0.421 ***
Open space −0.0030.001−8666.450 ***−1466.621 *
Welfare recipients−0.0020.006−0.0070.002−0.0110.002−0.0090.0003
Health status−1.035 ***−0.303 ***−0.167 *−0.067−1.066 ***−0.322 ***−0.159 *−0.065
Con.−1.650 *6.766 *** −1.4686.886 ***
N11751175117511751175117511751175
R20.7240.6350.1560.0940.7210.6330.1440.084
Adjusted R20.7230.634−0.061−0.1390.7190.631−0.076−0.151
F statistic511.829 ***339.336 ***28.724 ***16.131 ***501.847 ***335.230 ***26.180 ***14.328 ***
AIC2261.532667.128167.806−1134.2432278.252676.196184.132−1121.845
* p < 0.05; *** p < 0.001.
Table 3. Test results of the Chow and Hausman test.
TestFchisqDfp-ValueResult
Chow test (NDVI-female)19.682 235<0.001 H 0 rejected
Chow test (NDVI-male)14.467 235<0.001 H 0 rejected
Chow test (Open space-female)19.69 235<0.001 H 0 rejected
Chow test (Open space -male)14.415 235<0.001 H 0 rejected
Hausman test (NDVI-female) 188.046<0.001 H 0 rejected
Hausman test (NDVI-male) 94.256<0.001 H 0 rejected
Hausman test (Open space-female) 265.336<0.001 H 0 rejected
Hausman test (Open space-male) 97.6816<0.001 H 0 rejected
Table 4. Estimation of spatial panel results using maximum likelihood.
VariablesNDVIOpen Space
SAR-FESEM-FESAR-FESEM-FE
FemaleMaleFemaleMaleFemaleMaleFemaleMale
Female patient pop.0.0451 0.05494 0.0242 0.0251
Male patient pop. −0.0730 ** −0.0787 ** −0.0692 ** −0.0744 **
Age−0.0485 **−0.0220 *−0.0674 ***−0.0314 **0.0348−0.01270.0221−0.0236 ***
Population density−0.0002 ***−0.0002 ***−0.0002 ***−0.0001 ***−0.0002 **−0.0002 ***−0.0002 ***−0.0002 ***
NDVI0.9793 ***0.3136 **1.3181 ***0.3844 **
Open space −6142.9 **−1022.9−7943.2 ***−1161.7
Welfare recipients−0.00540.0017−0.00370.0032−0.00650.0009−0.00450.0027
Health status−0.1392−0.0569−0.2037 *−0.074−0.1309−0.0553−0.1563−0.0692
σ2 0.64270.3208
Rho0.0561 ***0.0511 ***0.1188 ***0.1172 ***0.0570.0510.061 ***0.
AIC100.305−1186.981170.653−1129.437106.101−1180.336188.781−1115.99
* p < 0.05; ** p < 0.01; *** p < 0.001.
Table 5. Time-period estimations of the fixed-effect (SEM-FE).
YearsNDVIOpen Space
FemaleMaleFemaleMale
20170.14200.05910.16010.0637
20180.07640.04960.14250.0675
2019−0.03520.0025−0.00830.0086
2020−0.0126−0.0314−0.0248−0.0328
2021−0.1706−0.0798−0.2694−0.1071
p-value *** ***
*** p < 0.001.
Disclaimer/Publisher’s Note: The statements, opinions and data contained in all publications are solely those of the individual author(s) and contributor(s) and not of MDPI and/or the editor(s). MDPI and/or the editor(s) disclaim responsibility for any injury to people or property resulting from any ideas, methods, instructions or products referred to in the content.

