Article

Evaluating the Impact of Human Activities on Vegetation Restoration in Mining Areas Based on the GTWR

College of Geoscience and Surveying Engineering, China University of Mining and Technology, Beijing 100083, China
*
Author to whom correspondence should be addressed.
ISPRS Int. J. Geo-Inf. 2024, 13(4), 132; https://doi.org/10.3390/ijgi13040132
Submission received: 15 March 2024 / Revised: 10 April 2024 / Accepted: 11 April 2024 / Published: 16 April 2024
(This article belongs to the Topic Advances in Earth Observation and Geosciences)

Abstract

:
The clarification of the impact of human activities on vegetation in mining areas contributes to the harmonization of mining and environmental protection. This study utilized Geographically and Temporally Weighted Regression (GTWR) to establish a quantitative relationship among the Normalized Difference Vegetation Index (NDVI), temperature, precipitation, and Digital Elevation Model (DEM). Furthermore, residual analysis was performed to remove the impact of natural factors and separately assess the impact of human activities on vegetation restoration. The experiment was carried out in Shangwan Mine, China, and following results were obtained: (1) During the period of 2000 to 2020, intensified huan activities corresponded to positive vegetation changes (NDVI-HA) that exhibited an upward trend over time. (2) The spatial heterogeneity of vegetation restoration was attributed to the DEM. It is negatively correlated with NDVI in natural conditions, while under the environment of mining activities, there is a positive correlation between NDVI-HA and DEM. (3) The contribution of human activities to vegetation restoration in mining areas has been steadily increasing, surpassing the influences of temperature and precipitation since 2010. The results of this study can provide important references for the assessment of vegetation restoration to some extent in mining areas.

1. Introduction

As mining activities progressed, the industrialization and urbanization processes in mining areas accelerated, resulting in the degradation of the ecological environment and increased vulnerability of ecosystems. Consequently, the local ecosystems became unable to recover the structure and function through self-regulation [1,2]. Therefore, ecological restoration has become a crucial approach to regulate the ecological balance and achieve sustainable high-quality development of the ecological environment in mining areas. Vegetation restoration represents one of the most common measures in ecological restoration [3], invariably influenced by the combined impacts of natural factors and human activities in mining areas [4]. Human activities in mining areas primarily consist mainly of mining activities and ecological restoration. Among natural factors, temperature and precipitation exert relatively significant influences on vegetation [5,6].
Vegetation restoration in mining areas is an important and difficult task in China, which is a crucial way to realize the construction of ecological civilization in mining areas. Numerous scholars have conducted extensive researches in this field, and existing studies can be categorized into four categories. The first category involves classifying the land use of remotely sensed images in specific periods. Land use transfer matrices are constructed to quantify the changes of different types of land use. Finally, the inflow and outflow of the vegetation area in each period were counted to evaluate the effect of vegetation restoration in mining areas [7,8]. The second category is to classify the vegetation cover into different levels, and analyze the spatial characteristics of vegetation restoration by counting the changes of the areas and proportions for different levels [9,10,11]. The third category evaluates and predicts the trend of vegetation restoration from a temporal perspective using mathematical and statistical methods. Typical studies usually apply linear regression analysis [12,13,14,15], trend analysis & Hurst-index [16,17], and coefficient of variation [18,19,20] to assess the interannual trends, change rates of vegetation cover over the time. This category is the most commonly used in assessing vegetation restoration effect. While the aforementioned three categories of research partially reveal the effects of vegetation restoration in mining areas, the first category relies on results from land use classification, which leads to lower efficiency. The second and third categories analyze the vegetation changes based on directly monitored vegetation indices. In these two categories of research, vegetation changes caused by natural factors and human activities are not differentiated, and the underlying driving factors are not quantitatively analyzed. Therefore, there is a fourth category of research that compares the relative contributions of natural factors and human activities to vegetation growth in mining areas utilizing multiple linear modelling and residual analysis [21,22]. Nevertheless, the impact of driving factors on vegetation growth varies in different time and spatial locations, i.e., there exists spatial heterogeneity and temporal heterogeneity, which cannot be considered by multiple linear regression modelling. Overall, existing studies lack the removal of the impact of natural factors to separately assess the impact of human activities on vegetation restoration in mining areas.
To address the aforementioned problem, this paper constructed a quantitative model between NDVI, temperature, precipitation, and DEM using GTWR [23,24], which considered the spatio-temporal heterogeneity of the impacts of the driving factors on vegetation restoration in mining area. Two goals have been reached:(1) The impact of natural factors and human activities on vegetation restoration was distinguished through residual analysis, allowing for a separate assessment of the impacts of human activities. (2) A quantitative comparison was conducted to evaluate the relative contributions of temperature, precipitation, and human activities to vegetation restoration. The results of this paper can provide data support and scientific basis to some extent for the ecological restoration and environmental protection in mining areas.

2. Materials and Methods

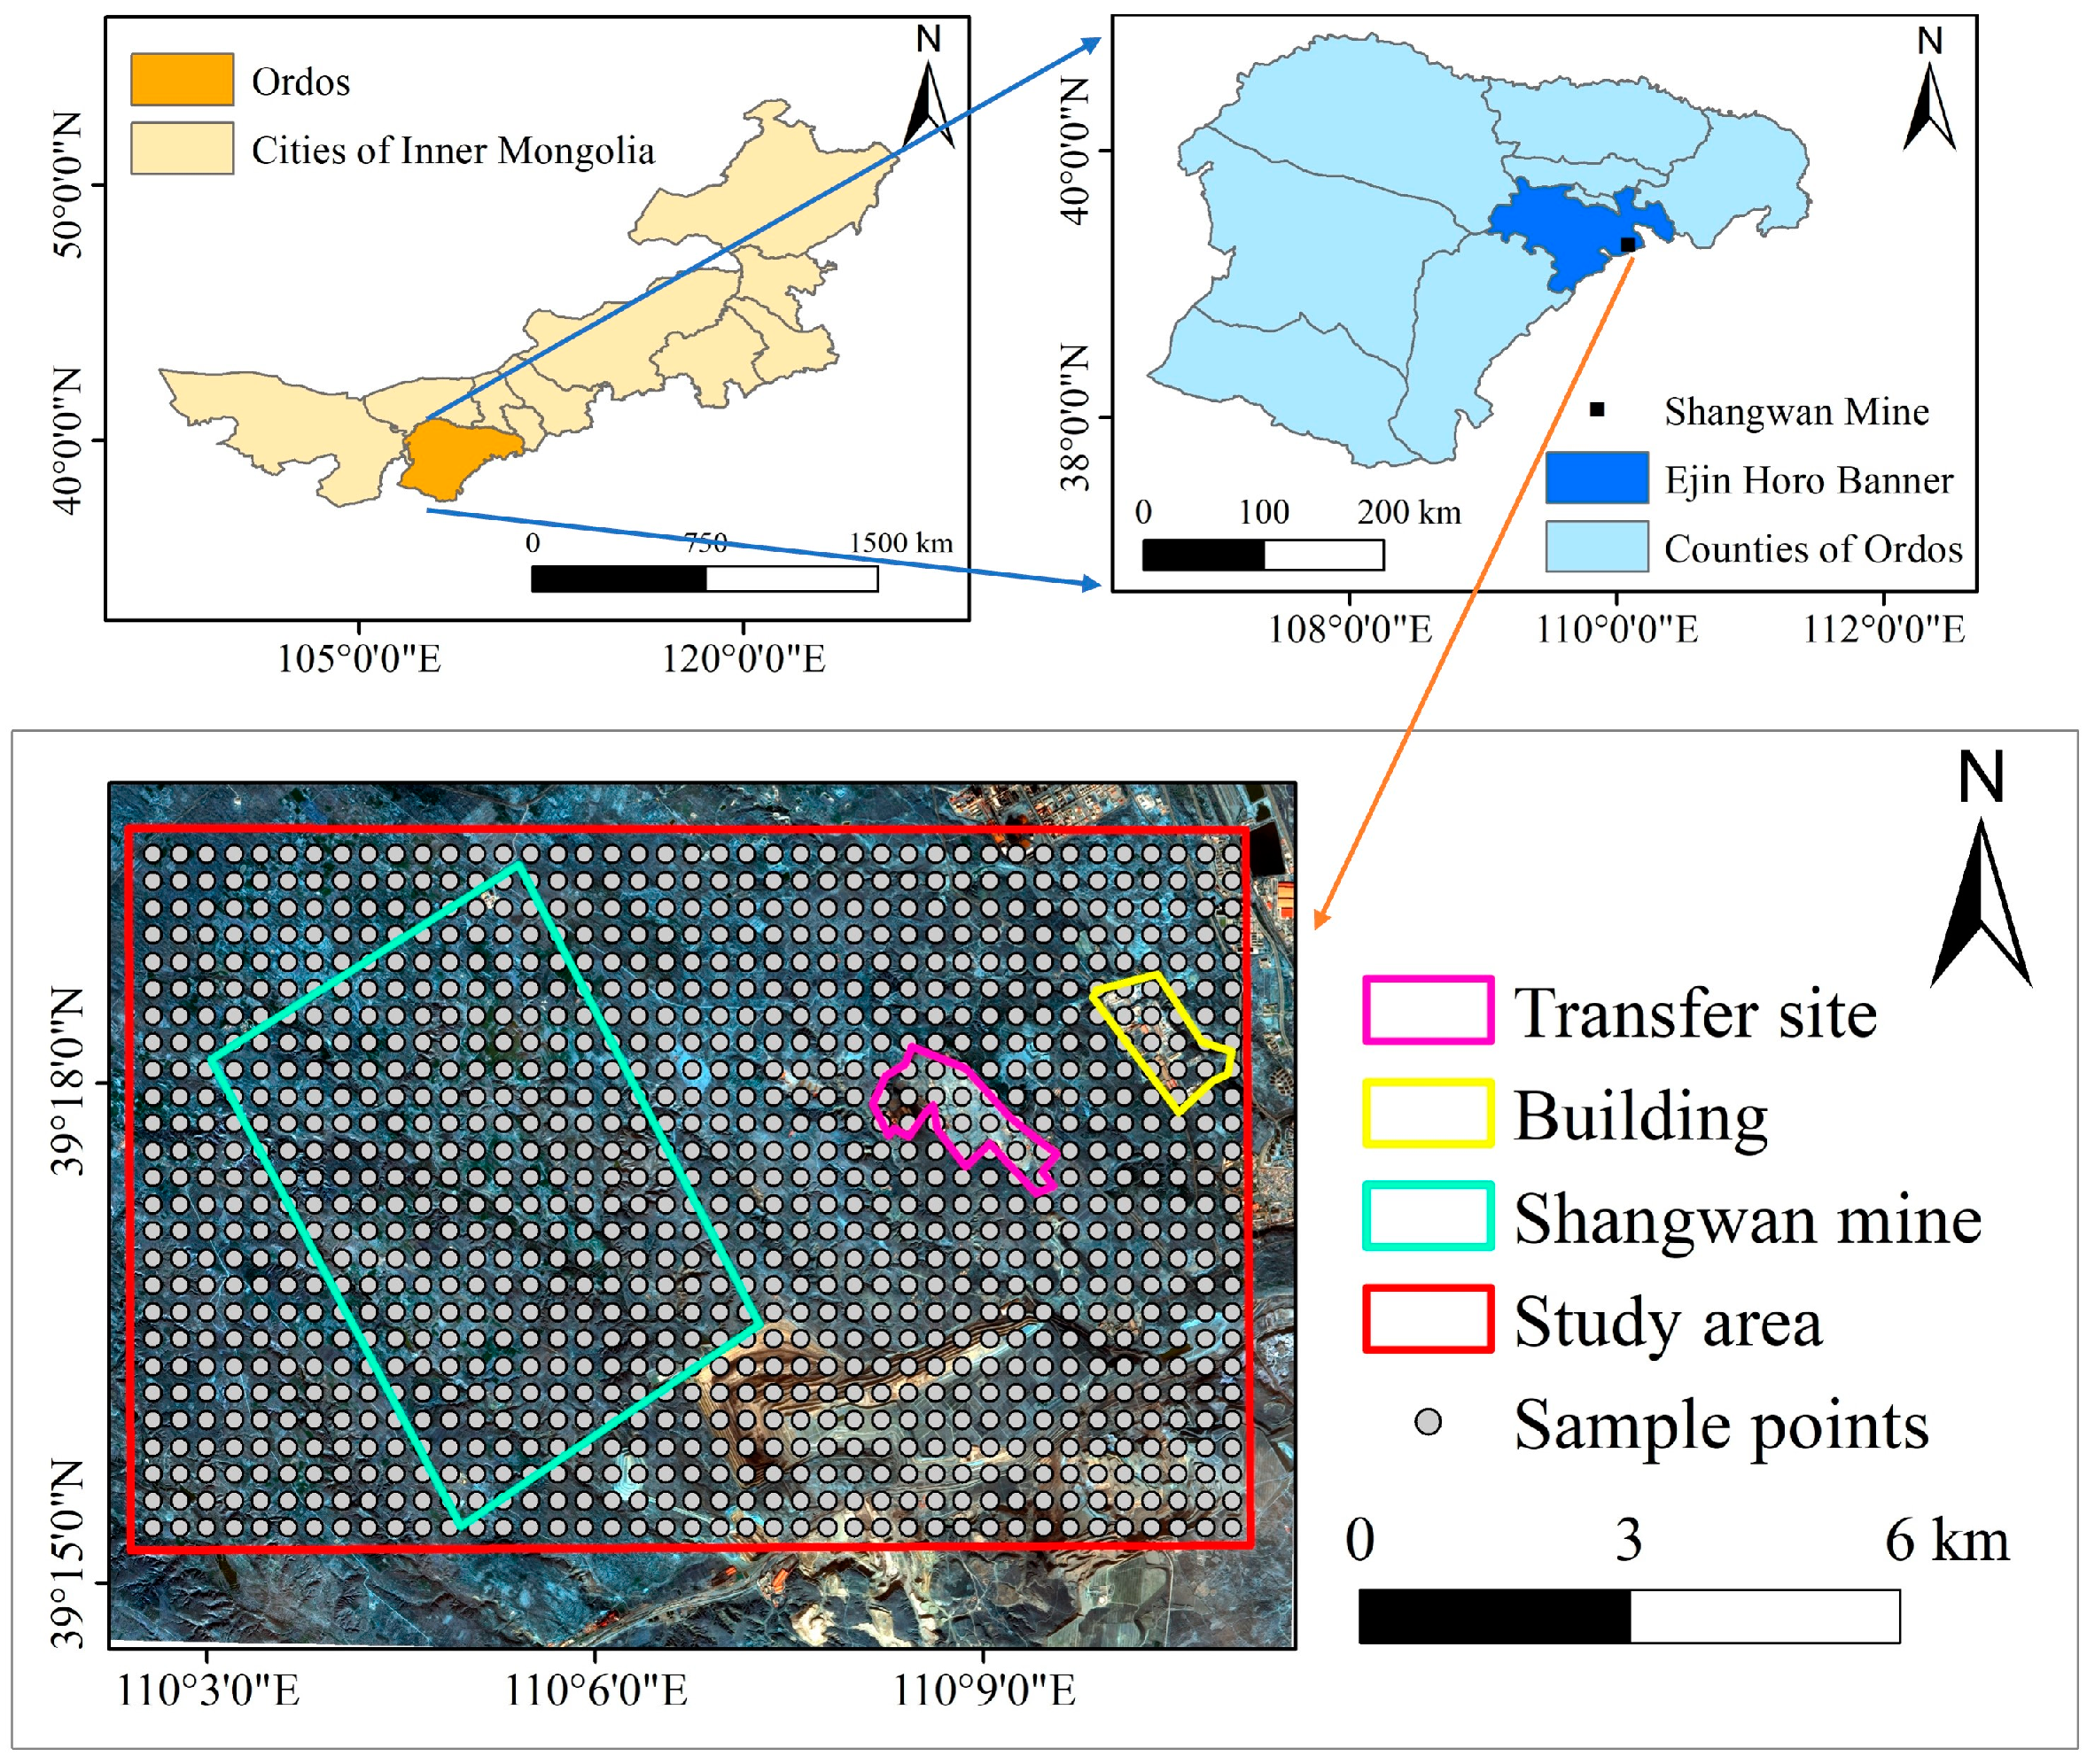
2.1. Study Area and Data

Shangwan Mine is situated in Ejin Holo Banner, Ordos, Inner Mongolia, China, and belongs to Shenfu-Dongsheng Coal Base. It was established and put into production in 2000. The mine area covers 61.80 km2, with geological reserves of 1.23 billion tons and recoverable reserves of 830 million tons. The approved production capacity is 16 million tons per year. Shangwan Mine employs a combination of level mining, inclined shafts, and vertical shafts, with an inclination angle ranging from 1° to 3°. The mining focuses on three stable coal seams: seams 1−2, 2−2, and 3−1, with average coal seam thicknesses of 5.20 m, 5.30 m, and 2.60 m, respectively [25]. All coal seams consist of non-caking coal. The study area is located between 39°15′14″~39°19′26″ N, 110°2′27″~110°11′2″ E, with an east-west extent of approximately 12.20 km and a north-south extent of about 7.60 km, covering an area of 92.72 km2. For the construction of the GTWR model, sampling points were uniformly selected within the study area at 300 m intervals, as shown in Figure 1. The topography within the study area is higher in the northwest and lower in the southeast, with elevations ranging from 1072 to 1341 m. Shangwan Mine is located in the transitional zone of the Mu Us Desert, characterized by typical sand dunes and sandy landforms, and falls within a temperate semi-arid continental climate. The annual evaporation reaches up to 2000 mm, while the annual rainfall is only approximately 400 mm, primarily concentrated between the months of July and September. The average annual temperature hovers around 7 °C. During the initial phase of construction, the average vegetation coverage at Shangwan Mine was only 3–11%, predominantly comprising shrubs and grasslands.
Guided by the overall strategic direction of China Shenhua Energy Company Limited, Shangwan Mine has developed a comprehensive plan for the “Green Mines” target of the mine from 2011 to 2020, encompassing scientific management, process equipment, resource conservation and comprehensive utilization, energy conservation and environmental protection, land reclamation, technological innovation, and harmonious mining area. Remarkable achievements have been made in the ecological and environmental management of the mining area. In March 2011, Shangwan Mine was designated as one of the “first batch of national Green Mines pilot units” by the Ministry of Land and Resources. In September 2014, it was awarded as one of the “first batch of national Green Mines” [26].
The data utilized in this study comprise long time-series remote sensing data, topographic data, and climate meteorological data, with detailed information in Table 1. The meteorological data are derived from the weather station nearest to the study area (i.e., Dongsheng station) and serve as a representative of the climatic conditions in the study area. Meteorological data includes all 12 months from 1986–2020. The Landsat images are used to obtain the NDVI [27,28], and the maximum algorithm was carried out for all eligible NDVI datasets from 1 July to 30 September. There are a total of 143 scenes Landsat images. Furthermore, it is worth noting that data quality issues resulted in missing data for the years 2001, 2009, and 2012.

2.2. Methodology

2.2.1. Data Acquisition and Pre-Processing

The acquisition of NDVI was achieved using the Google Earth Engine (GEE) platform. Firstly, the vector boundary file of the study area was imported. Subsequently, preprocessing steps, including cloud filtering, cloud removal, and cropping, were applied. Further filtering was conducted to select images from the period between 1 July and 30 September each year. NDVI was calculated based on Equation (1). Finally, the maximum algorithm was carried out for all eligible NDVI datasets. Maximum algorithm refers to the superposition of multiple raster images of the same spatial scope, and the value of each raster cell is taken as the maximum of multiple images. In addition, to eliminate the effects of unit and scale differences in multi-source data, all temperature, precipitation, and DEM data were normalized to a range of 0 to 1, calculated as in Equation (2).
N D V I = N I R R N I R + R
where NIR and R represent the surface reflectance of the near-infrared band and the red band.
x 0 = x x min x max x min
where xmax and xmin correspond to the maximum and minimum of the original data respectively, x represents the original data and x0 represents the normalized data.

2.2.2. Selection of Meteorological Data

To determine the optimal time period for the correlation between NDVI and meteorological data, this paper performed partial correlation analysis [29] and significance test for the correlations between NDVI and temperature as well as precipitation. The partial correlation coefficient was an indicator to assess the strength of the correlations. The calculation formula and t-test for the partial correlation coefficient are presented in Equation (3).
R X Y , Z = R X Y R X Z × R Y Z ( 1 R 2 X Z ) ( 1 R 2 Y Z ) T = R X Y , Z 1 R 2 X Y , Z n - q - 2
where RXY,Z denotes the correlation coefficient between the X and Y after determining for Z. In this paper, with Z representing temperature, X and Y respectively represent NDVI and precipitation. With Z representing precipitation, X and Y respectively represent NDVI and temperature. The value of RXY,Z ranges from −1 to 1, where a positive value indicates a positive correlation between the two variables, and a negative value indicates a negative correlation. The magnitude of the absolute value signifies the strength of the correlation between the variables. Additionally, n represents the number of samples, while q represents the order.

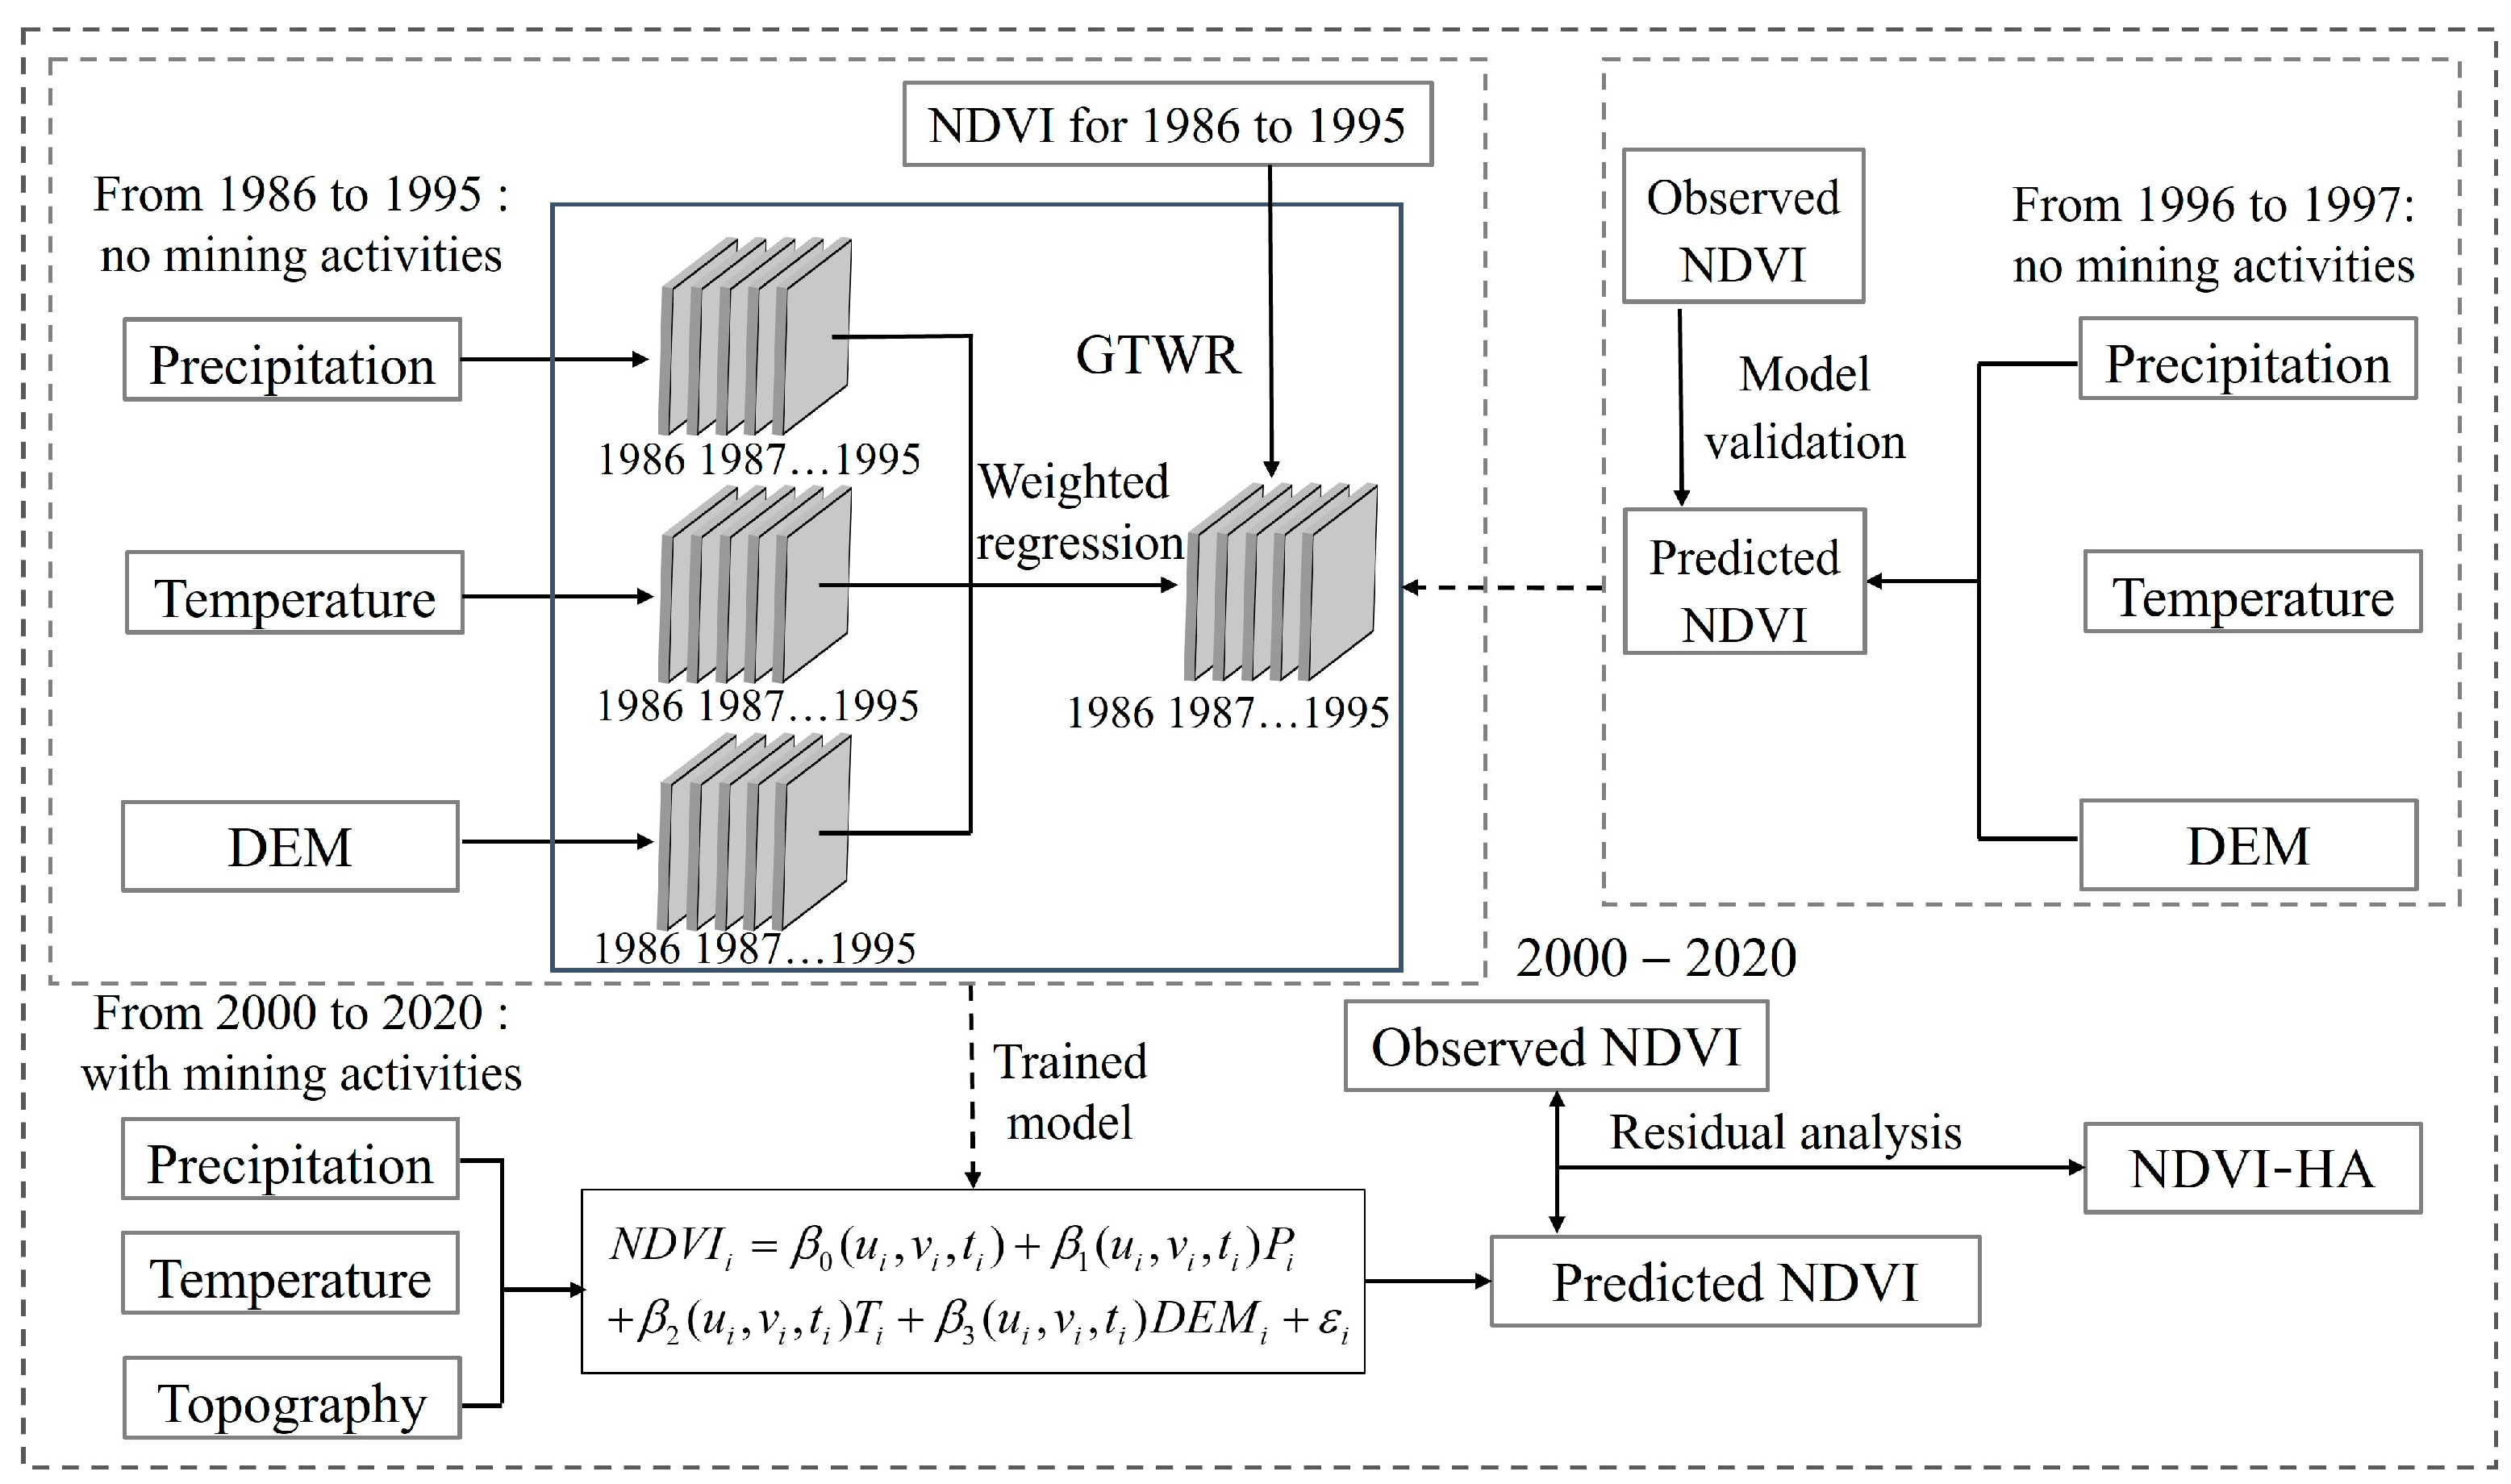
2.2.3. Extraction of NDVI-HA

Vegetation in mining areas is impacted by the coupling of multiple factors [30], including temperature, precipitation, topography, mining activities, manual restoration, et al. Furthermore, the extent of these impacts on vegetation varies across different times and geographical locations [31,32], leading to spatiotemporal heterogeneity. Therefore, GTWR was selected in this paper to construct the quantitative model between NDVI and the driving factors. GTWR is a local linear regression model that can consider the temporal non-stationarity and spatial non-stationarity at the same time. The model expression is shown in Equation (4).
Y i = β 0 ( u i , v i , t i ) + k n β k ( u i , v i , t i ) X i k + ε i
where (ui,vi,ti) represents the spatio-temporal coordinates of the ith point, β0 (ui,vi,ti) is the constant, βk (ui,vi,ti) denotes the regression coefficient of the kth variable for the ith point, and εi is the error for the ith point.
The model was utilized to extract the vegetation changes caused by human activities, with the specific implementation process shown in Figure 2. Firstly, according to remote sensing imagery and the available information, we found that there was almost no human activity during the period 1986–1995. Therefore, data from 1986–1995 characterized by the absence of mining activity were inputted into the model for training. During the training process, temperature, precipitation, and DEM were utilized as explanatory variables, while NDVI was considered the response variable. Mean Relative Error (MRE) was used to measure the model accuracy, and the accuracy was calculated to be 86% according to the Equation (5). Further accuracy validation of the model was conducted by inputting the data of 1996 and 1997 into the trained model, and comparing the predicted NDVI with the observed NDVI. The average MRE of these two years was 0.30, hence, the validation accuracy of the trained model was 70%. The scatter plot in Figure 3 illustrated the predicted NDVI and observed NDVI for the years 1996 and 1997, with the y = x contours in blue. It can be seen that the scatter points were relatively uniformly distributed on both sides of the contour line, which indicated that the model was credible to some extent. After the validation, the temperature, precipitation, and DEM from 2000 to 2020 were input into the trained model to obtain the predicted NDVI in the study area.
M R E = 1 n i = 1 n N D V I i N D ^ V I i N D V I i
where NDVIi and N D ^ V I i denote the observed NDVI and the predicted NDVI for the ith point, respectively.
Comparing the predicted NDVI with the observed NDVI, as shown in Figure 4, which demonstrates the interannual changes of the observed NDVI and predicted NDVI from 2000 to 2020. These two curves have similar fluctuating trends, which are impacted by climatic conditions. In addition, there is a deviation between the two curves, with the observed NDVI being larger than the predicted NDVI. In this paper, vegetation in mining areas was influenced by a combination of natural factors and human activities. The observed NDVI reflect the vegetation growth under the joint influence of these factors, while the predicted NDVI represent the vegetation growth driven only by natural factors. Hence, the discrepancy between the observed NDVI and the predicted NDVI is regarded as the vegetation changes induced by human activities (NDVI-HA), as shown in Equation (6). The results demonstrate that vegetation in the study area exhibits better growth conditions in the presence of human activities compared to natural conditions. The analysis of NDVI-HA can find out the impact pattern of human activities on the vegetation growth, and then make a reasonable evaluation of the vegetation restoration in the mining area.
N D V I p r e = β 0 + β 1 × P + β 2 × T + β 3 × D E M N D V I - H A = N D V I o b s N D V I p r e
where NDVIpre and NDVIobs denote the predicted NDVI and the observed NDVI.

2.2.4. Evaluation of Trends in Vegetation Growth

Trend analysis was utilized to predict the changing trends of NDVI over the time by performing a linear regression [33]. The calculation formula is defined in Equation (7).
S l o p e = n i = 1 n i N D V I i i = 1 n i i n N D V I i n i = 1 n i 2 ( i = 1 n i ) 2
where i corresponds to the monitoring year, ranging from 1 to 32. n represents the total number of years, which is set at 32. NDVIi denotes the NDVI for the ith year. A positive Slope value reflects vegetation improvement, whereas a negative Slope value indicates vegetation degradation. The significance of the trend is examined through the F-test, which assesses the confidence level. Notably, the significance is only concerned with the degree of reliability in the trend change, regardless of its speed. The calculation of F-test is presented in Equation (8).
  U =   i = 1   n ( y ^ i y ¯ i ) 2   Q =   i = 1   n ( y i y ^ i ) 2   F = U × n 2 Q
where U represents the regression sum of squares errors, Q denotes the sum of squared errors, yi corresponds to the observed value for the ith year, ŷi represents the regression value, and ӯ is the annual average of NDVI.
Referring to the p-value selection of existing publications [34,35,36], vegetation changes were classified into six classes in this paper: Slope < 0 & p < 0.01 (extremely significant degradation), Slope < 0 & 0.01 < p < 0.05 (significant degradation), Slope < 0 & p > 0.05 (no evident degradation), Slope > 0 & p > 0.05 (no evident improvement), Slope > 0 & 0.01 < p < 0.05 (significant improvement), Slope > 0 & p < 0.01 (extremely significant improvement).

3. Results

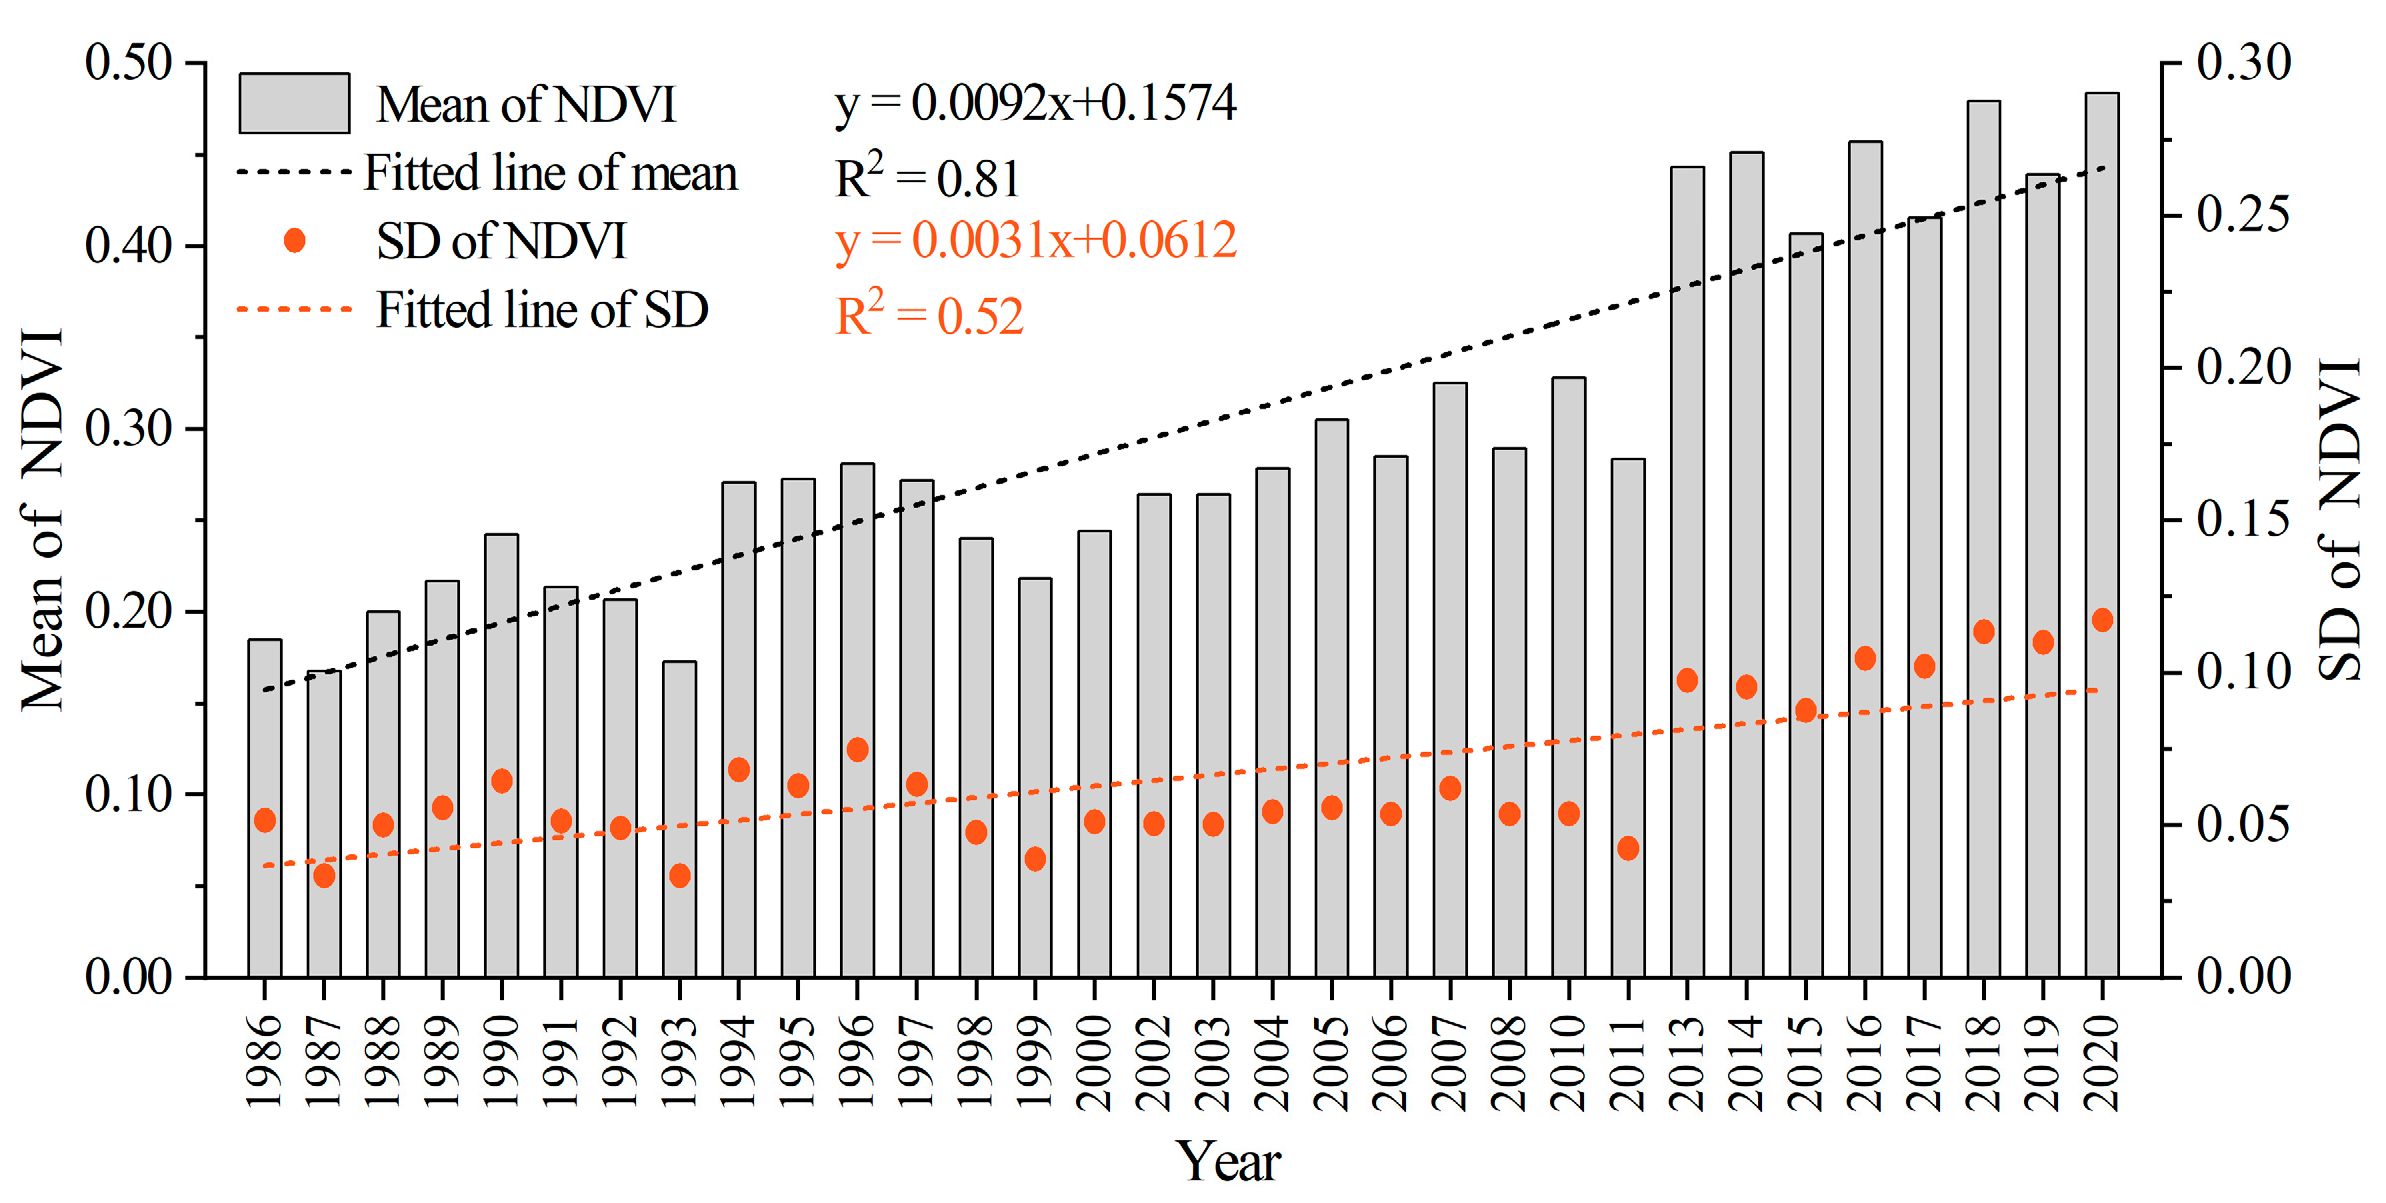
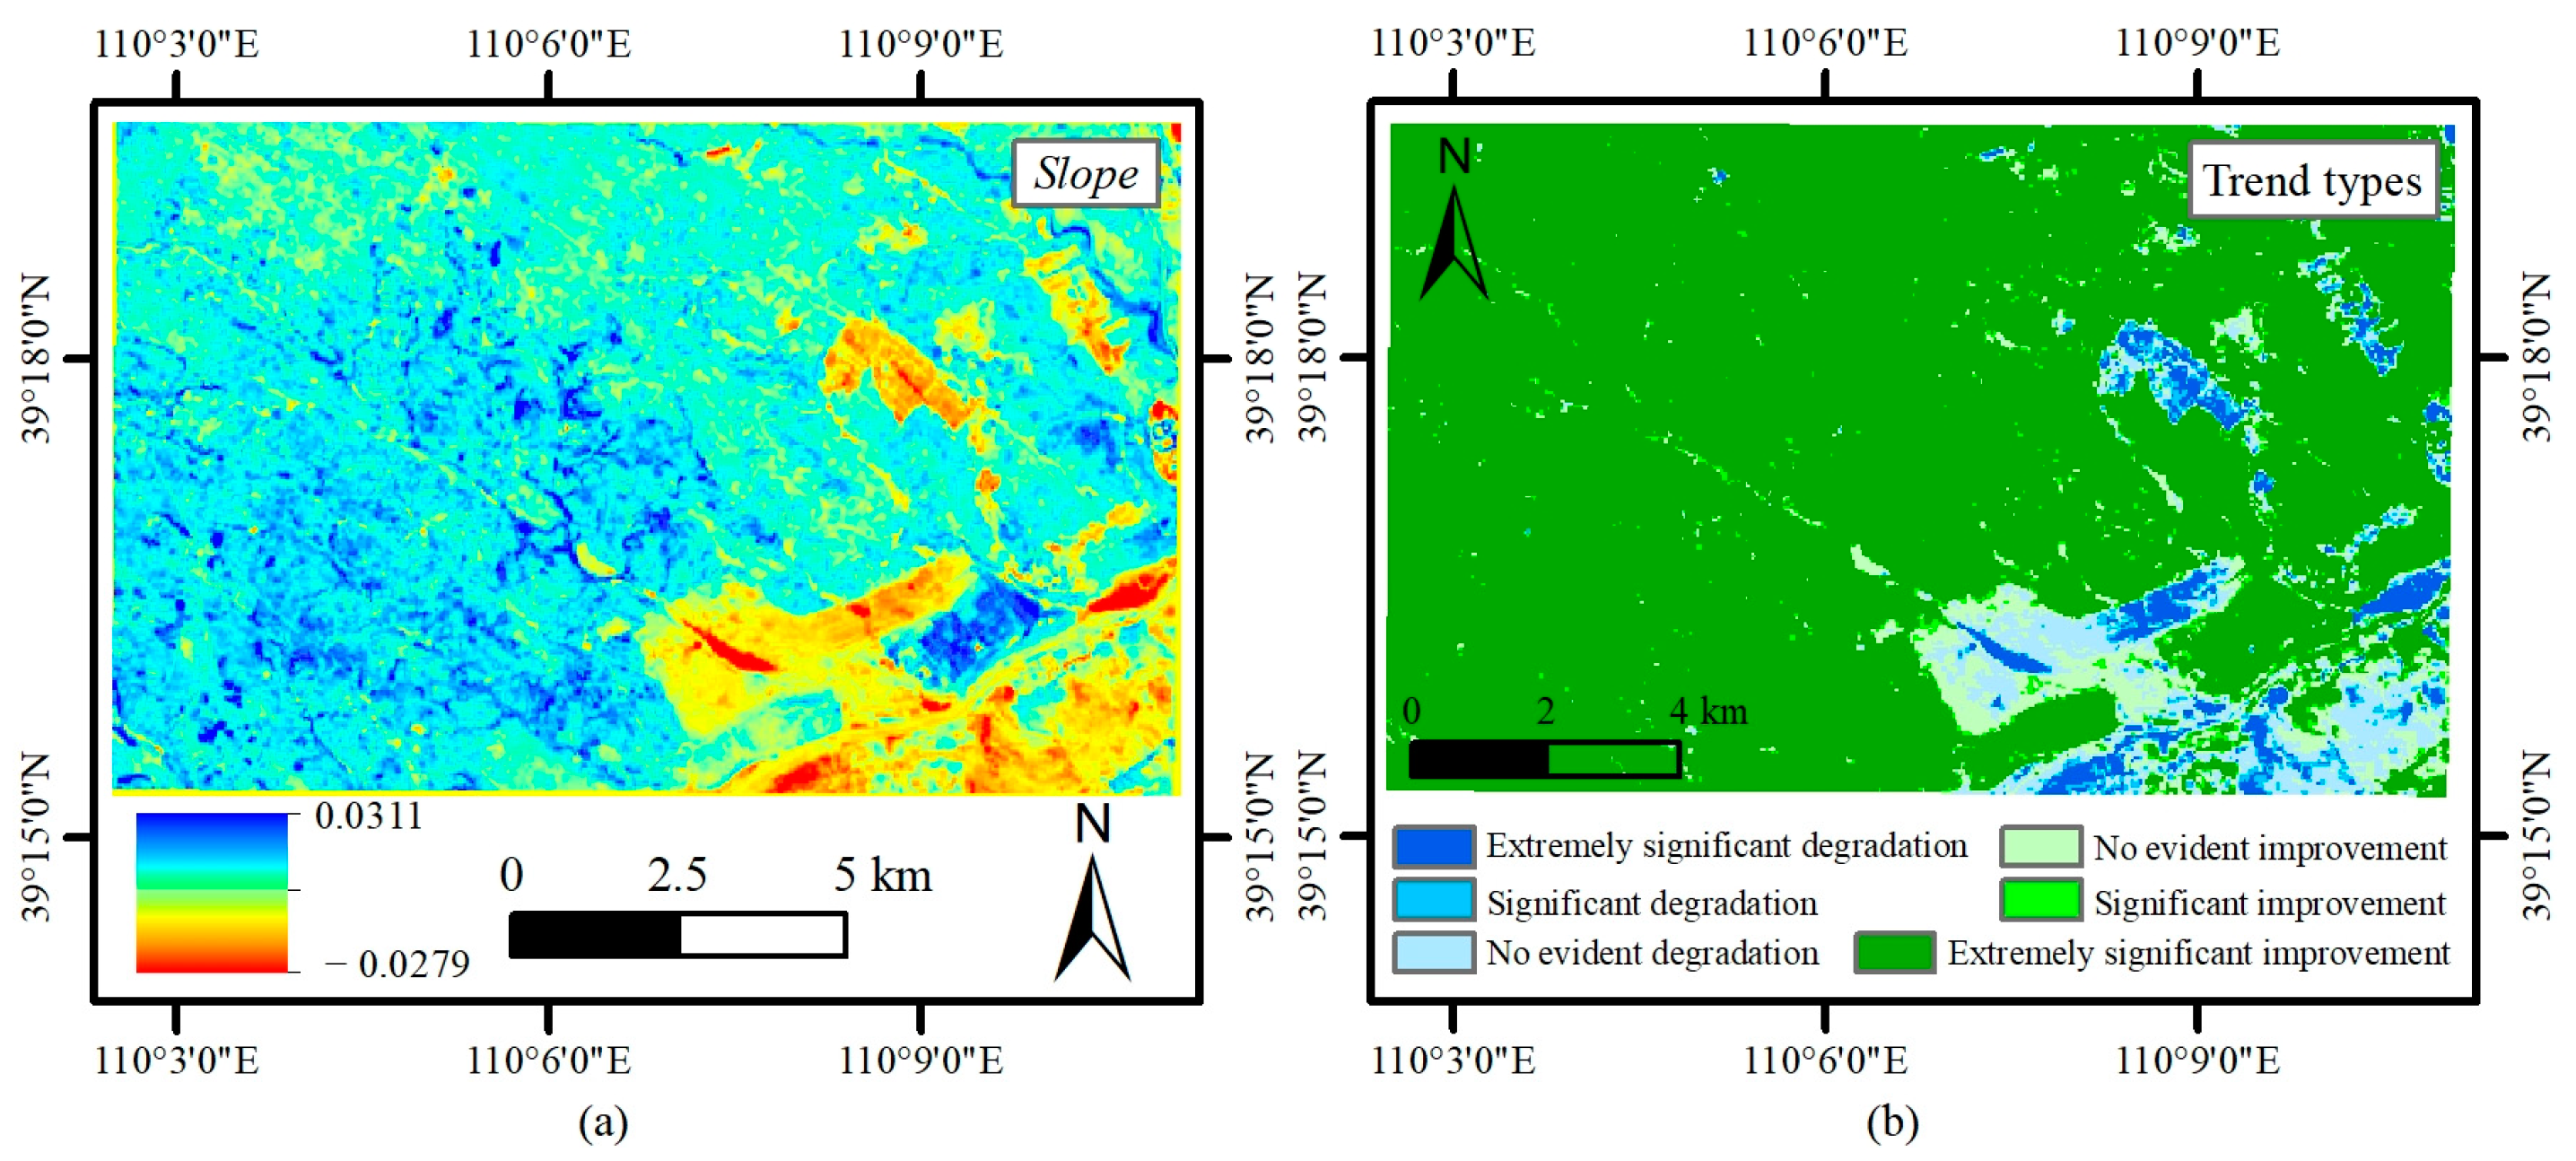
3.1. Spatio-Temporal Characteristics of Vegetation Cover

Figure 5 illustrates the average NDVI in the study area from 1986 to 2020, exhibiting fluctuations ranging from 0.16 to 0.49. A linear regression was conducted to fit the mean NDVI values, yielding a slope of 0.0092. The R2 was 0.81, indicating a significant fit. The positive slope indicated an overall upward trend in NDVI throughout the research period, signifying vegetation improvement. Furthermore, the standard deviation (SD) was calculated for each year and subjected to linear regression analysis. The resulting slope was 0.0031, with an R2 of 0.52, indicating a significant fit. The positive slope indicates that the standard deviation of NDVI generally increased, and the NDVI values in the study area became more dispersed, reflecting the increased spatial heterogeneity of vegetation cover in the study area.
To further quantify the spatio-temporal characteristics of vegetation growth trends within the mining area, the trend analysis was utilized to perform linear fitting and significance tests for each pixel, revealing the temporal variations of NDVI. Figure 6a illustrates the spatial distribution of Slope in the study area. It is observed that most of the areas exhibits positive values, indicating an improving vegetation trend. The areas with negative Slope values are the open-pit mining areas in the lower right corner and the vicinity of the transfer site and building area of the Shangwan Mine. The vegetation change trends in the study area were classified into 6 types: extremely significant degradation, significant degradation, no evident degradation, no evident improvement, significant improvement, and extremely significant improvement, as shown in Figure 6b. Furthermore, a statistical analysis is conducted to determine the pixel count and area proportion for six trend types (Table 2). The degraded areas account for 8.47% of the total area, with 4.91% exhibiting a “no evident degradation”, while more than 90% of the area showed an improving trend, with 84.68% demonstrating an “extremely significant improvement”. The results indicate that the vegetation cover of the study area has demonstrated a trend of great improvement over the past three decades.

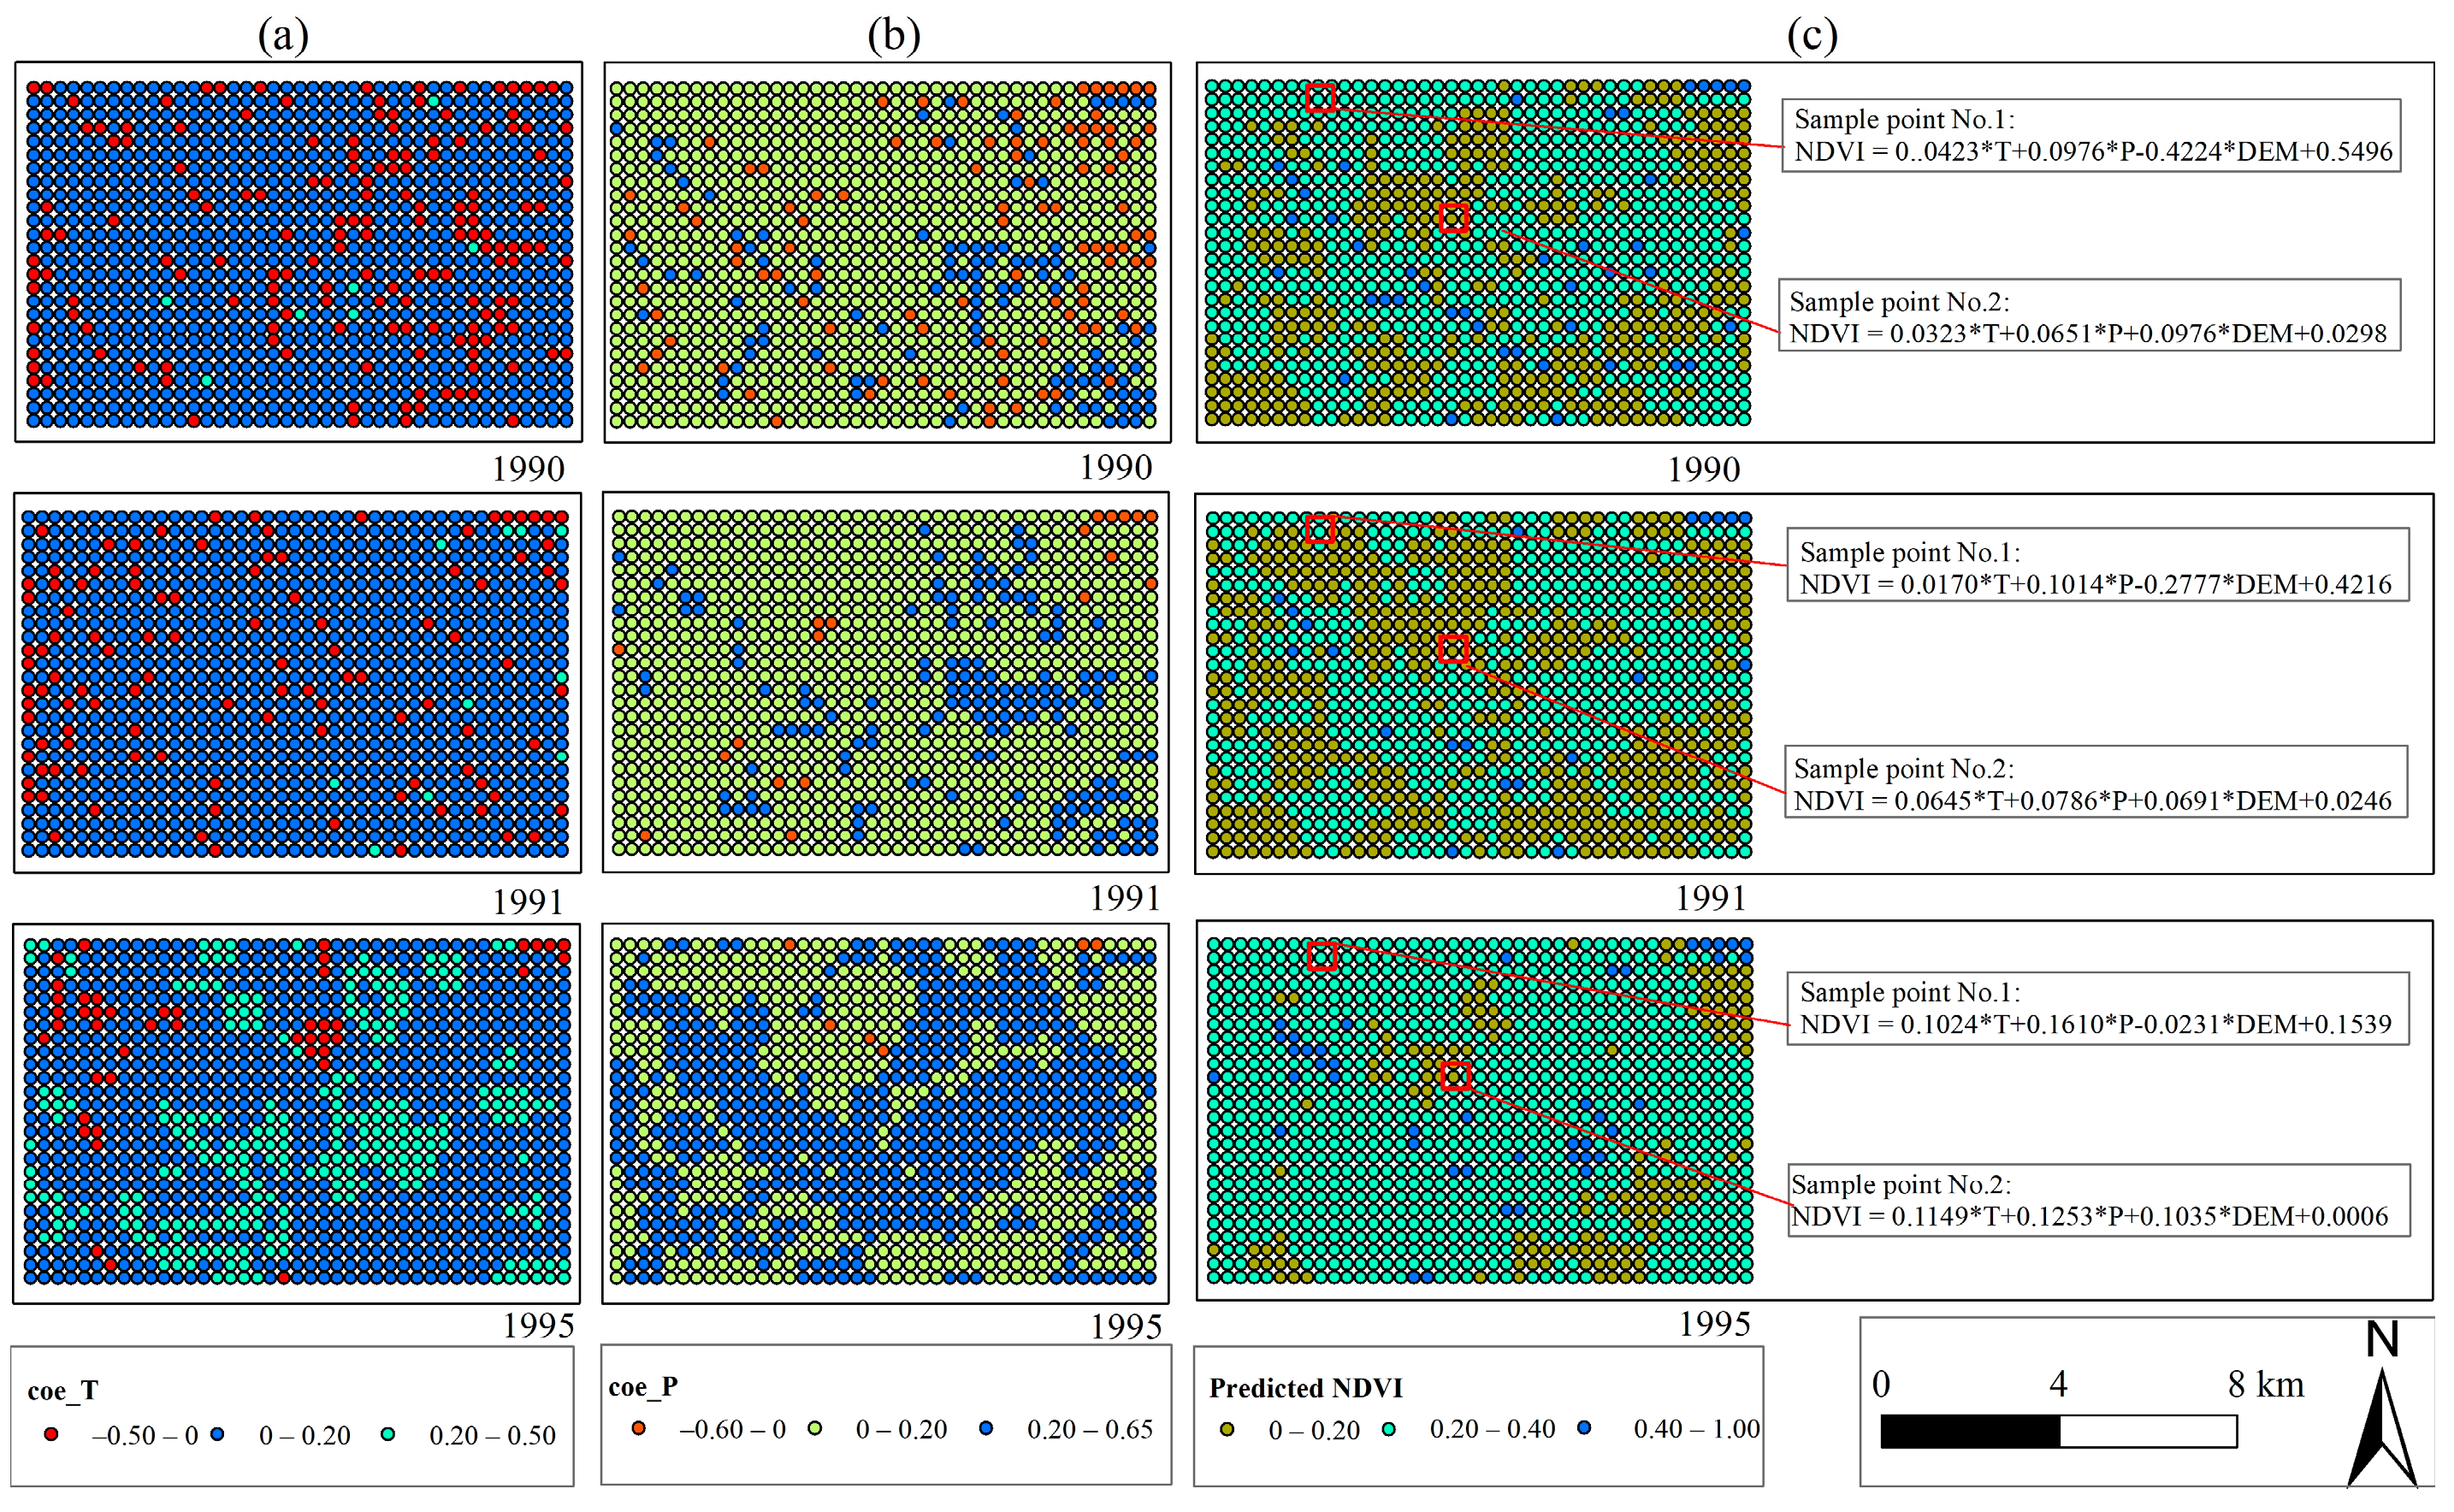
3.2. Driving Processes of Vegetation Growth in Natural Conditions

Under natural conditions, the optimal growth period for vegetation in the study area is from July to September. Therefore, temperature and precipitation data before September were selected for correlation analysis with NDVI. As shown in Table 3, the results indicated that NDVI exhibited the strongest correlation with the precipitation in July, with a partial correlation coefficient of 0.879, and the strongest correlation with the average temperature in July-August, with a partial correlation coefficient of 0.702. Hence, the precipitation in July and the average temperature in July-August were selected as the driving factors to participate in the construction of the model in this paper.
The modelling results of GTWR are shown for the years 1990, 1991, and 1995 as examples. As shown in Figure 7, Figure 7a,b show the spatial distribution of the coefficients for temperature (β2) and precipitation (β1) in the driving model, respectively. It can be observed that the coefficients for temperature and precipitation generally exhibit positive values, indicating a positive impact on NDVI. Within a certain range, higher temperatures and greater precipitation levels correspond to improved vegetation growth conditions. From 1990 to 1995, there is an increasing trend in the coefficients for temperature and precipitation, suggesting a progressive amplification of their influence on NDVI over the years. Figure 7c shows the driving equations of the predicted NDVI for some sample points. The variables T and P in the equations represent temperature and precipitation, respectively. The same point has different driving equations at different times, and the driving equations of the points in different spatial locations are also different. For example, the driving equation for sample point No.2 in 1991 is NDVI = 0.0645 × T + 0.0786 × P + 0.0691 × DEM + 0.0246. Upon analyzing this equation, it is evident that all coefficients are positive, indicating the positive influence of temperature, precipitation, and DEM on the sample point. Moreover, precipitation has the greatest impact on NDVI at this point as the absolute value of the coefficient for precipitation is the largest.
The above results show that the GTWR can simultaneously consider temporal heterogeneity and spatial heterogeneity to obtain the quantitative relationship between NDVI and temperature, precipitation, and DEM, which provides a quantitative model basis for the subsequent separation of the impacts of natural factors and human activities on vegetation restoration in mining areas.

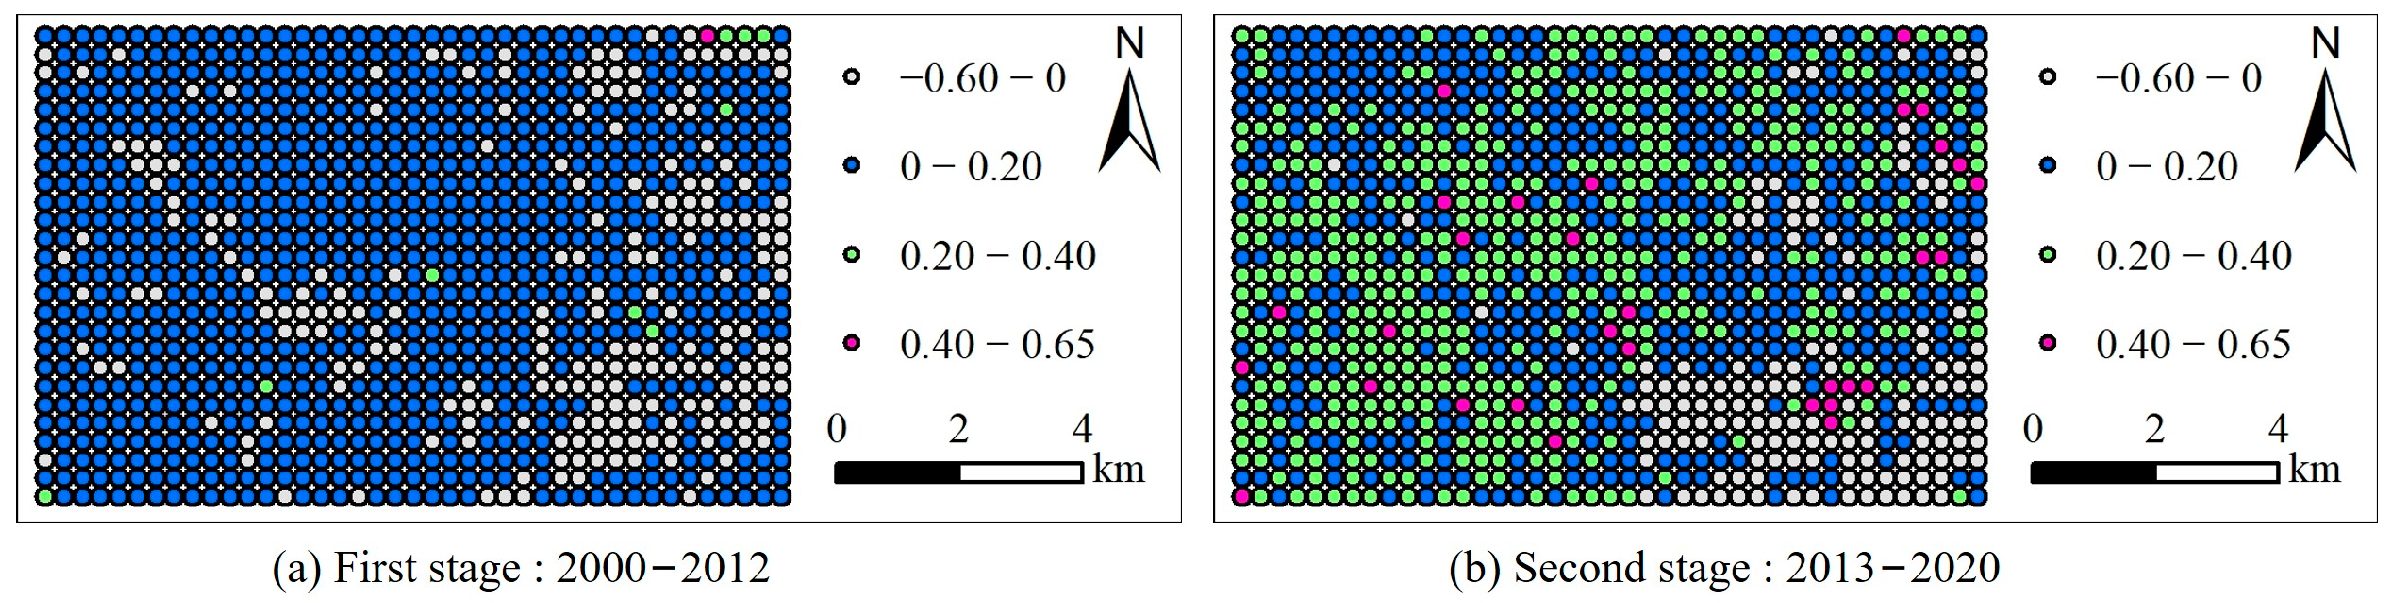
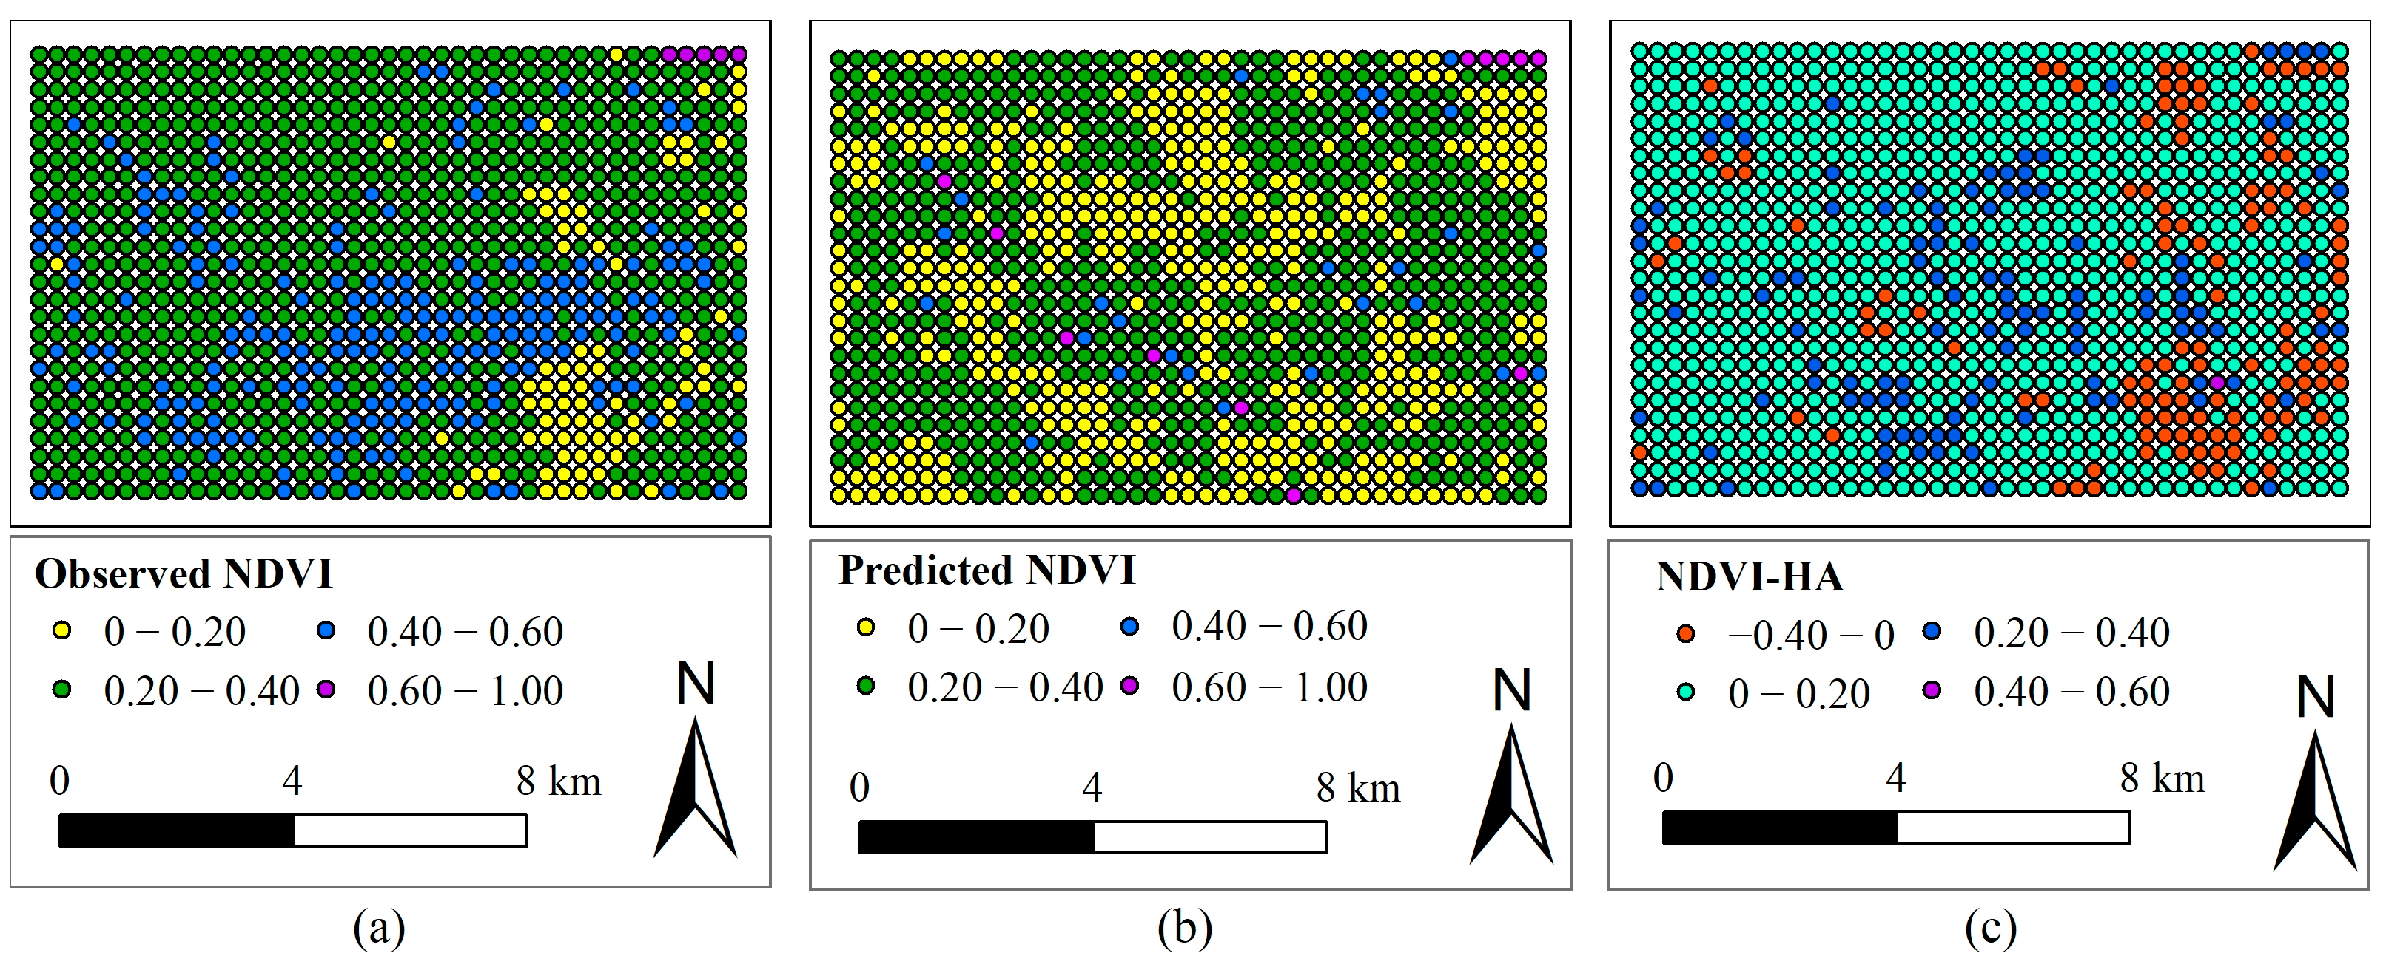
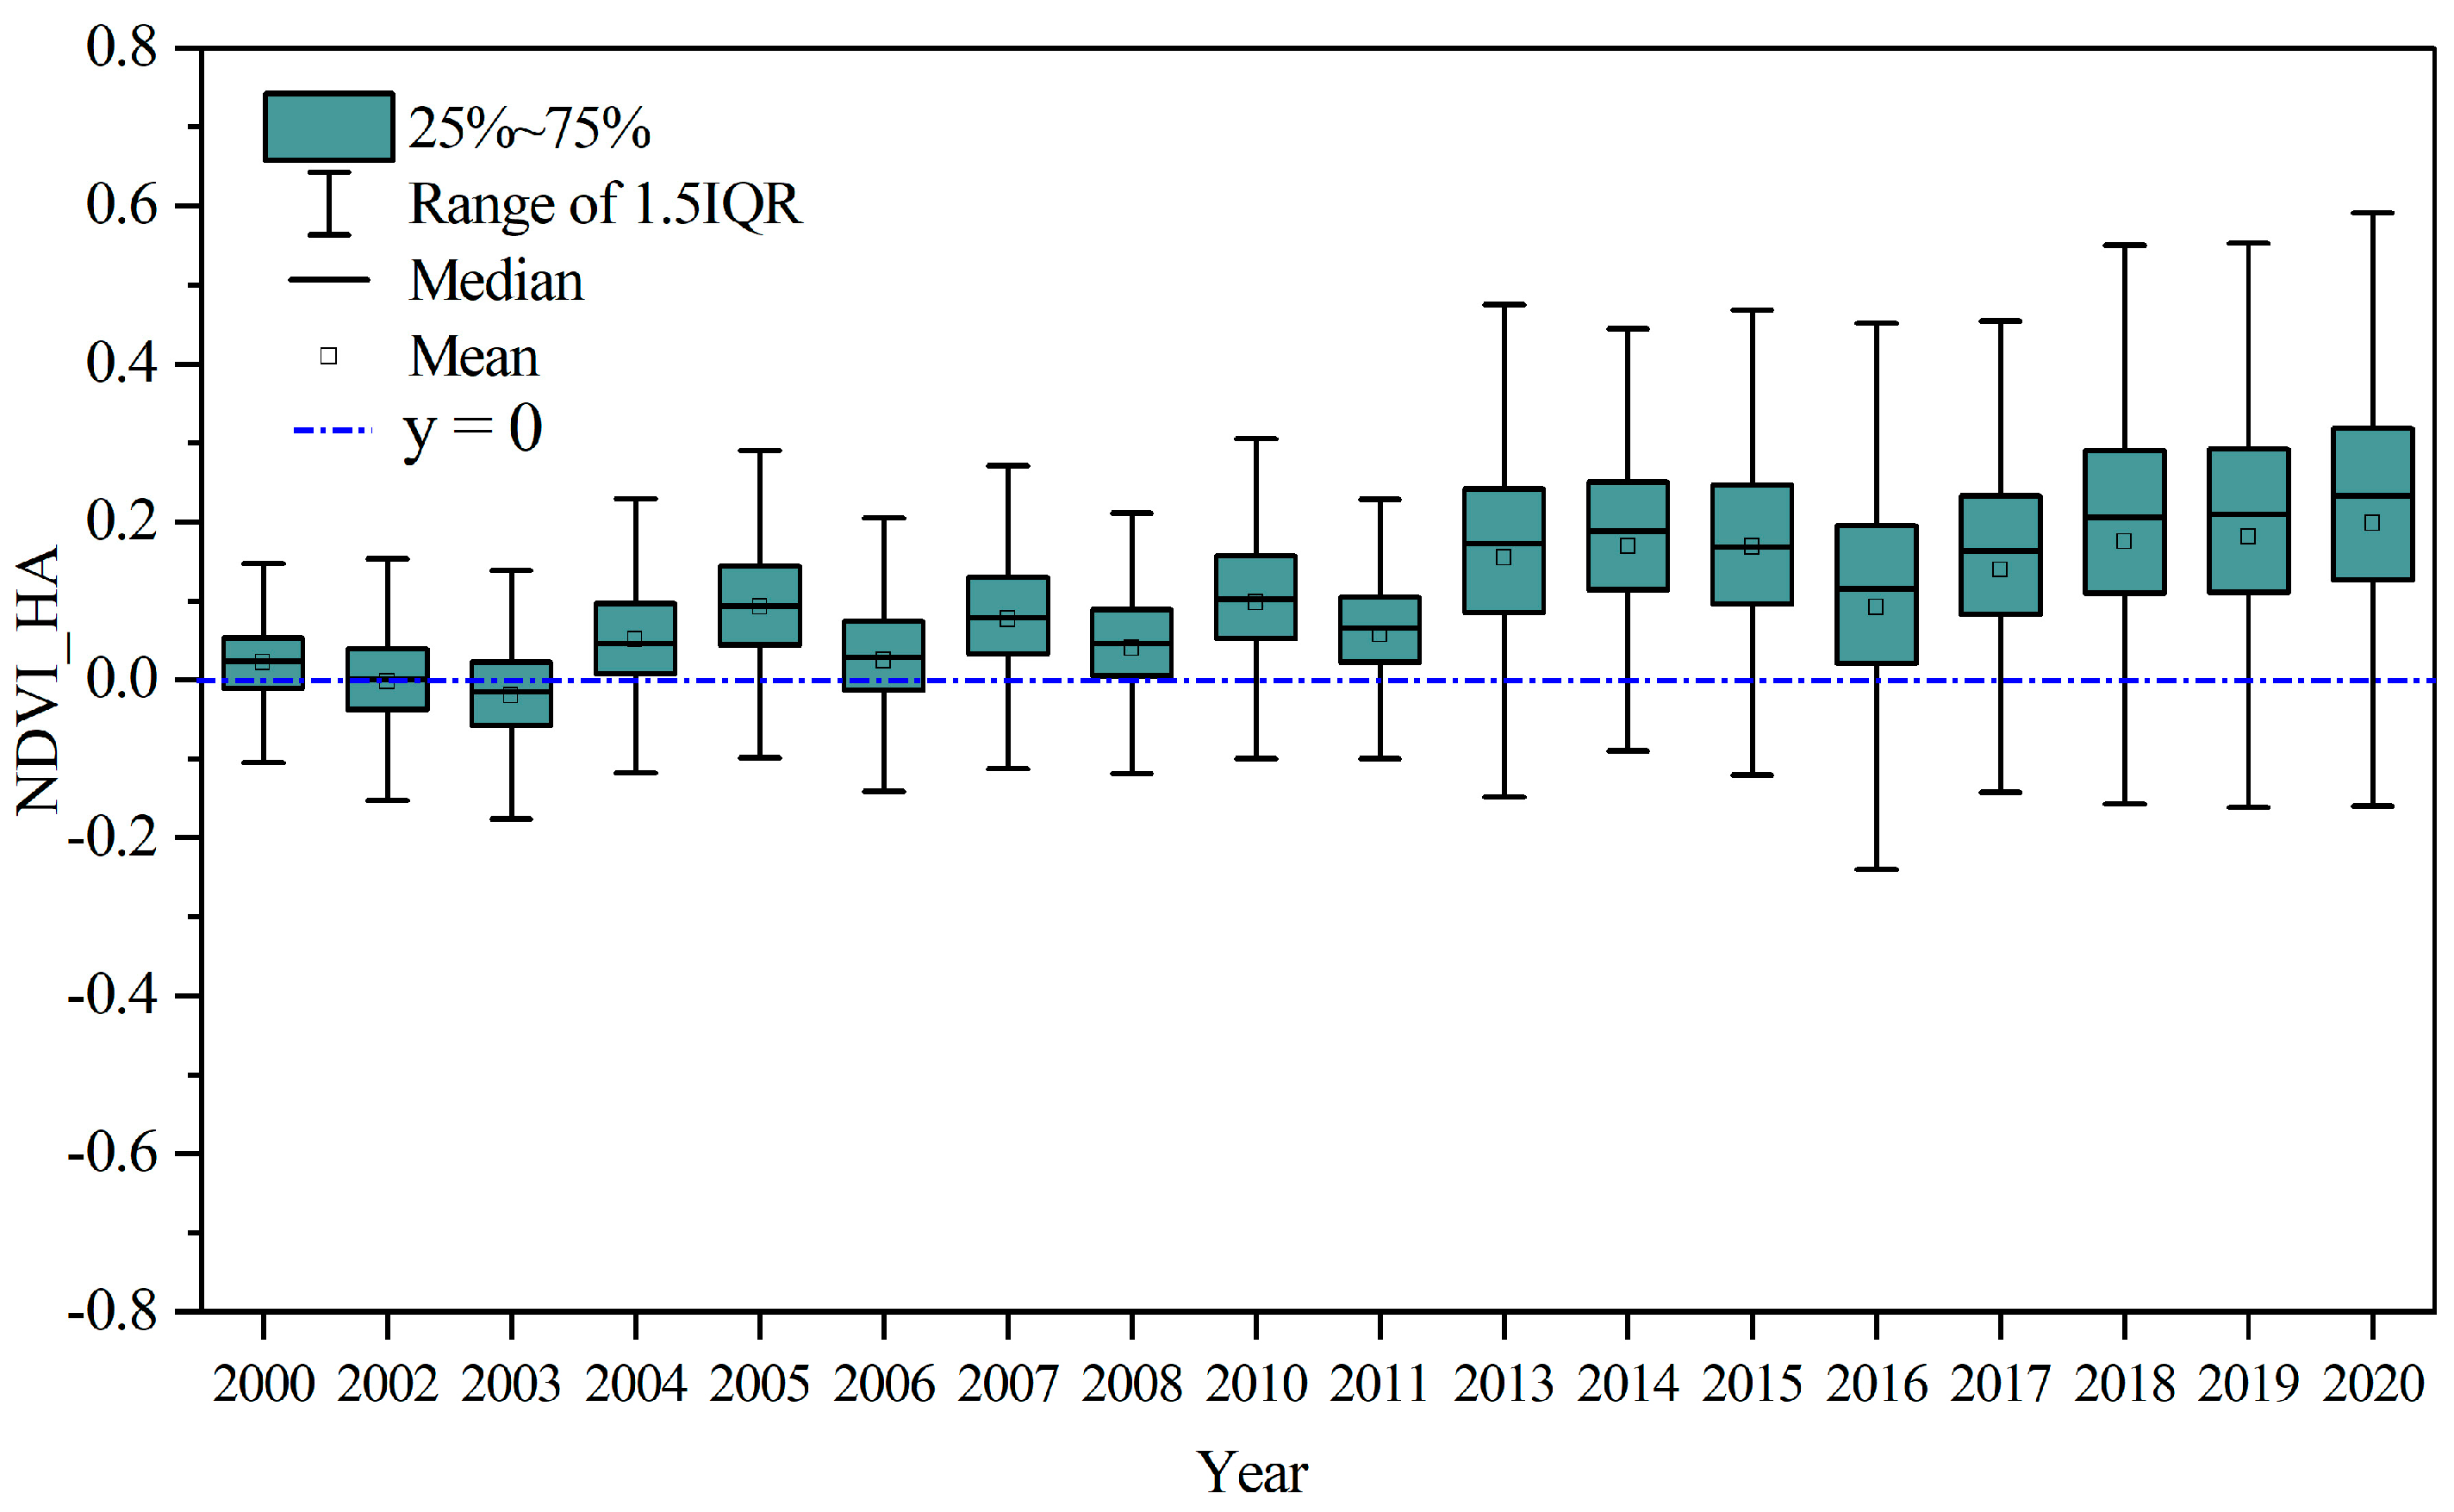
3.3. Spatio-Temporal Patterns of Impact of Human Activities on Vegetation Restoration

Taking 2010 as an example, Figure 8 shows the extraction results of NDVI-HA. Figure 8a displays the observed NDVI monitored by remote sensing, and Figure 8b represents the NDVI predicted by the model. As can be seen from Figure 8b, the predicted NDVI values are not uniform, this can be attributed to two main reasons. Firstly, the GTWR modeling utilized in this study takes into account the spatiotemporal heterogeneity, leading to different driving equations for individual sample points. Secondly, there is spatial variability in the topography of the study area, characterized by higher elevations in the northwest and lower elevations in the southeast.
By subtracting the observed NDVI from the predicted NDVI on a per-sample point, the difference in NDVI can be calculated, thereby separating the vegetation growth changes caused by natural factors. The resulting NDVI difference represents the vegetation changes caused by human activities. Figure 8c illustrates the spatial distribution of NDVI-HA. NDVI-HA > 0 indicate a positive impact of human activities on vegetation, while NDVI-HA < 0 indicate a negative impact.
To examine the temporal patterns of impact of human activities on vegetation restoration in the Shangwan Mine, this study conducted box plot statistics on the NDVI-HA from 2000 to 2020, as depicted in Figure 9. The results reveal that NDVI-HA values are generally positive, indicating vegetation has been improving due to the human activities in the mining area. Furthermore, the average of NDVI-HA exhibits a year-by-year increase, signifying a progressive enhancement in the degree of vegetation improvement in the mining area. The range of 1.5 times the interquartile range (IQR) gradually increases, suggesting a growing spatial heterogeneity of NDVI-HA and an intensified vegetation heterogeneity resulting from human activities in the study area. Overall, the vegetation was significantly improved under the environment with mining activities from 2000 to 2020 where human activities were intense. It indicates that there are obvious vegetation restoration activities in the study area and significant restoration effects have been achieved. Additionally, it is notable that the NDVI-HA in the period of 2013−2020 is noticeably higher than that in 2000–2012, indicating better vegetation restoration after 2013.
The spatial characteristics of impact of human activities on vegetation restoration are further analyzed. As can be seen from Figure 9, it is clear that the average NDVI-HA for the period from 2013 to 2020 exhibit a significantly increase compared to the period from 2000 to 2012. Therefore, the analysis for vegetation changes was divided into two stages: the first stage spanning from 2000 to 2012 and the second stage covering 2013 to 2020, as shown in Figure 10. Figure 10a,b show the spatial distribution of NDVI-HA in two stages, respectively. The NDVI-HA was classified into 4 restoration grades: I (degraded): −0.60~0, II (slightly improved): 0~0.20, III (moderately improved): 0.20~0.40, and IV (significantly improved): 0.40~0.65. Statistical analysis was performed on sample points with different restoration grades in two stages. The results are shown in Figure 11, most of the points in two stages were classified into the restoration grades of II, III and IV, and the sums of the proportion for two stages were 80.39% and 87.05%, respectively. The degraded areas in two stages were concentrated in the open-pit mine in the lower right corner, and the vicinity of transfer site and building area of the Shangwan Mine.
Among the points showing improvement trends, the points improved in the first stage were concentrated in the restoration grade II (slightly improved), accounting for 79.45%. In the second stage, the improved points were primarily concentrated in the restoration grades II (slightly improved) and III (moderately improved), accounting for a total of 84.24%, with 39.31% of the points in the grade III (moderately improved). From the first stage to the second stage, the area where NDVI-HA increased was concentrated on the left of the study area, i.e., near the mineral rights of Shangwan Mine.
As can be seen from Figure 10, there is spatial heterogeneity in the vegetation changes caused by human activities in the study area, with different NDVI-HA at different spatial locations. To investigate the underlying causes, the elevations within the study area were divided into seven levels at 40 m intervals, as shown in Figure 12. The average of predicted NDVI within each elevation level was counted to quantify the relationship between DEM and NDVI in natural conditions. As shown in Figure 12, it was found that there was a significant negative correlation between the predicted NDVI and DEM in two stages, and the vegetation growth was poorer in the higher elevation areas in natural conditions. Moreover, the average of NDVI-HA for multi-year and many points in each elevation level was further counted to establish the functional relationship between the NDVI-HA and DEM in two stages. The results are shown in Figure 13, the NDVI-HA of the two stages showed a significant positive correlation with the DEM, and the NDVI-HA increased with the increase of the DEM. Therefore, DEM may be the main reason for the spatial heterogeneity in vegetation restoration, with higher elevations being more impacted by human activities.

3.4. Comparison of the Impacts of Natural Factors and Human Activities on the Vegetation Restoration

Between 2000 and 2020, the growth of vegetation in the Shangwan Mine was influenced by a combination of natural factors and human activities. To compare the impacts of natural factors (temperature, precipitation) and human activities on vegetation restoration, the relative contribution is used to quantify the impact extent of temperature, precipitation, and human activities on vegetation restoration in this paper. The definition of relative contribution is shown in Equation (9).
C H A = N D V I H A N D V I o b s C t = N D V I t N D V I o b s C p = N D V I p N D V I o b s
where NDVI-HA, NDVIt, NDVIp denote the changes of NDVI caused by human activities, temperature, and precipitation, and CHA, Ct, and Cp denote the relative contribution of human activities, temperature, and precipitation, respectively.
Figure 14 shows the relative contributions of temperature, precipitation, and human activities to the vegetation growth in the mining area. It can be found that from 2000 to 2020, the contribution of human activities shows an overall upward trend. After 2010, its contribution exceeds that of temperature and precipitation as the dominant factor impacting the vegetation growth in the mining area, and reaches a maximum of 42.78% in 2019. However, negative contributions of human activities are observed in 2002 and 2003. This can be attributed to the initial stages of mining when intense mining activities and limited restoration measures resulted in overall vegetation degradation during those years. The contributions of temperature and precipitation display significant interannual fluctuations, with an average of 12.66% and 15.74%, respectively. In general, the contribution of precipitation was greater than that of temperature, and the contribution of temperature showed a subtle decreasing trend.

4. Discussion

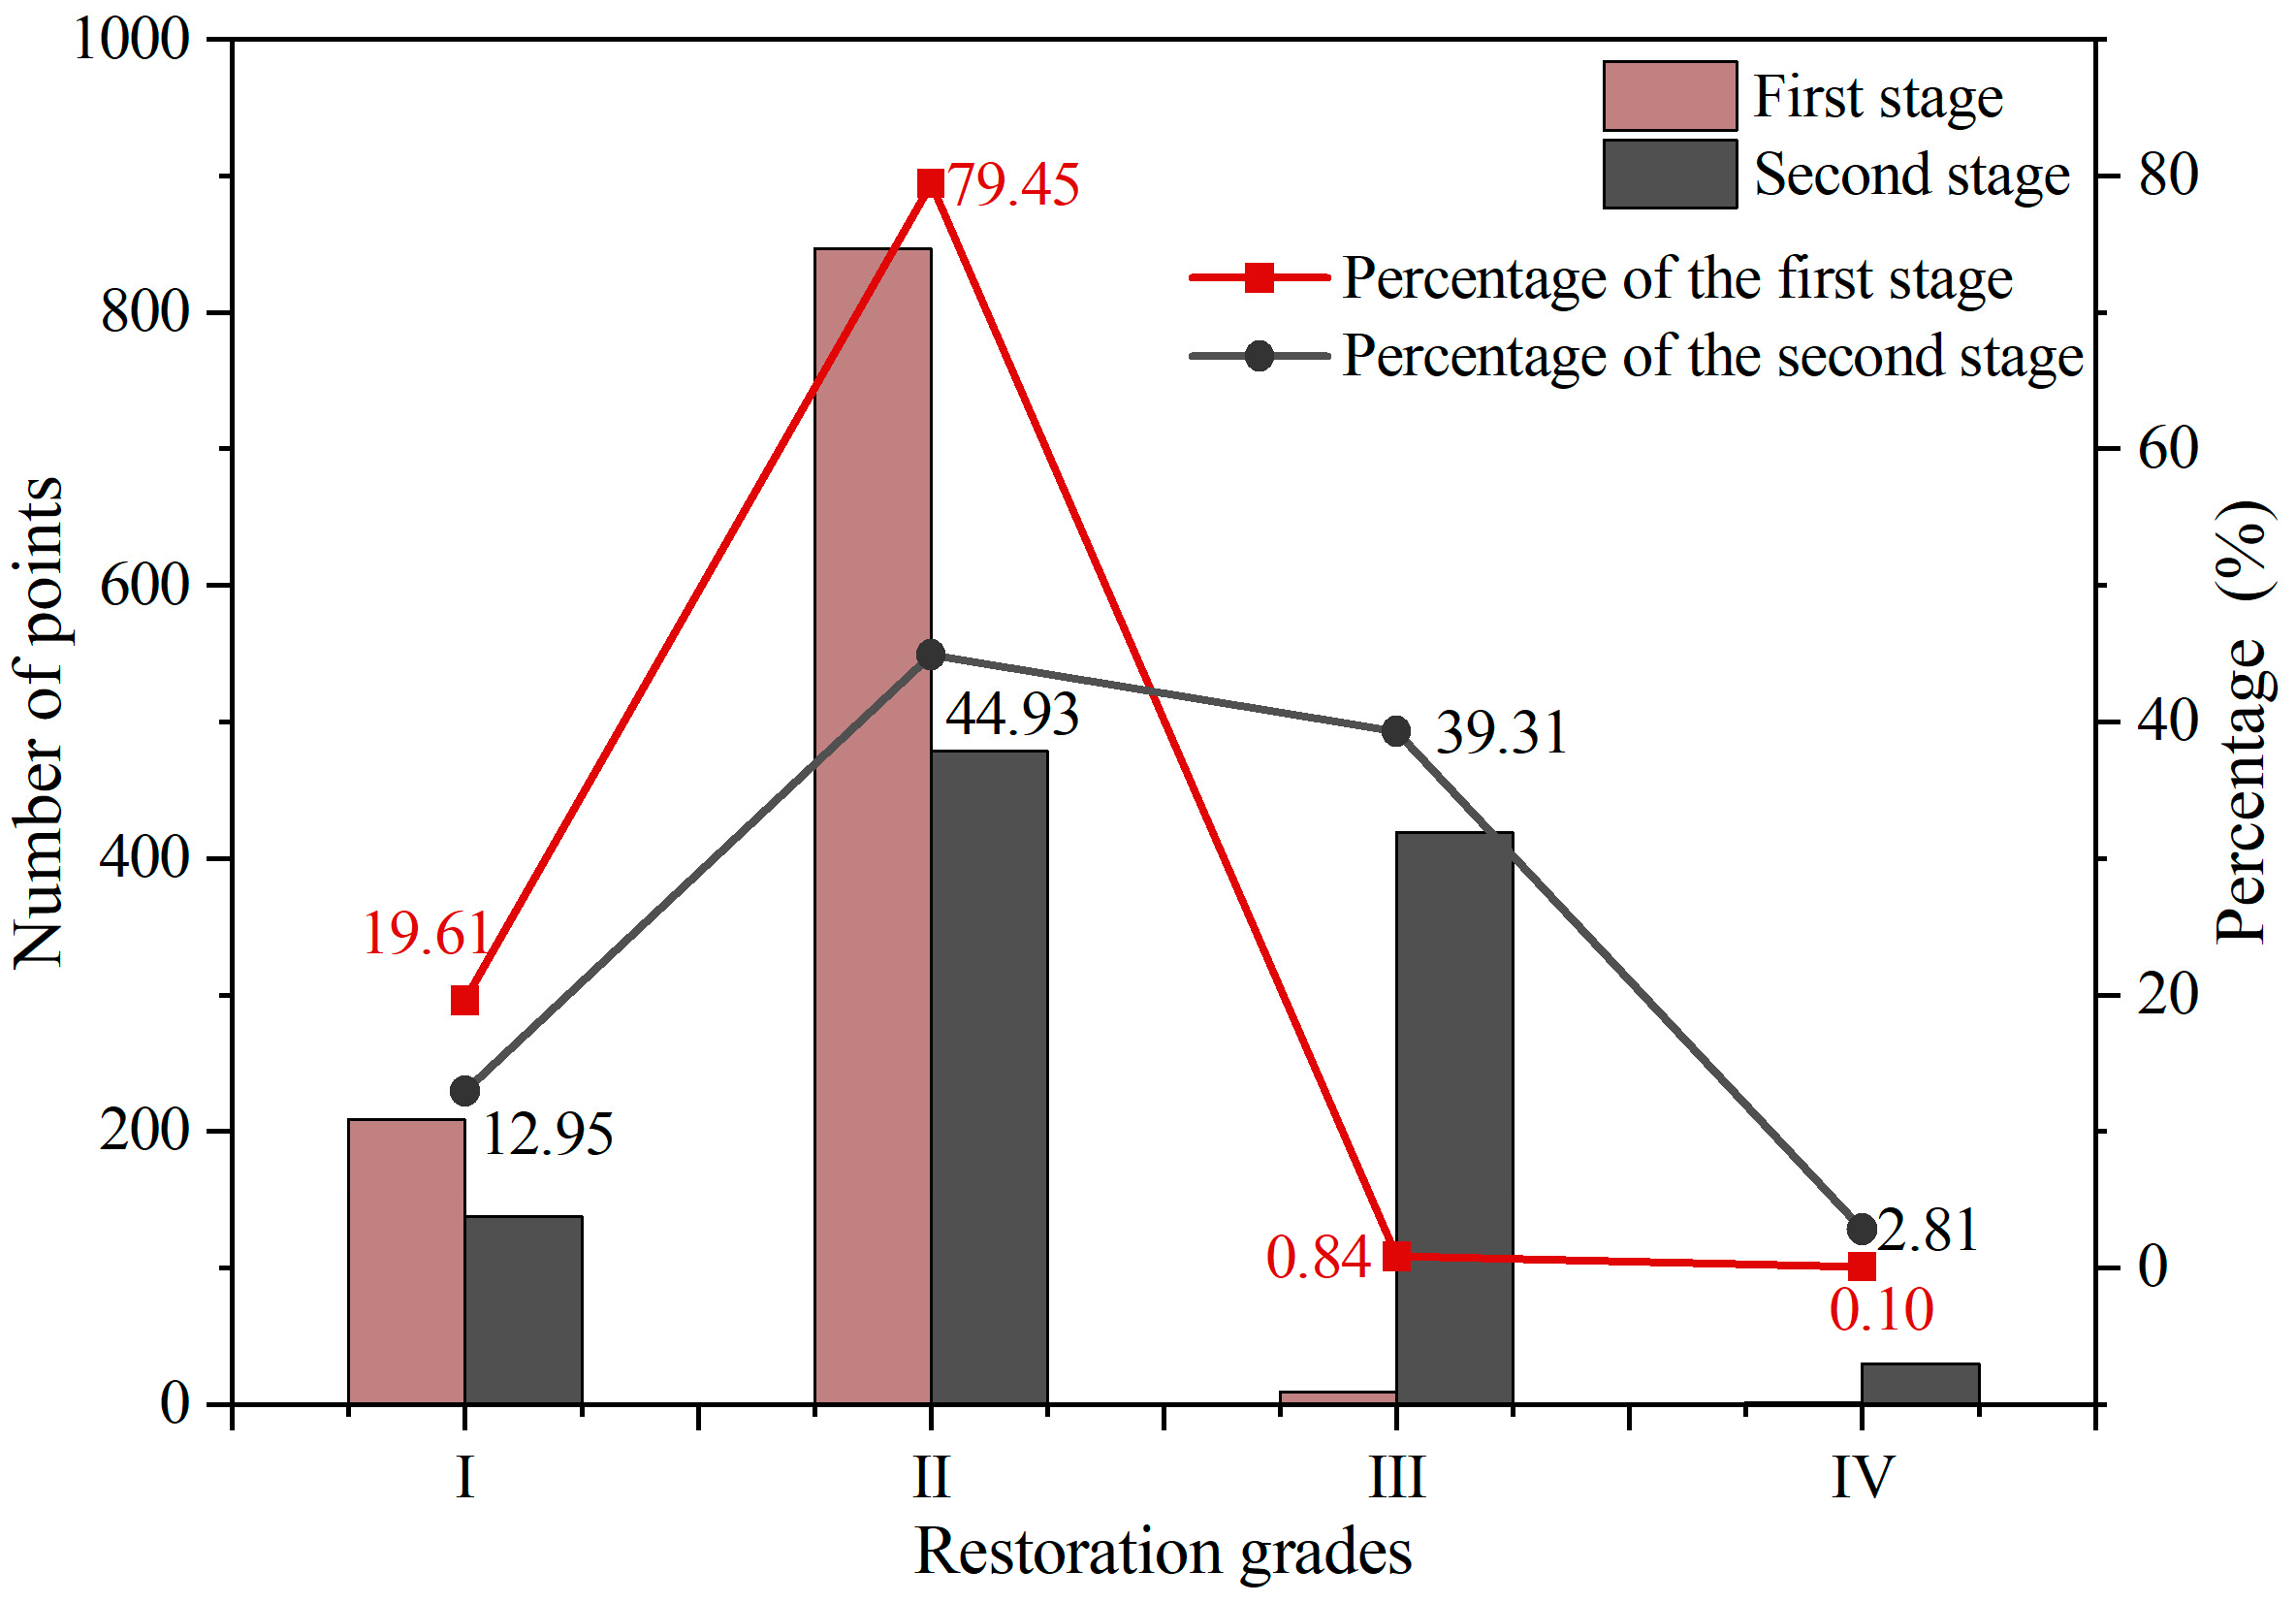
4.1. Associations between Restoration Measures and NDVI-HA

Shangwan Mine has consistently practiced the concept of “Green mining” of “Three Phases and Three Circles” in the mining process [37]. The “Three Phases” involve comprehensive pre-mining management to enhance the ecological environment’s resilience against mining disturbances, the implementation of innovative green mining technologies to minimize the ecological impact during mining, and the establishment of a sustainable and stable regional ecosystem after mining for the perpetual utilization of ecological resources. The “Three Circles” encompass extensive sand and dust control measures and the construction of a “green cover “around the mining area to form an “outer protective circle”, the establishment of ecological protection forests and the management of small watersheds in the surrounding areas to create a “peripheral evergreen circle” for the mining area, and the implementation of landscaping and reconstruction projects to develop a “central beautification circle” within the industrial and residential zones. Guided by the “Green mining” concept, Shangwan Mine has carried out the following restoration measures [19]:
  • Preventing surface subsidence and cracks: Regular observations are conducted on the cracks and sinkholes that emerge on the surface as a result of mining, and timely backfilling of surface subsidence and cracks is undertaken. The gangue produced by the coal preparation plant is transformed into filling material and used to fill the underground sinkholes, thereby reducing the ecological impact of gangue discharge and reducing the extent of surface subsidence in the sinkholes.
  • Reforestation and reclamation of the mining area: Approximately 50,000 trees and shrubs, along with green hedges, are planted in the industrial site. In reclamation areas susceptible to soil erosion and land desertification, locally suitable shrubs and grass species that thrive in the local environment are carefully chosen.
  • Establishing a green safeguard mechanism: To ensure the geological environmental protection and land reclamation of the Shangwan Mine, a long-term green safeguard mechanism has been implemented. The mine has developed various guidelines and protocols, including the “Safe Management Measures for Tree Pruning”, “Green Maintenance Techniques”, “Landscape Greening and Management Measures for Mining Service Companies”, “Inspection and Maintenance Procedures for Green Maintenance”, “Responsibility Scope for Green Maintenance”, “Greening and Management Measures for Shangwan Service Department”, and the “Annual Green Maintenance Management Plan”.
  • Ensuring the effect of greening: A specialized service contract for the greening and maintenance project within the central zone of Inner Mongolia has been established between the Shangwan Mine and an external contracting company. The company has been entrusted with the responsibilities of watering, greening, and fertilizing the vegetation within the factory area.
Significant achievements have been accomplished in the ecological environment management of the Shangwan Mine under the aforementioned ecological restoration measures. The mining area disturbance spans 20.87 km2, while the ecological management area covers 50 km2. In 2008, the establishment of an ecological economic forest in the subsidence area of the Shangwan Mine took place. By 2010, the subsidence area management rate reached 73%, and by 2013, it reached 100%. The vegetation coverage in the Shangwan Mine is 72%, surpassing the national average of 70%. The greening coverage in the industrial factory area achieves 100% of the potential greening area. The results of this study reveal that from 2000 to 2020, the NDVI-HA values were generally positive and exhibited an upward trend. This suggests that vegetation in the study area has been restoring due to human activities, with the degree of restoration increasing over time. Notably, the vegetation restoration effect has been particularly pronounced after 2013. Hence, since 2000, the vegetation growth in the Shangwan Mine has exhibited a strong response to the aforementioned restoration measures.

4.2. Relationship between Vegetation Restoration and Temperature & Precipitation

During the periods of 1987–1993 and 1994–1999, when no mining activities occurred, the trend changes in NDVI were influenced mainly by natural factors, particularly precipitation. The years 1987, 1993, and 1999 had relatively low NDVI, corresponding to less precipitation in July amounts of 32.25 mm, 84.08 mm, and 27.2 mm, respectively. In contrast, the NDVI was higher in 1994, with a precipitation amount of 201.15 mm. From 2000 to 2020, the vegetation in the mining area has exhibited a significant improvement trend under the combined influence of temperature, precipitation, and human activities. The findings of this study reveal considerable interannual variability in the contribution of temperature and precipitation to vegetation growth, which are positively correlated with the annual temperature and precipitation patterns. Specifically, the precipitation in July reached 147.61 mm and 199.39 mm in 2003 and 2016, respectively. Consequently, the contributions of precipitation in those two years were 39.67% and 36.24%, respectively. In 2005, 2010, and 2015, the precipitation in July amounted to 30.99 mm, 29.22 mm, and 36.06 mm, respectively, resulting in corresponding contributions of 0.5%, 0% (normalized precipitation for 2010 is 0), and 1.7%. Concerning temperature, the average temperatures in July and August were 21.55 °C and 22.55 °C in 2000 and 2010, respectively, with contributions of temperature reaching 21.20% and 21.58% in those years. In 2004 and 2014, the average temperatures in July and August were 19.50 °C and 20.00 °C, respectively, resulting in corresponding contributions of temperature at 3.91% and 4.77%.

4.3. Limitations and Future Work

Although this paper establishes quantitative modelling based on GTWR, there are still some limitations that cause the verification accuracy to be not very high (70%). GTWR is a type of local linear regression, and it relies on the assumption of a linear relationship between NDVI and temperature, precipitation, and DEM, which is assumed to remain constant over time. In fact, the vegetation of the mining area is impacted by multiple factors, and the impact pattern is complicated. Therefore, non-linear modelling would be considered in the future study to quantify the driving process of vegetation growth in mining areas. In addition, interactions between the factors are present, however, these influences are often overlooked in existing publications [38,39,40,41], it is important for future studies to consider isolating the impacts of each individual factor and explore the interactions between them.

5. Conclusions

This study utilized long-term remote sensing data, meteorological data, and topographic data to establish a quantitative relationship model between NDVI and temperature, precipitation, and DEM in the Shangwan Mine. The findings are as follows:
  • The GTWR model was applied to construct a quantitative relationship between vegetation growth and driving factors in the mining area for the first time. The impact of natural factors was separated by the residual analysis, so that the vegetation changes caused by human activities in the mining area could be assessed separately.
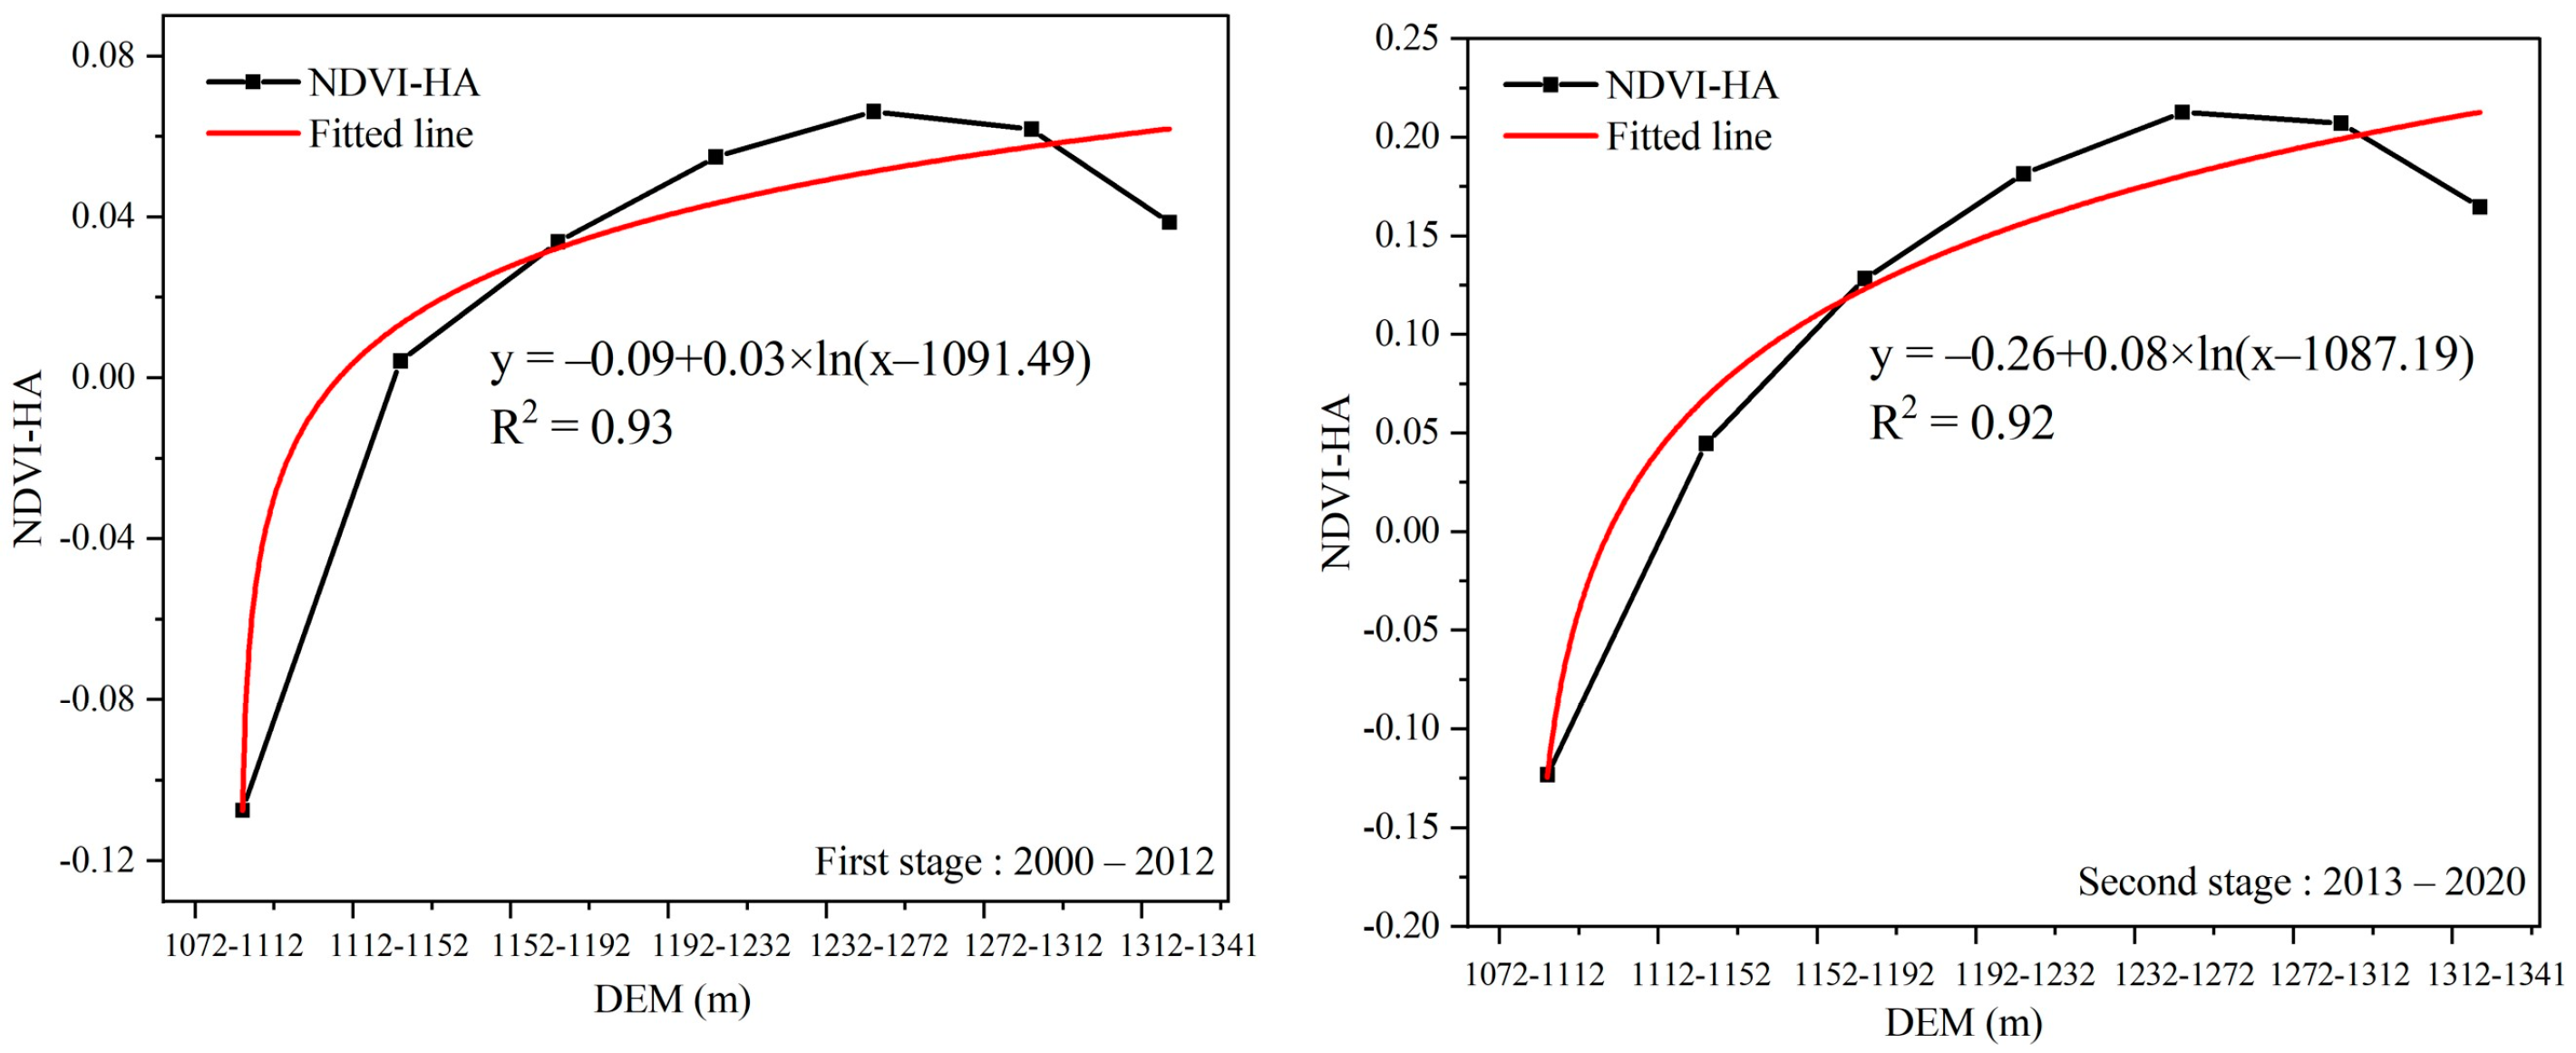
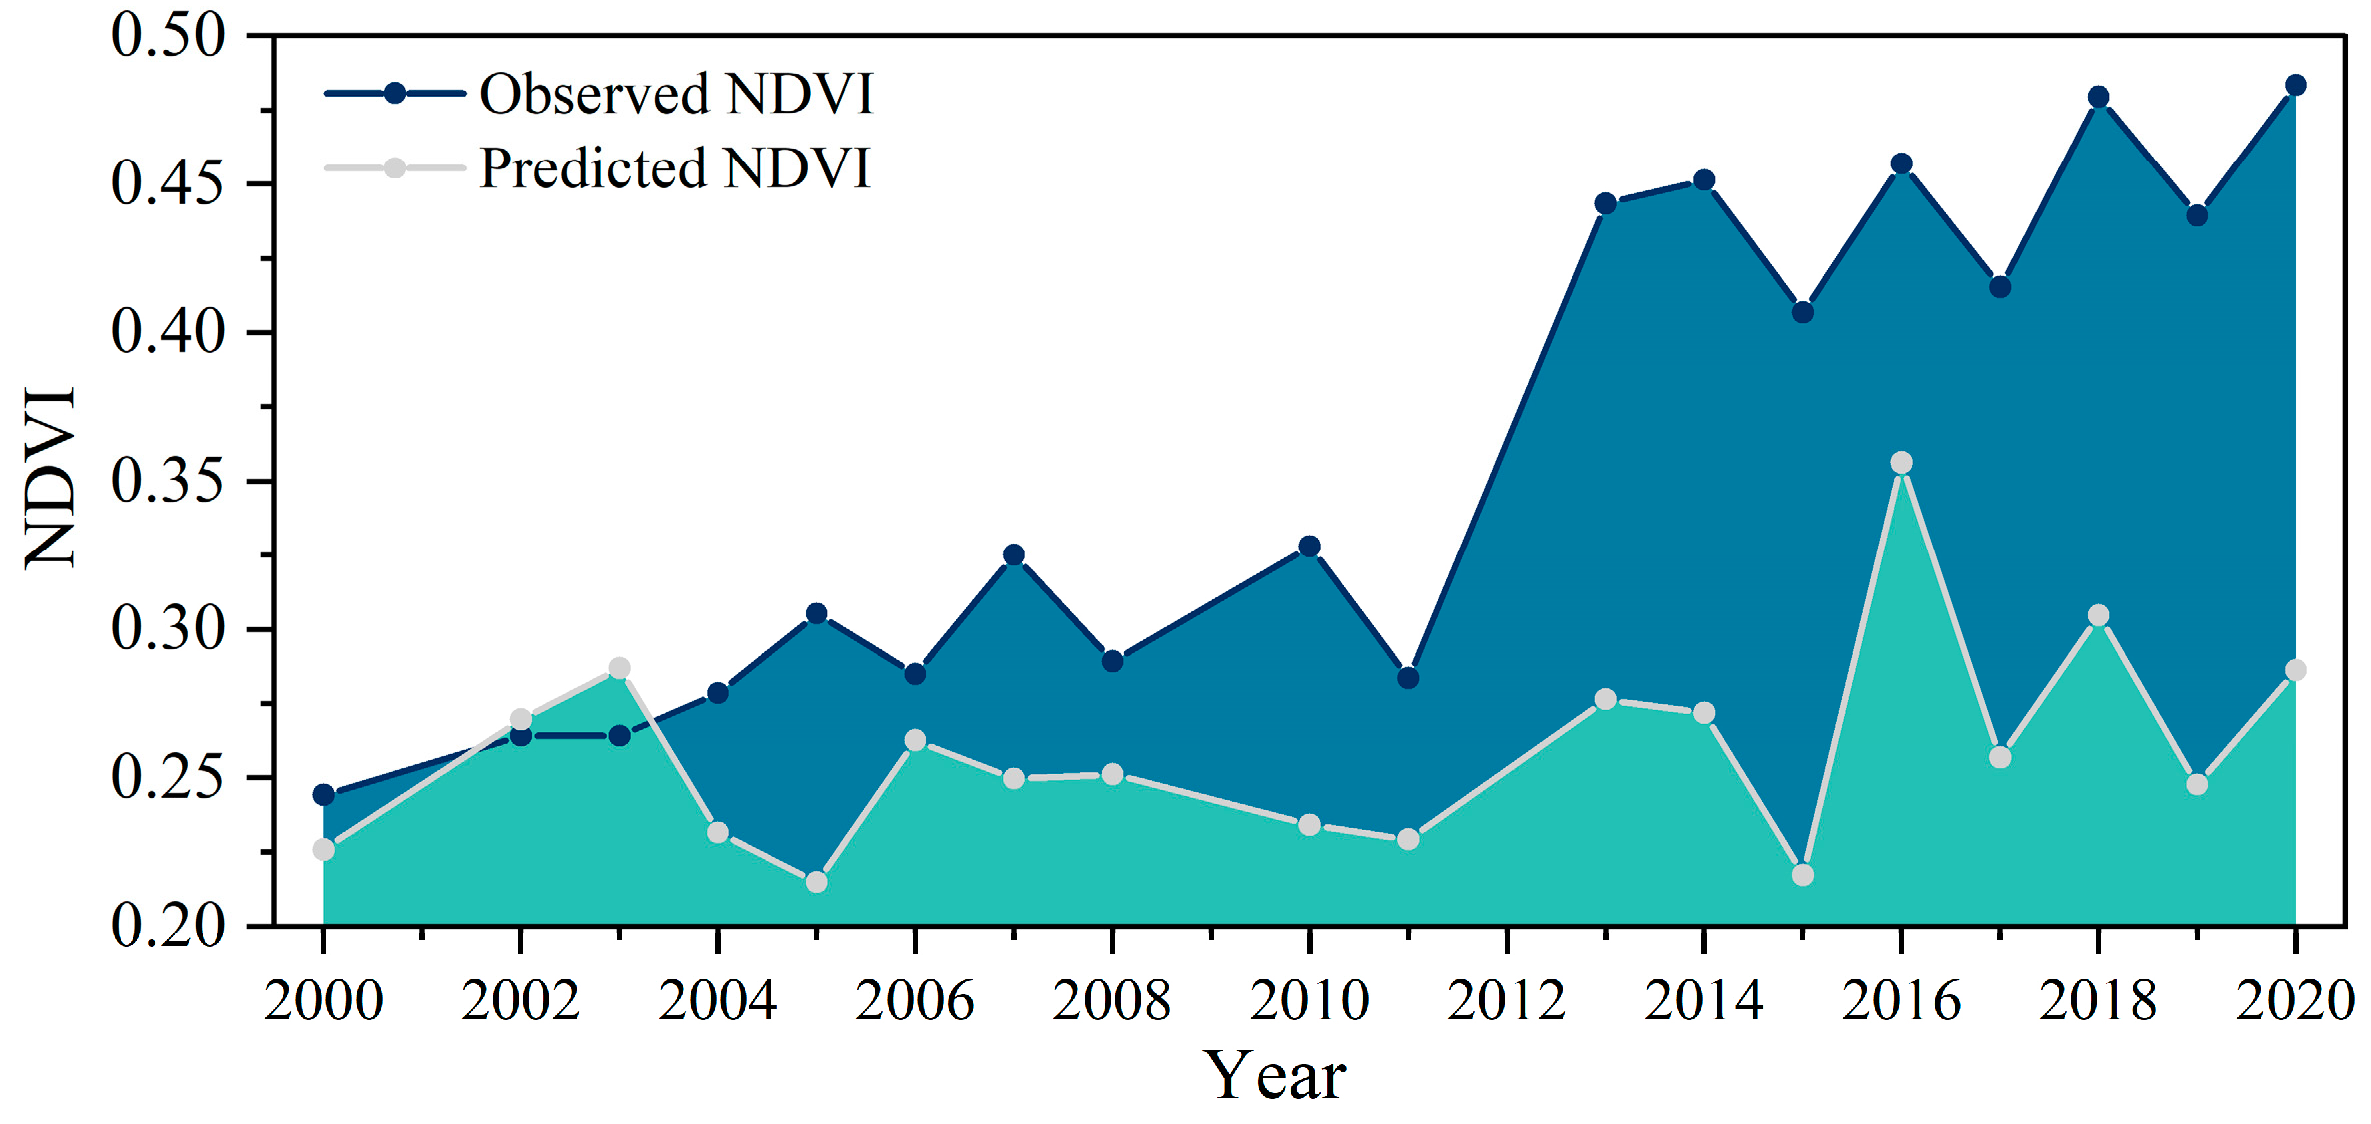
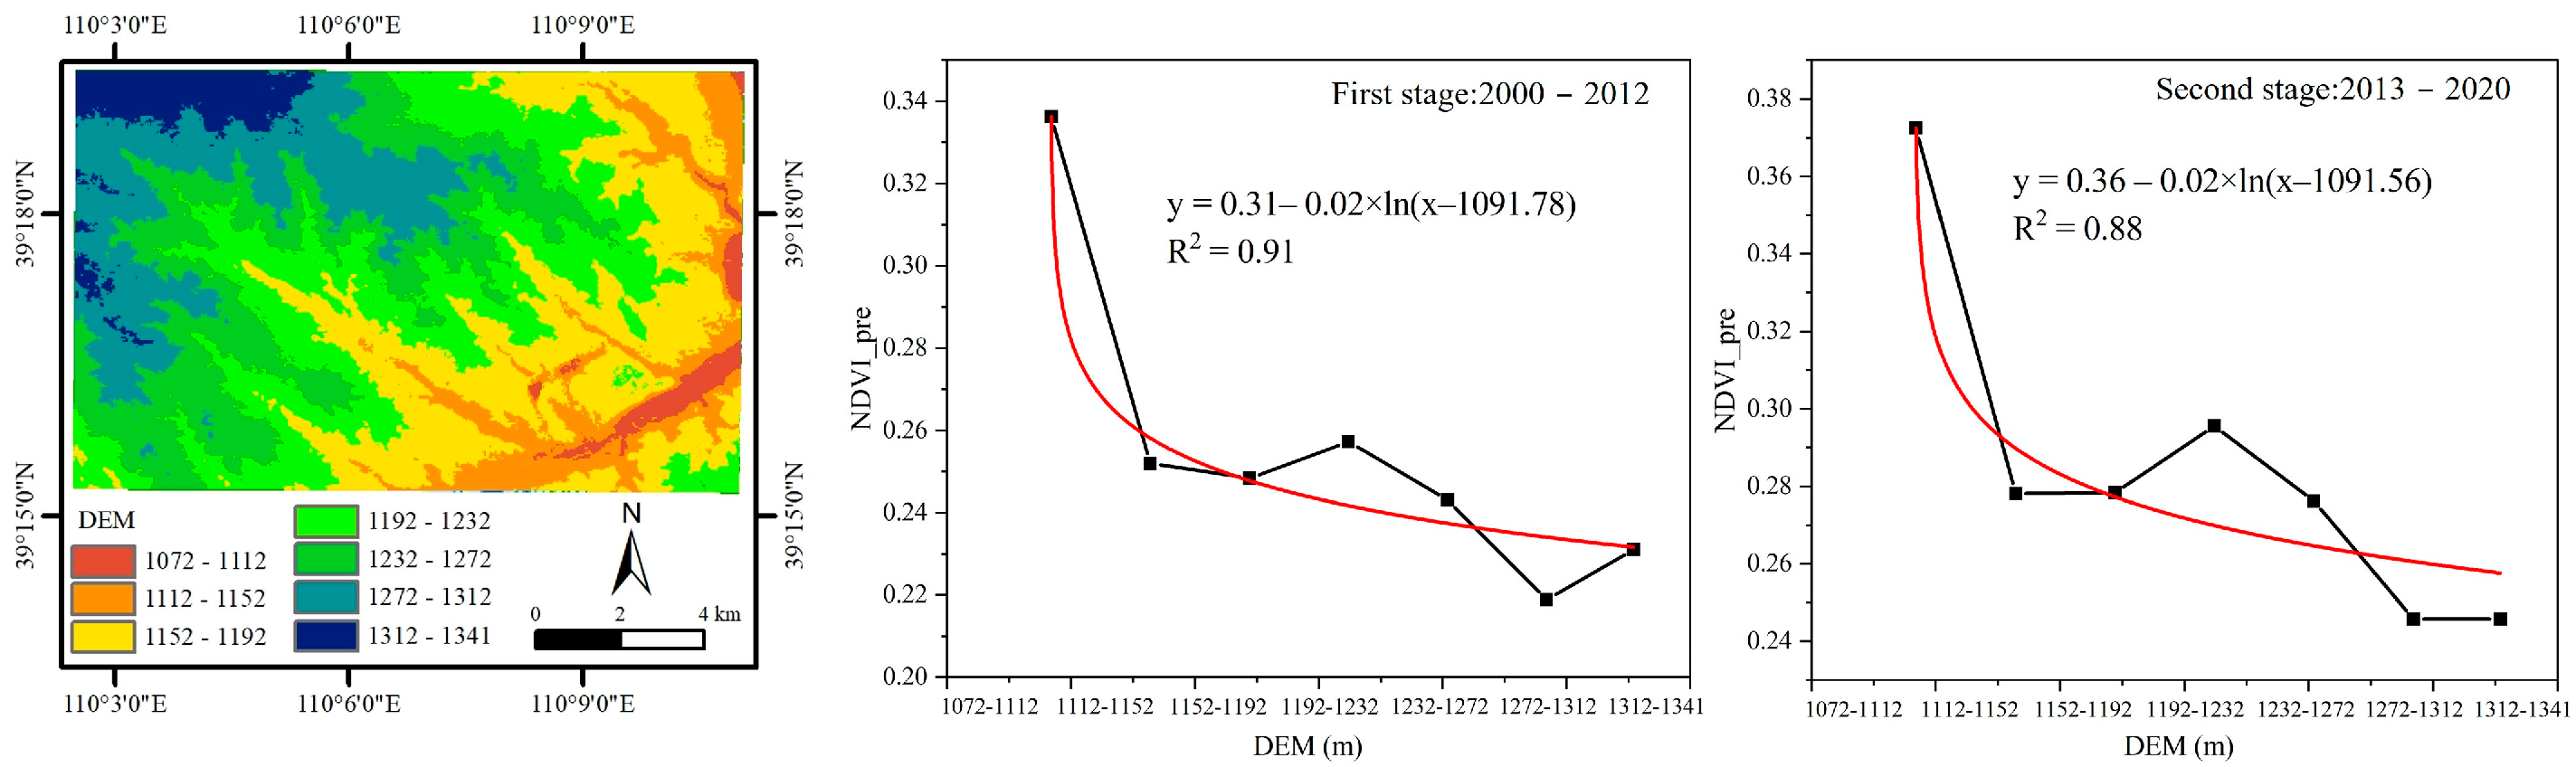
  • Over the past three decades, more than 90% of the area in the study area showed an improving trend, with 84.68% was extremely significant improvement. The NDVI-HA of the study area was generally positive under the environment with mining activities from 2000 to 2020 where human activities were intense, with an increasing trend over the time, particularly significant after 2013. Spatially, the areas degraded due to human activities were concentrated in the open-pit mining area in the lower right corner, and the vicinity of transfer site and building area of the Shangwan Mine, where the surface vegetation was removed due to the direct land occupation. Furthermore, the spatial heterogeneity of vegetation restoration was attributed to the DEM. It is negatively correlated with NDVI in natural conditions, while under the environment of mining activities, there is a positive correlation between NDVI-HA and DEM. The areas with higher elevation were more impacted by human activities.
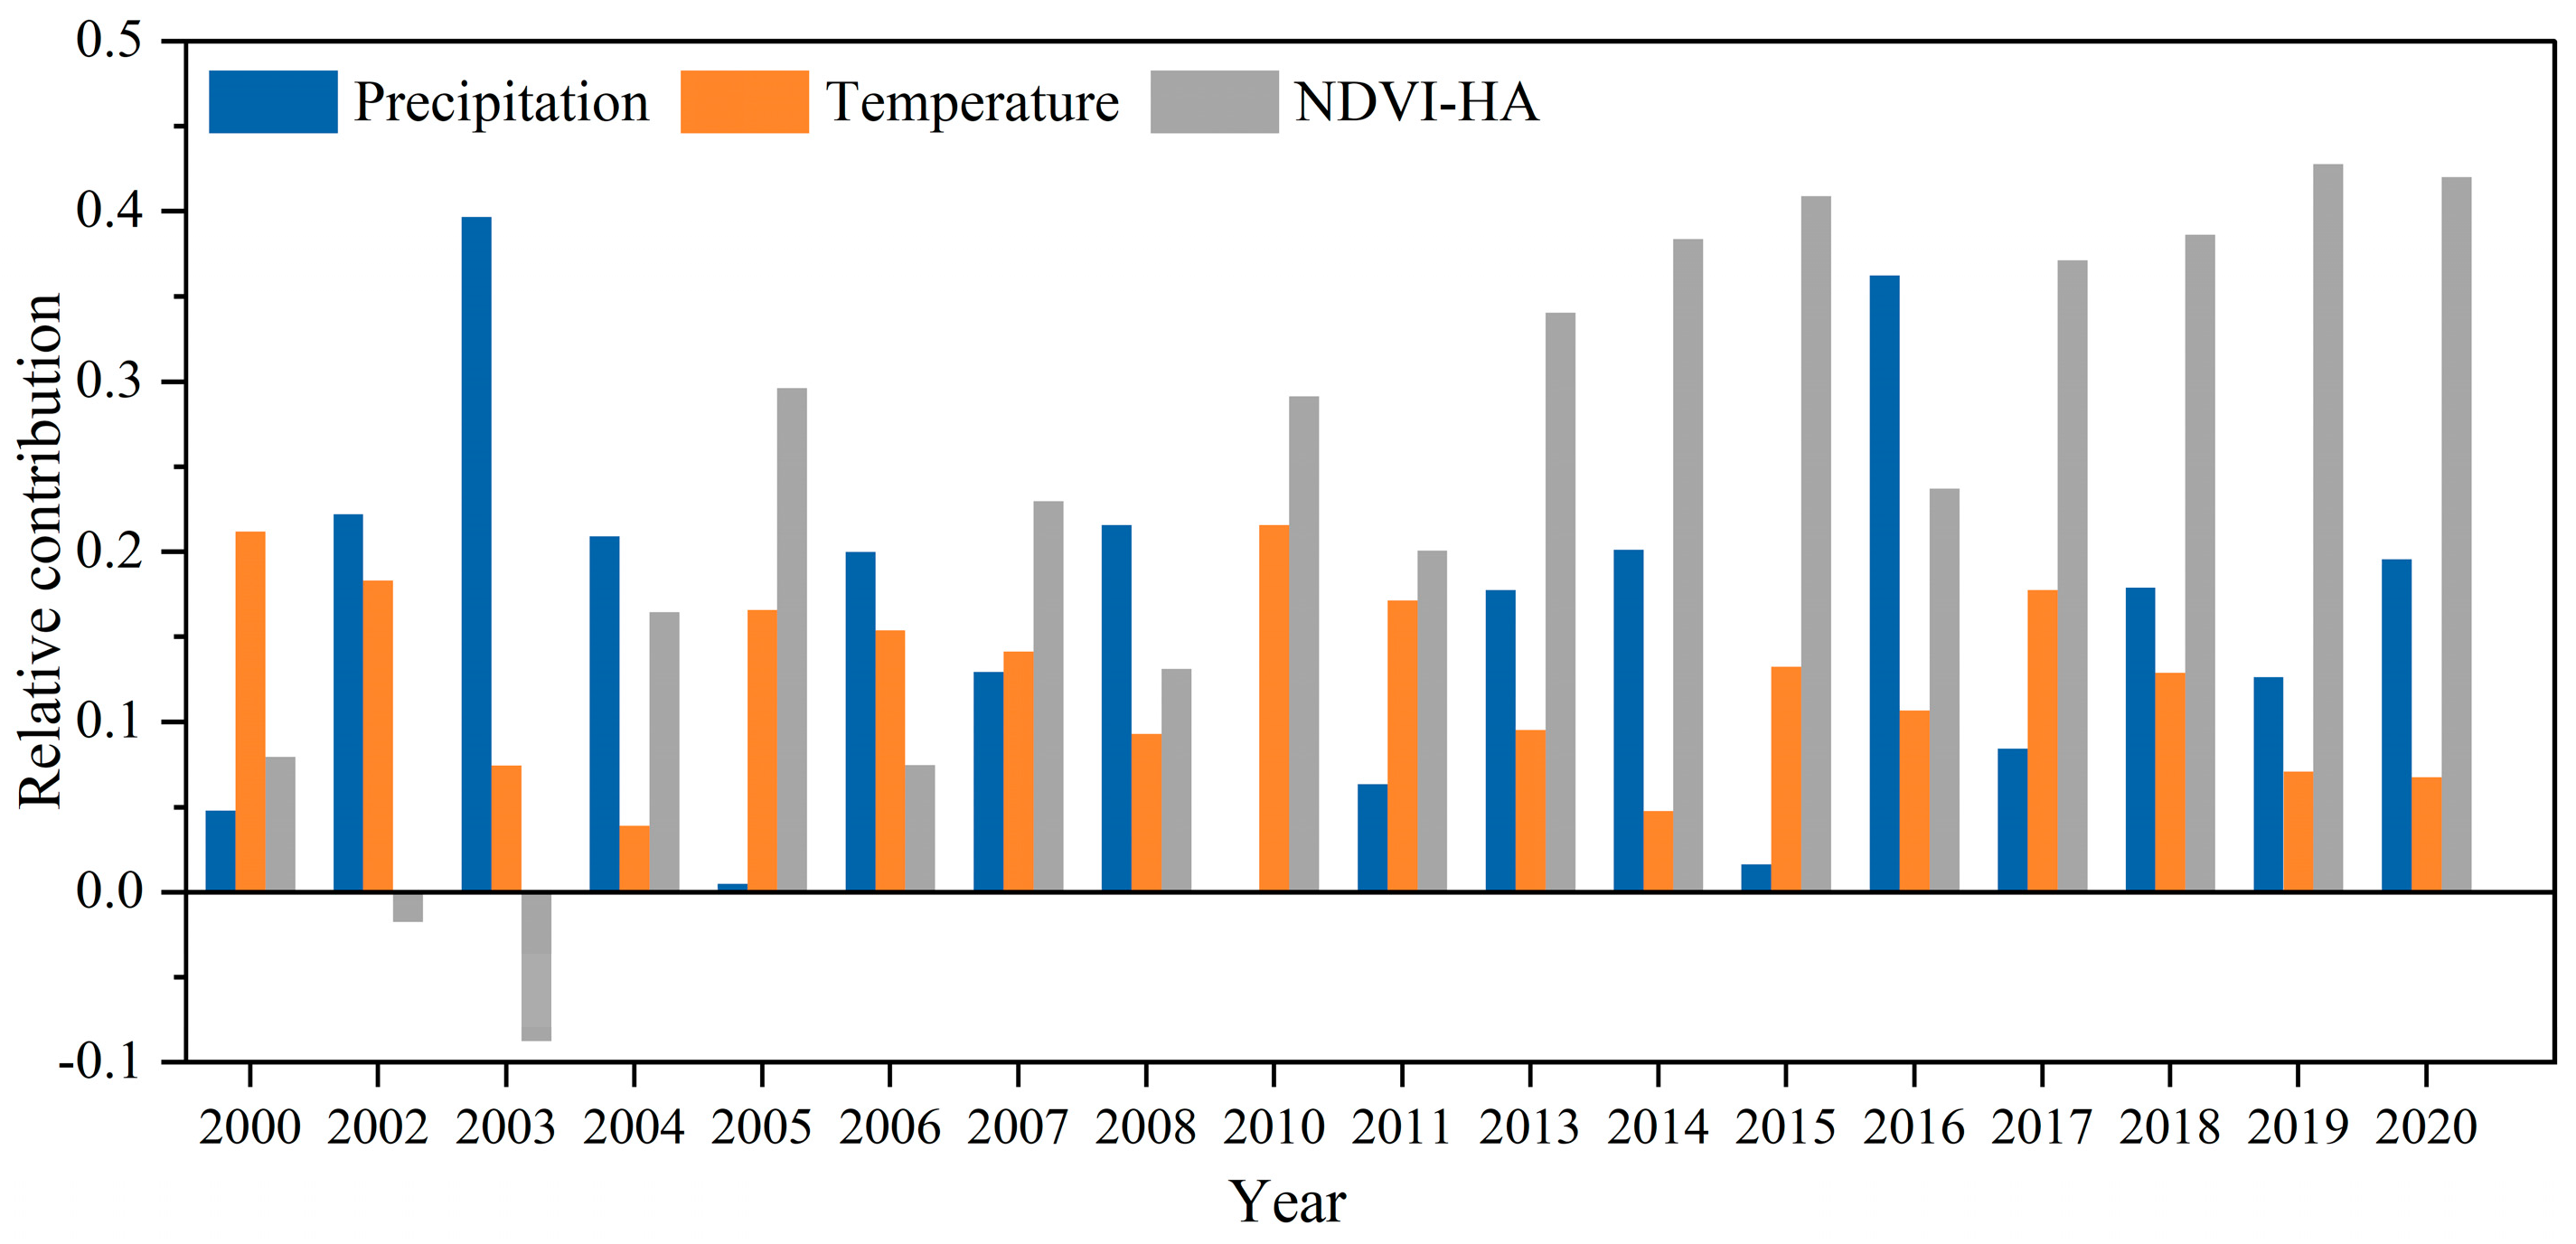
  • The study conducted a comparative analysis of the impacts of temperature, precipitation, and human activities on vegetation restoration. The findings reveal that the contribution of human activities to vegetation restoration in the mining area has been gradually increasing from 2000 to 2020. After 2010, the contribution of human activities exceeded that of temperature and precipitation, becoming the dominant factor influencing vegetation growth in the mining area. In comparison, precipitation exhibited a higher contribution to vegetation restoration than temperature.
This study provides new ideas for the evaluation of vegetation restoration in mining areas in some extent. The future work will be focused on the non-linear modelling between vegetation growth and driving factors.

Author Contributions

Jun Li: Conceptualization, writing—review & editing. Li Guo: Investigation, formal analysis, writing—original draft preparation. Chengye Zhang: Resources, writing—review & editing. Yaling Xu: Methodology. Jianghe Xing: Data curation. Jingyu Hu: Data curation. All authors have read and agreed to the published version of the manuscript.

Funding

This research was funded by the National Natural Science Foundation of China (42371347, 42271480), the National Key Research and Development Program of China (2022YFF1303301), and the Fundamental Research Funds for the Central Universities of China (2023ZKPYDC10).

Data Availability Statement

Data are contained within the article.

Conflicts of Interest

The authors declare no conflicts of interest.

References

  1. Li, S.J.; Zheng, X.; Sui, Y.Z. Research progress in evaluation of ecological restoration effects. Acta Ecol. Sin. 2021, 41, 4240–4249. [Google Scholar] [CrossRef]
  2. Xu, H.L.; Xu, F.J.; Lin, T.; Xu, Q.; Yu, P.J.; Wang, C.H.; Aili, A.; Zhao, X.F.; Zhao, W.Y.; Zhang, P.; et al. A systematic review and comprehensive analysis on ecological restoration of mining areas in the arid region of China: Challenge, capability, and reconsideration. Ecol. Indic. 2023, 154, 110630. [Google Scholar] [CrossRef]
  3. Xu, D.L.; Li, X.F.; Chen, J.; Li, J.H. Research Progress of Soil and Vegetation Restoration Technology in Open-Pit Coal Mine: A Review. Agriculture 2023, 13, 226. [Google Scholar] [CrossRef]
  4. Chen, L.F.; Zhang, H.; Zhang, X.Y.; Liu, P.H.; Zhang, W.C.; Ma, X.Y. Vegetation changes in coal mining areas: Naturally or anthropogenically Driven? Catena 2022, 208, 105712. [Google Scholar] [CrossRef]
  5. Zhang, X.Y.; Liu, Y.; Chen, X.Y.; Long, L.L.; Su, Y.D.; Yu, X.K.; An, S.K. Analysis of spatial and temporal changes of vegetation cover and its driving forces in the Huainan mining area. Environ. Sci. Pollut. Res. Int. 2022, 29, 60117–60132. [Google Scholar] [CrossRef]
  6. Hui, J.W.; Chen, Z.X.; Ye, B.Y.; Shi, C.; Bai, Z.K. Remote Sensing Monitoring of the Spatial Pattern of Greening and Browning in Xilin Gol Grassland and Its Response to Climate and Human Activities. Remote Sens. 2022, 14, 1765. [Google Scholar] [CrossRef]
  7. Shivesh, K.K.; Sukha, R.S.; Subodh, K.M. Assessment of the capability of remote sensing and GIS techniques for monitoring reclamation success in coal mine degraded lands. J. Environ. Manag. 2016, 182, 272–283. [Google Scholar] [CrossRef]
  8. Hui, J.W.; Bai, Z.K.; Ye, B.Y.; Wang, Z.H. Remote Sensing Monitoring and Evaluation of Vegetation Restoration in Grassland Mining Areas—A Case Study of the Shengli Mining Area in Xilinhot City, China. Land 2021, 10, 743. [Google Scholar] [CrossRef]
  9. Yu, H.X.; Zahidi, I.; Chow, M.F. Vegetation as an ecological indicator in assessing environmental restoration in mining areas. Iscience 2023, 26. [Google Scholar] [CrossRef]
  10. Bao, N.S.; Lechner, A.M.; Johansen, K.; Ye, B.Y. Object-based classification of semi-arid vegetation to support mine rehabilitation and monitoring. J. Appl. Remote Sens. 2014, 8, 083564. [Google Scholar] [CrossRef]
  11. Wang, W.; Liu, R.Y.; Gan, F.P.; Zhou, P.; Zhang, X.W.; Ding, L. Monitoring and Evaluating Restoration Vegetation Status in Mine Region Using Remote Sensing Data: Case Study in Inner Mongolia, China. Remote Sens. 2021, 13, 1350. [Google Scholar] [CrossRef]
  12. Liu, Y.; Lei, S.G.; Chen, X.Y.; Chen, M.; Yang, Y.M.; Li, X.H.; Zhang, X.Y.; Long, L.L.; Dian, Z.F. Temporal variation and driving factors of vegetation coverage in Shendong central mining area based on the perspective of guided restoration. J. China Coal Soc. 2021, 46, 3319–3331. [Google Scholar] [CrossRef]
  13. Bi, Y.L.; Liu, T. Time series analysis of multi-source data of coordinated evolution of vegetation in open-pit mining area: Taking Jungar Mining Area as an example. Coal Sci. Technol. 2022, 50, 293–302. [Google Scholar]
  14. Bao, N.S.; Lechner, A.; Fletcher, A.; Erskine, P.; Mulligan, D.; Bai, Z.K. SPOTing long-term changes in vegetation over short-term variability. Int. J. Min. Reclam. Environ. 2014, 28, 2–24. [Google Scholar] [CrossRef]
  15. Zhang, K.; Lü, Y.H.; Fu, B.J.; Li, T. The effects of restoration on vegetation trends: Spatiotemporal variability and influencing factors. Earth Environ. Sci. Trans. R. Soc. Edinb. 2019, 109, 473–481. [Google Scholar] [CrossRef]
  16. Ren, H.; Zhao, Y.L.; Xiao, W.; Li, J.Q.; Yang, X. Influence of management on vegetation restoration in coal waste dump after reclamation in semi-arid mining areas: Examining ShengLi coalfield in Inner Mongolia, China. Environ. Sci. Pollut. Res. Int. 2021, 28, 68460–68474. [Google Scholar] [CrossRef]
  17. Li, S.J.; Wang, J.M.; Zhang, M.; Tang, Q. Characterizing and attributing the vegetation coverage changes in North Shanxi coal base of China from 1987 to 2020. Resour. Policy 2021, 74, 102331. [Google Scholar] [CrossRef]
  18. Qi, D.N.; Hu, Z.J.; Zhao, S.M. Long-term NDVI spatio-temporal variation trend and its response to climate in Xishan coalfield, Shanxi province. Bull. Surv. Mapp. 2021, 9, 98–102, 107. [Google Scholar] [CrossRef]
  19. Dong, J.W.; Tao, F.L.; Zhang, G.L. Trends and variation in vegetation greenness related to geographic controls in middle and eastern Inner Mongolia, China. Environ. Earth Sci. 2011, 62, 245–256. [Google Scholar] [CrossRef]
  20. Fu, X.; Ma, M.F.; Jiang, P.; Quan, Y. Spatiotemporal vegetation dynamics and their influence factors at a large coal-fired power plant in Xilinhot, Inner Mongolia. Int. J. Sustain. Dev. World Ecol. 2016, 24, 433–438. [Google Scholar] [CrossRef]
  21. Du, H.D.; Ning, B.Y.; Bai, M.T.; Fan, P.H. Dynamic Change of Vegetation Coverage and its Driving Forces in Different Landforms on Yushenfu Mining Area from 1990 to 2019. For. Resour. Manag. 2021, 5, 121–130. [Google Scholar] [CrossRef]
  22. Zhang, C.Y.; Li, F.Y.; Li, J.; Zhang, K.; Ran, W.Y.; Du, M.H.; Guo, J.T.; Hou, G.F. Assessing the effect, attribution, and potential of vegetation restoration in open-pit coal mines’ dumping sites during 2003–2020 utilizing remote sensing. Ecol. Indic. 2023, 155, 111003. [Google Scholar] [CrossRef]
  23. Huang, B.; Wu, B.; Barry, M. Geographically and temporally weighted regression for modeling spatio-temporal variation in house prices. Int. J. Geogr. Inf. Sci. 2010, 24, 383–401. [Google Scholar] [CrossRef]
  24. Fotheringham, A.S.; Crespo, R.; Yao, J. Geographical and Temporal Weighted Regression (GTWR). Geogr. Anal. 2015, 47, 431–452. [Google Scholar] [CrossRef]
  25. Yang, W.; Yao, Q.Y.; Wu, B.Y.; Xie, X.H.; Yu, L.Q.; Li, Y.H.; Wang, L.J. Strength Damage and Acoustic Emission Characteristics of Water-Bearing Coal Pillar Dam Samples from Shangwan Mine, China. Energies 2023, 16, 1692. [Google Scholar] [CrossRef]
  26. Lv, S.; Wang, X.G.; Chen, Y.P. Talking about green mine construction in Shangwan Coal Mine. China Coal 2023, 49, 41–45. [Google Scholar] [CrossRef]
  27. Tian, F.; Fensholt, R.; Verbesselt, J.; Grogan, K.; Horion, S.; Wang, Y.J. Evaluating temporal consistency of long-term global NDVI datasets for trend analysis. Remote Sens. Environ. 2015, 163, 326–340. [Google Scholar] [CrossRef]
  28. May, J.L.; Parker, T.; Unger, S.; Oberbauer, S.F. Short term changes in moisture content drive strong changes in Normalized Difference Vegetation Index and gross primary productivity in four Arctic moss communities. Remote Sens. Environ. 2018, 212, 114–120. [Google Scholar] [CrossRef]
  29. van Aert, R.C.M.; Goos, C. A critical reflection on computing the sampling variance of the partial correlation coefficient. Res. Synth. Methods 2023, 14, 520–525. [Google Scholar] [CrossRef]
  30. Li, J.; Peng, S.P.; Zhang, C.Y.; Yang, F.; Sang, X. Quantitative remote sensing-based monitoring and evaluation of the ecological environment in mining areas: Technology framework and application. J. Min. Sci. Technol. 2022, 7, 9–25. [Google Scholar] [CrossRef]
  31. Li, J.; Xu, Y.L.; Zhang, C.Y.; Guo, J.T.; Wang, X.J.; Zhang, Y.C. Unmixing the coupling influence from driving factors on vegetation changes considering spatio-temporal heterogeneity in mining areas: A case study in Xilinhot, Inner Mongolia, China. Environ. Monit. Assess. 2022, 195, 224. [Google Scholar] [CrossRef]
  32. Li, Q.S.; Xu, Y.L.; Li, J.; Zhang, C.Y.; Guo, J.T.; She, C.Z.; Song, Z.H.; Wang, F. Extraction of the impact of mining on vegetation changes and quantitative analysis of ecological cumulative effects based on long time series multi-source data. J. China Coal Soc. 2022, 6, 2420–2434. [Google Scholar] [CrossRef]
  33. Stow, D.; Daeschner, S.; Hope, A.; Douglas, D.; Petersen, A.; Myneni, R.; Oechel, W. Variability of the Seasonally Integrated Normalized Difference Vegetation I-ndex Across the North Slope of Alaska in the 1990s. Int. J. Remote Sens. 2003, 24, 1111–1117. [Google Scholar] [CrossRef]
  34. Wang, M.Y.; Fu, J.E.; Wu, Z.T.; Pang, Z.G. Spatiotemporal variation of NDVI in the vegetation growing season in the source region of the Yellow River, China. ISPRS Int. J. Geo-Inf. 2020, 9, 282. [Google Scholar] [CrossRef]
  35. Li, Y.; Zheng, Z.C.; Qin, Y.C.; Rong, P.J. Relative contributions of natural and man-made factors to vegetation cover change of environmentally sensitive and vulnerable areas of China. J. Clean. Prod. 2021, 321, 128917. [Google Scholar] [CrossRef]
  36. Sun, Q.Y.; Liu, W.W.; Gao, Y.N.; Li, J.S.; Yang, C.Y. Spatiotemporal variation and climate influence factors of vegetation ecological quality in the sanjiangyuan national park. Sustainability 2020, 12, 6634. [Google Scholar] [CrossRef]
  37. Guo, Y.L.; Yang, J.Z.; He, A.M.; Li, N.K. Discussion on the construction of green mine pilot unit in Shangwan coal mine. Shaanxi Coal 2013, 6, 18–20. [Google Scholar]
  38. Zhang, M.; Lin, H.; Long, X.G.; Cai, Y.T. Analyzing the spatiotemporal pattern and driving factors of wetland vegetation changes using 2000–2019 time-series Landsat data. Sci. Total Environ. 2021, 780, 146615. [Google Scholar] [CrossRef]
  39. Mu, B.H.; Zhao, X.; Wu, D.H.; Wang, X.Y.; Zhao, J.C.; Wang, H.Y.; Zhou, Q.; Du, X.Z.; Liu, N. Vegetation cover change and its attribution in China from 2001 to 2018. Remote Sens. 2021, 13, 496. [Google Scholar] [CrossRef]
  40. Wu, H.F.; Zhang, J.Y.; Bao, Z.X.; Wang, G.Q.; Wang, W.S.; Yang, Y.Q.; Wang, J.; Kan, G. The impacts of natural and anthropogenic factors on vegetation change in the Yellow-Huai-Hai River Basin. Front. Earth Sci. 2022, 10, 959403. [Google Scholar] [CrossRef]
  41. Feng, X.J.; Tian, J.; Wang, Y.X.; Wu, J.J.; Liu, J.; Ya, Q.; Li, Z.S. Spatio-Temporal Variation and Climatic Driving Factors of Vegetation Coverage in the Yellow River Basin from 2001 to 2020 Based on kNDVI. Forests 2023, 14, 620. [Google Scholar] [CrossRef]
Figure 1. Geographic location of the study area and the distribution of sample points.
Ijgi 13 00132 g001
Figure 2. Extraction process of vegetation changes caused by human activities.
Ijgi 13 00132 g002
Figure 3. Scattered distribution of observed NDVI and predicted NDVI for 1996 and 1997.
Ijgi 13 00132 g003
Figure 4. Interannual trends of observed NDVI and predicted NDVI.
Ijgi 13 00132 g004
Figure 5. Interannual trend of mean and standard deviation of NDVI from 1986–2020.
Ijgi 13 00132 g005
Figure 6. Trend changes of NDVI for 1986–2020, (a) is the spatial distribution of Slope, (b) is the classes of vegetation change trends.
Ijgi 13 00132 g006
Figure 7. The results of GTWR modelling for the years 1990, 1991, and 1995, (a,b) represent the spatial distribution of the coefficients for temperature (β2) and precipitation(β1) in the driving model, respectively, (c) are the driving equations of the predicted NDVI for some sample points.
Ijgi 13 00132 g007
Figure 8. Extraction results of NDVI-HA for 2010, (ac) represent the observed NDVI, predicted NDVI, and the NDVI-HA.
Ijgi 13 00132 g008
Figure 9. Box plot of NDVI-HA for 2000−2020.
Ijgi 13 00132 g009
Figure 10. Spatial distribution of NDVI-HA in two stages.
Ijgi 13 00132 g010
Figure 11. Distribution of sample points for different restoration grades in two stages.
Ijgi 13 00132 g011
Figure 12. Negative correlation between DEM and predicted NDVI.
Ijgi 13 00132 g012
Figure 13. Positive correlation between DEM and NDVI-HA.
Ijgi 13 00132 g013
Figure 14. Relative contributions of temperature, precipitation, and human activities to vegetation growth for 2000−2020.
Ijgi 13 00132 g014
Table 1. Datasets of the study.
TypesNamesSourcesDescription
Remotely sensed imagesLandsat 5/7/8Google Earth Engine
(https://earthengine.google.com/)
Images of 1 July to 30 September from 1986 to 2020; the spatial resolution is 30 m.
Topographic dataASTER GDEM V2Geospatial Data Cloud
(http://www.gscloud.cn/)
The horizontal resolution is 30 m and the vertical resolution is 20 m.
Climatic and meteorological dataTemperature & PrecipitationChina Meteorological Data Service Centre (http://data.cma.cn/)Monthly dataset of surface climatic information from 1986–2020.
Table 2. Statistics of pixels and percentage of area for 6 trend types.
Slopep-ValueTrend TypesNumber of PixelsPercentage
Slope < 0p < 0.01Extremely significant degradation32142.35%
Slope < 00.01 < p < 0.05Significant degradation16521.21%
Slope < 0p > 0.05No evident degradation67274.91%
Slope > 0p > 0.05No evident improvement70045.11%
Slope > 00.01 < p < 0.05Significant improvement23821.74%
Slope > 0p < 0.01Extremely significant improvement116,00284.68%
Table 3. Correlation of NDVI with temperature and precipitation.
NDVI & PrecipitationNDVI & Temperature
MonthsCorrelationMonthsCorrelation
70.879 **70.424
80.52280.433
90.7979−0.235
1–7 0.2661–7 0.257
1–8 0.3221–8 0.242
1–9 0.3411–9 0.177
7–8 0.832 *7–8 0.702
8–9 0.4308–9 0.204
7–9 0.768 *7–9 0.294
“**” and “*” are significant correlations at the 0.01 level and the 0.05 level, respectively. Cumulative precipitation and the average temperature are used in cumulative months.
Disclaimer/Publisher’s Note: The statements, opinions and data contained in all publications are solely those of the individual author(s) and contributor(s) and not of MDPI and/or the editor(s). MDPI and/or the editor(s) disclaim responsibility for any injury to people or property resulting from any ideas, methods, instructions or products referred to in the content.

