Article

Unveiling the Non-Linear Influence of Eye-Level Streetscape Factors on Walking Preference: Evidence from Tokyo

1
School of Environment and Society, Tokyo Institute of Technology, Tokyo 152-8550, Japan
2
Center for Real Estate Innovation (CREI), University of Tokyo, Tokyo 113-0033, Japan
3
Center for Spatial Information Science (CSIS), University of Tokyo, Tokyo 153-8505, Japan
*
Author to whom correspondence should be addressed.
ISPRS Int. J. Geo-Inf. 2024, 13(4), 131; https://doi.org/10.3390/ijgi13040131
Submission received: 21 February 2024 / Revised: 10 April 2024 / Accepted: 11 April 2024 / Published: 15 April 2024

Abstract

:
Promoting walking is crucial for sustainable development and fosters individual health and well-being. Therefore, comprehensive investigations of factors that make walking attractive are vital. Previous research has linked streetscapes at eye-level to walking preferences, which usually focuses on simple linear relationships, neglecting the complex non-linear dynamics. Additionally, the varied effects of streetscape factors across street segments and intersections and different street structures remain largely unexplored. To address these gaps, this study explores how eye-level streetscapes influence walking preferences in various street segments and intersections in Setagaya Ward, Tokyo. Using street view data, an image survey, and computer vision algorithms, we measured eye-level streetscape factors and walking preferences. The Extreme Gradient Boosting (XGBoost) model was then applied to analyze their non-linear relationships. This study identified key streetscape factors influencing walking preferences and uncovered non-linear trends within various factors, showcasing a variety of patterns, including upward, downward, and threshold effects. Moreover, our findings highlight the heterogeneity of the structural characteristics of street segments and intersections, which also impact the relationship between eye-level streetscapes and walking preferences. These insights can significantly inform decision-making in urban streetscape design, enhancing pedestrian perceptions.

1. Introduction

In many high-density cities across Asia, such as Tokyo, promoting active transportation, particularly walking, is a pivotal strategy for urban development. This initiative aims to reduce reliance on private vehicles and foster sustainable development [1]. At the individual level, promoting walking has immense significance due to its profound impact on public health. Studies have shown that walking is a readily adoptable activity that effectively mitigates the risks associated with chronic conditions, such as type 2 diabetes [2], cardiovascular disease [3], and hypertension [4]. Moreover, encouraging walking stimulates economic growth, fosters social cohesion, and boosts property values [5,6]. These aspects emphasize the comprehensive benefits of promoting walking as a fundamental urban strategy.
The effectiveness of initiatives designed to encourage walking relies on identifying factors that impact street safety, comfort, and attractiveness [7,8,9]. Therefore, comprehensive investigations of factors affecting walking appeal are essential for devising effective strategies to encourage walking and amplify its positive effects at both the personal and community levels.
Eye-level streetscapes have recently become a focal point of research as micro-scale walkability factors, primarily because they are closer to human perceptions and can be modified more cost-effectively and easily than macro-scale factors [10]. Numerous studies have explored the relationship between eye-level streetscape factors and walking preferences and behaviors, primarily using linear analysis models [11,12,13,14,15]. However, these studies have overlooked the complex and multi-dimensional nature of this relationship, which frequently exhibits non-linear characteristics in real-world contexts. Nevertheless, comprehensive research on the non-linear impact of eye-level streetscape factors on walking preferences is scarce. This limits our understanding of how the eye-level environment shapes pedestrian perceptions. A holistic approach that considers these complex relationships is essential for creating walkable, enjoyable, and safe urban spaces. Furthermore, streets can be classified into two distinct sections based on their morphological and functional characteristics: street segments and intersections. These classifications have already been incorporated into existing walkability evaluation indexes [10,16]. However, the distinct effects of streetscape factors on walking preferences within these two sections remain inadequately explored. Moreover, streets of different structural categories exhibit unique configurations of elements, and their influence on walking preferences has also not been thoroughly discussed [15,17].
Therefore, this study explored the non-linear impact of eye-level streetscape factors on walking preferences in Japan, focusing on Tokyo’s Setagaya Ward. This study posed the following research questions: do eye-level streetscape factors exhibit non-linear associations with walking preferences? Furthermore, is there variability in how streetscape factors influence walking preferences across different categories of street segments and intersections? To address these questions, we utilized street-view big data, computer vision techniques, and a machine-learning regression algorithm. Our research provides valuable insights that could influence decision-making in the design of urban streetscapes to promote pedestrian perceptions.

2. Literature Review

Many studies have focused on identifying the factors that affect walkability and individual preferences for walking-friendly environments. Fundamental factors often include macro-scale factors, such as urban form characteristics (i.e., density, diversity, and design) [18], as well as destination accessibility and proximity to transit systems [19]. However, the focus on immediate eye-level factors is growing due to their cost efficiency and simpler modifications compared to macroscale factors [10]. These factors, including street width, building height, architectural style, greenery, pedestrian-focused design, street furnishings, and other fine-grained elements, enhance the aesthetic and functional qualities of streetscapes [20]. These factors are pivotal in shaping key urban design characteristics, including imageability, sense of enclosure, human scale, and transparency [10]. Several assessment tools were designed to measure the walkability and health characteristics of local environments based on the existing research findings. These tools include the Irvine Minnesota Inventory (IMI) [16], Microscale Audit of Pedestrian Streetscapes (MAPS) [10], Analytic Audit Tool and Checklist Audit Tool [21], Healthy Aging Network [22], Walking Suitability Assessment Form (WSAF) [23], PIN3 Neighborhood Audit Instrument [24], Neighborhood Sidewalk Assessment Tool (NSAT) [25], and a set of indices specifically focused on high-density Asian contexts [26,27].
Studies have comprehensively evaluated the impact of diverse streetscape factors on pedestrians and explored the interplay between these factors. For instance, Gallimore et al. [28] examined the link between walk-friendly routes to educational institutions and the frequency of walking among students in neighborhood settings. They identified certain IMI factors [16], particularly those of eye-level streetscapes, that were correlated with increased instances of students walking to school. Numerous studies have investigated how streetscapes affect pedestrian perceptions and experiences [17,29,30,31]. Built environment characteristics at the eye-level shape feelings of safety, comfort, and interest, thereby modifying pedestrian behavior [29,32]. Borst et al. [33] proposed that the visual appeal of streets for pedestrians is influenced by three primary elements: cleanliness, aesthetic appeal, and the presence of pedestrian activities. Harvey et al. [17] noted that streets bordered by buildings and greenery are typically perceived as safer than open and bare ones. Asgarzadeh et al. [30,31] revealed a preference for low-rise buildings over high-rise ones among pedestrians. Similarly, Agrawal et al. [34] focused on individuals commuting to railway stations and observed that, while safety and visual appeal were influential, the most critical factor was route directness. Li et al. [35] suggested that the presence of green spaces could mitigate crime and boost pedestrians’ perceived security. Rodrigue et al. [36] highlighted the various determinants of perceived walkability in the built environment depending on the purpose of the trip.
However, these studies have failed to fully consider the intricate underlying interrelations among the built environment, walking behavior, and perceptions. To address this gap, research has increasingly employed machine learning methods to unearth complex, non-linear associations between these variables. For instance, Yin et al. [37] explored the non-linear dynamics of various walking objectives. Tao et al. [38] used non-linear approaches to examine the impact of built environments on active commuting and walking patterns among older adults. Similarly, Cheng et al. [39] investigated the non-linear influences on walking duration among older adults. Furthermore, Wu et al. [40] analyzed the non-linear interactions between streetscape attributes and the propensity for school walking in Hong Kong. Nevertheless, despite the growing body of work, studies focusing on the non-linear relationships between eye-level streetscape factors and their effects on walking preferences, particularly those considering variations in street morphologies and structures, remain relatively scarce.

3. Materials and Methods

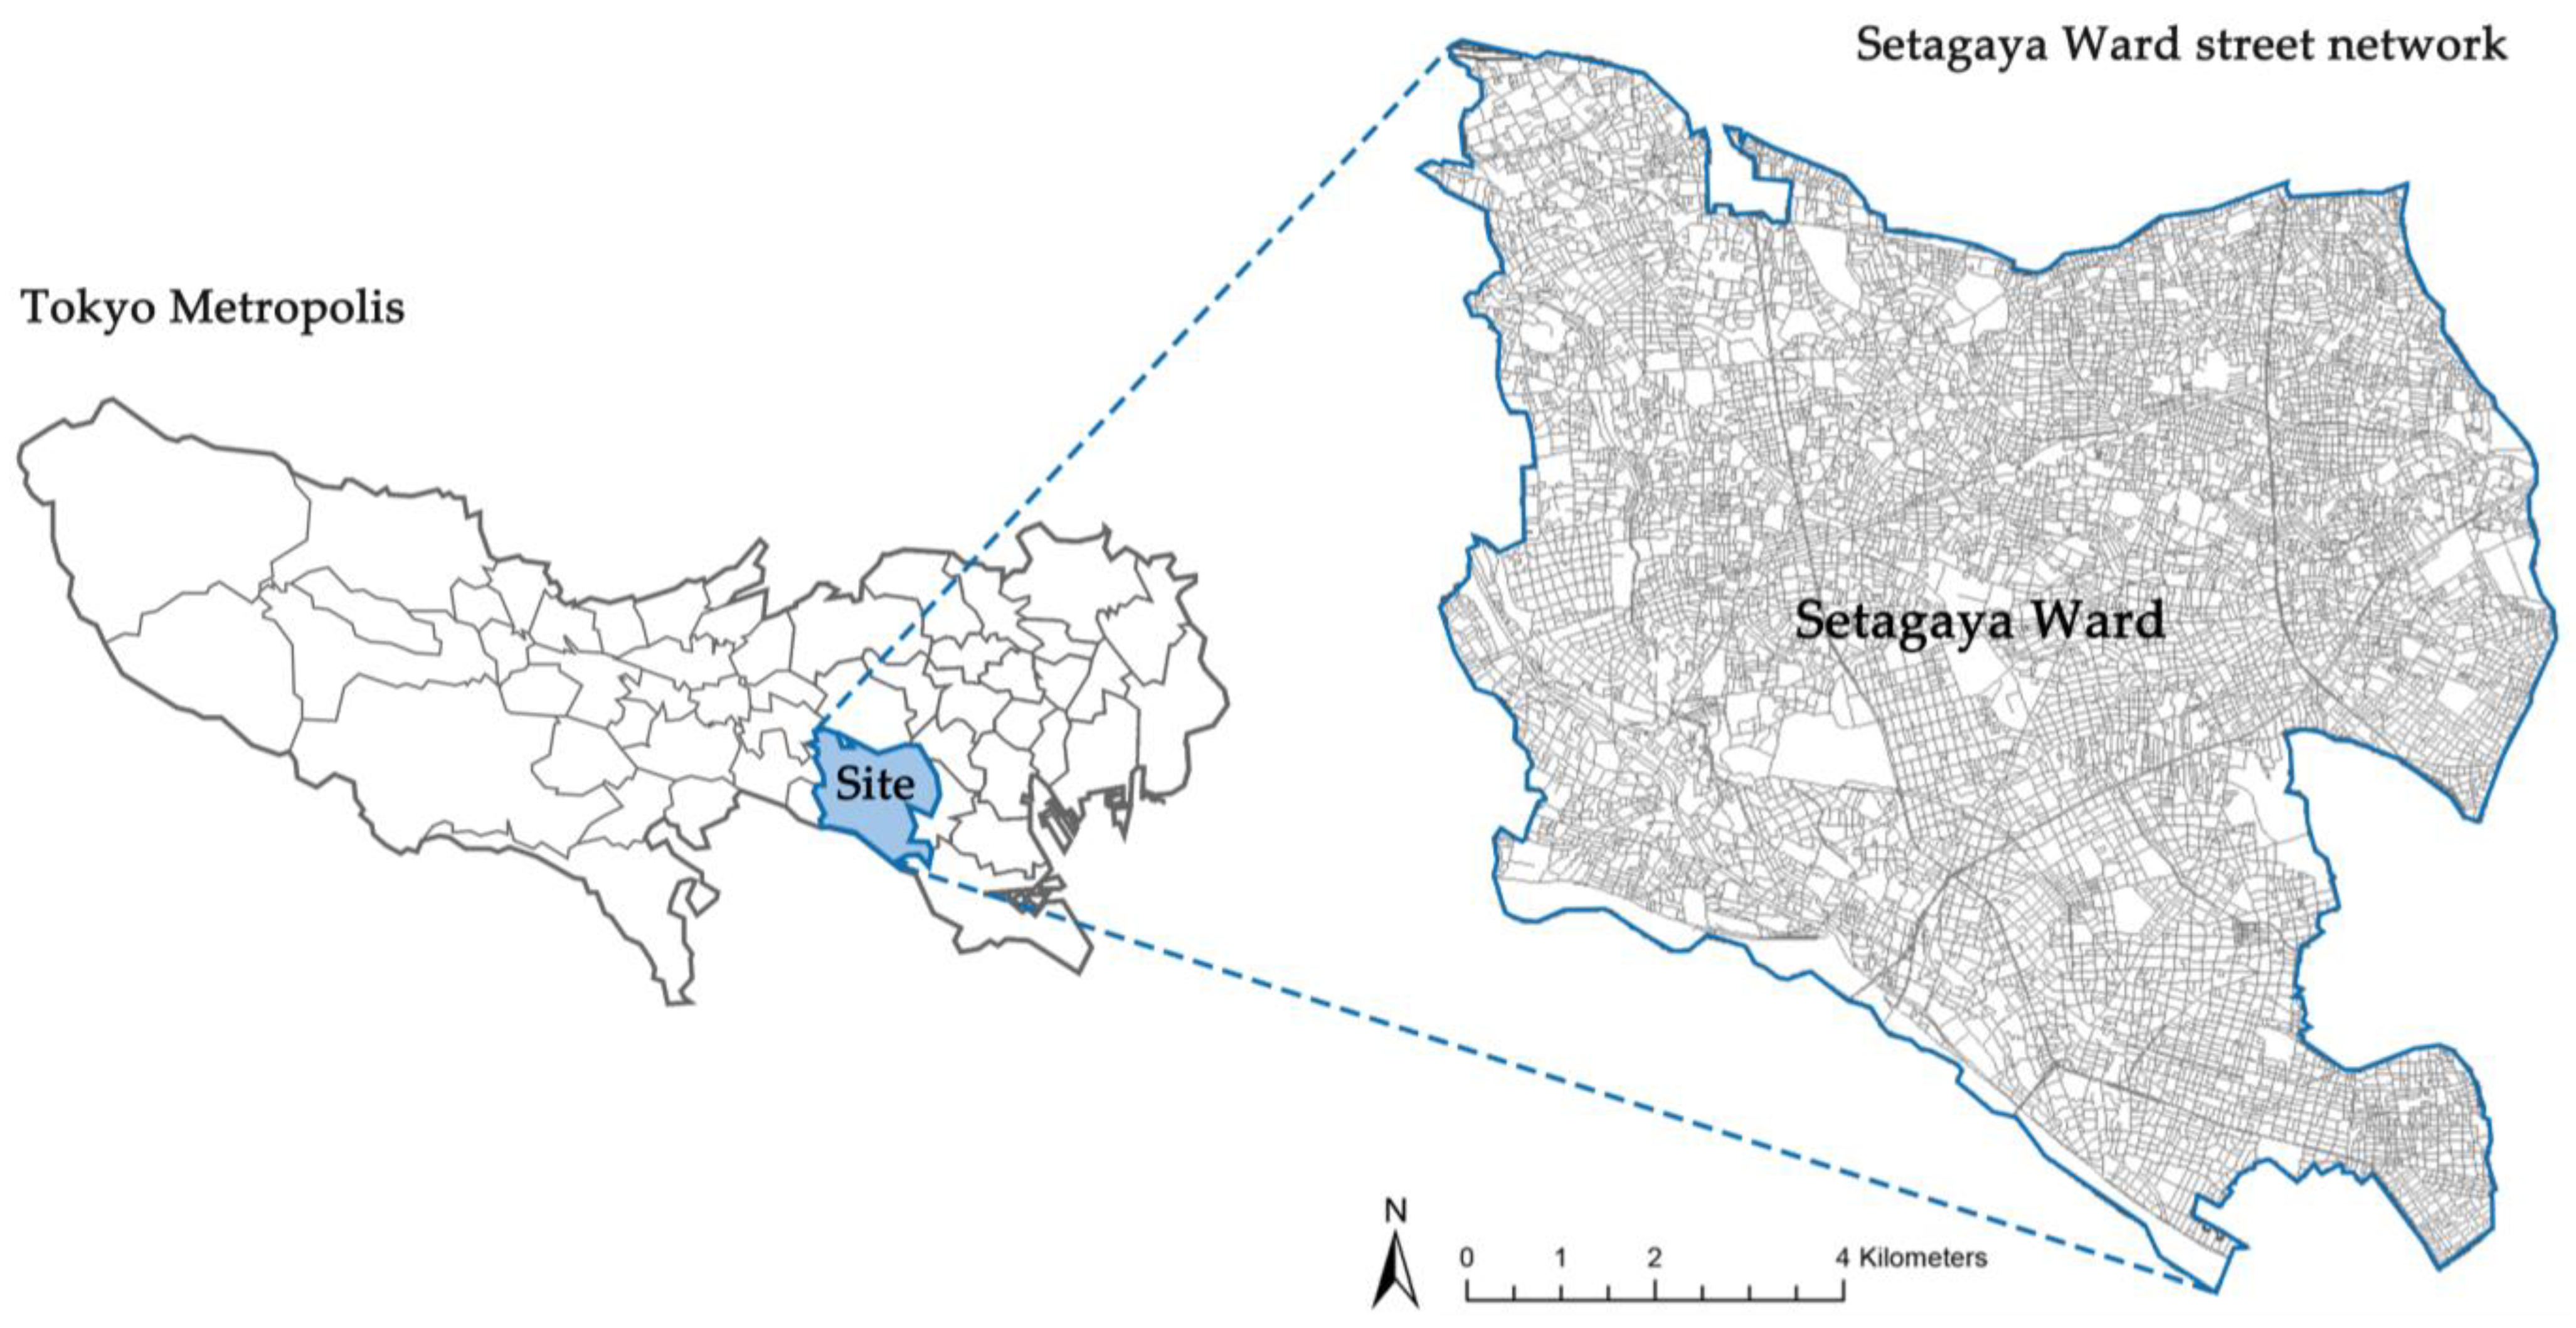
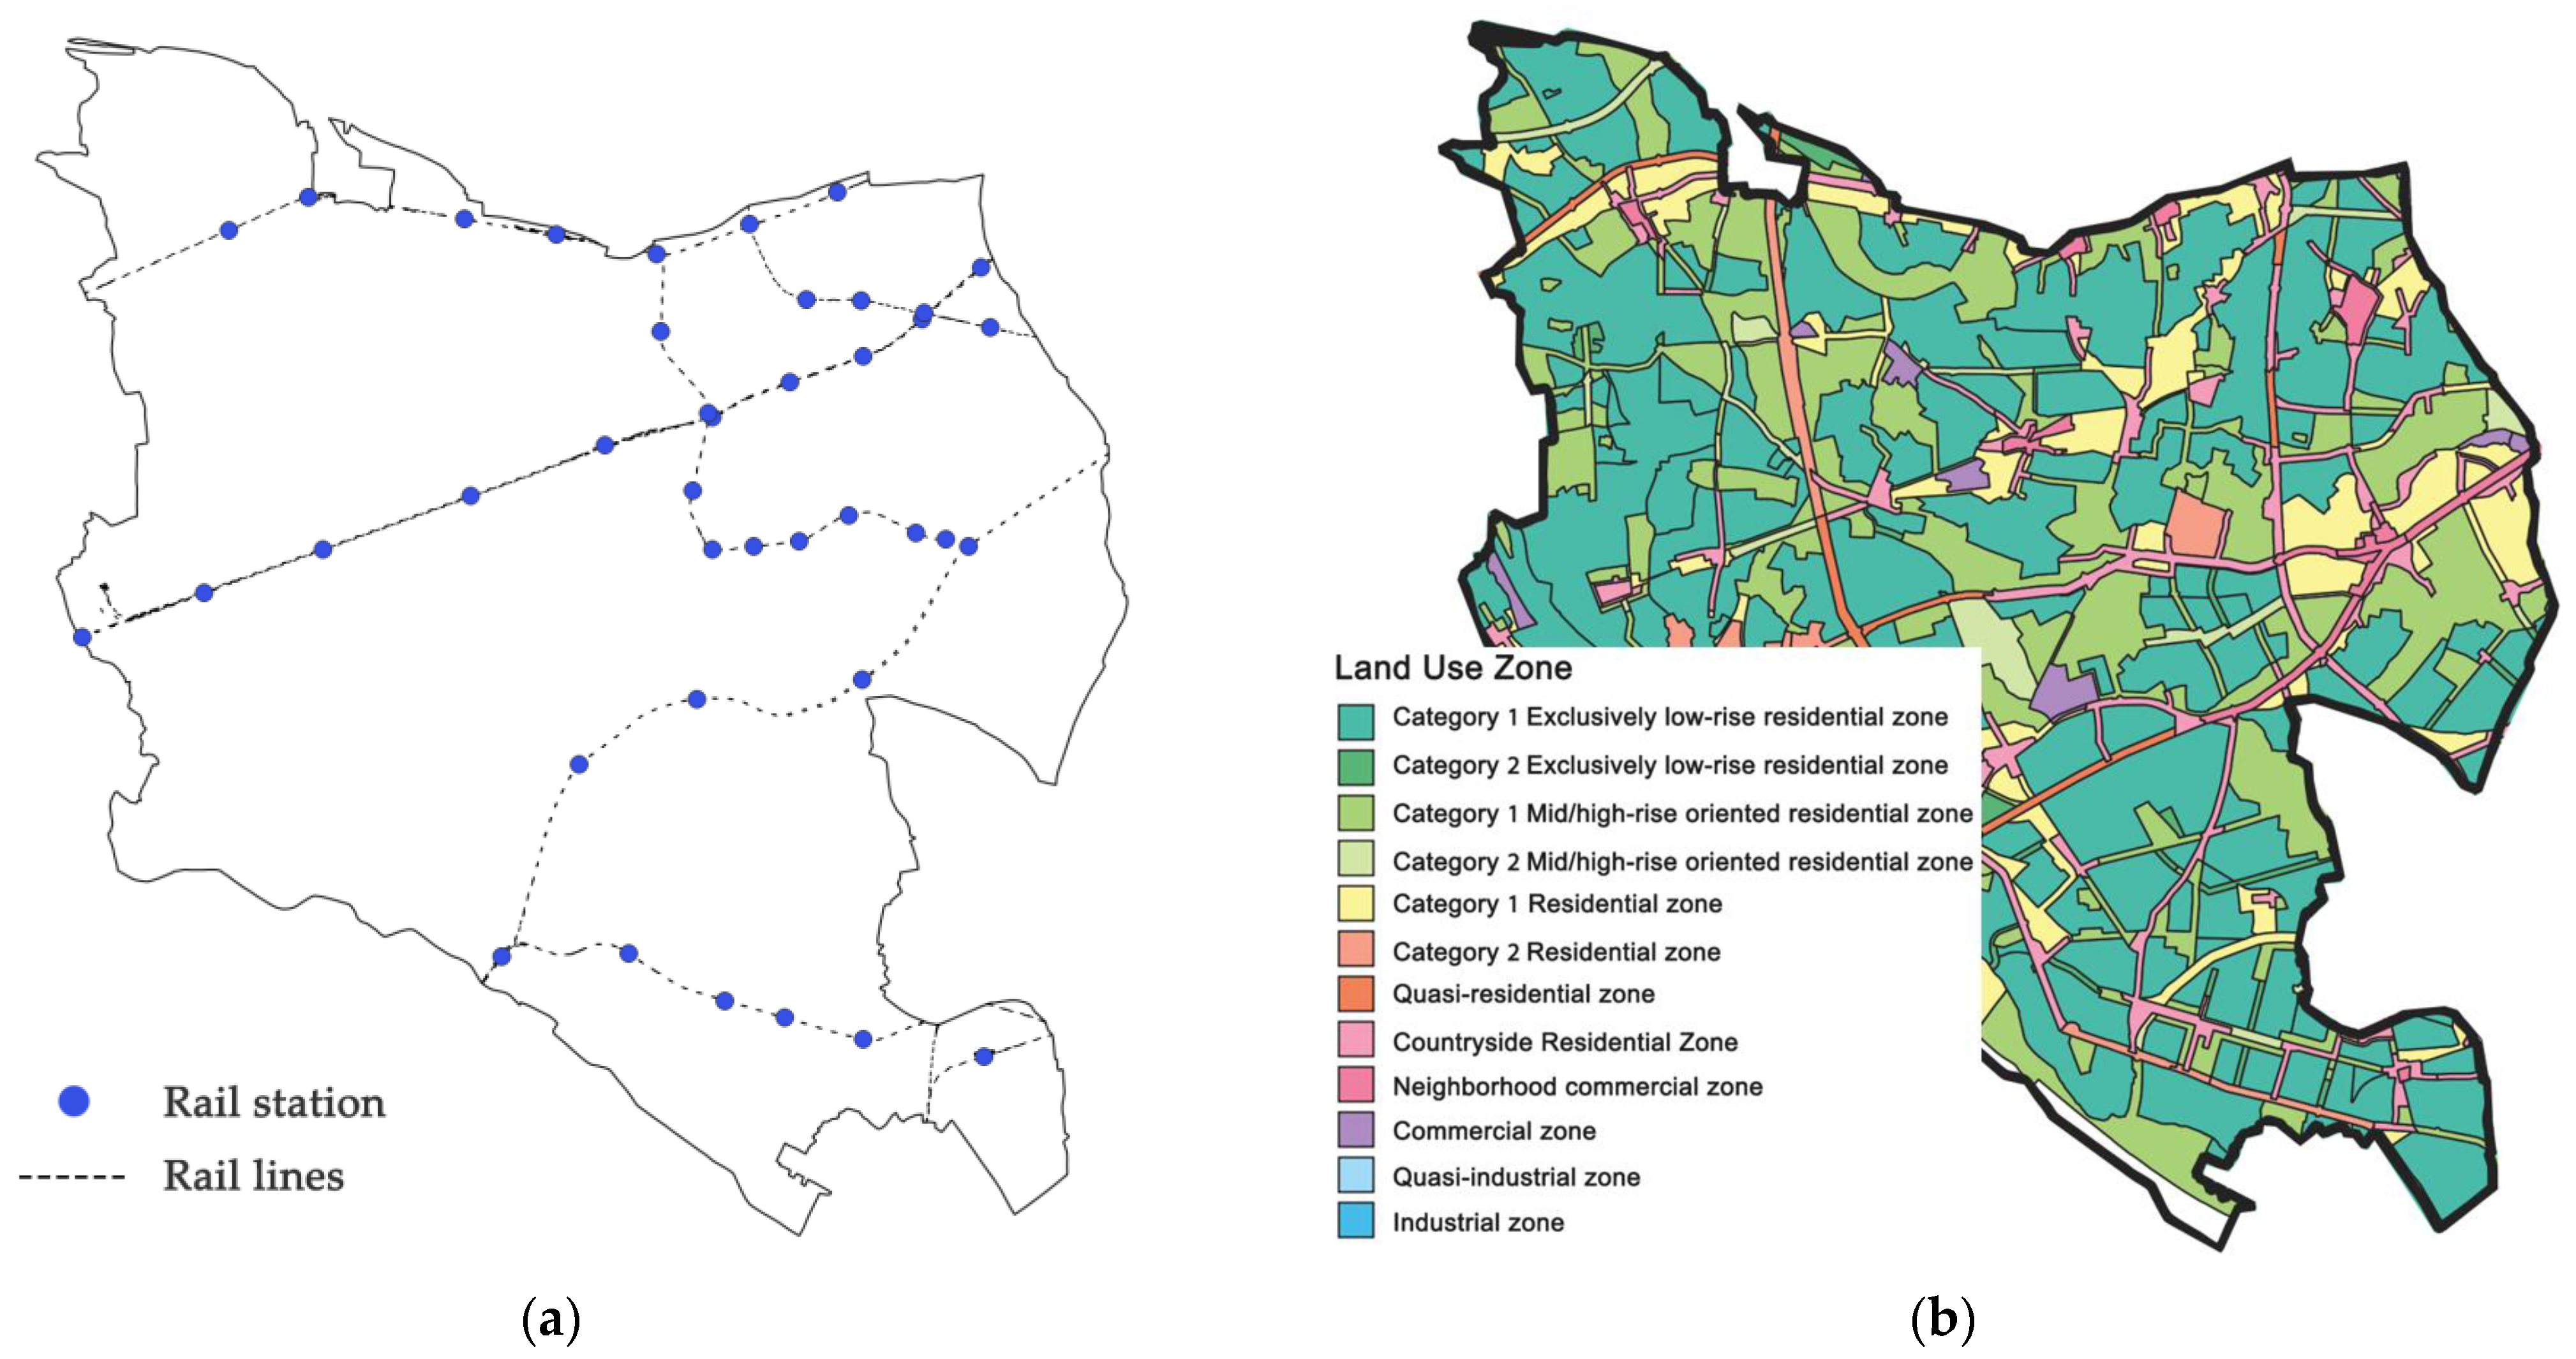
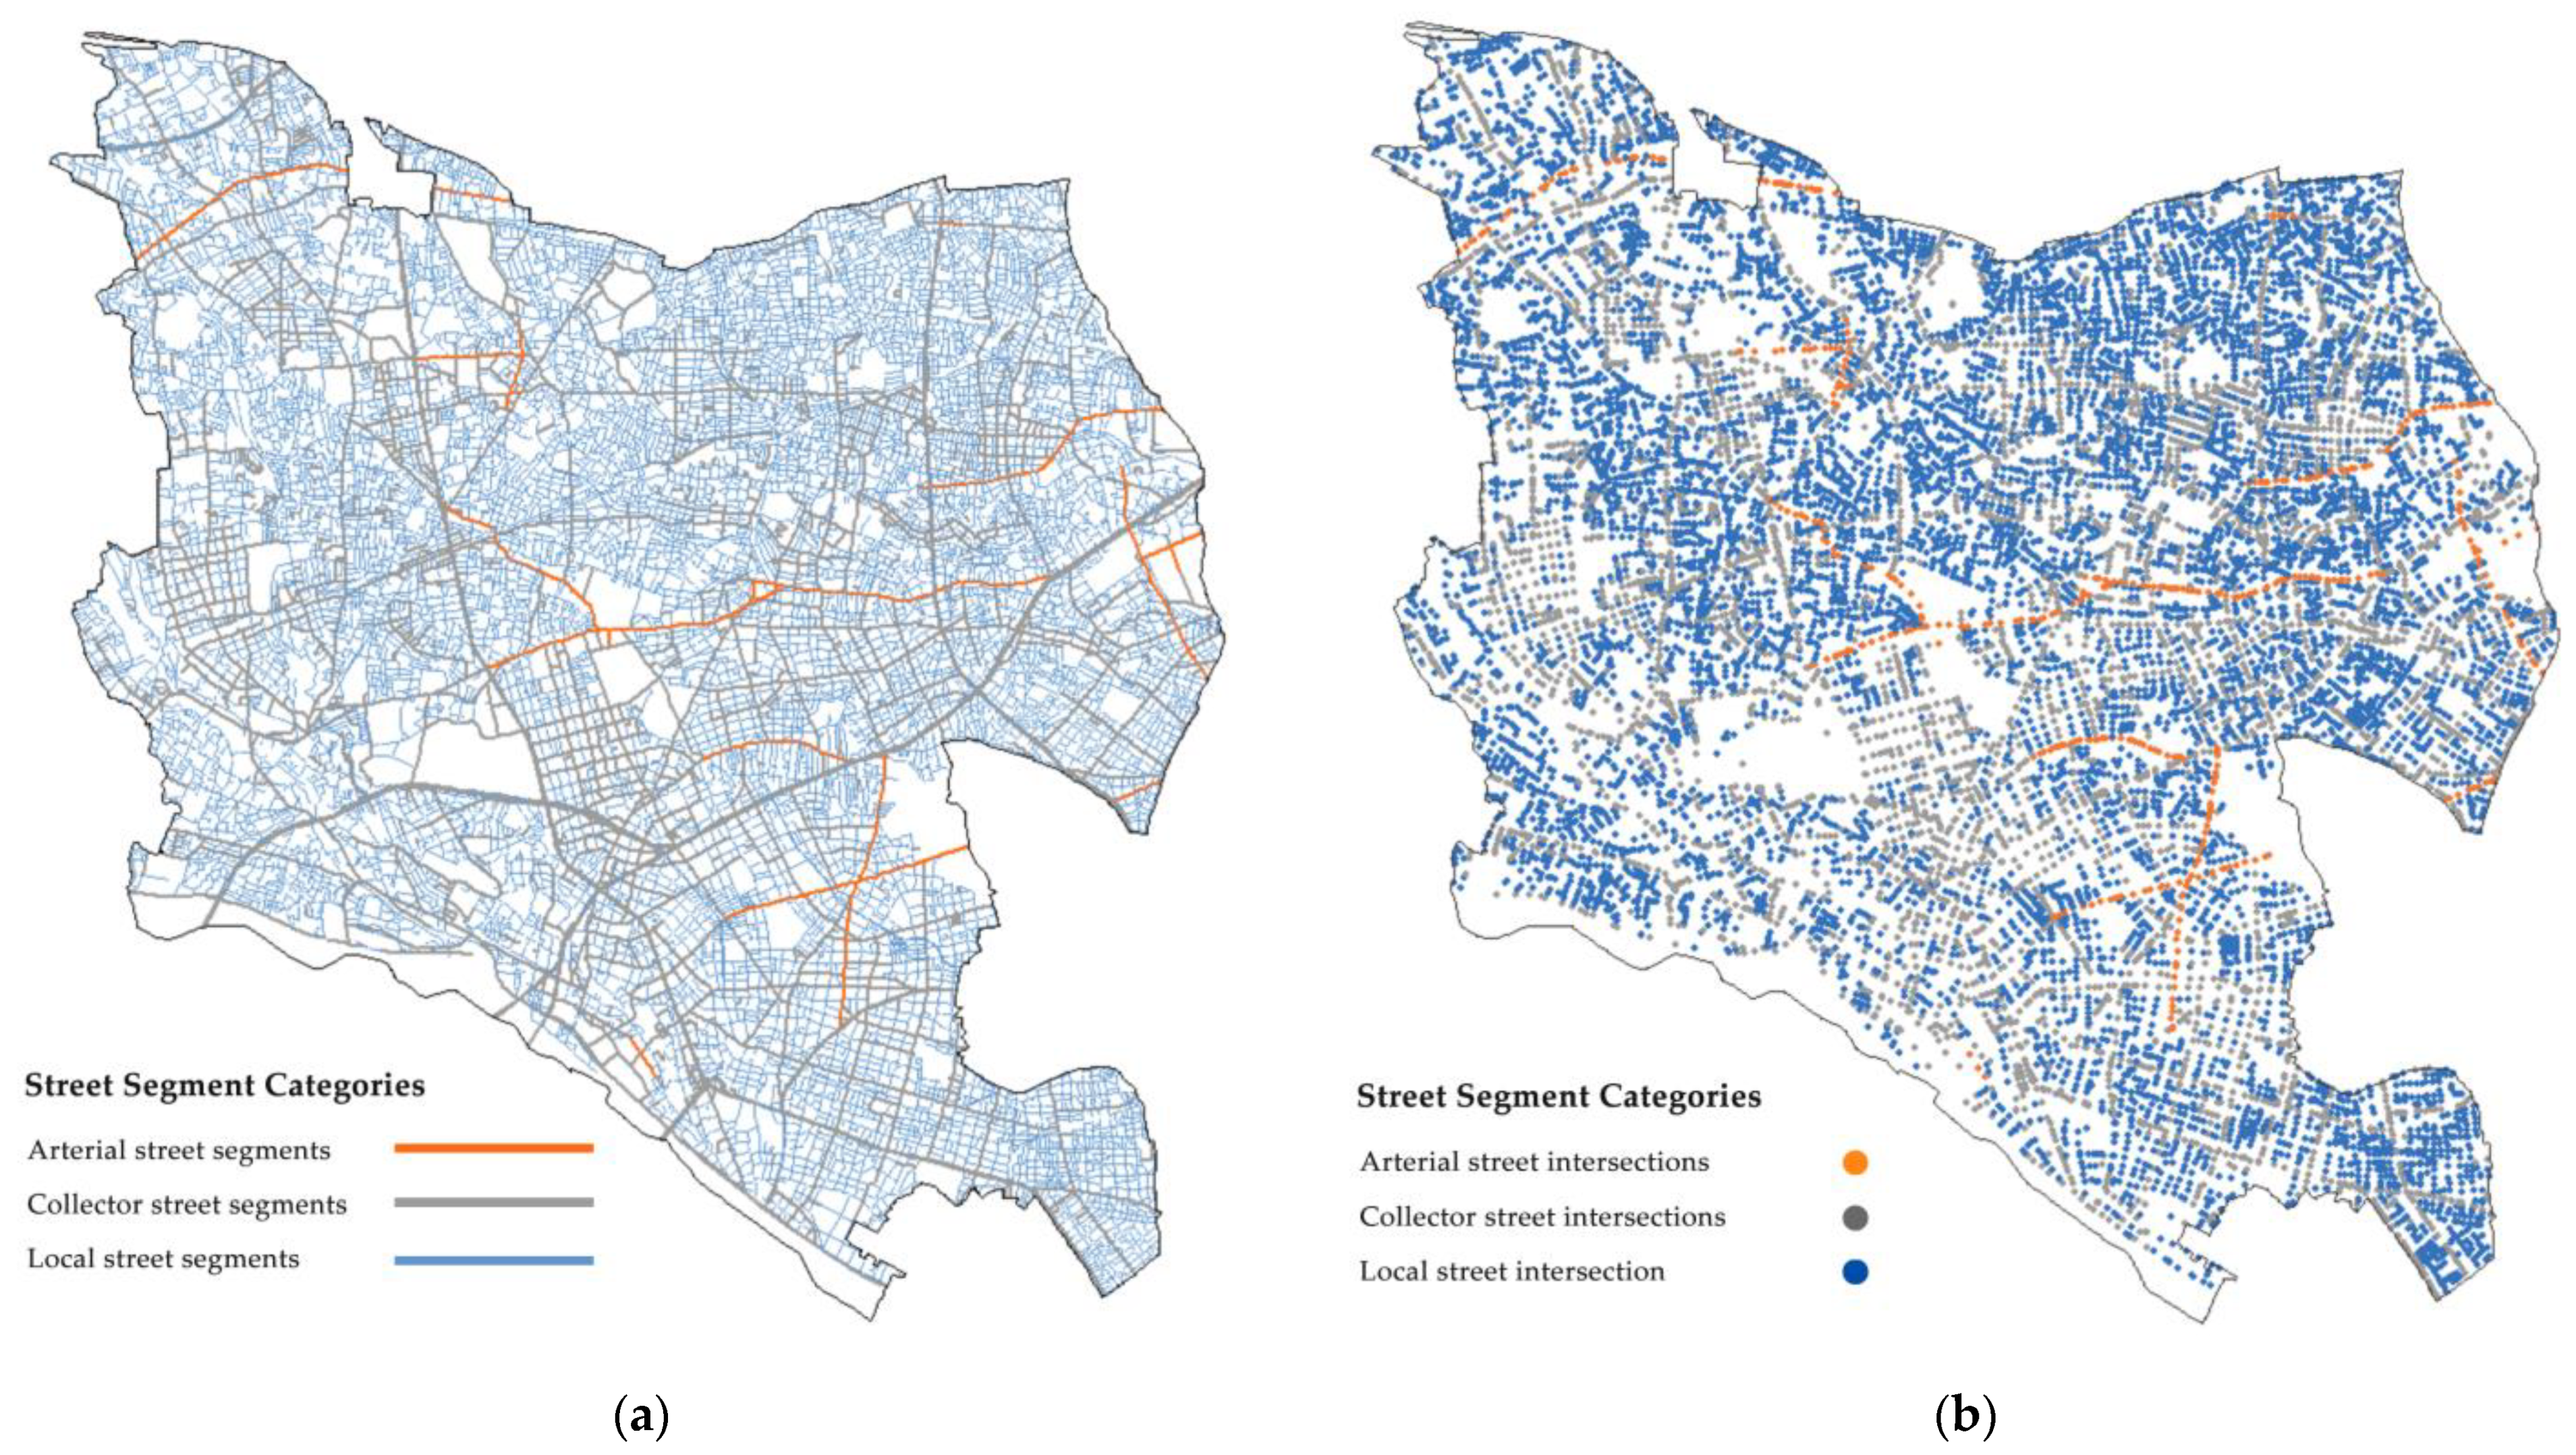
3.1. Case Study Site and Study Scope

Tokyo is a high-density urban area with a substantial reliance on rail-based public transportation, enhancing pedestrian experiences and perceptions is a pivotal component of the city’s spatial development strategy. This study focused on Setagaya Ward, a highly populous area situated on the southwestern edge of Tokyo (Figure 1). Setagaya is well served by extensive and efficient rail networks (Figure 2a). These networks guarantee swift transit of trains to major hubs, such as Shinjuku, Shibuya, and other districts of Tokyo. The ward also has diverse land-use patterns, integrating residential, commercial, and industrial zones (Figure 2b). This varied urban landscape, combined with its high population density and superior transportation facilities, makes Setagaya an exemplary model for studying walkability in urban environments [41].

3.2. Study Scope

To delineate the scope of our study and subjects of investigation, we followed the established methodologies to divide the streets into two main components: street segments and intersections [10,16]. This division considers their unique morphological features and roles in facilitating pedestrian perception and movement. Segments refer to the linear portions of streets, encapsulating the vibrancy of street life, whereas intersections refer to the pivotal points of traffic flow and direction change.
To gain a more nuanced understanding of whether differences in the street structure affect the relationship between streetscapes and walking preferences, we further classified street segments and intersections into distinct categories. We drew upon the Road Structure Ordinance [42] and research conducted by Neighborhood Street Research Group [43], Kato and Kanki [15], and Nagata et al. [15] in Japanese contexts and utilized street width classes as the criteria for the classification. Through the utilization of width classification information in street network centerlines of the Digital Road Map (DRM), we discerned three categories of streets within Tokyo’s Setagaya Ward accessible to pedestrians. These categories are delineated by width thresholds: streets with widths equal to or exceeding 13 m, between 5.5 and less than 13 m, and between 3 and less than 5.5 m. Each category corresponds to a specific type of street segment: arterial, collector, and local [15,44]. For street intersections, we employed a similar classification approach: intersections where arterial streets intersect were defined as arterial street intersections, those where collector streets intersect were termed collector street intersections, and those where local streets intersect were designated as local street intersections. Table 1 records detailed descriptions for each classification.
In Figure 3, the various categories of street segments (Figure 3a) and intersections (Figure 3b) within the Setagaya ward were mapped.

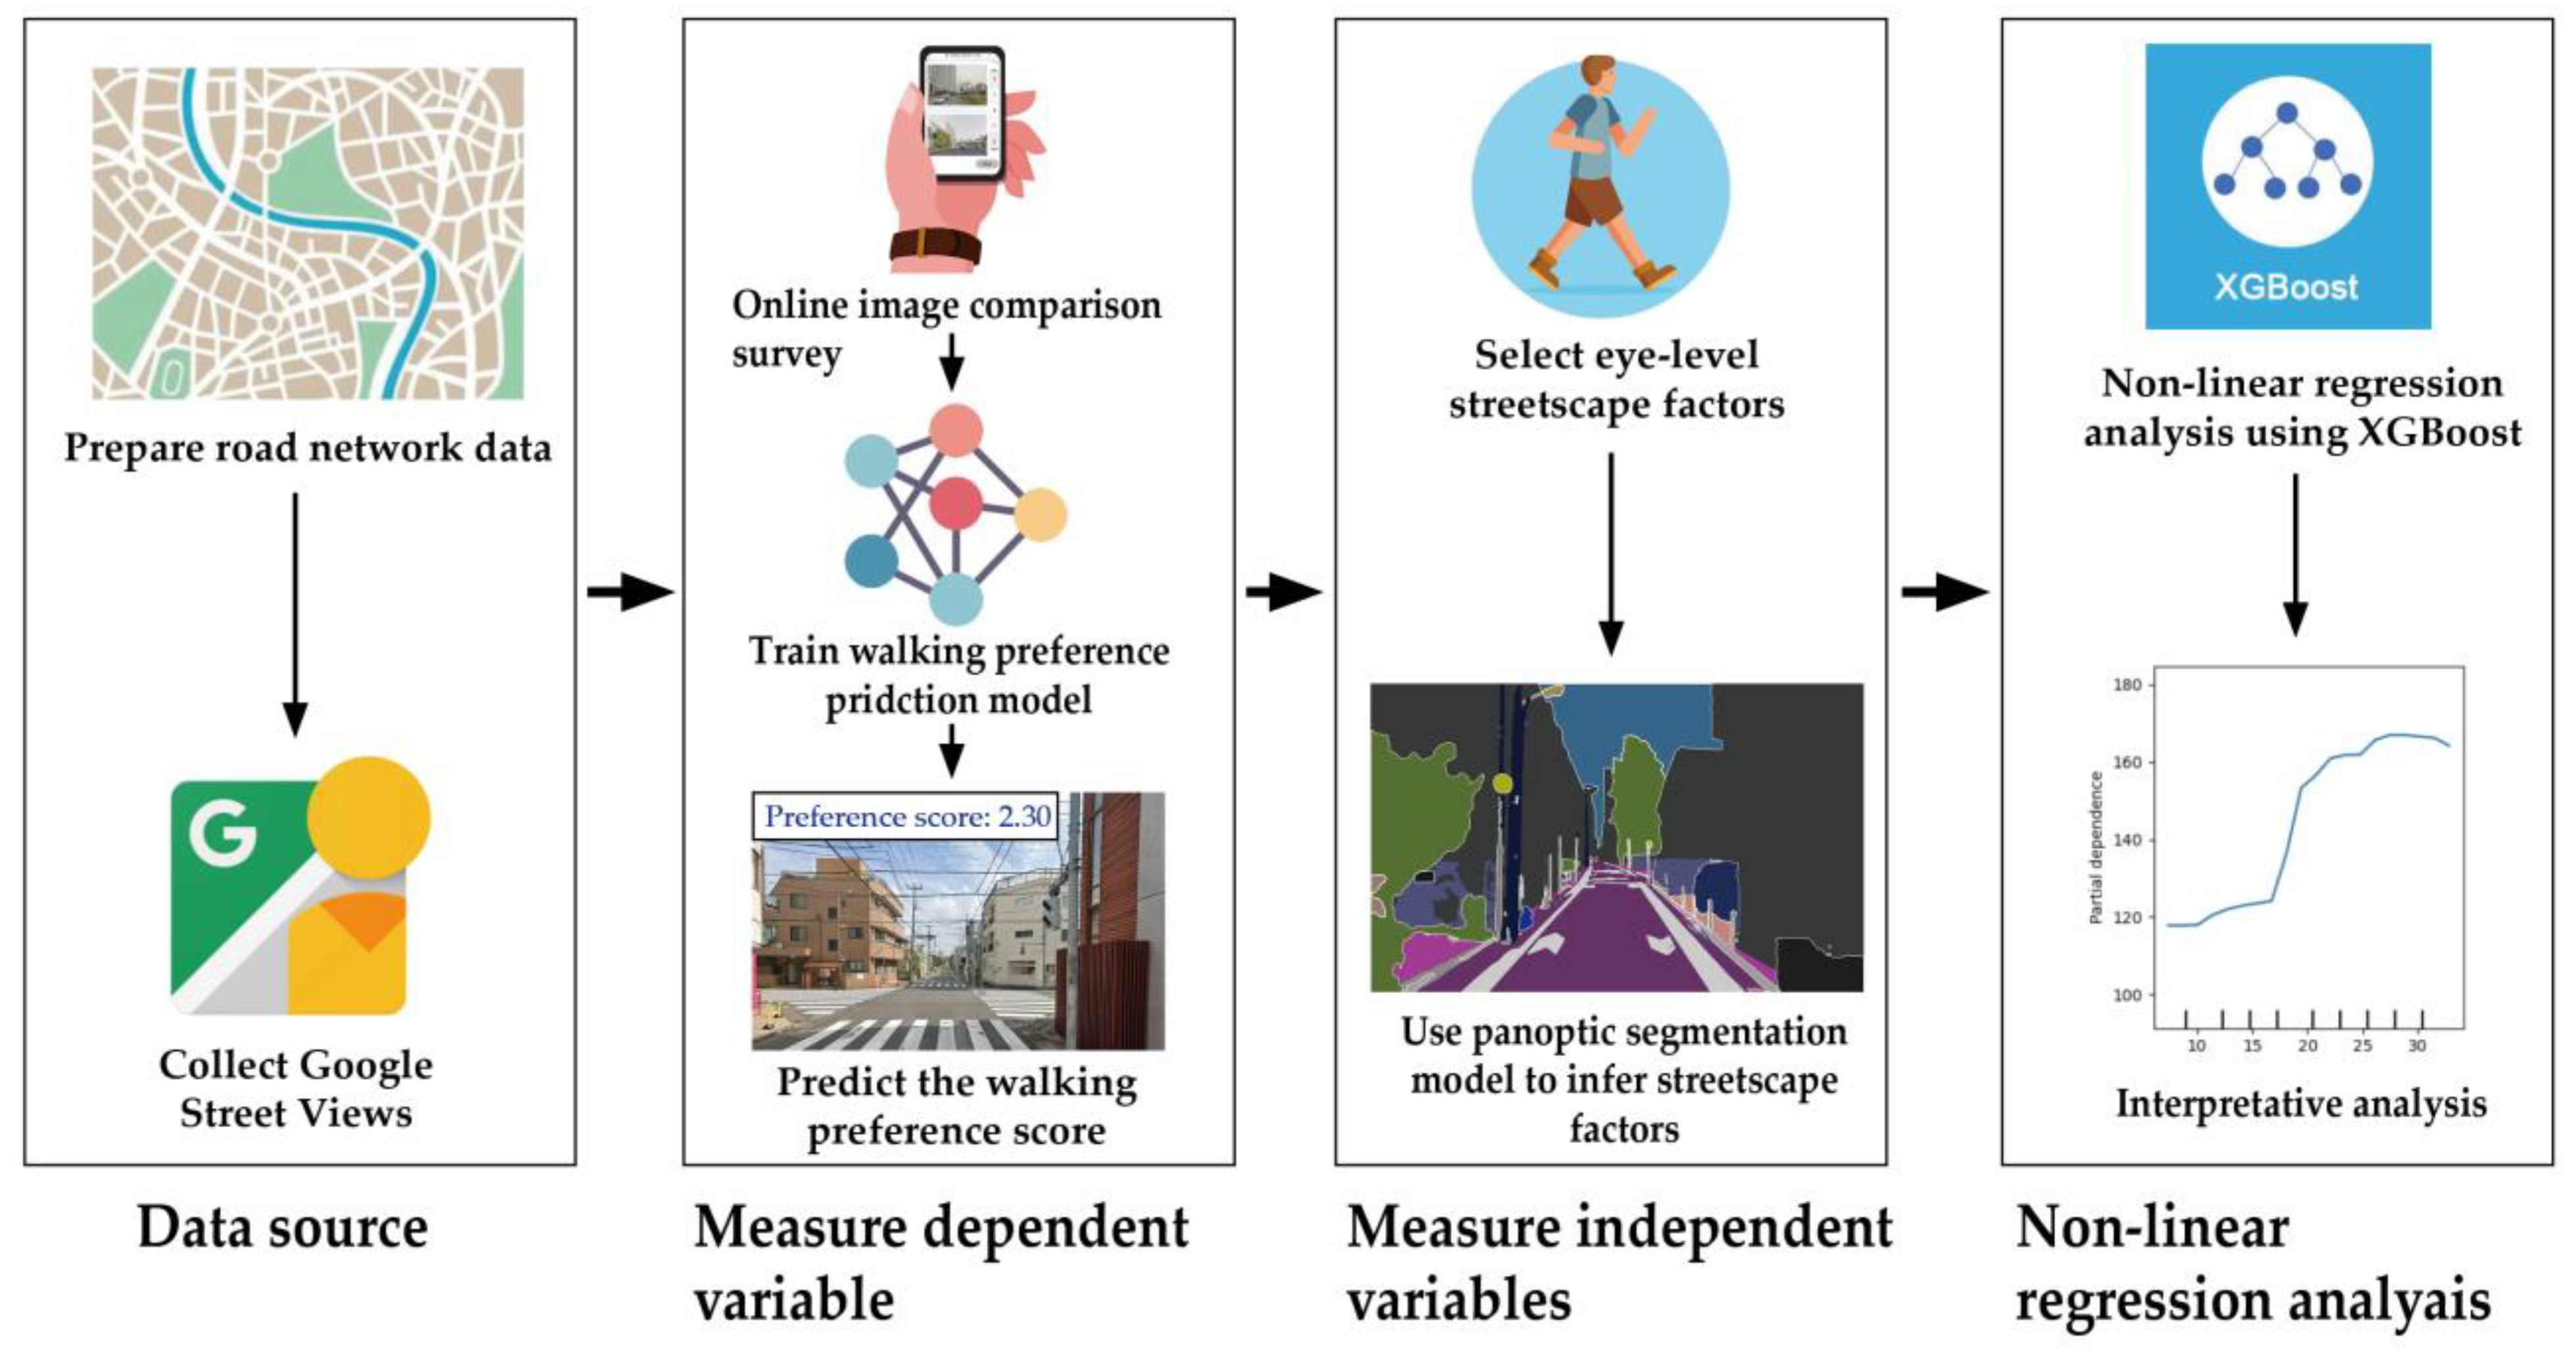
3.3. Analysis Framework

Figure 4 illustrates the study framework. We collected walking preference data using an online crowdsourced survey. These data were instrumental in training the deep learning models, which were then used to predict walking preferences throughout the street segments and intersections in Setagaya Ward. Subsequently, we identified and quantified the factors related to eye-level streetscapes in both segments and intersections by employing panoptic segmentation [45] combined with Geographic Information System (GIS) methods. Finally, we utilized an Extreme Gradient Boosting (XGBoost) [46] machine learning model to analyze the complex influences of eye-level streetscape factors on walking preferences, with street segments and intersections as distinct categories.

3.4. Data Preparation

We used Google Street View (GSV) images as the data source. We began by using street network centerlines from the DRM, setting a 30 m interval for collecting GSV images and their corresponding coordinates using QGIS version 3.22.3. This interval was selected based on Gehl’s [47] concept of the human scale of outdoor urban spaces. Using this approach, we captured approximately 50,000 panoramic images at selected coordinates, including approximately 46,000 representing street segments and approximately 4000 focusing on street intersections. Subsequently, we converted these panoramas into front-view images to simulate an eye-level perspective. In this study, individual street view images were used as the units of analysis.

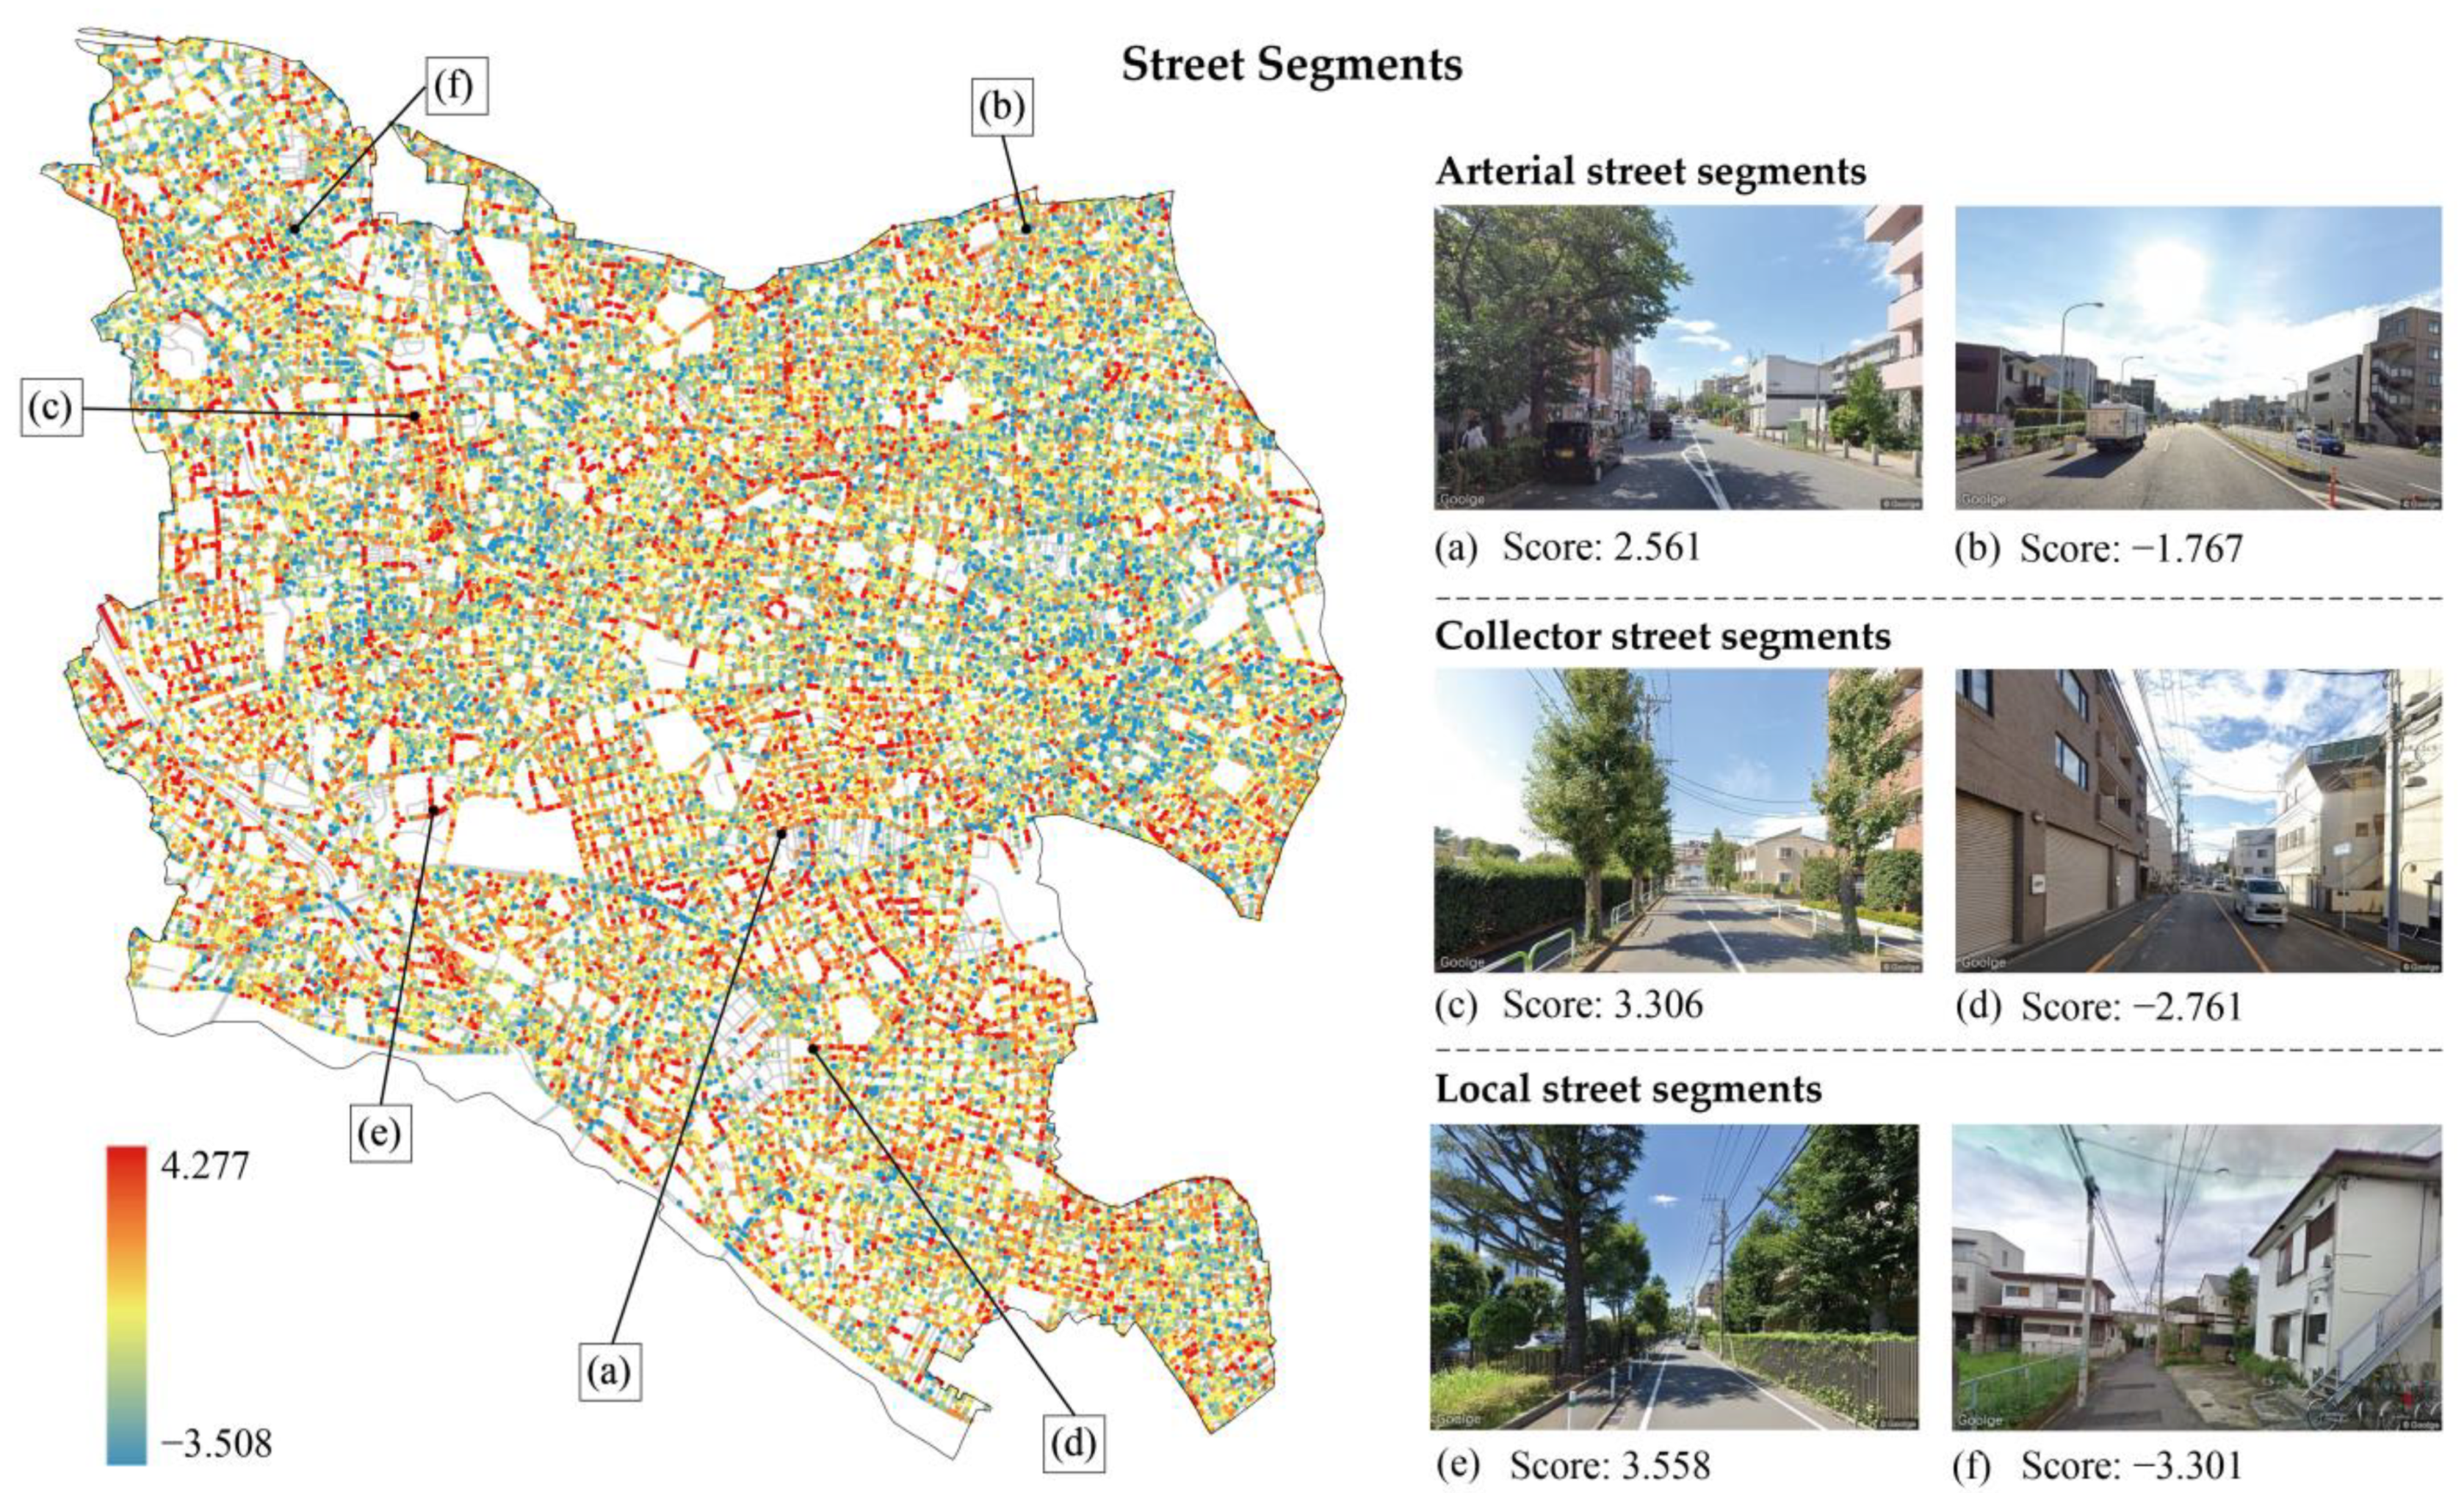
3.5. Dependent Variables: Walking Preference Scores

In recent years, deep learning methodologies have become increasingly prominent in environmental perception analysis. Our research applied a deep learning method that blends pairwise image comparison data with deep convolutional neural networks to predict walking preference scores [48]. This technique, tested by Ordonez et al. [49] and Dubey et al. [50], has undergone continuous refinement and application in subsequent studies [48,51,52,53], further enhancing its efficacy and applicability in the field.
Our approach is grounded in the empirical foundation of existing research and includes three vital stages: (1) preparing image survey data, (2) collecting preference opinions through a pairwise image comparison survey, and (3) training the inference model. This structured approach allows us to make extensive inferences and accurately predict walking preference scores by utilizing individual street-view images as the input for scoring.

3.5.1. Image Survey Data Preparation

To develop a model capable of predicting walking preference scores, compiling a training dataset that includes image survey data and the corresponding preference labels from individuals is essential. To prepare our image survey data, we meticulously chose 1000 images that reflect the streetscape characteristics of street segments and 200 images that illustrate the streetscape features of intersections from our collected street-view image dataset. During the selection process, we considered the image’s representativeness to ensure its ability to reflect diverse street hierarchies and intersection scenarios. Subsequently, we randomly paired these selected survey images, creating pairs in which each image was matched with the other images ten times. This process generated 10,000 image pairs for street segments and 2000 for street intersections.
We then adapted the image comparison sets to an interactive interface optimized for use on mobile devices (Figure 5a). The respondents were presented with two questions designed for a comparative analysis of street segments and intersections: “Which street segment is preferable for walking?” and “Which street intersection is preferable for walking?” Moreover, comparative levels were measured using a five-point scale: “Upper image is much better than Bottom image”, “Upper Image is somewhat better than Bottom image”, “Both are the same”, “Bottom image is somewhat better than Upper image”, and “Bottom image is much better than Upper image”.

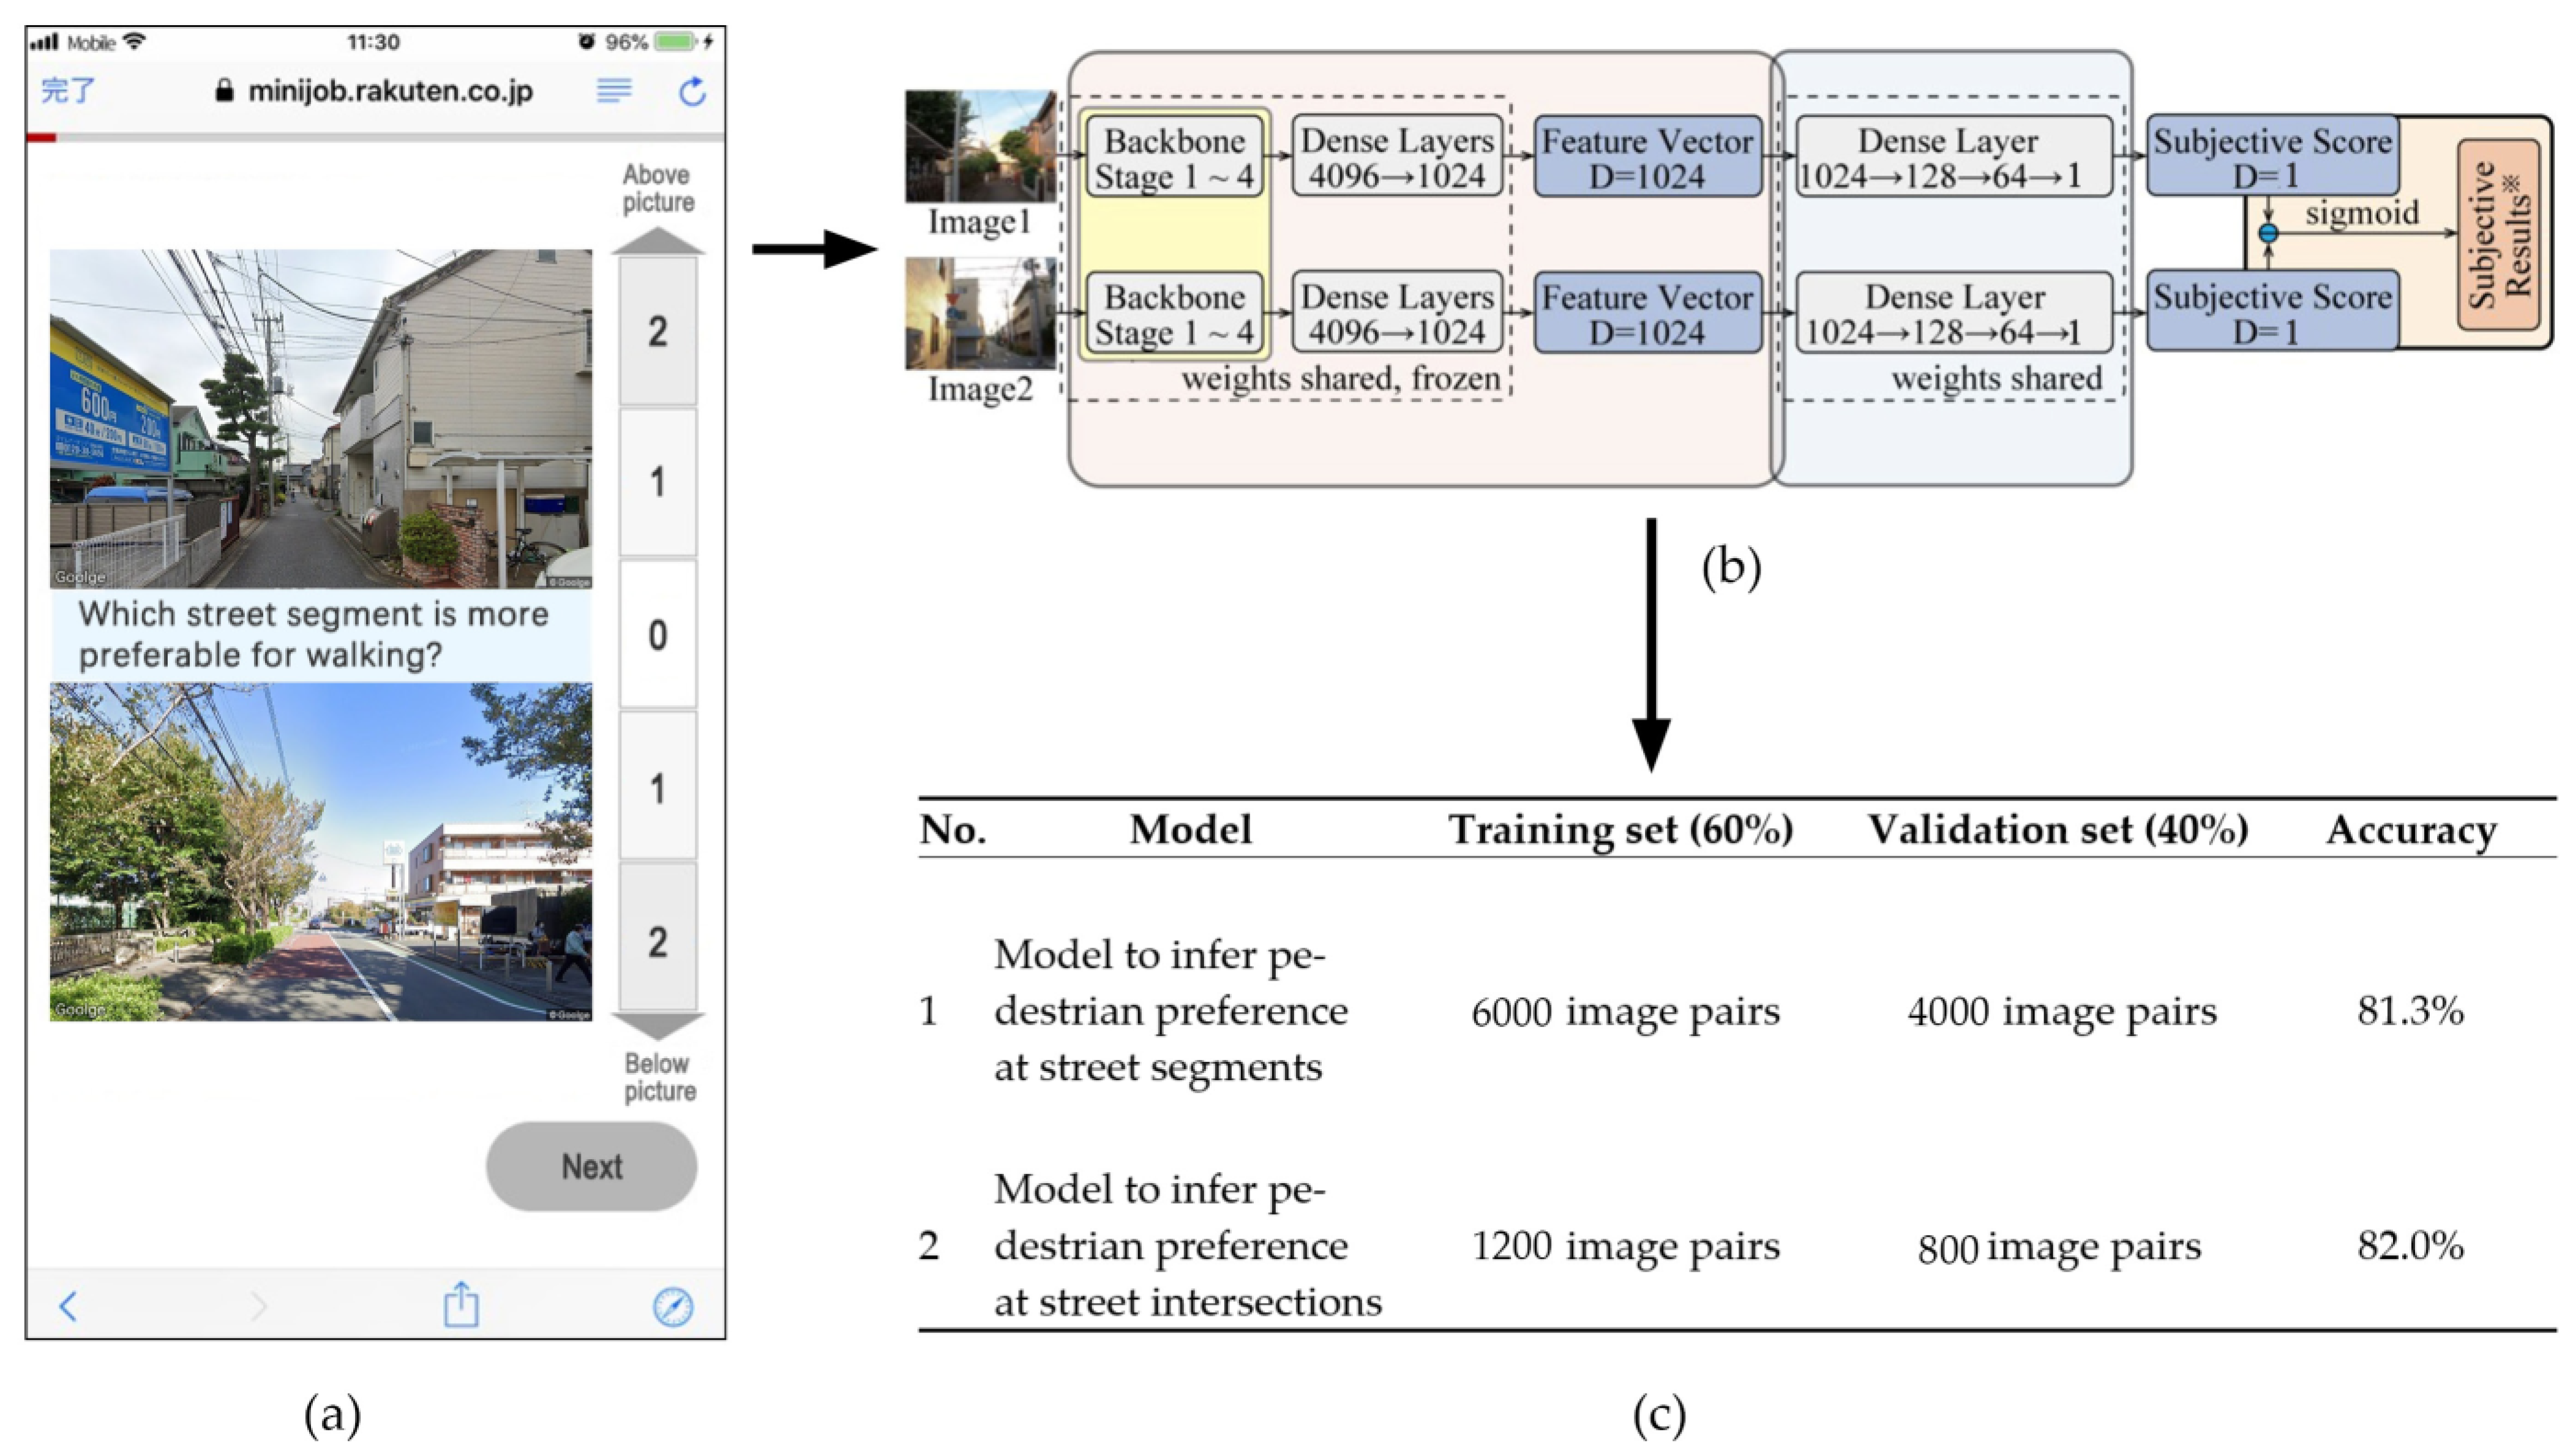
3.5.2. Walking Preference Surveying

In February 2023, a survey involving pairwise image comparisons was conducted among volunteer participants of diverse ages and genders living in Japan, facilitated by a professional survey company. Approximately 18,000 anonymous respondents were recruited. Each comparison pair received responses from 10 different respondents. The highest number of responses from a single individual was 120, whereas the lowest number was one. In total, we collected over 120,000 responses with an average of 6.6 responses per respondent. The survey successfully achieved a balanced representation of gender and age among the respondents, ensuring that the results accurately reflected the broader population.

3.5.3. Prediction-Model Training

Two distinct models were trained to predict walking preferences for street segments and intersections. The training data consisted of image pairs of street segments and intersections used in the image surveys along with the corresponding comparative preference scores gathered as labels. The training data were divided into two parts: 60% for training and 40% for validation. First, image pairs were processed using a CNN with ConvNeXt V2 [54] as the backbone for feature extraction. Meanwhile, the survey scores corresponding to the image comparisons were transformed into a binary classification label. Subsequently, the extracted features were then introduced into a Deep Neural Network (DNN) to generate two predicted scores. We calculated the differences between these scores to facilitate binary classification and model training. Subsequently, we applied a sigmoid function to map this difference to the range of 0–1. This transformation enabled us to minimize the loss function by comparing the predicted values with the pre-processed labels obtained from an online image survey. The detailed architecture of this model is illustrated in Figure 5b.
This approach led to the development of two distinct prediction models, which demonstrated accuracy rates of 81.3% (street segments) and 82.0% (street intersections) (Figure 5c). These accuracies reflected the proportion of correctly predicted samples among the total number of samples. During the model training phase, we did not consider creating separate models for different genders and age groups due to concerns that splitting the training data might reduce the accuracy of the predictive models.

3.5.4. Prediction Model Application

We utilized the trained models to predict the GSV scores across the street segments and intersections in Setagaya Ward. They were then normalized within their respective categories using the z-score method for subsequent regression analysis. Figure 6 illustrates the spatial mapping of preference scores for street segments of different categories, arranged in descending order from warm to cold based on color. Figure 6a,c,e depicts street scenes with high predicted preference scores based on arterial street segments, collector street segments, and local street segments, respectively. Meanwhile, Figure 6b,d,f illustrate examples with lower predicted scores based on the aforementioned three categories of segments.
Figure 7 shows the preference-mapping pattern for street intersections. Figure 7a,c,e show the intersection scenes that received relatively high scores based on arterial street intersections, collector street intersections, and local street intersections, whereas Figure 7b,d,f show the intersection scenes that received relatively low scores on the aforementioned three categories of intersections.

3.6. Independent Variables: Eye-Level Streetscape Factors

3.6.1. Selection of Eye-Level Streetscape Factors

We drew on existing research to select the independent variables for our study. Many studies, including those by Handy et al. [20] and Harvey and Aultman-Hall [17], have suggested that eye-level streetscapes can be categorized into two groups: (1) the skeleton of streetscapes and (2) finer streetscape details. The first group concentrates on the street’s skeletal configuration, which Handy et al. [20] describe as “three-dimensional features along a street, bounded by buildings”. The second group focuses on finer streetscape factors, such as pedestrian facilities, street furniture, and detailed architectural features [10,16].
This study referenced and utilized a skeletal-detail framework to select eye-level streetscape factors. For skeletal variables in street segments, in line with our focus on discontinuous perception, we concentrated on variables that reflected the cross-sectional characteristics, including street-to-building and sidewalk-to-roadway ratios [55]. For street intersections, we selected the number of legs and average crossing distance [10] as skeletal variables. Our selection of detailed streetscape variables for both street segments and intersections was primarily guided by variables found in classical eye-level walkability assessment indexes and existing computer vision-based eye-level streetscape analyses. From which we derived factors encompassing elements depicting major static streetscape features, such as walls [15,40], sidewalks [10,16,26,40], elevated viaducts [40], and roadways [10,16,40], along with associated facilities, like mailboxes, street lights [10,16,26,40], benches [10,16,26], trees [10,16,26,40], shrubs [40], awnings [16,26,40], trash cans [10,26], crosswalks [10,16,26], and traffic lights [10,16,26,40]. Additionally, dynamic components, such as pedestrians [15,40], riders [15], and vehicles [15,48], have been acknowledged for their influence on visual preference, as they significantly shape perceptions of safety (e.g., through the presence of “eyes on the streets” or effects on traffic congestion) and comfort (e.g., through the presence of eyes on the streets or effects on traffic congestion) and comfort [26]. Considering that integrating dynamic factors as control variables within the model can help mitigate potential perceptual biases and since our research does not aim to conduct a systematic audit of street walkability, dynamic variables have also been included in the variable selection process.
Ultimately, we identified two skeletal factors and 20 detailed factors for street segments and two skeletal factors and 16 detailed factors for street intersections (Table 2 and Table 3).

3.6.2. Quantification of Eye-Level Factors

An increasing number of studies have utilized street-view imagery and computer vision techniques to quantify streetscape factors, thereby facilitating automated and large-scale quantitative analyses [26]. This study used deep-learning-based computer vision algorithms to analyze the GSVs and quantify selected variables. For streetscape factors with continuous or non-countable attributes, such as elevated viaducts, walls, trees, and sidewalks, we computed pixel view indices. The pixel view index of a streetscape factor is commonly defined as the ratio of its pixels to all pixels within a GSV [40,56], as described in Equation (1).
V o b j = i = 1 n P i x e l o b j i = 1 n P i x e l t o t a l , o b j { t r e e ,   c r o s s w a l k ,   s i d e w a l k ,   e t c }
where V o b j is the view index, i = 1 n P i x e l o b j is the number of pixels of the streetscape factor, and i = 1 n P i x e l t o t a l is the total number of pixels. This ratio reflects the proportion of streetscape variables in a pedestrian’s eye-level view.
Skeletal streetscape factors, street-to-building ratios, and sidewalk-to-roadway ratios were calculated based on pixel statistics. The street-to-building ratio was calculated as the ratio of the sum of pixels of vertical elements, such as buildings and walls, to the sum of pixels of sidewalks, roadway, people, and vehicles on them. This method, as shown in Equation (2), has been outlined in previous studies [55].
V s b = i = 1 n P i x e l s i d e w a l k + i = 1 n P i x e l r o a d w a y + i = 1 n P i x e l p e r s o n + i = 1 n P i x e l v e h i c l e i = 1 n P i x e l b u i l d i n g + i = 1 n P i x e l w a l l
where V s b is the visual ratio of street-related pixels to building-related pixels; and i = 1 n P i x e l s i d e w a l k , i = 1 n P i x e l r o a d w a y , i = 1 n P i x e l p e r s o n , i = 1 n P i x e l v e h i c l e , i = 1 n P i x e l b u i l d i n g , and i = 1 n P i x e l w a l l are the total pixels of the sidewalk, roadway, person, vehicle, building, and wall categories, respectively.
The sidewalk-to-roadway ratio was calculated by comparing the sum of the pixels of the sidewalk and pedestrians with the sum of the pixels of the roadway and vehicles, as shown in Equation (3).
V s r = i = 1 n P i x e l s i d e w a l k + i = 1 n P i x e l p e r s o n i = 1 n P i x e l r o a d w a y + i = 1 n P i x e l v e h i c l e
where V s r is the visual ratio of sidewalk-related pixels to roadway-related pixels; and i = 1 n P i x e l s i d e w a l k , i = 1 n P i x e l r o a d w a y , i = 1 n P i x e l p e r s o n , and i = 1 n P i x e l v e h i c l e are the total pixels of sidewalk, roadway, person, and vehicle categories, respectively.
Although pixel statistics are effective for computing certain streetscape factors, they are less suited for quantifying discontinuous and countable streetscape factors, such as benches and street lights. Therefore, specifying the precise numbers offers clear explanations and practical guidance for design purposes [26].
To simultaneously extract both pixel- and quantity-based features from images, we utilized a panoptic segmentation algorithm [45]. Unlike semantic segmentation, panoptic segmentation not only provides pixel counts for each category but also identifies and counts individual instances within these countable categories. This dual capability enables a comprehensive and detailed image analysis.
We trained a model capable of inferring streetscape variables from images based on the Mask2Former structure [57] using a ResNet50 backbone [58]. The training dataset used was Mapillary Vistas v2.0 [59], which encompassed a comprehensive set of 124 feature categories (116 categories for panoptic segmentation). This training dataset was carefully selected due to its ability to effectively encapsulate most of the selected variables, which was central to the focus of this study. Moreover, we used a pre-trained panoptic segmentation model, also based on the Mask2Former structure but trained on the ADE20K dataset [60], to extract pixel values for indicators, including the view index of trees, shrubs, and grasses, and number-counting information, such as awnings.
Figure 8 shows the results of the panoptic segmentation applied to the images. These images were segmented based on models trained using both the Mapillary Vistas v2.0 (Figure 8a,b) and the ADE20K dataset (Figure 8c,d).
In addition to using GSV data, we utilized DRM data as a supplementary resource to quantify variables, such as leg numbers and the average crossing distance. To calculate the leg numbers, which represent the total number of segments intersecting at a specific crossing point, we counted the number of segments converging at each intersection point. For calculating the average crossing distance, which represents the difficulty people face when crossing streets in intersection areas, we measured the average number of drive lanes of the segments intersecting at the intersections. To facilitate this calculation, we retrieved the lane count classification from the DRM, which included four levels within the study area. We then assigned scores ranging from 1 to 4 to represent the gradation from the lowest to the highest level of the drive lane classification and calculated the average score to characterize the average crossing distance.

3.7. XGBoost Regression Analysis

For the regression analysis, we utilized the XGBoost machine learning algorithm [46] to explore the influence of eye-level streetscape factors on walking preferences.
XGBoost is a software library designed to be highly efficient in terms of computational speed and model performance by providing parallel-tree boosting. It optimizes Gradient Boosting Decision Tree (GBDT) training and dramatically improves the computational speed and model performance by conducting distributed computing. It attempts to accurately predict target variables by combining a set of simpler and more fragile model estimates. While this model performs better than its counterparts, it may encounter challenges, such as overfitting or the misjudgment of component weights, when exposed to a limited number of samples or certain model-specific factors.
XGBoost modeling provided two key insights. First, the relative importance of each predictor was identified, totaling 100%, using the mean-decreasing impurity. The Mean Decrease Gini method, based on the Gini impurity index [61], quantifies the effect of each independent variable on the dependent variable. Second, the model generated partial dependence plots (PDPs). These plots illustrate the relationship between a given predictor and the predicted walking preferences, considering interactions with other predictors.

4. Results

4.1. Results of XGBoost Model Training

This study was conducted using Python within the PyCharm Integrated Development Environment, version 2022.0.2. We employed the XGBRegressor module from the XGBoost library for our regression analysis, aiming to train separate models to explore the non-linear impacts of eye-level streetscape factors on walking preferences across various categories of street segments and intersections. To ensure the performance of the models, we employed GridSearchCV from scikit-learn to adjust the parameters. Table 4 presents an overview of the optimal parameter configurations for all models. We used the pseudo-R-squared as the assessment metric to evaluate the training performance of the models. In total, six models were developed. Among them, three models focused on street segments—specifically arterial street segments, collector street segments, and local street segments—with R-squared values of 0.38, 0.41, and 0.31, respectively. The other three models targeted intersections connected to arterial streets, collector streets, and local streets, achieving R-squared values of 0.35, 0.39, and 0.29, respectively.

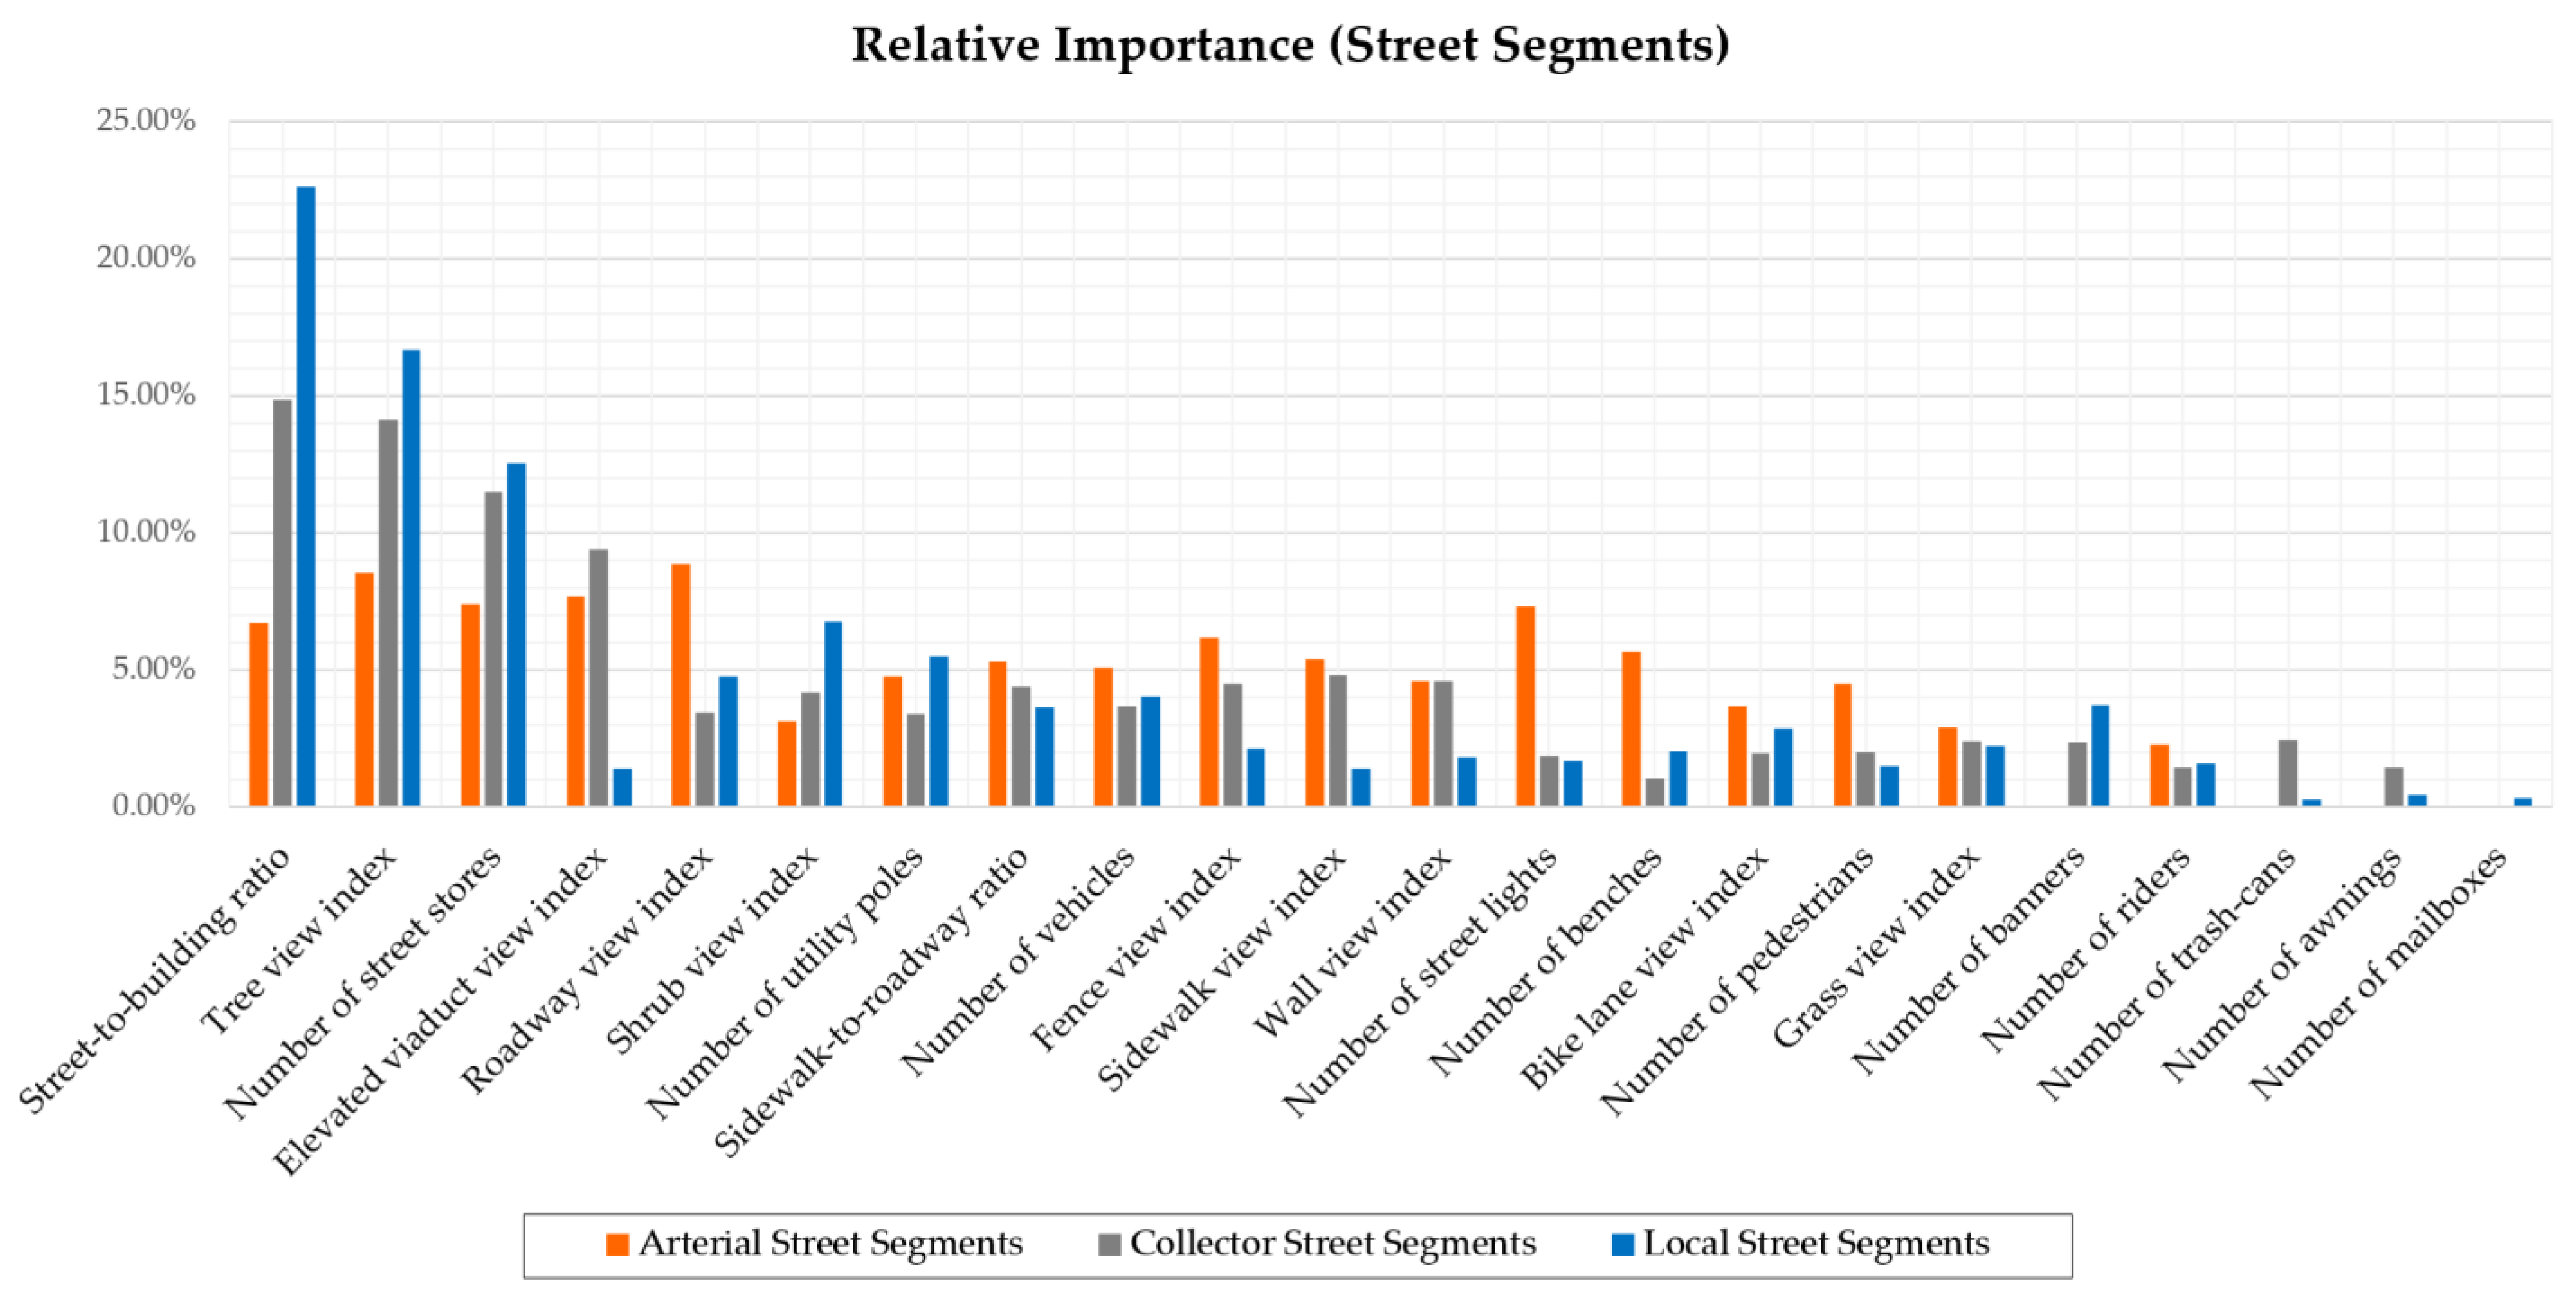
4.2. Results for Relative Importance

Figure 9 delineates the relative importance of eye-level streetscape variables in predicting walking preferences across street segments. As depicted in Figure 9, skeletal and detailed streetscape factors based on arterial street segments, collector street segments, and local street segments explain 12.042% and 87.958%, 19.333% and 80.667%, and 26.273% and 73.727% of the variance, respectively.
Specifically, for arterial street segments, the roadway view index was a key factor, with a significant impact of 8.847%, followed by the tree view index (8.529%) and elevated viaduct view index (7.657%). Other significant variables included the number of street stores (7.428%) and number of street lights (7.325%). In terms of collector streets, the most influential variables impacting walking preferences were the street-to-building ratio (14.850%), tree view index (14.154%), number of street stores (11.505%), elevated viaduct view index (9.416%), and sidewalk view index (4.822%). For local streets, in addition to the street-to-building ratio, tree view index, and number of street stores, the shrub view index and number of utility poles are also key influencing factors. Conversely, the presence of trash cans, mailboxes, and awnings exerted a lesser effect on walking preferences across nearly all categories of segments, indicating their lower predictive power for walking preferences.
In the analysis of street intersections (Figure 10), we observed that the proportions of skeletal factors and detail factors at intersections linked to arterial streets, collector streets, and local streets were found to be 8.791% and 91.209%, 5.035% and 94.965%, and 13.64% and 86.36%, respectively.
For arterial street intersections, the elevated viaduct view index was the most influential factor, accounting for an importance of 16.046%. This was closely followed by the tree view index at 15.483% and crosswalk view index at 6.884%. These three factors also stand out as key determinants for collector street intersections. Meanwhile, at local street intersections, the predominant factors included the number of intersection legs (13.638%), the grass view index (9.383%), and the crosswalk view index (8.397%). In contrast, across all categories of intersections, factors, such as the number of stop lines, riders, and pedestrian traffic lights, had a considerably lower impact on walking preferences.

4.3. PDP Results

The PDP depicts a fine-grained analysis of the relationship between independent and dependent variables. For each plot, the X-axis shows the distribution and variation of the independent variable, and the Y-axis represents the level of walking preference.

4.3.1. Skeletal Streetscapes in Segment Sections

Figure 11 illustrates the non-linear effects of skeletal streetscape factors on walking preferences within street segments. The plot revealed an inverted U-shaped pattern for the street-to-building ratio based on arterial street segments (Figure 11a). When the ratio ranged from 0.5 to approximately 1.3, a positive correlation with the walking preference was observed. However, when the ratio exceeded 1.3, the positive impact began to plateau, indicating a diminishing influence on the walking preference. Furthermore, when the ratio exceeded 3, walking preferences were adversely affected. This observed pattern can be compared with studies examining the distance-to-height (D/H) ratio [62], which contrasts the street width with building height. This non-linear trend is not unique to arterial street segments but is also observed in other segment categories, suggesting that certain skeletal factors have a universal impact on walking preferences across different categories of street segments.
Another skeletal streetscape factor, the sidewalk-to-roadway ratio (Figure 11b), displayed a threshold effect as well, particularly on collector streets and arterial streets. The beneficial effects on walking preferences increase until the ratio reaches around 0.5 for both arterial and collector street segments, after which the marginal benefits significantly decline. This indicates that there is an optimal proportion of the sidewalk width to roadway width based on arterial and collector street segments that encourages pedestrian preferences, beyond which the added value decreases. However, variations in the sidewalk-to-roadway ratio have a less pronounced impact on walking preferences for local streets.

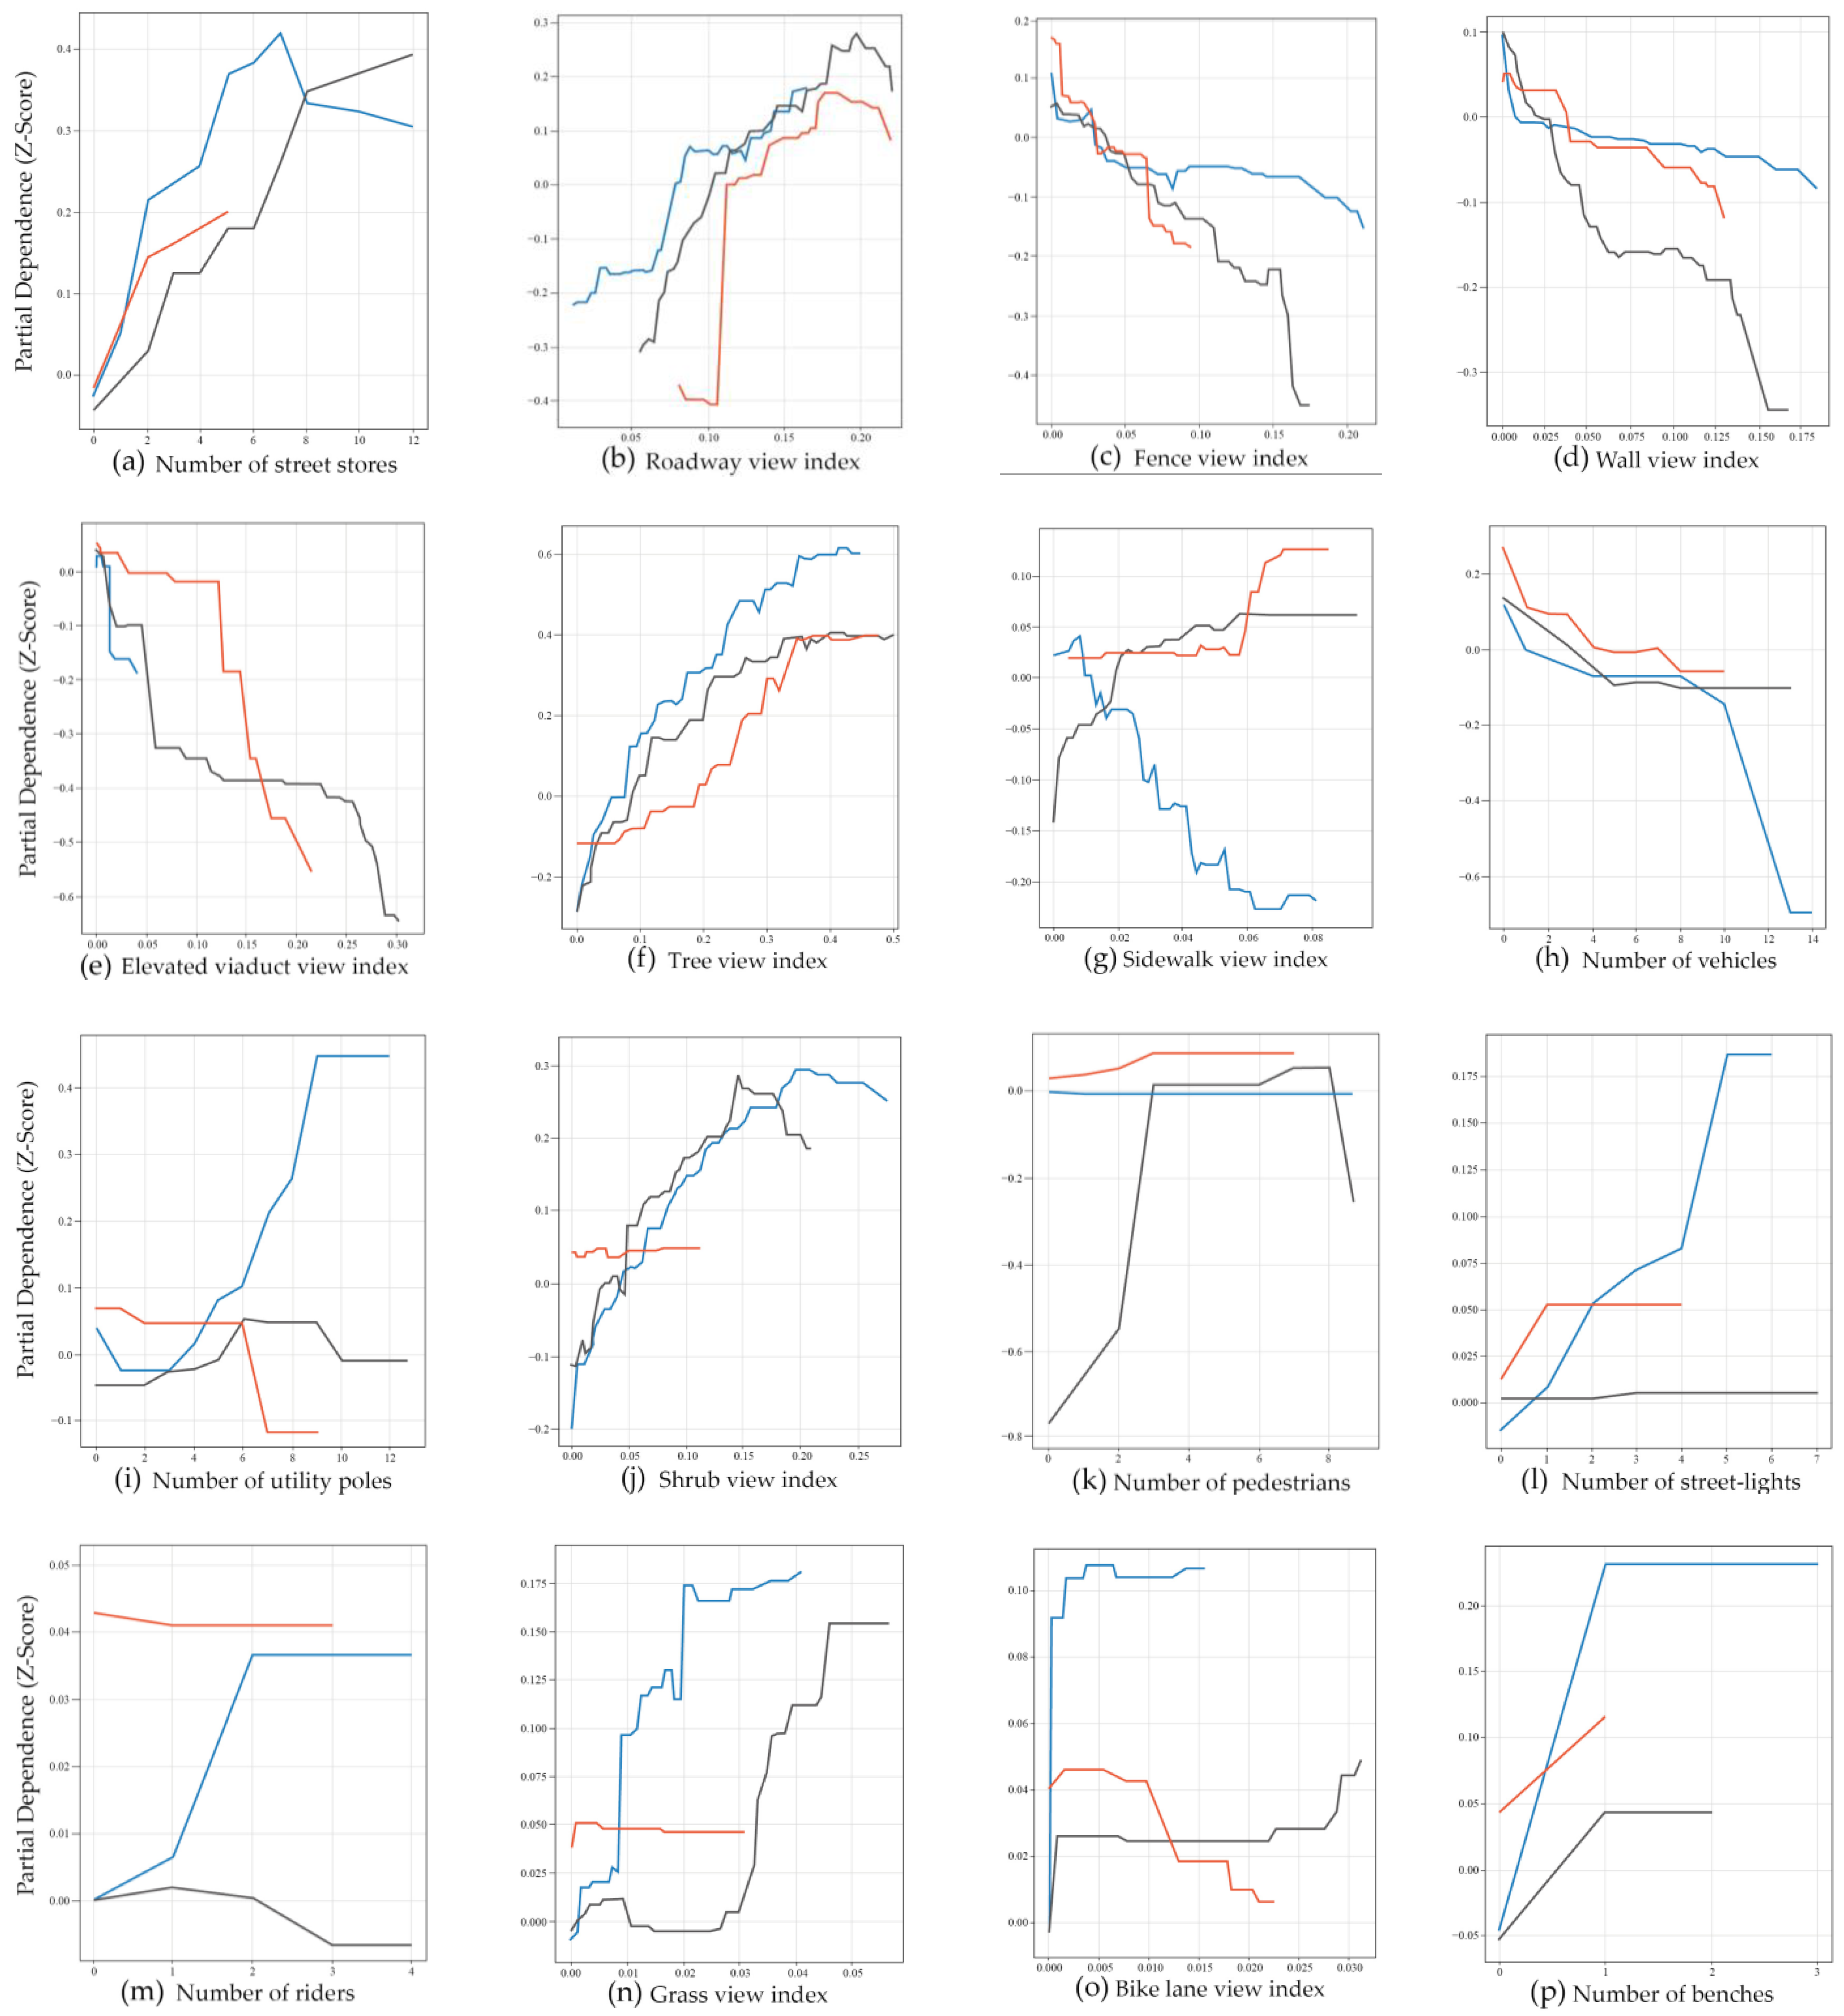
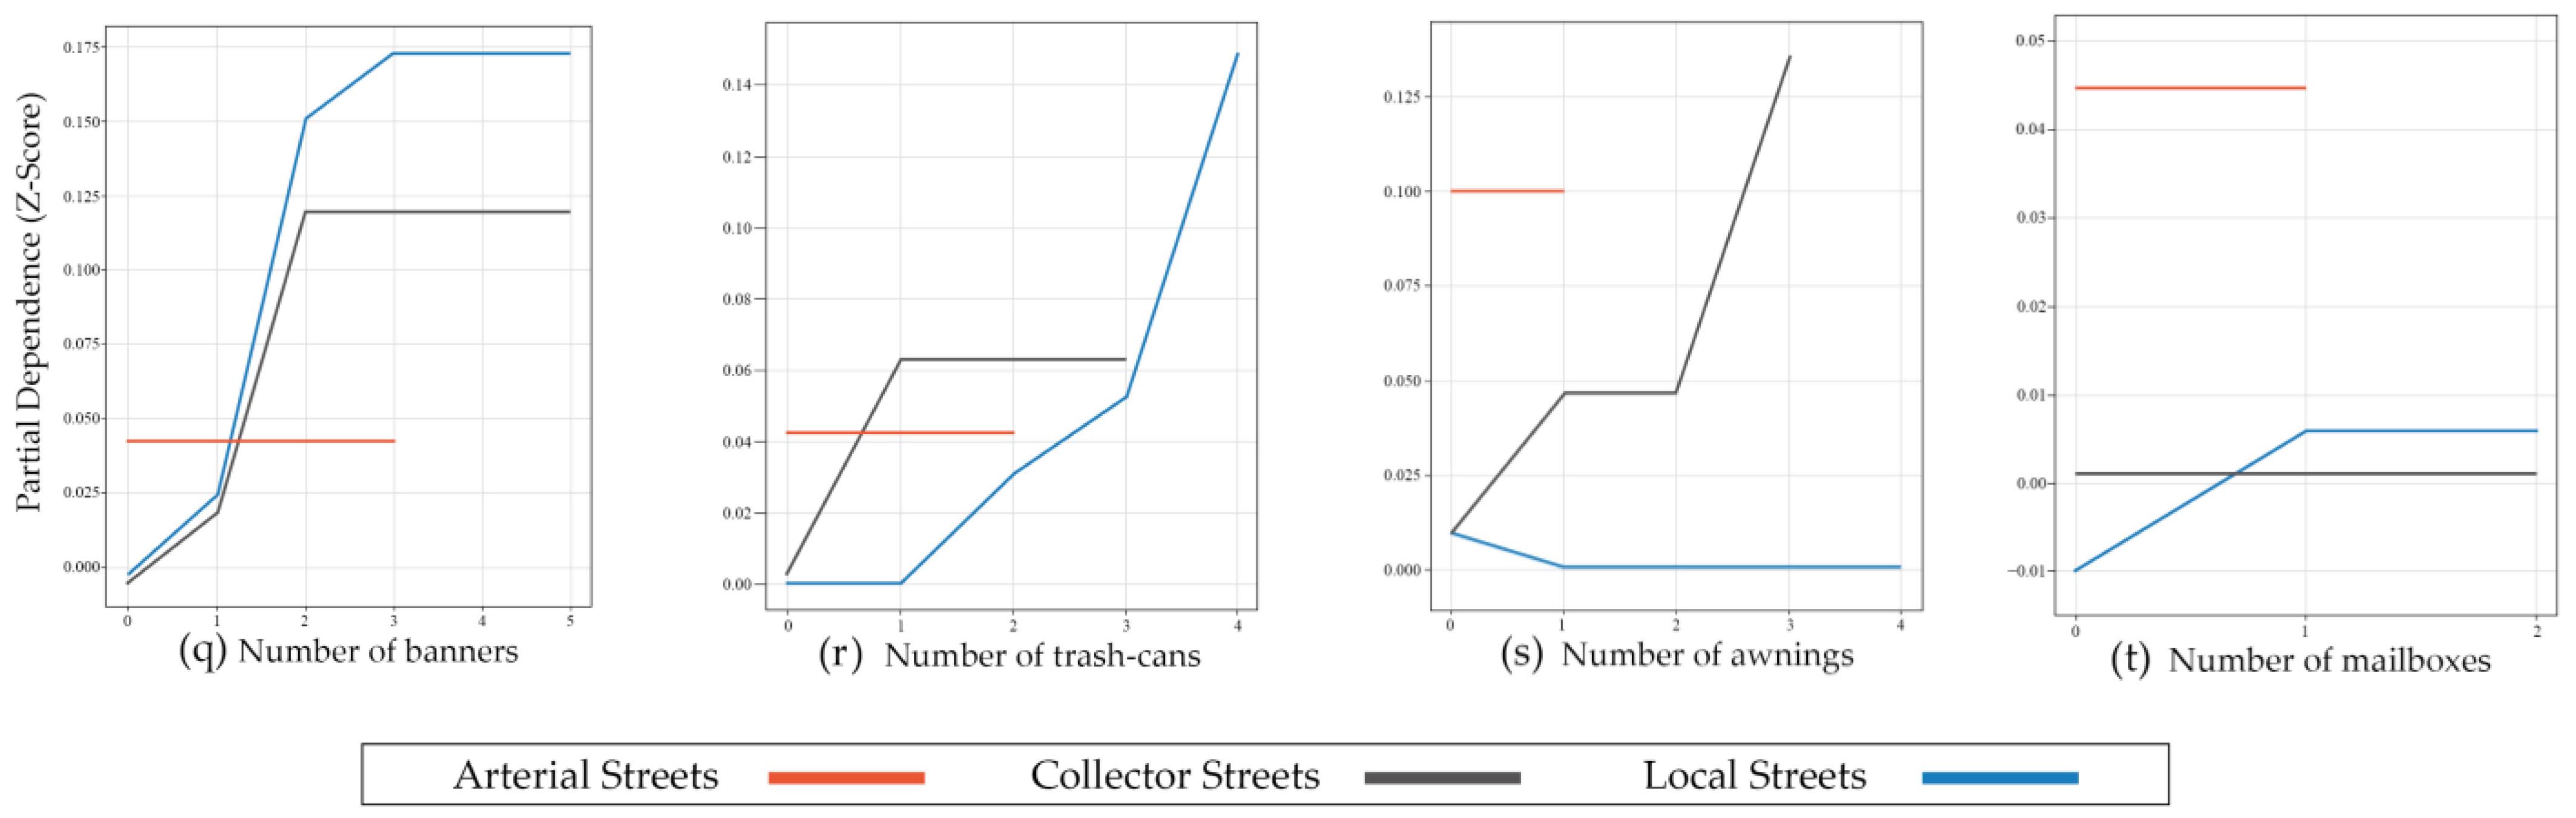
4.3.2. Detailed Streetscapes in Street Segments

Figure 12 shows the influence of detailed streetscape factors on walking preferences across different categories of street segments. Initially, several factors reveal consistent patterns that either enhance or discourage walking in specific street categories. For instance, the increase in street stores (Figure 12a) on both arterial and collector streets demonstrated a predominantly positive effect, indicating that when this factor is more visible, it makes walking more attractive. Likewise, the visibility of the roadway (Figure 12b) has a reliably positive effect on the walking preference on local street segments, despite displaying a different trend in the other segment categories. On the other hand, factors, like the fence (Figure 12c), wall (Figure 12d), and elevated viaduct view index (Figure 12e), tend to discourage walking across almost all segment categories, indicating an overall negative impact on the desire to walk.
Additionally, we observed clear threshold effects for some detailed streetscapes. Factors, like the tree view index (Figure 12f) and sidewalk view index (Figure 12g), on arterial street segments and collector street segments show an inverted L pattern. Specifically, enhancing the visibility of trees to around 0.32 on arterial, 0.31 on collector, and 0.35 on local street segments has a positive effect on people’s preference to walk. However, after reaching these visibility levels, the additional advantage of more tree visibility for walking preferences markedly diminishes (Figure 12f). For the sidewalk view index (Figure 12g), on arterial and collector street segments, visibility within the range of 0.06 to 0.07 and from 0 to 0.06 positively influences walking preferences. Beyond these ranges, any increase in visibility does not have a significant impact. However, the trend in variations in the sidewalk view on local street segments shows a different trend (Figure 12g), presenting a left-slanted L pattern in its impact on walking preferences. This left-slanted L pattern is also observed in factors, such as the number of vehicles (Figure 12h) across all segment categories and the number of utility poles (Figure 12i) on arterial street segments.
Moreover, an inverted U-shaped pattern can be identified in certain detailed streetscape factors, such as the shrub view index (Figure 12j) based on collector and local street segments and the number of pedestrians (Figure 12k) based on collector street segments. Regarding the shrub view index (Figure 12j), changes in visibility within the ranges of 0–0.15 for collector street segments and 0–0.2 for local street segments positively influence walking preferences. However, surpassing these tipping points leads to a negative impact on walking preferences. The number of pedestrians (Figure 12k) on collector street segments has a positive influence on walking preferences up to a count of eight, after which it starts to have a negative effect, highlighting a balance point beyond which more pedestrians become a deterrent rather than an encouragement to walk on collector streets. Other factors that exhibit a similar pattern include the roadway view index (Figure 12b) based on arterial and collector street segments and the number of street stores (Figure 12a) based on local street segments.

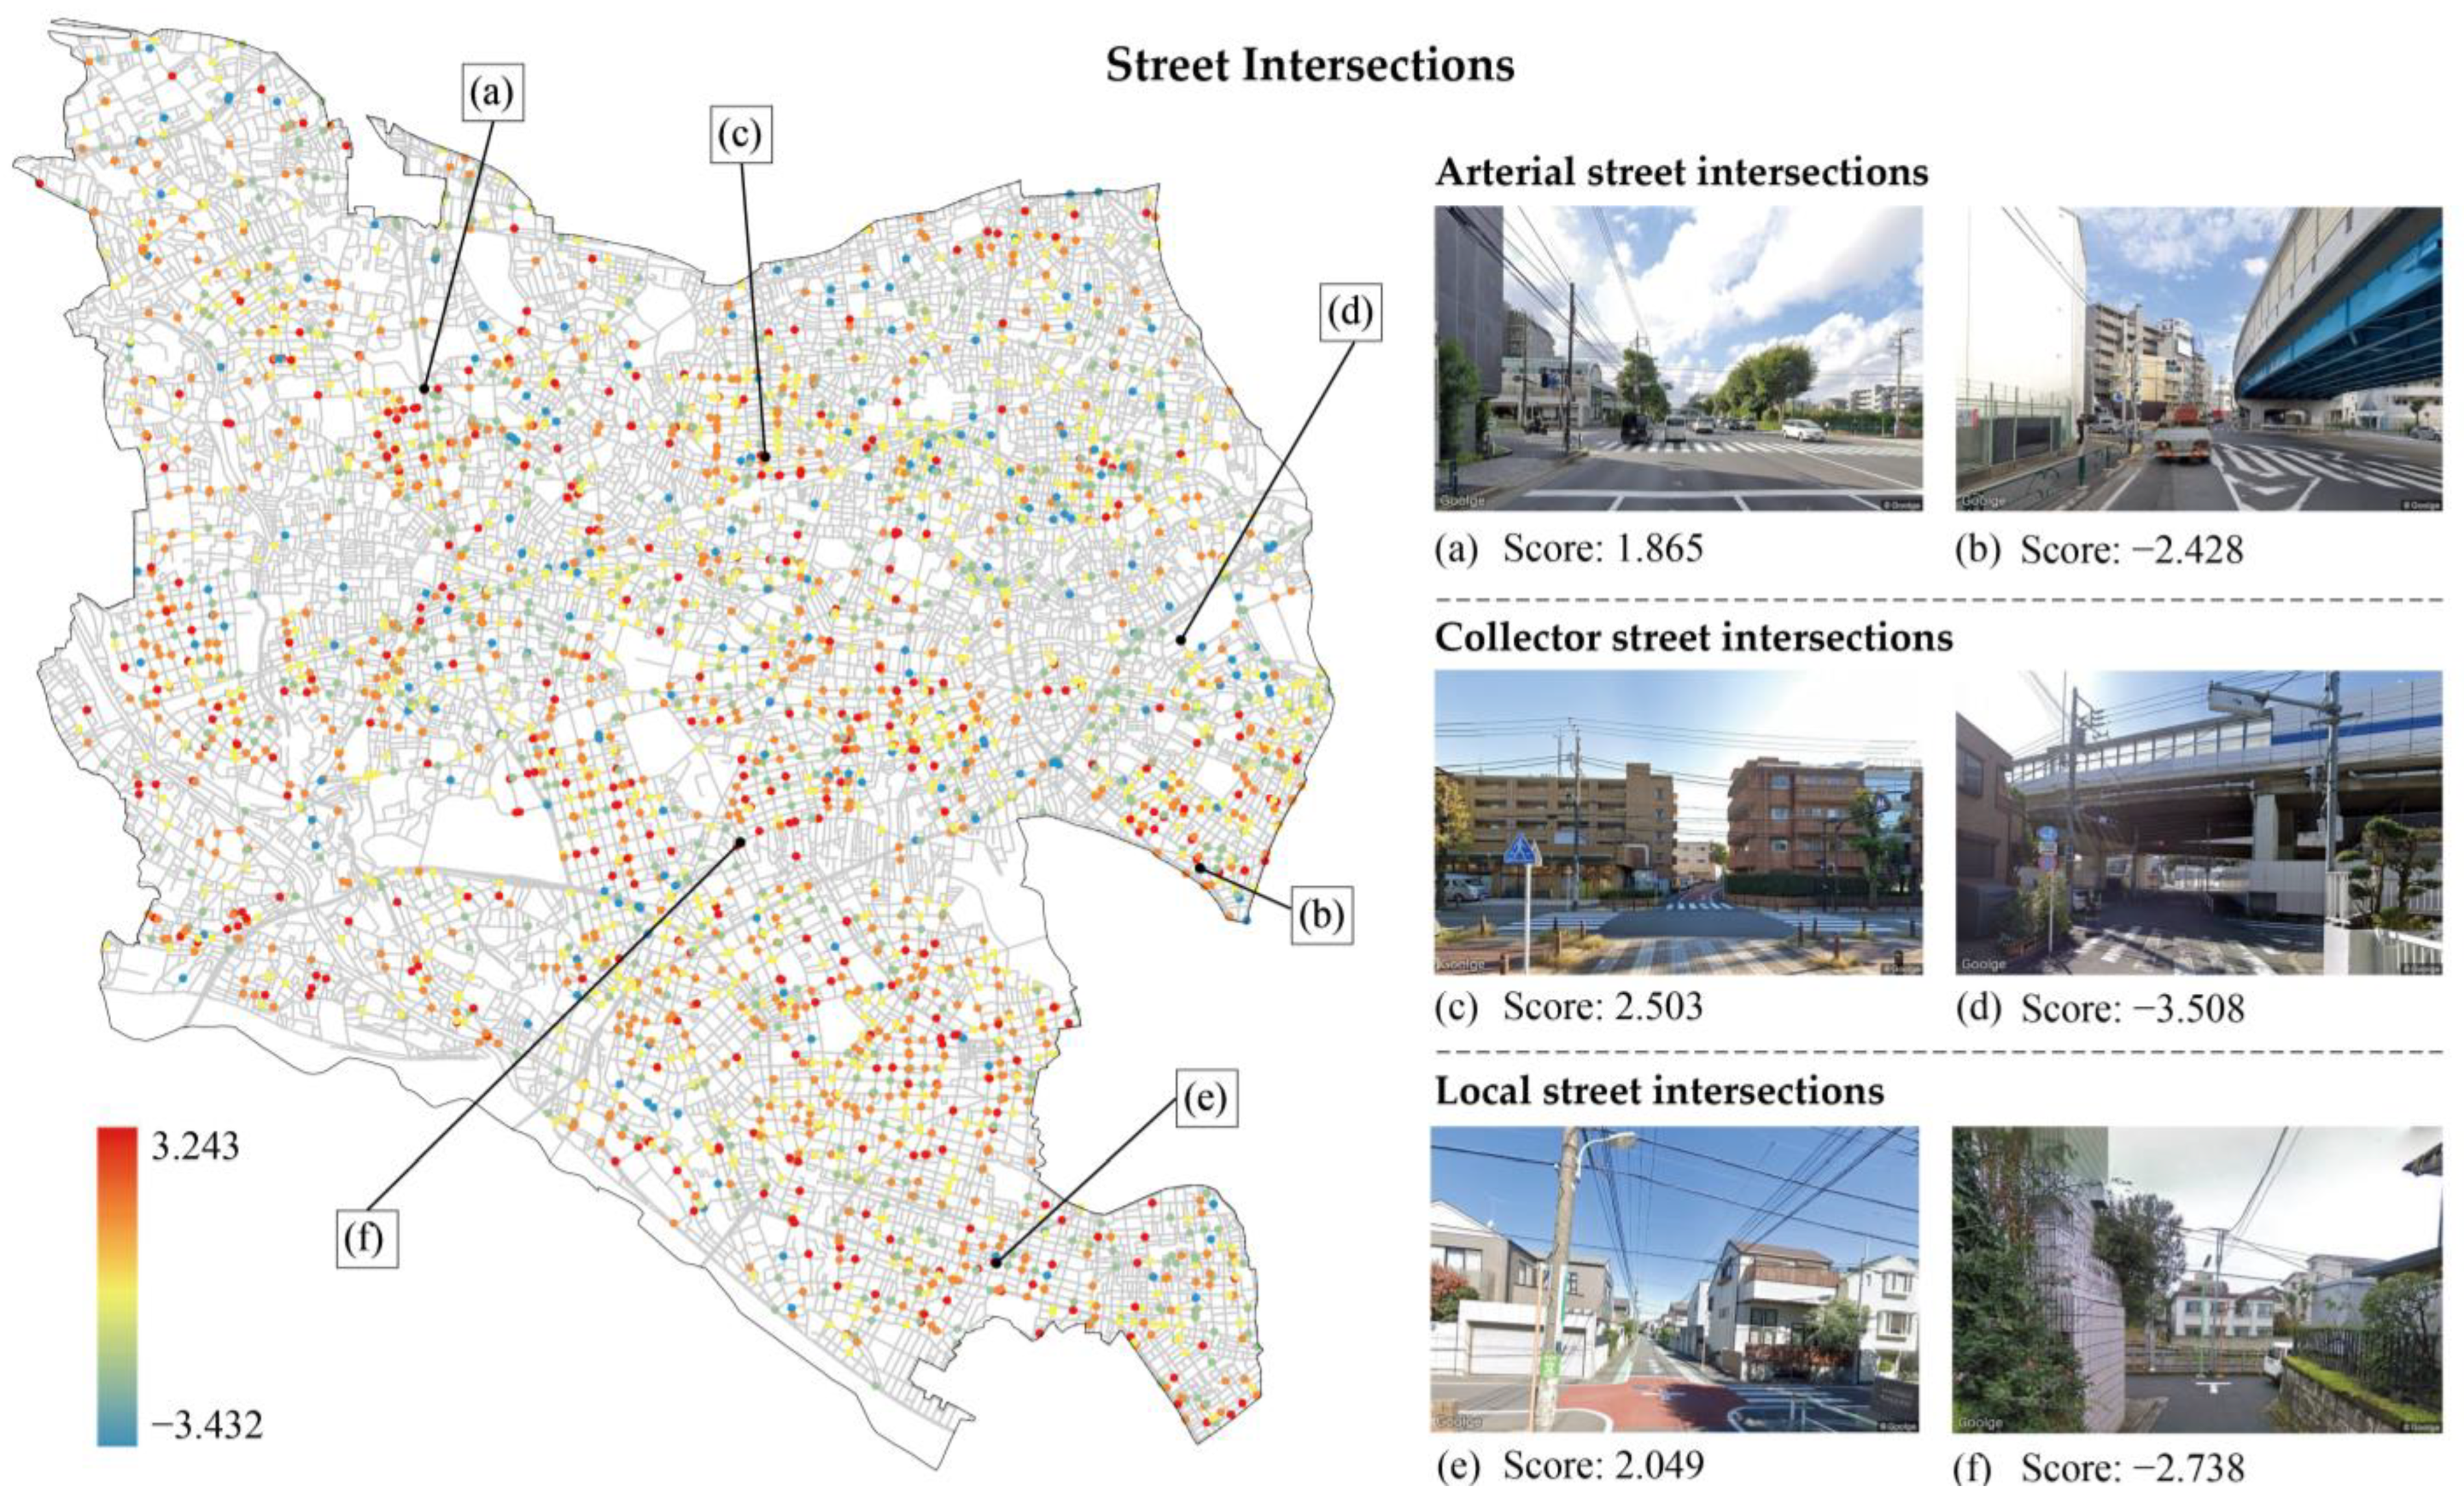
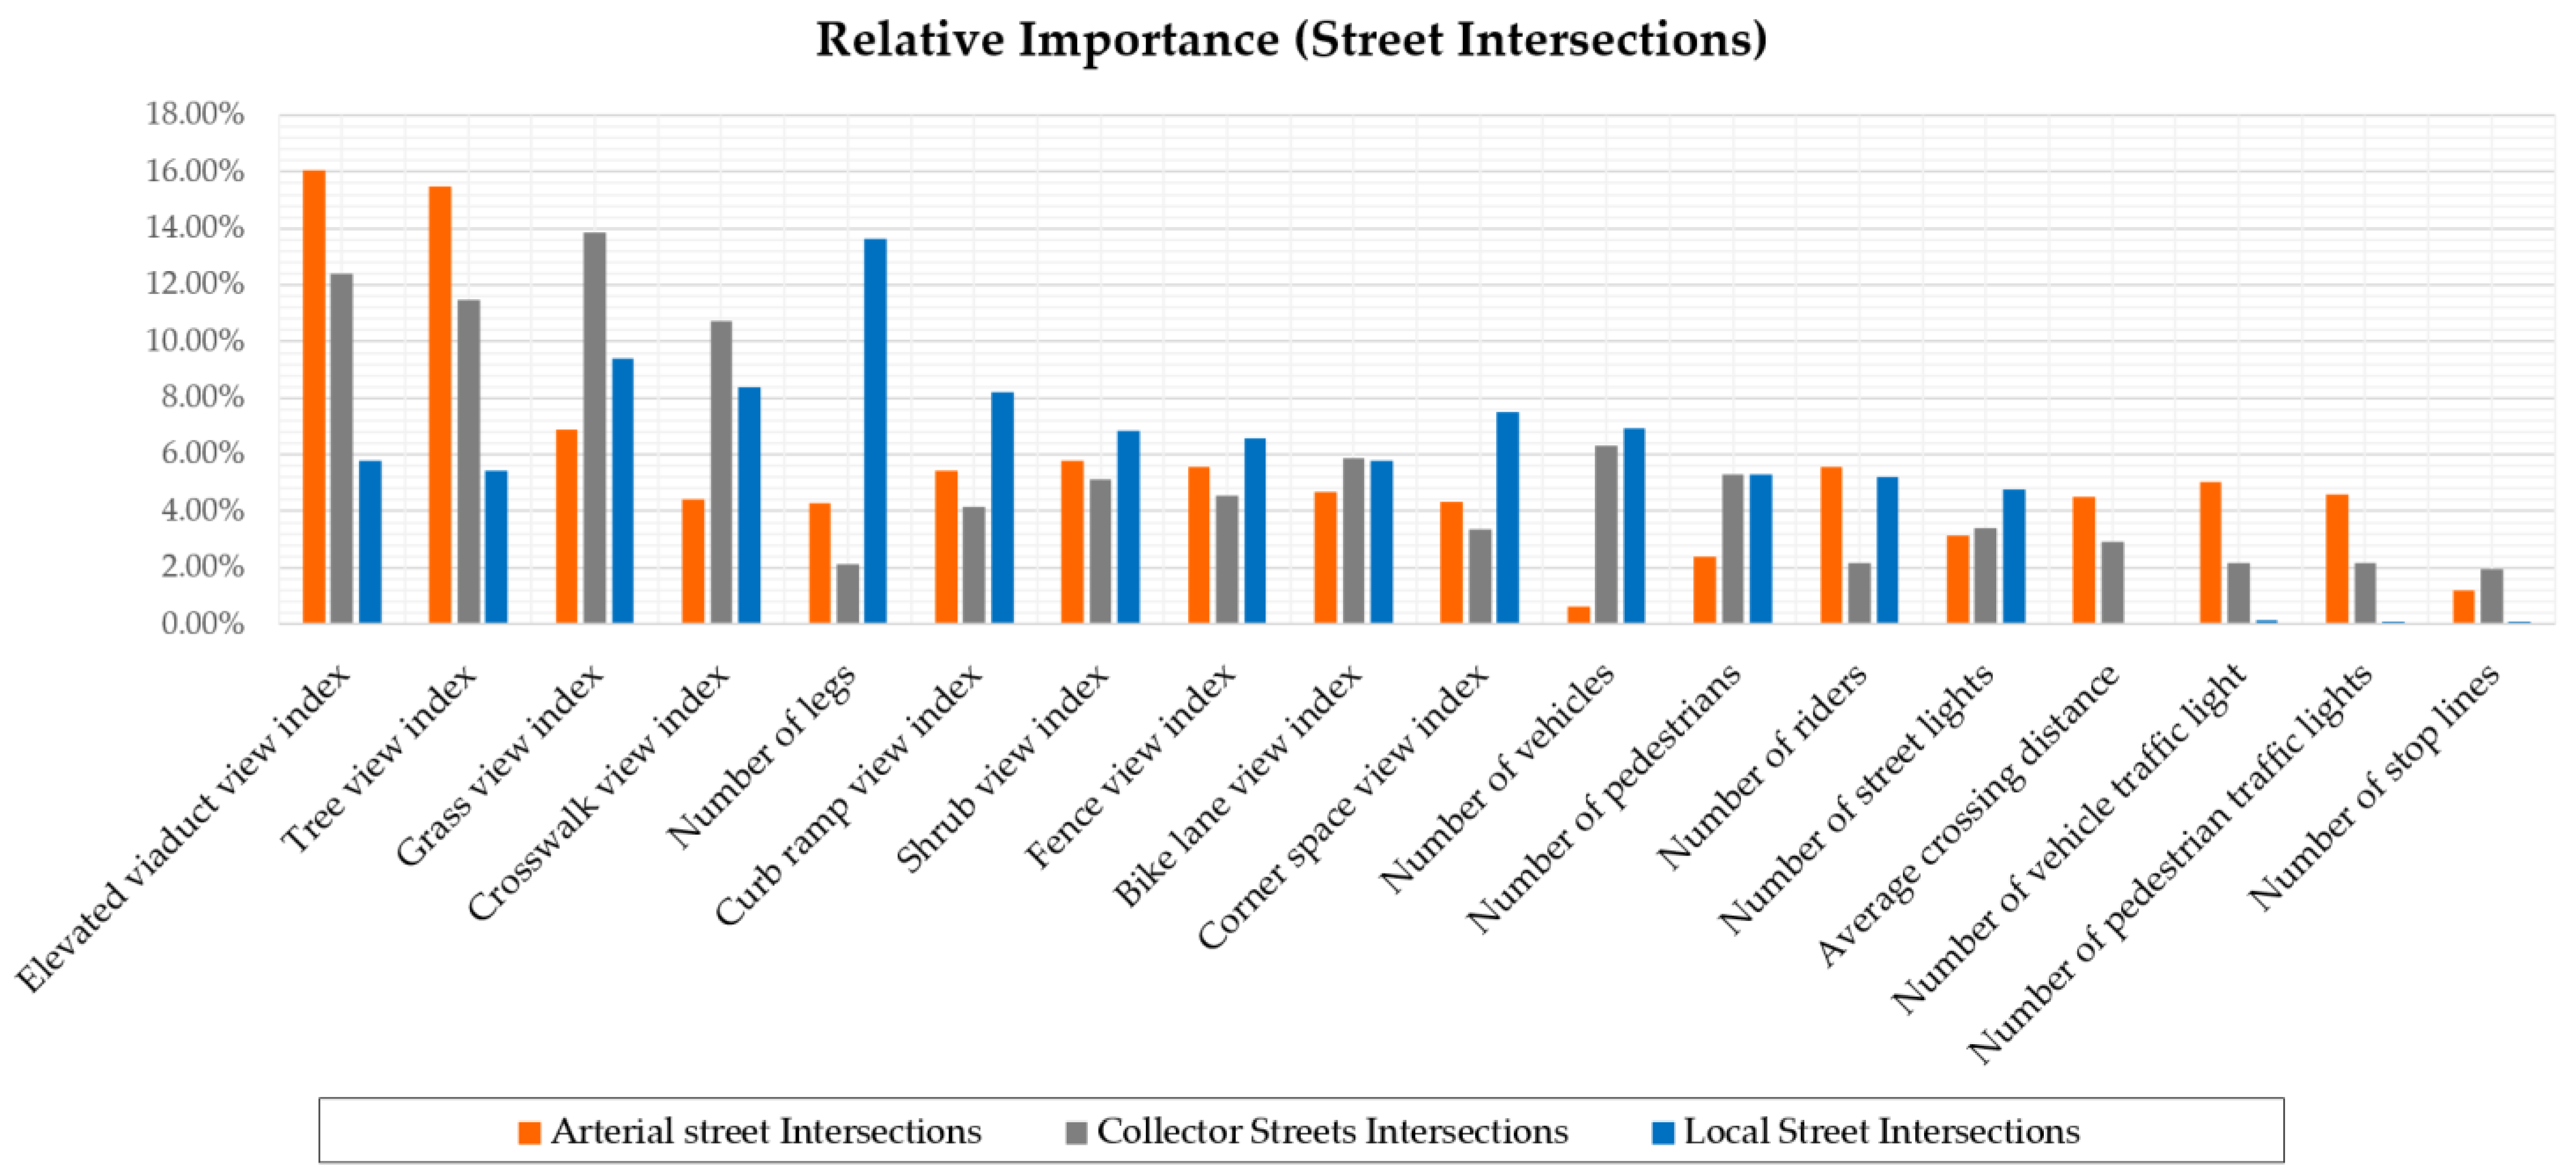
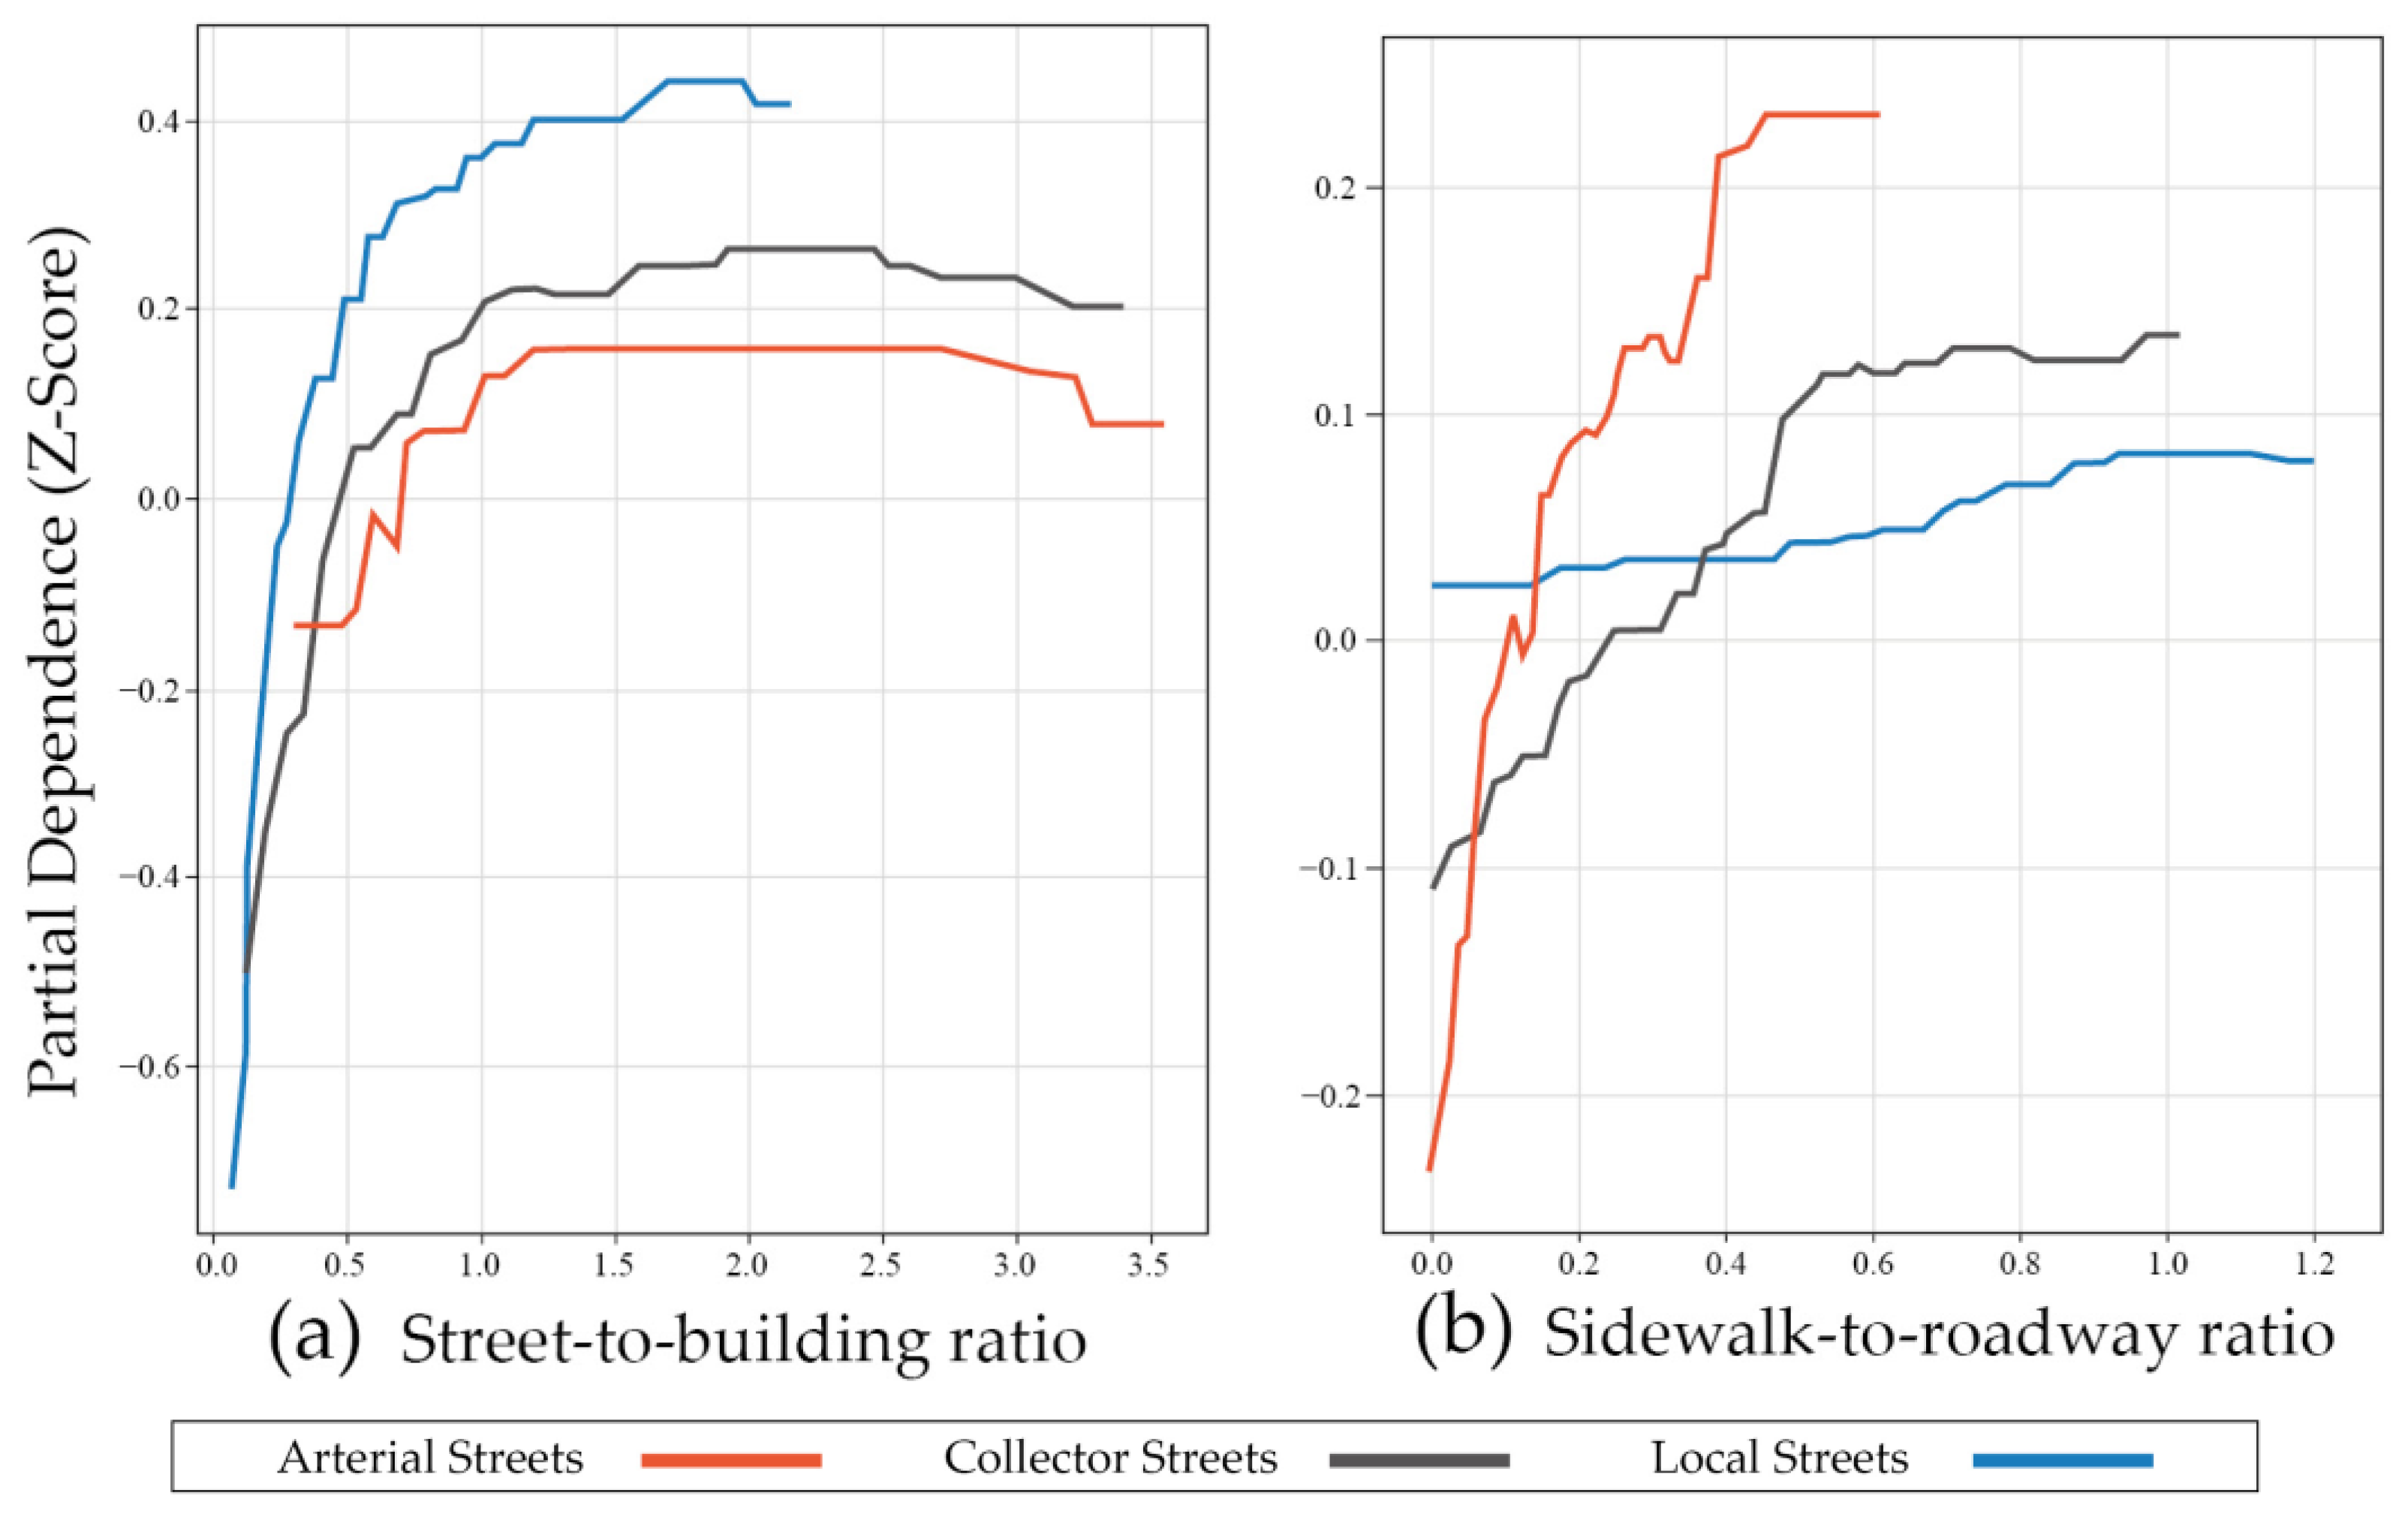
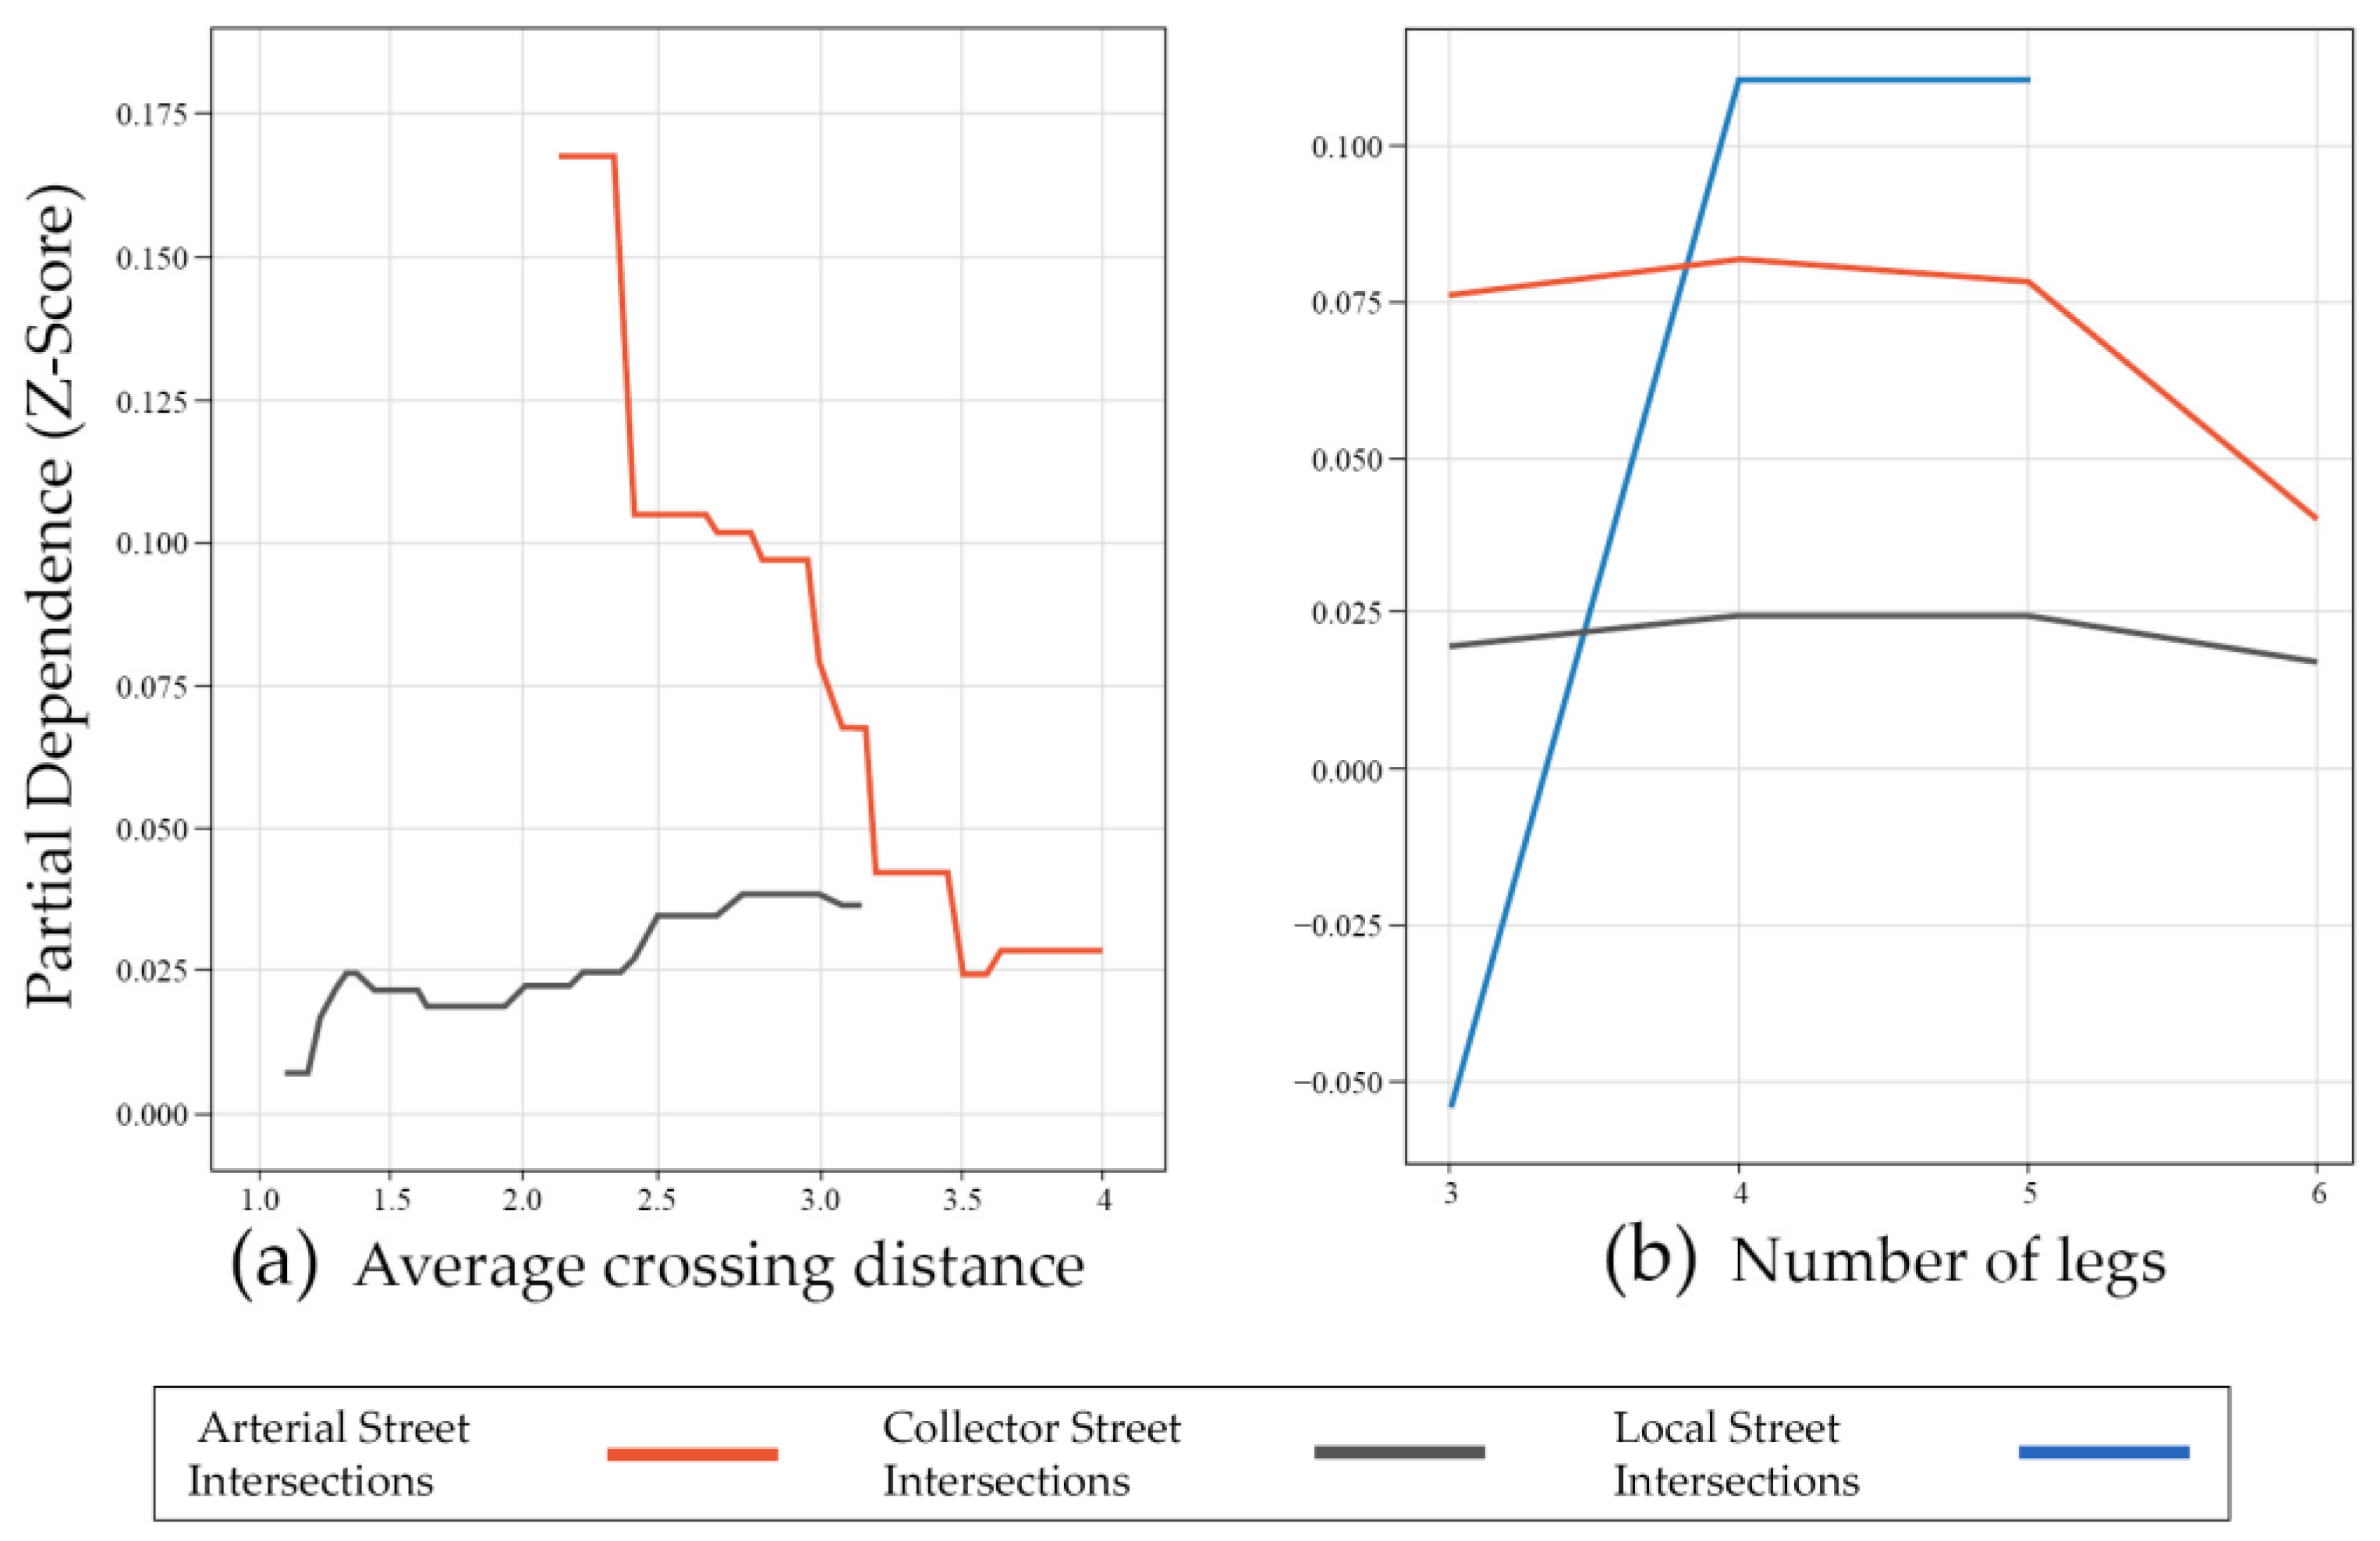
4.3.3. Skeletal Streetscapes in Street Intersections

Figure 13 depicts the impact of skeletal streetscape factors on walking preferences at street intersections of varying categories. For arterial street intersections, the average crossing distance (Figure 13a) showed a generally decreasing preference for walking, indicating that larger average crossing distances are associated with lower walking preference. Conversely, for collector street intersections, a greater crossing distance tends to enhance walking preferences, up to a score of 2.7. However, for local street intersections, this variable did not vary because the values at this category of intersections were consistent. Therefore, it did not have an impact on walking preferences. Regarding the number of intersection legs (Figure 13b), a notable inverted-L pattern was observed based on local street intersections. Intersections with four legs have been observed to positively influence walking preferences. However, an increase beyond this number does not contribute to further enhancements in walking preferences. A different trend is observable for both arterial and collector street intersections, where the presence of four legs also acts as a tipping point. Beyond this level, an increase in the number of legs is found to have a negative impact on walking preferences, a trend that is particularly pronounced for arterial street intersections.

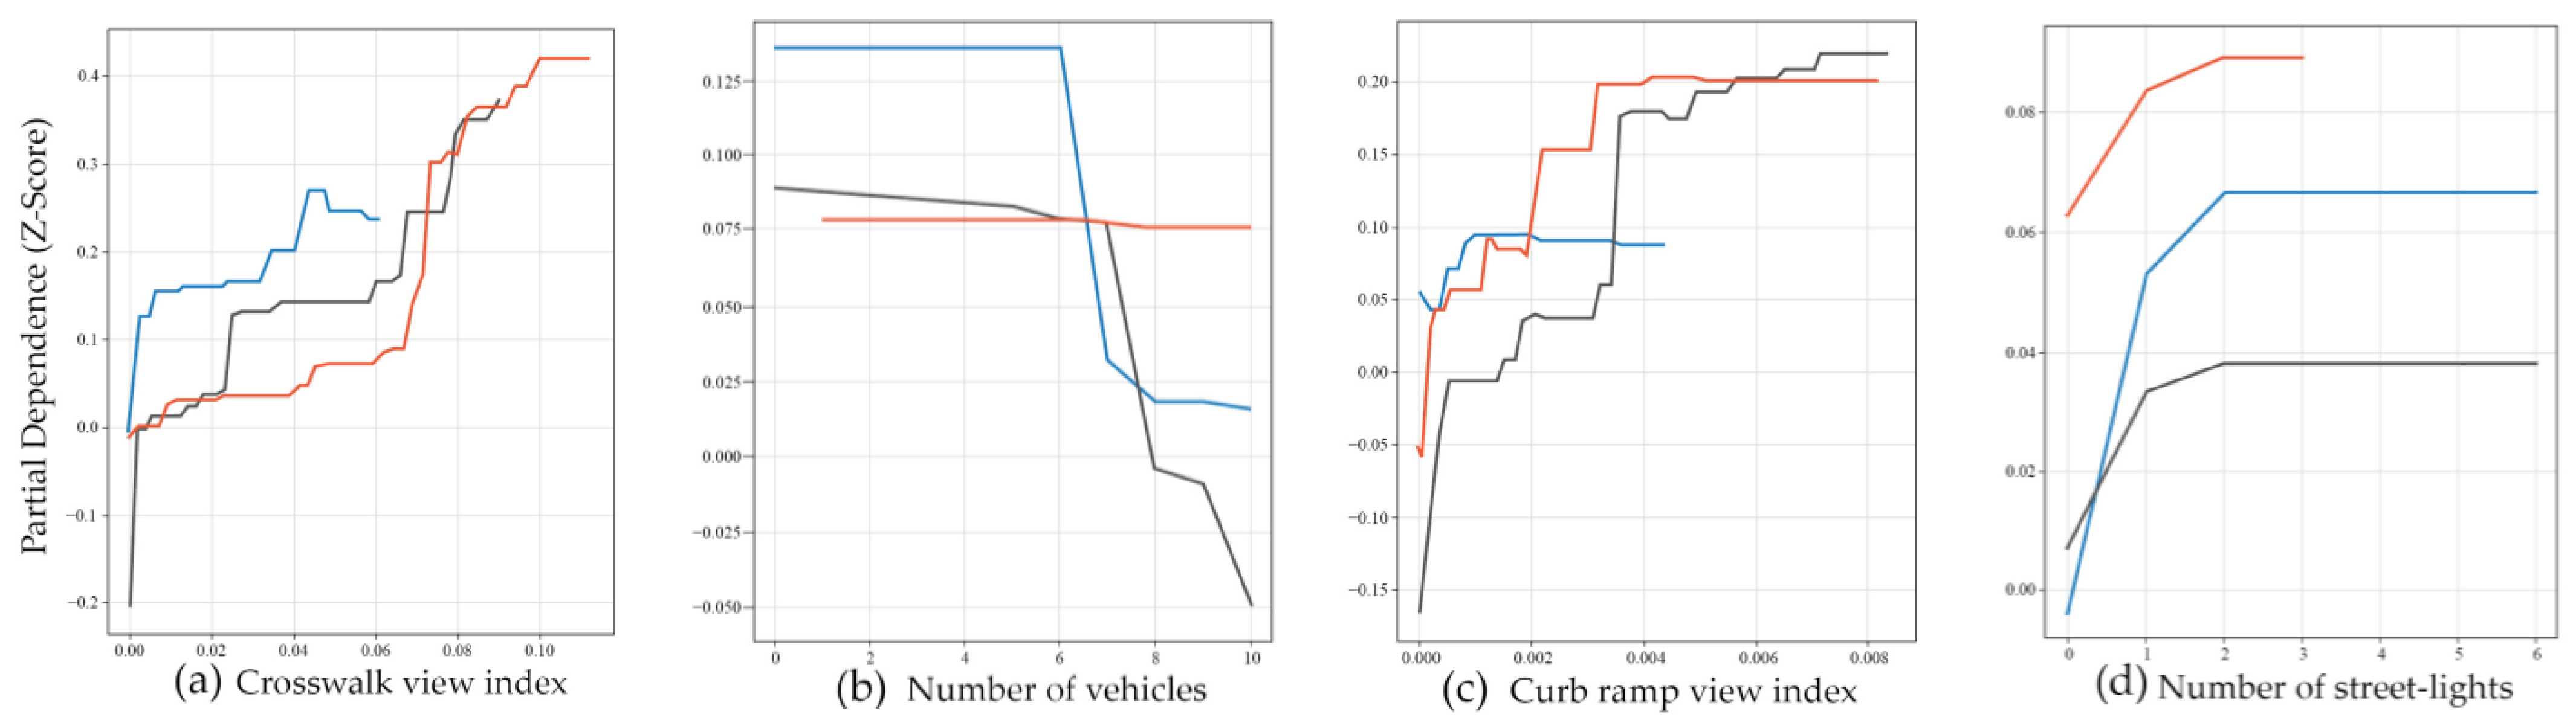
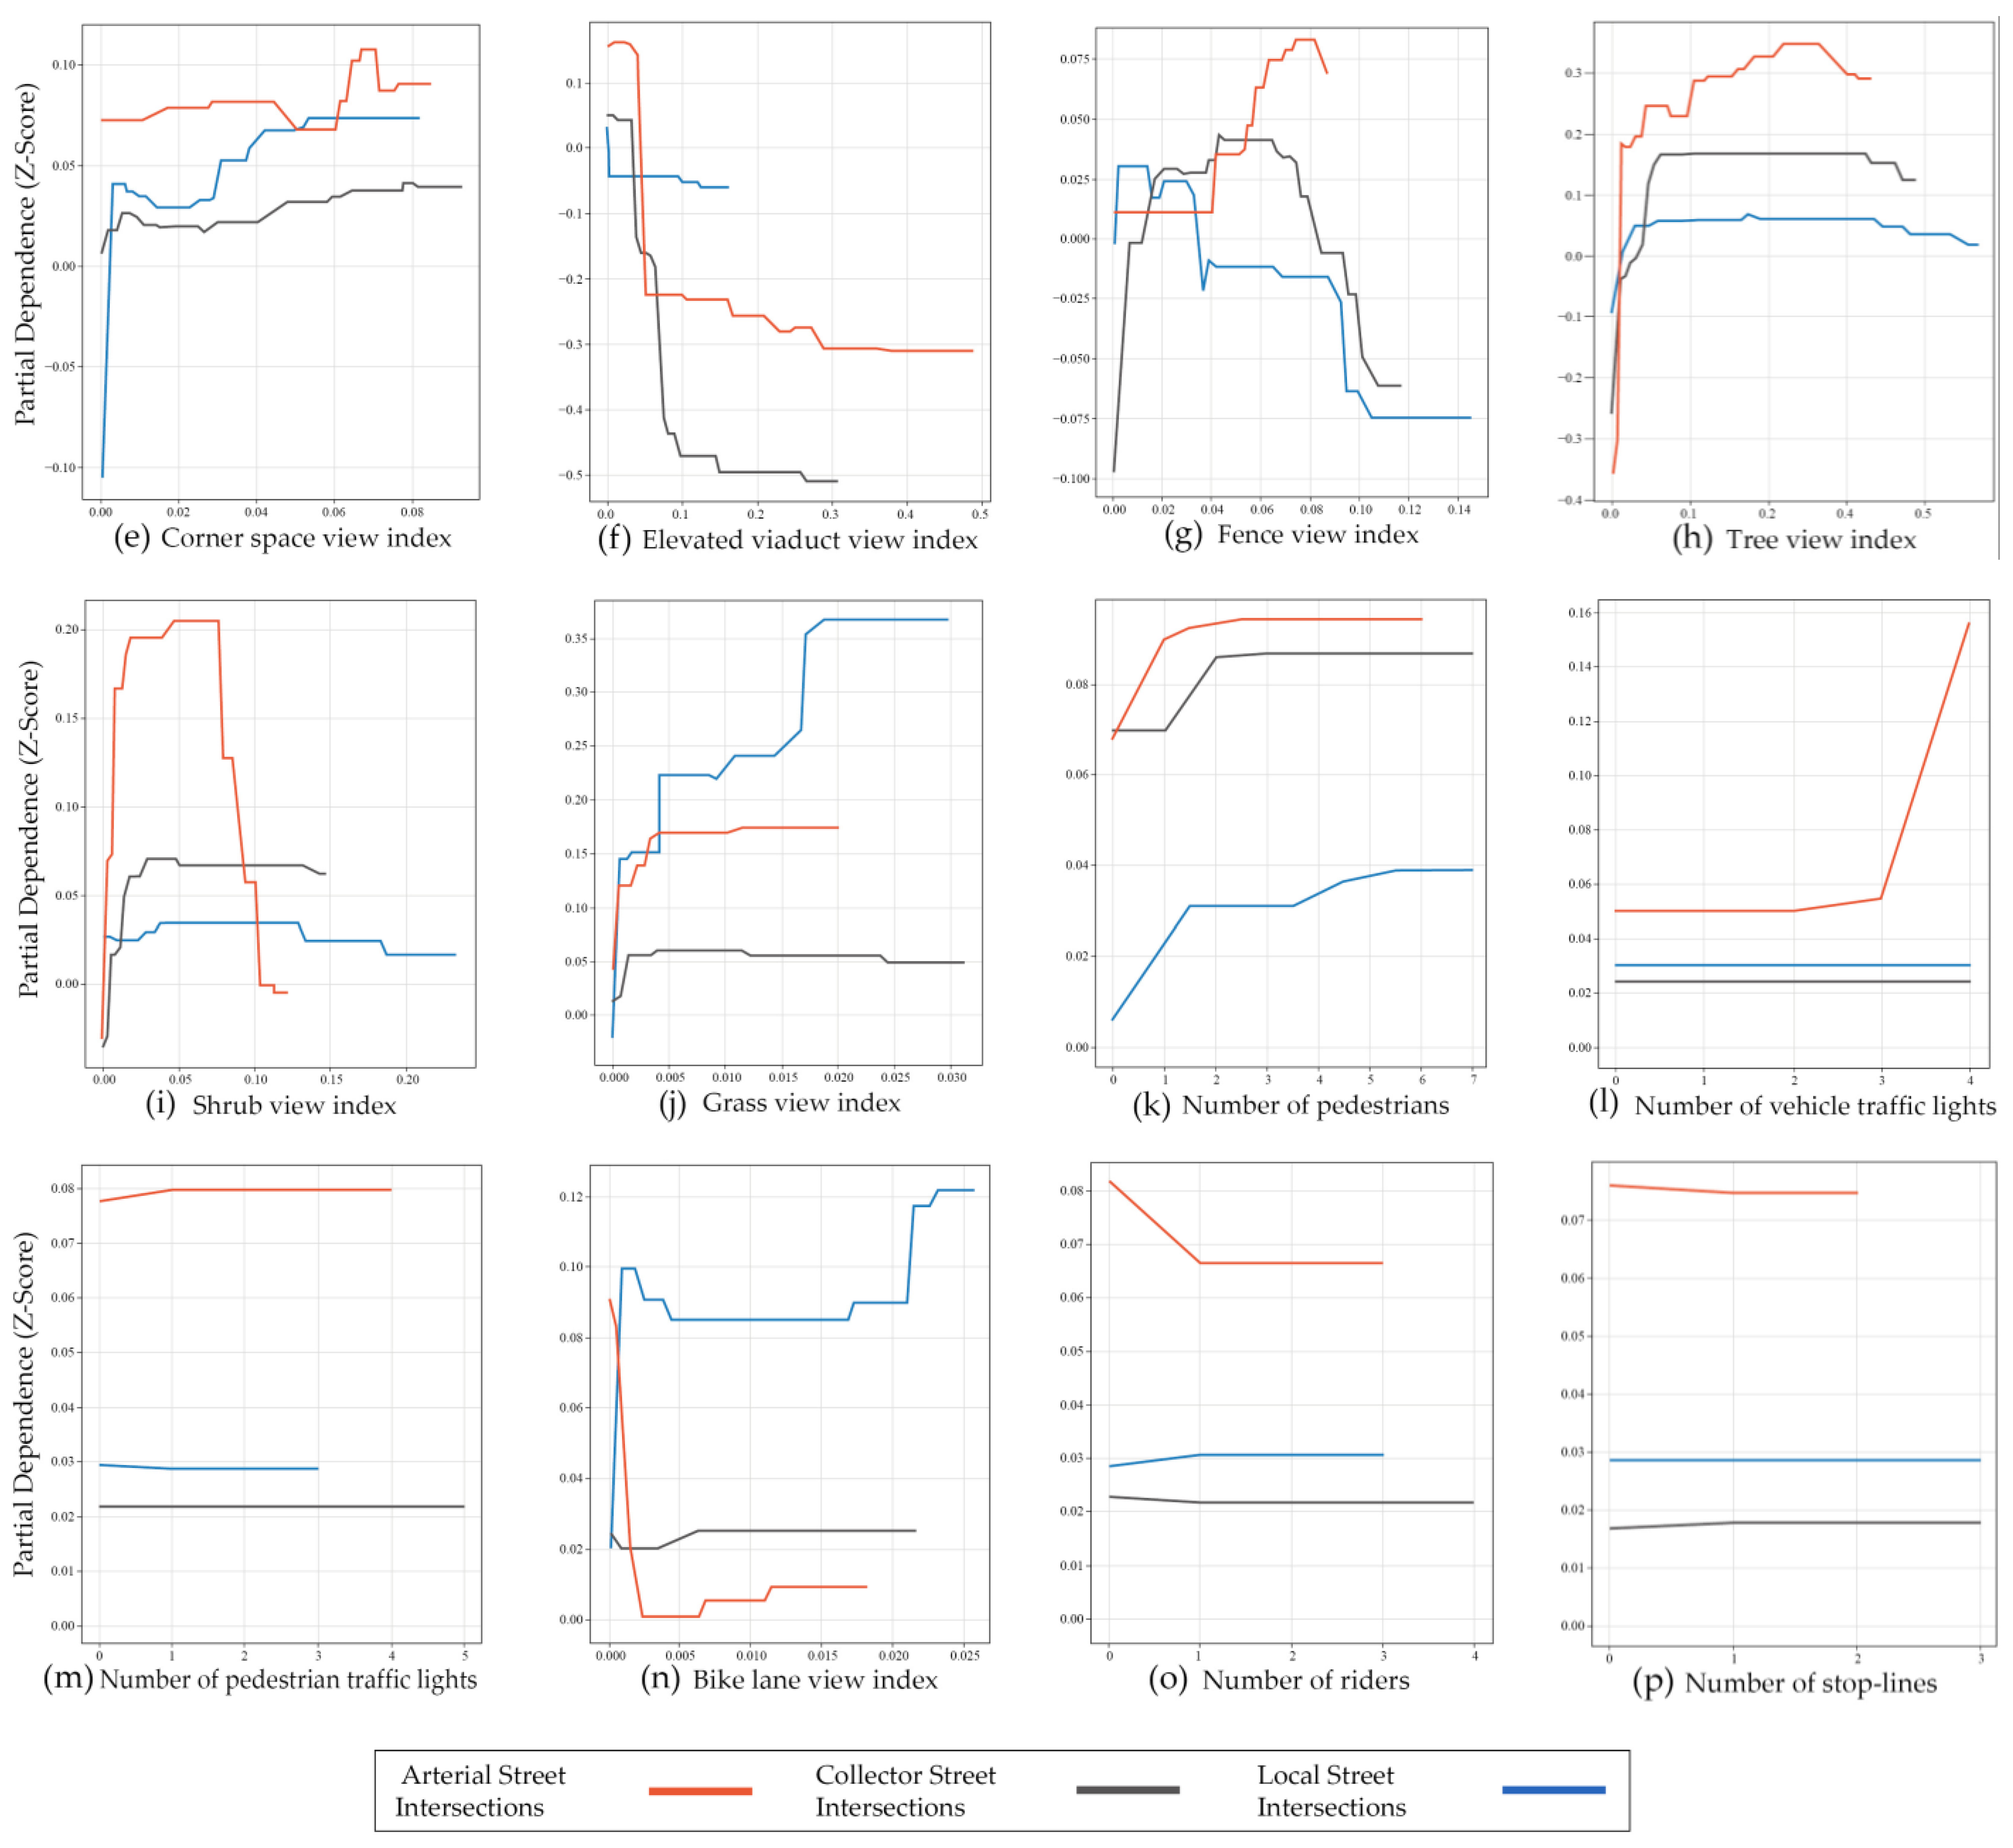
4.3.4. Detailed Streetscapes in Street Intersections

In the detailed streetscape analysis of street intersections, factors, such as the crosswalk view index (Figure 14a), across intersections of all categories exhibited an overall positive correlation with walking preferences, reflecting that the number of marked crossings was positively correlated with perceived safety levels [63,64]. Conversely, factors, like the number of vehicles (Figure 14b), at intersections interacting at collector streets exhibited a contrasting trend, showing that a higher presence of vehicles negatively impacts walking preferences.
Factors, such as the curb ramp view index (Figure 14c), the number of street lights (Figure 14d), and the corner space view index (Figure 14e), exhibited inverted L-shaped patterns in relation to walking preferences. Specifically, the curb ramp view index exhibited a positive correlation within specific ranges: from 0 to 0.002 at arterial and collector street intersections, and from 0 to 0.001 at local street intersections; however, beyond these thresholds, the marginal effect was significantly diminished. This trend can be understood as the strategic positioning of curb-ramp visibility at intersection corners aiding the transition from the sidewalk to street level [63] and offered accessible routes for people with physical disabilities, as well as for those using shopping carts or strollers [65]. However, an excessive visibility of the ramp facility did not bring additional benefits. Additionally, a left-slanted L pattern can also be identified in some detailed factors, such as the elevated viaduct view index (Figure 14f), which exhibits a decreasing trend within specific ranges and then leveling off across all categories of intersections. This trend diverges from the pattern observed along street segments, where the elevated viaduct view index (Figure 12e) tends to exhibit a nearly negative correlation with walking preferences on street segments.
Regarding factors, such as the fence view index (Figure 14g), an inverted U-pattern can be detected. Specifically, the observed trend indicated a significant positive correlation with walking preferences within specific ranges: from 0.04 to 0.07 for arterial street intersections, and from 0 to 0.04 for collector street intersections. However, when the value exceeded the tipping points, the positive influence began to diminish and a negative correlation emerged, suggesting nuanced interplay between perceived safety and the desire for unrestricted movement around intersections. While a moderate number of safe barriers improves perceived safety and positively influences walking preferences, an excess can lead to negative perceptions. This adverse effect is likely due to the feelings of restriction or confinement that the barrier creates, particularly at local street intersections. In addition, this trend was markedly different from that observed for street segments (Figure 12c). Other factors exhibiting an inverted U-pattern include the tree view index (Figure 14h) and shrub view index (Figure 14i) across all categories of intersections.

5. Discussion

The results of this study are important for guiding design practices aimed at creating pedestrian-friendly street environments. First, pinpointing critical factors is vital for deciding which streetscape factors to prioritize for design intervention. By acknowledging these key variables, urban planners can optimize resource utilization, minimize waste, and significantly improve the overall efficiency of city development.
Existing studies have highlighted numerous key eye-level factors in street segment sections that can influence walking preferences, such as the street-to-building ratio [55], number of street stores [66,67,68], and roadway view index [40]. Similarly, for street intersections, factors, such as the crosswalk view index [63,64], elevated viaduct view index [64], and number of legs [63,64], have been identified as key variables affecting pedestrian behavior and preferences. Our study underscores the significance of these factors but goes further by incorporating the heterogeneity of the street structure into our analysis. By categorizing streets into three categories for analysis, we have unearthed deeper insights. Our investigation reveals that while there are common effects of eye-level streetscape factors on walking preferences across different segment and intersection categories, significant differences also exist. For instance, within street segments, factors, such as the roadway, tree, and elevated viaduct view index, are crucial in influencing walking preferences on arterial streets (Figure 9). However, for collector and local streets, the key variables that predict walking preferences shift to the street-to-building ratio, tree view index, and the number of street stores. By highlighting these key factors, tailored to various street categories in practical design initiatives, an opportunity arises to improve pedestrian experiences and perceptions. This is achieved through the implementation of more precise and context-sensitive design strategies.
Second, our study employed PDPs to uncover potential non-linear trends across various streetscape factors, unveiling diverse patterns, such as upward, downward, and threshold effects. By observing these patterns, planners and designers can discern the optimal range for design interventions. For street segments, some streetscape factors showing an upward trend in relation to walking preferences, like street stores on arterial and collector street segments (Figure 12a), indicate that future urban renovations and design projects could enhance walkability by promoting ground-level small businesses along arterial and collector streets. For local street segments, integrating an appropriate number of stores can similarly contribute to increasing pedestrian activity and enhancing interest in walking. Conversely, the presence of elevated viaducts consistently undermines walking preferences, affecting both street segments (Figure 12e) and intersections (Figure 14f) negatively. Strategies aimed at mitigating their impact—such as burying these structures or improving their permeability—should be considered to enhance walkability. Acknowledging threshold effects is vital for urban planners and designers, as it allows them to precisely adjust the number of specific streetscape factors and establish the most suitable extent for interventions. In this study, the findings suggest that enhancing tree visibility on streets of all categories up to a certain threshold can optimally boost the walking preference (Figure 12f). However, beyond this level, further improvements in tree visibility cease to yield additional benefits. These insights are consistent with established research [69]. These findings not only demonstrate the superiority of non-linear approaches but also provide designers with the necessary tools to precisely determine the optimal scale and intensity of design interventions.
Third, our research uncovers that while shared trends exist in the non-linear influence of eye-level streetscape factors on walking preferences across different categories of street segments and intersections, such as the effects of the wall view index (Figure 12d), elevated viaduct view index (Figure 12e), and tree view index (Figure 12f) on street segments, and the impacts of the crosswalk view index (Figure 14a), shrub view index (Figure 14i), and the number of street-lights (Figure 14d) at intersections, notable differences are also evident. For example, the sidewalk view index along street segments (Figure 12g) shows an initial increase followed by a plateauing trend based on arterial and collector streets, indicating an inverted L-shaped pattern. However, on local streets, sidewalk visibility tends to negatively correlate with walking preferences. This phenomenon can be attributed to the fact that in Japan, local streets often lack sidewalks and are subject to regulatory limits on traffic flow and speed, leading residents to become accustomed to freely walking on any part of the road [44]. Consequently, the introduction of sidewalks on local streets might be perceived as an impediment to the freedom of walking. Conversely, on arterial and collector streets, the high volume of vehicular traffic prompts a desire for dedicated and adequately wide pedestrian sidewalks, aligning with existing research findings [68]. Identifying these heterogeneous trends aids designers in more accurately and contextually applying non-linear statistical results in their work.
Last, our study revealed that the same factors can elicit different perceptual responses in street segments and intersections, as evidenced by factors, such as the fence view index (Figure 12c and Figure 14g). This discovery underscores the significance of discerning and conducting a comprehensive examination of how various streetscapes affect walking preferences within different morphological street sections when formulating street design strategies.

6. Conclusions

This study aimed to unravel the intricate and non-linear relationships between eye-level streetscape factors and individual walking preferences. This study used the XGBoost regression method and importance plots to identify the relative importance of eye-level streetscape factors across different street categories and sections that influence walking preferences. Furthermore, by employing PDP, this study illustrated the non-linear trends of streetscape factors in street segments and intersections of various categories, aiding the identification of optimal design intervention thresholds for promoting walking preference. These insights offer planners and designers the opportunity to craft specific intervention strategies for different categories of street segments and intersections. Ultimately, this study contributes significantly to the advancement of evidence-based and context-sensitive designs for pedestrian-friendly environments that promote a healthy lifestyle.
This study had several limitations. First, this study focused on walking preferences and desires. However, the role of streets as places is also critically important. Future research should consider both the function of streets as pathways and as places, as well as the impact of the streetscape on each of these roles. Second, our analysis explored the heterogeneity among street segments and intersections, along with different structural categories. However, it fell short of thoroughly investigating the effects of land use differences and other more detailed contextual factors on eye-level streetscape variations and their impact on walking preferences. Future research should aim to integrate these contextual variances. Last, this study’s reliance on street view imagery from vehicular perspectives to simulate human visual perception may introduce bias due to differences in the street structure, viewpoint elevation, and vehicular movement patterns. To mitigate this limitation and more accurately reflect the pedestrian experience, subsequent research should strive to include imagery data collected from pedestrian viewpoints.

Author Contributions

Lu Huang and Takuya Oki played a crucial role in shaping the research by conceptualizing its framework and establishing the study’s design and objectives. They were primarily responsible for formulating and implementing the research methodology, and overseeing tasks such as data collection, analysis, and visualization. Meanwhile, Sachio Muto and Yoshiki Ogawa took charge of reviewing and revising the manuscript, consistently providing valuable suggestions and assistance throughout the entire process of enhancing the paper. Each author’s contribution played an essential part in the successful completion of this research. The financial support required for this research was secured by Lu Huang and Takuya Oki, who obtained the necessary funding. All authors have read and agreed to the published version of the manuscript.

Funding

This research was funded by JST SPRING under Grant Number JPMJSP2106, and JSPS KAKENHI under Grant Number JP22K04490.

Data Availability Statement

The data presented in this study are available on request from the authors due to privacy restrictions.

Conflicts of Interest

The authors declare no conflicts of interest.

References

  1. Tokyo Metropolitan Government. Tokyo Sustainability Action 2023. Available online: https://www.metro.tokyo.lg.jp/english/about/sustainable/documents/tokyo_sustainability_action2023.pdf (accessed on 3 February 2024).
  2. Hu, F.B.; Sigal, R.J.; Rich-Edwards, J.W.; Colditz, G.A.; Solomon, C.G.; Willett, W.C.; Speizer, F.E.; Manson, J.E. Walking compared with vigorous physical activity and risk of type 2 diabetes in women: A prospective study. JAMA 1999, 282, 1433–1439. [Google Scholar] [CrossRef]
  3. Hu, H.B.; Stampfer, M.J.; Solomon, C.; Liu, S.; Colditz, G.A.; Speizer, F.E.; Willett, W.C.; Manson, J.E. Physical activity and risk for cardiovascular events in diabetic women. Ann. Intern. Med. 2001, 134, 96–105. [Google Scholar] [CrossRef]
  4. Williams, P.T.; Thompson, P.D. Walking versus running for hypertension, cholesterol, and diabetes mellitus risk reduction. Arterioscler. Thromb. Vasc. Biol. 2013, 33, 1085–1091. [Google Scholar] [CrossRef] [PubMed]
  5. Hu, G.; Jousilahti, P.; Borodulin, K.; Barengo, N.C.; Lakka, T.A.; Nissinen, A.; Tuomilehto, J. Occupational, commuting and leisure-time physical activity in relation to coronary heart disease among middle-aged Finnish men and women. Atherosclerosis 2007, 194, 490–497. [Google Scholar] [CrossRef] [PubMed]
  6. Cavill, N.; Kahlmeier, S.; Rutter, H.; Racioppi, F.; Oja, P. Economic Assessment of Transport Infrastructure and Policies Methodological Guidance on the Economic Appraisal of Health Effects Related to Walking and Cycling; WHO Regional Office for Europe: Copenhagen, Denmark, 2007. [Google Scholar]
  7. Sung, H.; Doohwan, C.G.; Cheon, S.; Park, S. Effects of street-level physical environment and zoning on walking activity in Seoul, Korea. Land Use Policy 2015, 49, 152–160. [Google Scholar] [CrossRef]
  8. Sarkar, C.; Webster, C.; Pryor, M.; Tang, D.; Melbourne, S.; Zhang, X.; Jianzheng, L. Exploring associations between urban green, street design and walking: Results from the Greater London boroughs. Landsc. Urban Plan. 2015, 143, 112–125. [Google Scholar] [CrossRef]
  9. Alfonzo, M.A. To walk or not to walk? The hierarchy of walking needs. Environ. Behav. 2005, 37, 808–836. [Google Scholar] [CrossRef]
  10. Millstein, R.A.; Cain, K.L.; Sallis, J.F.; Conway, T.L.; Geremia, C.; Frank, L.D.; Chapman, J.; Van Dyck, D.; Dipzinski, L.R.; Kerr, J.; et al. Development, scoring, and reliability of the Microscale Audit of Pedestrian Streetscapes (MAPS). BMC Public Health 2013, 13, 403. [Google Scholar] [CrossRef]
  11. Borst, H.C.; Vries, S.I.; Graham, J.M.; van Dongen, J.E.; Bakker, I.; Miedema, H.M. Influence of environmental street characteristics on walking route choice of elderly people. J. Environ. Psychol. 2009, 29, 477–484. [Google Scholar] [CrossRef]
  12. Shatu, F.; Yigitcanlar, T.; Bunker, J. Shortest path distance vs. least directional change: Empirical testing of space syntax and geographic theories concerning pedestrian route choice behaviour. J. Transp. Geogr. 2019, 74, 37–52. [Google Scholar] [CrossRef]
  13. Basu, R.; Sevtsuk, A. How do street attributes affect willingness-to-walk? City-wide pedestrian route choice analysis using big data from Boston and San Francisco. Transp. Res. A Policy Pract. 2022, 163, 1–19. [Google Scholar] [CrossRef]
  14. Guzman, L.A.; Arellana, J.; Castro, W.F. Desirable streets for pedestrians: Using a street-level index to assess walkability. Transp. Res. D Trans. Environ. 2022, 111, 103462. [Google Scholar] [CrossRef]
  15. Nagata, S.; Hanibuchi, T.; Amagasa, S.; Kikuchi, H.; Inoue, S. Objective scoring of streetscape walkability related to leisure walking: Statistical modeling approach with semantic segmentation of Google Street View images. Health Place 2020, 66, 102428. [Google Scholar] [CrossRef] [PubMed]
  16. Boarnet, M.G.; Day, K.; Alfonzo, M.; Forsyth, A.; Oakes, M. The Irvine–Minnesota Inventory to Measure Built Environments: Reliability Tests. Am. J. Prev. Med. 2006, 30, 153–159. [Google Scholar] [CrossRef] [PubMed]
  17. Harvey, C.; Aultman-Hall, L.; Stephanie, E.; Austin, T.; Hurley, S.E. Effects of skeletal streetscape design on perceived safety. Landsc. Urban Plan. 2015, 142, 18–28. [Google Scholar] [CrossRef]
  18. Cervero, R.; Kockelman, K. Travel demand and the 3Ds: Density, diversity, and design. Transp. Res. D Trans. Environ. 1997, 2, 199–219. [Google Scholar] [CrossRef]
  19. Cervero, R.; Sarmiento, O.L.; Jacoby, E.; Gomez, L.F.; Neiman, A. Influences of built environments on walking and cycling: Lessons from Bogotá. Int. J. Sustain. Transp. 2009, 3, 203–226. [Google Scholar] [CrossRef]
  20. Handy, S.L.; Boarnet, M.G.; Ewing, R.; Killingsworth, R.E. How the built environment affects physical activity: Views from urban planning. Am. J. Prev. Med. 2002, 23, 64–73. [Google Scholar] [CrossRef] [PubMed]
  21. Brownson, R.C.; Hoehner, C.M.; Brennan, L.K.; Cook, R.A.; Elliott, M.B.; McMullen, K.M. Reliability of 2 instruments for auditing the environment for physical activity. J. Phys. Act. Health 2004, 1, 191–208. [Google Scholar] [CrossRef]
  22. Belza, B.; Altpeter, M.; Smith, M.L.; Ory, M.G. The Healthy Aging Research Network: Modeling Collaboration for Community Impact. Am. J. Prev. Med. 2017, 52, S228–S232. [Google Scholar] [CrossRef] [PubMed]
  23. Emery, J.; Crump, C.; Bors, P. Reliability and validity of two instruments designed to assess the walking and bicycling suitability of sidewalks and roads. Am. J. Health Promot. 2003, 18, 38–46. [Google Scholar] [CrossRef] [PubMed]
  24. Evenson, K.R.; Sotres-Alvarez, D.; Herring, A.H.; Messer, L.; Laraia, B.A.; Rodríguez, D.A. Assessing urban and rural neighborhood characteristics using audit and GIS data: Derivation and reliability of constructs. Int. J. Behav. Nutr. Phys. Act. 2009, 6, 44. [Google Scholar] [CrossRef] [PubMed]
  25. Aghaabbasi, M.; Moeinaddini, M.; Shah, M.Z.; Asadi-Shekari, Z.A. A new assessment model to evaluate the microscale sidewalk design factors at the neighbourhood level. J. Transp. Health 2017, 5, 97–112. [Google Scholar] [CrossRef]
  26. Huang, L.; Oki, T.; Muto, S.; Kim, H.; Ogawa, Y.; Sekimoto, Y. Automatic Evaluation of Street-Level Walkability Based on Computer Vision Techniques and Urban Big Data: A Case Study of Kowloon West, Hong Kong. In Intelligence for Future Cities: Planning through Big Data and Urban Analytics; Springer Nature: Berlin/Heidelberg, Germany, 2023; pp. 231–259. [Google Scholar] [CrossRef]
  27. Ng, S.; Lai, C.; Liao, P.; Lao, M.; Lau, W. Measuring and Improving Walkability in Hong Kong; Civic Exchange: Hong Kong, China, 2016. [Google Scholar]
  28. Gallimore, J.M.; Brown, B.B.; Werner, C.M. Walking routes to school in new urban and suburban neighborhoods: An environmental walkability analysis of blocks and routes. J. Environ. Psychol. 2011, 31, 184–191. [Google Scholar] [CrossRef]
  29. Ewing, R.; Handy, S. Measuring the unmeasurable: Urban design qualities related to walkability. J. Urban Des. 2009, 14, 65–84. [Google Scholar] [CrossRef]
  30. Asgarzadeh, M.; Koga, T.; Hirate, K.; Farvid, M.; Lusk, A. Investigating oppressiveness and spaciousness in relation to building, trees, sky and ground surface: A study in Tokyo. Landsc. Urban Plan. 2014, 131, 36–41. [Google Scholar] [CrossRef]
  31. Asgarzadeh, M.; Lusk, A.; Koga, T.; Hirate, K. Measuring oppressiveness of streetscapes. Landsc. Urban Plan. 2012, 107, 1–11. [Google Scholar] [CrossRef]
  32. Adkins, A.; Luhr, G.; Neal, M. Unpacking walkability: Testing the influence of urban design features on perceptions of walking environment attractiveness. J. Urban Des. 2012, 17, 499–510. [Google Scholar] [CrossRef]
  33. Borst, H.C.; Miedema, H.M.; de Vries, S.I.; Graham, J.M.; van Dongen, J.E. Relationships between street characteristics and perceived attractiveness for walking reported by elderly people. J. Environ. Psychol. 2008, 28, 353–361. [Google Scholar] [CrossRef]
  34. Agrawal, A.W.; Schlossberg, M.; Irvin, K. How Far, by Which Route and Why? A Spatial Analysis of Pedestrian Preference. J. Urban Des. 2008, 13, 81–98. [Google Scholar] [CrossRef]
  35. Li, X.; Zhang, C.; Li, W. Does the visibility of greenery increase perceived safety in urban areas? Evidence from the place pulse 1.0 dataset. ISPRS Int. J. Geo-Inf. 2015, 4, 1166–1183. [Google Scholar] [CrossRef]
  36. Rodrigue, L.; Manaugh, K.; El-Geneidy, A.; Daley, J.; Wasfi, R.; Ravensbergen, L.; Butler, G. Factors influencing subjective walkability: Results from built environment audit data. J. Transp. Land Use 2022, 15, 709–727. [Google Scholar] [CrossRef]
  37. Yin, C.; Cao, J.; Sun, B.; Liu, J. Exploring built environment correlates of walking for different purposes: Evidence for substitution. J. Transp. Geogr. 2023, 106, 103505. [Google Scholar] [CrossRef]
  38. Tao, T.; Wu, X.; Cao, J.; Fan, Y.; Das, K.; Ramaswami, A. Exploring the nonlinear relationship between the built environment and active travel in the Twin Cities. J. Plan. Educ. Res. 2023, 43, 637–652. [Google Scholar] [CrossRef]
  39. Cheng, L.; De Vos, J.; Zhao, P.; Yang, M.; Witlox, F. Examining non-linear built environment effects on elderly’s walking: A random forest approach. Transp. Res. D Trans. Environ. 2020, 88, 102552. [Google Scholar] [CrossRef]
  40. Wu, F.; Li, W.; Qiu, W. Examining non-linear relationship between streetscape features and propensity of walking to school in Hong Kong using machine learning techniques. J. Transp. Geogr. 2023, 113, 103698. [Google Scholar] [CrossRef]
  41. International Affairs Division. Setagaya City Outline. Available online: https://www.city.setagaya.lg.jp/mokuji/bunka/007/d00156846_d/fil/setagayacityoutline.pdf (accessed on 11 September 2023).
  42. MLIT. Road Structure Order. Available online: https://www.mlit.go.jp/road/sign/kouzourei_kaisetsu.html (accessed on 26 March 2024).
  43. Neighborhood Street Research Group. The Creation of Roads for Coexistence Between People and Cars: Considerations for Neighborhood Street Planning; Kajima Institute Publishing Co., Ltd.: Tokyo, Japan, 1989; ISBN 978-43-0607-170-4. [Google Scholar]
  44. Kato, H.; Kanki, K. Effectiveness of Walkability Indicator from the perspective of Subjective Evaluation on Streets in Sprawl Urban Areas: Toward Smart Shrinking for Sprawl urban areas in North Osaka Metropolitan Region. J. City Plan. Inst. Jpn. 2019, 54, 10–19. [Google Scholar] [CrossRef]
  45. Kirillov, A.; He, K.; Girshick, R.; Rother, C.; Dollár, P. Panoptic segmentation. In Proceedings of the IEEE/CVF Conference on Computer Vision and Pattern Recognition, Long Beach, CA, USA, 16–17 June 2019. [Google Scholar] [CrossRef]
  46. Chen, T.; Guestrin, C. Xgboost: A scalable tree boosting system. In Proceedings of the 22nd ACM SIGKDD International Conference on Knowledge Discovery and Data Mining, San Francisco, CA, USA, 13–17 August 2016. [Google Scholar] [CrossRef]
  47. Gehl, J. Life between Buildings: Using Public Space; Van Nostrand Reinhold: New York, NY, USA, 1987. [Google Scholar]
  48. Ogawa, Y.; Oki, T.; Zhao, C.; Sekimoto, Y.; Shimizu, C. Evaluating the subjective perceptions of streetscapes using street-view images. Landsc. Urban Plan. 2024, 247, 105073. [Google Scholar] [CrossRef]
  49. Ordonez, V.; Berg, T.L. Learning high-level judgments of urban perception. In Computer Vision—ECCV 2014: 13th European Conference, Zurich, Switzerland, 6–12 September 2014, Proceedings, Part VI 13; Springer International Publishing: Berlin/Heidelberg, Germany, 2014; pp. 494–510. [Google Scholar] [CrossRef]
  50. Dubey, A.; Naik, N.; Parikh, D.; Raskar, R.; Hidalgo, C.A. Deep learning the city: Quantifying urban perception at a global scale. In Computer Vision—ECCV 2016: 14th European Conference, Amsterdam, The Netherlands, 11–14 October 2016, Proceedings, Part I 14; Springer International Publishing: Berlin/Heidelberg, Germany, 2016; pp. 196–212. [Google Scholar] [CrossRef]
  51. Oki, T.; Kizawa, S. Model for Evaluating Impression of Streets in Residential Areas Based on Image Big Data and A Large Questionnaire. J. Archit. Plan. 2022, 87, 2102–2113. [Google Scholar] [CrossRef]
  52. Zhang, F.; Zhou, B.; Liu, L.; Liu, Y.; Fung, H.; Lin, H.; Ratti, C. Measuring human perceptions of a large-scale urban region using machine learning. Landsc. Urban Plan. 2018, 180, 148–160. [Google Scholar] [CrossRef]
  53. Kang, Y.; Kim, J.; Park, J.; Lee, J. Assessment of Perceived and Physical Walkability Using Street View Images and Deep Learning Technology. ISPRS Int. J. Geogr. Inf. 2023, 12, 186. [Google Scholar] [CrossRef]
  54. Woo, S.; Debnath, S.; Hu, R.; Chen, X.; Liu, Z.; Kweon, I.S.; Xie, S. Convnext v2: Co-designing and scaling convnets with masked autoencoders. In Proceedings of the IEEE/CVF Conference on Computer Vision and Pattern Recognition, New Orleans, LA, USA, 18–24 June 2022. [Google Scholar] [CrossRef]
  55. Koo, B.W.; Guhathakurta, S.; Botchwey, N. How are neighborhood and street-level walkability factors associated with walking behaviors? A big data approach using street view images. Environ. Behav. 2022, 54, 211–241. [Google Scholar] [CrossRef]
  56. Qiu, W.; Li, W.; Liu, X.; Zhang, Z.; Li, X.; Huang, X. Subjective and objective measures of streetscape perceptions: Relationships with property value in Shanghai. Cities 2023, 132, 104037. [Google Scholar] [CrossRef]
  57. Cheng, B.; Misra, I.; Schwing, A.G.; Kirillov, A.; Girdhar, R. Masked-attention Mask Transformer for Universal Image Segmentation. In Proceedings of the IEEE/CVF Conference on Computer Vision and Pattern Recognition, New Orleans, LA, USA, 18–24 June 2022. [Google Scholar] [CrossRef]
  58. He, K.; Zhang, X.; Ren, S.; Sun, J. Deep residual learning for image recognition. In Proceedings of the IEEE Conference on Computer Vision and Pattern Recognition, Las Vegas, NV, USA, 26 June–1 July 2016; pp. 770–778. [Google Scholar]
  59. Neuhold, G.; Ollmann, T.; Rota Bulò, S.; Kontschieder, P. The Mapillary Vistas Dataset for Semantic Understanding of Street Scenes. In Proceedings of the International Conference on Computer Vision (ICCV), Venice, Italy, 22–29 October 2017. [Google Scholar]
  60. Zhou, B.; Zhao, H.; Puig, X.; Fidler, S.; Barriuso, A.; Torralba, A. Scene parsing through ade20k dataset. In Proceedings of the IEEE Conference on Computer Vision and Pattern Recognition, Honolulu, HI, USA, 21–26 July 2017; pp. 633–641. [Google Scholar] [CrossRef]
  61. Atkinson, A.B. On the measurement of inequality. J. Econ. Theory 1970, 2, 244–263. [Google Scholar] [CrossRef]
  62. Ashihara, Y. The Aesthetic Townscape; The MIT Press: Cambridge, MA, USA, 1984; ISBN 978-02-6251-031-8. [Google Scholar]
  63. Blečić, I.; Cecchini, A.; Canu, D.; Cappai, A.; Congiu, T.; Fancello, G. Evaluating the effect of urban intersections on walkability. In Computational Science and Its Applications—ICCSA 2016: 16th International Conference, Beijing, China, 4–7 July 2016; Proceedings, Part IV 16; Springer International Publishing: Berlin/Heidelberg, Germany, 2016; pp. 138–149. [Google Scholar] [CrossRef]
  64. Wang, K.; Akar, G. Street intersection characteristics and their impacts on perceived bicycling safety. Transp. Res. Rec. 2018, 2672, 41–54. [Google Scholar] [CrossRef]
  65. Toronto City Council. Toronto Complete Streets Guidelines. Available online: https://www.toronto.ca/services-payments/streets-parking-transportation/enhancing-our-streets-and-public-realm/complete-streets/complete-streets-guidelines/ (accessed on 24 September 2023).
  66. Chiang, Y.C.; Sullivan, W.; Larsen, L. Measuring neighborhood walkable environments: A comparison of three approaches. Int. J. Environ. Res. Public Health 2017, 14, 593. [Google Scholar] [CrossRef] [PubMed]
  67. City and County of Denver. Streetscape Design Manual. Available online: https://www.denvergov.org/files/assets/public/v/1/doti/documents/standards/pwes-002.0-streetscape_design_manual.pdf (accessed on 15 October 2023).
  68. Herrmann-Lunecke, M.G.; Mora, R.; Vejares, P. Perception of the built environment and walking in pericentral neighbourhoods in Santiago, Chile. Travel Behav. Soc. 2021, 23, 192–206. [Google Scholar] [CrossRef]
  69. Yang, L.; Ao, Y.; Ke, J.; Liang, Y. To walk or not to walk? Examining non-linear effects of streetscape greenery on walking propensity of older adults. J. Transp. Geogr. 2021, 94, 103099. [Google Scholar] [CrossRef]
Figure 1. Case study site.
Ijgi 13 00131 g001
Figure 2. (a) Rail transit network and stations; (b) land use zones.
Ijgi 13 00131 g002
Figure 3. (a) Mapping different categories of street segments and (b) street intersections.
Ijgi 13 00131 g003
Figure 4. Analysis framework.
Ijgi 13 00131 g004
Figure 5. (a) Image comparison survey interface (translated to English, original in Japanese); (b) a network to infer walking preference at street segments and intersections; (c) training dataset parameters and results.
Ijgi 13 00131 g005
Figure 6. Mapping preference scores for street segments. (a,b) Examples of preference predictions for arterial street segments, (c,d) collector street segments, and (e,f) local street segments.
Ijgi 13 00131 g006
Figure 7. Mapping preference scores for street intersections. (a,b) Examples of preference predictions for arterial street intersections, (c,d) collector street intersections, and (e,f) local street intersections.
Ijgi 13 00131 g007
Figure 8. (a) Example of panoptic segmentation at a street intersection using the Mapillary Vista v2.0 dataset; (b) panoptic segmentation at a street segment using the Mapillary Vista v2.0 dataset; (c) panoptic segmentation at a street segment using the ADE20K dataset; (d) panoptic segmentation at a street intersection using the ADE20K dataset.
Ijgi 13 00131 g008
Figure 9. Relative importance of streetscapes on walking preference (street segments).
Ijgi 13 00131 g009
Figure 10. Relative importance of streetscapes on the walking preference (street intersections).
Ijgi 13 00131 g010
Figure 11. (a,b) PDP of skeletal factors affecting walking preferences for street segments.
Ijgi 13 00131 g011
Figure 12. (at) PDP of detailed factors affecting walking preferences for street segments.
Ijgi 13 00131 g012aIjgi 13 00131 g012b
Figure 13. (a,b) PDP of skeletal factors affecting walking preferences for street intersections.
Ijgi 13 00131 g013
Figure 14. (ap) PDP of detailed factors affecting walking preferences for street intersections.
Ijgi 13 00131 g014aIjgi 13 00131 g014b
Table 1. The categorization of street segments and intersections based on their width classes.
CategoryWidthDefinitionExample
Street Segments
Arterial street
segment
W ≥ 13 mArterial streets constitute the basic framework of national road transportation as public roads, with the majority including bicycle lanes and pedestrian sidewalks.
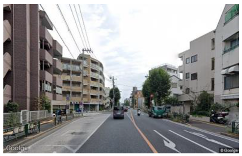
Ijgi 13 00131 i001
Collector street
segment
5.5 m ≤ W < 13 mCollector streets constitute the major roads forming the basic network of the road transportation system, with most of these roads including bicycle lanes and pedestrian sidewalks.
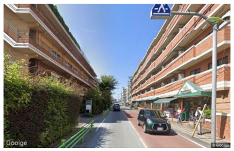
Ijgi 13 00131 i002
Local street segment3 m ≤ W < 5.5 mLocal streets serve mainly local traffic with short trip lengths. Streets of this class are usually formed in a disorderly manner adjacent to residential areas. There are few streets with bicycle and pedestrian sidewalks along the roadside.
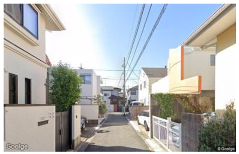
Ijgi 13 00131 i003
Street Intersection
Arterial street
intersection
The widest leg ≥ 13 mThe intersection is crossed by an arterial street and serves as a crucial node for the urban backbone street network. Such intersections typically have well-developed crossing facilities and traffic signals.
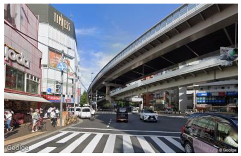
Ijgi 13 00131 i004
Collector street
intersection
The widest leg falls within the range 5.5 m ≤ W < 13 mThe intersection is crossed by a collector street and serves as a vital node for the neighborhood backbone road network. These intersections typically have well-developed crossing facilities and traffic signals in most cases.Ijgi 13 00131 i005
Local street
intersection
The widest leg falls within the range 3 m ≤ W < 5.5 mThe intersection is crossed by a local street and forms part of the branching structure of the neighborhood street network. These intersections sometimes have crossing facilities and traffic signals.
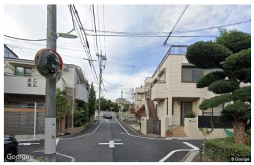
Ijgi 13 00131 i006
Table 2. Eye-level streetscape factors of street segments.
NoVariableDescriptionData SourceMeanStd
ArterialCollectorLocalArterialCollectorLocal
Skeletal streetscape
1Street-to-building ratioRatio of the street view index to the building view indexGSV0.8940.7120.3870.5440.6090.379
2Sidewalk-to-roadway ratioRatio of the sidewalk view index to the roadway view indexGSV0.2520.2850.2340.1500.2390.272
Detailed streetscape
3Elevated viaduct view indexProportion of pixels of the elevated viaduct category in the image.GSV0.0050.0130.0020.0300.0590.022
4Wall view indexProportion of pixels of the wall category in the image.GSV0.0100.0260.0410.0170.0360.041
5Fence view indexProportion of pixels of the fence category in the image.GSV0.0230.0310.0380.0190.0380.044
6Sidewalk view indexProportion of pixels of the sidewalk category in the image.GSV0.0380.0300.0120.0200.0240.019
7Roadway view indexProportion of pixels of the roadway category in the image.GSV0.1450.1180.1810.0250.0330.026
8Tree view indexProportion of pixels of the tree category in the image.GSV0.1760.0980.0880.1160.1130.108
9Shrub view indexProportion of pixels of the shrub category in the image.GSV0.0240.0370.0530.0260.0450.062
10Grass view indexProportion of pixels of the grass category in the image.GSV0.0010.0030.0010.0050.0100.008
11Number of street storesNumber of street stores detected in the image.GSV0.7180.6520.1551.0251.0180.656
12Number of utility polesNumber of utility poles detected in the image.GSV3.0153.5363.3231.8792.1351.748
13Number of street lightsNumber of street lights detected in the image.GSV0.9890.8830.5970.8170.8940.699
14Bike lane view indexProportion of pixels of the bike lane category in the image.GSV0.0010.0010.0010.0040.0040.002
15Number of benchesNumber of benches detected in the image.GSV0.0100.0030.0030.1000.0580.065
16Number of trash-cansNumber of trash-cans detected in the image.GSV0.0200.0320.0540.1500.1980.254
17Number of awningsNumber of awnings detected in the image.GSV0.0290.0180.0070.1690.1560.089
18Number of mailboxesNumber of mailboxes detected in the image.GSV0.0020.0090.0250.0500.0990.160
19Number of bannersNumber of banners detected in the image.GSV0.1250.0970.0450.3940.3740.258
20Number of ridersNumber of riders detected in the image.GSV0.2630.1620.0750.5530.4350.291
21Number of vehiclesNumber of vehicles detected in the image.GSV4.1192.9111.7482.0662.2031.594
22Number of pedestriansNumber of pedestrians detected in the image.GSV0.8980.6060.3671.1361.0100.758
Table 3. Eye-level streetscape factors of street intersections.
NoVariableDescriptionData SourceMeanStd
ArterialCollectorLocalArterialCollectorLocal
Skeletal streetscape
1Average crossing distanceMean length that pedestrians need to cover to traverse the intersection from one side to the other.DRM3.3422.13311.2150.9310
2Number of legsTotal count of segments that intersect at a particular crossing point.DRM3.7093.6773.4880.5500.5280.513
Detailed streetscape
3Elevated viaduct view indexProportion of pixels of the elevated viaduct category in the image.GSV0.0400.0130.0030.1060.0580.028
4Corner space view indexProportion of pixels of the corner space category in the image.GSV0.0330.0330.0200.0180.0210.017
5Fence view indexProportion of pixels of the fence category in the image.GSV0.0150.0210.0300.0170.0250.033
6Crosswalk view indexProportion of pixels of the crosswalk category in the image.GSV0.0330.0230.0030.0270.0210.010
7Curb ramp view indexProportion of pixels of the curb ramp category in the image.GSV0.0020.0020.0010.0010.0020.001
8Number of vehicle traffic lights Number of vehicle traffic lights detected in the image.GSV1.1180.7090.0420.8910.9220.270
9Number of pedestrian traffic lightsNumber of pedestrian traffic lights detected in the image.GSV0.6100.4280.0180.7800.7750.164
10Bike lane view indexProportion of pixels of the bike lane category in the image.GSV0.0010.0010.0010.0030.0040.005
11Number of stop linesNumber of stop lines detected in the image.GSV0.3480.3340.3050.4960.5070.493
12Number of street lightsNumber of street lights detected in the image.GSV0.8770.7510.6740.7110.7700.727
13Tree view indexProportion of pixels of the tree category in the image.GSV0.0690.0710.0880.0740.0840.102
14Shrub view indexProportion of pixels of the shrub category in the image.GSV0.0120.0250.0480.0200.0330.052
15Grass view indexProportion of pixels of the grass category in the image.GSV0.0010.0010.0010.0030.0060.007
16Number of ridersNumber of riders detected in the image.GSV0.4650.2690.1050.7070.5480.345
17Number of vehiclesNumber of vehicles detected in the image.GSV3.9032.5851.6201.8481.9421.471
18Number of pedestriansNumber of pedestrians detected in the image.GSV1.0690.7510.4581.2131.0920.842
Table 4. XGBoost model training parameters and results.
Arterial
(Segment)
Collector
(Segment)
Local
(Segment)
Arterial
(Intersection)
Collector
(Intersection)
Local
(Intersection)
Gamma00.10.10.100.1
Learning_rate0.010.10.10.010.010.01
Max_depth435444
Min_child_weight313535
n_estimators200300300300300300
Pseudo R20.380.410.310.350.390.29
Disclaimer/Publisher’s Note: The statements, opinions and data contained in all publications are solely those of the individual author(s) and contributor(s) and not of MDPI and/or the editor(s). MDPI and/or the editor(s) disclaim responsibility for any injury to people or property resulting from any ideas, methods, instructions or products referred to in the content.

