

Identifying the Hierarchical Structure of Nighttime Economic Agglomerations Based on the Fusion of Multisource Data
 , ,
, ,
Abstract
:1. Introduction
2. Materials and Methods
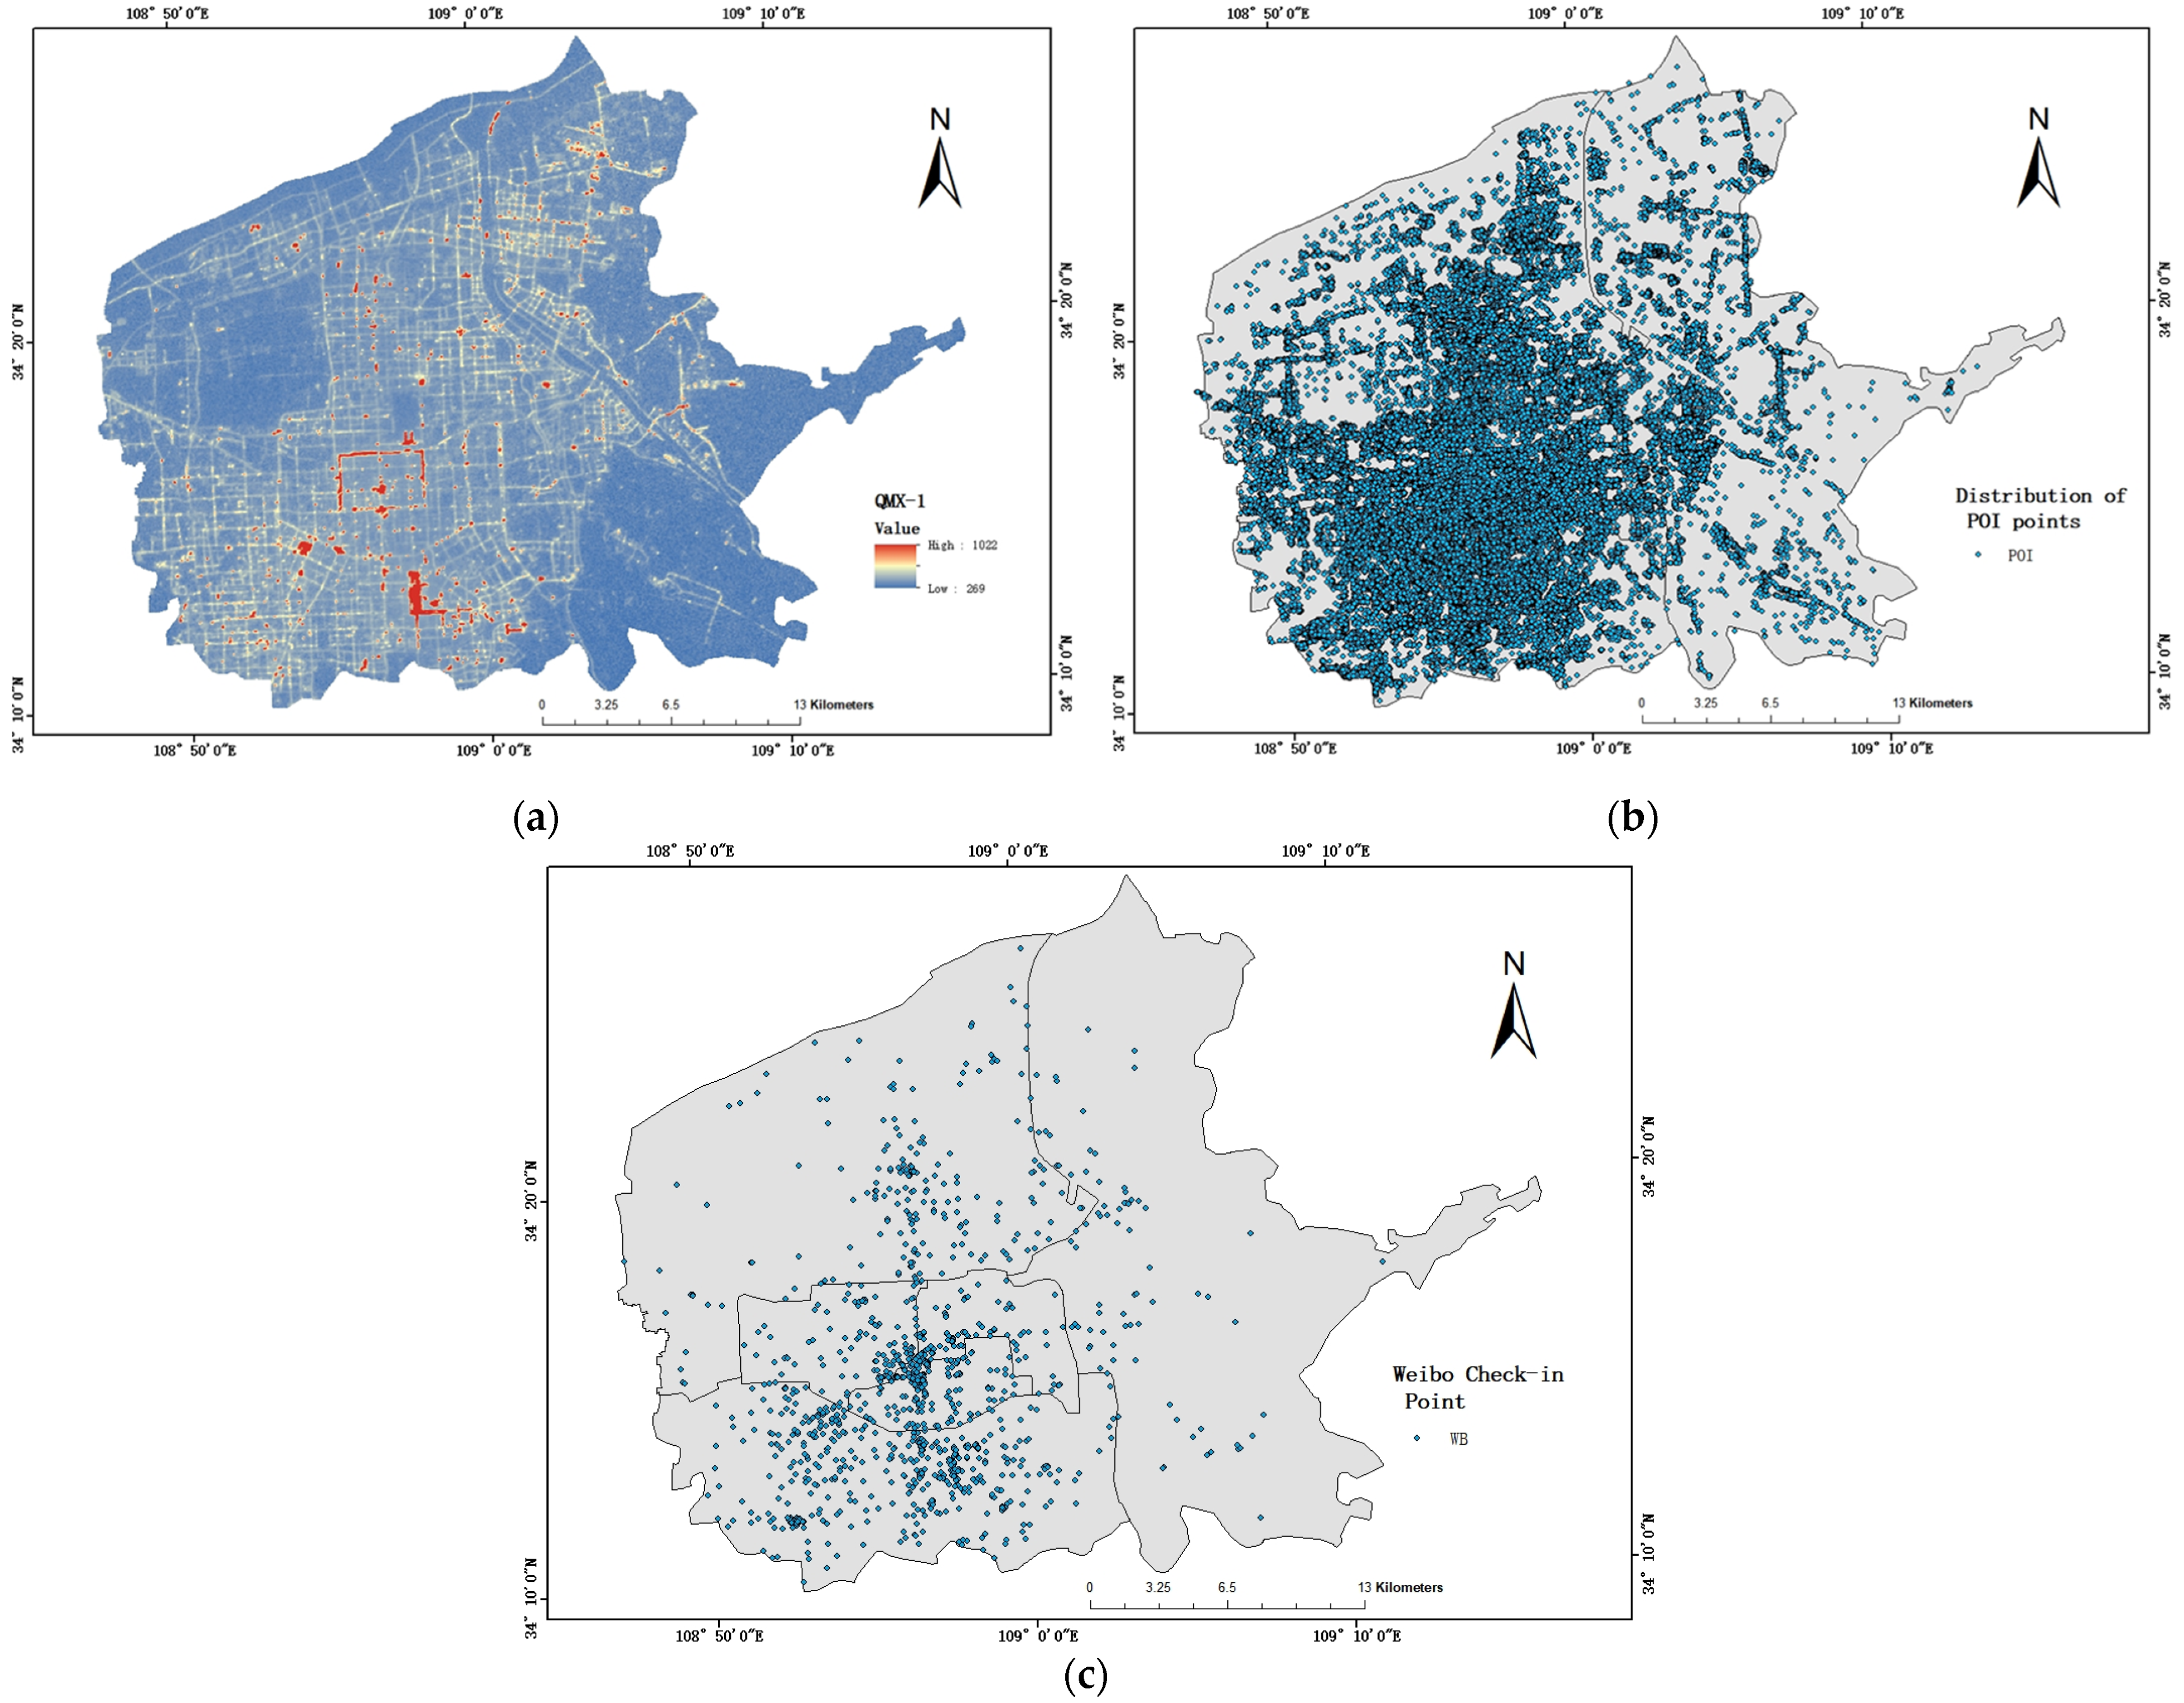
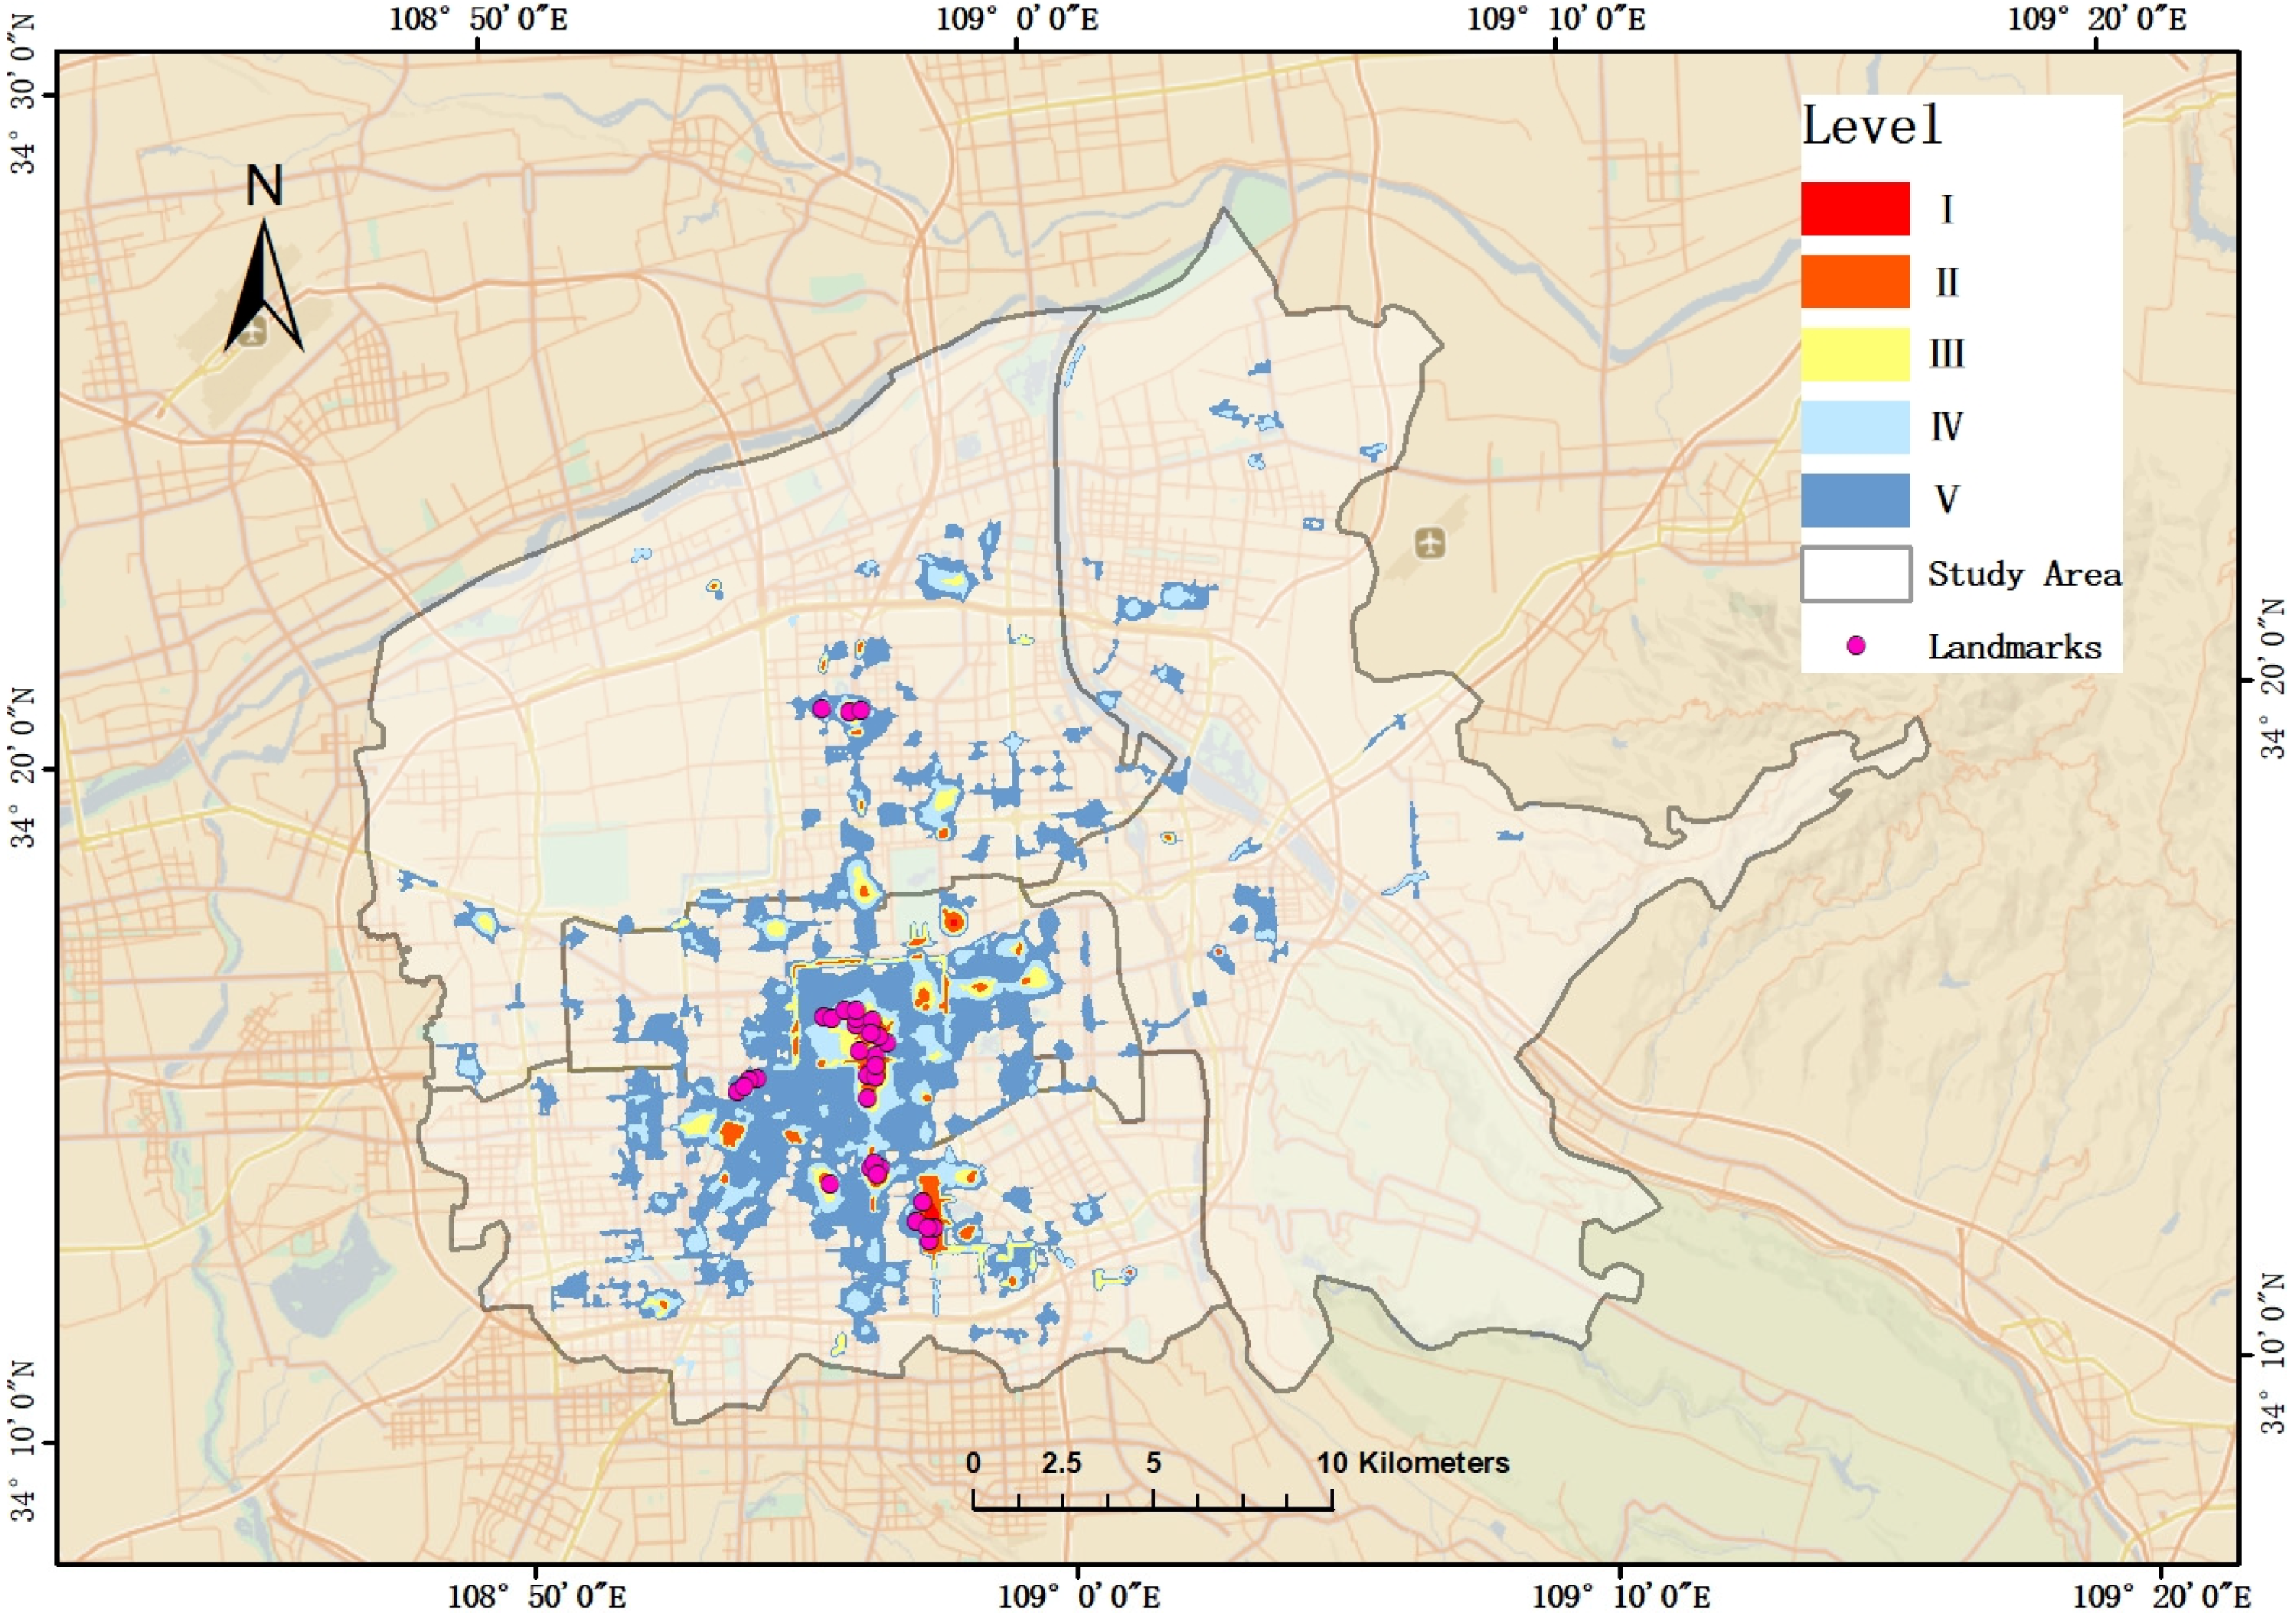
2.1. Study Area
2.2. Data Sources
2.2.1. Nighttime Light Data
2.2.2. POI Data
2.2.3. Weibo Check-in Data
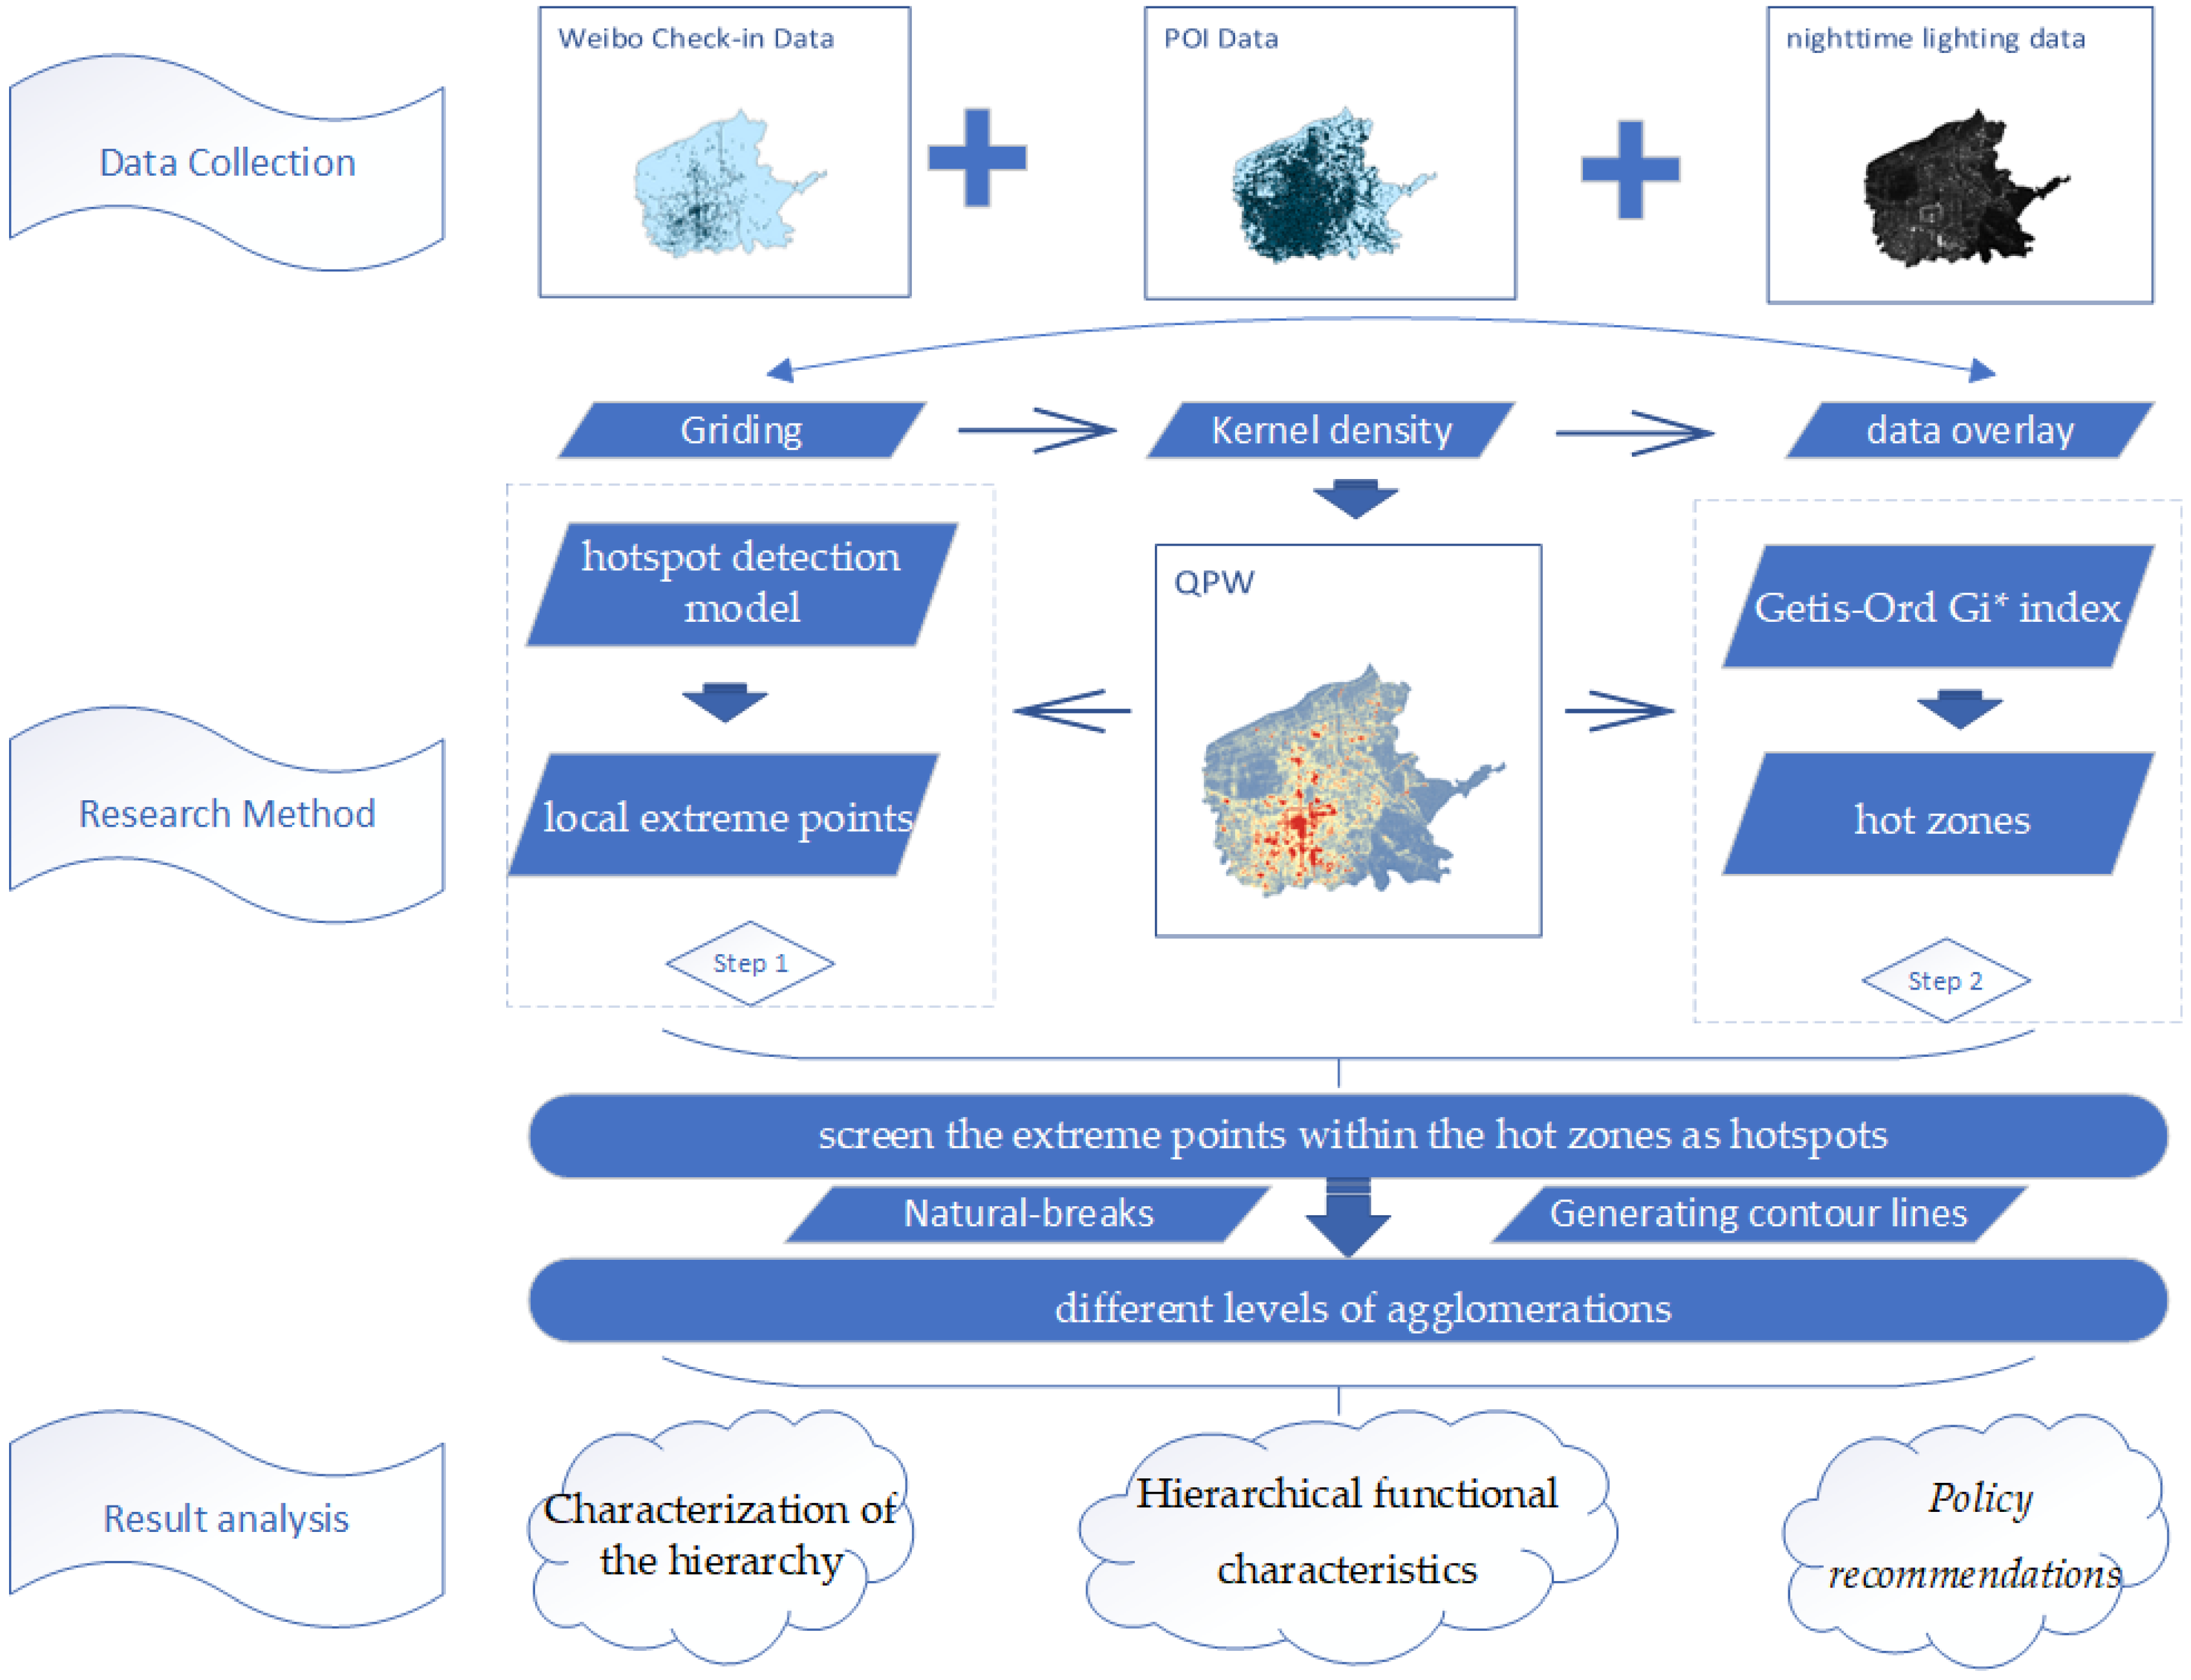
2.3. Research Methodology
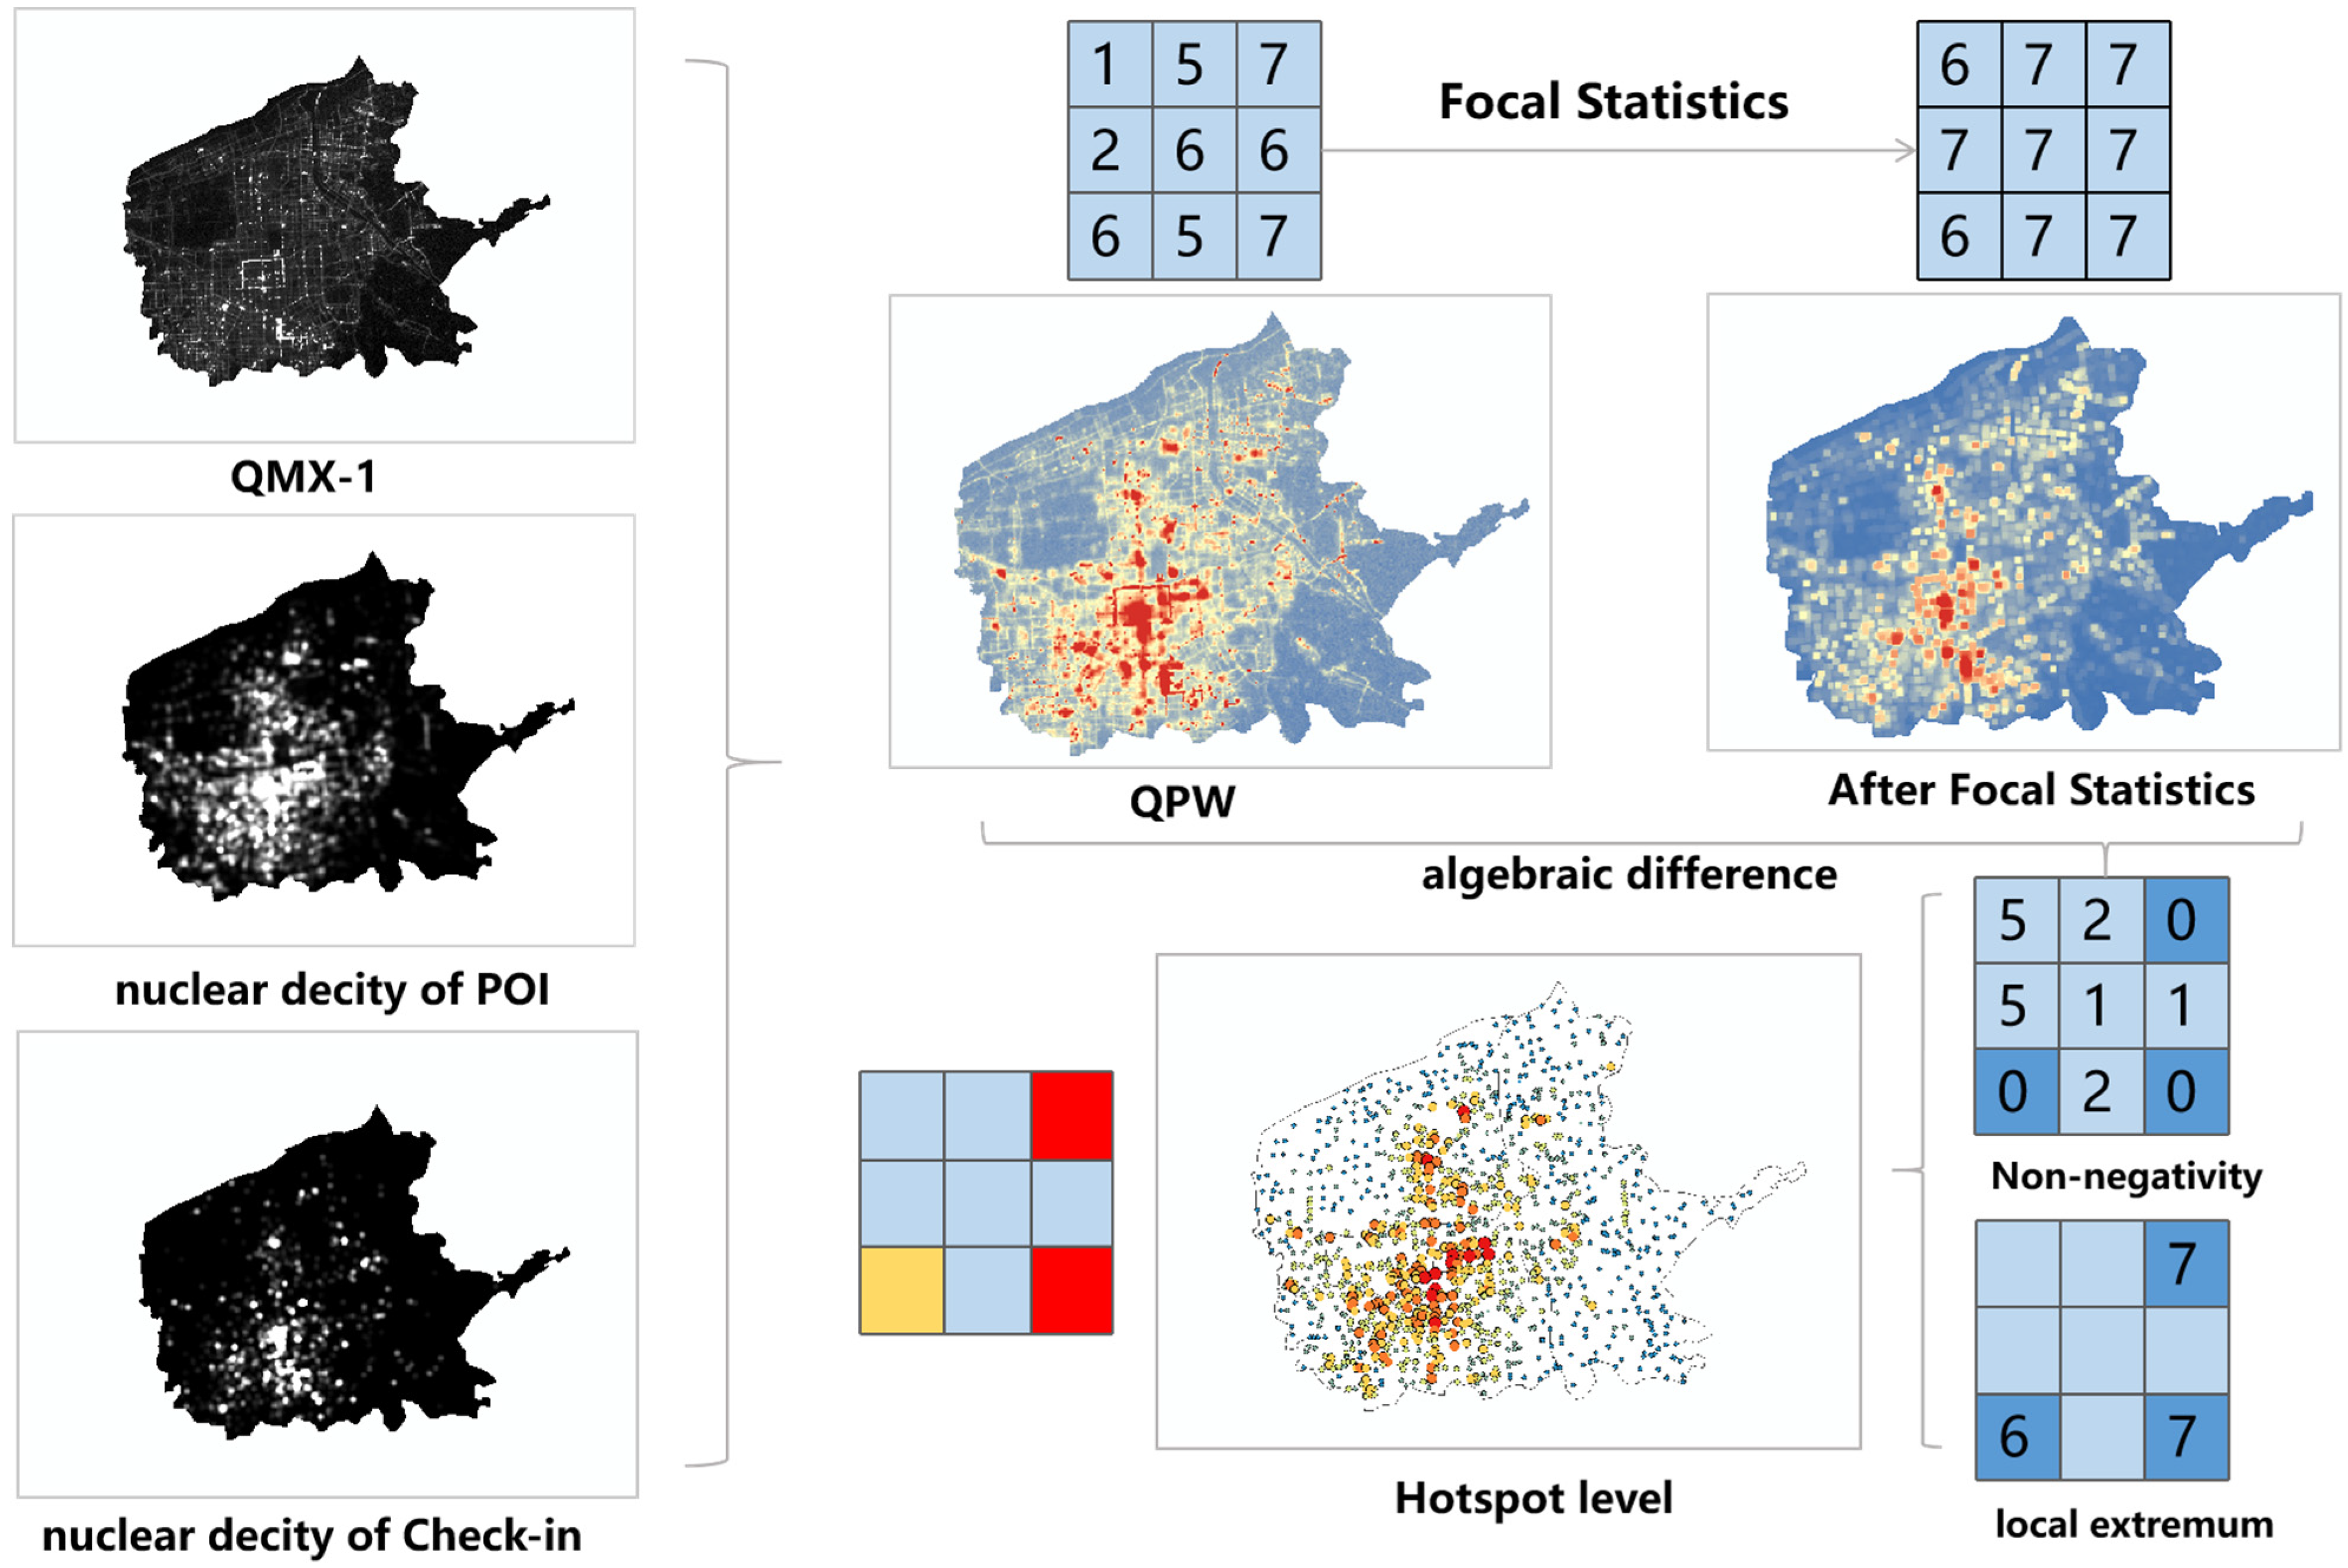
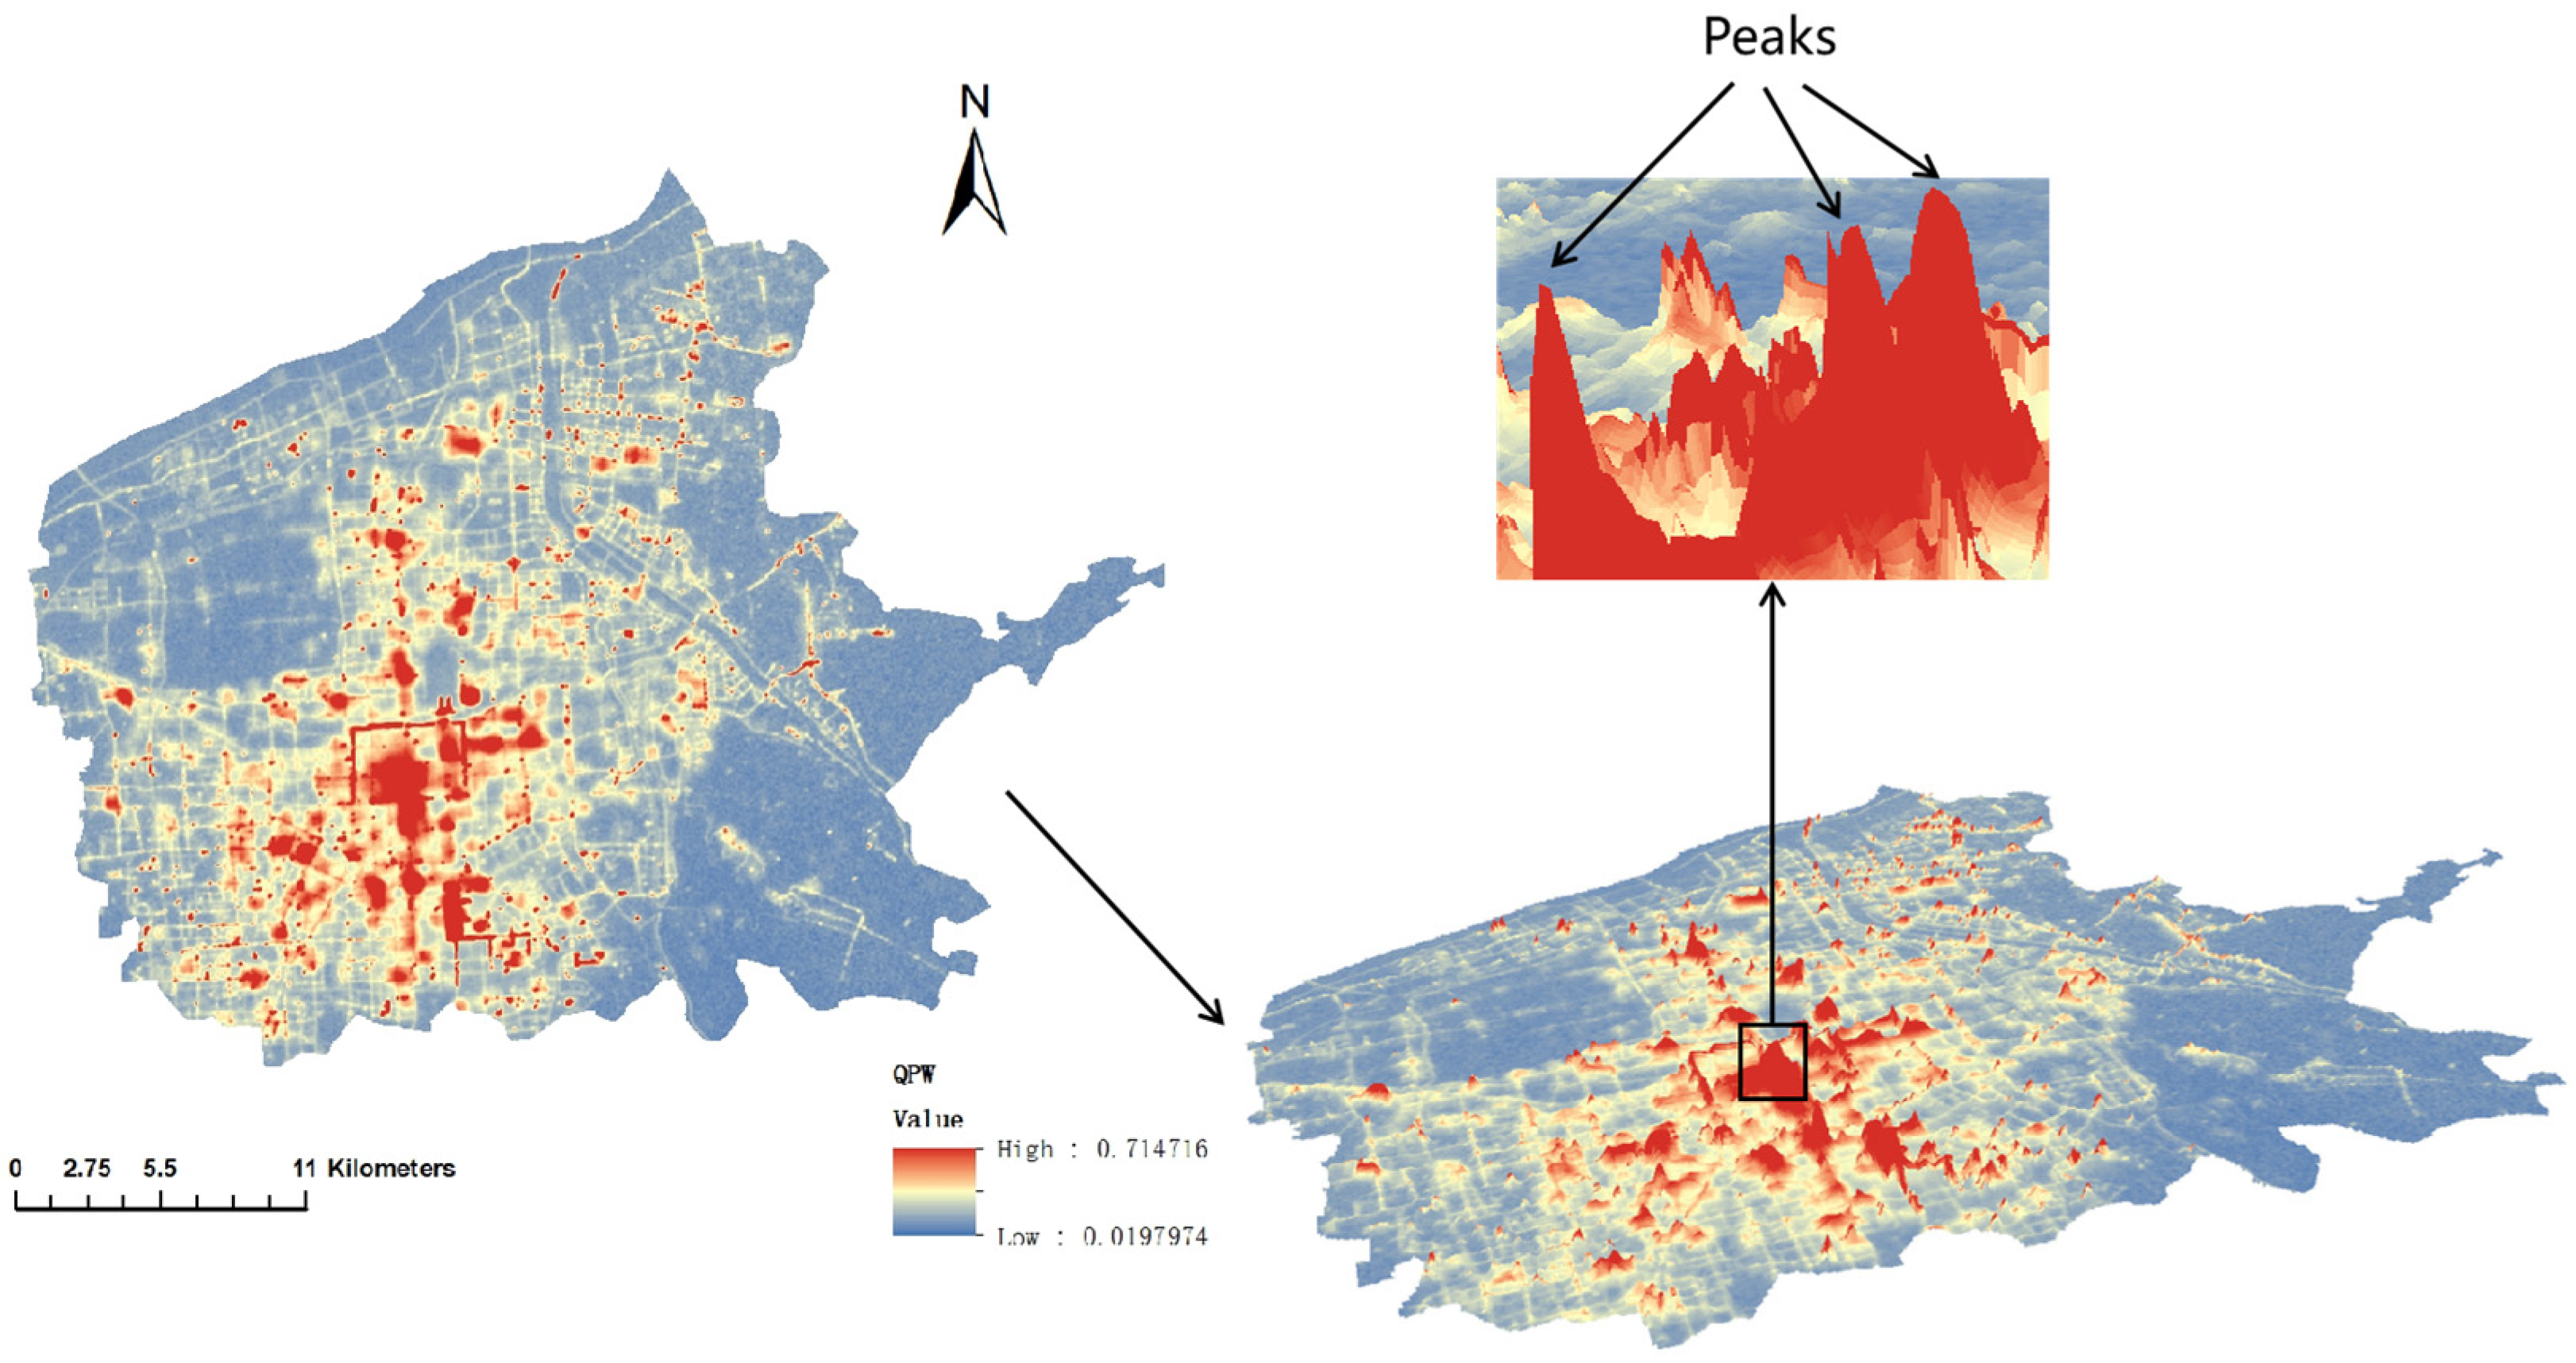
2.3.1. QPW Composite Index Construction
- Kernel density estimation
- 2.
- QPW composite index
2.3.2. Extraction of Hotspots of Nighttime Economic Activities Based on the Two-Step Method
- Hotspot detection model
- 2.
- The Getis-Ord Gi* Index
2.3.3. Identification of the Hierarchical Structure of Nighttime Economic Agglomerations
- 1.
- Visualization of the hierarchical structure of nighttime economic agglomerations
- 2.
- Functional characteristics of the nighttime economy agglomeration hierarchy
3. Results
3.1. Xi’an Nighttime Economic Agglomeration Identification Results
3.2. Validation of Recognition Results
3.2.1. Comparison of Single-Source and Multisource Data Fusion Results
3.2.2. Comparison with Planning Data
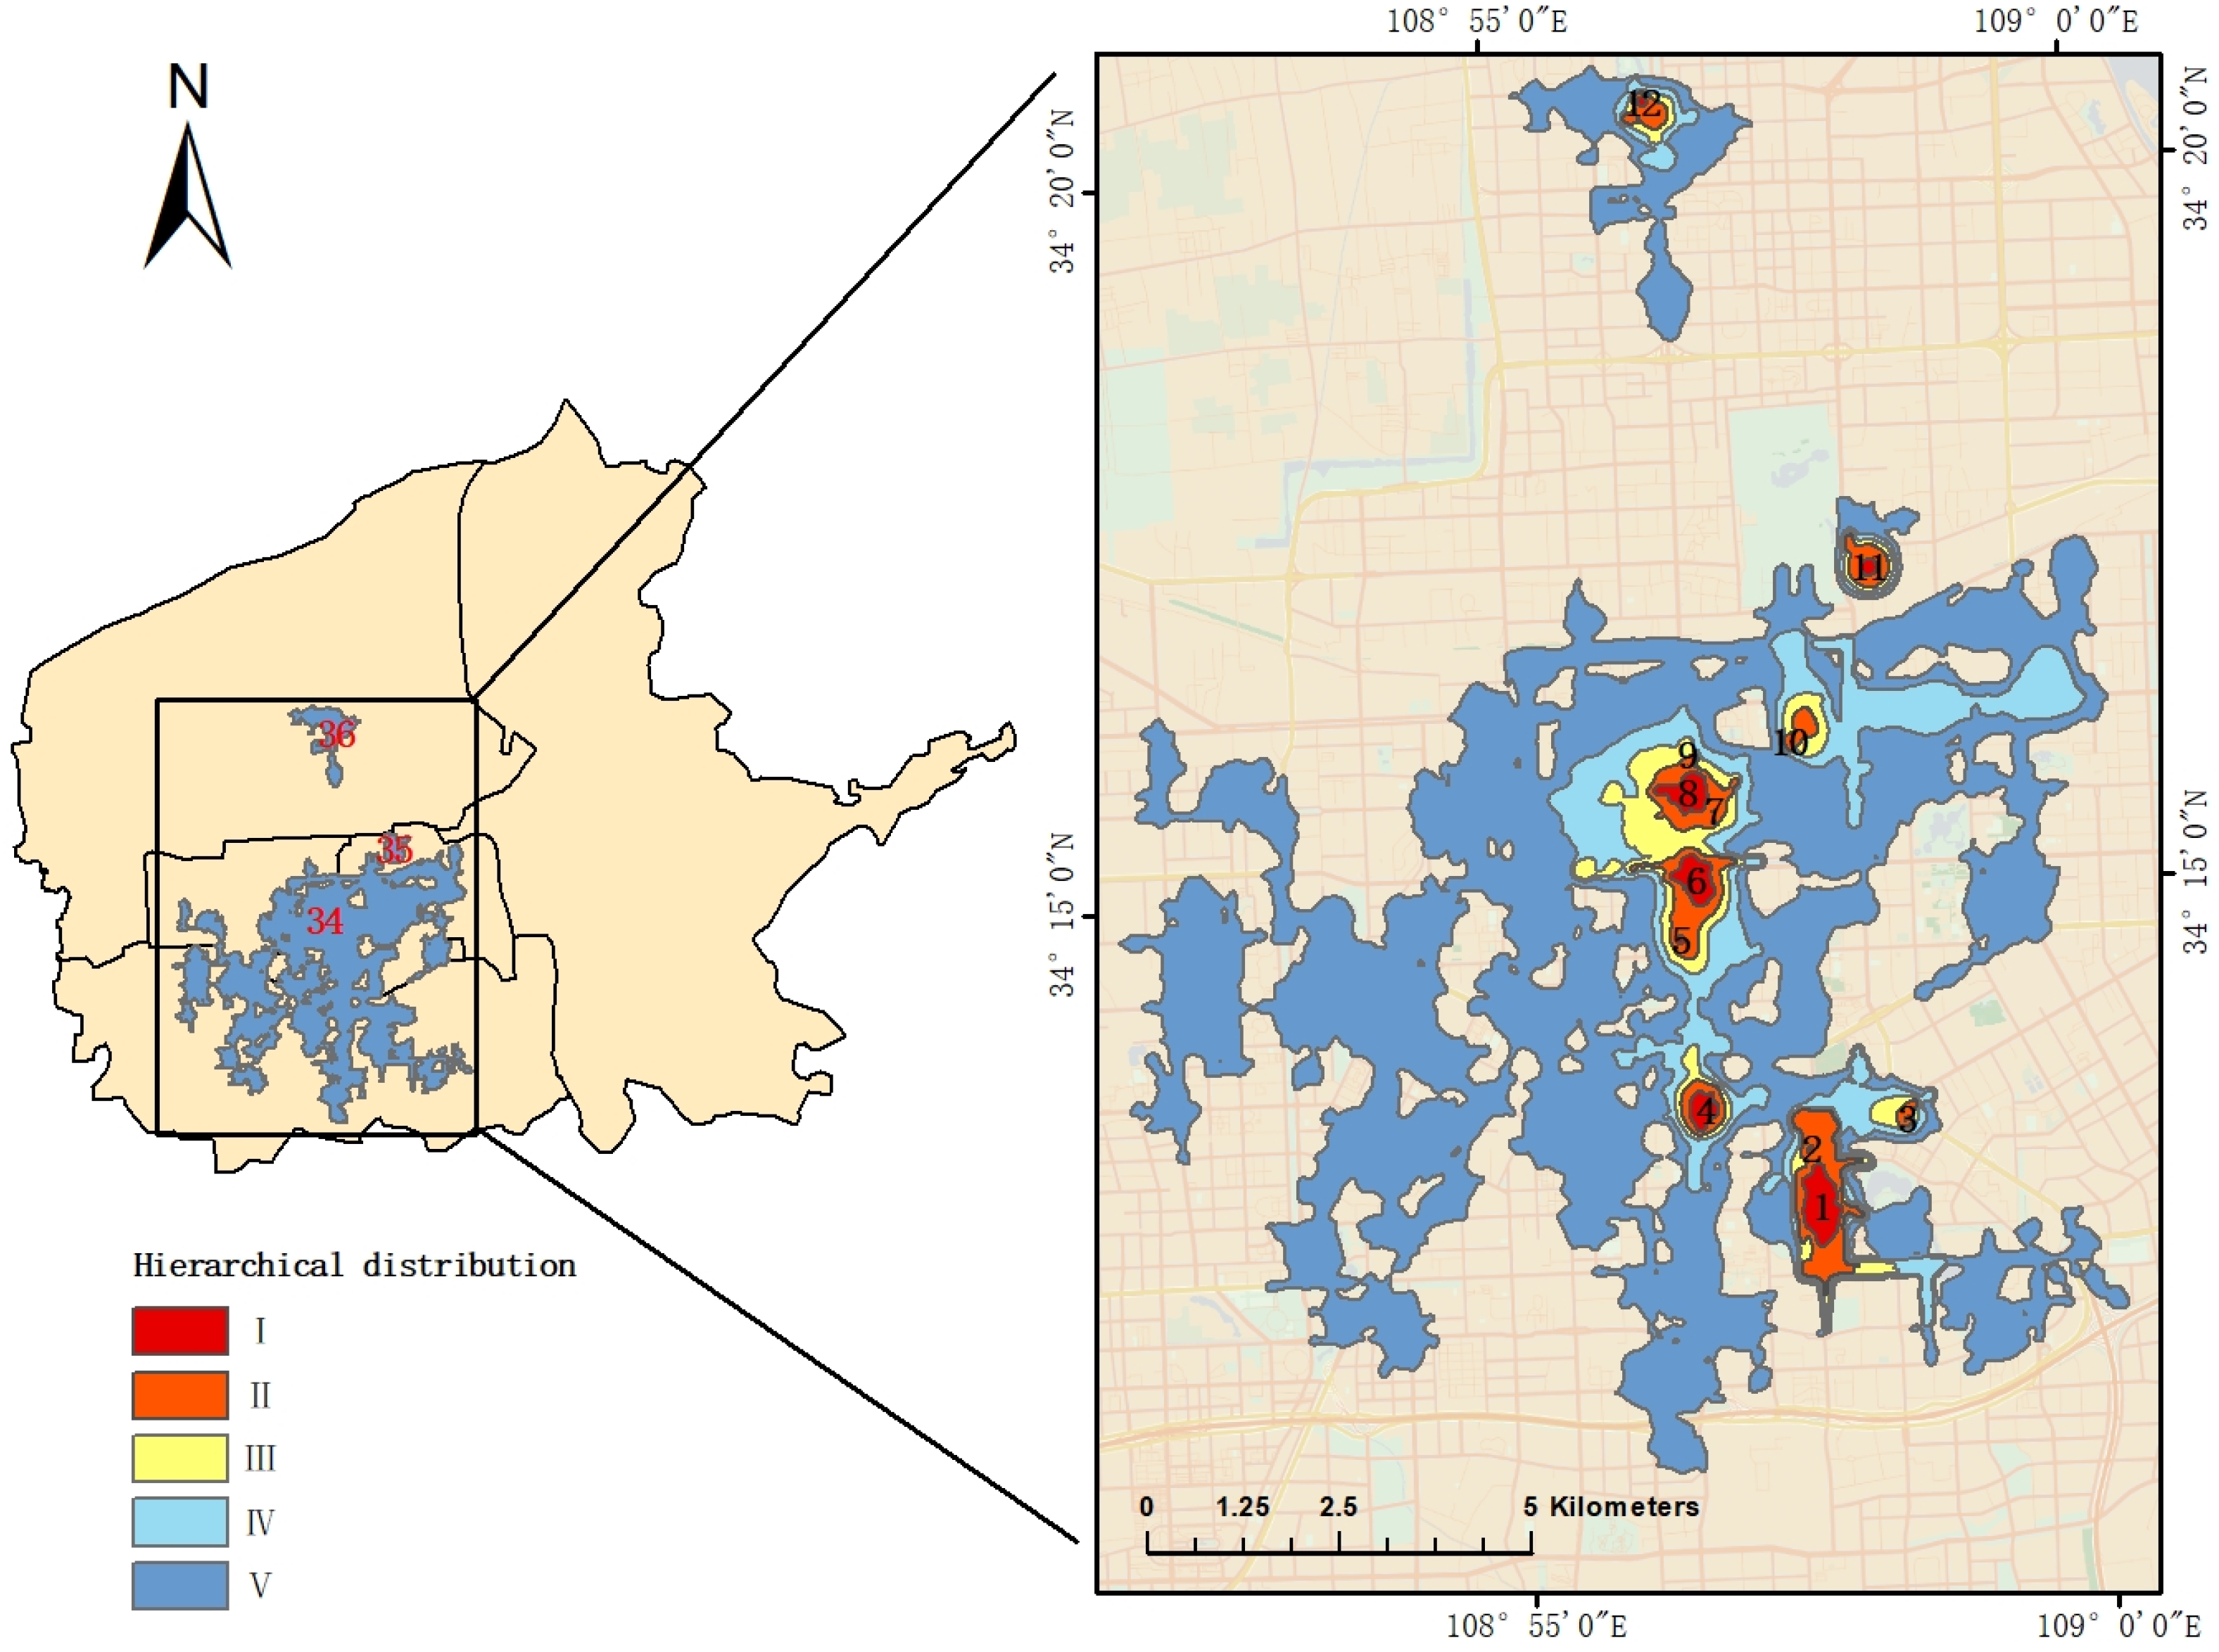
3.3. Hierarchy of Nighttime Economic Agglomerations
3.3.1. Characterization of the Hierarchy
3.3.2. Hierarchical Functional Characteristics
4. Discussion
4.1. Exploration of the Advantages of Identification Methods
4.2. Policy Recommendations
4.3. Shortcomings of the Study and Suggestions for Future Research
5. Conclusions
Author Contributions
Funding
Data Availability Statement
Acknowledgments
Conflicts of Interest
References
- Montgomery, J. Cities and the art of cultural planning. Plan. Pract. Res. 1990, 5, 17–24. [Google Scholar] [CrossRef]
- Bianchini, F. Night Cultures, Night Economies. Plan. Pract. Res. 1995, 10, 121–126. [Google Scholar] [CrossRef]
- Mao, Z.G.; Long, Y.N.; Ye, X. Research Prograss on Night-Time Economy. Econ. Persp 2020, 1, 103–116. [Google Scholar]
- Li, M.X.; Tu, W.; Lu, F. Sensing the Nighttime Economy-Housing Imbalance from a Mobile Phone Data Perspective: A Case Study in Shanghai. Remote Sens. 2022, 14, 21. [Google Scholar] [CrossRef]
- Schwanen, T.; van Aalst, I.; Brands, J.; Timan, T. Rhythms of the night: Spatiotemporal inequalities in the nighttime economy. Environ. Plan. A 2012, 44, 2064–2085. [Google Scholar] [CrossRef]
- Valentine, G.; Holloway, S.L.; Jayne, M. Contemporary cultures of abstinence and the nighttime economy: Muslim attitudes towards alcohol and the implications for social cohesion. Environ. Plan. A 2010, 42, 8–22. [Google Scholar] [CrossRef]
- Diaz-Fernandez, S.; Evans, A. Lad culture as a sticky atmosphere: Navigating sexism and misogyny in the UK’s student-centred nighttime economy. Gend. Place Cult. 2020, 27, 744–764. [Google Scholar] [CrossRef]
- Tong, H.; Kang, J. Relationships between noise complaints and socio-economic factors in England. Sust. Cities Soc. 2021, 65, 9. [Google Scholar] [CrossRef]
- Fu, H.Y.; Shao, Z.F.; Fu, P.; Cheng, Q.M. The Dynamic Analysis between Urban Nighttime Economy and Urbanization Using the DMSP/OLS Nighttime Light Data in China from 1992 to 2012. Remote Sens. 2017, 9, 19. [Google Scholar] [CrossRef]
- Tang, C.; Xiao, X. Advances and Prospect in Nighttime Tourism Research Home and Abroad. Human. Geo 2022, 37, 21–29. [Google Scholar]
- Wu, F.C.; Wang, Y.F. Urban Nighttime Tourism Consumption Space FromThe Perspective of Scene-A Study Based on the Cultural Scene of Super Wenheyou in Changsha. Wuhan Univ. J. Phil. Soc. Ed. 2021, 74, 58–70. [Google Scholar]
- McArthur, J.; Robin, E.; Smeds, E. Socio-spatial and temporal dimensions of transport equity for London’s night time economy. Transp. Res. Pt. A-Policy Pract. 2019, 121, 433–443. [Google Scholar] [CrossRef]
- Cui, Y.Z.; Shi, K.F.; Jiang, L.; Qiu, L.F.; Wu, S.H. Identifying and Evaluating the Nighttime Economy in China Using Multisource Data. IEEE Geosci. Remote Sens. Lett. 2021, 18, 1906–1910. [Google Scholar] [CrossRef]
- Zeng, L.; Liu, T.; Du, P. Research Method of Temporal and Spatial Distribution Pattern of Night-time Economy based on Multi-source Data. J.Geo-Inf. Sci. 2022, 24, 38–49. [Google Scholar]
- Liu, F.; Liu, S.; Zhu, Y. The spatial distribution pattern of nighttime economy carriers in Wuhan. J. Central China Normal Univ. Nat. Sci. Ed. 2022, 56, 686–694. [Google Scholar]
- Wang, L.; Zhong, H.; Xu, Z.; Wang, W. Quantitative Identification and Classification of the Nighttime Economic Agglomeration based on the Luojia-01 NTL Data and Pole-Axis Theory. J.Geo-Inf. Sci. 2022, 24, 2141–2152. [Google Scholar]
- Wang, Y.; Zhao, M. Spatial-Temporal Differentiation and Influencing Mechanism of Night-Time Economic Forms in Tianjin. Geogr. Geo-inf. Sci. 2023, 39, 134–143. [Google Scholar]
- Chen, S. Exploration and Research on Geo-Informatic Tupu; The Commercial Press: Beijing, China, 2001. [Google Scholar]
- Hu, X.Y.; Wang, Y.D.; Wang, H.; Shi, Y. Hierarchical Structure of the Central Areas of Megacities Based on the Percolation Theory-The Example of Lujiazui, Shanghai. Sustainability 2022, 14, 20. [Google Scholar] [CrossRef]
- Chen, Z.Q.; Yu, B.L.; Song, W.; Liu, H.X.; Wu, Q.S.; Shi, K.F.; Wu, J.P. A New Approach for Detecting Urban Centers and Their Spatial Structure with Nighttime Light Remote Sensing. IEEE Trans. Geosci. Remote Sens. 2017, 55, 6305–6319. [Google Scholar] [CrossRef]
- Zhang, H.; Zhou, X.; Tang, G.; Zhou, L.; Ye, X. Hotspot discovery and its spatial pattern analysis for catering service in cities based on field model in GIS. Geogr. Res. 2020, 39, 354–369. [Google Scholar]
- Xu, X.; Ding, S.; Ding, L. Survey on Density Peaks Clustering Algorithm. J. Softw. 2022, 33, 1800–1816. [Google Scholar]
- Wang, Y.; Xue, D.; Song, Y.; Ma, B. Spatial Structure and Formation Mechanism of Entertainment Industry in Xi’an. Econ. Geog. 2022, 42, 132–145. [Google Scholar]
- Kang, L.; Liu, H.; Cheng, W.; Chen, X.; Li, J. A method of urban facility hot spot recognition considering attribute characteristics. Bulletin. Surv. Mapp. 2022, 1, 8–14. [Google Scholar]
- Zhang, X.Y.; Li, W.W.; Zhang, F.; Liu, R.Y.; Du, Z.H. Identifying Urban Functional Zones Using Public Bicycle Rental Records and Point-of-Interest Data. ISPRS Int. J. Geo-Inf. 2018, 7, 16. [Google Scholar] [CrossRef]
- Hu, Q.; Wang, M.; Li, Q. Urban Hotspot and Commercial Area Exploration with Check-in Data. Acta Geod. Cart. Sin. 2014, 43, 314–321. [Google Scholar]
- Hu, Q.W.; Bai, G.K.; Wang, S.H.; Ai, M.Y. Extraction and monitoring approach of dynamic urban commercial area using check-in data from Weibo. Sust. Cities Soc. 2019, 45, 508–521. [Google Scholar] [CrossRef]
- Pok, S.; Matsushita, B.; Fukushima, T. An easily implemented method to estimate impervious surface area on a large scale from MODIS time-series and improved DMSP-OLS nighttime light data. ISPRS-J. Photogramm. Remote Sens. 2017, 133, 104–115. [Google Scholar] [CrossRef]
- Zheng, Q.M.; Jiang, R.W.; Wang, K.; Huang, L.Y.; Ye, Z.R.; Gan, M.Y.; Ji, B.Y. Monitoring the trajectory of urban nighttime light hotspots using a Gaussian volume model. Int. J. Appl. Earth Obs. Geoinf. 2018, 65, 24–34. [Google Scholar] [CrossRef]
- Tu, Y.; Chen, Z.Q.; Wang, C.X.; Yu, B.L.; Liu, B.J. Quantitative Analysis of Urban Polycentric Interaction Using Nighttime Light Data: A Case Study of Shanghai, China. IEEE J. Sel. Top. Appl. Earth Observ. Remote Sens. 2022, 15, 1114–1122. [Google Scholar] [CrossRef]
- Zhao, N.Z.; Zhang, W.; Liu, Y.; Samson, E.L.; Chen, Y.; Cao, G.F. Improving Nighttime Light Imagery with Location-Based Social Media Data. IEEE Trans. Geosci. Remote Sens. 2019, 57, 2161–2172. [Google Scholar] [CrossRef]
- Sun, M.Q.; Fan, H.C. Detecting and Analyzing Urban Centers Based on the Localized Contour Tree Method Using Taxi Trajectory Data: A Case Study of Shanghai. ISPRS Int. J. Geo-Inf. 2021, 10, 26. [Google Scholar] [CrossRef]
- Huang, B.; Zhao, B.; Song, Y.M. Urban land-use mapping using a deep convolutional neural network with high spatial resolution multispectral remote sensing imagery. Remote Sens. Environ. 2018, 214, 73–86. [Google Scholar] [CrossRef]
- Deng, Y.; Liu, J.P.; Liu, Y.; Luo, A. Detecting Urban Polycentric Structure from POI Data. ISPRS Int. J. Geo-Inf. 2019, 8, 20. [Google Scholar] [CrossRef]
- Shi, F.; Li, X.; Xu, H. Analysis of human activities in nature reserves based on nighttime light remote sensing and microblogging data—Illustrated by the case of national nature reserves in jiangxi province. Int. Arch. Photogramm. Remote Sens. Spatial Inf. Sci. 2017, XLII-2/W7, 1341–1348. [Google Scholar] [CrossRef]
- Rizwan, M.; Wan, W.G.; Cervantes, O.; Gwiazdzinski, L. Using Location-Based Social Media Data to Observe Check-In Behavior and Gender Difference: Bringing Weibo Data into Play. ISPRS Int. J. Geo-Inf. 2018, 7, 17. [Google Scholar] [CrossRef]
- Zhao, N.; Cao, G.; Zhang, W.; Samson, E.L. Tweets or nighttime lights: Comparison for preeminence in estimating socioeconomic factors. ISPRS-J. Photogramm. Remote Sens. 2018, 146, 1–10. [Google Scholar] [CrossRef]
- Devkota, B.; Miyazaki, H.; Witayangkurn, A.; Kim, S.M. Using Volunteered Geographic Information and Nighttime Light Remote Sensing Data to Identify Tourism Areas of Interest. Sustainability 2019, 11, 29. [Google Scholar] [CrossRef]
- Huang, B.; Zhou, Y.L.; Li, Z.G.; Song, Y.M.; Cai, J.X.; Tu, W. Evaluating and characterizing urban vibrancy using spatial big data: Shanghai as a case study. Env. Plan. B-Urban Anal. CIty Sci. 2020, 47, 1543–1559. [Google Scholar] [CrossRef]
- Wang, B.; Loo, B.P.Y.; Liu, J.X.; Lei, Y.Q.; Zhou, L. Urban vibrancy and air pollution: Avoidance behaviour and the built environment. Int. J. Urban Sci. 2024, 20, 1. [Google Scholar] [CrossRef]
- Zhong, Q.; Xiao, R.; Cao, H.; Li, X.; Wu, J. Evaluation of Qimingxing-1 Nighttime Light Image. Geomatics Inf. Sci. Wuhan Univ. 2023, 48, 1273–1285. [Google Scholar]
- Xu, Z.; Gao, X. A novel method for identifying the boundary of urban built-up areas with POI data. Acta. Geogr. Sin. 2016, 71, 928–939. [Google Scholar]
- Xiao, Z.P.; Chai, Y.B.; Zhang, Y. Overseas Life Circle Planning and Practice. Planners 2014, 30, 89–95. [Google Scholar]
- ESRI. ArcGIS Desktop and Spatial Analyst Extension: Release 10.5; Environmental Systems Research Institute: Redlands, CA, USA, 2017. [Google Scholar]
- Getis, A.; Ord, J.K. The Analysis of Spatial Association by Use of Distance Statistics. Geo. Anal. 1992, 24, 189–206. [Google Scholar] [CrossRef]
- Yu, M.Y.; Li, J.Q.; Lv, Y.Q.; Xing, H.Q.; Wang, H.M. Functional Area Recognition and Use-Intensity Analysis Based on Multi-Source Data: A Case Study of Jinan, China. ISPRS Int. J. Geo-Inf. 2021, 10, 21. [Google Scholar] [CrossRef]
- Zhou, L.L.; Shi, Y.S.; Zheng, J.W. Business Circle Identification and Spatiotemporal Characteristics in the Main Urban Area of Yiwu City Based on POI and Night-Time Light Data. Remote Sens. 2021, 13, 5153. [Google Scholar] [CrossRef]


| POI Category | Main Modes of Operation | Quantity | Percentage |
|---|---|---|---|
| Shopping | Supermarkets, convenience stores, malls, grocery stores, etc. | 74,944 | 43.20% |
| Dining | Chinese food, foreign food, snacks, cakes and desserts, etc. | 51,055 | 29.40% |
| Living Services | Laundromat, photographic printing, beauty salon, etc. | 16,864 | 9.70% |
| Accommodation | Star hotels, express hotels, B&Bs, youth hostels, etc. | 12,136 | 7% |
| Education | Educational institutions, vocational training, study rooms, etc. | 10,401 | 6% |
| Sports | Gymnasiums, basketball courts, swimming pools, etc. | 3010 | 1.70% |
| Recreation | Bars, KTVs, movie theaters, chess and card rooms, etc. | 2898 | 1.60% |
| Sightseeing | Scenic spots, parks, playgrounds, cultural relics, etc. | 1892 | 1% |
| Nighttime Consumption Agglomeration | Included Items | Identification Results | Remote Sensing Image |
|---|---|---|---|
| Datang Everbright City | 1. Datang Everbright City Commercial Walking Street | 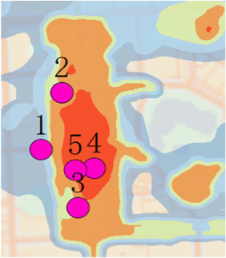 |  |
| 2. Xi’an Joy City Mall | |||
| 3. Qujiang Intime Department Store | |||
| 4. Xi’an Concert Hall | |||
| 5. Shaanxi Grand Theater | |||
| Xiaozhai Nighttime Consumption Cluster | 6. SAGA International Shopping Center | 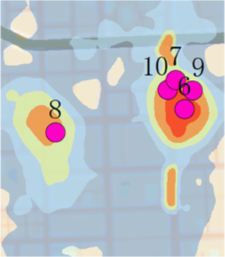 |  |
| 7. Kinshasa International Shopping Center | |||
| 8. Momopark Shopping Center 9. Harbour City Shopping Center | |||
| 10. Xing-Shan Temple West Street | |||
| North Gate Historical and Cultural Block | 11. Xiyang Market Street | 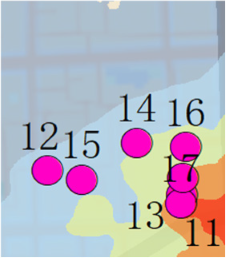 |  |
| 12. Miaohou Street | |||
| 13. Muslim Quarter | |||
| 14. Dapi yard | |||
| 15. Daxuexi Lane | |||
| 16. North Courtyard Gate | |||
| 17. Huejue Lane | |||
| Xi’an South Gate Nighttime Consumption Cluster | 18. Shuyuan Gate | 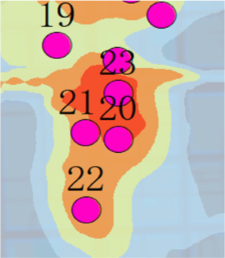 |  |
| 19. Defu Lane | |||
| 20. Shin Kong Place | |||
| 21. Wangfujing Department Store | |||
| 22. Zhongmao Plaza | |||
| 23. Liuyuan Plaza | |||
| Bell Tower Nighttime Consumption Cluster | 24. Yisu Theater Cultural District | 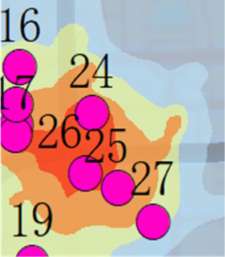 | 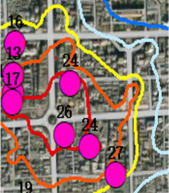 |
| 25. Luoma Pedestrian Street | |||
| 26. Kaiyuan Mall | |||
| 27. Dongmutou Street | |||
| Administrative Center Nighttime Consumption Cluster | 28. City On Shopping Center |  |  |
| 29. Darongcheng Shopping Center | |||
| 30. Hanshin Shopping Plaza | |||
| Tang West Market in Xi’an | 31. Xishicheg Shopping Center | 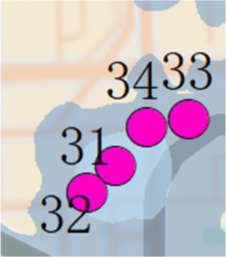 | 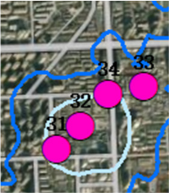 |
| 32. Tang West Market Silk Road Style Street | |||
| 33. Tang West Market International Antique City | |||
| 34. Tang West Market Museum |
Disclaimer/Publisher’s Note: The statements, opinions and data contained in all publications are solely those of the individual author(s) and contributor(s) and not of MDPI and/or the editor(s). MDPI and/or the editor(s) disclaim responsibility for any injury to people or property resulting from any ideas, methods, instructions or products referred to in the content. |
© 2024 by the authors. Licensee MDPI, Basel, Switzerland. This article is an open access article distributed under the terms and conditions of the Creative Commons Attribution (CC BY) license (https://creativecommons.org/licenses/by/4.0/).
Share and Cite
Wan, W.; Chen, H.; Yang, X.; Li, R.; Cui, Y.; Hu, Y. Identifying the Hierarchical Structure of Nighttime Economic Agglomerations Based on the Fusion of Multisource Data. ISPRS Int. J. Geo-Inf. 2024, 13, 188. https://doi.org/10.3390/ijgi13060188
Wan W, Chen H, Yang X, Li R, Cui Y, Hu Y. Identifying the Hierarchical Structure of Nighttime Economic Agglomerations Based on the Fusion of Multisource Data. ISPRS International Journal of Geo-Information. 2024; 13(6):188. https://doi.org/10.3390/ijgi13060188
Chicago/Turabian StyleWan, Weijie, Hongfei Chen, Xiping Yang, Renda Li, Yuzheng Cui, and Yiyang Hu. 2024. "Identifying the Hierarchical Structure of Nighttime Economic Agglomerations Based on the Fusion of Multisource Data" ISPRS International Journal of Geo-Information 13, no. 6: 188. https://doi.org/10.3390/ijgi13060188