Article

A Novel Approach to Urban Village Extraction and Generalization from Digital Line Graphics Using the Computational Geometric Method and the Modified Hausdorff Distance

1
Faculty of Geomatics, Lanzhou Jiaotong University, Lanzhou 730070, China
2
Key Laboratory of Urban Land Resources Monitoring and Simulation, Ministry of Natural Resources, Shenzhen 518034, China
3
Postdoctoral Workstation of Gansu Sanhe Digital Surveying and Geographic Information Technology Co., Ltd., Tianshui 741000, China
4
National-Local Joint Engineering Research Center of Technologies and Applications for National Geographic State Monitoring, Lanzhou 730070, China
5
Key Laboratory of Science and Technology in Surveying & Mapping, Gansu Province, Lanzhou 730070, China
6
College of Earth and Environmental Science, Lanzhou University, Lanzhou 730070, China
7
College of Resources and Environment Engineering, Tianshui Normal University, Tianshui 741000, China
*
Author to whom correspondence should be addressed.
ISPRS Int. J. Geo-Inf. 2024, 13(6), 198; https://doi.org/10.3390/ijgi13060198
Submission received: 13 April 2024 / Revised: 3 June 2024 / Accepted: 9 June 2024 / Published: 13 June 2024

Abstract

:
Urban villages represent informal residential areas emerging since China’s rapid urbanization process. Scientific map generalization of urban villages with scientific maps aids readers in discerning their distribution and making informed decisions concerning them. However, there is still a scarcity of research on the automatic extraction and generalization of urban villages from vector data, which needs to be studied to further improve the expression of maps. To address this problem, this paper presents a methodology for the extraction and generalization of urban villages from Digital Line Graphics. Firstly, a heuristic approach is employed to analyze the atypical morphological characteristics of urban villages. Then, indices based on computational geometry and the modified Hausdorff distance are utilized to quantify these traits. Lastly, an automatic generalization principle for urban villages is offered. The approach was tested in experimental blocks and proved to be effective. It offers a novel method for the automatic extraction and cartography of urban villages.

1. Introduction

The term “urban village” specifically refers to an unplanned informal residential area in China, the area is characterized by rural regions being enveloped by urban architectural environments; urban village emerged in the urbanization process progresses at a certain stage [1,2]. It represents a new spatial category emerging with the rapid urbanization of China [3]. Urban villages are commonly found across Chinese cities and provide affordable housing for a large population of migrant workers [4], possessing unique spatial properties and social roles [3]. Therefore, the scientific and rational approach to the renovation and reconstruction of urban villages is closely related to national welfare and people’s livelihoods, and it constitutes a pressing issue that needs to be addressed in the process of urban development [5,6].
In the field of cartographic generalization, most existing research studies pertaining to settlement polygons focus on structured settlements, such as regular-shaped buildings [7], buildings with typical shapes [8], or arrangements [9,10,11,12], but limited studies address map features with certain semantics, e.g., urban villages. On the other hand, our preliminary research has identified that urban villages possess a distinctive morphology in 1:5K Digital Line Graphics (DLGs). And DLGs are a crucial component of the national spatial data infrastructure (NSDI), which can be paraphrased as digital map, as in the literature [13]; DLGs include not only linear features but also point and polygonal features. Or in other words, DLGs have a similar meaning to the multiple representation database (MRDB) [14]. As mentioned before, the distinctiveness of urban villages in 1:5K DLGs is associated with atypical morphological characteristics of urban villages, such as high building density, small roof areas, and narrow internal roads [1]. These characteristics make it impossible to individually delineate each building at the 1:5K scale. Instead, cartographers apply the aggregation operator, that is, portraying multiple buildings collectively. The amalgamated residential areas exhibit pronounced features: (1) they are closely neighboring; (2) the shapes of the facing line segments (briefly referred to as FLSs) of two neighboring residential polygons tend to be very similar; and (3) the areas of urban village polygons are relatively larger and generally irregular in shape, as illustrated in Figure 1 and Figure 2: Figure 1 shows example settlement polygons, which can be grouped into urban villages and a built-up district, while Figure 2 is a corresponding satellite map of the same region as Figure 1.
In the more developed cities of China, urban villages and built-up areas are generally concentrated in their distribution [15]. However, Lanzhou, as the capital city of a less developed province [16], exhibits a pattern where urban villages and urbanized areas are intermingled, as illustrated in Figure 1. Therefore, in the process of map generalization, it is paramount to first differentiate urban villages from other established urban districts, as they represent distinct semantics. Subsequently, appropriate generalization within each semantic region should be carried out. For example, within the territory of urban villages, it is necessary to establish a hierarchy of road “Strokes”, which should then be selected from the longest to the shortest to accurately reflect the skeletal structure of the urban villages.
Therefore, the most crucial initial step in the automated generalization of urban villages is their extraction. This involves inferring the semantics of the data through their shape. An interesting finding is that the outcomes judged by the human eye are mostly correct, which suggests that the principles of cognition can be deduced from the basis of human judgment, i.e., a heuristic approach. By analyzing the geometric morphologies of urban villages in vector datasets and their surrounding residential areas, it has been revealed that within 1:5K-scale data, the shapes of urban villages differ from those of developed residential areas, as follows:
(1)
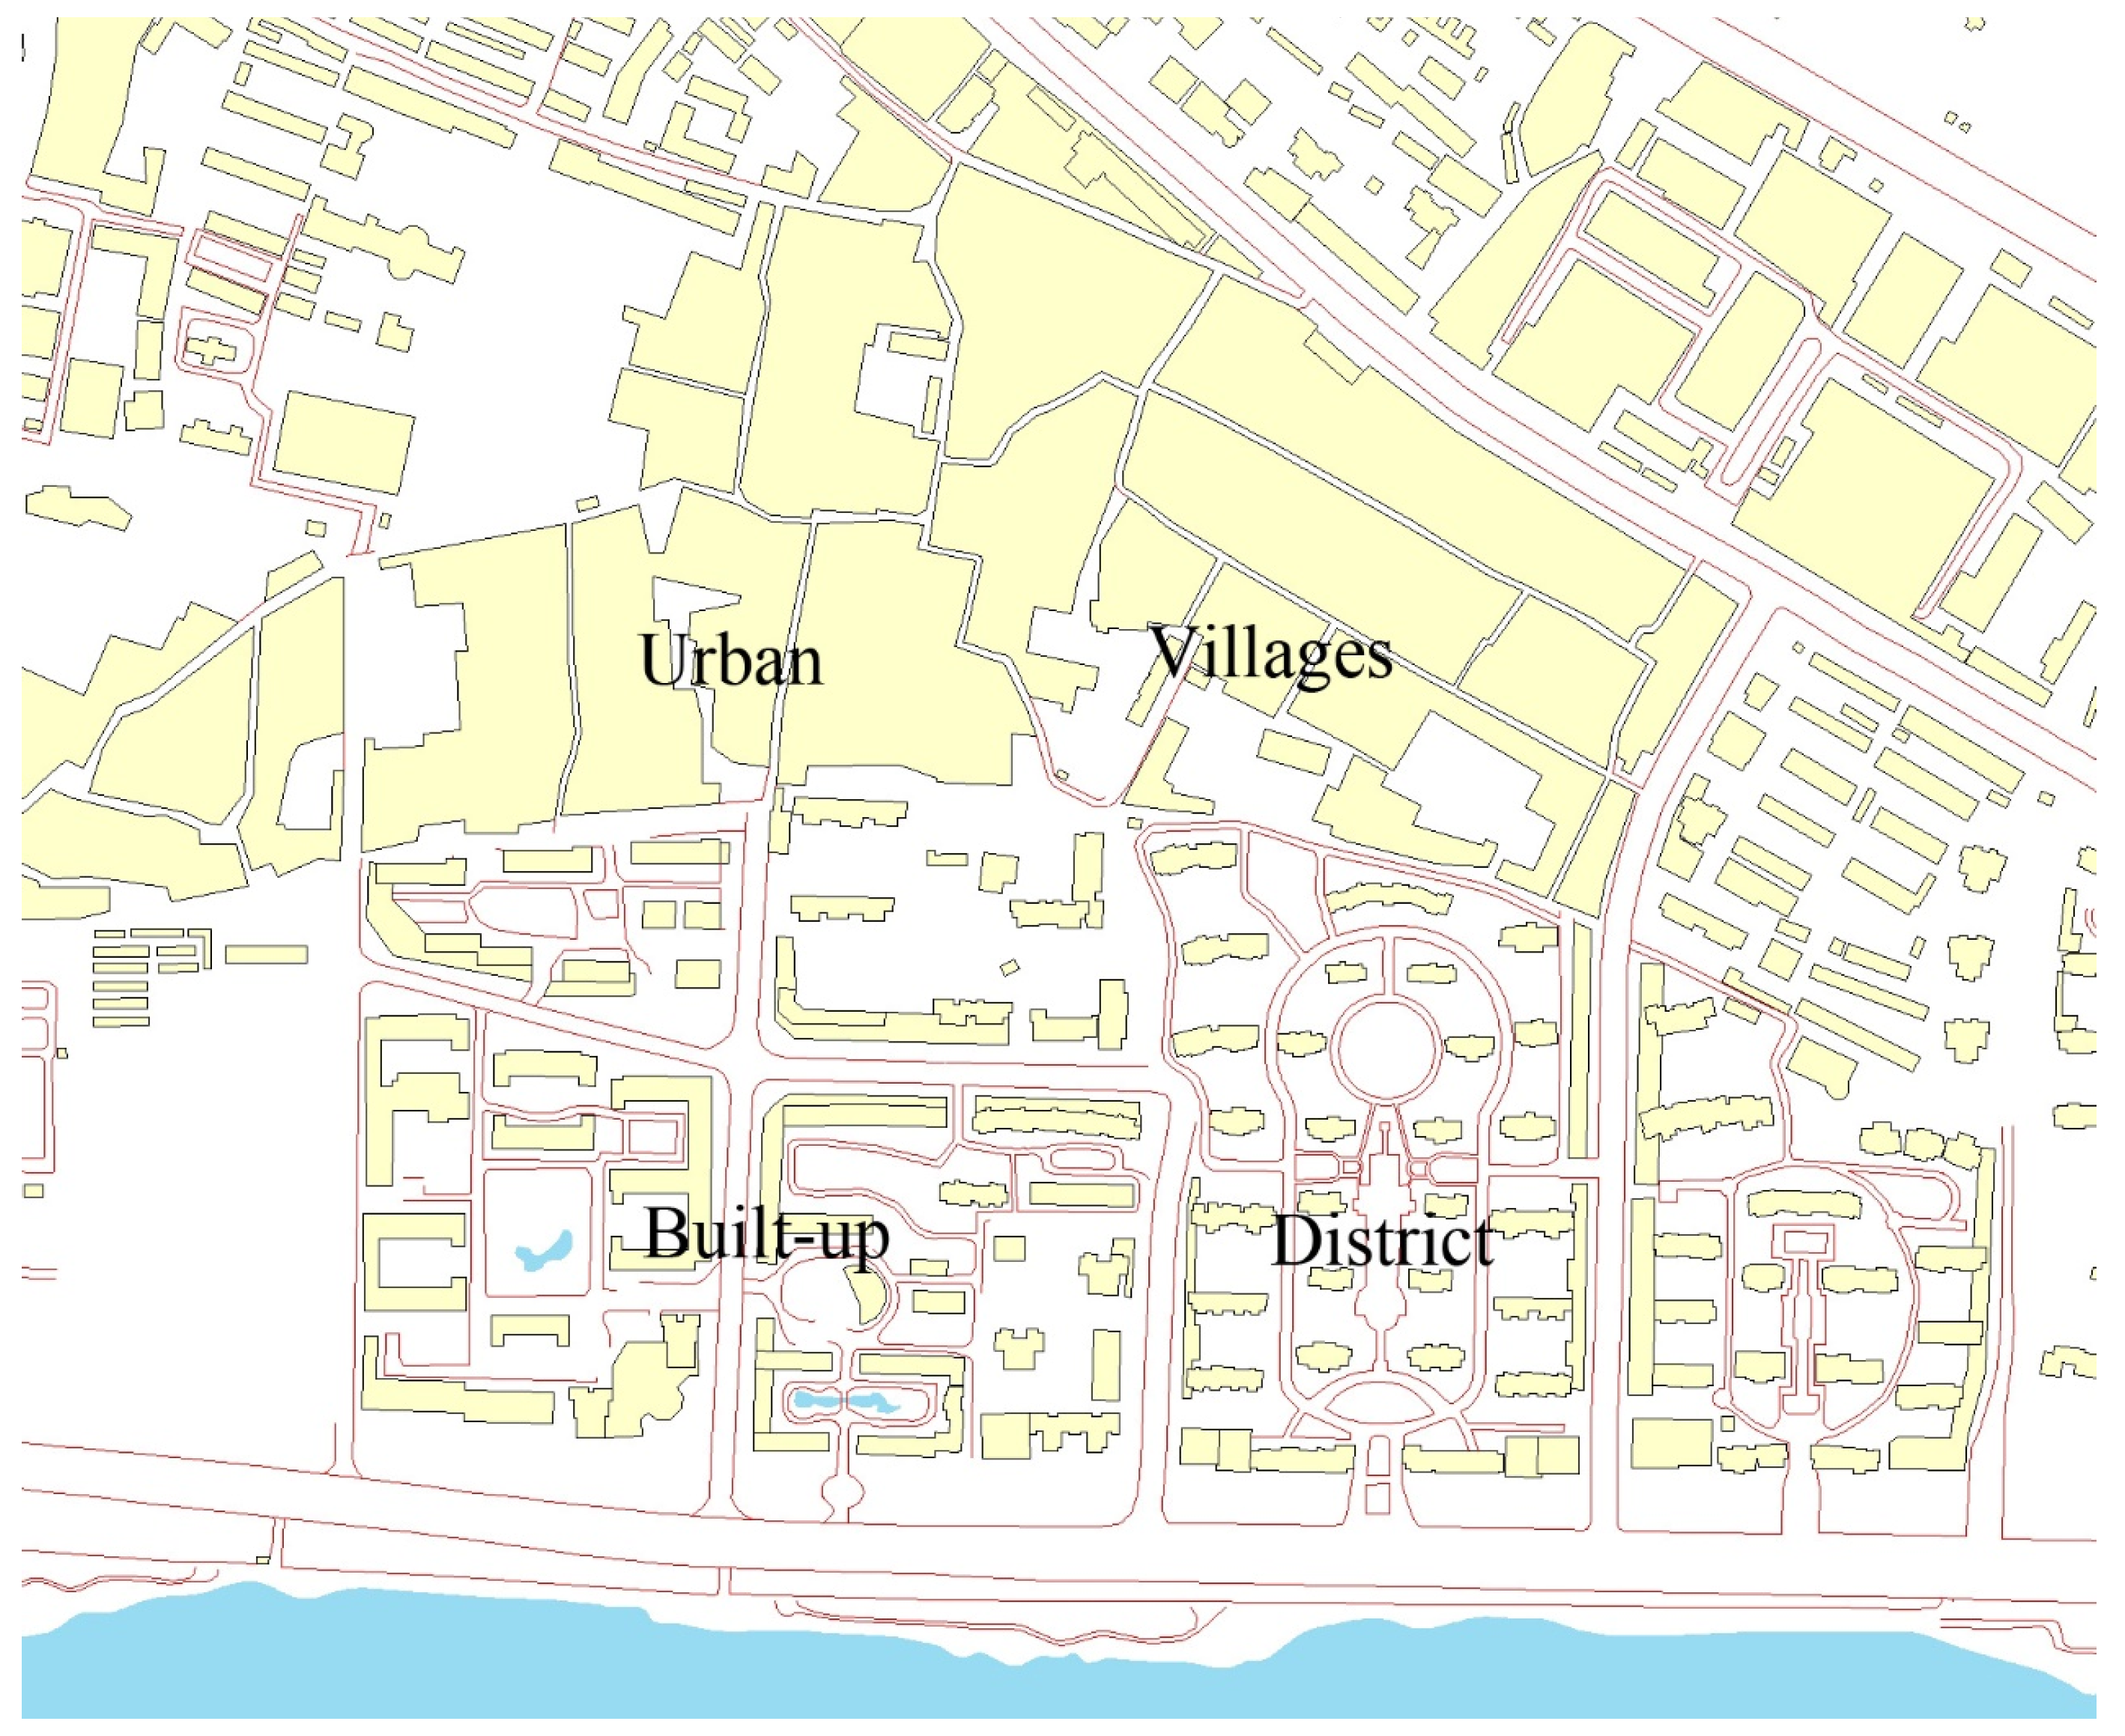
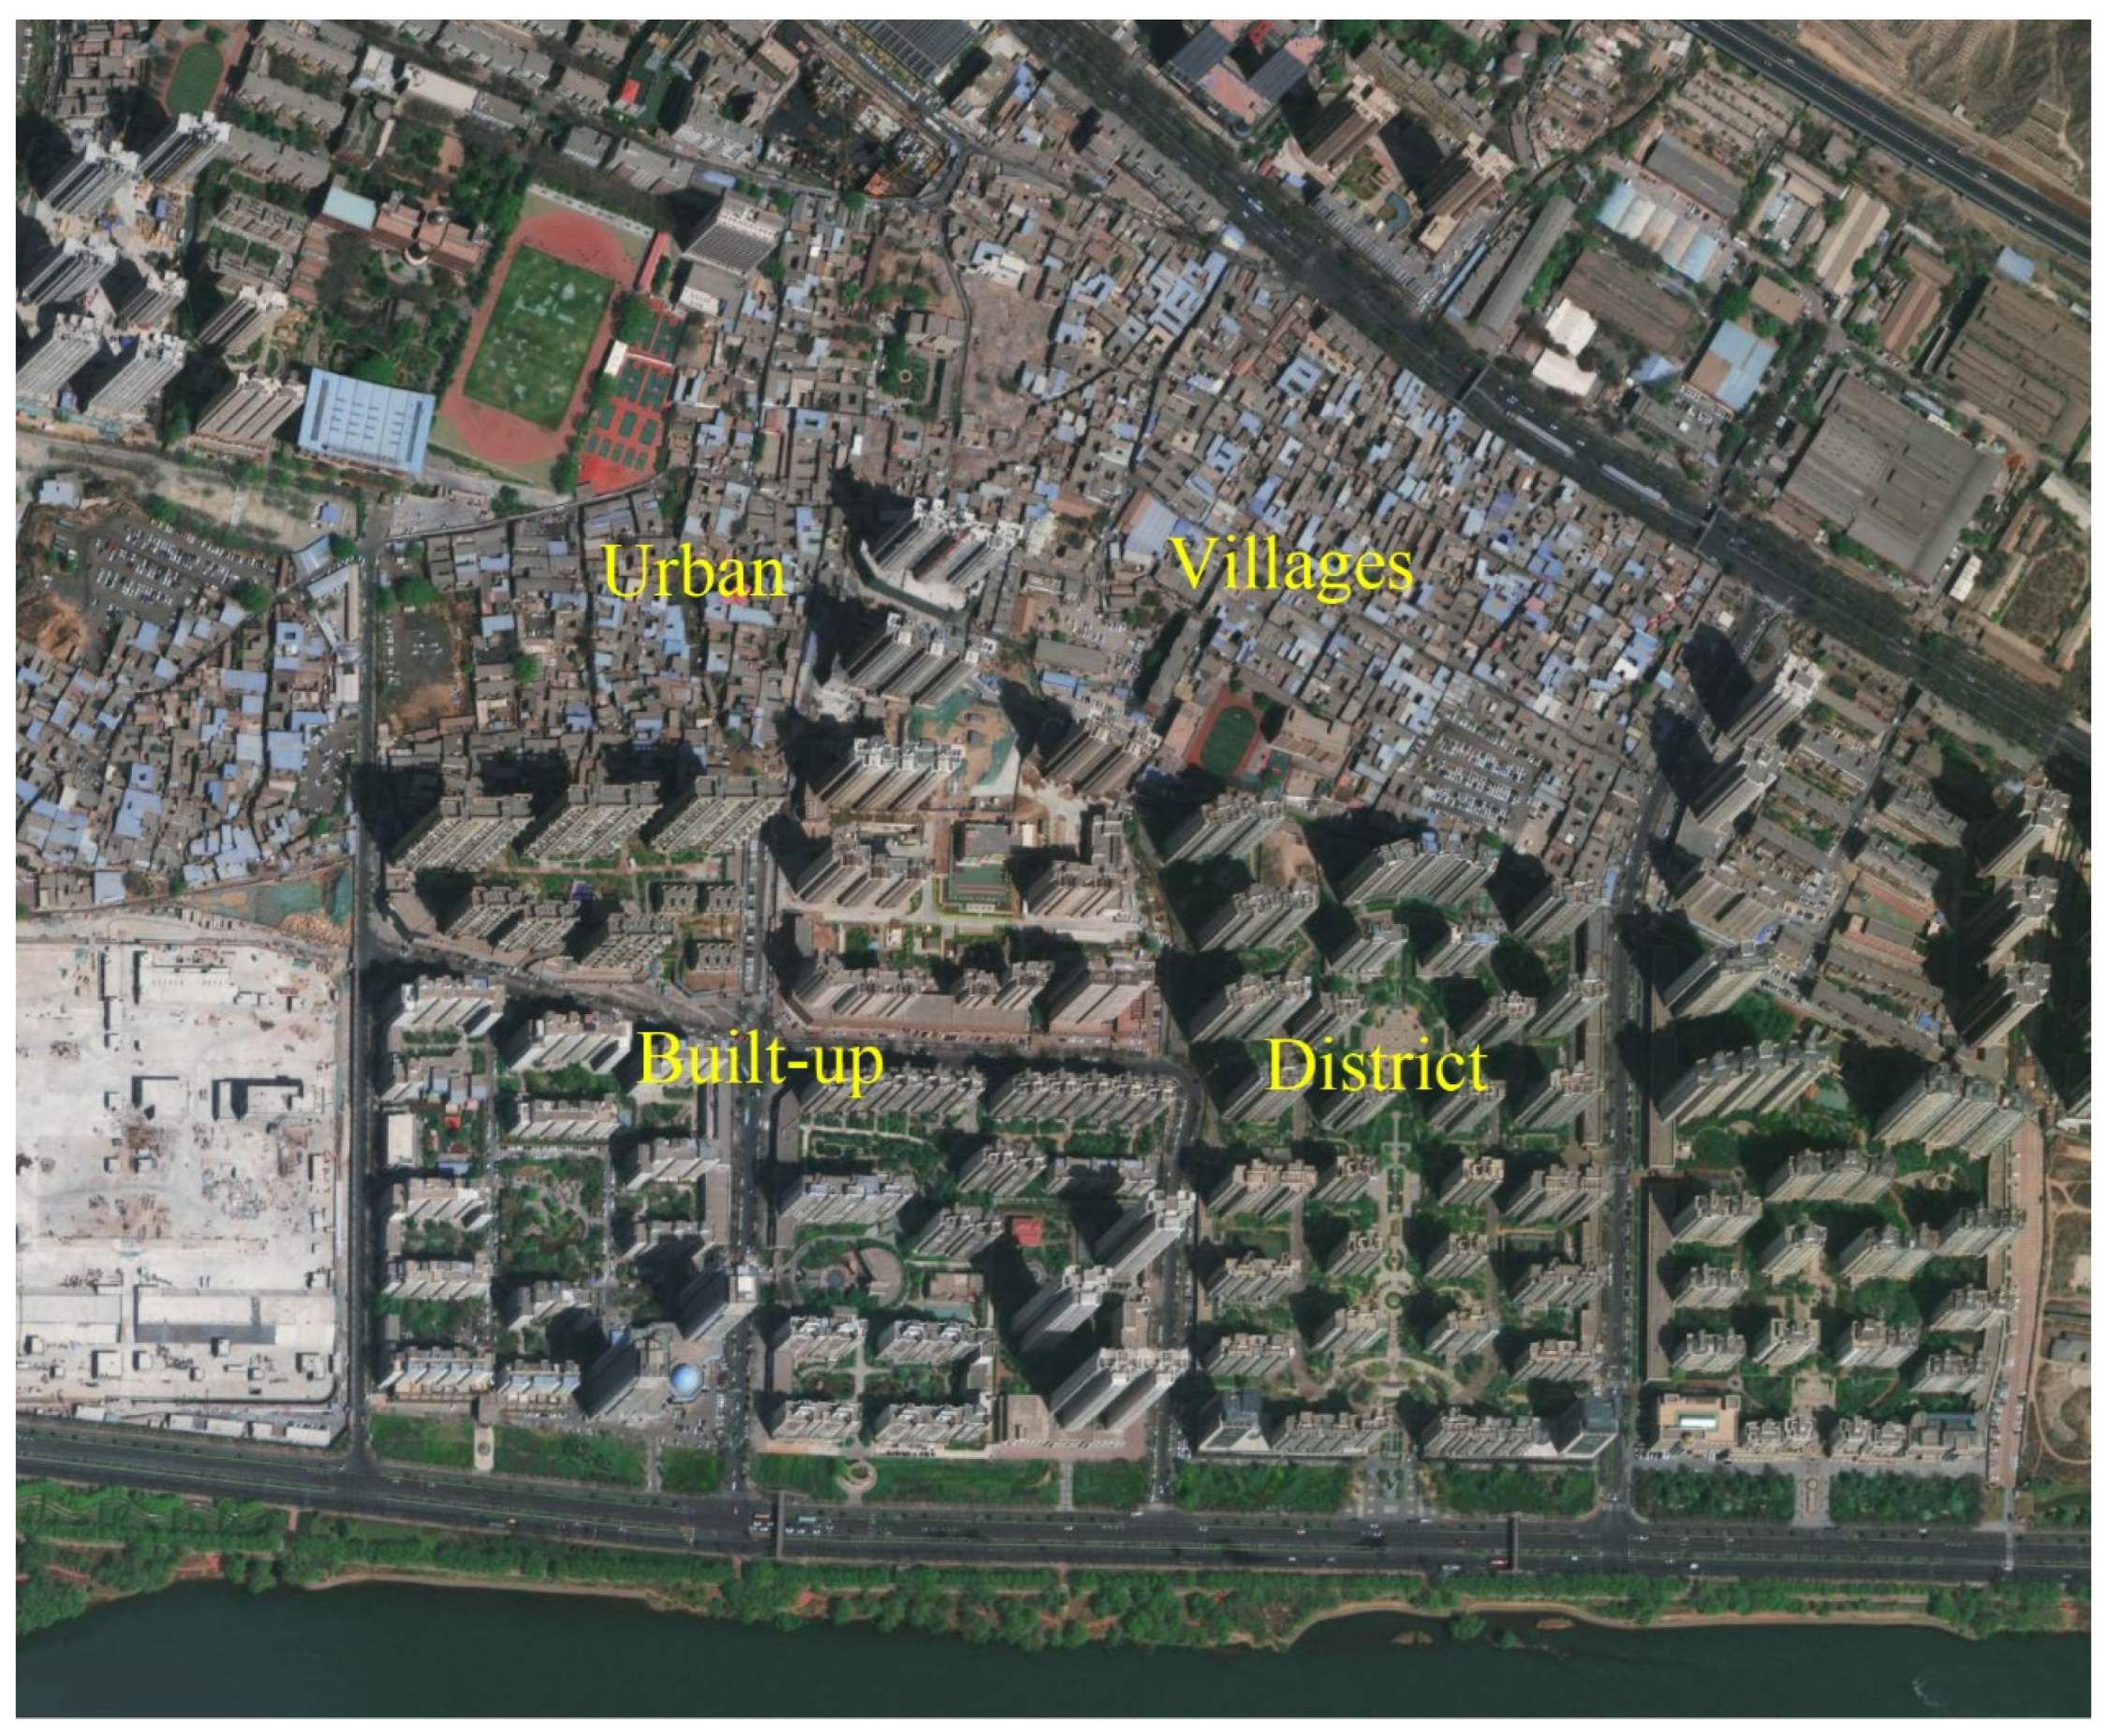
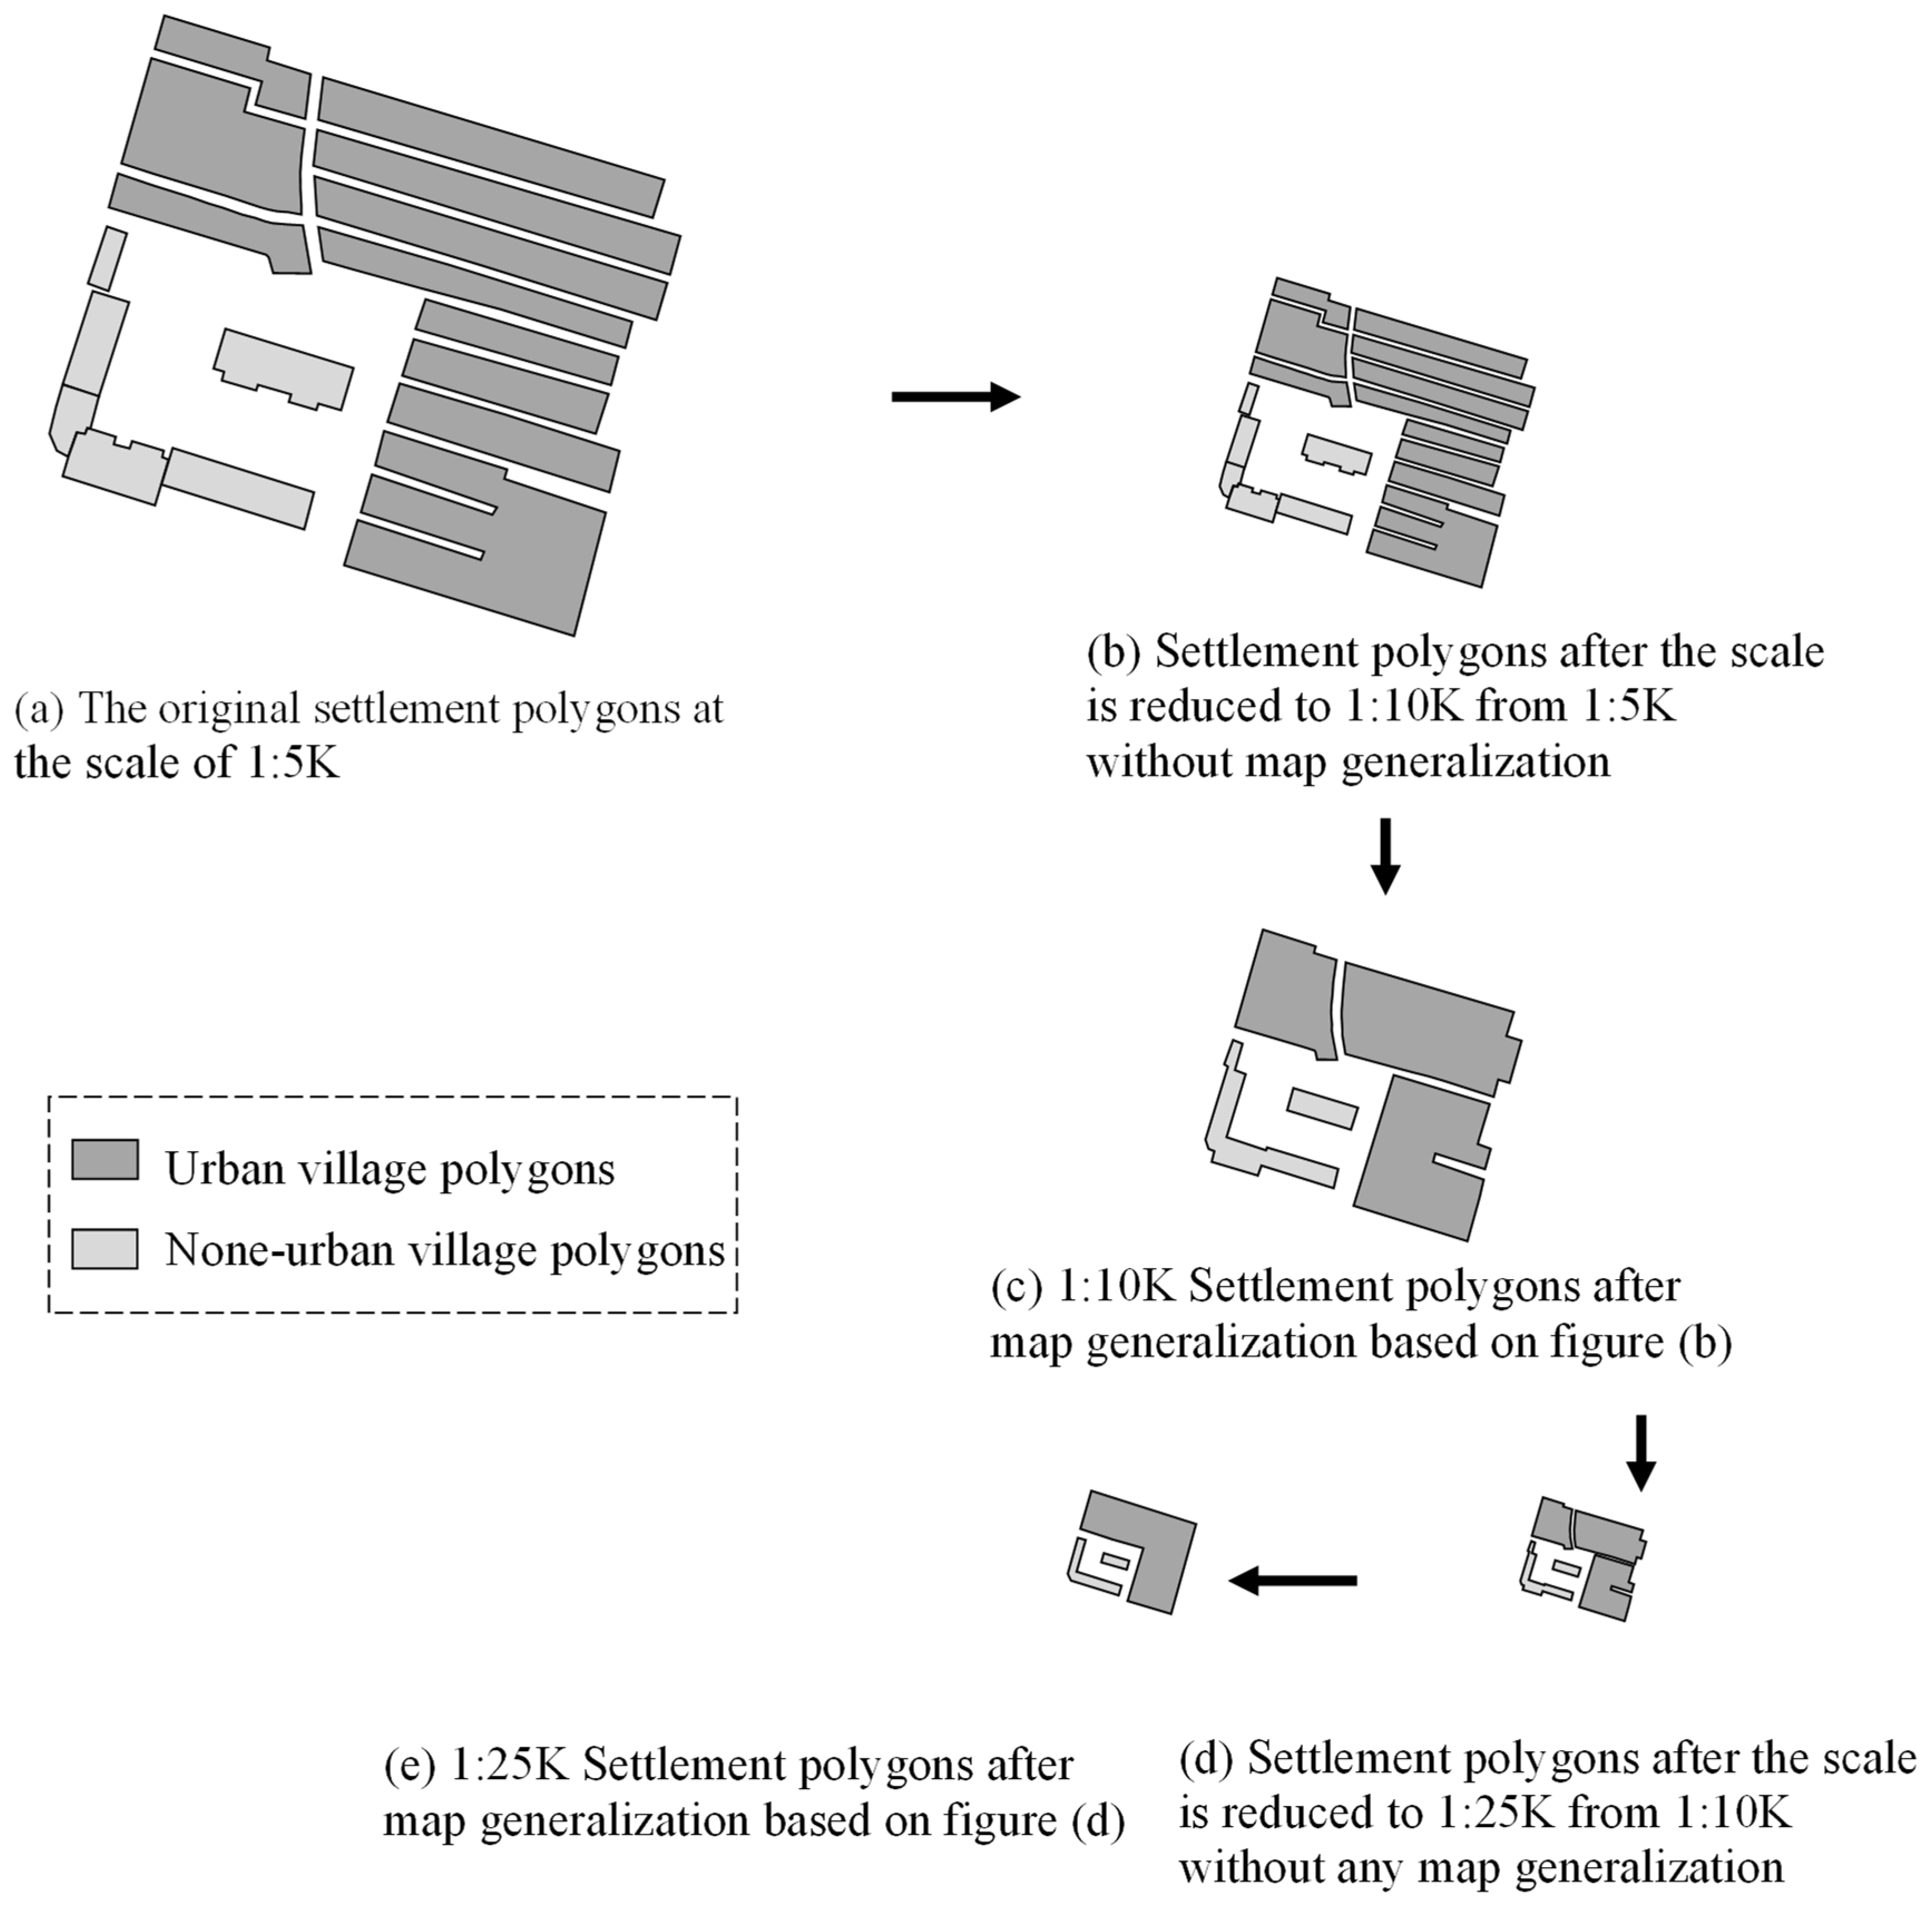
Since the areas of individual urban village buildings do not meet the minimum visible area requirement when represented individually, urban villages are generalized as large polygons (as depicted in Figure 1);
(2)
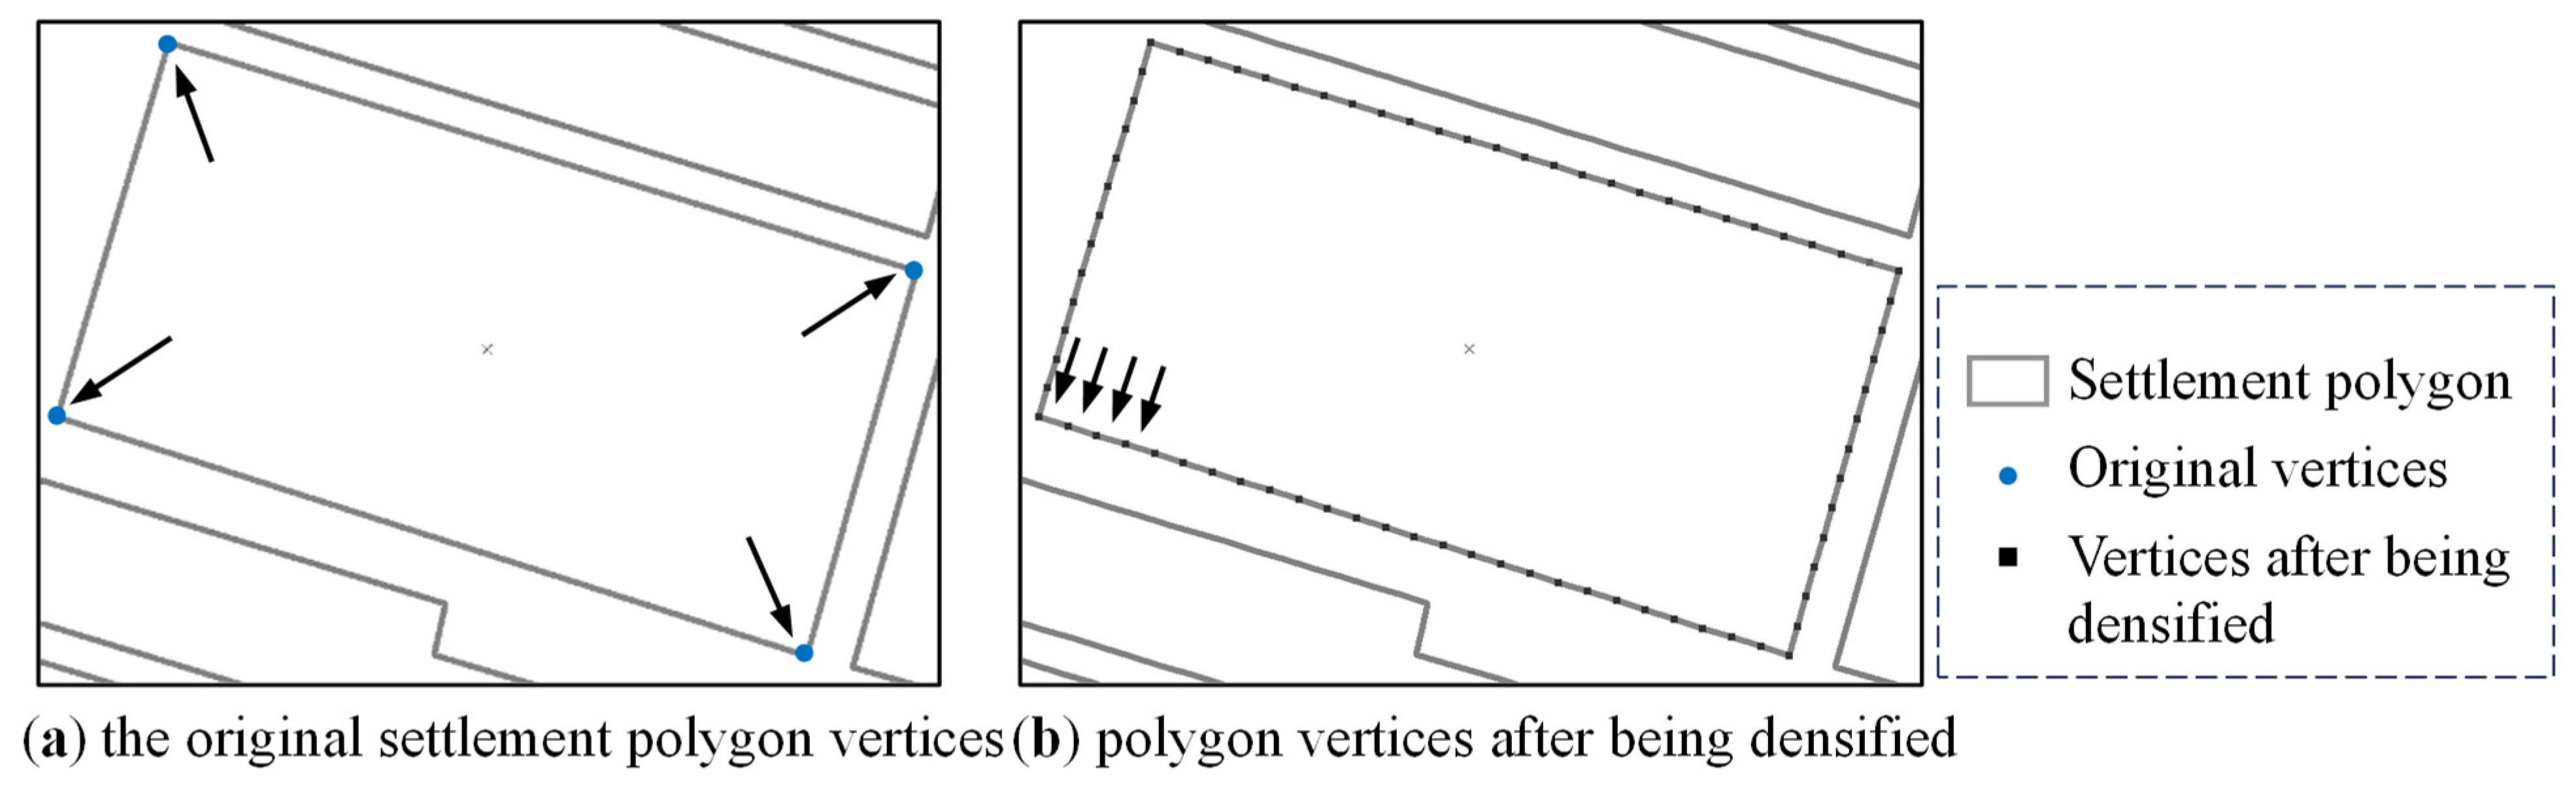
The spacing between buildings is very small, approximately equal to or less than 4.4 m;
(3)
The confronting line segments of urban village buildings, which are on the sidelines of roads, result in similar shapes to the FLSs of adjacent buildings.
By analyzing these characteristics, urban villages can be automatically extracted from existing large-scale (1:5K or 1:10K) vector map databases. Subsequently, when reducing the map scale (to greater than or equal to 1:25K), one can implement an automatic generalization that is appropriate to the spatial features of urban village residential areas and retains their semantic characteristics, thus producing maps on smaller scales. It is expected that the multi-scale maps obtained in this way will provide more scientific support for decisions on the development of urban villages.
The remainder of the article is structured as follows: Section 2 presents the related research; Section 3 describes the methodology; Section 4 demonstrates the experiment; and Section 5 concludes the whole paper.

2. Related Research

Most of the existing research on urban villages focuses on policy-making, for instance, researching the unique spatial attributes and social roles of urban villages and developing new urban planning models aiming to replace radical redevelopment and eradicate policies targeting them [3]; a neoliberal policy approach that provides a more satisfactory outcome in urban village redevelopment [17]; and other redevelopment projects [18,19], expanding the concept of environmental considerations to include informal rules and the participation of villagers in the transformation process [2] as well as advancing the ideological foundations for the regeneration of urban villages [20].
Other research about urban villages encompasses the following aspects: the use of Super-Resolution Generative Adversarial Networks (SRGANs) for the automatic detection of crowded and unplanned urban environments (i.e., urban villages) in remote sensing images [1], as well as analyzing the relationship between the development patterns of urban villages and overall urban planning [4], while in the field of automated map generalization, Yu et al. [21] and Li et al. [22] focused on automatic generalization methodologies for known urban village buildings; that is, they focused on the generalization method, with experimental data selected from urban villages by the researchers before the generalization process.
It is evident that current research on urban villages is primarily concentrated on policy formulation, ideological bases, planning, automatic generalization, etc. However, as mentioned in the introduction, prior to implementing the aforementioned tasks, the ability to automatically extract urban villages from existing datasets and to generalize them automatically while preserving the semantic features of “urban villages” would benefit the decision-making process in support of these tasks. Crivellari et al. [1] utilized remote sensing methods to extract urban villages from image data, which is not directly applicable for vector cartography. Yu et al. [21] and Li et al. [22] generalized urban villages in developed cities of China, whose characteristics are different from those of less developed cities. Therefore, it is necessary to study the extraction and generalization of less developed cities. At the same time, the unique morphology of urban village settlements in the 1:5K vector DLG data provide favorable conditions for the automatic extraction and generalization of urban villages based on vector data, and for producing maps. This is also the task that the present paper aims to accomplish. Thus, the experimental data used in this article are from the 1:5K DLG database; they are official data from the provincial geomatics center, and their quality can be ensured by a rigorous “Two-level inspection and one-level acceptance system”.

3. Methodology

As previously mentioned, the characteristics of combined urban village residential areas on the 1:5K map scale are as follows: (1) close proximity to one another; (2) highly similar FLSs of each couple of neighboring polygons; (3) a comparatively large area and generally irregular shape. Consequently, this study selects two metrics to quantify the aforementioned three traits; they are as follows: (1) the Area Ratio (AreaRatio) and (2) the modified Hausdorff distance (MHDistance) between adjacent residential area polygons regarding their FLSs. Figure 3 illustrates a flowchart of the method for urban village extraction as described in this paper.
As shown in Figure 3, the proposed method starts with a pre-process, and in this procedure, the settlement polygons of an urban area are divided into different groups by road network polygons, and network polygons are created from the urban arterial roads. Then, taking a settlement polygon group that is named Block S within a certain network polygon as an example, AreaRatio and MHDistance indicators are employed to extract urban villages. The method for urban village extraction from other blocks is the same.
In Figure 3, si and sj represent any settlement polygon in Block S, S1 represents the candidate set for urban village polygons in S, and S2 is the candidate set for non-urban village polygons in S; they are initialized as empty sets before the urban village extraction process.
Section 3.1, Section 3.2, Section 3.3 and Section 3.4 provide a detailed description of the method used in this paper. Section 3.1 presents the pre-processing, in which settlement polygons are divided into different blocks by road networks formed by arterial roads, and also, the constrained Delaunay triangulation and the Thiessen polygons for the settlement polygons in each block are generated. Section 3.2 describes the calculation method for the AreaRatio indicator; Section 3.3 demonstrates the calculation method for the MHDistance.

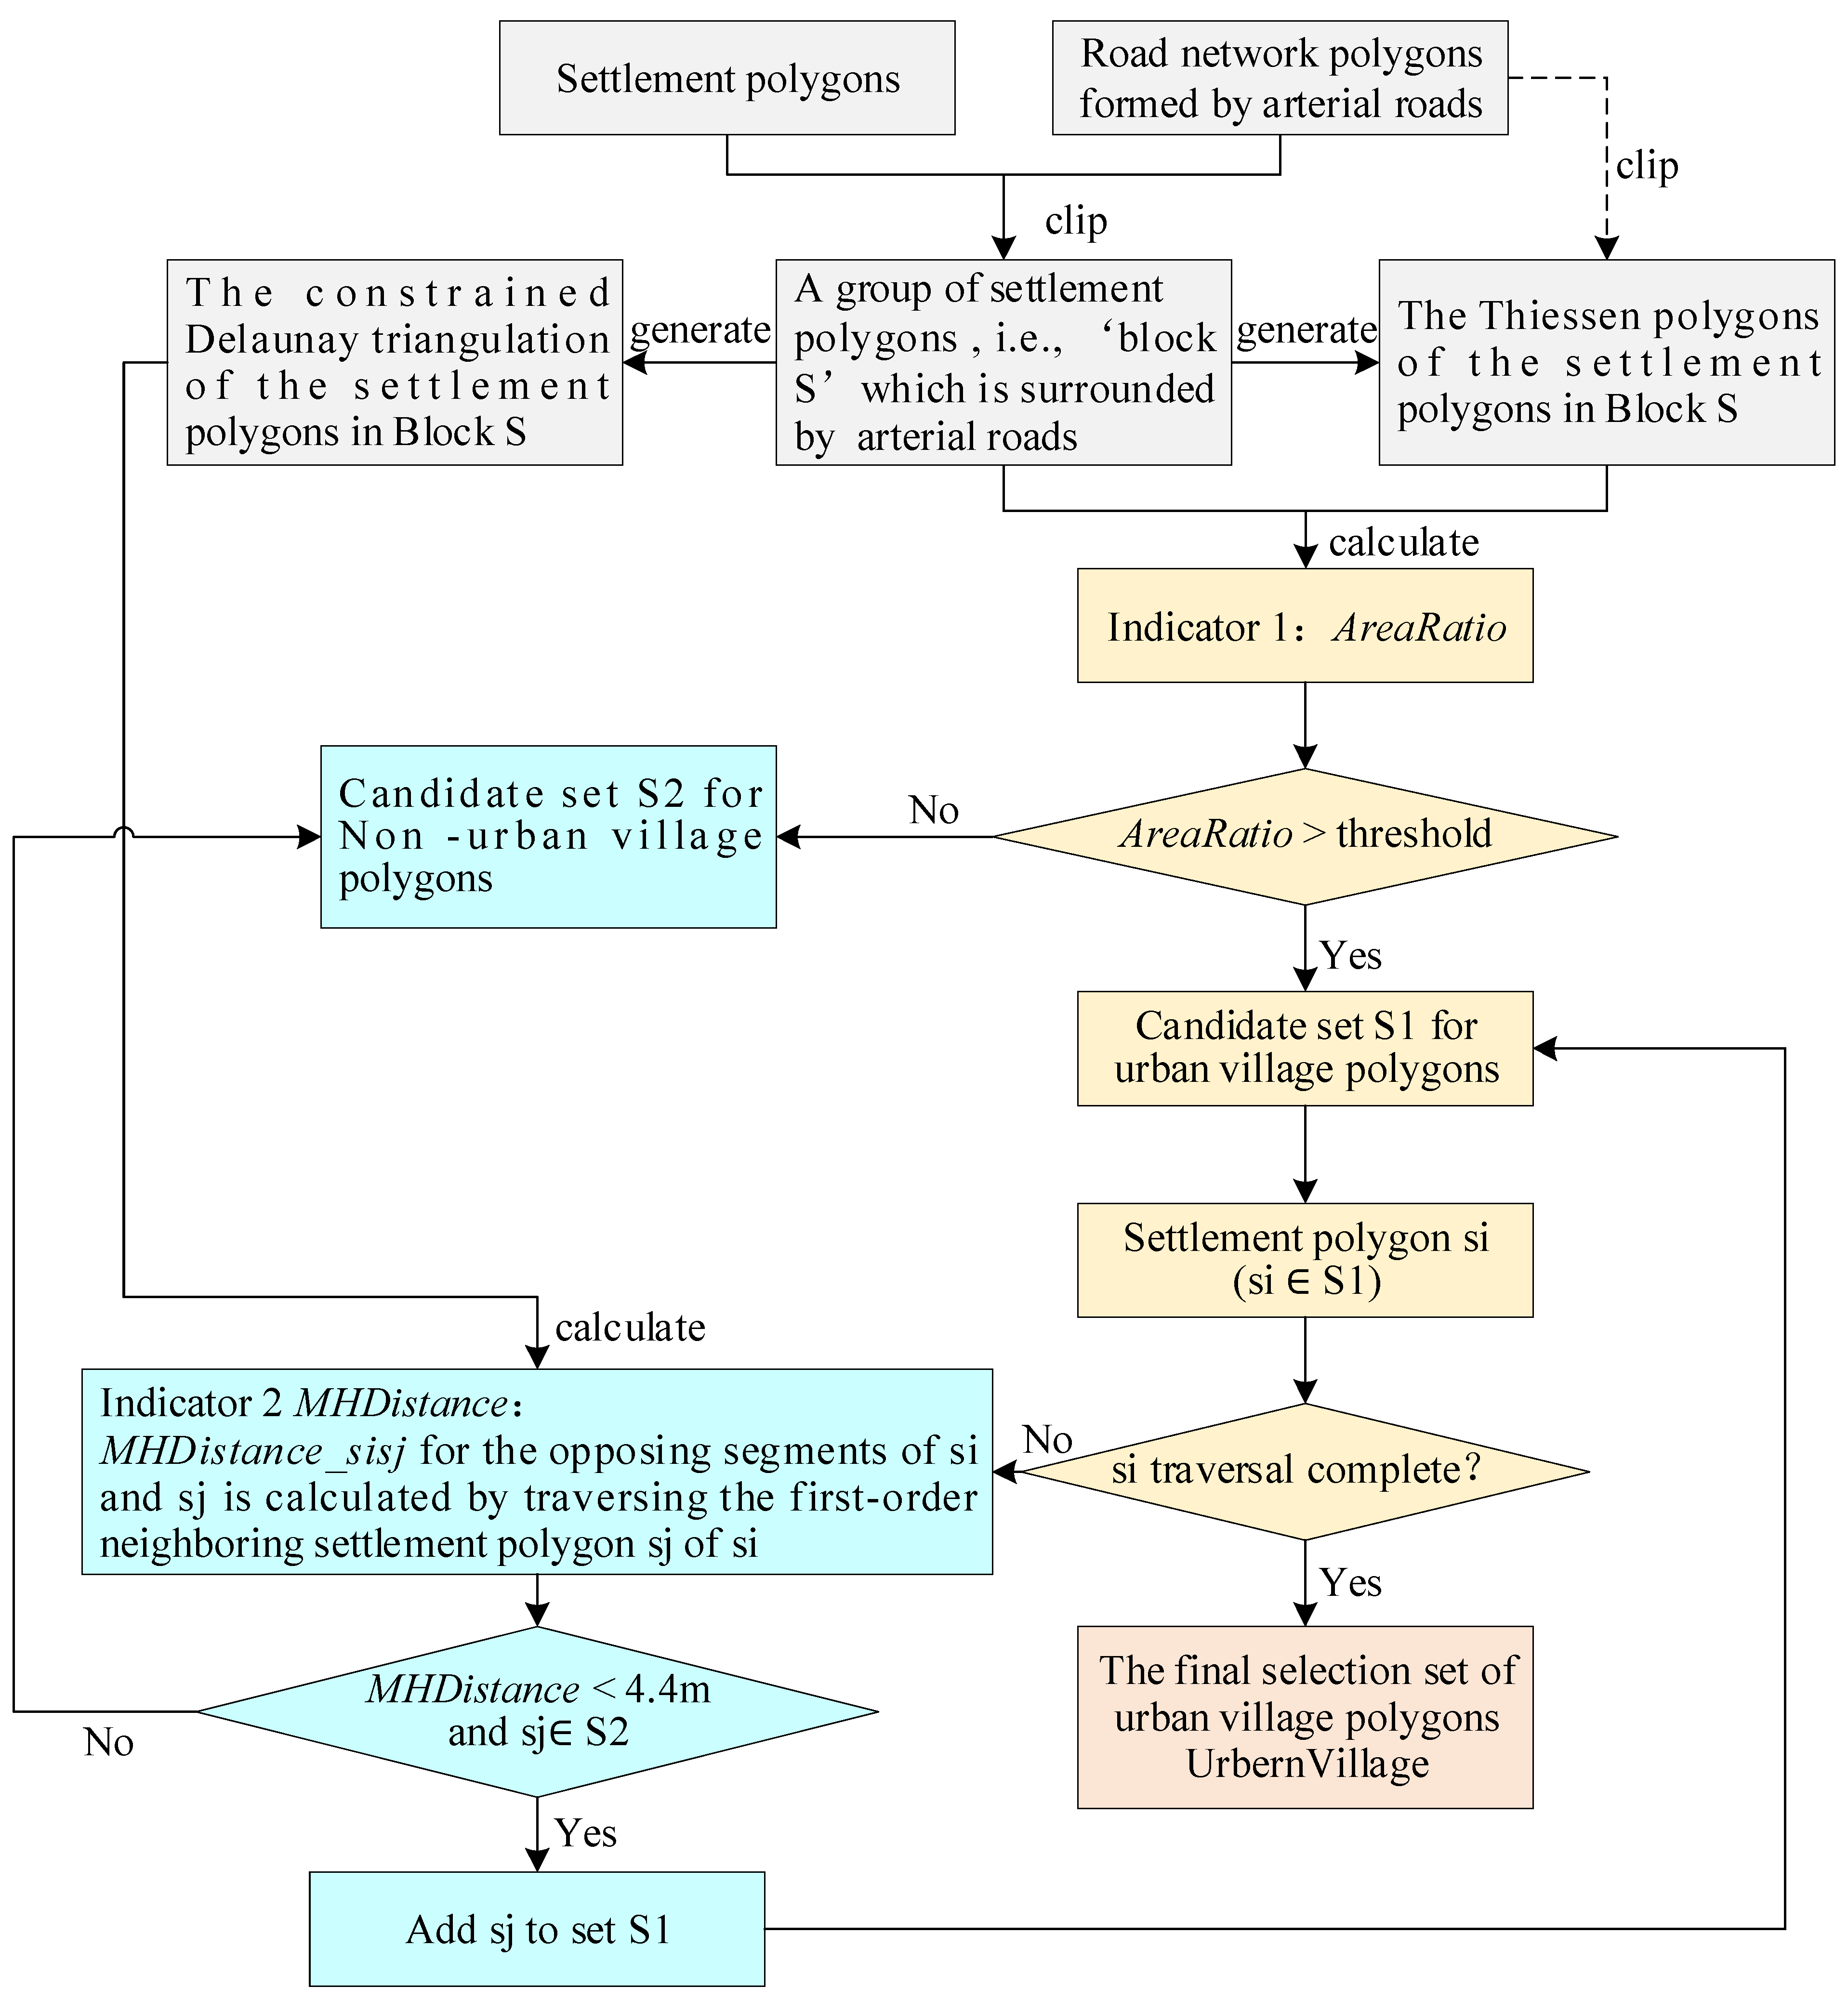
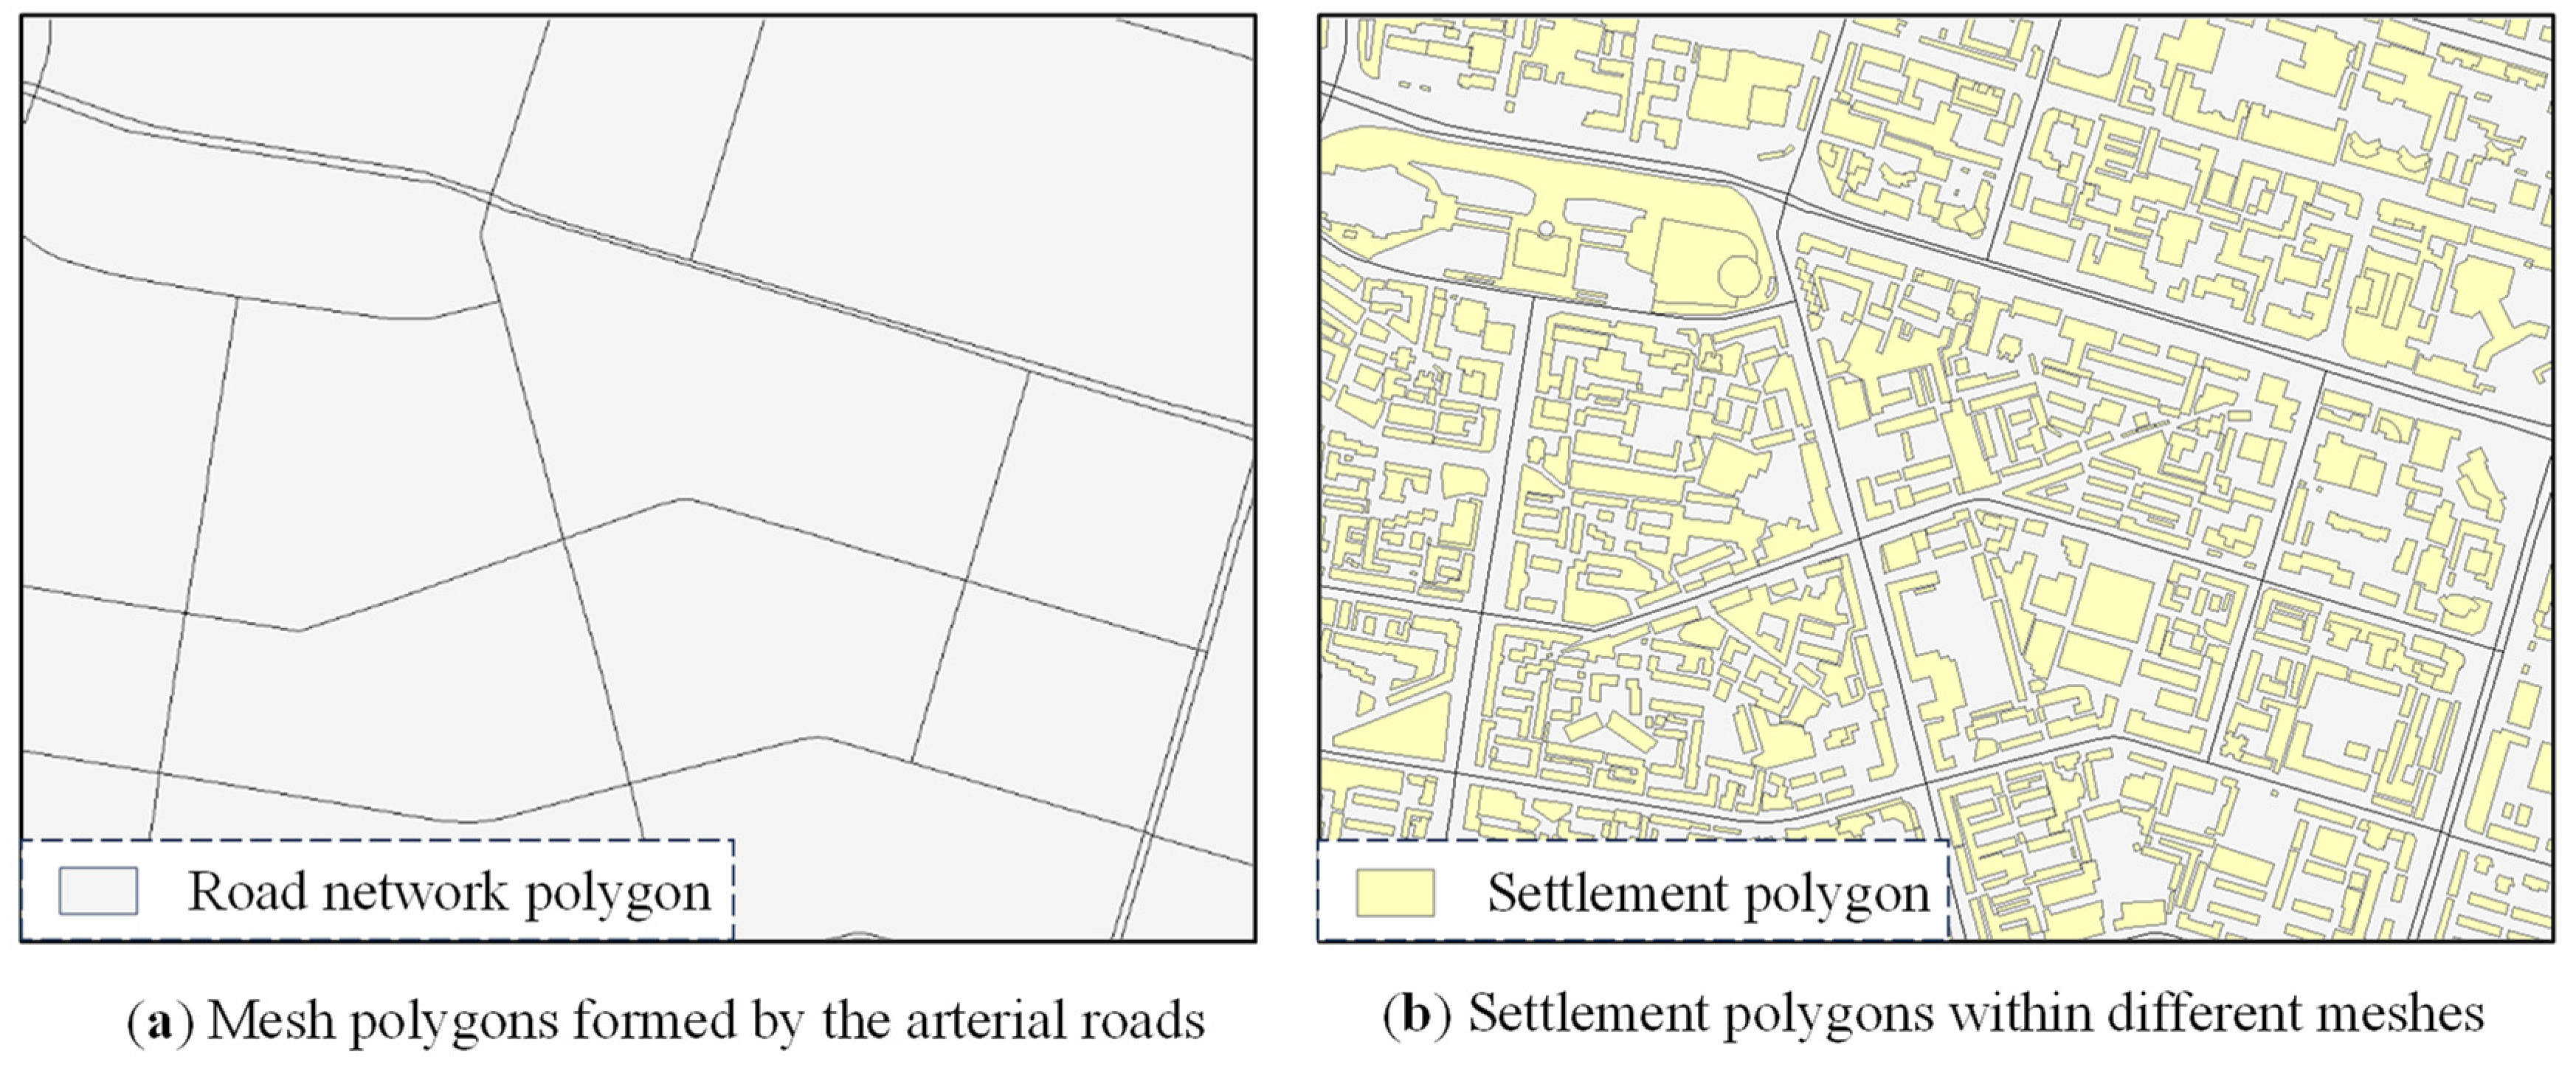
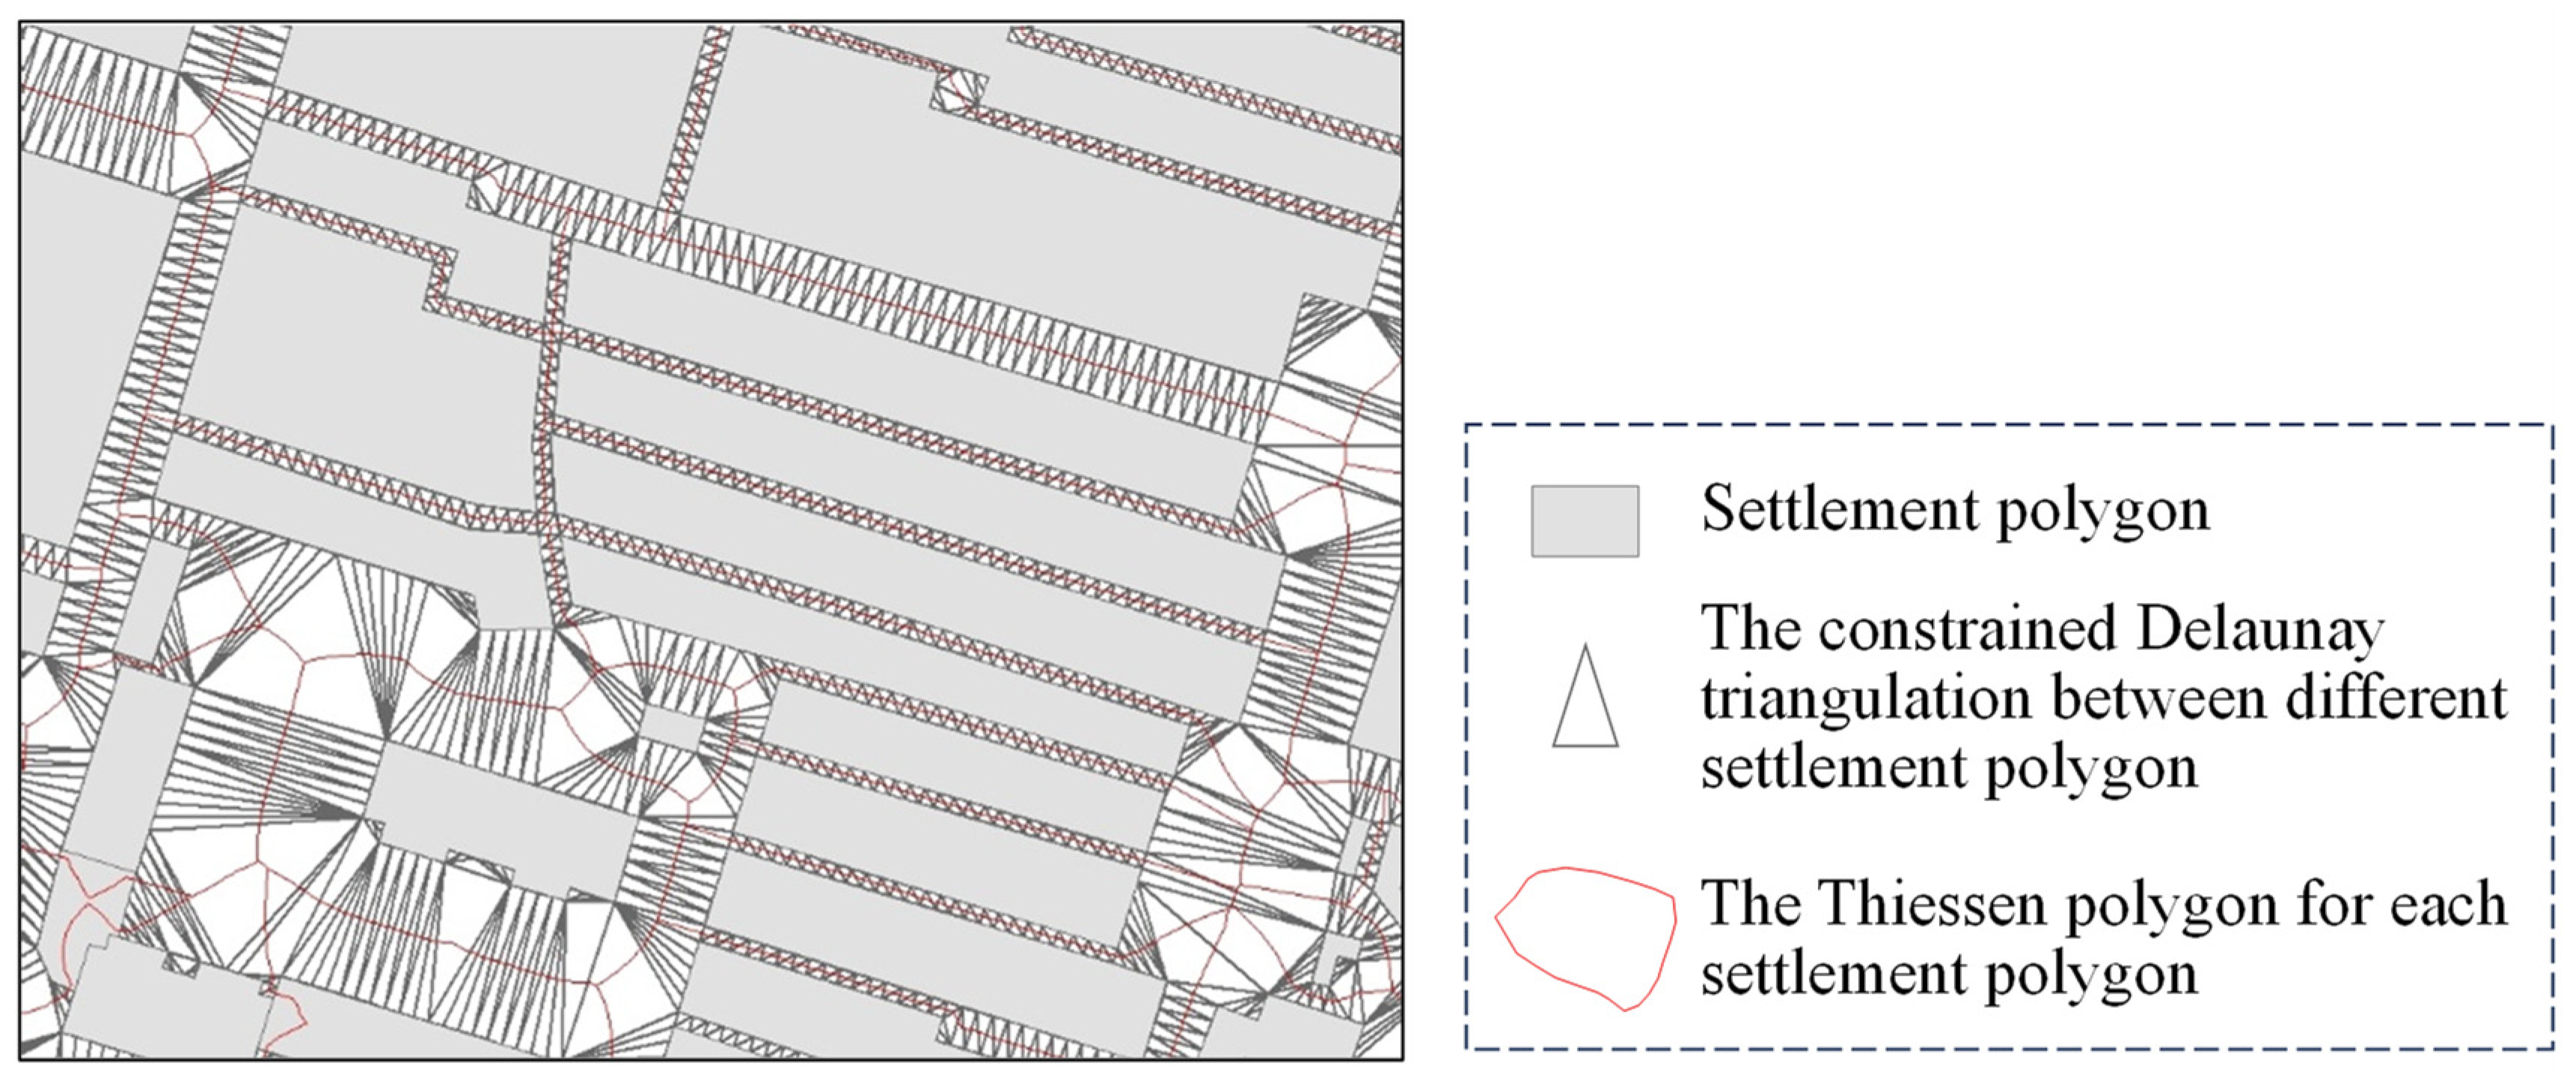
3.1. Division of City Blocks from Settlement Polygons

Based on the principles of urban morphology [23,24,25], the road network formed by arterial roads imposes the first layer of constraints on groups of buildings within a city. Thus, the premise for extracting urban village residential areas in this paper is through the use of main thoroughfares (primarily including main and secondary roads) to divide the city’s residential land into different “blocks.” The subsequent operations outlined in Section 3.2, Section 3.3 and Section 3.4 are then applied within each individual “block.”
Figure 4 illustrates a line segment of the experimental road network area (Figure 4a) and the residential groups located therein (Figure 4b).

3.2. AreaRatio Indicator Calculation Based on Thiessen Polygons

Building upon Section 3.1, within a specified block, in order to judge the “close proximity” topology and to quantify characteristics such as “larger merged residential area” and “narrow internal roads,” the Thiessen polygons for the residential groups are constructed and used to determine their proximity; the AreaRatio indicator is then calculated, based on the ratio of the area of the residential land ( A s i ) to the area of its corresponding Thiessen polygon ( A T P o l y g o n _ i ), as a means of filtering out residential areas/groups that occupy a larger proportion of the open space, as shown in Equation (1).
A r e a R a t i o = A s i / A T P o l y g o n _ i
Importantly, prior to the construction of the Thiessen polygons, it is essential to densify the boundary vertices of the settlement polygons, so that the distances between the adjacent vertices are smaller than or equal to 1.5 m, as depicted in Figure 5.
Figure 6 presents the Thiessen polygons and the constrained Delaunay triangulation (DT) built upon the densified vertices. The construction of the DT lays the groundwork for the calculation of the MHDistance indicator described in Section 3.3.

3.3. MHDistance Calculation within Blocks

As mentioned earlier, based on the constrained Delaunay triangulation within a block of settlement polygons, the modified Hausdorff distance serves as a quantitative indicator to assess the similarity of opposing polygon segments. The concept of facing line segments was introduced by Knorr et al. as early as 1997 [26], and Yang et al. [27] also conducted research on criteria for similarity of line segment chains in 2005. The modified Hausdorff distance was selected in this paper due to urban villages not only having narrow roads but also possessing similar facing line segment shapes. Preliminary experiments have demonstrated that the modified Hausdorff distance quantifies both distance and similarity of shape between two line segments. An analysis of the Hausdorff distance and the modified version used in this paper follows.

3.3.1. The Hausdorff Distance

The Hausdorff distance is commonly employed in measuring shape similarity and operates under the following principle [28,29]:
Consider two point sets, P and Q , with P comprising points { p 1 , p 2 , , p N p } and Q comprising points { q 1 , q 2 , , q N q } .
The directed Hausdorff distance between point set P and Q is defined as follows:
d D i r e c t e d H D ( P , Q ) = max p P d ( p , Q )
where d ( P , Q ) denotes the Euclidean distance between point p and set Q . Here, the distance between a point and a set is the minimum of the distances between point p and every point in { q 1 , q 2 , , q N q } , namely, d ( P , Q ) = min q Q p q .
Similarly, the directed Hausdorff distance from Q to P is as follows:
d D i r e c t e d H D ( Q , P ) = max q Q d ( q , P )
The bidirectional Hausdorff distance (or simply the Hausdorff distance) between point sets P and Q is then as follows:
H D U n d i r e c t e d H D ( P , Q ) = m a x { d P , Q , d ( Q , P ) }

3.3.2. The Modified Hausdorff Distance

The Hausdorff distance has some limitations when measuring the similarity between two chains, especially due to its sensitivity to local shape features [30,31,32,33]. To mitigate the shortcomings of the Hausdorff distance, several modifications to the measurements have been proposed.
The modified Hausdorff distance utilized in this paper, proposed by Dubuisson [28], involves averaging the distances between each point and point set, rather than taking the maximum value, thus providing a comprehensive consideration of each point’s impact. This is shown in the following equation:
d D i r e c t e d M H D ( P , Q ) = 1 N p p P d ( p , Q )
That is, the directed Hausdorff distance between point sets P and Q is the mean of the smallest distances from each point in P to all points in Q ( N p is the number of points in set P ), rather than the maximum.
Similarly, the directed Hausdorff distance from Q to P is given as follows:
d D i r e c t e d M H D ( Q , P ) = 1 N q q Q d ( q , P )
Based on this, the bidirectional modified Hausdorff distance is defined as follows:
M H D U n d i r e c t e d H D ( Q , P ) = m a x { d P , Q , d ( Q , P ) }

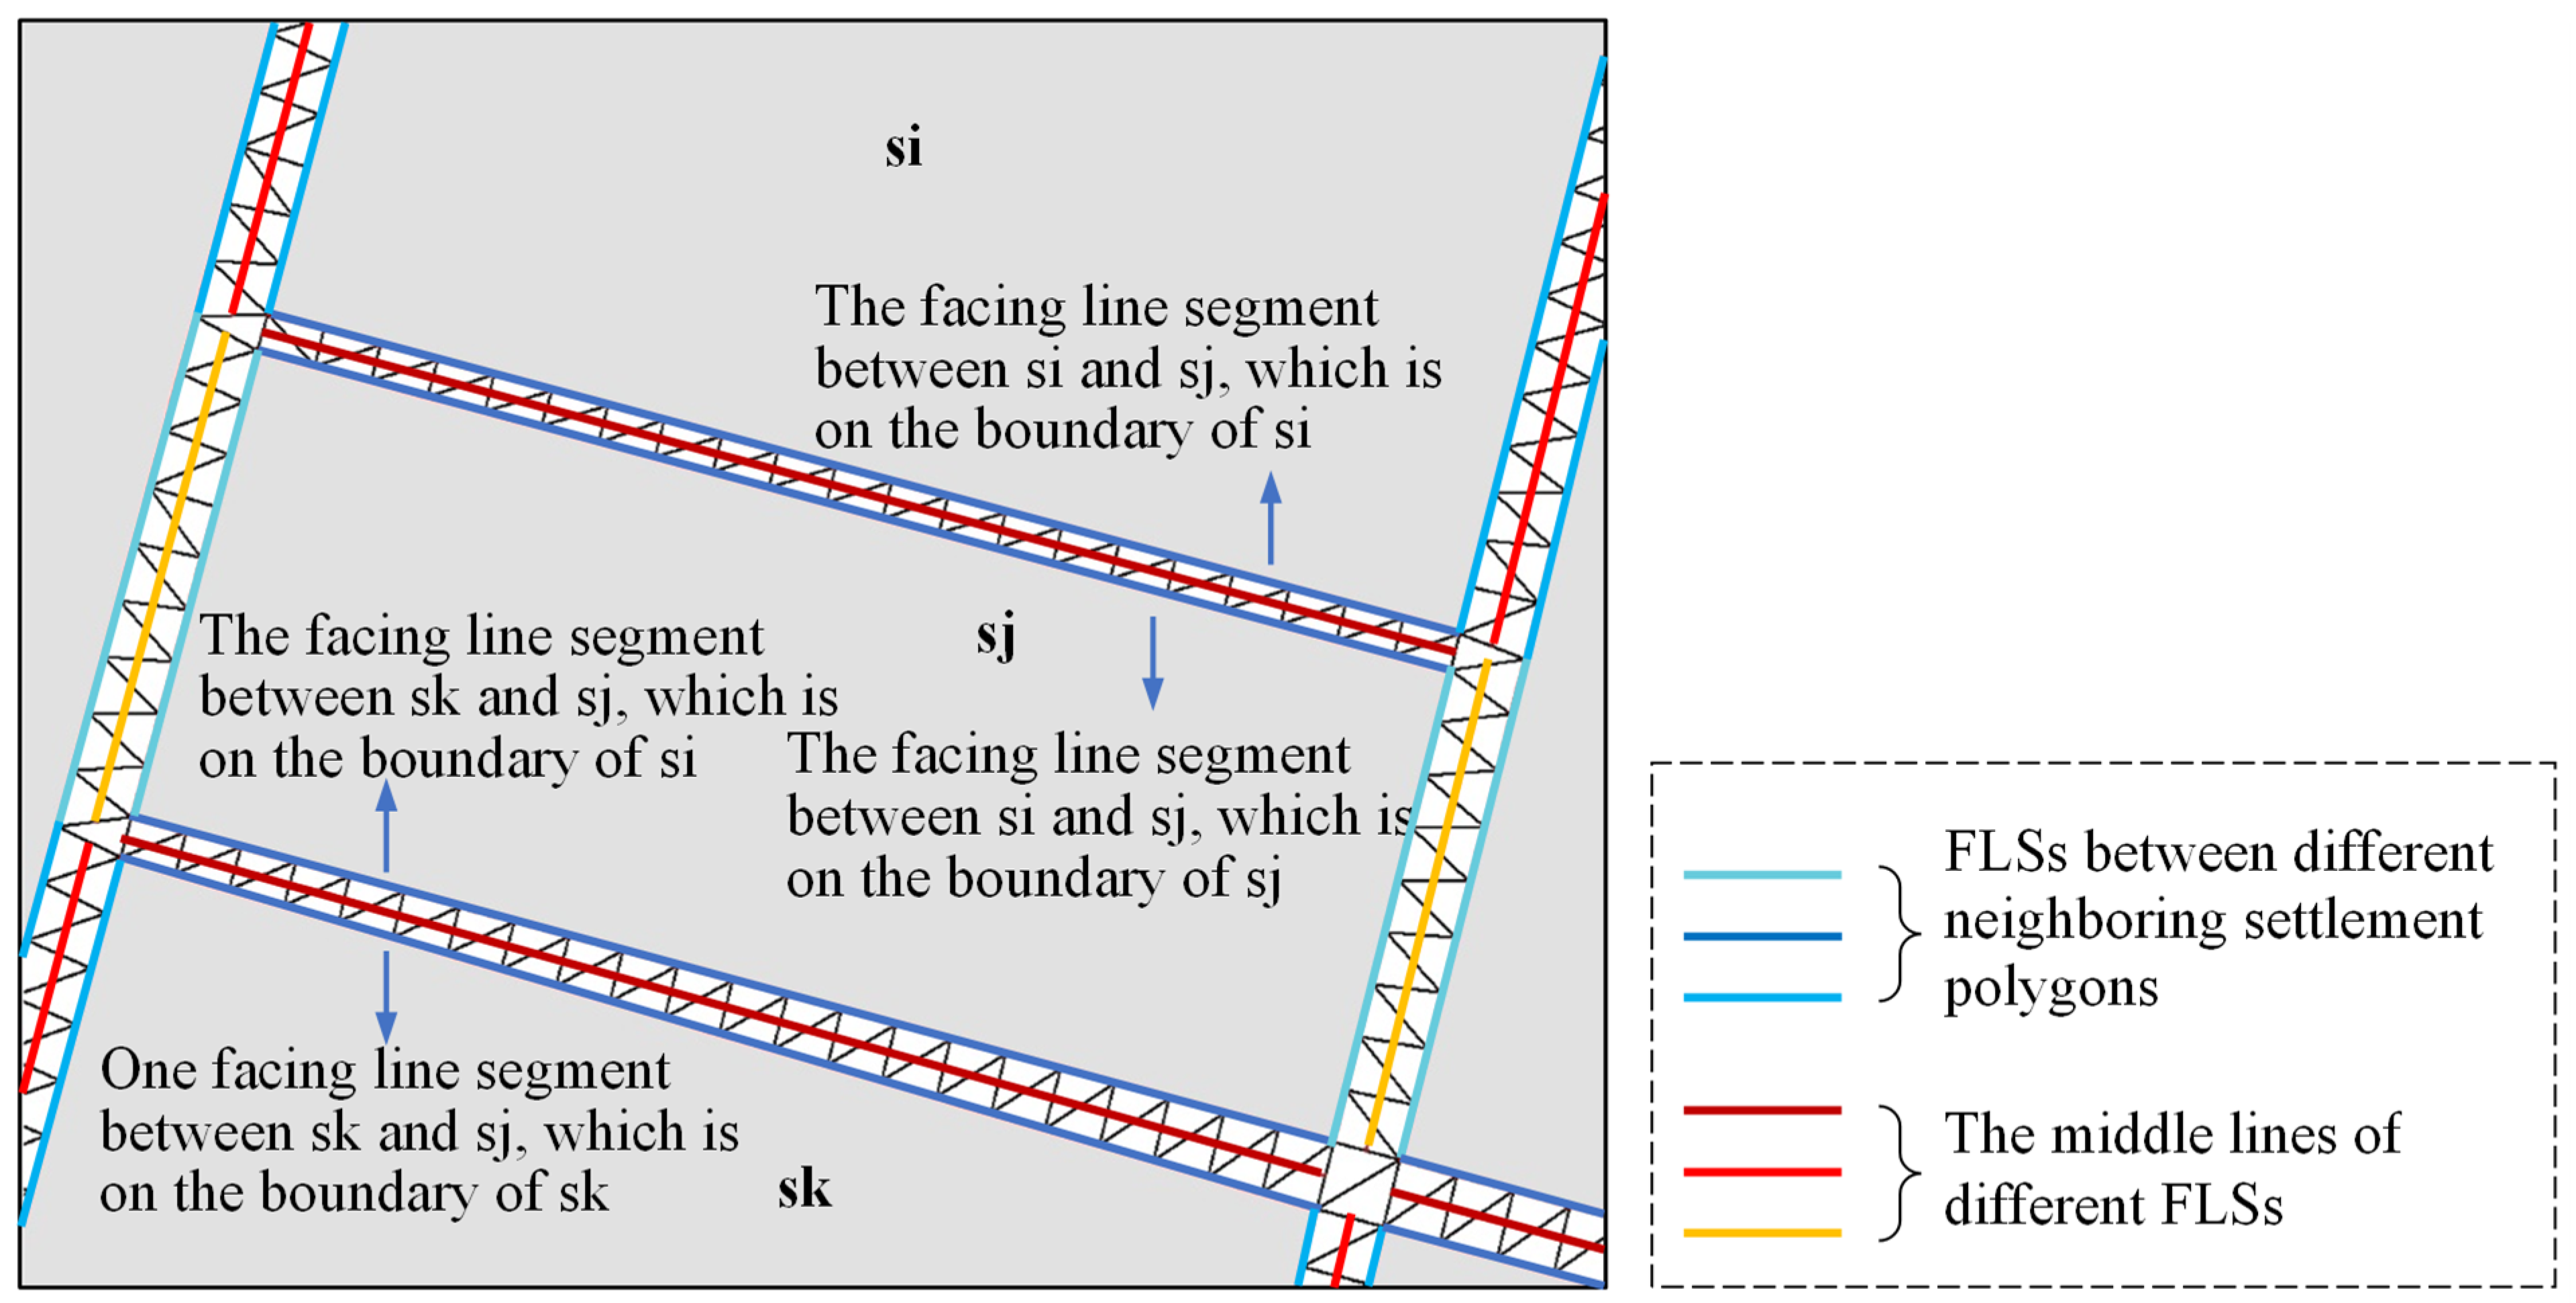
3.3.3. Facing Line Segments (FLSs)

Existing research and prior studies have proven that distance is the most critical factor when grouping settlement polygons [34]. There are multiple methods for measuring distance, such as the minimum distance, the mean distance, the maximum distance, etc. The facing-oriented distance proposed in this paper is based on the FLSs between two adjacent residential areas, as put forth by many researchers in the existing literature [20,21,26,27,35]. As illustrated in Figure 7, the FLSs between residential areas s i , s j , and s k are determined by the side connecting the bases of the second-class triangles (triangles whose vertices fall on two adjacent polygons) in the constrained Delaunay network between two polygons. The facing line segments between s i and s j , as well as between s j and s k , are located where the arrows point.
At this stage, it is possible to calculate the modified Hausdorff distance (MHDistance) between the FLSs of adjacent residential areas.

3.3.4. Extraction of Urban Village Polygons Based on AreaRatio and MHDistance

The method for extracting urban village residential areas from each block, as shown in Figure 3, is as follows:
(1)
A preliminary set of urban village residential areas is determined based on the value of the AreaRatio index for each block’s residential areas.
The principle is based on comparing the AreaRatio with a threshold, using a binary division approach to classify residential areas with an AreaRatio greater than the threshold as urban villages and those with an AreaRatio less than the threshold as non-urban villages.
(2)
Building on the preliminary set, a final set of urban village and non-urban village residential areas is determined based on the MHDistance.
The principle here is to inspect the MHDistance of FLSs between each urban village settlement polygon and the line segments of its adjacent non-urban village settlement polygons. By comparing the MHDistance with a threshold, non-urban village residential areas that fall below this threshold are added to the urban village residential area. This process continues, assessing the newly added urban village residential areas against the MHDistance with adjacent non-urban village areas until the distance is greater than the threshold, at which point the process stops.
It is apparent that the determination of thresholds for the AreaRatio and MHDistance has a significant influence on the results of urban village extraction, requiring calibration through experimentation. The methodology of this paper is described in Section 3.3.5.

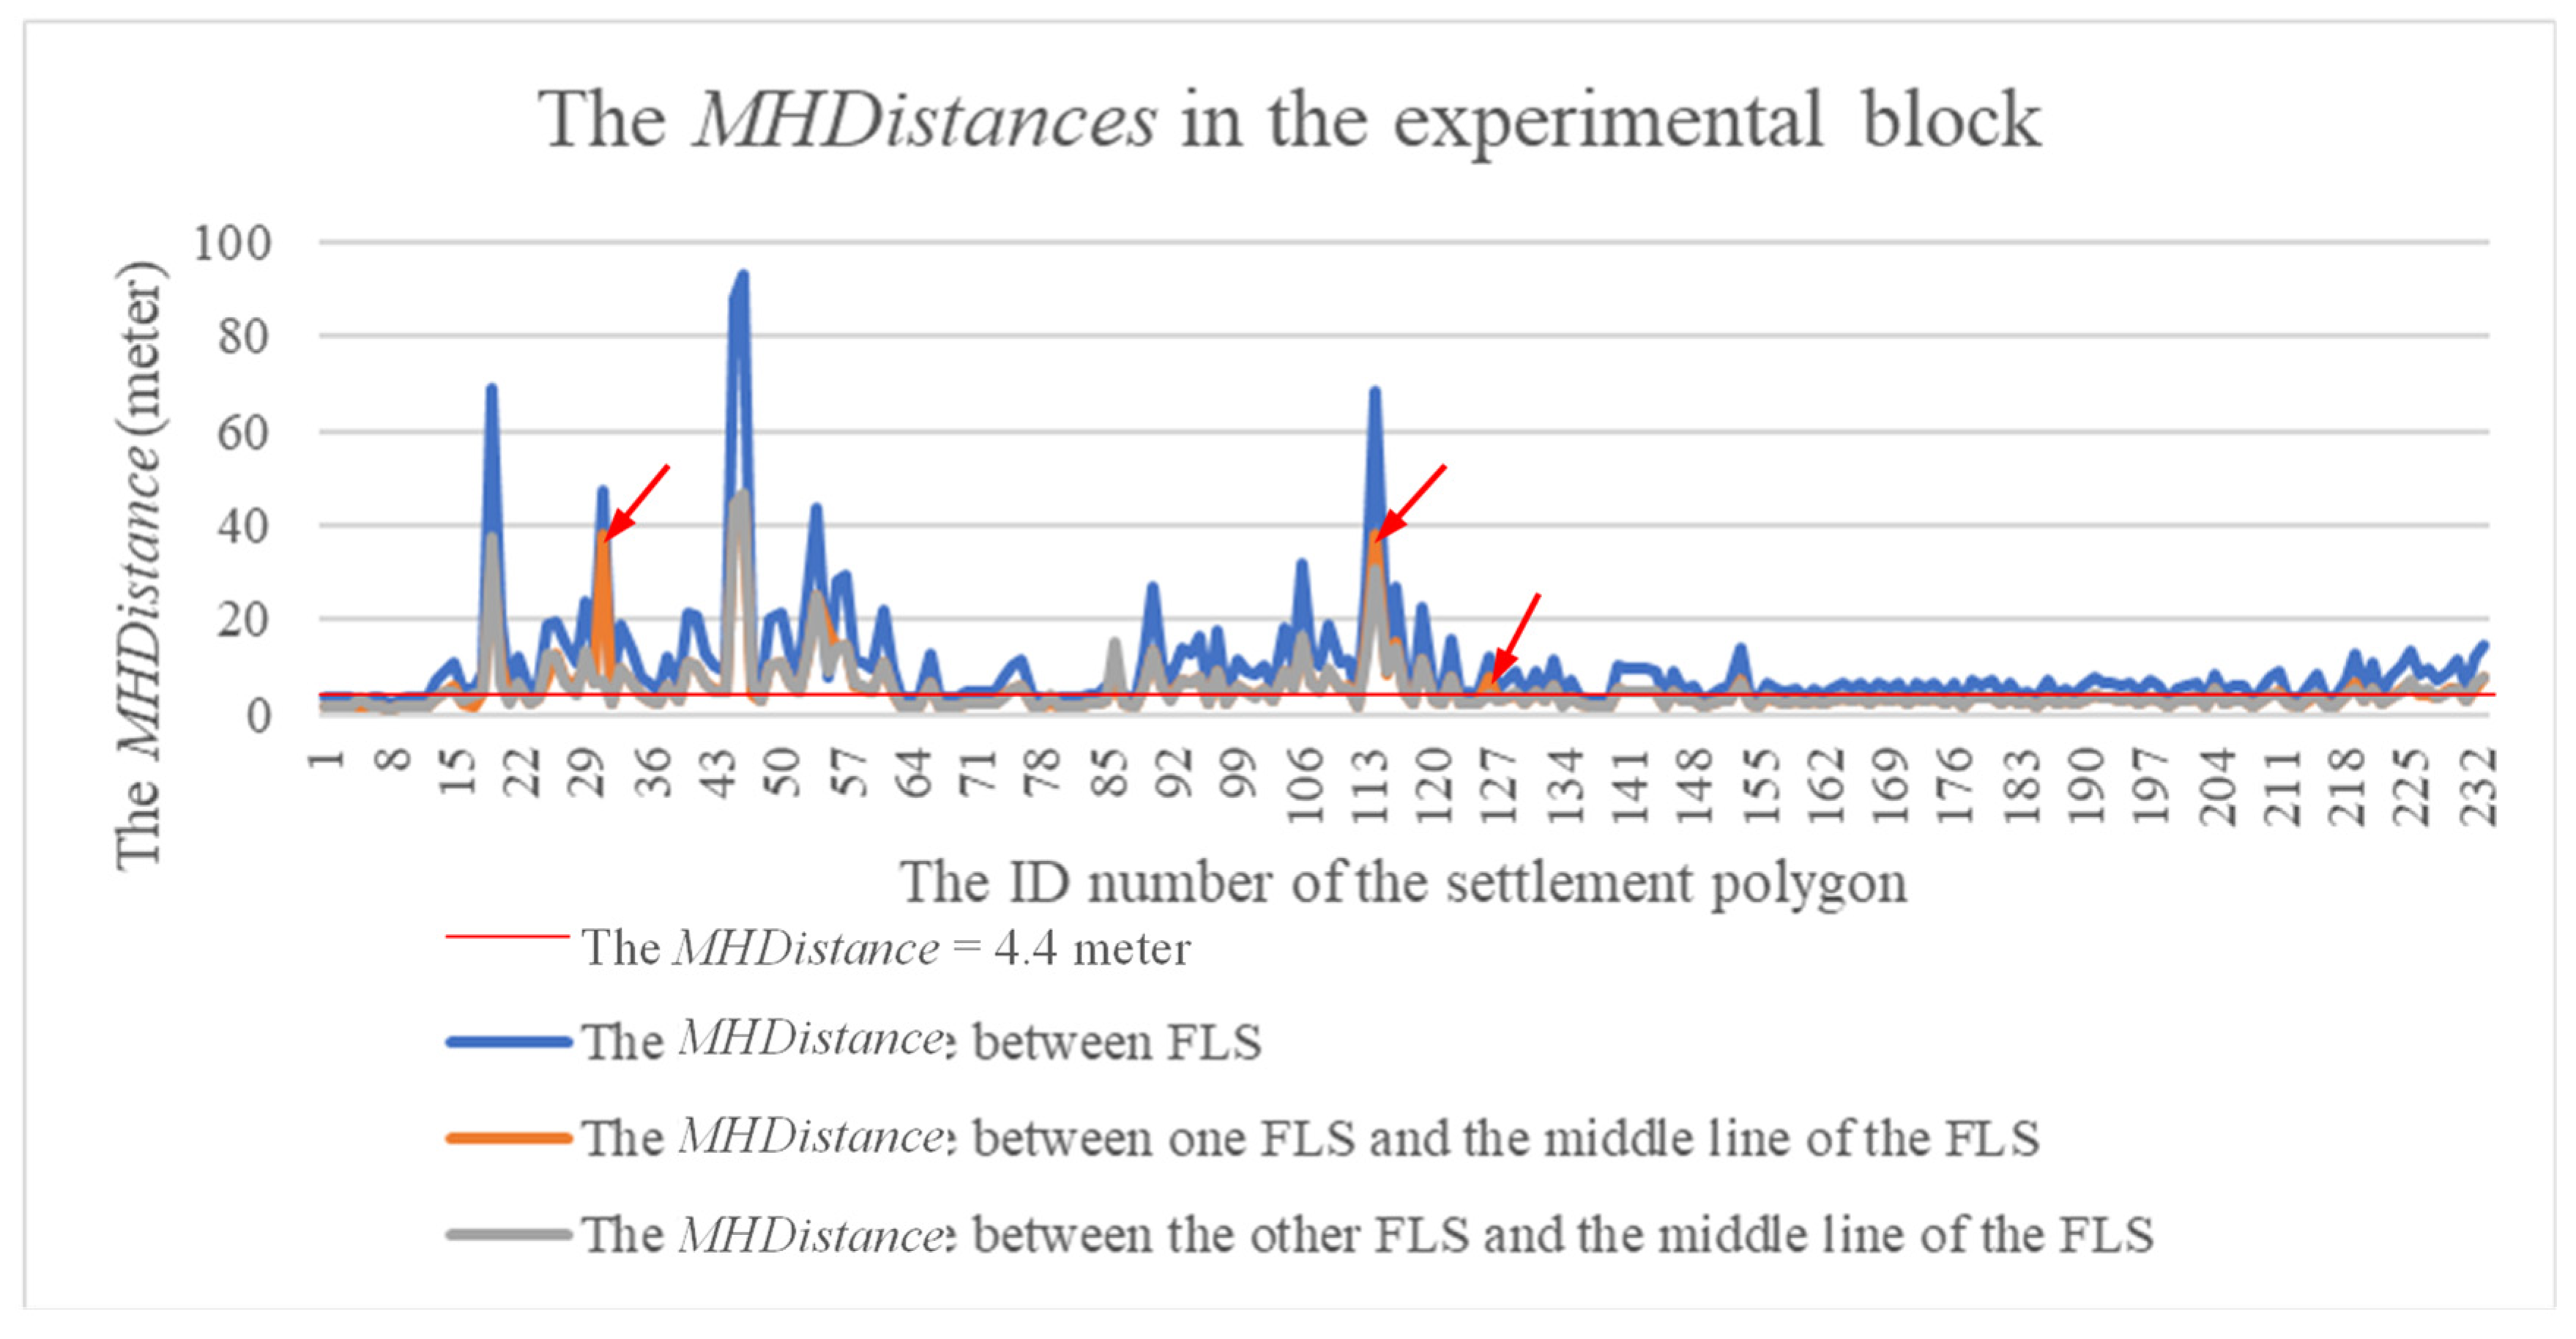
3.3.5. Determination of the Thresholds for AreaRatio and MHDistance

In the experimental block, the obtained AreaRatios are classified into five categories using the natural breaks method (Jenks), with the third category ranging from 0.519689 to 1.348790 (from small to large) being identified as the candidate set for urban village residential areas. This threshold is selected because, upon visual interpretation, it was observed that there were fewer omissions of urban villages within this threshold. In contrast, when classified into four categories, non-urban village residential areas within the range of 0.447298 to 1.348790 were misclassified as urban villages. This indicates that urban village residential areas have a proportionally higher occupied area within their corresponding Thiessen polygons beyond 0.447298, meaning that the narrowness of their roads is more accurately depicted when the AreaRatio is above 0.519689.
For the MHDistance threshold, this is determined by statistics gathered from the experimental block. In the experimental block, most of the modified Hausdorff distances between an urban village polygon and its neighboring polygons are smaller than this value, which is determined as the threshold of the MHDistance, as shown in Figure 8. In Figure 8, there are 699 values represented by three lines, and each line represents 233 values. The line in dark blue illustrates the MHDistance between FLSs (which is in accordance with the blue lines demonstrated in Figure 7); the line in orange represents the MHDistance between one facing line segment and the middle line of the FLSs (the middle line of the FLSs is illustrated in the Figure 7); and the line in gray shows the MHDistance between the other facing line segment and the middle line of the corresponding FLSs. The horizontal axis is marked by the ID numbers for the 233 groups of lines, which are from 0 to 232.
It can be seen that the modified Hausdorff distances between urban village residential areas were within 4.4 m (the line in red in Figure 8), suggesting that within this area, the road width is commonly less than 5 m. In addition, it can be observed that most of the orange line is overlapped by the gray line in Figure 8, which proves that most of the MHDistances between one FLS and the middle line of the FLS and the MHDistances between the other FLS and the same middle line are the same, with some exceptions (for instance, the orange line where the red arrow points).

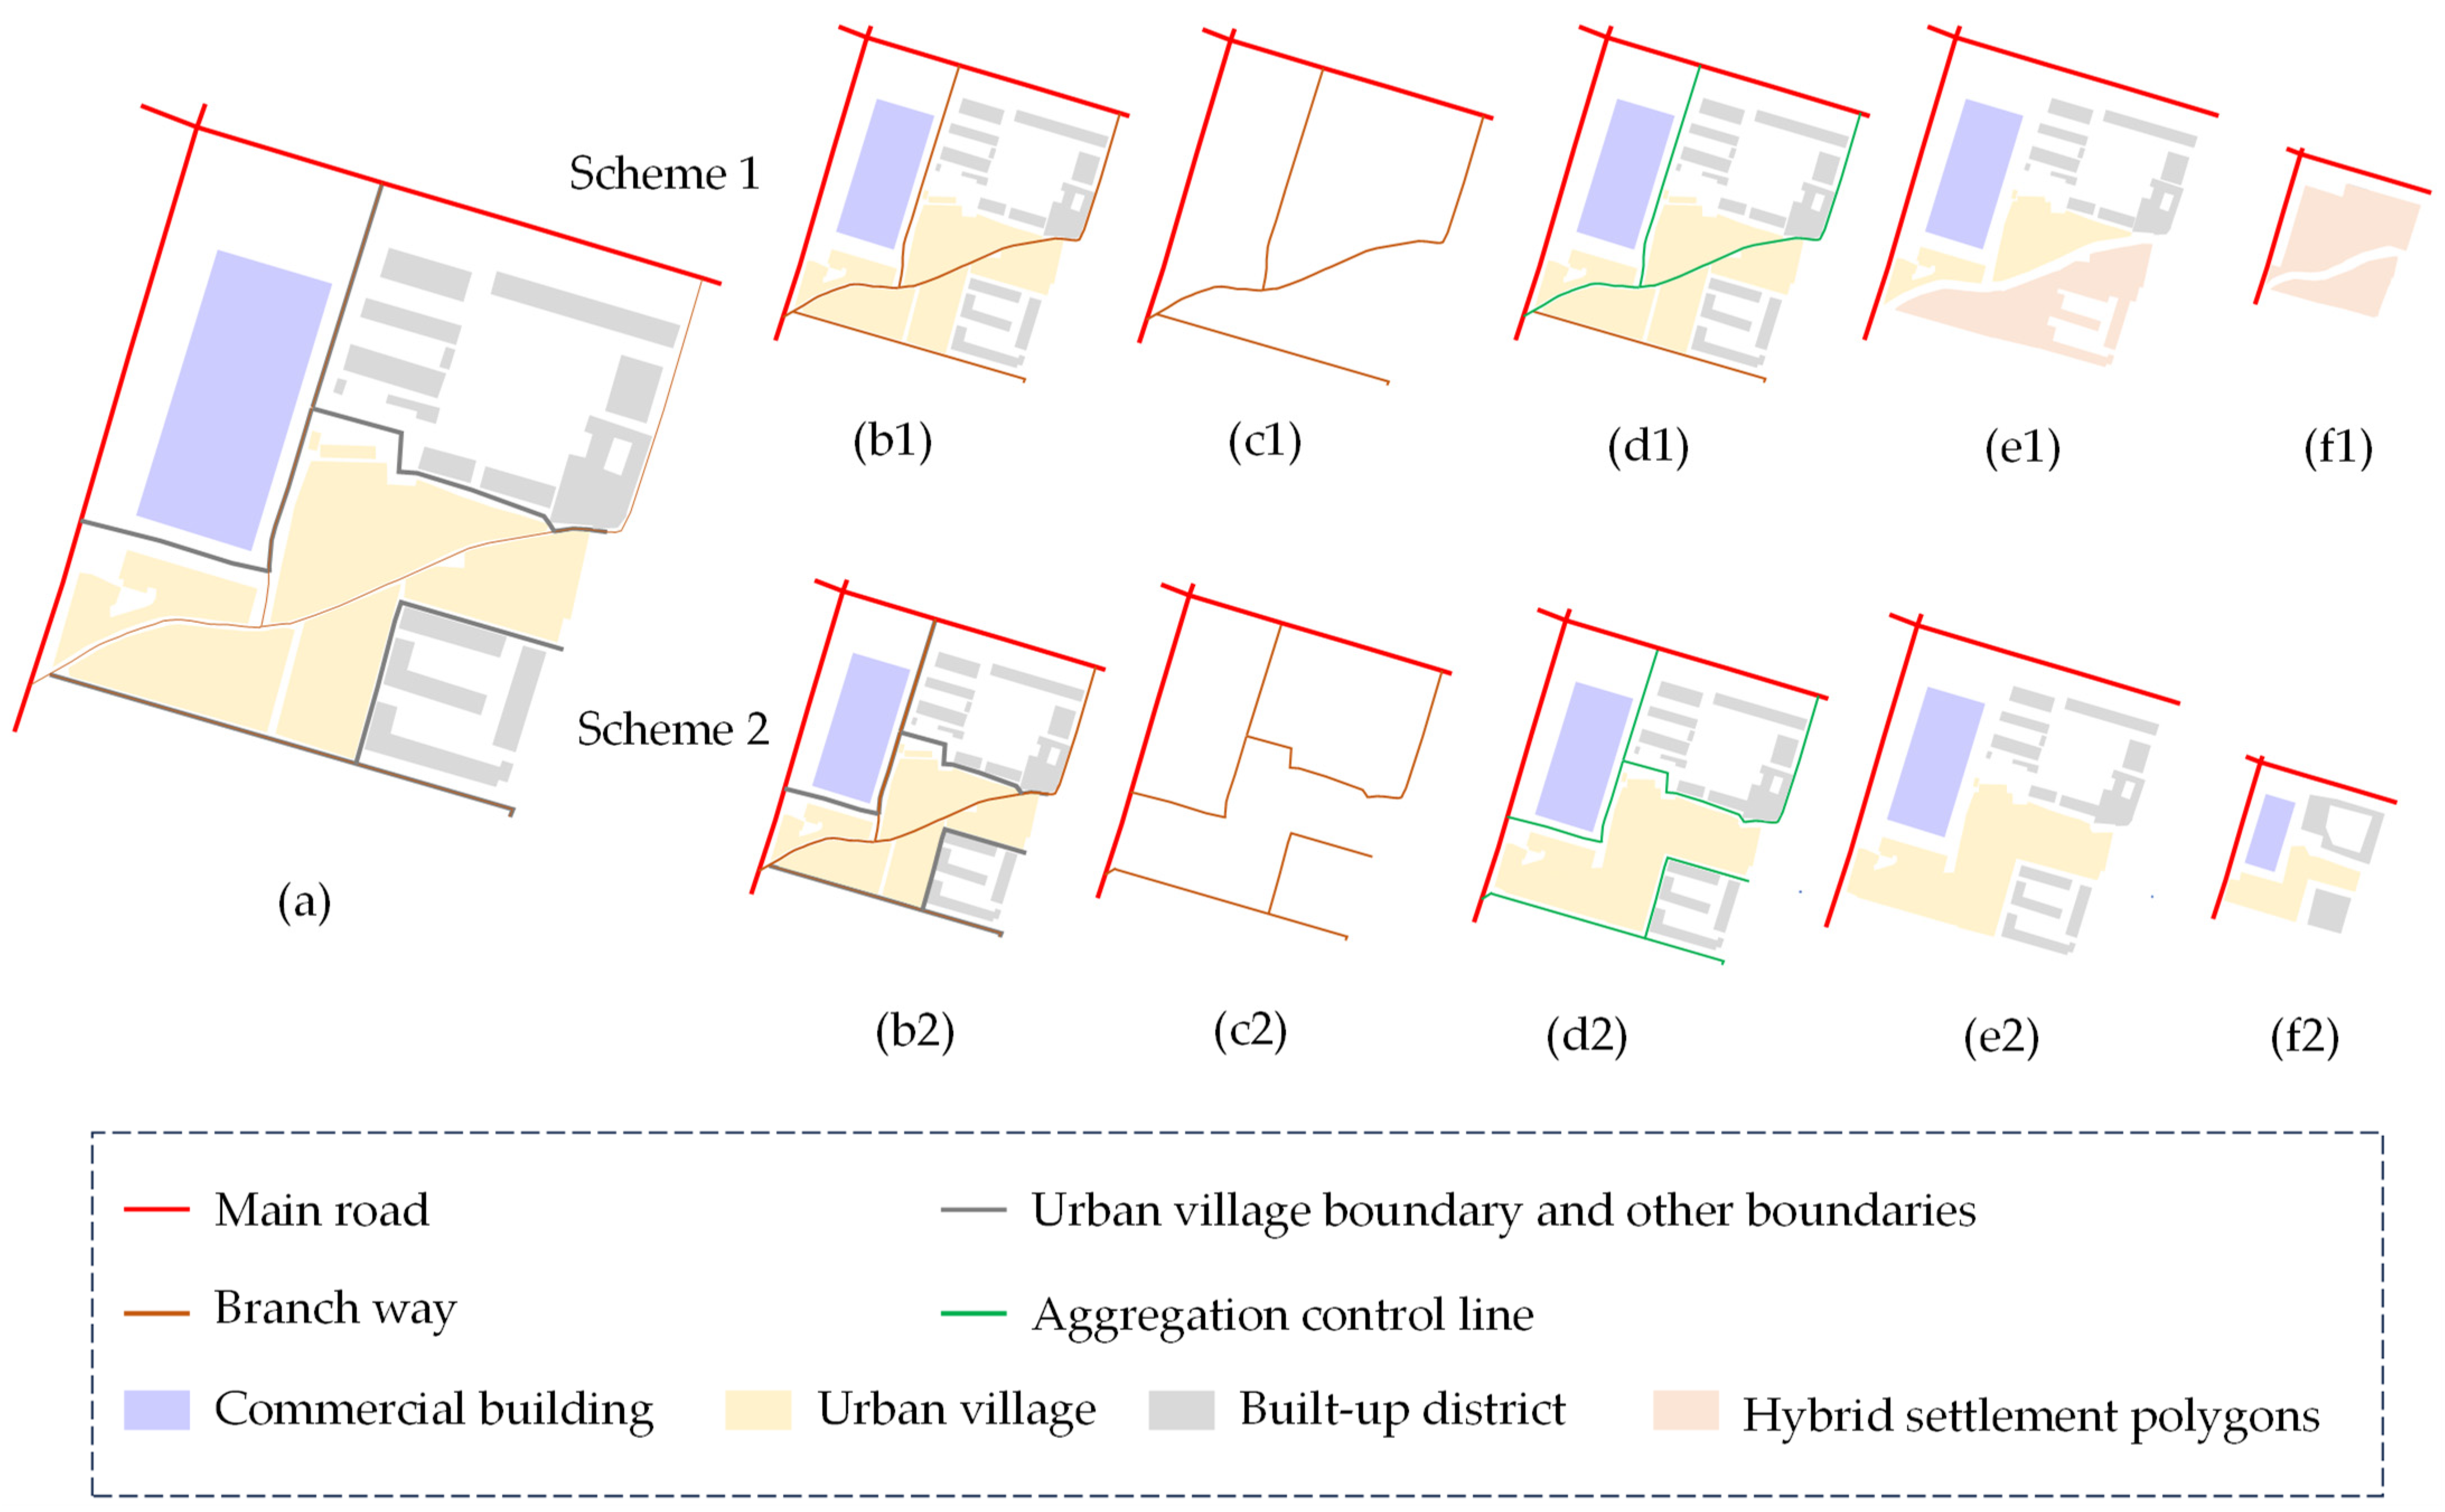
3.4. Generalization Method for Extracted Urban Villages and Non-Urban Villages

After the urban villages and non-urban villages have been extracted, a map generalization method is applied to settlement polygons when the map scale is reduced. The method is described in an example in Figure 9.
To describe the proposed method clearly, a comparison between the proposed method and a general generalization is made in Figure 9. As can be seen from the figure:
(1)
Figure 9a is a source map at the 1:5K scale, the target map scale is 1:10K, Figure 9(b1) to Figure 9(e1) are the process for a general generalization, and Figure 9(b2) to Figure 9(e2) are the process for the generalization approach in this paper.
(2)
Figure 9(b1) does not consider the boundaries between urban villages and the built-up district; on the contrary, both the roads and the boundaries between different urban function areas are taken into consideration in Figure 9(b2). The roads include the main roads and the branch ways, and the urban function areas include the urban villages (filled by the yellow color), the built-up district (filled by the gray color), and the business building (filled by the purple color). The boundaries between different function areas can be obtained based on the middle lines of FLSs and the roads. Commercial buildings are extracted through a query of the thematic attributes.
(3)
Figure 9(c1) and Figure 9(c2) illustrate different divisions in the block based on Figure 9(b1) and Figure 9(b2), respectively.
(4)
In Figure 9(d1) and Figure 9(d2), settlement polygons fall into different “aggregation areas” when the block is divided into Figure 9(c1) and Figure 9(c2). The aggregation areas are proposed in this paper to represent the control boundaries where aggregation does not happen at a certain scale. This is because aggregation of settlement polygons is equal to the elimination of roads; when it is decided to retain roads in the green color at the scale of 1:10K, the aggregation is applied within the areas formed by different aggregation control lines.
(5)
Figure 9(e1) is the result of the generalization following the principle of Scheme 1, which does not consider the urban villages and other boundaries. Figure 9(e2) is the result of the generalization using the proposed method. It can be seen that in Figure 9(e2), the function regions, e.g., the urban villages in the block, have been aggregated into a polygon, and the semantics of the polygon are preserved well.
(6)
When the scale is reduced to 1:2.5K in Figure 9(f1) and Figure 9(f2), the difference between the two schemes becomes even more pronounced. There are more and more “hybrid polygons” in Figure 9(f1), while from the results in Figure 9(f2), the commercial buildings, urban villages, and built-up districts maintain separate peripheral contours and semantic features.
(7)
It should be noted that topological rules between different groups of different objects are important, and aggregation, displacement, and simplification operators must be applied on the premise of maintaining topological relationships.

4. Experiment

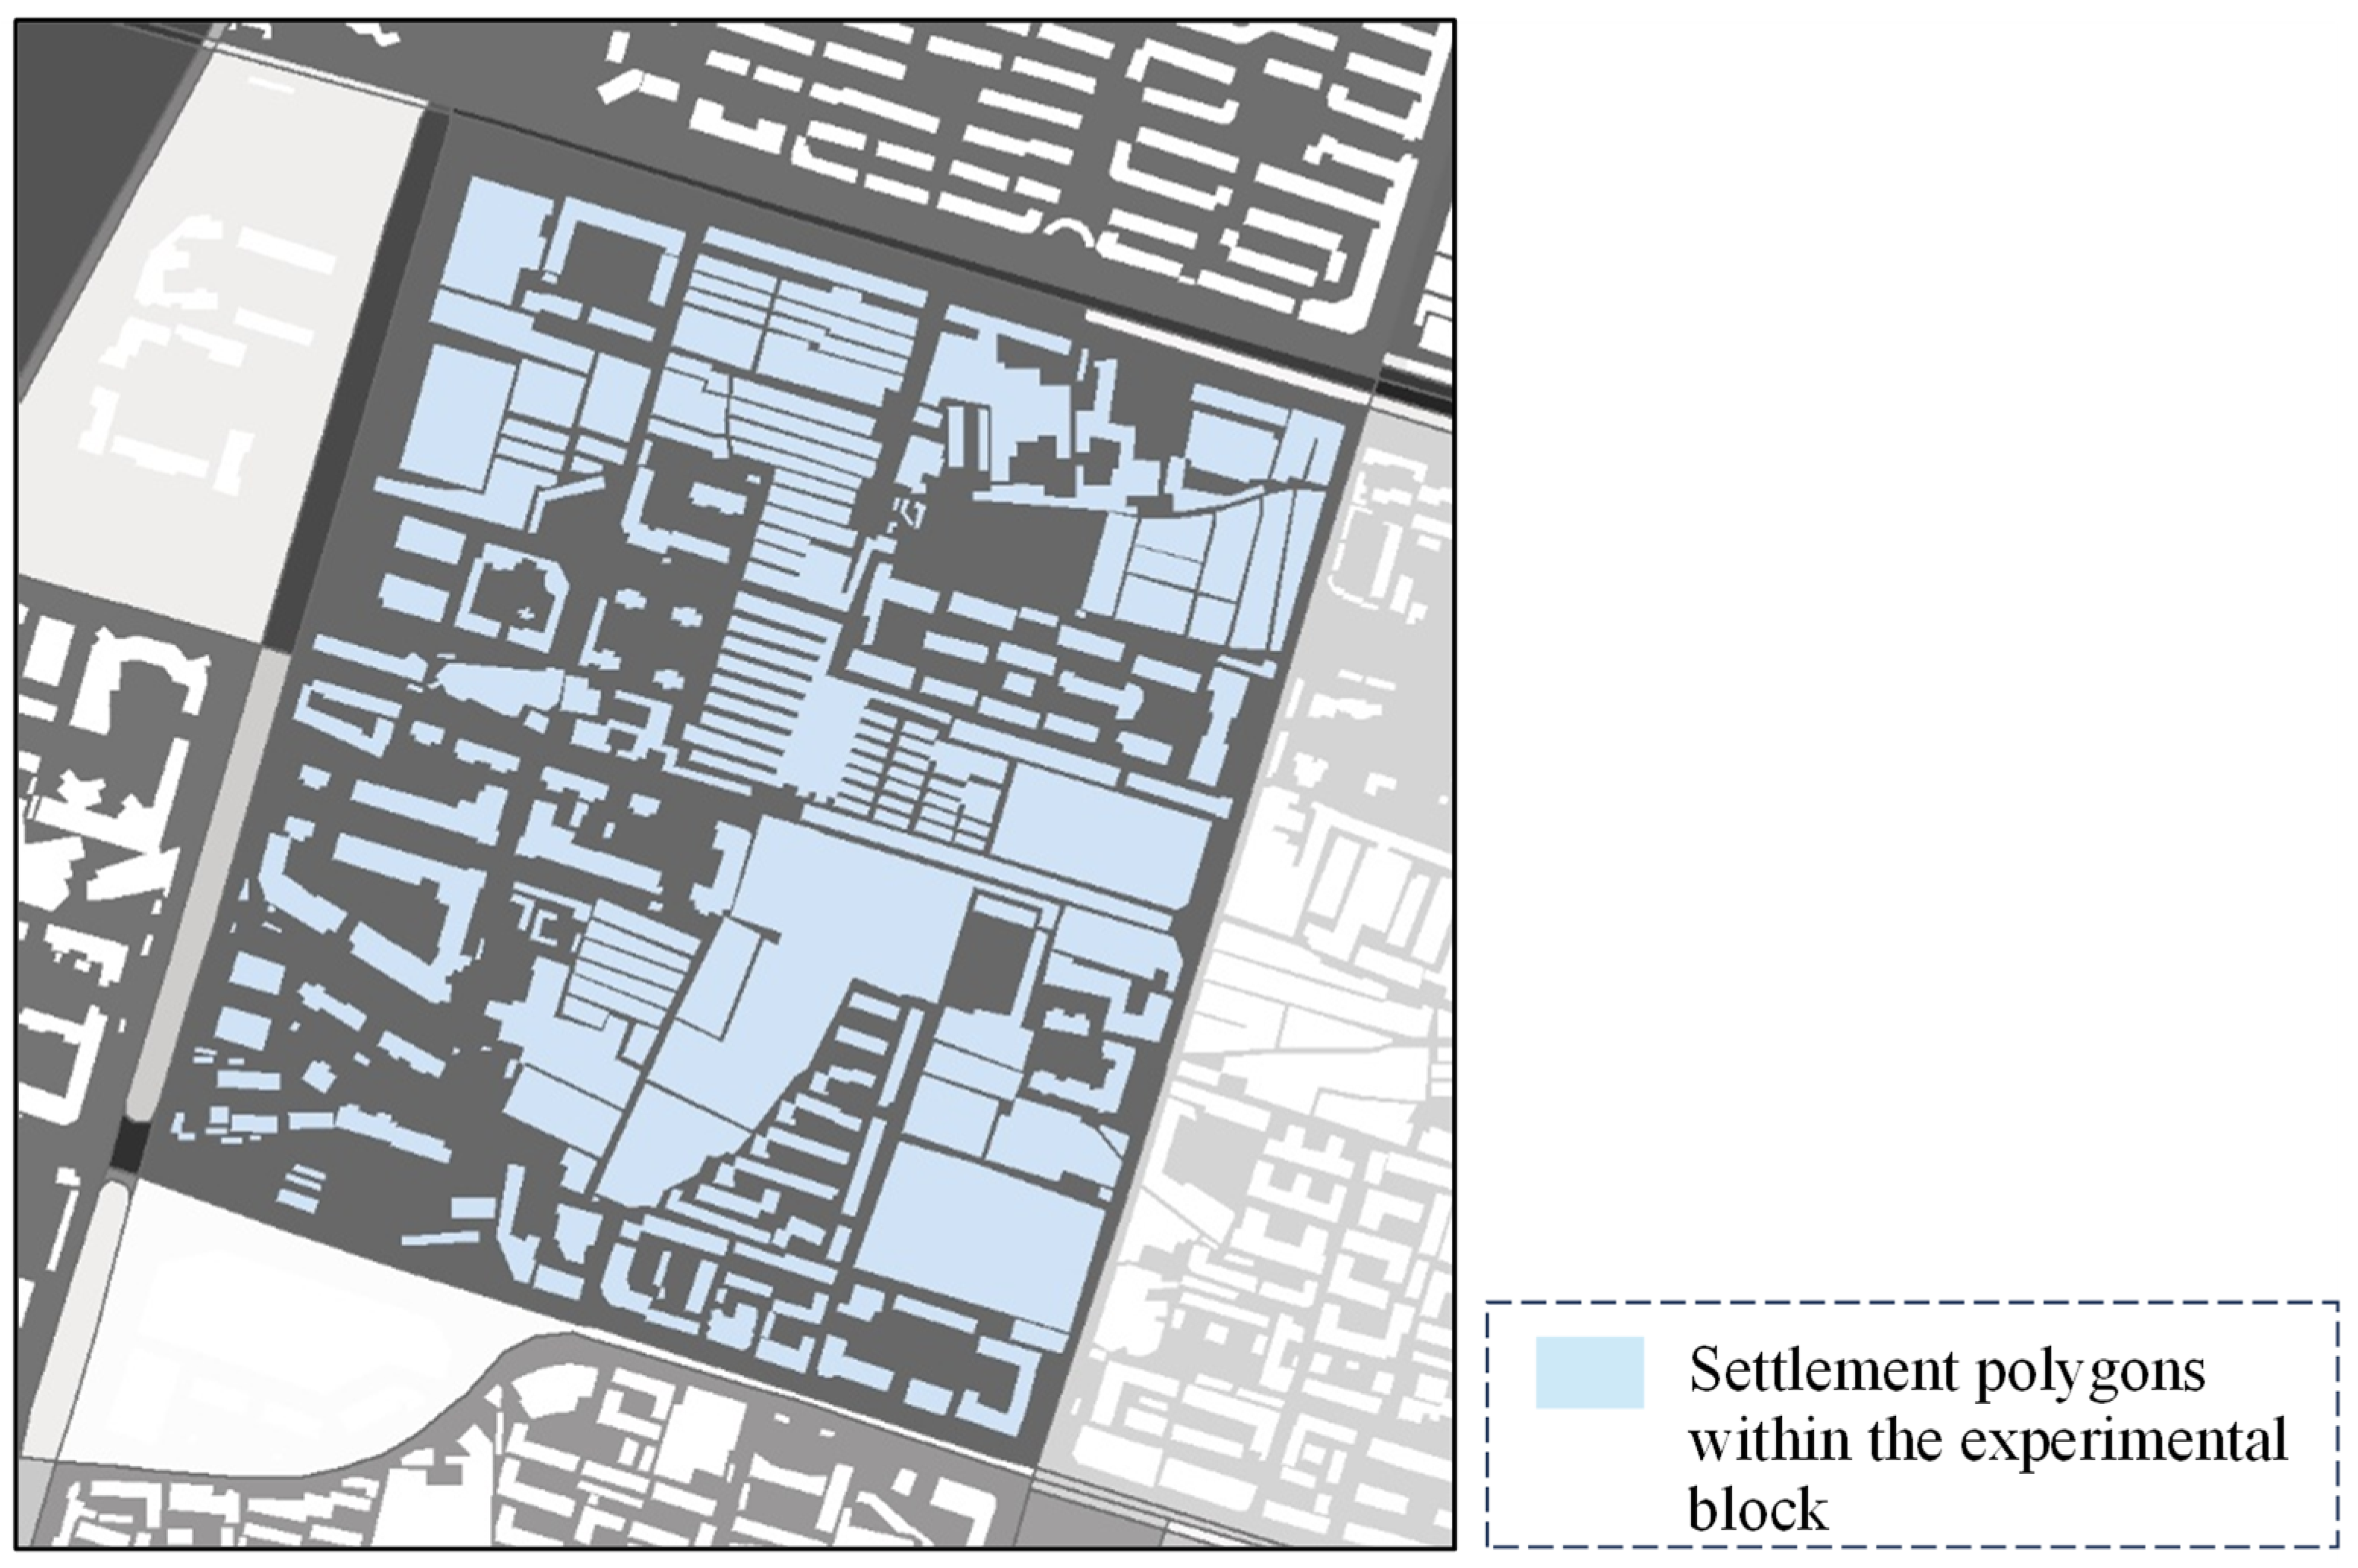
4.1. Experimental Data

The present method for extracting urban villages was tested on the ArcGIS 10.2.2 platform. The calculation of the modified Hausdorff distance was completed through an open-source code in MATLAB language which was shared by “dridon” on Github, and the function was written by B S SasiKanth, Indian Institute of Technology Guwahati [36]. A block defined by a main thoroughfare in Lanzhou City, China, at a 1:5K scale was selected as the research area, with data sourced from the Gansu Province Geomatics Center. As shown in Figure 10, this block contained both urban village and non-urban village residential areas, thus justifying its selection as an experimental area.

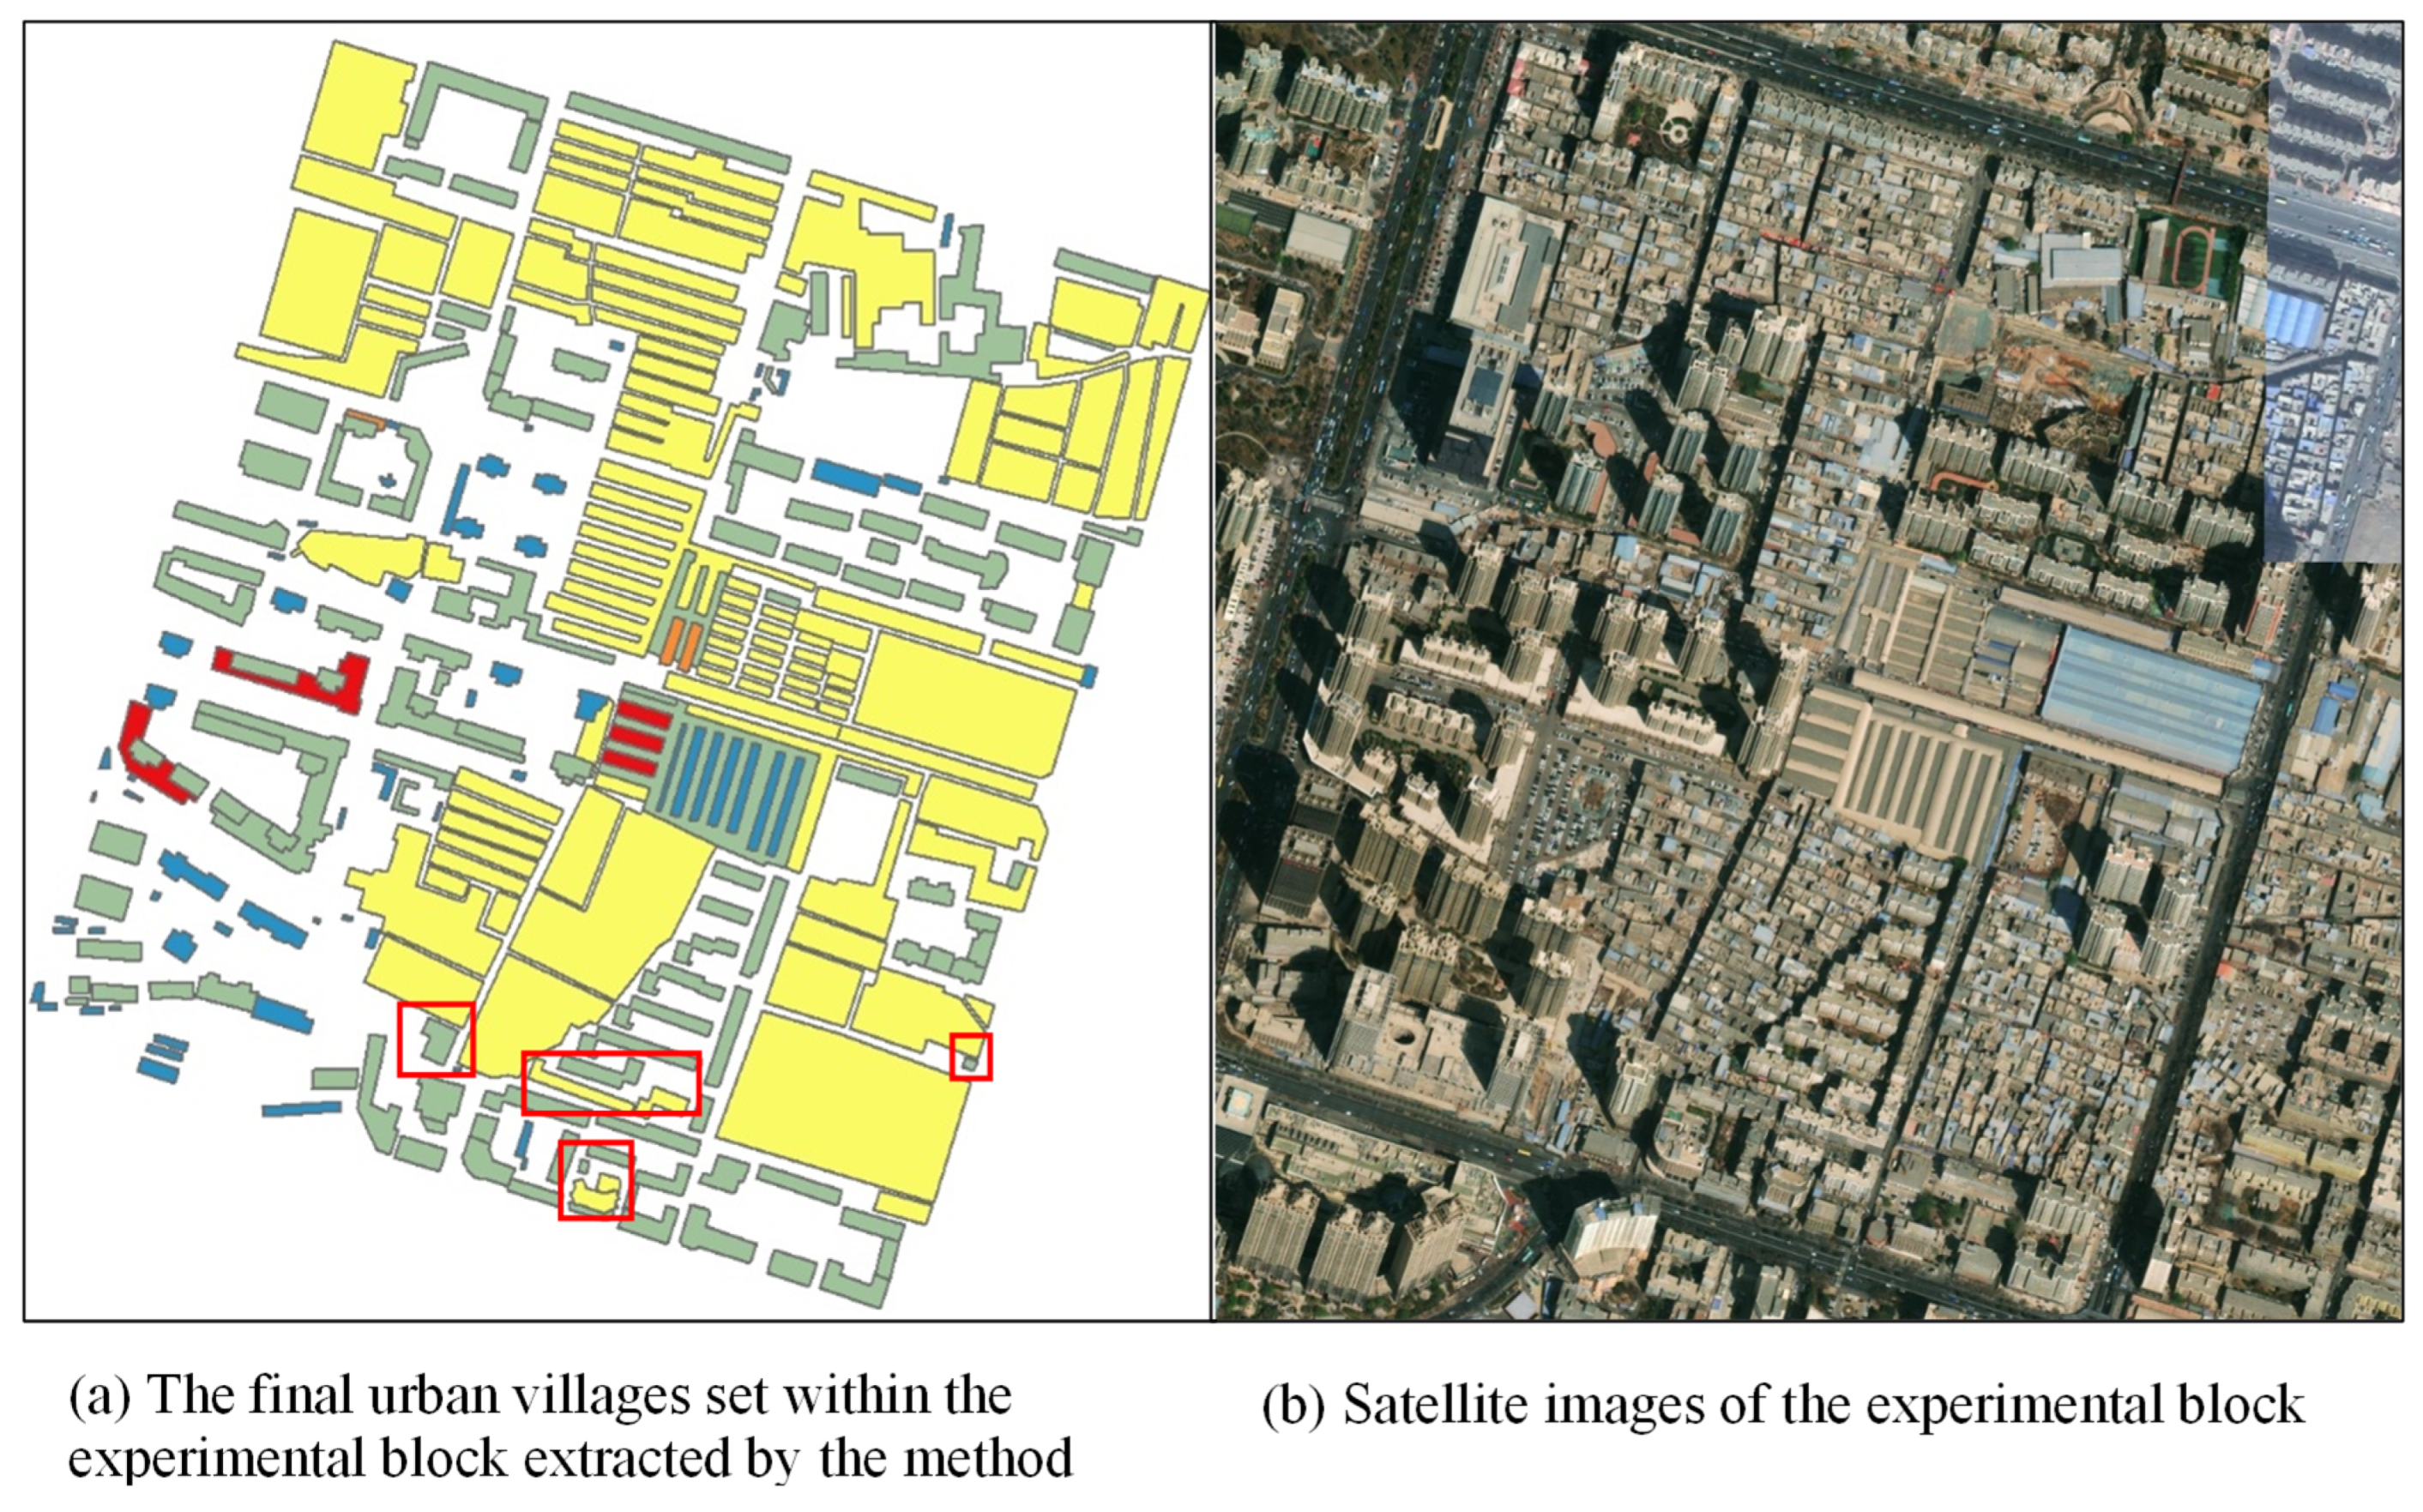
4.2. Experimental Results

Figure 11 displays the results as categorized by the AreaRatio index. The yellow polygons represent the preliminary set of the urban village residential areas extracted under the threshold (0.519689 < AreaRatio < 1.348790). It is important to note that due to certain offsets that occur when ArcGIS constructs Thiessen polygons for adjoining polygons, some AreaRatio values exceeded 1. However, this did not affect the efficacy of urban village residential area extraction using the natural breaks method.
Figure 12 shows the distribution of FLS chains with MHDistances less than or equal to 5 m. It is evident that such line segment chains were predominantly located within the preliminary set of urban village residential areas, further corroborating the characteristic narrow roads within urban villages. At the same time, there were occurrences of MHDistance ≤ 5 between the preliminary sets of urban villages and non-urban villages, as indicated by arrows at locations ① to ⑤ in Figure 12. In these instances, non-urban village residential areas falling within the preliminary set were added to the urban village collection. Figure 13 illustrates the final set of urban village residential areas extracted using the method described in this paper. It can be seen that non-urban village settlement polygons at locations ① to ⑤ in Figure 12 (filled by the green color) were added into the urban village set in Figure 13 (filled by the yellow color).

5. Discussion

In the literature on residential pattern recognition and automated map generalization, there is attention given to the identification and generalization of regularly/irregularly shaped settlements, linear/curvilinear/networked residential arrangements, and specific template shapes like L-, T-, and Y-shaped settlements. There is less focus on the automated generalization methods for urban village settlements, which are important but unplanned areas in less developed cities of China. Likewise, few studies address the extraction of urban village residential areas within large-scale NSDI vector data.
This paper realizes the extraction of urban village settlement polygons in an experimental block through spatial statistical analysis. The subsequent generalization is based on these extracted results applied separately within the urban village and non-urban village areas. Even if the spacing between urban villages and non-urban villages is less than the cartographic limit, the spacing can be exaggerated to preserve their respective semantic information, as shown in Figure 14. This method aids in maintaining the types of residential clusters (i.e., urban villages, built-up districts, commercial buildings, etc.) while considering map legibility, compared to generalization methods that consider distance alone, conveying more information to readers and supporting decision-making for urban village renovation.
However, by analyzing the experimental results, it is apparent that there is room for improvement in this method in the following areas:
(1)
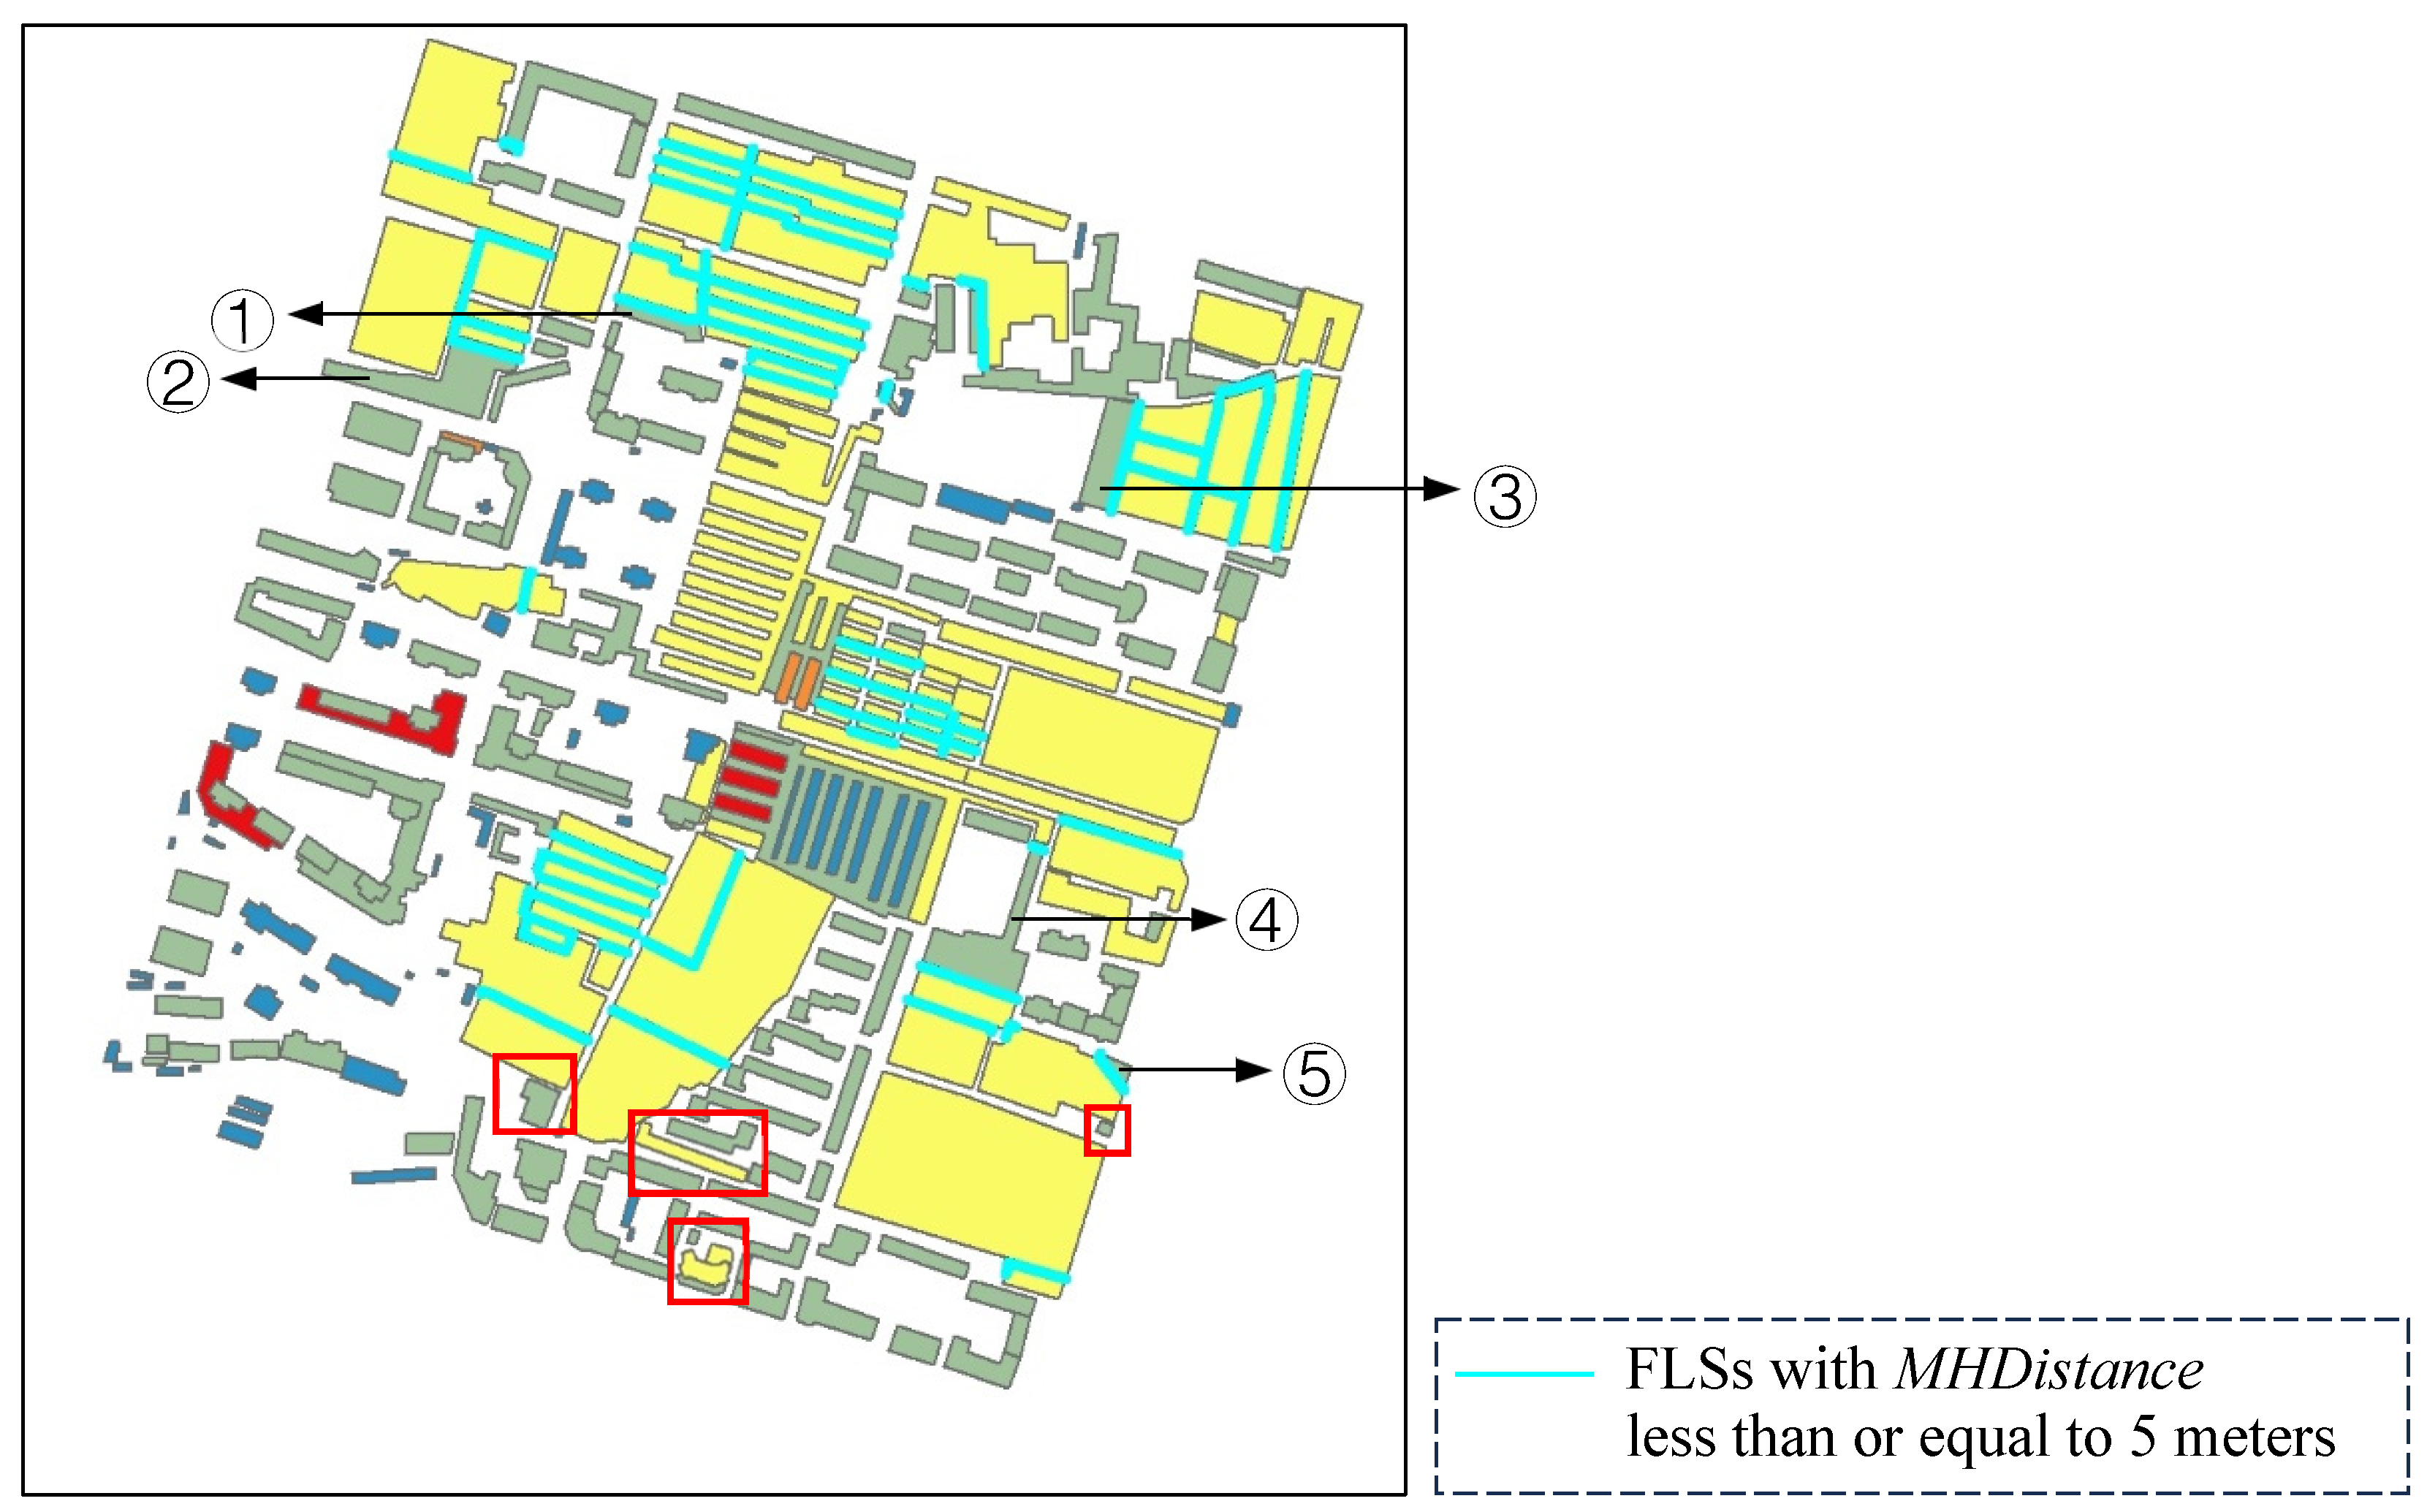
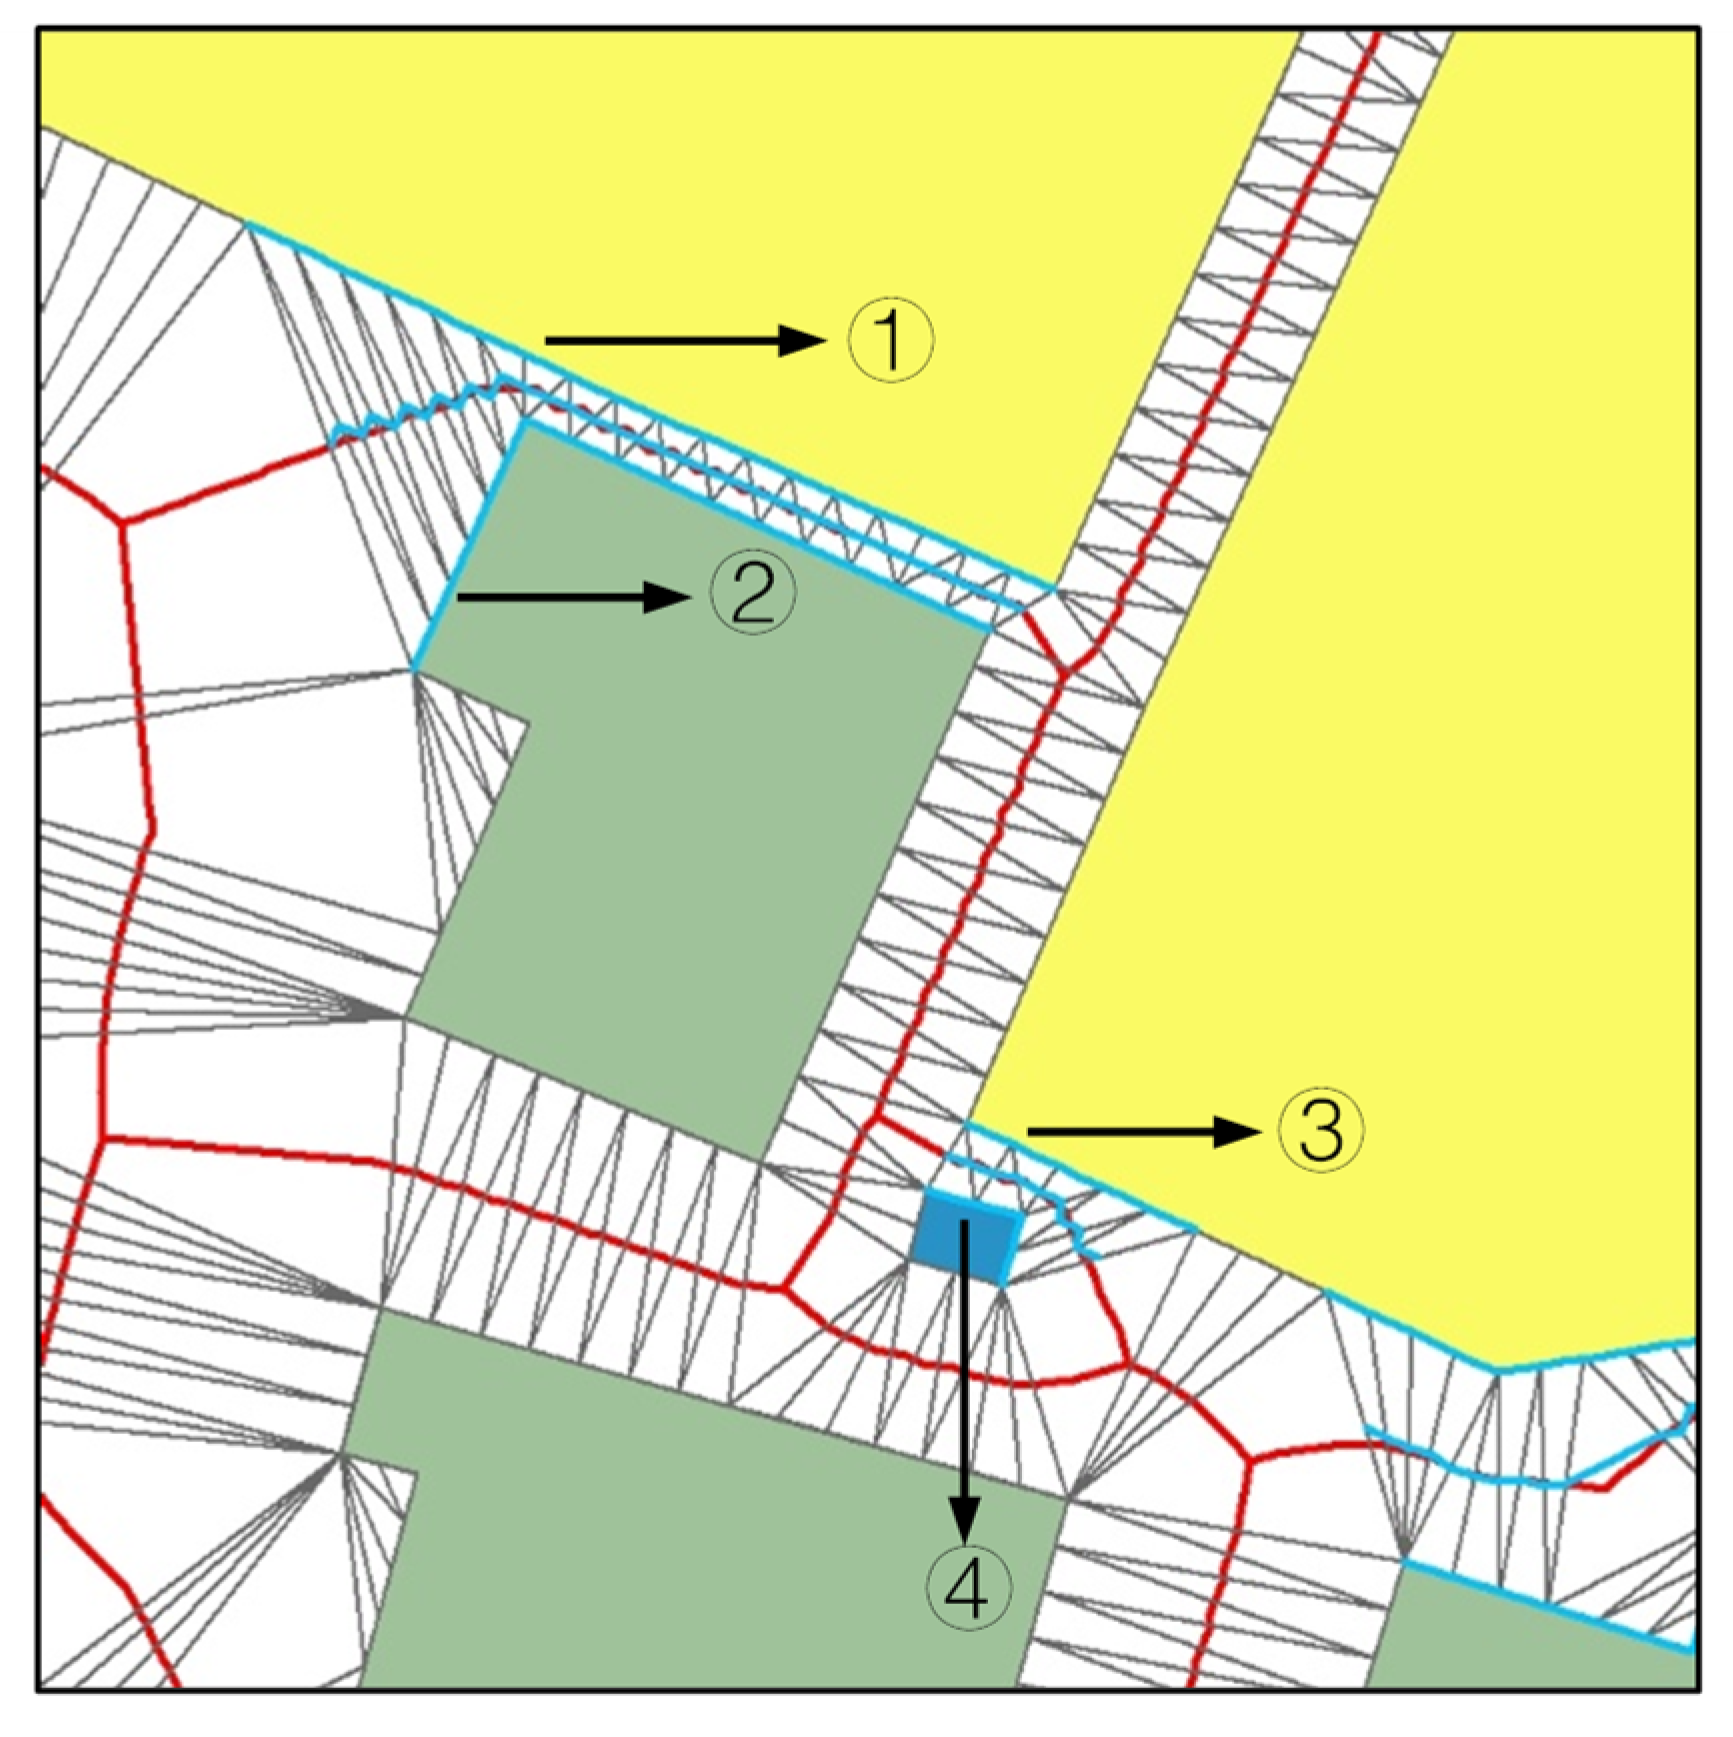
The extraction method: For instance, the red box in Figure 13a highlights areas of mis-extraction and omissions. The issue arises because the FLSs between two residential areas is derived based on the secondary-class triangles between them, as shown in Figure 15. In this case, one segment chain in the FLSs approximated a straight line (as indicated by ① and ③ in Figure 15) and the other segment chain in the FLSs underwent a turn of approximately 90 degrees, with this turning part occupying a significant length of the said line segment (as indicated by ② and ④ in Figure 15). This resulted in a larger MHDistance between this FLS and the other, and then the residential area on the edge of the urban village was classified as a non-urban village. Similarly, several areas were identified incorrectly in the red boxes in Figure 13, including both omissions and cases where non-urban village residential areas were identified as urban village ones. Addressing these issues will be the focus of further research.
(2)
For the generalization method, the priority has been given to keeping the semantic function regions, such as urban villages, commercial building, etc., complete, while the connectivity of the road network becomes a secondary consideration in this approach. For example, in Figure 9, the polygons in (f1) all become hybrid function regions which are filled with the pink color, while on the contrary, the polygons in (f2) preserve their semantic attributes. (f1) preserves one space between the two aggregated polygons (numbered as ① where the blue arrow points), and the space is the longest branch way within the block. (f2) preserves two spaces between the resulting aggregated polygons (numbered as ② and ③ where the blue arrows point). Therefore, in the future, the present generalization method can be further improved by taking road length into consideration.

6. Conclusions

Map generalization is a process of scientifically modeling a cartographic area at different levels of detail, reflecting the cartographer’s cognition of the region to some extent. Urban villages are unplanned informal settlements that emerged at a certain stage of China’s urbanization, and they provide affordable housing for a large population of migrant workers. Therefore, the accurate generalization of urban villages in less developed cities in China on maps is critical to the scientific and rational approach to their renovation and reconstruction. Precise depiction and generalization depend on their extraction; thus, the automatic extraction and generalization of urban villages are worthy of in-depth research. Most of the existing research extracts urban villages through automatic remote sensing interpretations, with fewer studies focusing on extraction from vector data in less developed cities. In response to this, the current paper’s preliminary research found that urban village residential areas, due to their unique shape in an important component of the national spatial data infrastructure, 1:5K-scale Digital Line Graph, are depicted in a distinctive manner by data producers, laying the foundational conditions for their automatic extraction from such scale data.
The urban village residential area extraction method described in this paper is proposed by analyzing the cognitive process of humans and mimicking this cognitive flow. The selected indices reflect the narrow roads within urban villages and the contiguous depiction of urban villages in 1:5K data, as well as the similar shape of the road-facing line segment chains on opposite sides of the road. Building upon the extraction of urban villages and non-urban villages, the principles of their automatic generalization are outlined to scientifically convey semantic information from the original maps to the readers in the implementation of map generalization at the 1:10K and 1:25K scales.
The present methodology is validated using data from a 1:5K-scale block in Lanzhou City, demonstrating that most urban village residential areas can be extracted using the method described. Still, there remain some issues that need to be addressed in future research. The issues include the following: (1) the polygons at the edge of the urban villages may be classified as non-urban villages due to some special cases in facing line segments, and (2) the generalization method does not take roads’ lengths into consideration. So, the issues are problems that should be solved in future works.
Urban villages provide affordable housing for a large number of migrant workers and serve as an important transitional stage in the urbanization process. The method described herein aids in the accurate depiction and automatic extraction of urban village residential areas. If proven effective in other regional datasets, this method could provide a reference for the generalization of residential areas in China.

Author Contributions

Conceptualization, Xiaorong Gao and Haowen Yan; methodology, Xiaorong Gao; software, Xiaolong Wang; validation, Xiaomin Lu and Rong Wang; resources, Haowen Yan; data curation, Xiaorong Gao; writing—original draft preparation, Xiaorong Gao; writing—review and editing, Haowen Yan and Rong Wang; visualization, Xiaorong Gao; supervision, Xiaolong Wang; project administration, Xiaomin Lu; funding acquisition, Xiaorong Gao and Haowen Yan. All authors have read and agreed to the published version of the manuscript..

Funding

This work was supported by the National Natural Science Foundation of China [42301512, 41930101, 42361072 and 42161066]; the Open Fund of the Key Laboratory of Urban Land Resource Monitoring and Simulation, Ministry of Natural Resources, under grant number KF-2022-07-015; and the Science and Technology Project of Gansu Province (No. 22JR11RE190).

Data Availability Statement

The raw data supporting the conclusions of this article will be made available by the authors on request.

Acknowledgments

The authors would like to express special thanks to the editor and all the anonymous reviewers for their valuable comments that helped improve the manuscript.

Conflicts of Interest

No potential conflict of interest was reported by the author(s).

References

  1. Crivellari, A.; Wei, H.; Wei, C.; Shi, Y. Super resolution GANs for upscaling unplanned urban settlements from remote sensing satellite imagery—The case of Chinese urban village detection. Int. J. Digit. Earth 2023, 16, 2623–2643. [Google Scholar] [CrossRef]
  2. Pan, W.; Du, J. Towards sustainable urban transition: A critical review of strategies and policies of urban village renewal in Shenzhen, China. Land Use Policy 2021, 111, 105744. [Google Scholar] [CrossRef]
  3. Kochan, D. Placing the urban village: A spatial perspective on the development process of urban villages in contemporary China. Int. J. Urban Reg. Res. 2015, 39, 927–947. [Google Scholar] [CrossRef]
  4. Hao, P.; Geertman, S.; Hooimeijer, P.; Sliuzas, R. Spatial analyses of the urban village development process in Shenzhen, China. Int. J. Urban Reg. Res. 2013, 37, 2177–2197. [Google Scholar] [CrossRef]
  5. Bonsu, K.; Bonin, O. Urban Growth Process in Greater Accra Metropolitan Area: Characterization Using Fractal Analysis. J. Geovisualization Spat. Anal. 2023, 7, 21. [Google Scholar] [CrossRef]
  6. Yue, W.; Wei, J.; Liu, Y.; Wang, T.; Zhang, H. Investigating Intra-urban Functional Polycentricity from a Linkage Perspective: The Case of Changsha, China. J. Geovisualization Spat. Anal. 2023, 7, 1. [Google Scholar] [CrossRef]
  7. Jérémy, R.; Cécile, D. Urban Structure Generalization in Multi-Agent Process by Use of Reactional Agents. Trans. GIS 2014, 18, 201–218. [Google Scholar]
  8. Yan, X.; Ai, T.; Zhang, X. Template matching and simplification method for building features based on shape cognition. ISPRS Int. J. Geo-Inf. 2017, 6, 250. [Google Scholar] [CrossRef]
  9. Yan, X.; Ai, T.; Yang, M.; Yin, H. A graph convolutional neural network for classification of building patterns using spatial vector data. ISPRS J. Photogramm. Remote Sens. 2019, 150, 259–273. [Google Scholar] [CrossRef]
  10. Zhang, X.; Ai, T.; Stoter, J.; Kraak, M.J.; Molenaar, M. Building pattern recognition in topographic data: Examples on collinear and curvilinear alignments. Geoinformatica 2013, 17, 1–33. [Google Scholar] [CrossRef]
  11. Yan, X.; Yang, M. A deep learning approach for polyline and building simplification based on graph autoencoder with flexible constraints. Cartogr. Geogr. Inf. Sci. 2024, 51, 79–96. [Google Scholar] [CrossRef]
  12. Zhao, R.; Ai, T.; Yu, W.; He, Y.; Shen, Y. Recognition of building group patterns using graph convolutional network. Cartogr. Geogr. Inf. Sci. 2020, 47, 400–417. [Google Scholar] [CrossRef]
  13. Chen, J.; Liu, W.; Li, Z.; Zhao, R.; Cheng, T. Detection of spatial conflicts between rivers and contours in digital map updating. Int. J. Geogr. Inf. Sci. 2007, 21, 1093–1114. [Google Scholar] [CrossRef]
  14. Chaudhry, O.; Mackaness, W. Automatic identification of urban settlement boundaries for multiple representation databases. Comput. Environ. Urban Syst. 2008, 32, 95–109. [Google Scholar] [CrossRef]
  15. Cai, J.; Chen, Y. A novel unsupervised deep learning method for the generalization of urban form. Geo-Spat. Inf. Sci. 2022, 25, 568–587. [Google Scholar] [CrossRef]
  16. Shi, L.; Taubenböck, H.; Zhang, Z.; Liu, F.; Wurm, M. Urbanization in China from the end of 1980s until 2010—Spatial dynamics and patterns of growth using EO-data. Int. J. Digit. Earth 2019, 12, 78–94. [Google Scholar] [CrossRef]
  17. Wu, F.; Li, L.; Han, S. Social sustainability and redevelopment of urban villages in China: A case study of Guangzhou. Sustainability 2018, 10, 2116. [Google Scholar] [CrossRef]
  18. Yuan, D.; Yau, Y.; Bao, H.; Lin, W. A framework for understanding the institutional arrangements of urban village redevelopment projects in China. Land Use Policy 2020, 99, 104998. [Google Scholar] [CrossRef]
  19. Yuan, D.; Yau, Y.; Bao, H. Urban village redevelopment in China: Conflict formation and management from a neo-institutional economics perspective. Cities 2024, 145, 104710. [Google Scholar] [CrossRef]
  20. Li, L.; Lin, J.; Li, X.; Wu, F. Redevelopment of urban village in China–A step towards an effective urban policy? A case study of Liede village in Guangzhou. Habitat Int. 2014, 43, 299–308. [Google Scholar] [CrossRef]
  21. Yu, W.; Zhou, Q.; Zhao, R. A heuristic approach to the generalization of complex building groups in urban villages. Geocarto Int. 2019, 36, 155–179. [Google Scholar] [CrossRef]
  22. Li, W.; Yan, H.; Lu, X.; Shen, Y. A Heuristic Approach for Resolving Spatial Conflicts of Buildings in Urban Villages. ISPRS Int. J. Geo-Inf. 2023, 12, 392. [Google Scholar] [CrossRef]
  23. Li, Z.; Yan, H.; Ai, T.; Chen, J. Automated building generalization based on urban morphology and Gestalt theory. Int. J. Geogr. Inf. Sci. 2004, 18, 513–534. [Google Scholar] [CrossRef]
  24. Qi, H.; Li, Z. An Approach to Building Grouping Based on Hierarchical Constraints. Int. Arch. Photogramm. Remote Sens. Spat. Inf. Sci. 2008, 37, 449–454. [Google Scholar]
  25. Li, C.; Wu, W.; Yin, Y.; Wu, P.; Wu, Z. A multi-scale partitioning and aggregation method for large volumes of buildings considering road networks association constraints. Trans. GIS 2022, 26, 779–798. [Google Scholar] [CrossRef]
  26. Knorr, E.; Ng, R.; Shilvock, D.L. Finding Boundary Shape Matching Relationships in Spatial Data. In Proceedings of the 5th International Symposium (SSD’97), Berlin, Germany, 15–18 July 1997. [Google Scholar]
  27. Yang, C.; Zhang, Q.; Tian, X.; He, L. A Criterion of Shape Similarity Between Line Segments for Clustering Analysis of Geographical Area Entities. Geomat. Inf. Sci. Wuhan Univ. 2005, 1, 61–64+72. (In Chinese) [Google Scholar]
  28. Dubuisson, M.; Jain, A. A modified Hausdorff distance for object matching. In Proceedings of the 12th International Conference on Pattern Recognition, Jerusalem, Israel, 9–13 October 1994; Volume 1, pp. 566–568. [Google Scholar]
  29. Tang, L.; Zhang, X.; Kan, Z.; Yang, B.; Li, Q. Spatial data Internet progressive transmission control based on the geometric shapes similarity. Int. J. Control Autom. Syst. 2014, 12, 1110–1117. [Google Scholar] [CrossRef]
  30. Alt, H.; Knauer, C.; Wenk, C. Matching polygonal curves with respect to the Fréchet distance. In Proceedings of the 18th International Symposium on Theoretical Aspects of Computer Science, Dresden, Germany, 15–17 February 2001; pp. 63–74. [Google Scholar]
  31. Tong, X.; Liang, D.; Jin, Y. A linear road object matching method for conflation based on optimization and logistic regression. Int. J. Geogr. Inf. Sci. 2014, 28, 824–846. [Google Scholar] [CrossRef]
  32. Kim, I.; Feng, C.; Wang, Y. A simplified linear feature matching method using decision tree analysis, weighted linear directional mean, and topological relationships. Int. J. Geogr. Inf. Syst. 2017, 31, 1042–1060. [Google Scholar] [CrossRef]
  33. Kim, J.; Yu, K.; Bang, Y. A multi-criteria decision-making approach for geometric matching of areal objects. Trans. GIS 2018, 22, 269–287. [Google Scholar] [CrossRef]
  34. Wei, Z.; Guo, Q.; Wang, L.; Yan, F. On the spatial distribution of buildings for map generalization. Cartogr. Geogr. Inf. Sci. 2018, 45, 539–555. [Google Scholar] [CrossRef]
  35. Yan, H.; Weibel, R.; Yang, B. A Multi-parameter Approach to Automated Building Grouping and Generalization. Geoinformatica 2008, 12, 73–89. [Google Scholar] [CrossRef]
  36. Available online: https://github.com/Sable/mcbench-benchmarks/blob/ba13b2f0296ef49491b95e3f984c7c41fccdb6d8/29968-modified-hausdorff-distance/ModHausdorffDist.m (accessed on 12 June 2024).
Figure 1. Example of settlement polygons of urban villages and built-up district in 1:5K vector data.
Ijgi 13 00198 g001
Figure 2. Images of the urban villages and built-up district of the same region as Figure 1 on an online map.
Ijgi 13 00198 g002
Figure 3. Urban village extraction method proposed in this paper (polygons filled with gray color represent data pre-process stage; polygons filled with yellow color represent judgements related to the AreaRatio; polygons filled with green color represent judgements related to the MHDistance; and the polygon filled with pink color represents the final results of urban village extraction).
Ijgi 13 00198 g003
Figure 4. The first step of extracting urban villages: dividing settlement polygons into “blocks”.
Ijgi 13 00198 g004
Figure 5. Before the establishment of the constrained Delaunay triangulation and the Thiessen polygons, vertices of the settlement polygons must be densified.
Ijgi 13 00198 g005
Figure 6. The constrained Delaunay triangulation (DT) and the Thiessen polygons constructed within a block.
Ijgi 13 00198 g006
Figure 7. Facing line segments (FLSs) between adjacent polygons (FLSs are represented by blue lines with different brightnesses).
Ijgi 13 00198 g007
Figure 8. The threshold of the MHDistance is determined statistically(the orange lines where the red arrows point in demonstrate the MHDistances between one FLS and the middle line of the FLSs and the MHDistances be-tween the other FLS and the same middle line are the not the same).
Ijgi 13 00198 g008
Figure 9. Example of generalization method after urban villages and built-up districts have been extracted. (Note: (a) source map at 1:5K; (b1) map at 1:10K without generalization and without urban village boundary; (c1) roads at 1:10K; (d1) 1:10K roads which have been retained and settlement polygons; (e1) settlement polygons after being generalized based on (d1); (f1) settlement polygons after being generalized based on (e1) at 1:25K; (b2) 1:10K map without generalization but with urban village and other boundaries; (c2) boundaries between different groups; (d2) 1:10K boundaries which have been retained (in green color); (e2) settlement polygons after being generalized based on (d2); (f2) settlement polygons after being generalized based on (e2) at 1:25K).
Ijgi 13 00198 g009
Figure 10. Experimental dataset (a neighborhood in Lanzhou City, Gansu Province, China).
Ijgi 13 00198 g010
Figure 11. The preliminary set of urban village residential areas extracted under the threshold (0.519689 < AreaRatio < 1.348790).
Ijgi 13 00198 g011
Figure 12. The distribution of FLSs with MHDistance less than or equal to 5 m (① to ⑤ are non-urban village polygons who have MHDistances less than or equal to 5 m with urban village polygons in the preliminary set; the red boxes highlight areas of mis-extraction and omissions).
Ijgi 13 00198 g012
Figure 13. The final set of urban villages within the block as extracted by the present method (the red boxes highlight areas of mis-extraction and omissions).
Ijgi 13 00198 g013
Figure 14. Generalization method for the extracted urban villages and other settlement polygons.
Ijgi 13 00198 g014
Figure 15. When one of a pair of facing line segments has a near right-angle turn, it causes the MHDistance to be relatively larger (① and ③ indicate segment chains in the FLSs approximated a straight line; ② and ④ indicate the other segment chains in the FLSs underwent a turn of approximately 90 degrees).
Ijgi 13 00198 g015
Disclaimer/Publisher’s Note: The statements, opinions and data contained in all publications are solely those of the individual author(s) and contributor(s) and not of MDPI and/or the editor(s). MDPI and/or the editor(s) disclaim responsibility for any injury to people or property resulting from any ideas, methods, instructions or products referred to in the content.

