Abstract
Research on forest carbon storage (FCS) is crucial for the sustainable development of human society given the context of global climate change. Previous FCS studies formed the science base of the FCS field but lacked a macrolevel knowledge summary. This study combined the scientometric mapping tool VOSviewer and multiple statistical models to conduct a comprehensive knowledge graph mining and analysis of global FCS papers (covering 101 countries, 1712 institutions, 5435 authors, and 276 journals) in the Web of Science database as of 2022, focusing on revealing the macro spatiotemporal pattern, multidimensional research status, and topic evolution process of FCS research at the global scale, so as to grasp the status of global FCS research more clearly and comprehensively, thereby facilitating the future decision-making and practice of researchers. The results showed the following: (1) In the past three decades, the number of FCS papers indicated an increasing trend, with a growth rate of 4.66/yr, particularly significant after 2010. These papers were mainly from Europe, the Americas, and Asia, while there was a huge gap between Africa, Oceania, and the above regions. (2) For the research status at the national, institutional, scholar, and journal levels, the USA, with 331 FCS papers and 18,653 total citations, was the most active and influential country in global FCS research; the United States Forest Service topped the influential ranking with 4115 citations; Grant M. Domke and Jerome Chave were the most active and influential FCS researchers globally, respectively. China’s activity (237 papers) and influence (5403 citations) ranked second, and the Chinese Academy of Sciences was the most active research institution in the world. Currently, FCS research is published in a growing number of journals, among which Forest Ecology and Management ranked first in the number of papers (154 papers) and citations (6374 citations). (3) In recent years, the keyword frequency of monitoring methods, driving factors, and reasonable management for FCS has increased rapidly, and many new related keywords have emerged, which means that researchers are not only focusing on the estimation and monitoring of FCS but also increasingly concerned about its driving mechanism and sustainable development.
1. Introduction
Climate change has become one of the most pressing and highly regarded issues currently [1,2,3,4]. Statistics show that approximately 60–70% of global greenhouse gas emissions are caused by carbon dioxide [5,6,7], which severely threatens the sustainable development of humanity [8]. To reduce the amount of carbon dioxide in the atmosphere, the international community has successively issued multiple agreements to reduce the amount of carbon dioxide in the atmosphere, such as the United Nations Framework Convention on Climate Change (UNFCCC), the Kyoto Protocol, and the Paris Agreement [9]. In addition, as of October 2020, 127 countries/regions had successively announced carbon neutral targets. Driven by efforts to reach these targets, related measures such as energy conservation and emission reduction, afforestation, and returning farmland to forests have been fully implemented in various countries around the world.
Forests can effectively mitigate global climate change by absorbing CO2 from the atmosphere and storing it in trees, soil, and other organic matter [10,11,12]. Statistics from the Food and Agriculture Organization of the United Nations [13] indicate that forests, which are distributed worldwide, account for approximately 31% of the total land area. Dixon et al. [10] noted that more than 86% of the global vegetation carbon pool and more than 73% of the global soil carbon pool are stored in forest ecosystems. Early research by Fang et al. [14] further indicated that the fixed carbon of forest ecosystems accounted for more than two-thirds of the total amount in terrestrial ecosystems each year. These studies have proven that forests are the largest carbon pool in terrestrial ecosystems [15,16] and play an irreplaceable role in maintaining global carbon cycling and improving regional ecological environments [12,15,17].
Given the context of global warming and the human pursuit of sustainable development, the study of forest carbon storage (FCS) is receiving increasing attention. According to our literature review, in the 1980s, many American scholars began carrying out FCS research, such as Armentano [18], Cooper [19], and Schiffman and Johnson [20]. Since the 1990s, other countries have also successively carried out relevant research, such as Fang et al. [14], Piao [11], Salunkhe et al. [21], and Tian et al. [3]. To date, this field has produced a large amount of research; related research topics are rapidly increasing as well [9]. Undoubtedly, these studies on forest carbon storage are of great significance because they can help humans to more accurately monitor FCS [11,14], more effectively manage forests [21], develop more realistic climate policies [8], and better protect biodiversity [5,22].
Several representative papers in China, such as Fang et al. [14], Piao [11], and Guo et al. [23], have reviewed the domestic FCS situation and proposed various estimation models. Qureshi et al. [24] reviewed various methods for estimating carbon storage and soil organic carbon, such as the “forest yield method”, “biomass expansion coefficient”, and “Walkley–Black method”, and established standardized levels for different landscapes and forest types. Kho and Jepsen [25] collated and analyzed Malaysian datasets on total carbon stocks for both aboveground and belowground biomass. Birdsey and Pan [26] summarized trends in global forest area according to management intensity and provided an overview of changes in global carbon stocks associated with managed forests. Kalies et al. [27] performed a meta-analysis of FCS studies from the United States and Canada to investigate the effects of aboveground vegetation, soil, litter, and dead wood on FCS. Ali and Yan [22] systematically reviewed the relationship between biodiversity and carbon storage in different forest ecosystems based on 47 studies collected from the Web of Science (WOS) and Knowledge databases. Salunkhe et al. [21] provided a detailed overview of the current research on aboveground biomass and carbon storage in different forest types in India based on datasets of forest biomass and carbon storage. Huang et al. [9] performed a bibliometric analysis of 1284 publications related to forest carbon sequestration from the WOS core collection database between 1990 and 2018. Similarly, Udara Willhelm Abeydeera et al. [7] reviewed the relevant literature on global carbon emissions from 1981 to 2019 and mapped a global carbon emissions research network. Recently, Sun and Liu [16] systematically reviewed the basic types of FCS estimation methods and their applications in China and pointed out that multi-source data and heterogeneous models used in FCS estimation research can lead to significant differences in estimation results.
The original research summarized in the above reviews forms the knowledge foundations of FCS research and helps explain the current state of the field. However, the existing knowledge is still limited and fragmented. Specifically, the existing reviews are mostly regionally specific (e.g., Guo et al. [23]: China; Kalies et al. [27]: USA and Canada; Salunkhe et al. [21]: India). Additionally, most of the research topics focus on a specific point related to FCS, which is relatively different from the overall “forest carbon storage” topic (e.g., Udara Willhelm Abeydeera et al. [7]: carbon emissions; Birdsey and Pan [26]: forest management intensity; Huang et al. [9]: carbon sequestration; Sun and Liu [16]: FCS estimation method). It is worth noting that previous studies have rarely focused on the following issues: (1) What is the spatiotemporal pattern of global FCS research? (2) How does one evaluate the number and impact of FCS papers at the national, institutional, scholar, and journal levels? (3) What are the main research hotspots and their evolution process? The answers to these questions are very important for enriching FCS research. Therefore, it is necessary to conduct a macroscopic and comprehensive review of FCS research in order to grasp its current status and trends, which can help FCS scholars to make effective decisions for future research.
Bibliometric analysis can quantitatively evaluate and analyze existing research in a specific field, thus increasing the understanding of the current state, characteristics, and trends of related knowledge [28,29,30]. This method utilizes statistical algorithms for knowledge extraction and network analysis and uses visualization methods to create a knowledge map for a specific field; it allows people to explore the development and relationships between different scientific knowledge blocks [9]. It has been widely used to gain insights and development trends in different fields, such as ecology [30,31], security science [29], and geology [32]. However, an effective review of global-scale FCS studies is still lacking. Although Huang et al. [9] comprehensively assessed global carbon sequestration research trends, carbon sequestration is a relatively broad field that encompasses various topics, such as carbon storage, carbon sinks, and carbon accumulation, making it difficult to focus specifically on the “forest carbon storage” topic and reflect the detailed characteristics of this field. Moreover, increasing attention to global climate change has led countries to set carbon neutrality goals, and related research on efforts to promote carbon storage has also increased rapidly in recent years. However, the research period of Huang et al. [9] extends to only 2018, which limits the timeliness of their knowledge and their ability to reflect the latest research trends. In terms of research methods, the current bibliometric analysis research is almost entirely based on scientometric mapping tools (e.g., VOSviewer, CiteSpace), which have a limited ability to summarize knowledge. Innovatively incorporating other statistical models could provide a more objective and comprehensive exploration of the knowledge landscape in specific fields, such as trend detection models like the Mann–Kendall mutation test that can be used to analyze the literature time series [33]. Additionally, activity index and attractive index models can be used to measure the activity and influence of research entities in a given field [34].
In summary, the main goal of this study is to integrate the FCS literature from throughout the world from 1993 to 2022 and explore its spatiotemporal pattern, research status at the national, institutional, scholar, and journal levels, and evolution of research topics in the FCS field from multiple angles, so as to grasp the characteristics and trends of FCS research and provide a theoretical basis for decision-making and practice in this field in the future.
2. Materials and Methods
2.1. Literature Collection Strategy
Our literature collection strategy includes the following four steps: (1) Determine the scientific databases to be used. We assessed the evaluation results of Olawumi et al. [35] for the current major scientific databases (i.e., Scopus, WOS, and Google Scholar) and considered the comprehensiveness, scientific robustness, and organized structure of these databases [36,37]. We then adopted the WOS core collection database, which includes the SCI-EXPANDED, SSCI, CPCI-S, CPCI-SSH, CCR-EXPANDED, and IC databases, to search and collect related journals. (2) Define the search criteria. The search string “(forest* AND “carbon storage”) or (forest* AND “carbon stock*”)” was used to comprehensively retrieve documents from the core collection of WOS, with the “*” character indicating a fuzzy search. We referred to the previous study of Huang et al. [9] and used the title field instead of the topic field for retrieval. The current study proved that the retrieval results of the latter were far greater than those of the former (10,777 papers vs. 1391 papers) since the latter’s search scope includes “title”, “abstract”, and “keywords” and thus produced many nonrelated results. (3) Identify other conditions, including year published, language, and document type. Specifically, since the earliest FCS paper in the WOS database was published in 1993, the year published was set to 1993–2022. As English is the most widely used academic language, language was set to English; document type was established as article and review, as these published journal articles have undergone strict peer reviews and possess good reputations, which allows them to be classified as “certified knowledge” [36]. (4) The 1252 bibliographic records finally screened out were exported as plain text files in the format of “full record and cited references” as well as Microsoft Excel files, which served as the analysis sample.
2.2. Methods
2.2.1. Bibliometric Analysis
Scientific research tools can greatly improve the efficiency of information extraction and knowledge discovery in bibliometric analysis [29]. In the early years, Cobo et al. [38] conducted a comprehensive review of scientometric mapping tools, which were further updated and extended by Li et al. [29] a decade later.
For the bibliometric analysis relating to the formation of networks for countries, organizations, authors, references, and keywords, we used VOSviewer (version 1.6.16) developed by van Eck and Waltman [39]; VOSviewer is one of the most influential pieces of software in bibliometric analysis [30]. It presents the structure and distribution of scientific knowledge via scientometrics, data analysis, and information visualization, enabling the generation of different types of knowledge graphs and providing researchers with visual citations of the literature landscape [9]. This tool can be downloaded for free from the website (https://www.vosviewer.com, (accessed on 25 June 2021)). For an introduction to its development principles and functions, please refer to the manual for version VOSviewer 1.6.16 [39] or the detailed analysis of the main concepts underlying bibliometric mapping technology in this tool by Li et al. [29].
Figure 1 takes the collaboration network of countries as an example to chart the process of bibliometric analysis, and Table 1 lists the relevant parameters. The main process is as follows: first, a bibliometric analysis project was created in VOSviewer software; second, the pure text document metadata to be analyzed were selected; then, the analysis method was selected, and relevant parameters were set to generate analysis results; and finally, the visualization method and parameter were selected and set, respectively, to generate visualized network maps. It is worth noting that the network maps (e.g., Figure 1) created in VOSviewer consist of one type of item (country/organization/author names, references, or keywords) connected to each other by lines or links, and each link has a strength, represented by a positive numerical value [31]. The strength of a link may, for example, indicate the number of publications in which two countries/organizations/authors have collaborated (in the case of country/organization/author co-authorship) or the number of publications in which two keywords have occurred together (in the case of keyword co-occurrence). The item is the basic unit of the network, a closely linked set of items forms a cluster, and different clusters are further connected to form a network. The size of each item in a network is weighted by the number of documents, citations, or the strength of the link between two items. The color of an item is determined by the cluster to which it belongs [31,39].
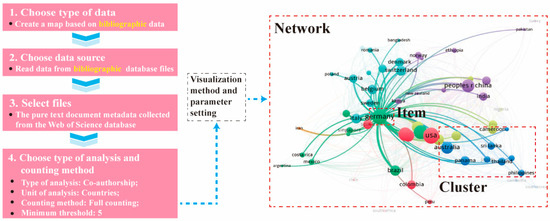
Figure 1.
The process of bibliometric analysis (taking the collaboration network of countries as an example).

Table 1.
Bibliometric analysis process and parameter settings in VOSviewer platform.
2.2.2. Mann–Kendall Mutation Test
The Mann–Kendall mutation test is a nonparametric statistical method for time series analysis [33], also known as a nondistribution test. The method has previously been widely used in meteorology and hydrology [40]. In this study, for the first time, we applied it to the trend analysis and mutation detection of the time series of global FCS papers and related keywords in the past 30 years. The formula is defined as follows:
(1) For FCS paper time series with samples, , an ordered series is constructed:
where is the cumulative number of values greater at time than .
(2) The mean and variance statistics are defined as follows:
(3) Assume that the time series is random and independent, and define the following statistics:
where conforms to the standard normal distribution, and indicates that the time series shows an increasing trend and vice versa. According to the normal distribution table, we defined the significance level as and the corresponding critical confidence coefficient as , which means that when , the change trend of the time series is significant. Similarly, the inverse order of is calculated as . If the and curves intersect at a certain point, and the intersection point is between the credibility line, then the time corresponding to the intersection point is the mutation moment of the time series.
2.2.3. Activity Index (AI) and Attractive Index (AAI)
The activity index (AI) and attractive index (AAI) defined by Hungarian scholars [34] were employed to evaluate the relative effort devoted by a country to the FCS field (i.e., activeness) and the relative impact made by a country in terms of the citations of its publications (i.e., academic influence). For the principles and model explanations of these two indicators, please refer to the previous study by Schubert and Braun [34] and related applications such as Chen and Guan [41] and Huang et al. [9]. The equation of the AI is defined as follows:
where represents the activeness for the -th country in the -th year during the given period; is the number of FCS papers of the -th country in the -th year; is the total number of FCS papers of the -th country during the given publication period; is the number of FCS papers published globally in the -th year; is the total number of FCS papers published globally during the given publication period.
Similarly, the equation of the AAI is defined as follows:
where represents the academic influence for the -th country in the -th year during the given period; in addition to replacing in the AI model with ( is the number of citations of paper), the meaning of each parameter is almost the same as that of the AI [41].
3. Results
3.1. Macroscopic Characteristics of Published FCS Papers
3.1.1. Interannual Trends in the Number of Published FCS Papers
The statistics suggest that from the publication of the first FCS paper [42] in 1993 to the end of 2022, a total of 1252 related papers have been published worldwide. Figure 2 shows the annual paper count and its changing trend. Over the past 30 years, the number of FCS papers has generally shown an increasing trend, with a linear regression coefficient of 4.66 (R2 = 0.8627) and passes the significance test at a 99% confidence level. In particular, 2019 had the highest number of publications (140 papers). The Mann–Kendall mutation test observed a phased feature in the above trend. Specifically, it can be divided into the following three periods: (1) the initial period (1993–2001), during which the UF(t) curve fluctuated before 2001, and the number of papers published in this period was less than 5 per year, with none of the relevant literature published in 1994, 1998, or 2001; (2) the slow growth period (2002–2009), during which the UF(t) curve fluctuated between 0 and 1.96 after 2002, indicating that the number of FCS papers showed a slow growth trend, with the number of papers exceeding 10 for the first time in 2003; and (3) the rapid growth period (2010–2022), during which the UF(t) curve exceeded the critical confidence coefficient of 1.96 after 2010, indicating that the growth trend for FCS paper quantity had changed from slow growth to significant growth, and this trend was relatively pronounced during 2012–2013 and 2010–2018. Since the intersection of the UF(t) and UB(t) curves lies outside the critical confidence coefficient, no potential mutation years in the article volume were detected across the entire time domain.
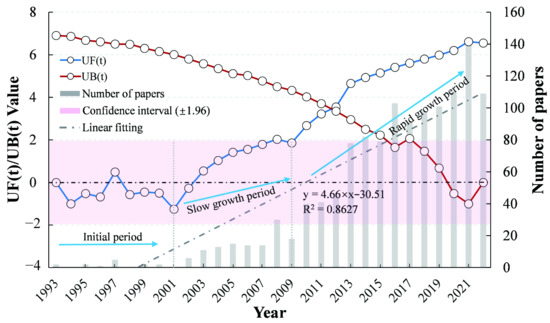
Figure 2.
Annual number of forest carbon storage (FCS) papers published and its trends at global scale.
3.1.2. The Spatial Distribution in the Number of FCS Papers
The spatial distribution of published FCS papers was determined according to the institutional addresses. Note that cross-regional collaboration studies may result in a paper having multiple institutional affiliations representing different countries, and 1252 FCS papers recorded in the WOS core database were expanded to 2057 after being classified by country; thus, the percentages were calculated based on the percentile of 2057. Furthermore, the number of papers (NoP) index was used to represent activity, and the total citations (TC) index was used to measure influence [43]. Figure 3a clearly demonstrates that the NoP on FCS had significant spatial heterogeneity at the global scale and was dominated by Europe, the Americas (including North America and South America), and Asia. Specifically, Europe had the highest number of FCS papers published, with 683 papers, accounting for 33.20% of the total papers, and its TC were also the highest, with 35,014 citations, followed by the Americas (615 papers, 29.90%, 31,477 times); Asia was in the middle (563 papers, 27.37%, 13,358 citations), while the NoP in Africa and Oceania accounted for only 5.49% and 4.04%, respectively, and the TC were 8086 citations and 4448 citations, respectively. Figure 3b shows the top three countries in terms of the percentage of FCS papers published each year to the total global FCS papers for that year between 1993 and 2022, which are the main countries conducting FCS research, all from Europe, the Americas, and Asia. Before 2010, the countries engaged in FCS research were almost all from the Americas and Europe, such as the United States (USA), Germany (DEU), and Canada (CAN), especially the USA, which ranked in the top three in terms of the number of FCS papers published each year. After 2010, some Asian countries began to publish a large number of FCS papers, such as China (CHN) and India (IND), which became the main countries in FCS research after 2010 and 2019, respectively. In summary, in the past 30 years, the total NoP and TC in Europe, the Americas, and Asia accounted for 90.47% and 86.43% of the total, respectively, and the main countries conducting FCS research were also concentrated in these three continents, indicating that these three continents were the main research regions for FCS, while there was a huge gap in FCS knowledge between Africa, Oceania, and the above regions.
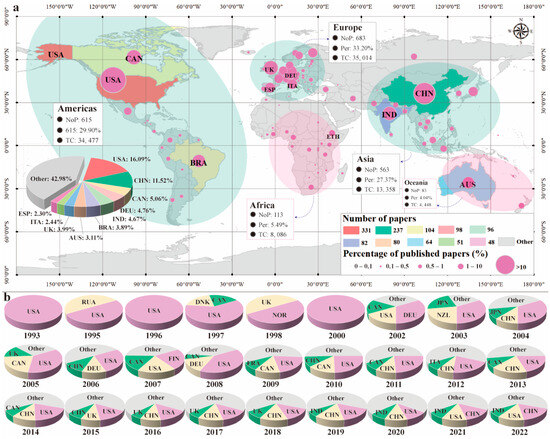
Figure 3.
The spatiotemporal distribution of FCS papers in the past 30 years: (a) the spatial distribution of FCS papers; (b) the top three countries in terms of the percentage of FCS papers published each year to the total global FCS papers for that year. NoP, Per, and TC represent the number of papers, the percentage of published papers in the total papers, and total citations, respectively.
3.2. The Research Status at Different Levels of the FCS Field
3.2.1. National and Institutional Level
(1) An analysis of the number and citations of FCS papers
The paper samples were from 101 countries/regions around the world, the majority of which were from China and the United States. Table 2 shows the top ten most productive countries. Statistics showed that the sum of the FCS papers of these countries exceeded the sum of other countries (57.02% vs. 42.98%). Among these countries, the USA had the most FCS papers, with 331 papers, accounting for 16.09%. Correspondingly, its TC were also the highest in the world, with 18,653 citations. China’s NoP and TC were the next highest, with 237 papers and 5403 citations, respectively. The NoP proportions in other countries were all less than 10% and ranked as follows: Canada (5.06%), Germany (4.76%), India (4.67%), the UK (3.99%), Brazil (3.89%), Australia (3.11%), Italy (2.48%), and Spain (2.33%). The TC of the UK (5500 citations) and Germany (5081 citations) ranked third and fourth, respectively, while the remaining countries all had less than 5000 citations. The average citations (AC) per paper can indirectly reflect the average quality of a country’s publications [30]. From this perspective, the UK had the highest AC, reaching 78.75 citations, followed by Australia at 61.86 citations, the USA at 56.35 citations, and Germany at 51.85 citations. The quality of the FCS research results of the above countries was relatively high, while other countries all had AC of less than 50 citations. Note that, unlike the high positions shown in the NoP rankings, the AC of China (22.80 citations) and India (15.54 citations) were relatively low. Table 2 also shows the countries that published only one FCS paper and whose TC were less than 10, mainly from Africa and Oceania. Specifically, the above countries included four African countries, three Oceanian countries, two Asian countries, and one European country, and the NoP, TC, and AC of these countries were all ranked at the bottom. Among them, the FCS papers of Tunisia, the United Arab Emirates, Uganda, and Zambia all had 0 citations.
Table 2.
The countries with the highest and lowest productivity in the FCS field.
The activeness and academic influence of the top ten most productive countries in FCS research were quantified through the AI and AAI and compared with international standards (Figure 4). The activeness and academic influence of the USA and Germany were higher than the global average for more than ten years, which were concentrated before 2011 and 2015, respectively, but have since declined in both the AI and AAI. The UK’s AI and AAI were higher than the global average for 9 and 8 years, respectively, all concentrated before 2018. The AI and AAI in Brazil, Italy, and Australia were below the global average in most years. The activeness of China, Canada, and India was higher than the global average level for more than ten years, and the academic influence of Italy was higher than the global average level for more than ten years. An imbalance was found between the activeness and academic influence of some countries. For example, China had 14 years of high activity but only 7 years of high academic impact.
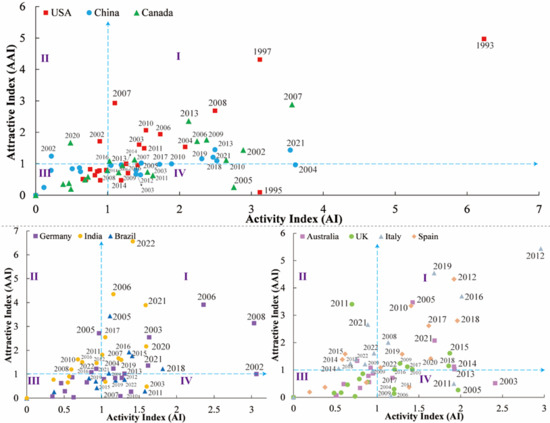
Figure 4.
The AI and AAI relation chart for the top ten most productive countries in the FCS field. I, II, III, and IV represent quadrants 1–4, respectively, and the abscissa = 1 and ordinate = 1 represent the global average of the AI and AAI, respectively. When the AI and AAI of a country are both higher/lower than the global average level, the corresponding year points are clustered in the first/third quadrant; when the AI is lower/higher than the global average and the AAI is higher/lower than the global average, the corresponding year points are clustered in the second/fourth quadrant.
Table 3 shows the top ten institutions with the most papers in the FCS field among the 1712 institutions worldwide. The statistics showed that the Chinese Academy of Sciences topped the list with 89 papers, followed closely by the United States Forest Service (82 papers), while other institutions published less than 50 papers. Further statistics found that China had the most FCS research institutions among the top ten institutions, and the domestic Chinese Academy of Sciences, University of Chinese Academy of Sciences, Peking University, Chinese Academy of Forestry, Beijing Forestry University, and Northeast Forestry University ranked first, third, sixth, seventh, eighth, and tenth in the world, respectively. These institutions have published a total of 196 FCS papers in the past 30 years. There were two institutions in the United States on the list: the second-ranked United States Forest Service and fourth-ranked Oregon State University published a combined 108 FCS papers. The other two institutions were the fifth-ranked University of Copenhagen in Denmark and the ninth-ranked Natural Resources Canada in Canada. In terms of influence, TC from the United States Forest Service (4115 citations), Chinese Academy of Sciences (2357 citations), and Oregon State University (1505 citations) ranked among the top three. In terms of the average influence of a paper, Oregon State University ranked first with an AC index of 57.88 citations, among which the most cited paper was authored by McKinley et al. [44] with 261 citations; the United States Forest Service ranked second with an AC index of 50.18 times, with the most cited paper authored by Asner et al. [45] with 437 citations. Due to the high citation rates of papers published by Vesterdal et al. [46] (256 citations), Mayer et al. [47] (187 citations), and Van Breugel et al. [48] (176 citations), the University of Copenhagen’s NoP ranked fifth and rose to third with an AC index of 48.36 citations.
Table 3.
The top ten most productive institutions in the FCS field.
(2) Collaboration analysis
Based on the VOSviewer software, the collaboration network in the FCS field between countries that had more than five FCS papers was drawn (Figure 5). A total of 100 countries worldwide had launched extensive cooperation in the FCS field, prominently clustered in developed countries of Europe and North America (Figure 5a). Specifically, seven of the top ten countries in the number of cooperations were European and American countries, including the top-ranked United States, which cooperated with 52 countries, followed closely by Germany (second, 48 countries), the UK (third, 47 countries), Canada (fourth, 43 countries), Netherlands (sixth, 37 countries), France (seventh, 37 countries), and Italy (ninth, 31 countries). China, Australia, and Brazil rank fifth (41 countries), eighth (37 countries), and tenth (31 countries), respectively. It is noteworthy that the USA was the first country to study FCS and had the most FCS-related publications. In the past 30 years, the USA has maintained close cooperation with other countries, especially with China, Brazil, the UK, Canada, Germany, and Australia. European countries/regions (e.g., Germany and the UK) collaborated frequently with each other and with other developed countries (e.g., the USA, Canada) in the early years and in recent years have increasingly collaborated with developing countries, such as China and Brazil. China has established close collaborative relationships with FCS research powerhouses such as the United States, Canada, and Germany since publishing its first FCS paper in 2001.

Figure 5.
The collaboration network of (a) countries and (b) institutions that have more than 5 FCS papers. Nodes represent countries and institutions, and larger nodes and thicker lines indicate more partners and more frequent collaborations, respectively.
Figure 5b reveals a comprehensive collaboration network among 130 institutions globally that have published at least five FCS papers. The relatively dense network structure indicates that these institutions frequently collaborate. The first research echelon was dominated by the United States Forest Service, which had collaborative relations with 41 institutions, among which cooperation with Oregon State University was the strongest. The subsequent second echelon was dominated by the Chinese Academy of Sciences (32 partners), with the closest cooperation with the University of The Chinese Academy of Sciences. In the third, fourth, and fifth echelons were the University of Copenhagen (24 partners), the University of Oxford (22 partners), and Wageningen University (21 partners), respectively. The number of partners for other institutions was less than 20, and their influence was relatively weak.
3.2.2. Author Level
(1) Collaboration and activity analysis
The author collaboration network was drawn by VOSviewer software (Figure 6). At first glance, the FCS field brought together numerous researchers and extensive collaboration. Statistics indicated that a total of 5435 scholars have published FCS papers, of which 725 scholars have published at least two papers. Clustering was conducted in accordance with the co-authorship method, and the authors were divided into 21 different clusters, among which 4 author clusters with significant team effects and outstanding research achievements form the main body of FCS research. The first cluster (marked with a red circle) was led by Grant M. Domke, Christopher W. Woodall, and James E. Smith, all from the United States Forest Service in the USA, who have long been committed to estimating the FCS of the United States (e.g., Domke et al. [49]; Domke et al. [50]; Smith et al. [51]; Woodall et al. [52]; Woodall et al. [53]). The second cluster (marked with a purple circle) was led by Guomo Zhou and Yongjun Shi, both from Zhejiang A&F University in China, who have focused on developing remote sensing models for estimating carbon storage in various forest types, such as moso bamboo forests (e.g., Du et al. [54]; Li et al. [55]; Mao et al. [56]; Shi et al. [57]; Xu et al. [58]). The third cluster (marked with a red circle) was led by Jingyun Fang of Peking University, China, who has been working on the estimation and spatiotemporal analysis of forest biomass and carbon stocks in China (e.g., Fang et al. [59]; Fang et al. [14]; Fang et al. [60]; Fang et al. [8]; Guo et al. [61]; Guo et al. [23]; Piao [11]; Zhu et al. [62]). The fourth cluster (marked with a pink circle) was led by Lars Vesterdal from the University of Copenhagen, Denmark, who has long been engaged in research on forest soil carbon storage (e.g., De Vos et al. [63]; Vesterdal et al. [46]; Nord-Larsen et al. [64]). The collaboration within these four teams was close, such as Grant M. Domke and Christopher W. Woodall, Guomo Zhou and Yongjun Shi, but direct collaboration between teams was relatively rare.
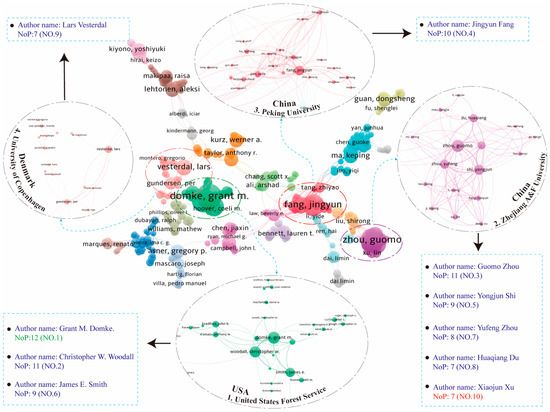
Figure 6.
The collaboration network of authors who have published more than 2 papers. Nodes represent authors, and larger nodes and thicker lines indicate more papers and more frequent collaborations, respectively. NoP represents the number of papers.
The top ten most active authors were included in the four research teams mentioned above, of whom three were from the USA, six were from China, and one was from Denmark. Specifically, Grant M. Domke from the United States Forest Service was the most active as he has published the most FCS papers (12 papers), followed by Christopher W. Woodall of the same institution (11 papers). Guomo Zhou from Zhejiang A&F University and Jingyun Fang from Peking University, with 11 and 10 papers, respectively, ranked third and fourth. The publication volume of other authors was less than 10 papers. Surprisingly, half of the top 10 most active authors were from Zhejiang A&F University, with a total of 42 published papers.
(2) Influence analysis
The number of published FCS papers represents a certain author’s activity level in this field, and the number of citations of a certain author or paper can further reflect the influence of the author or paper on FCS research [29]. This indicator can be quantified through a co-citation analysis of the author and reference to ensure that we obtained the most outstanding authors and documents in the FCS field.
The statistics of the author co-citation network analysis showed that the top ten most cited authors were primarily from six American scholars, two Chinese scholars, and two United Nations institutions (Figure 7a,b). The top four most cited authors were all American scholars, namely, Jerome Chave (472 citations), Sandra Brown (408 citations), Richard A. Houghton (355 citations), and Yude Pan (304 citations). Following them was one Chinese scholar, namely Jingyun Fang (235 citations). The 6th-10th positions were held by Mark E. Harmon (231 citations, USA), the Intergovernmental Panel on Climate Change (IPCC, 211 citations, the institution of United Nations), Rattan Lal (211 citations, USA), Renee K. Dixon (206 citations, USA), and the FAO (205 citations, the institution of United Nations). These scholars cooperated closely, especially the collaboration between Jingyun Fang and Yude Pan (Figure 7(a1)) and the collaboration between Sandra Brown, Jerome Chave, and Richard A. Houghton (Figure 7(a2)).
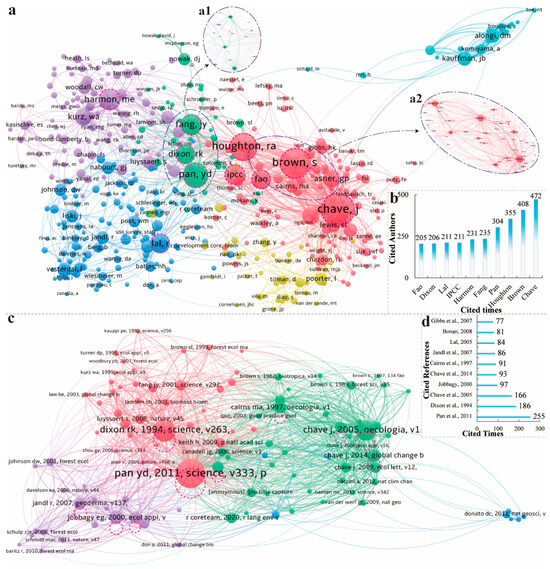
Figure 7.
The co-citation network: (a) authors with more than 20 citations and their (b) statistics, of which a1 and a2 are detailed displays of the collaboration network of scholars with close cooperation; (c) references with more than 25 citations and their (d) statistics, including Gibbs et al., 2007, Bonan, 2008, Lal, 2005, Jandl et al., 2007, Cairns et al., 1997, Chave et al., 2014, Jobbagy, 2000, Chave et al., 2005, Dixon et al., 1994, and Pan et al., 2011. Nodes represent authors, and larger nodes and thicker lines indicate more cited citations and more frequent collaborations, respectively.
The reference co-citation network analysis confirmed that a paper by Pan et al. [15] was the only publication cited more than 200 times. The paper estimated the global forest carbon sink from 1990 to 2007 and was published in Science in 2011. The second most cited paper was a study by Dixon et al. [10], which was published in Science in the early stages of FCS research and has been cited 186 times. The paper simulated the global forest carbon sink under different scenarios of forest growth and decline and revealed that forests may become a carbon sink or a carbon source in the future. Following this, a study by Chave et al. [65] has been cited 166 times; it focused on tree allometry and improved the estimation of carbon stocks and balance in tropical forests. The other papers had fewer than 100 citations. Note that among the top ten most cited papers, eight were from American scholars, and the remaining two were from Argentinian [66] and Australian [67] scholars, ranking fourth and seventh, respectively.
3.2.3. Journal Level
The 1252 FCS paper samples were distributed across 276 different journals worldwide. Figure 8a provides multidimensional statistics of the top ten most productive journals. The results showed that these journals published a total of 406 papers, accounting for 32.43% of the 1252 papers, among which Forest Ecology and Management topped the list with 154 papers, accounting for 12.30%, followed by Forests (72 papers, 5.75%); the remaining journals published fewer than 50 FCS papers. In terms of citations, Forest Ecology and Management had the highest TC with 6374 citations, while for AC, it ranked second (41.39 citations). In contrast, Global Change Biology, which had the highest IF2022 (13.211), ranked third in the number of papers published but topped the list in the AC ranking with 81.48 average citations, which was nearly twice that of the former. The AC of the remaining journals ranged from 9 to 40 citations. Figure 8b plots FCS’ NoP by the above journals each year. The number of journals publishing FCS papers gradually increased after 2002. Among them, Forest Ecology and Management was the first to publish FCS papers and ranked first in the NoP almost every year. The statistics of the NoP trend showed that the average annual growth rate of the NoP (AAGR) of the abovementioned journals has increased to varying degrees since 2002. Among these journals, Forest Ecology and Management had the highest AAGR (65.82%), which showed that the number of FCS papers published in this journal had a significant increase trend. Forests (58.43%) and Scientific Reports (55.42%) ranked second and third, respectively. Although these two journals published their first FCS papers only in 2012 and 2015, respectively, they have grown rapidly. The AAGR of the other journals was less than 50%. In terms of research directions, most of the above ten journals focus on the fields of agriculture and forestry science, forestry science, environmental science, earth science, biological science, and soil science, which indicates that although FCS research is mainly focused on forestry, it still has cross-disciplinary and diverse foci.
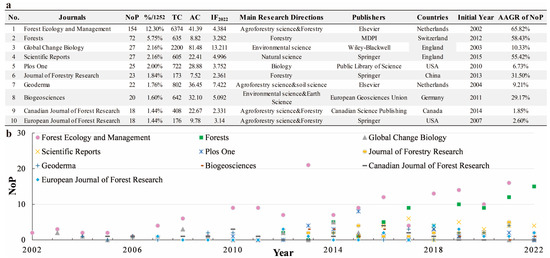
Figure 8.
An analysis of the top ten most productive journals in the FCS field: (a) statistical table; (b) the number of FCS papers published each year. NoP: number of papers; TC: total citations; AC: average citations; IF2022: impact factor in 2022; AAGR: average annual growth rate of the NoP.
3.3. Focal Research Topics and Its Trends
3.3.1. The Most Frequently Used Keywords in FCS Research at Different Stages
Keywords represent the core content of the literature, and their frequency analysis can help to identify the research hotspots and directions in FCS research [30]. Furthermore, an analysis of the keyword frequency in different periods can further reveal the temporal trajectory of FCS research and help predict future research trends. Table 4 lists the top 20 most frequently appearing keywords in different periods, and Figure 9 visualizes the focal topic network of FCS research in different periods.
Table 4.
The top 20 most frequently used keywords in FCS research at different stages.

Figure 9.
The evolution of the keywords in the FCS literature in the (a) initial period (1993–2001), (b) slow growth period (2002–2009), (c) rapid growth period (2010–2022), and (d) whole study period (1993–2022). Nodes represent keywords, and the larger the node is, the higher the occurrence frequency of the keyword.
In the initial period (1993–2001), 14 FCS papers provided 96 keywords, of which 79 keywords appeared only once. Before 1995, “budget” was the main research topic, appearing four times. After 1997, the frequency of “CO2” (six times) and “biomass” (five times) surpassed that of “budget” and became initial hotspots.
During the slow growth period (2002–2009), 121 publications contributed 726 keywords, of which 205 keywords appeared more than twice. Among the top five high-frequency keywords, “biomass” rose to the top of the list with a frequency of 34 times, followed by “sequestration” (26 times) and “storage” (19 times), which also rose in the ranking. In addition, some new and interesting topics emerged during this period, such as “dynamics” (20 times) and “nitrogen” (17 times), which ranked third and fifth, respectively. The initial hotspot “CO2” dropped out of the top 20.
During the rapid growth period (2010–2022), both the number and frequency of keywords increased markedly. VOSviewer detected 1345 keywords in 1117 publications, of which 217 keywords appeared more than 10 times, and 10 keywords appeared more than 100 times. Among these ten high-frequency keywords, similar to the previous stage, “biomass” (358 times), “dynamics” (238 times), “sequestration” (234 times), and “storage” (206 times) remained the top four keywords, while “aboveground biomass” (162 times) replaced “nitrogen” as the fifth. The subsequent keywords were “climate-change” (149 times), “management” (122 times), “carbon storage” (119 times), “productivity” (106 times), and “carbon sequestration” (104 times).
Over the entire time domain (1993–2022), “biomass”, with a frequency of 397 times, was by far the most frequent keyword, occupying a central position and mediating role in the network diagram, and “allometric equations” was the most frequent keyword related to this topic. The following keywords were “sequestration” (262 times), “dynamics” (258 times), “climate-change” (249 times), and “storage” (226 times); they were relatively close to each other in frequency. These four keywords have received widespread attention, especially since 2016. The frequency of other keywords was less than 200 times.
3.3.2. The High-Frequency Keywords That Have Emerged and Disappeared in the FCS Research in Recent Years
For a more comprehensive view of recent trends in the FCS field, we further analyzed the keywords that have emerged and disappeared in the past 5 years and 1 year, and Table 5 shows the top 20 keywords with the highest frequency. Statistics show that compared with studies conducted before 2018, a total of 1854 new keywords emerged from 2018 to 2022, of which 10 keywords appeared five times or more, namely “global patterns” (nine times), “leaf-litter” (seven times), “community structure” (six times), “redd plus” (six times), “altitude” (five times), “invest model” (five times), “litter quality” (five times) “moisture” (five times), “random forest” (five times), and “subtropical forests” (five times). In addition, 1947 keywords have disappeared in the past 5 years, with 12 words appearing five or more times before 2018, and the top 3 were “nutrient dynamics” (ten times), “clear-cut” (seven times), and “kyoto protocol” (seven times). Compared with studies conducted before 2018, a total of 342 new keywords appeared in 2022, 10 of which appeared twice, namely “coal”, “environmental covariates”, “environmental-conditions”, “growth model”, “important driver”, “plus model”, “soc stock”, and “tropical dry deciduous forest”. In addition, 3876 keywords disappeared in the past year, 8 of which appeared 20 times or more before 2022, and the top 3 were “budget” (29 times), “sink” (29 times), and “allometry” (26 times).
Table 5.
The top 20 most frequently used keywords that have emerged and disappeared in the FCS literature in recent years.
4. Discussion
4.1. Spatiotemporal Characteristic Analysis of FCS Field
From 1993 to 2022, the total number of published FCS papers globally showed an increasing trend, which can be divided into three stages, namely the initial period (1993–2001), the slow growth period (2002–2009), and the rapid growth period (2010–2022). This reveals that with the passage of time, the field of FCS has attracted more and more attention from the international academic community, especially after 2010. To the best of our knowledge, there are two reasons that have driven the rapid development of FCS research in recent years. First, the macro background of global climate change and the implementation of related policies have attracted an increasing number of researchers to engage in FCS research [8]. Specifically, as global climate change intensifies, the demand for FCS research is becoming more urgent. As one of the largest carbon sinks in the world, forests play an important role in mitigating global climate change [12,15]. Currently, some countries are taking relevant measures to protect forests to reduce carbon emissions and address climate change. For instance, the United Nations established the international forest protection mechanism (i.e., REDD+) in 2008, and the United States Forest Service implemented the “Forest Plan”. In September 2020, at the 75th United Nations General Assembly, the Chinese government officially proposed the goal of achieving carbon peaking in 2030 and carbon neutrality in 2060. These policies triggered many scholars’ high enthusiasm for FCS research. Additionally, more advanced and efficient technologies and methods have further promoted research progress in this field. Compared with traditional FCS measurement methods that require considerable human power and material resources, such as the cutting method, average standard tree method, and related growth method, which are implemented at the sample plot scale, the new generation of FCS estimation methods, such as ecological model simulation and remote sensing data inversion [11,61,68], have made large-scale FCS research feasible and more accurate (e.g., Pan et al. [15]; Piao [11]), which greatly promotes the applied value of FCS research and further promotes the development of this field.
In terms of spatial distribution, from 1993 to 2022, FCS papers were published on all continents worldwide but with significant heterogeneity in both quantity and impact (Figure 3), which may be related to factors such as forest conservation policies, economic development level, and scientific research resources in different regions. Specifically, the NoP and TC in Europe, the Americas, and Asia were in the top three, and the main countries conducting FCS research were also concentrated in these three continents, which demonstrated that Europe, the Americas, and Asia were the main regions of FCS research. Europe and the Americas have long attached importance to environmental protection and climate change issues; coupled with their abundant scientific research resources, researchers from these continents have published numerous FCS papers and have exerted a profound impact. Some Asian countries, such as China, Japan, and South Korea, have increasingly emphasized ecological protection and low-carbon economic development in recent years [69] and have also published a large amount of FCS-related results. However, compared with the results of Europe and the Americas, their influence is relatively low. Compared with the above three continents, there were obvious deficiencies in the FCS research in Africa and Oceania, which may be related to the existing conditions of these two continents. For instance, the socioeconomic conditions of most countries in Africa are relatively limited, and the number and scale of countries in Oceania are generally small, all of which lead to relatively limited resources such as funding, scholars, and research equipment for FCS research. Note that different countries have significantly heterogeneous contributions to FCS research on each continent. For example, Germany in Europe, the United States in the Americas, China in Asia, Ethiopia and South Africa in Africa, and Australia in Oceania were the main forces in FCS research on each continent, which will be discussed in more detail later.
4.2. Research Status Analysis at Different Levels of the FCS Field
The paper samples in this study were taken from 101 countries worldwide, among which the top 10 most productive countries account for more papers than all other countries combined (57.02% vs. 42.98%, Table 2), which may be related to factors such as the forest cover, the support level of government for environmental protection, and the number and activity of universities and scientific research institutions. These countries were prominently clustered in Europe and the Americas, including the USA, Canada, Germany, the UK, Italy, and Spain, with the remaining four being China, India, Brazil, and Australia.
The United States was a global leader in FCS research and had a significant influence, which was reflected in various aspects. First, the number of FCS papers and total citations in the United States were much higher than those in other countries (Table 2), and its activeness and academic influence were both higher than the global average level for more than ten years (Figure 4), indicating that it had both high activeness and high influence in the FCS field. Meanwhile, scholars from the US also actively collaborated with scholars from other countries. Statistics showed that they cooperated with scholars from 54 out of the 60 countries that had more than five FCS papers (Figure 5a), especially China, Brazil, the UK, Canada, Germany, and Australia. For the scientific institutions and scholars in the USA, statistics showed that the United States Forest Service was the most active institution in the FCS field in the USA. The number of FCS papers that they were involved in comprised 24.77% of the total papers in the USA, ranking second around the world. Furthermore, the influence and quality of the publications of this institution were also widely recognized; its total citations and average citations ranked first and second in the world, respectively. Oregon State University, also in the USA, ranked fourth in the number of publications and had the highest average citation number, which indicates that the impact of its papers was high. In terms of FCS researchers, Grant M. Domke, Christopher W. Woodall, and James E. Smith from the United States Forest Service in the USA were active members in the FCS field (Figure 6), and their number of publications ranked first, second, and sixth in the world, respectively. They have long been committed to estimating FCS in the United States and have published multiple papers (e.g., Domke et al. [49]; Domke et al. [50]; Smith et al. [51]; Woodall et al. [52]; Woodall et al. [53]). Jerome Chave, Sandra Brown, Richard A. Houghton, Yude Pan, Mark E. Harmon, Rattan Lal, and Renee K. Dixon were the authoritative FCS scholars in the United States (Figure 7), and the citation frequency of their FCS papers ranked first, second, third, fourth, sixth, seventh, and ninth in the world. Among these FCS papers, Pan et al. [15], Dixon et al. [10], and Chave et al. [65] were the top three most cited in the world. To the best of our knowledge, the United States’ leadership in FCS can be attributed to several factors. First, the United States has abundant forest resources. Statistics showed that the forest area of the United States was 304 million hectares in 2010, accounting for 31.6% of its land area and ranking fourth around the world [70], which gives it a natural opportunity in FCS research. Additionally, there are many research institutions and researchers in the US, which greatly promote the research of FCS.
The strong performance of the selected European countries and other developed countries in the FCS field was driven by factors similar to those in the USA, namely relatively abundant forest resources, proactive environmental policies, and numerous research institutions and researchers. Moreover, these countries had extensive collaboration networks globally (Figure 5a), particularly within Europe and with other developed countries (e.g., the USA and Canada), as well as increasingly frequent collaborations with some developing countries such as China and Brazil in recent years. The above factors have led to its high activity and influence in the FCS field for many years. Among these countries, Germany, the UK, and Australia have 98, 82, and 64 FCS papers, respectively, with high quality and impact, as evidenced by the total citations of 5081, 3959, and 5040, respectively, ranking them among the top three in the world in terms of average citations. In the research institutions of these countries, only Natural Resources Canada of Canada entered the list of the top ten most productive institutions.
Since the 21st century, China and India have shown rapid development trends in the FCS field, and their number of published papers ranked second and fifth globally, respectively. In contrast, China’s achievements in various aspects were relatively significant. Specifically, the number of FCS papers in China was only lower than that of the USA, ranked second globally, and it showed activeness higher than the global average for 14 years during the study period (Figure 4), which reflects its high activeness in the FCS field. These may be related to the implementation of an ecological protection strategy and improvements in the scientific research activity in China in recent years [69,71]. Meanwhile, Chinese scholars actively collaborated with scholars from 42 countries that have more than five FCS papers, especially those from the United States, Canada, and Germany. In contrast, while India had high paper output, its influence in the international collaboration network was relatively small (Figure 5b), which may be due to the fact that most of its FCS research was focused within the country and thus lacked a global perspective (e.g., Baishya and Barik [72]; Manhas et al. [73]). China’s rapid development in the FCS field was inseparable from the efforts of domestic scientific research institutions and researchers. Specifically, among the top ten most productive institutions and researchers, six institutions and six scholars in China were listed. For the former, the Chinese Academy of Sciences has become the most active FCS research institution globally with 89 papers. Other active institutions on the list were the University of Chinese Academy of Sciences, Peking University, Chinese Academy of Forestry, Beijing Forestry University, and Northeast Forestry University. Among the researchers, Guomo Zhou from Zhejiang A&F University was the most active FCS scholar in China and the third globally. Other active researchers included Jingyun Fang, Yongjun Shi, Yufeng Zhou, Huaqiang Du, and Xiaojun Xu. For influence, the total citations of FCS papers published by Jingyun Fang were ranked fifth globally. Interestingly, Jingyun Fang was the only researcher who appeared in the top ten lists of both the most productive (ranked fourth) and the most cited authors (ranked sixth) globally, demonstrating his active and authoritative role in FCS research. To the best of our knowledge, Jingyun Fang is a leading figure in FCS research in China. He has been dedicated to the estimation of FCS and its spatiotemporal changes and has published numerous authoritative papers (e.g., Fang et al. [59]; Fang et al. [14]; Fang et al. [60]; Fang et al. [8]), which have made significant contributions to the global FCS field. China’s FCS research has shown a high activeness at the national, institutional, and researcher levels. However, the AC at all levels has declined at different levels; additionally, Figure 4 reveals that China had 14 years of high activeness but only 7 years of high academic impact, indicating that the influence of FCS papers is relatively low.
The number of FCS papers and total citations in African countries were generally low. Statistics showed that only Ethiopia (20 papers), South Africa (12 papers), and Cameroon (11 papers) had more than 10 FCS papers. Compared with other African countries, these three countries have relatively abundant forest resources and relatively developed economies, which promotes FCS research. However, the number of FCS papers in these three countries ranked 24th, 37th, and 39th globally, respectively, indicating that there was still a huge gap compared to the most active countries worldwide of FCS research (e.g., USA, China). FCS research in other African countries was even more limited, and among the 10 countries with the lowest productivity, African countries account for 4 (Table 2). As mentioned earlier, the socioeconomic conditions of most countries in Africa are relatively limited, which may limit FCS research.
As a developed country, Australia ranked eighth globally and first in Oceania in the number of FCS papers. However, except for Australia, other Oceanian countries had relatively little research in the FCS field, and among the 10 countries with the lowest productivity, Oceanian countries account for 3 (Table 2), namely Micronesia, Papua New Guinea, and the Solomon Islands.
4.3. Research Topics and Its Trends Analysis of FCS Field
The statistical data on the frequency of keywords in FCS papers from 1993 to 2022 (Table 4 and Figure 9d) showed that “biomass” topped the list with 397 times, and the most frequently appearing keyword related to this topic was “allometric equations”. This result occurred because forest biomass and FCS are closely related in both physical relationships and measurement methods. Specifically, FCS was an important component of biomass; in the calculation process, biomass can be conveniently calculated through the allometric equations and is then converted into carbon storage through biomass carbon conversion factors. This method is currently one of the most widely used FCS estimation methods [16,68]. The high-frequency keywords were “sequestration” (262 times), “dynamics” (258 times), “climate-change” (249 times), and “storage” (226 times). These keywords have received widespread attention, especially after 2016, which may be due to the increasing global climate change and ecological environment issues in recent years, as people pay more attention to the changes in FCS and its relationship with other environmental issues [74].
The keywords at different periods were further analyzed to reveal the temporal trajectory of FCS research. This study found that in the initial period (1993–2001, Table 4 and Figure 9a), FCS research was relatively scarce, with “CO2” (six times) and “biomass” (five times) being the most common keywords, which is consistent with the previous study by Huang et al. [9]. During this period, climate change attracted increasing attention, and researchers paid more attention to the relationship between the forest carbon cycle and climate change caused by greenhouse gases [6,8]. In the slow growth period (2002–2009, Table 4 and Figure 9b), more keywords appeared, mainly including “biomass” (34 times), “sequestration” (26 times), “dynamics” (20 times), “storage” (19 times), and “Nitrogen” (17 times), while CO2 disappeared from the top 20 keywords. This result suggested that researchers were no longer limited to studying greenhouse effects but had begun exploring the dynamic changes in FCS and their driving mechanisms [75]. Furthermore, some new words appeared in the keywords, such as “net primary production” and “forest management”, which indicated that scholars began to focus on the impact of forest management on carbon storage [76].
In the rapid growth period (2010–2022, Table 4 and Figure 9c), given the era background of intensified global climate change and increasingly severe carbon emission problems, FCS-related research and keywords experienced rapid growth. During this period, 10 keywords appeared more than 100 times, among which “biomass” (358 times), “dynamics” (238 times), “sequestration” (234 times), and “storage” (206 times) were still the top four most popular topics, followed by “aboveground biomass” (162 times), “climate-change” (149 times), “management” (122 times), “carbon storage” (119 times), “productivity” (106 times), and “carbon sequestration” (104 times). More research emerged on the interaction effects of FCS with climate change and land use during this stage [77,78], as evidenced by the significant increase in the frequency of “climate-change” (149 times vs. 11 times) and “land-use” (81 times vs. 11 times) compared to the previous period. The above results reflected that the focus of research in this period shifted to the management and utilization of FCS, that is, how to increase forest carbon storage through forest management and protection to meet the challenges of global climate change.
To determine the evolving trends and mutation years of keywords in more detail, the Mann–Kendall mutation test was used to draw the mutation map of the 20 most frequently occurring keywords in FCS papers from 1993 to 2022 (Figure 10). The UF(t) curve shows that the frequency of all keywords has fluctuated and increased trends with varying degrees over the past 30 years, and all of these keywords exceeded the critical confidence coefficient (i.e., 1.96) after 2009, indicating that the keyword frequency showed a significant increasing trend, which was directly driven by the publication of numerous FCS-related papers from 2010 to 2022. Among them, “biomass” first appeared in 1995 and showed a slight decreasing trend from 1997 to 2005; after 2005, the UF(t) value turned positive and remained as such until 2022, indicating that the frequency of “biomass” has been increasing since 2005. In 2010, the UF(t) value exceeded the critical confidence coefficient; the increasing trend shifted from slow to significant. Other keywords that appeared before 2000, such as “sequestration”, “storage”, “ecosystems”, “management”, “carbon storage”, and “vegetation”, appeared in 1999, 1997, 1999, 1997, 1993, and 1997, respectively, and their UF(t) values exceeded the critical confidence coefficient in 2009, 2012, 2013, 2012, 2013, and 2013, respectively, indicating significant growth trends. Among these keywords, “storage”, “management”, and “vegetation” were detected where the UF(t) and UB(t) curves intersected between the critical confidence coefficients in 2012, 2012, and 2013, respectively, which represent potential mutation years. Keywords that appeared after 2000, including “dynamics”, “climate-change”, “carbon stock”, “aboveground biomass”, “carbon sequestration”, “productivity”, “nitrogen”, “soil carbon”, “organic-carbon”, “growth”, “climate”, “biodiversity”, and “deforestation”, showed significant increasing trends after 2013, 2010, 2015, 2015, 2014, 2012, 2020, 2015, 2019, 2012, 2017, 2015, and 2016, respectively. In conclusion, most of the keywords in FCS research have experienced rapid growth in the past decade, especially “nitrogen”, “climate”, “deforestation”, “Biodiversity”, “organic-carbon”, “soil carbon”, and “aboveground biomass”, which all broke out after 2015. This result indicates that the FCS field involves a wide range of directions, including biomass, ecosystems, climate change, human activities, etc. It also reflects the continuous breakthroughs and innovations in the breadth and depth of research on FCS.
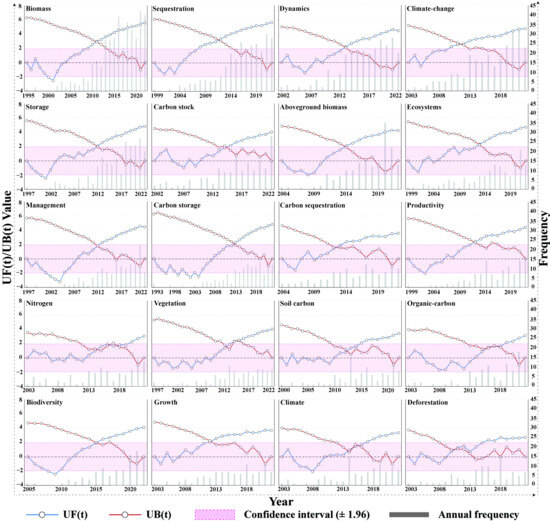
Figure 10.
The development trends of the frequency of keywords in global FCS papers from 1993 to 2022.
By further counting the new keywords that have emerged in recent years (Table 5), we found that new keywords are constantly emerging in FCS research, and the research direction is expanding from the high-precision monitoring of FCS itself to its driving mechanism and sustainable development. Summarizing the keywords that have emerged in recent years, it can be seen that the current research in the FCS field has the following trends: (1) The estimation and monitoring technology of FCS are constantly improving. The emergence of new keywords such as “global patterns”, “random forest”, “google earth engine”, and “spatial heterogeneity” indicates that with the rapid development of multi-source remote sensing technology and computer machine learning, researchers can more accurately estimate the global forest carbon storage from high-resolution pixel scales and analyze its spatial patterns, and the resulting long-term high-precision FCS estimation data greatly promote the monitoring of past and present FCS and can even simulate future FCS through predictive models (related keywords: “plus model”, “predictive modeling”, “potential evaluation”). (2) Analyze the driving factors of FCS distribution and changes from a more diverse perspective. The emergence of new keywords such as “environmental covariates”, “forest types”, “important driver”, “amazonian deforestation”, “anthropogenic pressure”, and “climatic factor” shows that researchers are explaining the mechanisms of FCS distribution and changes from multiple perspectives, which is a key step in addressing global climate change and promoting sustainable development. (3) Promote the sustainable development of FCS. Some new keywords have emerged in 2022, such as “active forest management” and “active restoration”, indicating that FCS research is no longer limited to FCS itself, and researchers are trying to study feasible forest management measures to achieve the sustainable development of forests and FCS.
4.4. Limitations and Future Work
The current study utilized bibliometric methods to analyze the characteristics and trends of global FCS research and obtained numerous meaningful results. However, this study still has some limitations. (1) For the paper sample, considering that WOS is considered the most authoritative science database [37], we obtained all analysis samples in the research from the WOS core database. However, this choice may result in ignoring some publications in other databases, such as Google Scholar and Scopus, which may lead to the incompleteness of the sample. Furthermore, when defining the search criteria, we referred to the previous study of Huang et al. [9] and used the title field instead of the topic field for retrieval. The latter was excluded because it would retrieve multitudinous irrelevant results, while the former, although it improved the consistency of the search results with the theme of “forest carbon storage” that we focused on, might also ignore some of the relevant literature. Additionally, although the search string “(forest* AND “carbon storage”) or (forest* AND “carbon stock*”)” can summarize the various expressions of “forest carbon storage”, it might also ignore FCS research involved in research on other topics (e.g., carbon sink). Similarly, considering that English is the most commonly used academic language, we selected only the English literature. However, scholars from different countries also publish their research results in domestic academic resource databases, such as the China National Knowledge Infrastructure database in China, the German National Library in Germany, and the Indian Citation Index in India. Limiting the academic language of publications may result in a less comprehensive paper sample. (2) The methodology applied in this study also has limitations. Specifically, we analyzed the research status in the FCS field from multiple levels, with a particular focus on the most productive countries, institutions, and authors, as well as the most cited authors and papers, which helps to identify the main contributors (e.g., countries, institutions, and scholars) and relevant collaborative networks in the FCS field, thereby providing support for understanding the current research status and making relevant decisions. However, although research has found knowledge gaps across different areas, there is still a lack of sufficient attention paid to fields where FCS research is scarce, making it difficult to identify clear knowledge gaps, which is related to the limitations of the predetermined research objectives and relevant research methods. Additionally, we analyzed the research hotspots and their trends in the FCS field based on keywords from published papers. However, keywords can only briefly reflect the research and FCS knowledge landscape behind them, making the above analysis too superficial. Future reviews need to further pay attention to the content of FCS papers, including research background, methods, and main findings, to deeply understand the status of FCS research and then discover the research trends. (3) For the VOSviewer software, although it has been used in many bibliometric studies, it still has its own limitations, which results in that the first author and co-author cannot be clearly distinguished when reviewing the influence of institutions and authors nor can their institutions be clearly distinguished, which may lead to limitations in explaining the activity and influence of authors and research institutions. For example, the United States Forest Service, as an important data-contributing organization, has become a co-author of many FCS papers, but whether it is the most influential scientific institution in the FCS field remains to be further verified. Hence, in future studies, it is recommended to distinguish the institutions and names of the first author and co-author, which may lead to more realistic results. Despite the above limitations, the sample of papers in this study is representative and objective, the research methods are scientific, and the research results are reliable and generally not influenced by empiricism. Finally, it is worth noting that the discussion of the research results in this study was mainly based on qualitative reasoning based on the macro situation of various countries, which was difficult to quantify; in the future, some statistical models could be applied to dig deeper into the potential driving forces of FCS research dynamics.
5. Conclusions
The current study analyzed the characteristics and trends of global FCS research based on knowledge graphs. We found that FCS paper output exhibited an increasingly significant growth trend from 1993 to 2022, especially after 2010, which is related to the increasing global awareness of climate change and the advancement of monitoring technology. Spatially, affected by factors such as forest quantity, environmental policies, and scientific research resources in different regions, FCS research was unevenly distributed at both the continental and national scales. For the former, Europe, the Americas, and Asia were in the leading position, while Africa and Oceania were relatively lagging. At the national level, the United States was the most active and influential country in FCS research, driven by its scientific research institutions (e.g., the United States Forest Service) and researchers (e.g., Grant M. Domke and Jerome Chave), as well as active international cooperation; similarly, most developed countries from Europe and the Americas have also shown considerable FCS research capabilities, such as Germany and Canada. Note that China’s rapid growth in FCS research output and international cooperation in recent years has made it a key player in global FCS research, which highlights China’s focus on climate change, environmental protection, and carbon neutrality goals. In the past 30 years, scholars’ research topics in the FCS field have continued to expand with technological innovation and contemporary background changes, mainly focusing on the estimation methods, dynamics, driving factors, and management of FCS, and the trend of FCS research is expanding from the high-precision monitoring of FCS itself to its driving mechanism and sustainable development. Despite the robust findings, this study acknowledges limitations in its paper sample, methodology, and VOSviewer software. Subsequent research should address these limitations by incorporating more comprehensive paper datasets, deeper literature content analysis, and more advanced statistical models. Despite these limitations, this study objectively and deeply revealed the characteristics and trends of global FCS research, which will assist researchers to better understand the state of global FCS research and facilitate future decision-making and practice.
Author Contributions
Conceptualization, Jie Li and Jinliang Wang; methodology, Jie Li, Jinliang Wang and Chenli Liu; validation, Suling He and Lanfang Liu; software, Jie Li, Chenli Liu and Suling He; writing—original draft preparation, Jie Li; writing—review and editing, Jinliang Wang and Lanfang Liu. All authors have read and agreed to the published version of the manuscript.
Funding
This research was funded by the Science and Technology Major Project of Yunnan Province (Science and Technology Special Project of Southwest United Graduate School-Major Projects of Basic Research and Applied Basic Research): Vegetation change monitoring and ecological restoration models in Jinsha River Basin mining area in Yunnan based on multi-modal remote sensing, grant number 202302AO370003; the National Natural Science Foundation of China for “Natural Forests Biomass Estimation at Tree Level in Northwest Yunnan by Combining ULS and TLS Cloud Points Data”, grant number 41961060; and the Graduate Research and Innovation Fund Project of Yunnan Normal University, grant number YJSJJ23-A21.
Data Availability Statement
The data presented in this study are available on request from the corresponding author.
Acknowledgments
The authors would like to express their respect and gratitude to the anonymous reviewers and editors for their professional comments and suggestions.
Conflicts of Interest
The authors declare no conflicts of interest.
References
- Hisano, M.; Searle, E.B.; Chen, H.Y.H. Biodiversity as a Solution to Mitigate Climate Change Impacts on the Functioning of Forest Ecosystems. Biol. Rev. 2018, 93, 439–456. [Google Scholar] [CrossRef]
- Ouhamdouch, S.; Bahir, M.; Ouazar, D.; Carreira, P.M.; Zouari, K. Evaluation of Climate Change Impact on Groundwater from Semi-Arid Environment (Essaouira Basin, Morocco) Using Integrated Approaches. Environ. Earth Sci. 2019, 78, 449. [Google Scholar] [CrossRef]
- Tian, L.; Tao, Y.; Fu, W.; Li, T.; Ren, F.; Li, M. Dynamic Simulation of Land Use/Cover Change and Assessment of Forest Ecosystem Carbon Storage under Climate Change Scenarios in Guangdong Province, China. Remote Sens. 2022, 14, 2330. [Google Scholar] [CrossRef]
- Wheeler, T.; Von Braun, J. Climate Change Impacts on Global Food Security. Science 2013, 341, 508–513. [Google Scholar] [CrossRef]
- Lal, R. Soil Carbon Sequestration Impacts on Global Climate Change and Food Security. Science 2004, 304, 1623–1627. [Google Scholar] [CrossRef]
- Solomon, S.; Plattner, G.K.; Knutti, R.; Friedlingstein, P. Irreversible Climate Change Due to Carbon Dioxide Emissions. Proc. Natl. Acad. Sci. USA 2009, 106, 1704–1709. [Google Scholar] [CrossRef]
- Udara Willhelm Abeydeera, L.H.; Wadu Mesthrige, J.; Samarasinghalage, T.I. Global Research on Carbon Emissions: A Scientometric Review. Sustainability 2019, 11, 3972. [Google Scholar] [CrossRef]
- Fang, J.Y.; Zhu, J.L.; Wang, S.P.; Yue, C.; Shen, H.H. Global Warming, Human-Induced Carbon Emissions, and Their Uncertainties. Sci. China Earth Sci. 2011, 54, 1458–1468. [Google Scholar] [CrossRef]
- Huang, L.; Zhou, M.; Lv, J.; Chen, K. Trends in Global Research in Forest Carbon Sequestration: A Bibliometric Analysis. J. Clean. Prod. 2020, 252, 119908. [Google Scholar] [CrossRef]
- Dixon, R.K.; Brown, S.; Houghton, R.A.; Solomon, A.M.; Trexler, M.C.; Wisniewski, J. Carbon Pools and Flux of Global Forest Ecosystems. Science 1994, 263, 185–190. [Google Scholar] [CrossRef]
- Piao, S. Forest Biomass Carbon Stocks in China over the Past 2 Decades: Estimation Based on Integrated Inventory and Satellite Data. J. Geophys. Res. 2005, 110. [Google Scholar] [CrossRef]
- Pugh, T.A.M.; Lindeskog, M.; Smith, B.; Poulter, B.; Arneth, A.; Haverd, V.; Calle, L. Role of Forest Regrowth in Global Carbon Sink Dynamics. Proc. Natl. Acad. Sci. USA 2019, 116, 4382–4387. [Google Scholar] [CrossRef]
- FAO. Global Forest Resources Assessment 2015-How Are the World’s Forests Changing; FAO: Rome, Italy, 2016. [Google Scholar]
- Fang, J.; Chen, A.; Peng, C.; Zhao, S.; Ci, L. Changes in Forest Biomass Carbon Storage in China between 1949 and 1998. Science 2001, 292, 2320–2322. [Google Scholar] [CrossRef]
- Pan, Y.; Birdsey, R.A.; Fang, J.; Houghton, R.; Kauppi, P.E.; Kurz, W.A.; Phillips, O.L.; Shvidenko, A.; Lewis, S.L.; Canadell, J.G.; et al. A Large and Persistent Carbon Sink in the World’s Forests. Science 2011, 333, 988–993. [Google Scholar] [CrossRef]
- Sun, W.; Liu, X. Review on Carbon Storage Estimation of Forest Ecosystem and Applications in China. For. Ecosyst. 2020, 7, 4. [Google Scholar] [CrossRef]
- Xiao, J.; Chevallier, F.; Gomez, C.; Guanter, L.; Hicke, J.A.; Huete, A.R.; Ichii, K.; Ni, W.; Pang, Y.; Rahman, A.F.; et al. Remote Sensing of the Terrestrial Carbon Cycle: A Review of Advances over 50 Years. Remote Sens. Environ. 2019, 233, 111383. [Google Scholar] [CrossRef]
- Armentano, T.V. Effects of Increased Wood Energy Consumption on Carbon Storage in Forests of the United States. Environ. Manag. 1984, 8, 529–538. [Google Scholar] [CrossRef]
- Cooper, C.F. Carbon Storage in Managed Forests. Can. J. For. Res. 1983, 13, 155–166. [Google Scholar] [CrossRef]
- Schiffman, P.M.; Johnson, W.C. Phytomass and Detrital Carbon Storage during Forest Regrowth in the Southeastern United States Piedmont. Can. J. For. Res. 1989, 19, 69–78. [Google Scholar] [CrossRef]
- Salunkhe, O.; Khare, P.K.; Kumari, R.; Khan, M.L. A Systematic Review on the Aboveground Biomass and Carbon Stocks of Indian Forest Ecosystems. Ecol. Process. 2018, 7, 17. [Google Scholar] [CrossRef]
- Ali, A.; Yan, E.R. Relationships between Biodiversity and Carbon Stocks in Forest Ecosystems: A Systematic Literature Review. Trop. Ecol. 2017, 58, 1–14. [Google Scholar]
- Guo, Z.D.; Hu, H.F.; Pan, Y.D.; Birdsey, R.A.; Fang, J.Y. Increasing Biomass Carbon Stocks in Trees Outside Forests in China over the Last Three Decades. Biogeosciences 2014, 11, 4115–4122. [Google Scholar] [CrossRef]
- Qureshi, A.; Pariva; Badola, R.; Hussain, S.A. A Review of Protocols Used for Assessment of Carbon Stock in Forested Landscapes. Environ. Sci. Policy 2012, 16, 81–89. [Google Scholar] [CrossRef]
- Kho, L.K.; Jepsen, M.R. Carbon Stock of Oil Palm Plantations and Tropical Forests in Malaysia: A Review. Singap. J. Trop. Geogr. 2015, 36, 249–266. [Google Scholar] [CrossRef]
- Birdsey, R.; Pan, Y. Trends in Management of the World’s Forests and Impacts on Carbon Stocks. For. Ecol. Manag. 2015, 355, 83–90. [Google Scholar] [CrossRef]
- Kalies, E.L.; Haubensak, K.A.; Finkral, A.J. A Meta-Analysis of Management Effects on Forest Carbon Storage. J. Sustain. For. 2016, 35, 311–323. [Google Scholar] [CrossRef]
- Bartolini, M.; Bottani, E.; Grosse, E.H. Green Warehousing: Systematic Literature Review and Bibliometric Analysis. J. Clean. Prod. 2019, 226, 242–258. [Google Scholar] [CrossRef]
- Li, J.; Goerlandt, F.; Reniers, G. An Overview of Scientometric Mapping for the Safety Science Community: Methods, Tools, and Framework. Saf. Sci. 2021, 134, 105093. [Google Scholar] [CrossRef]
- Liu, C.; Li, W.; Xu, J.; Zhou, H.; Li, C.; Wang, W. Global Trends and Characteristics of Ecological Security Research in the Early 21st Century: A Literature Review and Bibliometric Analysis. Ecol. Indic. 2022, 137, 108734. [Google Scholar] [CrossRef]
- Kandel, P.; Chettri, N.; Chaudhary, S.; Sharma, P.; Uddin, K. Ecosystem Services Research Trends in the Water Tower of Asia: A Bibliometric Analysis from the Hindu Kush Himalaya. Ecol. Indic. 2021, 121, 107152. [Google Scholar] [CrossRef]
- Wu, X.; Chen, X.; Zhan, F.B.; Hong, S. Global Research Trends in Landslides during 1991–2014: A Bibliometric Analysis. Landslides 2015, 12, 1215–1226. [Google Scholar] [CrossRef]
- Hamed, K.; Rao, A. A Modified Mann-Kendall Trend Test for Autocorrelated Data. J. Hydrol. 1998, 204, 182–196. [Google Scholar] [CrossRef]
- Schubert, A.; Braun, T. Relative Indicators and Relational Charts for Comparative Assessment of Publication Output and Citation Impact. Scientometrics 1986, 9, 281–291. [Google Scholar] [CrossRef]
- Olawumi, T.O.; Chan, D.W.M.; Wong, J.K.W. Evolution in the Intellectual Structure of BIM Research: A Bibliometric Analysis. J. Civ. Eng. Manag. 2017, 23, 1060–1081. [Google Scholar] [CrossRef]
- Olawumi, T.O.; Chan, D.W.M. A Scientometric Review of Global Research on Sustainability and Sustainable Development. J. Clean. Prod. 2018, 183, 231–250. [Google Scholar] [CrossRef]
- Tao, J.; Qiu, D.; Yang, F.; Duan, Z. A Bibliometric Analysis of Human Reliability Research. J. Clean. Prod. 2020, 260, 121041. [Google Scholar] [CrossRef]
- Cobo, M.J.; López-Herrera, A.G.; Herrera-Viedma, E.; Herrera, F. SciMAT: A New Science Mapping Analysis Software Tool. J. Am. Soc. Inf. Sci. Technol. 2012, 63, 1609–1630. [Google Scholar] [CrossRef]
- van Eck, N.J.; Waltman, L. Software Survey: VOSviewer, a Computer Program for Bibliometric Mapping. Scientometrics 2010, 84, 523–538. [Google Scholar] [CrossRef]
- Li, J.; He, S.; Wang, J.; Ma, W.; Ye, H. Investigating the Spatiotemporal Changes and Driving Factors of Nighttime Light Patterns in RCEP Countries Based on Remote Sensed Satellite Images. J. Clean. Prod. 2022, 359, 131944. [Google Scholar] [CrossRef]
- Chen, K.; Guan, J. A Bibliometric Investigation of Research Performance in Emerging Nanobiopharmaceuticals. J. Informetr. 2011, 5, 233–247. [Google Scholar] [CrossRef]
- Winjum, J.K.; Dixon, R.K.; Schroeder, P.E. Forest Management and Carbon Storage: An Analysis of 12 Key Forest Nations. Water Air Soil Pollut. 1993, 70, 239–257. [Google Scholar] [CrossRef]
- Ji, Q.; Pang, X.; Zhao, X. A Bibliometric Analysis of Research on Antarctica during 1993–2012. Scientometrics 2014, 101, 1925–1939. [Google Scholar] [CrossRef]
- McKinley, D.C.; Ryan, M.G.; Birdsey, R.A.; Giardina, C.P.; Harmon, M.E.; Heath, L.S.; Houghton, R.A.; Jackson, R.B.; Morrison, J.F.; Murray, B.C.; et al. A Synthesis of Current Knowledge on Forests and Carbon Storage in the United States. Ecol. Appl. 2011, 21, 1902–1924. [Google Scholar] [CrossRef]
- Asner, G.P.; Powell, G.V.N.; Mascaro, J.; Knapp, D.E.; Clark, J.K.; Jacobson, J.; Kennedy-Bowdoin, T.; Balaji, A.; Paez-Acosta, G.; Victoria, E.; et al. High-Resolution Forest Carbon Stocks and Emissions in the Amazon. Proc. Natl. Acad. Sci. USA 2010, 107, 16738–16742. [Google Scholar] [CrossRef]
- Vesterdal, L.; Clarke, N.; Sigurdsson, B.D.; Gundersen, P. Do Tree Species Influence Soil Carbon Stocks in Temperate and Boreal Forests? For. Ecol. Manag. 2013, 309, 4–18. [Google Scholar] [CrossRef]
- Mayer, M.; Prescott, C.E.; Abaker, W.E.A.; Augusto, L.; Cécillon, L.; Ferreira, G.W.D.; James, J.; Jandl, R.; Katzensteiner, K.; Laclau, J.P.; et al. Influence of Forest Management Activities on Soil Organic Carbon Stocks: A Knowledge Synthesis. For. Ecol. Manag. 2020, 466, 118127. [Google Scholar] [CrossRef]
- Van Breugel, M.; Ransijn, J.; Craven, D.; Bongers, F.; Hall, J.S. Estimating Carbon Stock in Secondary Forests: Decisions and Uncertainties Associated with Allometric Biomass Models. For. Ecol. Manag. 2011, 262, 1648–1657. [Google Scholar] [CrossRef]
- Domke, G.M.; Woodall, C.W.; Smith, J.E.; Westfall, J.A.; McRoberts, R.E. Consequences of Alternative Tree-Level Biomass Estimation Procedures on U.S. Forest Carbon Stock Estimates. For. Ecol. Manag. 2012, 270, 108–116. [Google Scholar] [CrossRef]
- Domke, G.M.; Perry, C.H.; Walters, B.F.; Woodall, C.W.; Russell, M.B.; Smith, J.E. Estimating Litter Carbon Stocks on Forest Land in the United States. Sci. Total Environ. 2016, 557–558, 469–478. [Google Scholar] [CrossRef]
- Smith, J.E.; Domke, G.M.; Nichols, M.C.; Walters, B.F. Carbon Stocks and Stock Change on Federal Forest Lands of the United States. Ecosphere 2019, 10, e02637. [Google Scholar] [CrossRef]
- Woodall, C.W.; Perry, C.H.; Westfall, J.A. An Empirical Assessment of Forest Floor Carbon Stock Components across the United States. For. Ecol. Manag. 2012, 269, 1–9. [Google Scholar] [CrossRef]
- Woodall, C.W.; Domke, G.M.; Riley, K.L.; Oswalt, C.M.; Crocker, S.J.; Yohe, G.W. A Framework for Assessing Global Change Risks to Forest Carbon Stocks in the United States. PLoS ONE 2013, 8, e73222. [Google Scholar] [CrossRef] [PubMed]
- Du, H.; Zhou, G.; Ge, H.; Fan, W.; Xu, X.; Fan, W.; Shi, Y. Satellite-Based Carbon Stock Estimation for Bamboo Forest with a Non-Linear Partial Least Square Regression Technique. Int. J. Remote Sens. 2012, 33, 1917–1933. [Google Scholar] [CrossRef]
- Li, P.; Zhou, G.; Du, H.; Lu, D.; Mo, L.; Xu, X.; Shi, Y.; Zhou, Y. Current and Potential Carbon Stocks in Moso Bamboo Forests in China. J. Environ. Manag. 2015, 156, 89–96. [Google Scholar] [CrossRef] [PubMed]
- Mao, F.; Zhou, G.; Li, P.; Du, H.; Xu, X.; Shi, Y.; Mo, L.; Zhou, Y.; Tu, G. Optimizing Selective Cutting Strategies for Maximum Carbon Stocks and Yield of Moso Bamboo Forest Using BIOME-BGC Model. J. Environ. Manag. 2017, 191, 126–135. [Google Scholar] [CrossRef] [PubMed]
- Shi, Y.; Xu, L.; Zhou, Y.; Ji, B.; Zhou, G.; Fang, H.; Yin, J.; Deng, X. Quantifying Driving Factors of Vegetation Carbon Stocks of Moso Bamboo Forests Using Machine Learning Algorithm Combined with Structural Equation Model. For. Ecol. Manag. 2018, 429, 406–413. [Google Scholar] [CrossRef]
- Xu, X.; Du, H.; Zhou, G.; Ge, H.; Shi, Y.; Zhou, Y.; Fan, W.; Fan, W. Estimation of Aboveground Carbon Stock of Moso Bamboo (Phyllostachys heterocycla Var. Pubescens) Forest with a Landsat Thematic Mapper Image. Int. J. Remote Sens. 2011, 32, 1431–1448. [Google Scholar] [CrossRef]
- Fang, J.Y.; Wang, G.G.; Liu, G.H.; Xu, S.L. Forest Biomass of China: An Estimate Based on the Biomass-Volume Relationship. Ecol. Appl. 1998, 8, 1084–1091. [Google Scholar] [CrossRef]
- Fang, J.Y.; Di Guo, Z.; Piao, S.L.; Chen, A.P. Terrestrial Vegetation Carbon Sinks in China, 1981–2000. Sci. China Ser. D Earth Sci. 2007, 50, 1341–1350. [Google Scholar] [CrossRef]
- Guo, Z.; Fang, J.; Pan, Y.; Birdsey, R. Inventory-Based Estimates of Forest Biomass Carbon Stocks in China: A Comparison of Three Methods. For. Ecol. Manag. 2010, 259, 1225–1231. [Google Scholar] [CrossRef]
- Zhu, J.; Wang, C.; Zhou, Z.; Zhou, G.; Hu, X.; Jiang, L.; Li, Y.; Liu, G.; Ji, C.; Zhao, S.; et al. Increasing Soil Carbon Stocks in Eight Permanent Forest Plots in China. Biogeosciences 2020, 17, 715–726. [Google Scholar] [CrossRef]
- De Vos, B.; Cools, N.; Ilvesniemi, H.; Vesterdal, L.; Vanguelova, E.; Carnicelli, S. Benchmark Values for Forest Soil Carbon Stocks in Europe: Results from a Large Scale Forest Soil Survey. Geoderma 2015, 251–252, 33–46. [Google Scholar] [CrossRef]
- Nord-Larsen, T.; Vesterdal, L.; Bentsen, N.S.; Larsen, J.B. Ecosystem Carbon Stocks and Their Temporal Resilience in a Semi-Natural Beech-Dominated Forest. For. Ecol. Manag. 2019, 447, 67–76. [Google Scholar] [CrossRef]
- Chave, J.; Andalo, C.; Brown, S.; Cairns, M.A.; Chambers, J.Q.; Eamus, D.; Fölster, H.; Fromard, F.; Higuchi, N.; Kira, T.; et al. Tree Allometry and Improved Estimation of Carbon Stocks and Balance in Tropical Forests. Oecologia 2005, 145, 87–99. [Google Scholar] [CrossRef] [PubMed]
- Jobbágy, E.G.; Jackson, R.B. The Vertical Distribution of Soil Organic. Ecol. Appl. 2000, 10, 423–436. [Google Scholar] [CrossRef]
- Jandl, R.; Lindner, M.; Vesterdal, L.; Bauwens, B.; Baritz, R.; Hagedorn, F.; Johnson, D.W.; Minkkinen, K.; Byrne, K.A. How Strongly Can Forest Management Influence Soil Carbon Sequestration? Geoderma 2007, 137, 253–268. [Google Scholar] [CrossRef]
- Pan, Y.; Luo, T.; Birdsey, R.; Hom, J.; Melillo, J. New Estimates of Carbon Storage and Sequestration in China’S Forests: Effects of Age-Class and Method on Inventory-Based Carbon Estimation. Clim. Chang. 2004, 67, 211–236. [Google Scholar] [CrossRef]
- Lu, C.A.; Dong, Y.G.; Lian, J.Y. On the Concept of Ecological Civilization in China and Joel Kovel’s Ecosocialism. Capital. Nat. Soc. 2016, 27, 27–33. [Google Scholar] [CrossRef]
- FAO. State of the World’s Forests 2011; FAO: Rome, Italy, 2011. [Google Scholar]
- Wang, C.; Yu, C.; Chen, T.; Feng, Z.; Hu, Y.; Wu, K. Can the Establishment of Ecological Security Patterns Improve Ecological Protection? An Example of Nanchang, China. Sci. Total Environ. 2020, 740, 140051. [Google Scholar] [CrossRef]
- Baishya, R.; Barik, S.K. Estimation of Tree Biomass, Carbon Pool and Net Primary Production of an Old-Growth Pinus Kesiya Royle Ex. Gordon Forest in North-Eastern India. Ann. For. Sci. 2011, 68, 727–736. [Google Scholar] [CrossRef]
- Manhas, R.K.; Negi, J.D.S.; Kumar, R.; Chauhan, P.S. Temporal Assessment of Growing Stock, Biomass and Carbon Stock of Indian Forests. Clim. Chang. 2006, 74, 191–221. [Google Scholar] [CrossRef]
- Kuuluvainen, T.; Gauthier, S. Young and Old Forest in the Boreal: Critical Stages of Ecosystem Dynamics and Management under Global Change. For. Ecosyst. 2018, 5, 26. [Google Scholar] [CrossRef]
- Pregitzer, K.S.; Burton, A.J.; Zak, D.R.; Talhelm, A.F. Simulated Chronic Nitrogen Deposition Increases Carbon Storage in Northern Temperate Forests. Glob. Chang. Biol. 2008, 14, 142–153. [Google Scholar] [CrossRef]
- Eggers, J.; Lindner, M.; Zudin, S.; Zaehle, S.; Liski, J. Impact of Changing Wood Demand, Climate and Land Use on European Forest Resources and Carbon Stocks during the 21st Century. Glob. Chang. Biol. 2008, 14, 2288–2303. [Google Scholar] [CrossRef]
- Feddema, J.J.; Oleson, K.W.; Bonan, G.B.; Mearns, L.O.; Buja, L.E.; Meehl, G.A.; Washington, W.M. The Importance of Land-Cover Change in Simulating Future Climates. Science 2005, 310, 1674–1678. [Google Scholar] [CrossRef] [PubMed]
- Reddy, C.S.; Rakesh, F.; Jha, C.S.; Athira, K.; Singh, S.; Alekhya, V.V.L.P.; Rajashekar, G.; Diwakar, P.G.; Dadhwal, V.K. Geospatial Assessment of Long-Term Changes in Carbon Stocks and Fluxes in Forests of India (1930–2013). Glob. Planet. Chang. 2016, 143, 50–65. [Google Scholar] [CrossRef]
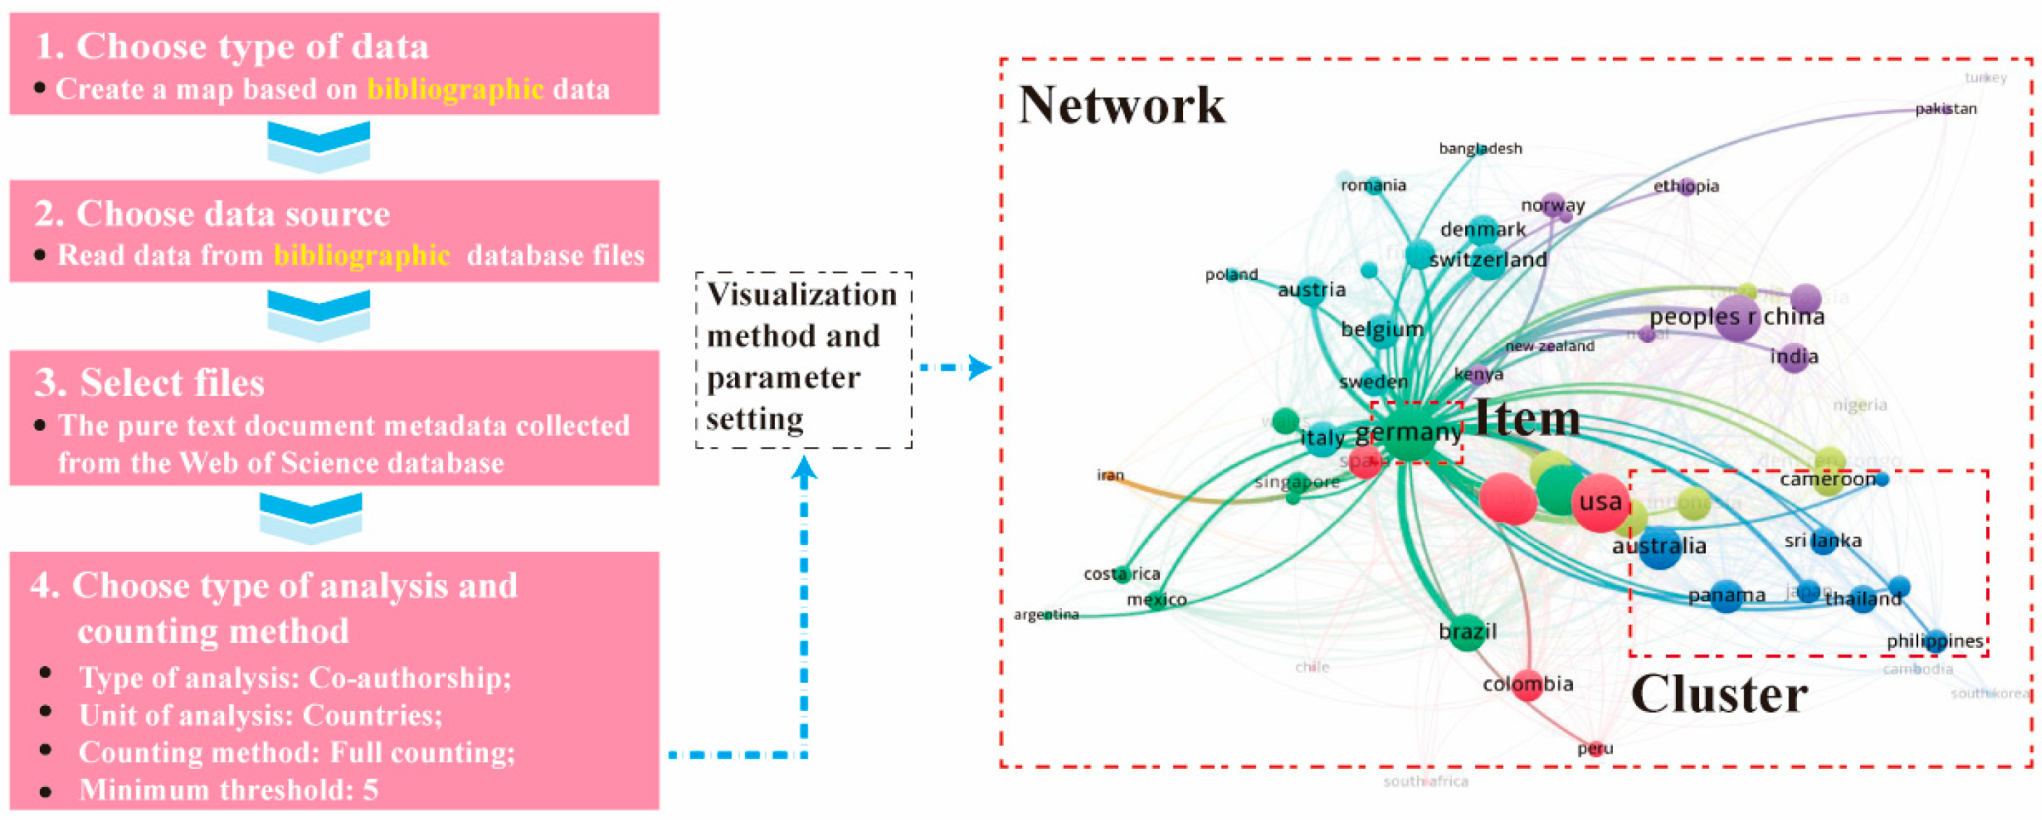


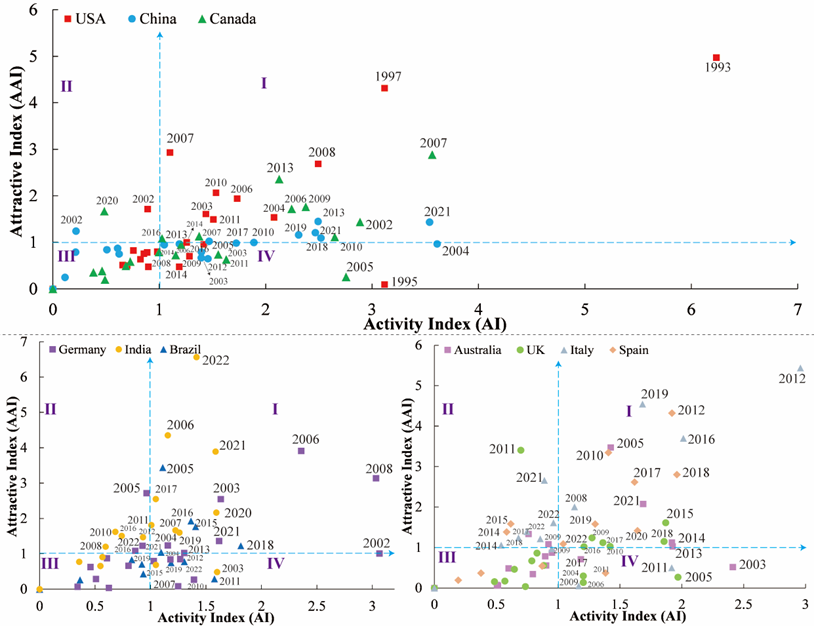
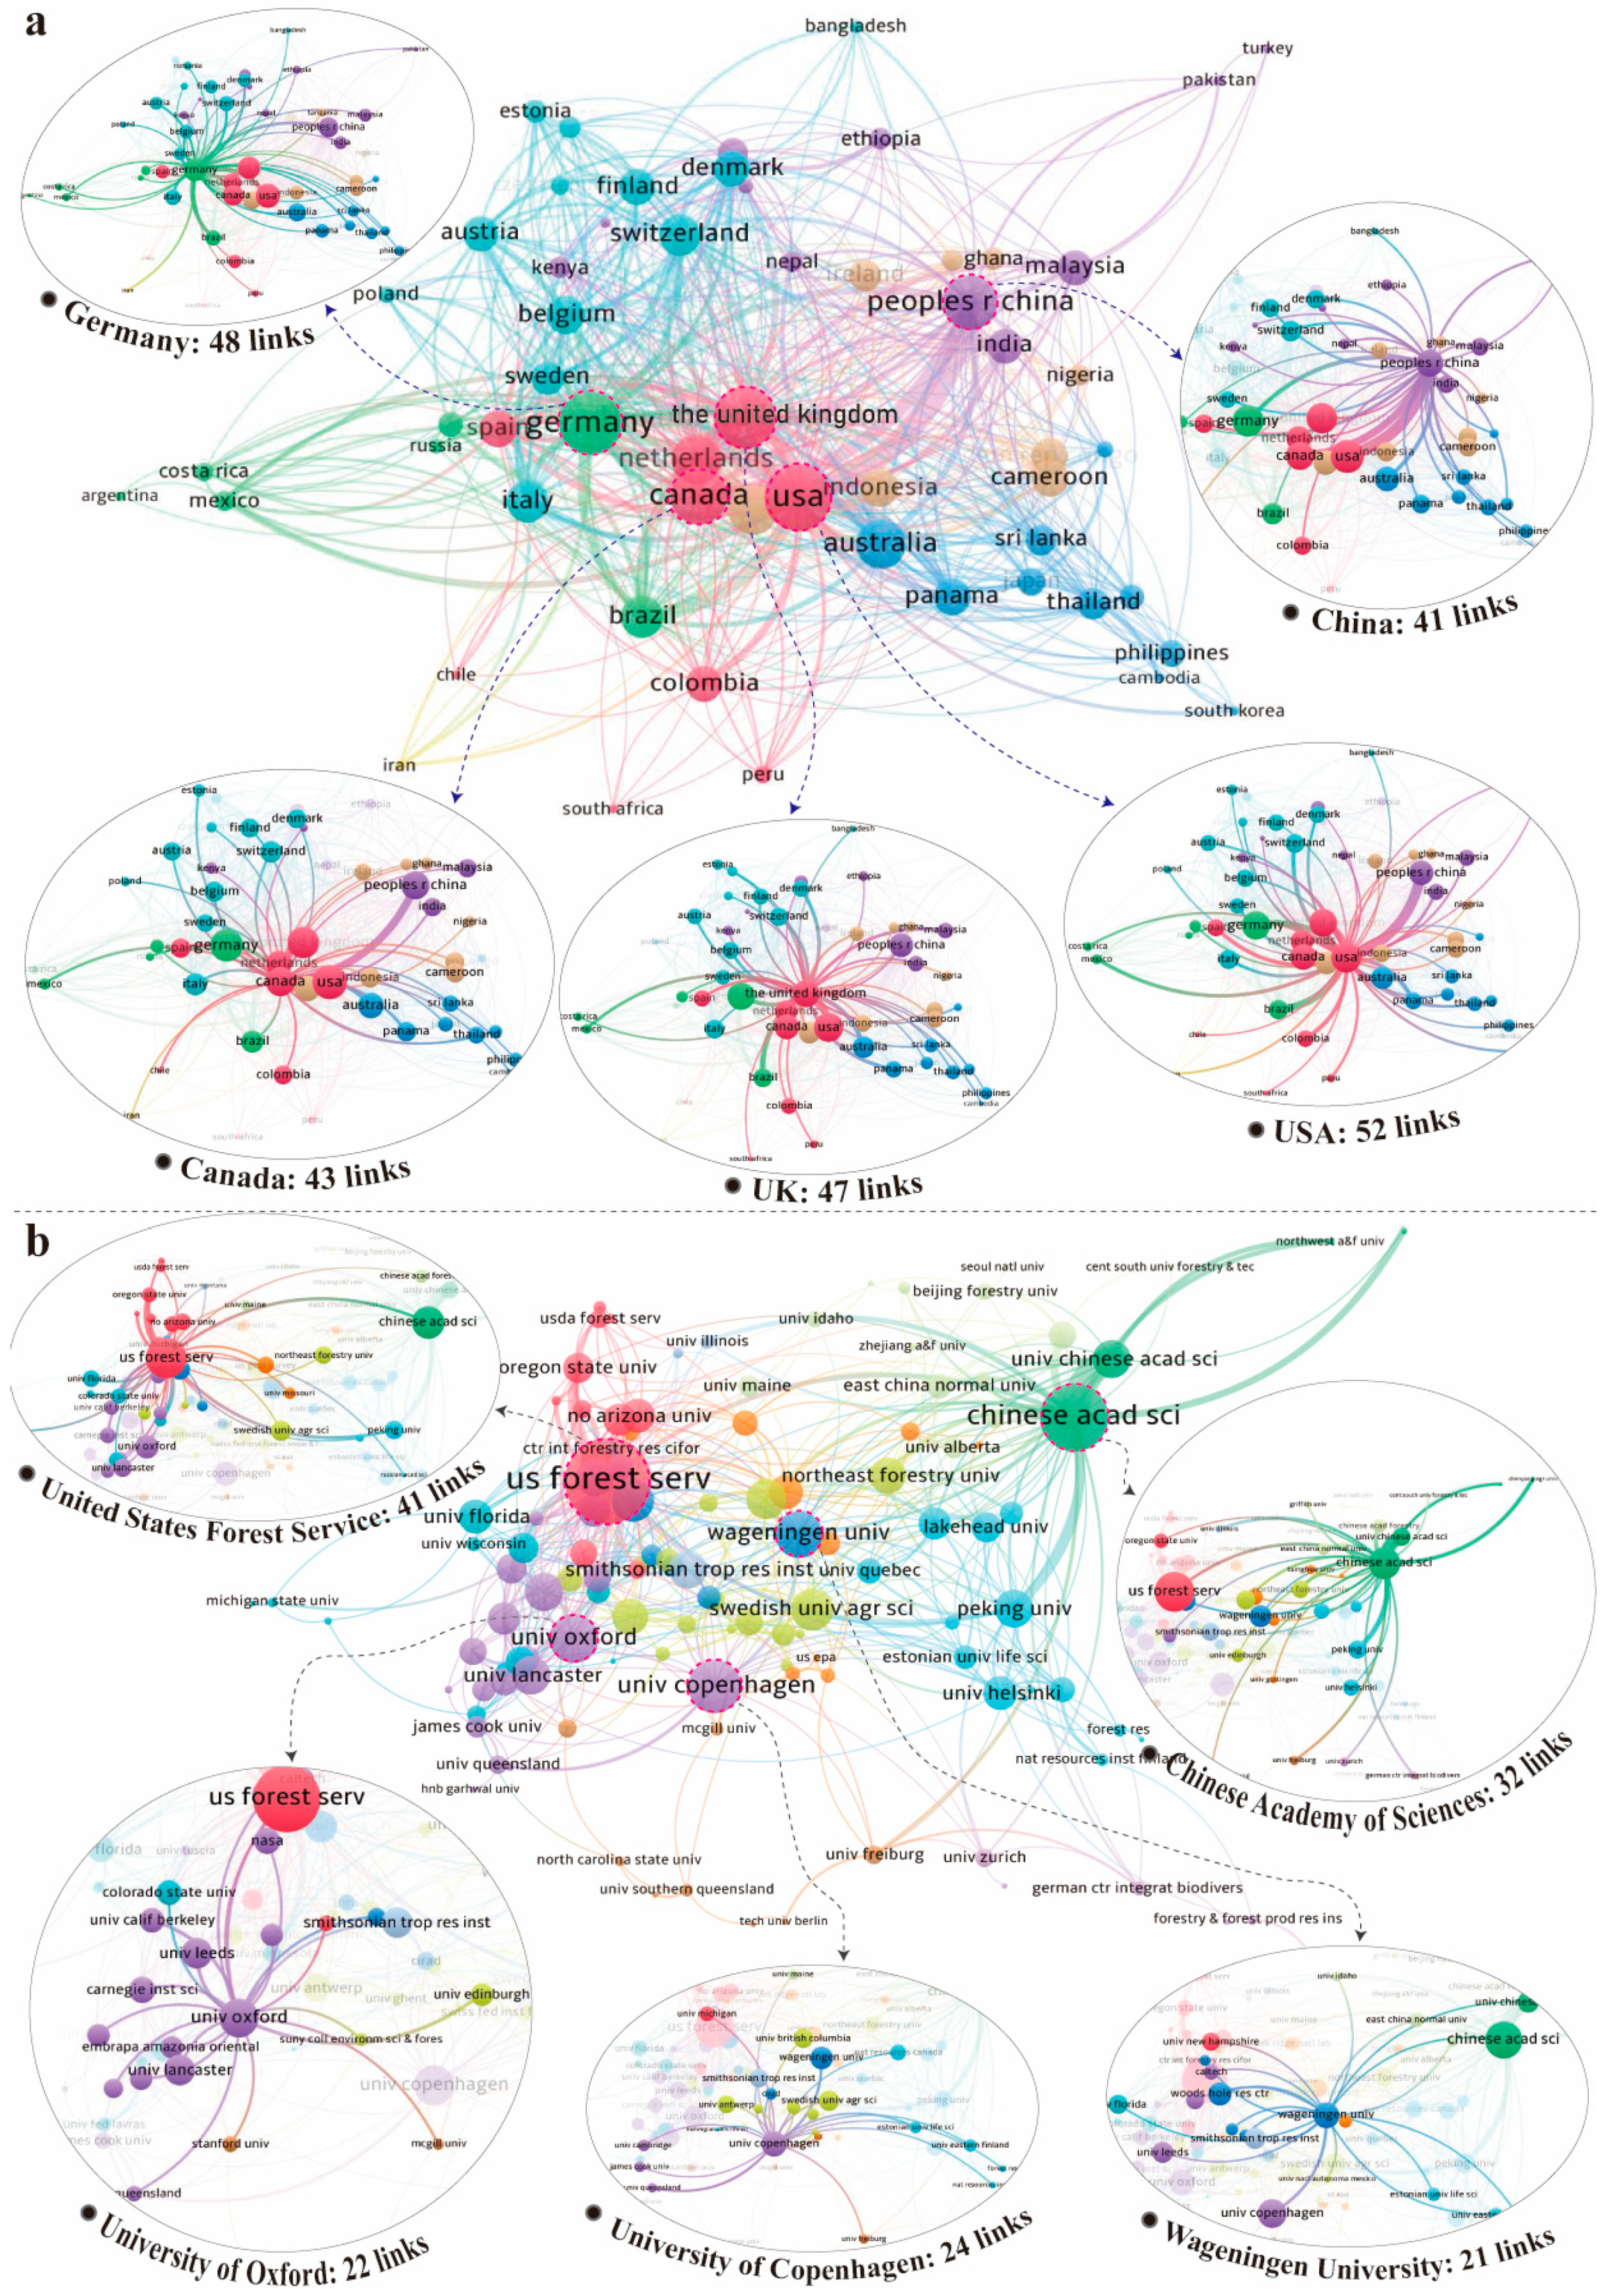
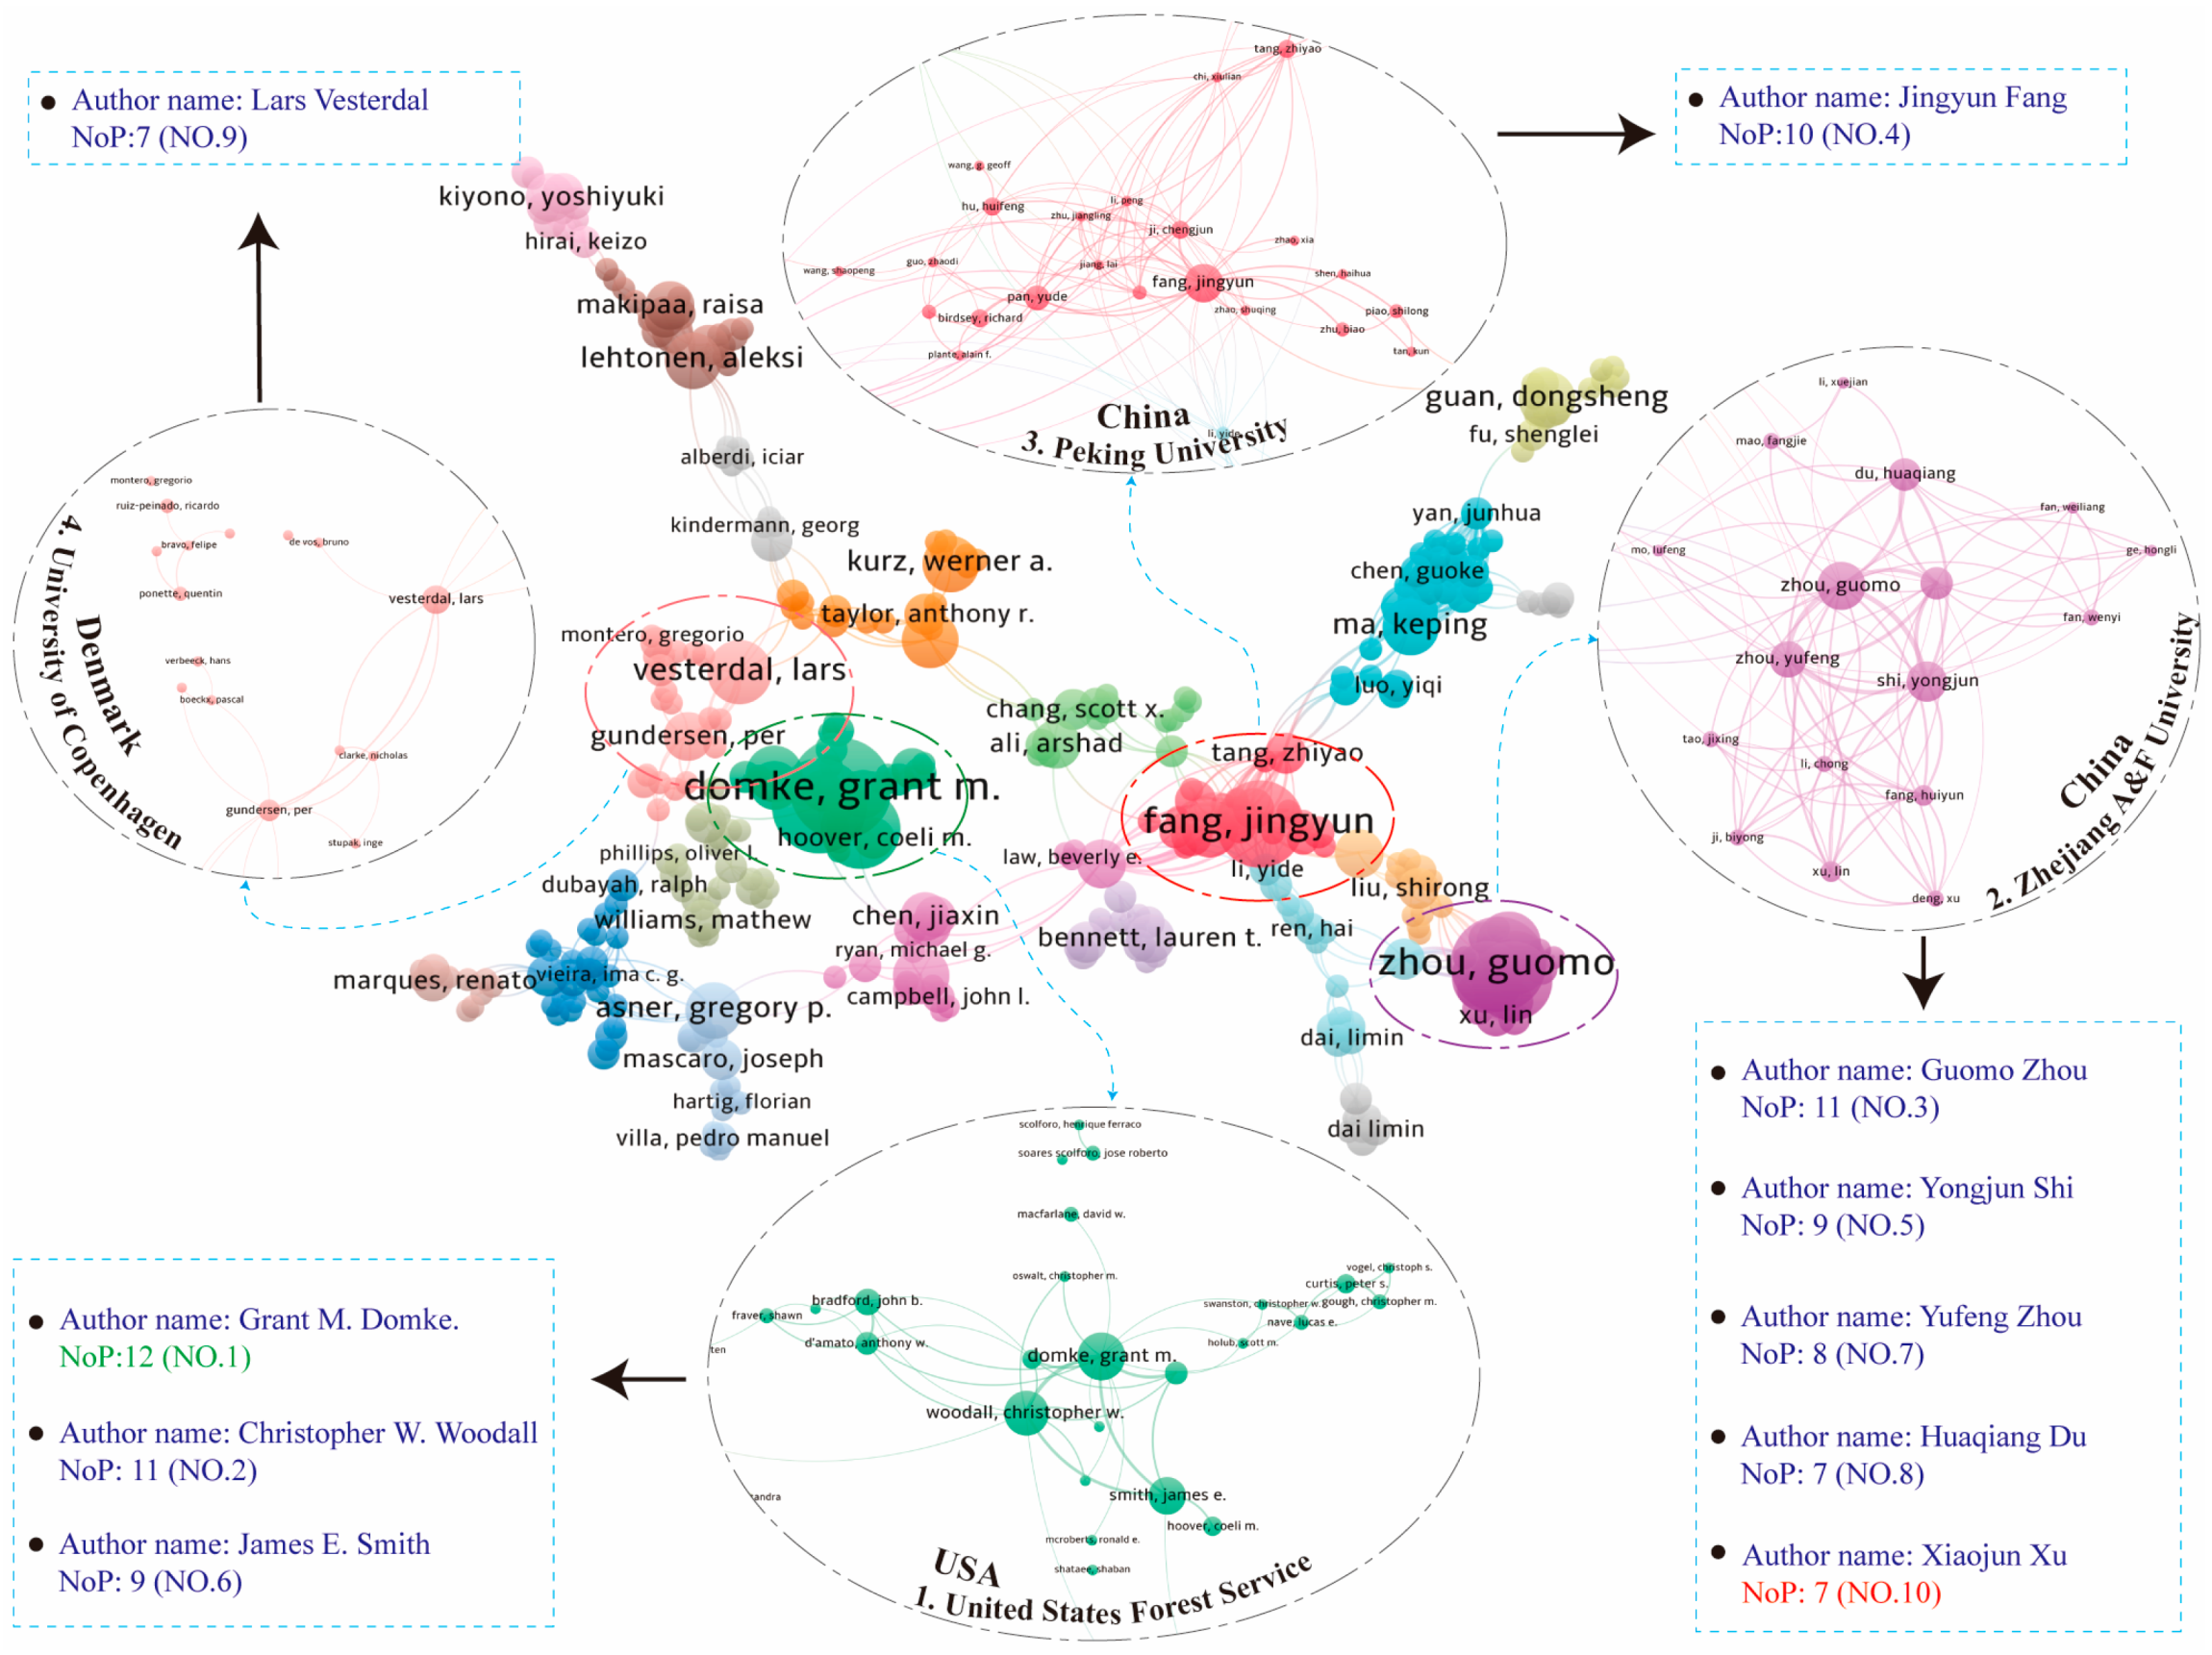

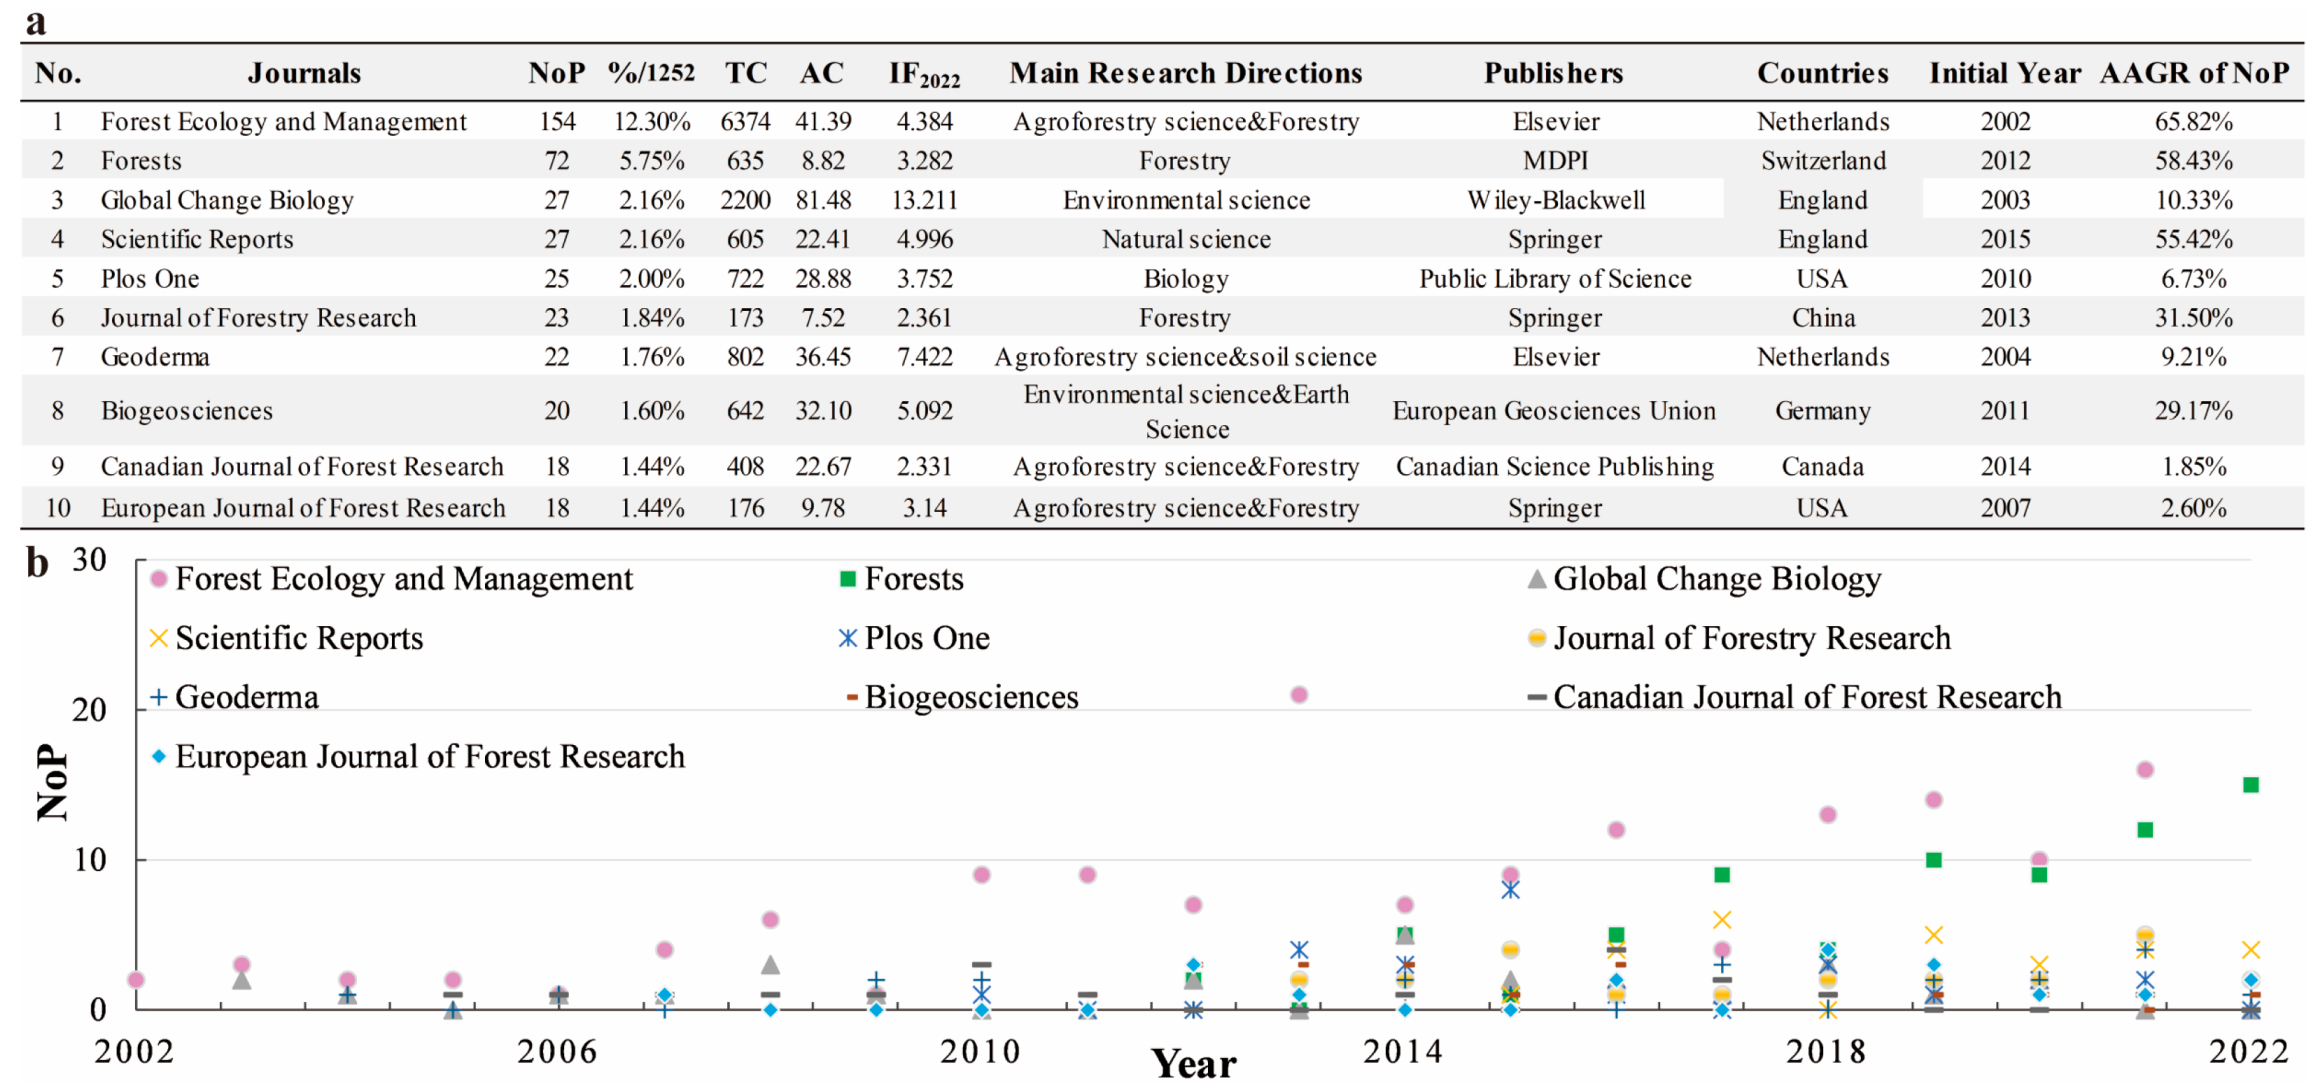
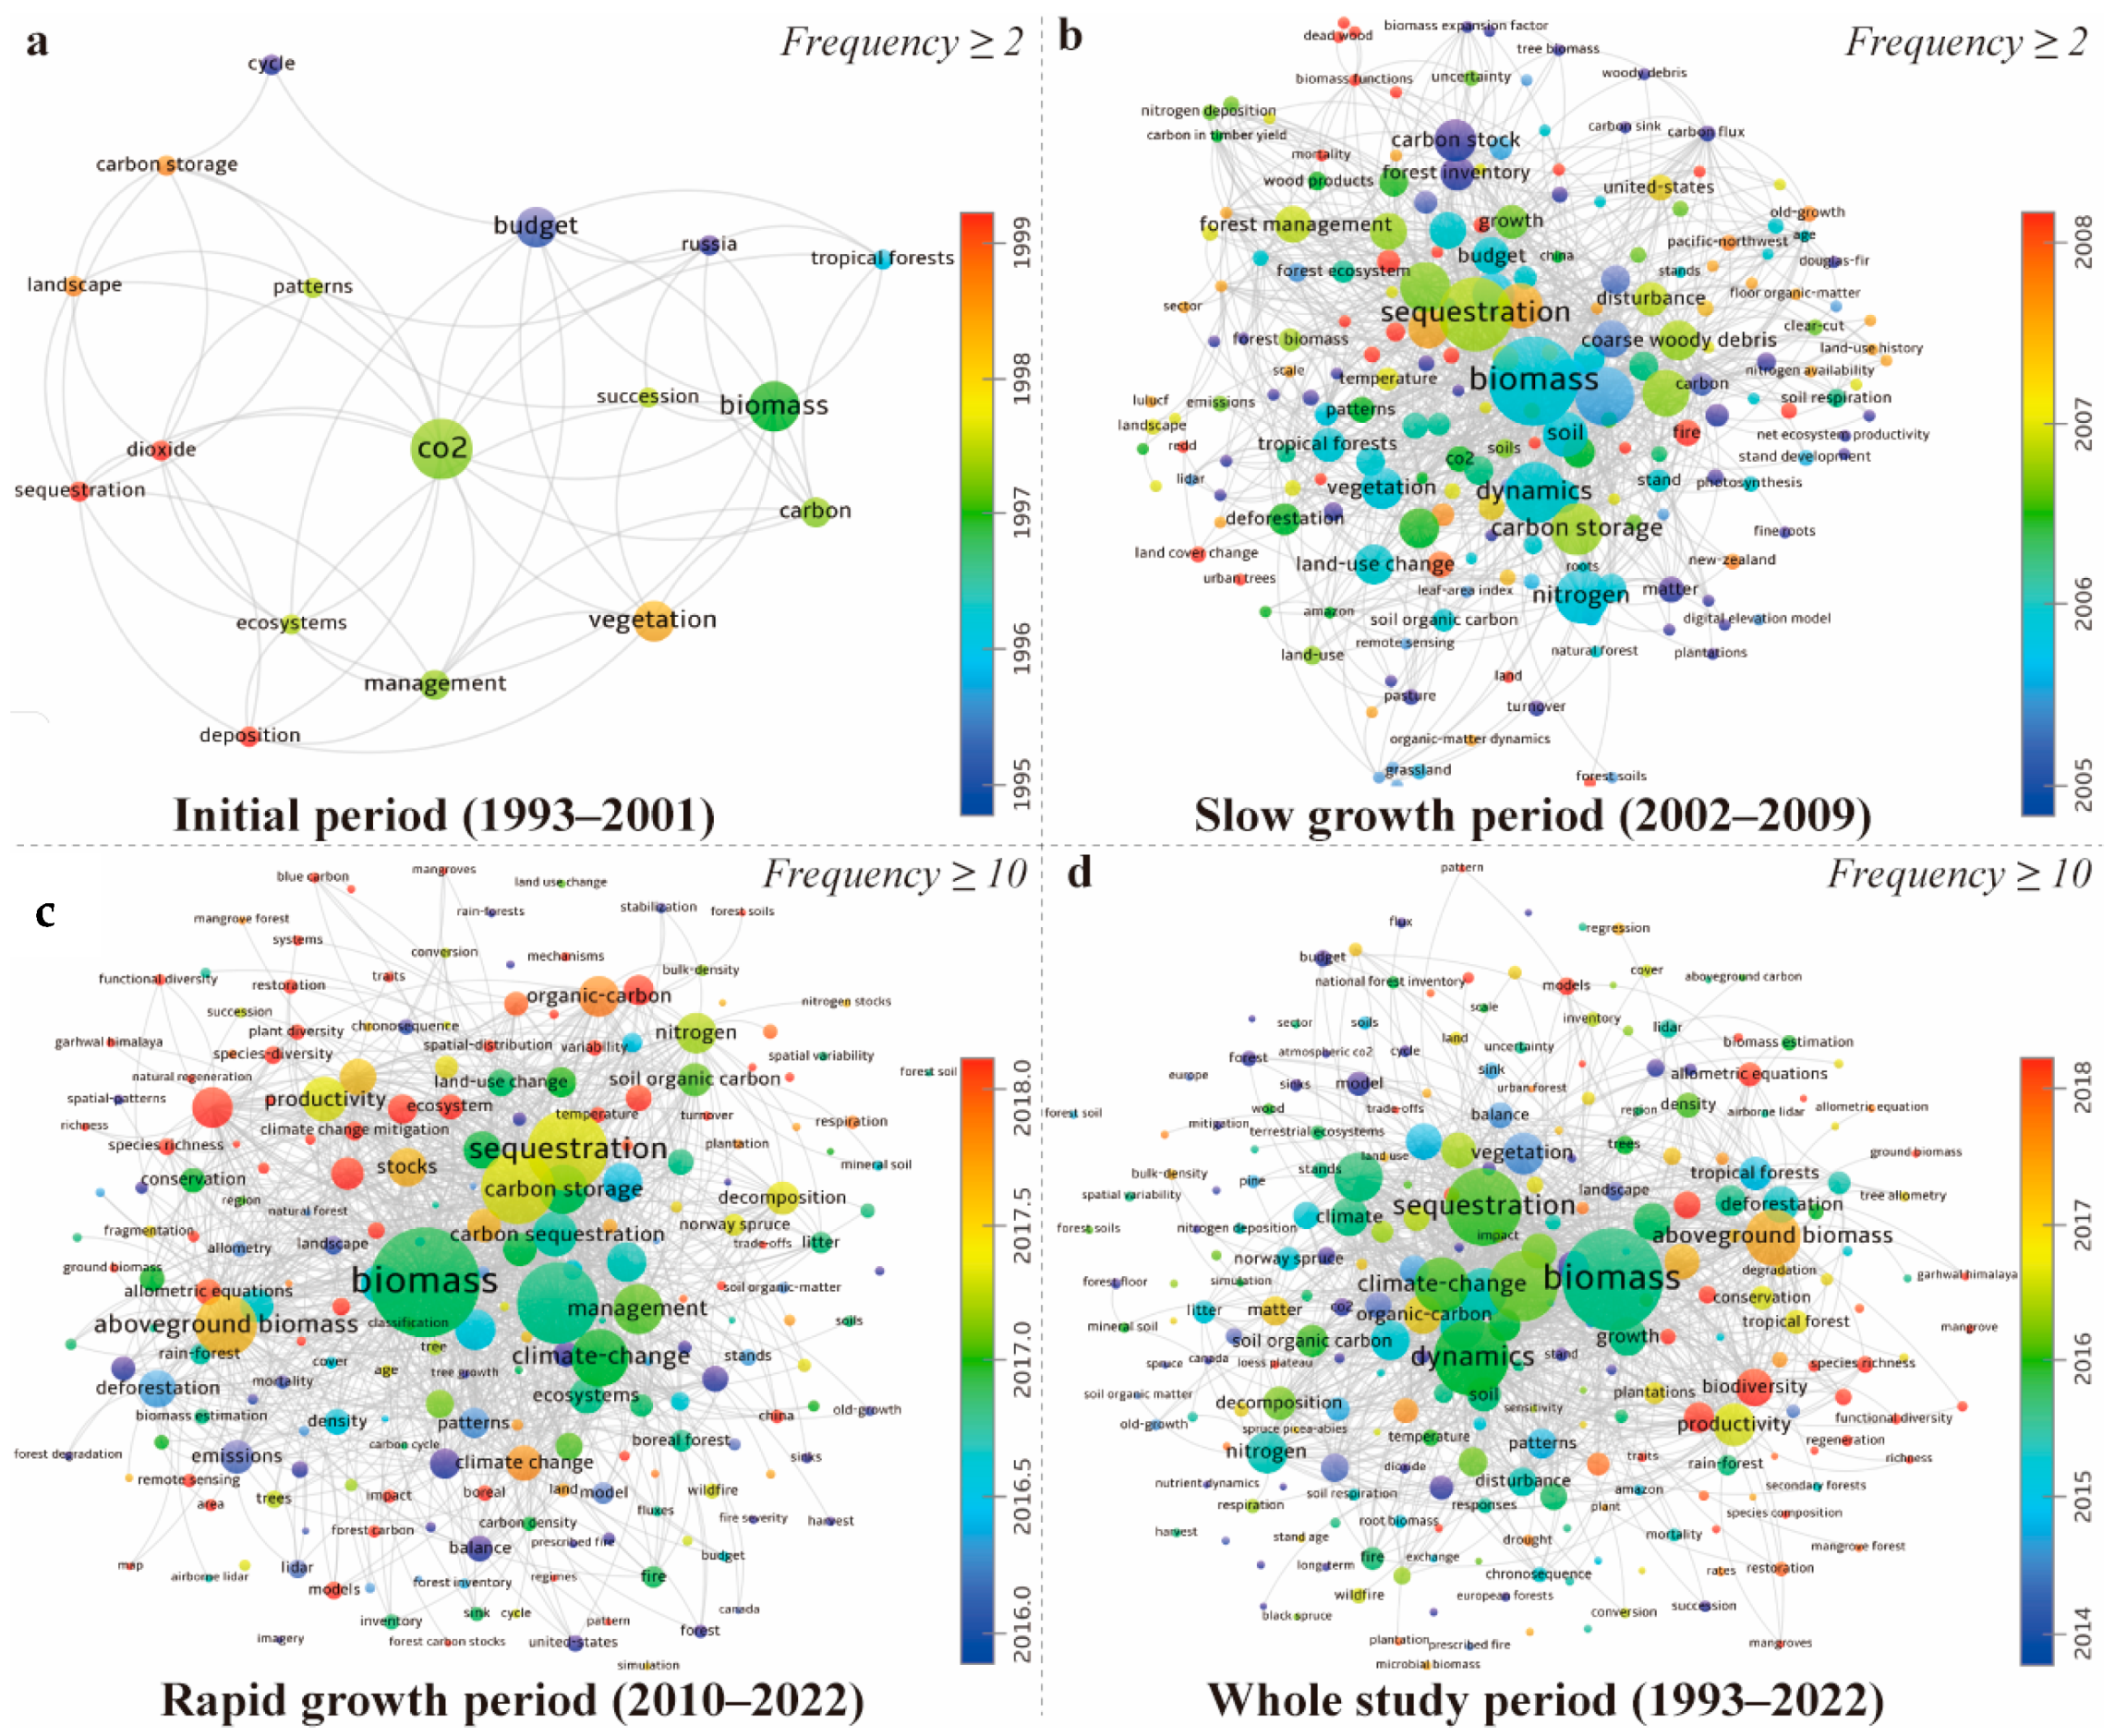

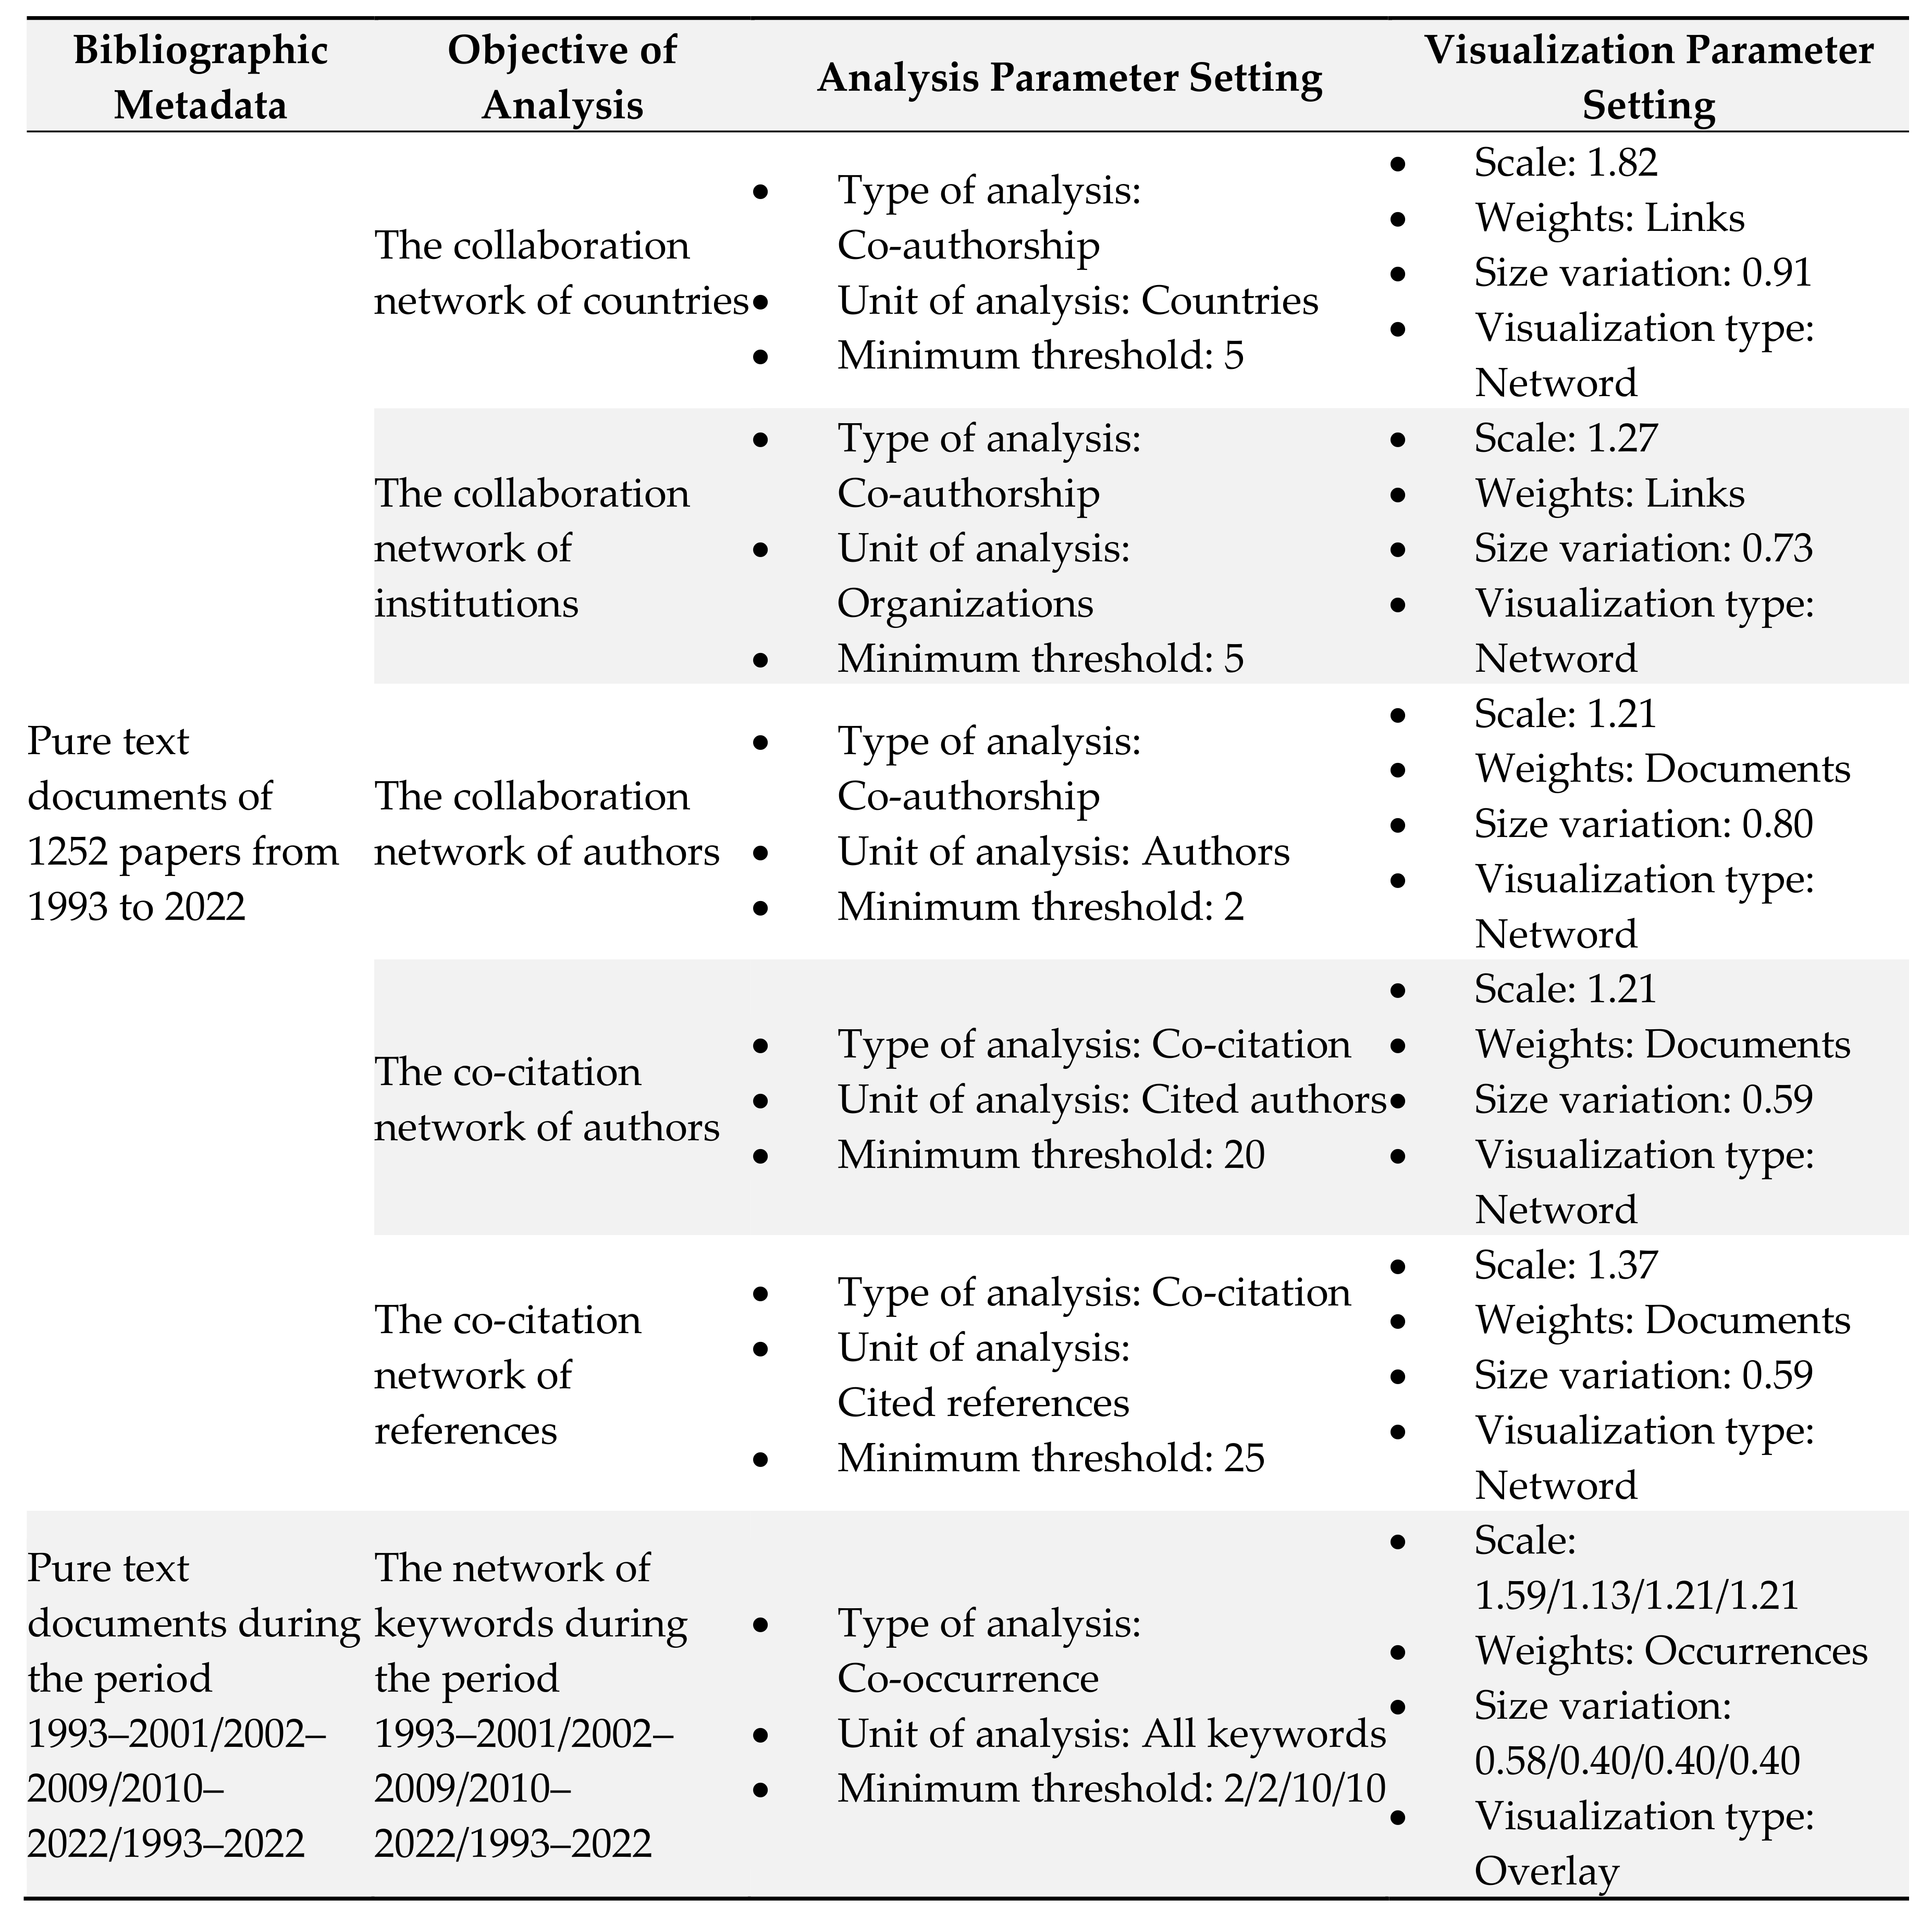
Disclaimer/Publisher’s Note: The statements, opinions and data contained in all publications are solely those of the individual author(s) and contributor(s) and not of MDPI and/or the editor(s). MDPI and/or the editor(s) disclaim responsibility for any injury to people or property resulting from any ideas, methods, instructions or products referred to in the content. |
© 2024 by the authors. Licensee MDPI, Basel, Switzerland. This article is an open access article distributed under the terms and conditions of the Creative Commons Attribution (CC BY) license (https://creativecommons.org/licenses/by/4.0/).