Article

Advanced Integration of Urban Street Greenery and Pedestrian Flow: A Multidimensional Analysis in Chengdu’s Central Urban District

by
Qicheng Ma
1,
Jiaxin Zhang
2,* and
Yunqin Li
2
1
College of Architecture and Urban Planning, Tongji University, Shanghai 200092, China
2
Architecture and Design College, Nanchang University, Nanchang 330031, China
*
Author to whom correspondence should be addressed.
ISPRS Int. J. Geo-Inf. 2024, 13(7), 254; https://doi.org/10.3390/ijgi13070254
Submission received: 27 April 2024 / Revised: 11 July 2024 / Accepted: 15 July 2024 / Published: 16 July 2024

Abstract

:
As urbanization accelerates, urban greenery, particularly street greenery, emerges as a vital strategy for enhancing residents’ quality of life, demanding attention for its alignment with pedestrian flows to foster sustainable urban development and ensure urban dwellers’ wellbeing. The advent of diverse urban data has significantly advanced this area of study. Focusing on Chengdu’s central urban district, this research assesses street greening metrics against pedestrian flow indicators, employing spatial autocorrelation techniques to investigate the interplay between street greenery and pedestrian flow over time and space. Our findings reveal a prevalent negative spatial autocorrelation between street greenery and pedestrian flow within the area, underscored by temporal disparities in greenery demands across various urban functions during weekdays versus weekends. This study innovatively incorporates mobile phone signal-based population heat maps into the mismatch analysis of street greenery for the first time, moving beyond the conventional static approach of space syntax topology in assessing pedestrian flow. By leveraging dynamic pedestrian flow data, it enriches our understanding of the disconnect between street greening plans and pedestrian circulation, highlighting the concept of urban flow and delving into the intricate nexus among time, space, and human activity. Moreover, this study meticulously examines multiple street usage scenarios, reflecting diverse behavior patterns, with the objective of providing nuanced and actionable strategies for urban renewal initiatives aimed at creating more inviting and sustainable urban habitats.

1. Introduction

By 2023, China’s urbanization rate of its permanent population exceeded 65%, with the rapid urban development bringing about a slew of issues associated with haphazard urban expansion, colloquially known as “urban diseases” [1]. In pursuit of more sustainable urban development, governments worldwide have initiated urban renewal programs aimed at rectifying unreasonable structures and fostering sustainable urban growth patterns [2]. Urban greenery, especially street greening—a component of urban green spaces frequently encountered by city residents—plays a pivotal role in these renewal efforts [3]. Extensive research underscores the benefits of street greening, from enhancing physiological health and beautifying living environments [4] to improving mental wellbeing [5], fostering community vitality [6], and mitigating urban microclimates [7]. Such positive impacts have sparked scholars’ interest in the strategic planning of street greening [8] and have endeavored to apply various methodologies for its measurement.
However, methodologies remain contentious. Previous methods include two-dimensional assessments of green coverage, often substituting the Normalized Difference Vegetation Index (NDVI) [9] or the red-edge Normalized Difference Vegetation Index (NDVIre), and others using greenery land ratios (GLRs) as a mandatory index in unit planning [10]. Another approach involves three-dimensional “Green View Indexes” (GVIs), which use street-level images analyzed with image recognition technology [11]. This approach has also been applied in studies exploring the relationship between other street furniture and pedestrians’ perceptions [12]. The latter, offering a pedestrian perspective, arguably reflects pedestrians’ real experiences on the street and the direct benefits of street greenery on urban dwellers’ physical and mental health more accurately [13]. Therefore, further studies have been conducted on how the GVI at different neighborhood scales affects residents’ walking behavior [14].
Despite numerous studies on the perceptual differences between these greenery metrics, challenges persist. For instance, Ye et al. [15] introduced the concept of “daily accessible greenery” by coupling street-level greenery metrics with pedestrian and vehicular traffic volumes using street network space syntax, a methodological framework established in the 1970s by Bill Hillier at University College London inspired by graph theory. This framework posits that movement within space is guided not only by physical distance but also by geometric and topological relationships [16,17], making space syntax a powerful tool in urban analysis across various contexts, such as predicting urban street vitality to optimize urban renewal projects and analyzing the connectivity of spatial units in the urban spatial network to study the morphological evolution of cities during historical periods [18,19,20]. These applications demonstrate how space syntax quantifies and standardizes complex spatial relationships using mathematical formulas, achieving a comprehensive and systematic examination of inherently unstable study subjects.
As urban big data research flourishes, scholars increasingly integrate space syntax with multi-source urban data to guide street greenery planning, examine spatial equity, guide the renewal of historic districts, explore the fairness in the spatial distribution of urban facilities, improve urban resilience to disasters, and conduct urban intention perception studies using street view imagery [1,7,18,21,22,23,24]. Analyzing differences between various data types not only elucidates spatial uniqueness but also reveals regional disparities and underlying principles, becoming a focal point in urban science research [25]. Nonetheless, current studies face challenges in data acquisition and the integration of multi-source data, which can limit research depth and breadth. Particularly, discrepancies in data formats, temporal scales, and spatial resolutions may impact the analytical accuracy. Additionally, the data quality and reliability across different sources require careful consideration. For instance, urban population heatmaps derived from mobile signaling can compensate for the dynamic vacancy of space syntax street vitality metrics, offering a “fluid space” rather than “place space” planning perspective and reflecting a more accurate street pedestrian flow [26,27,28]. In the past, the concept of urban flow has mostly been applied to urban transportation route planning and traffic area division [29]. This is based on an understanding of the complex dynamics of modern cities, emphasizing how various flow processes—such as pedestrian traffic, logistics, and information flows—affect the spatial structure and function of urban areas. Urban heatmaps were also commonly used to analyze the distribution of commercial hotspots, plan the locations of public service facilities, and predict the direction of urban development. This study, taking the central urban district of Chengdu as a case, employs a multidimensional comparative analysis based on spatial correlations between street greenery metrics (including GVI and NDVI) and street vitality metrics (integration and choice indexes of space syntax among others) alongside street dynamic use data. This approach aims to optimize the spatial alignment between urban street greenery and pedestrian flow, providing deeper insights for urban renewal and street greening optimization decisions.
This study introduces three innovative aspects: (1) In analyzing the mismatch between street greenery and pedestrian flow, it incorporates mobile signaling data into a heatmap as a means to refine and compare with the space syntax analysis of the urban road network topology, thereby adopting a perspective of urban flow to understand street greenery. By incorporating real-time pedestrian data to capture dynamic street flows, this study enhances previous methods that relied heavily on space syntax to represent pedestrian movements for studying the alignment between pedestrian flows and street greenery. Previous methods, such as those by Ye et al. in 2019 [15], although theoretically sound, failed to capture fluctuations in pedestrian flow caused by temporary events, time changes, or other dynamic social factors. They treated pedestrian flow as a static, unchanging quantity, ignoring the real-time dynamics of urban environments, leading to errors in the evaluation of street usage. (2) Acknowledging the spatial and temporal variances in the elements involved, this study employs bivariate spatial correlation analysis to investigate the mutual spatiotemporal mechanisms between street flow and greenery. This further delves into the integration of time, space, and people within the urban matrix [30]. This extends previous research that largely focused only on the spatial distribution of variables, such as the study by Zhu et al. in 2023 [10], which overlooked the impact of temporal variables in the dynamic relationship between urban environments and human activities. (3) By taking into account various scenarios such as walking, commuting, crossing, and arriving, and measuring street greenery from both top-down and bottom-up perspectives, this study identifies human-centric, nuanced perceptual differences to propose specific and viable street greenery optimization strategies. These contributions aim to enhance the precision and effectiveness of urban renewal initiatives. This approach addresses gaps left by previous studies that only analyzed different travel radii, such as the study by Ye et al. in 2019 [15], by utilizing the fundamental principles of space syntax algorithms to explain different states of human activity.

2. Materials and Methods
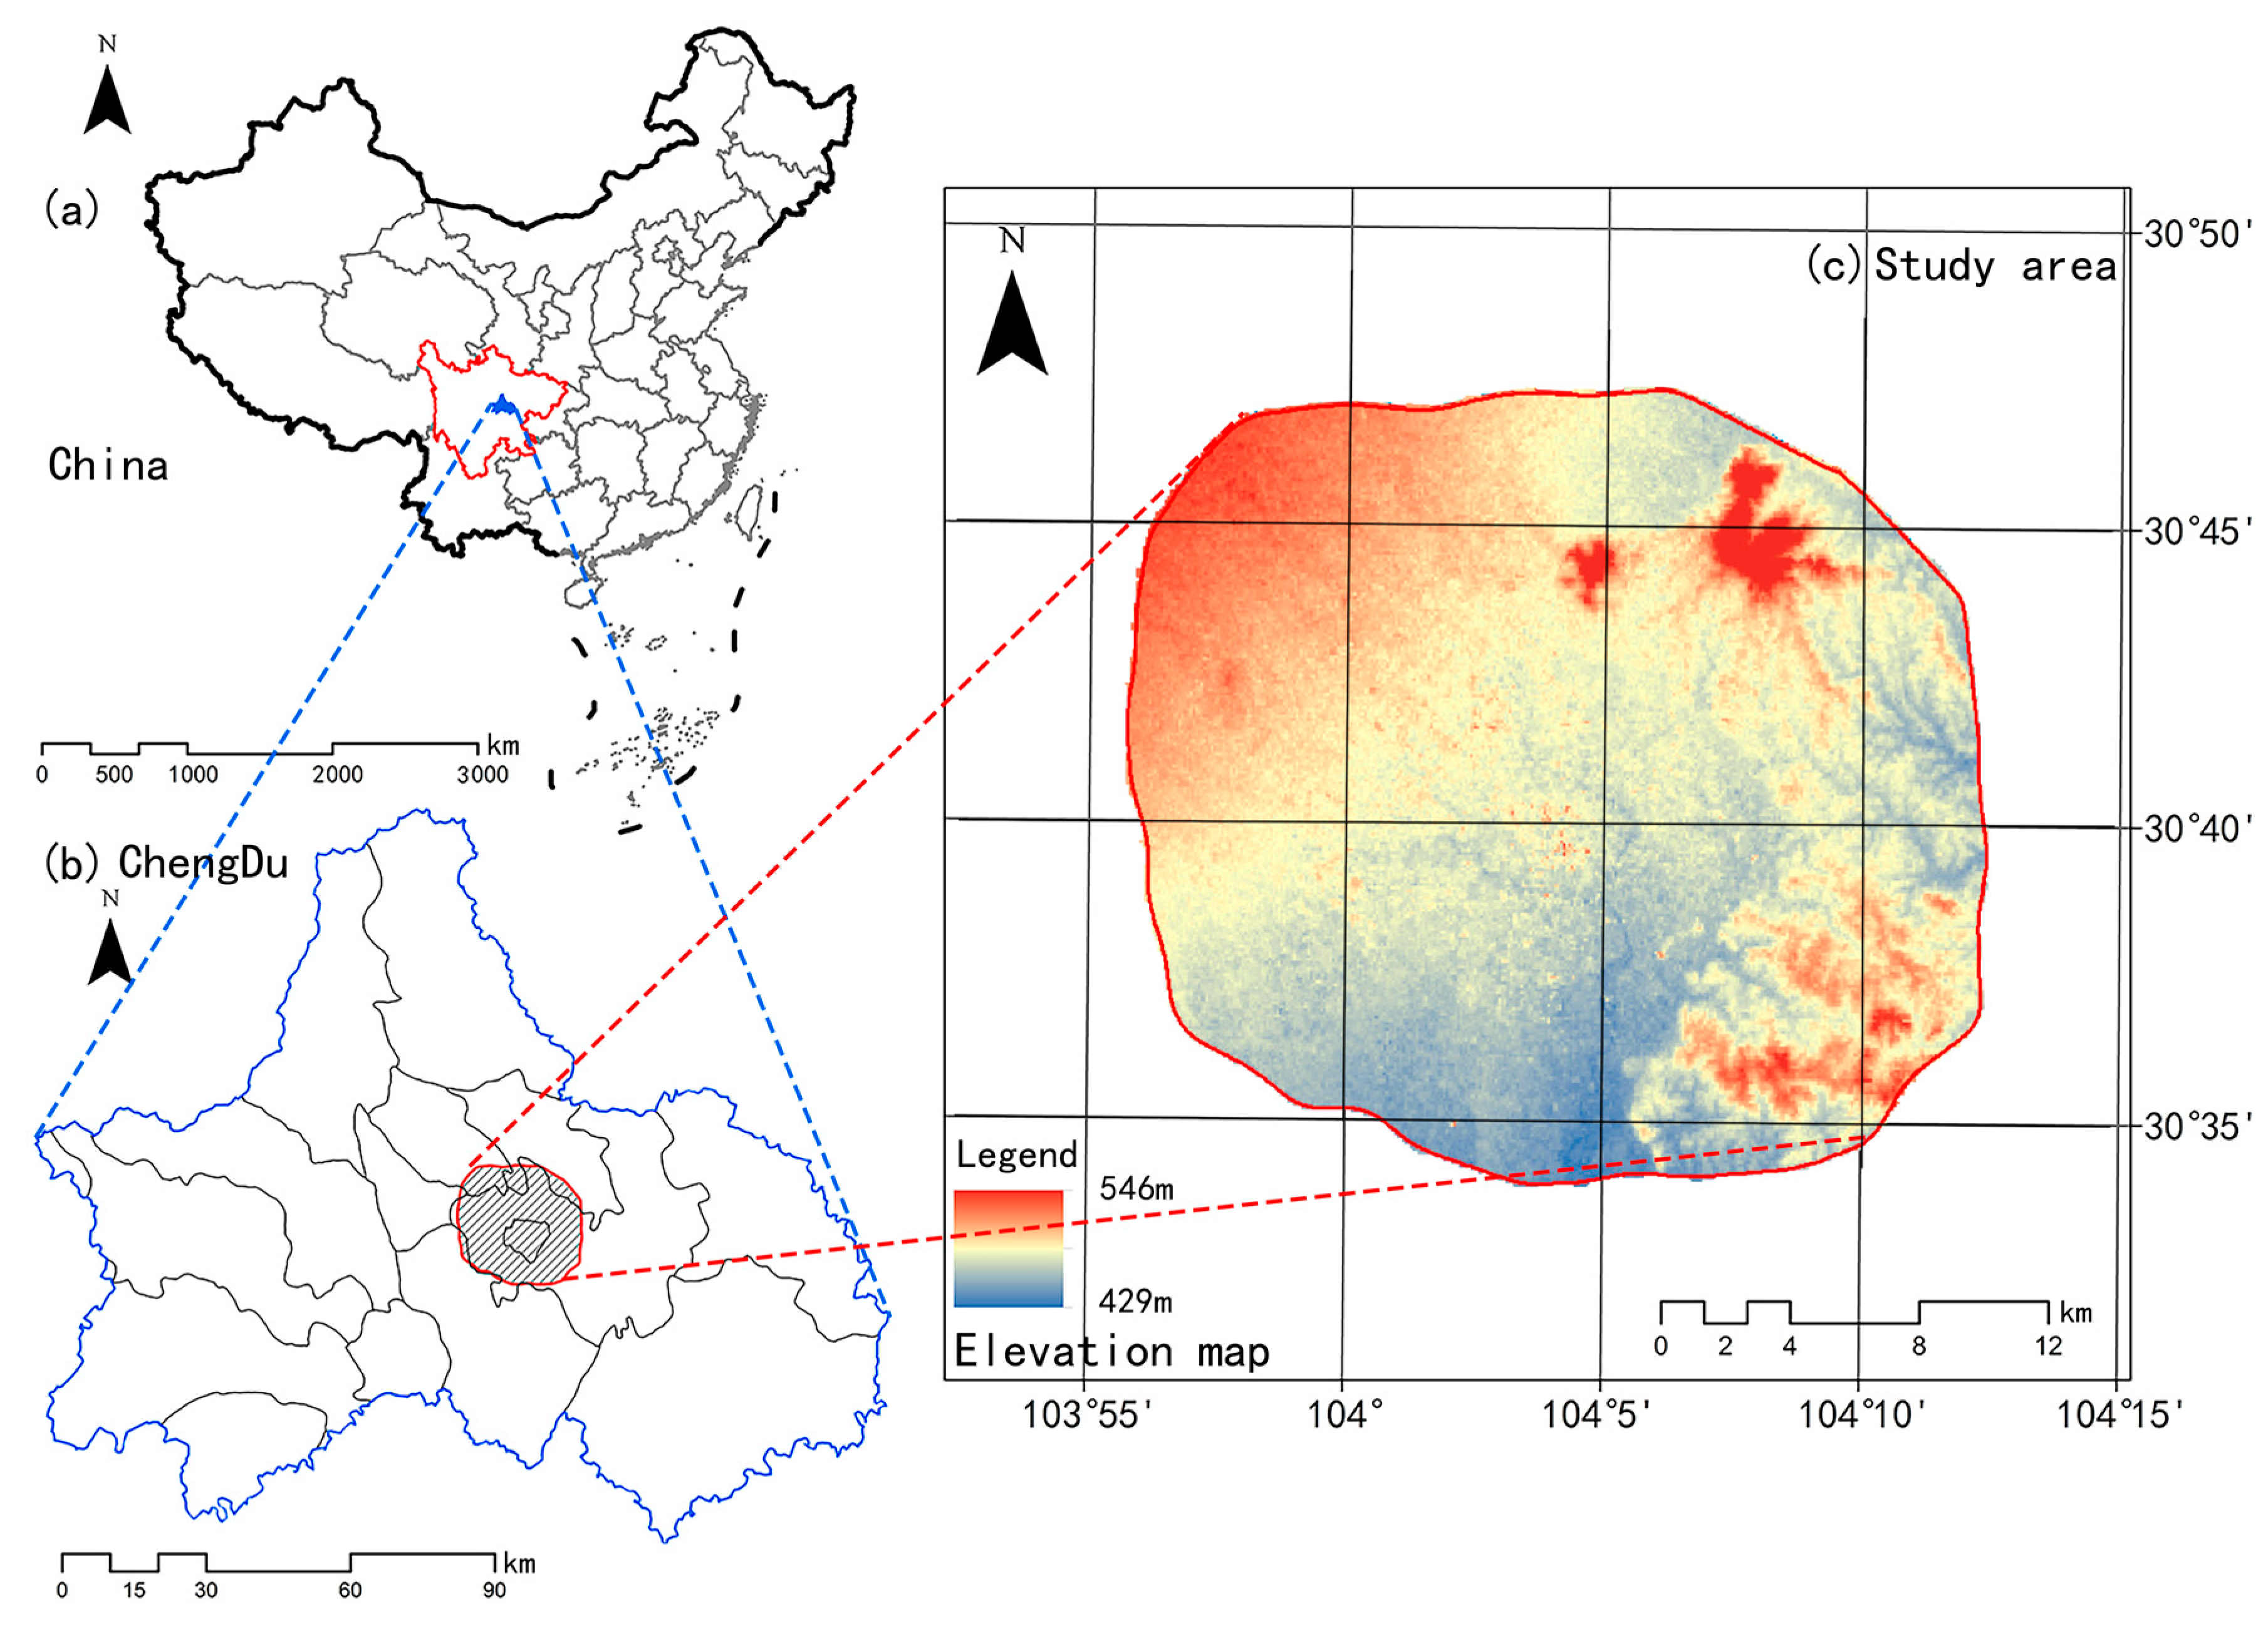
The research framework, depicted in Figure 1, begins with calculating urban street greenery and flow indicators, including GVI, NDVI, normalized weekday, weekend, and average heatmaps, and angular integration and choice indexes within 1000 m and 9500 m radii. Subsequently, indicators from both categories are analyzed pairwise through bivariate global and local spatial autocorrelation to derive the bivariate global Moran’s I index and spatial clustering images. Finally, by comparing the differences in greenery perception, patterns of pedestrian flow, and street usage, this study aims to inform better urban planning.

2.1. Research Area

Chengdu, located in western China, serves as a pivotal support for the inland economic development of the country [31] and is renowned as a leading example of China’s new development philosophy of park cities. The study area, shown in Figure 2, encompasses the central urban district of Chengdu, located within the city’s fourth ring road, facilitating the examination of street greenery and pedestrian traffic flow. The area spans from 103°55′ E to 104°15′ E and from 30°30′ N to 30°50′ N, covering 544.6 km2.

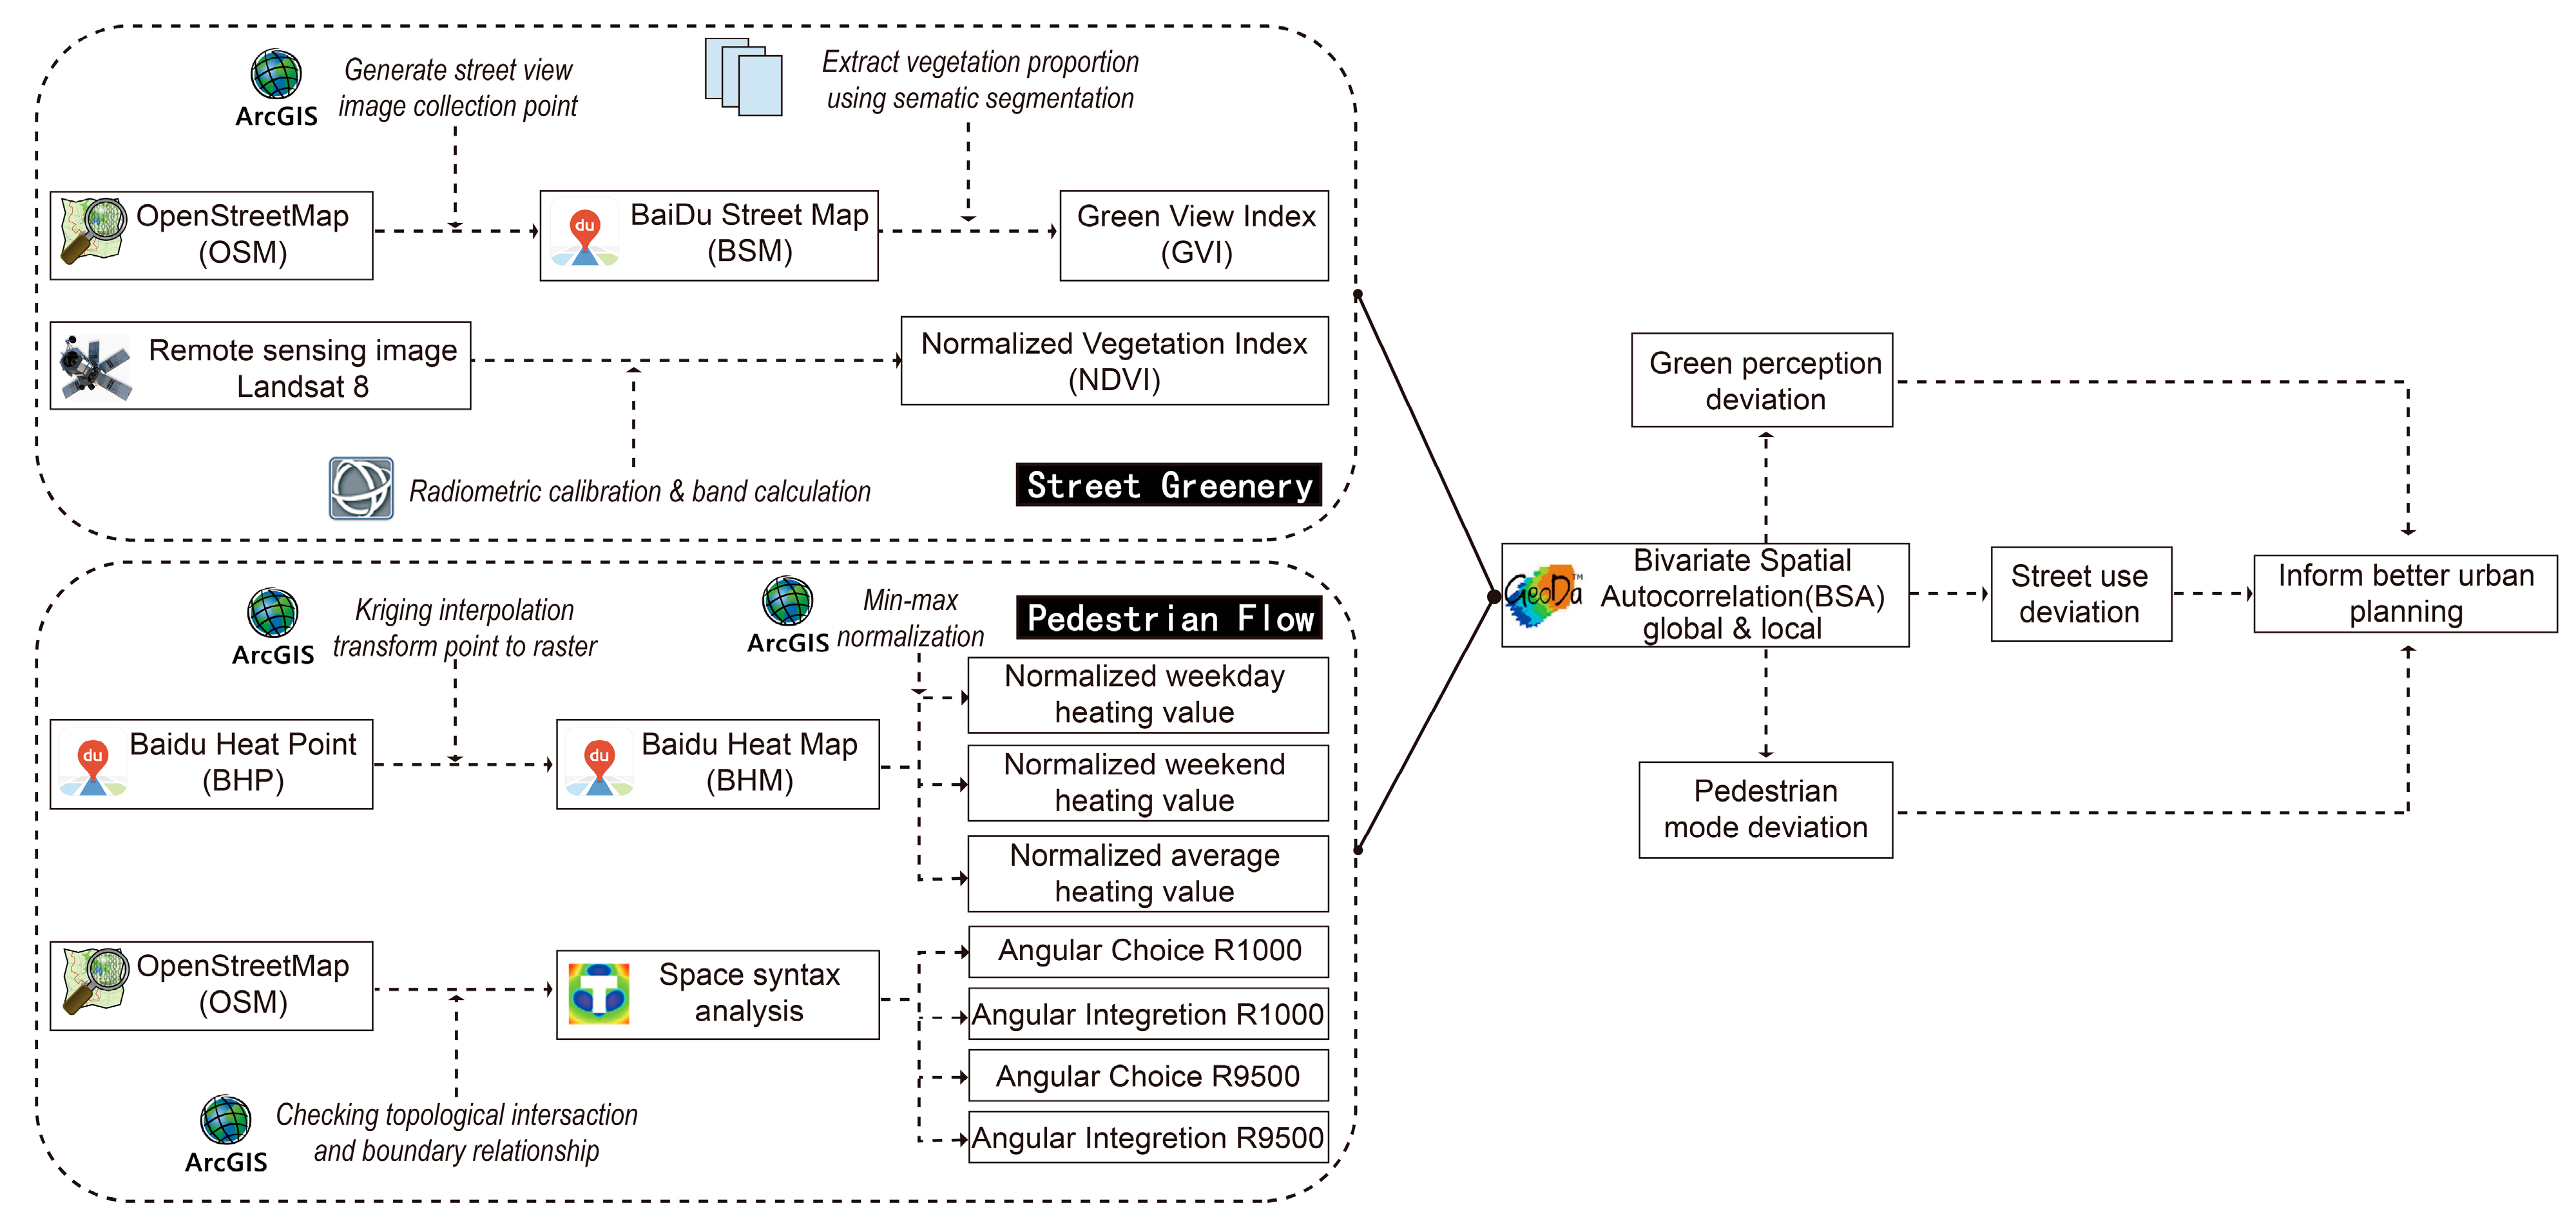
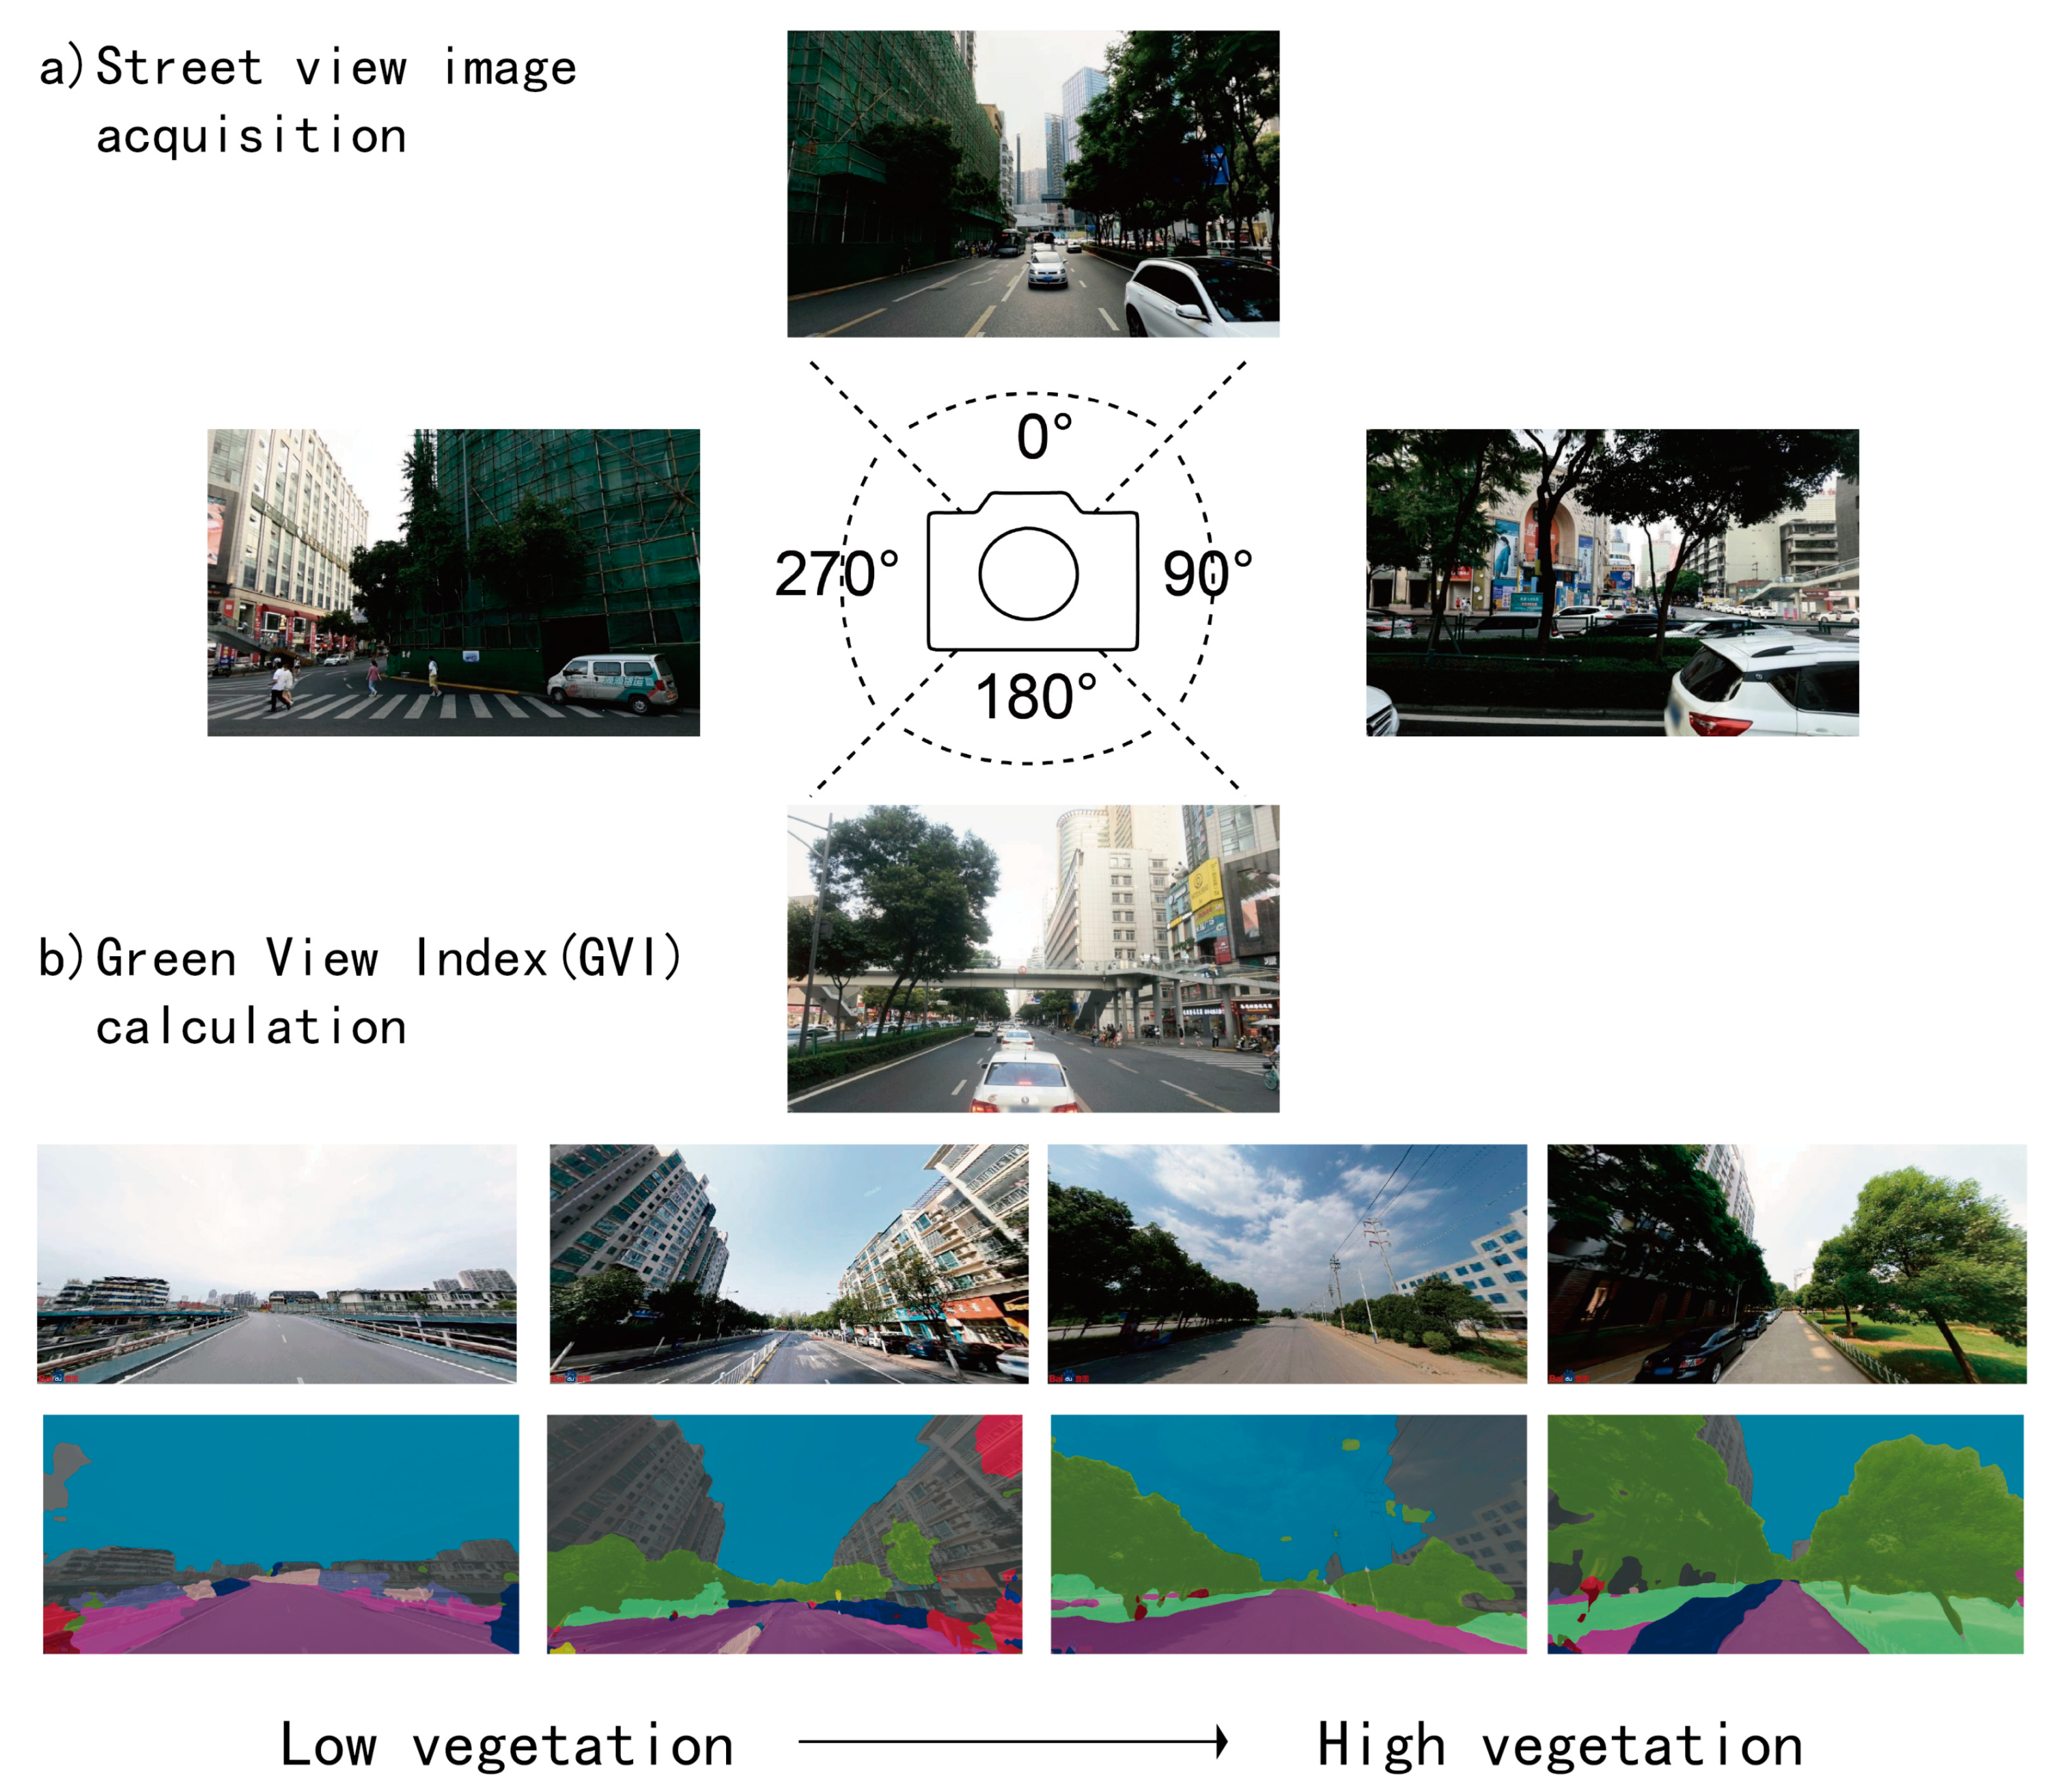
2.2. Measurement of Street Greenery Indicators

Initially, this study acquired linear data of the entire road network for the study area from the open-source website OSM (https://www.openstreetmap.org, accessed on 15 September 2023) and performed pre-processing tasks using Arcgis 10.8 software, including extracting by mask, extracting the main roads, merging dual lines, removing miscellaneous lines, and checking network topology. Subsequently, roads were segmented at 50 m intervals to generate sampling points for street view images and obtain the latitude and longitude coordinates for each sampling point. Each sampling point was oriented with true north at 0°, and street view maps from Baidu at 0°, 90°, 180°, and 270°—four directions perpendicular to each other—were obtained using Python code, as shown in Figure 3. The pitch value was set to 20, and the fov value was set to 90. In total, 69,649 sampling points and 278,596 valid street view photos were collected. Further, the pre-trained Deeplabv3+ model from the Cityscapes dataset was used for semantic segmentation of the four street view images to determine the vegetation coverage ratio. This method, offering enhanced accuracy over previous green color recognition methods, has been extensively applied in various urban research fields [13,32]. The Green View Index for each sampling point was averaged from the four directional images to obtain a composite score, with Figure 3 illustrating examples of street views ranked from high to low Green View Indices.
G V I i x = p v e g e t a t i o n i x / p t o t a l i x
G V I i = x = 1 4 G V I i x / 4
where i represents the sampling point, x represents the four directions (0°, 90°, 180°, 270°), p v e g e t a t i o n i x is the proportion of vegetation pixels in the x direction at sampling point i , and p t o t a l i x refers to the total pixels in the x direction at sampling point i .
This study utilized Landsat 8 satellite remote sensing images for the study area from the Geospatial Data Cloud platform (https://www.gscloud.cn, accessed on 2 August 2023), specifically for August 2019, when vegetation was at its peak and the cloud cover was less than 5%. The Landsat 8 satellite, providing 15 m panchromatic resolution and 30 m visible and near-infrared band resolution, facilitates the creation of more accurate greenery distribution maps [33]. After radiometric calibration and masking using ENVI software (version 6.0), the NDVI values were calculated from the infrared and near-infrared bands of the image. Higher NDVI values indicate greater vegetation coverage.
N D V I = N I R R E D / N I R + R E D
where N I R is the reflectance value of the near-infrared band, and R E D is the reflectance value of the infrared band.

2.3. Measurement of Street Pedestrian Flow Indicators

Previous research has shown that the distribution of urban heatmaps from Monday to Friday is similar, as well as the distribution on Saturday and Sunday [34]. Therefore, this study selected the hourly accumulated Baidu heatmaps for 23 August and 26 August 2023, representing the weekday and weekend street population density from 7 AM to 11 PM. The heating value, indicative of pedestrian density, was estimated using an hourly average, as mobile base stations record data every 15 min [28]. The Baidu heatmaps used in this study are sourced from the Baidu Huiyan population location data, which aggregate statistics on the location of terminals that call the Baidu Map positioning SDK within one hour. This statistical value is assigned to the centroid of a 200 × 200 coordinate grid. Based on sunrise and sunset times for Chengdu in August 2023, 7 a.m. to 8 p.m. was selected as the calculation period. Kriging interpolation was used to generate complete and continuous Baidu heat raster maps, which were then normalized to create weekday, weekend, and average heatmaps using Arcgis 10.8.
A v e r a g e   H e a t i n g   V a l u e = i = 1 n H e a t i n g   V a l u e / n
where H e a t i n g   V a l u e represents the heat interpolation for a given time period, and n is the number of heatmaps aggregated.
This study analyzed the street network using the space syntax angular shortest segment model, selecting 1000 m and 9500 m as analysis radii for walking and commuting, respectively. Integration and choice indexes were calculated for these radii. The 1000 m radius was chosen because most people can walk approximately 1 km within 15 min, which typically defines the range of personal living circles, and the 9500 m commuting distance was based on average daily car commuting distances in Chengdu reported by Baidu Maps and Gaode Maps over the past three years [21]. The integration index describes a street’s centrality within the network, reflecting its attractiveness as a destination and accessibility for collective movement [17].
I n t e g r a t i o n i = N o d e   C o u n t i 2 T o t a l   D e p t h i
where N o d e   C o u n t i represents the number of segments traversed from the chosen segment to all other segments, and T o t a l   D e p t h i is the shortest sum of angular distance to all other segments.
The choice index measures the likelihood of collective pedestrian movement through a segment, reflecting the accessibility of through-movement for the collective. Space syntax offers various analytical parameters for measuring street flow, with the angular-based choice and integration parameters used in this research being among the most frequently utilized for their superior analytical outcomes [35]. While streets primarily serve as conduits for movement, as vital public spaces within the city, their transformation directed towards activity destinations is becoming a significant trend in urban renewal, especially under the current conditions of increasingly scarce urban land resources. Therefore, these two parameters can be seen as complementary, representing pedestrian flow under different modes of travel [36]. Ultimately, by linking street segment values to sampling points and excluding outliers, 68,954 valid points were obtained. The data used in the study are presented in Table 1.
C h o i c e i = j = 1 n k = 1 n d j k i / d j k j < k
where d j k represents the shortest path from segment j to segment k, and d j k ( i ) represents the shortest path from segment j to segment k that includes segment i.

2.4. Bivariate Spatial Autocorrelation (BSA)

After obtaining street greenery and pedestrian flow indicators, to better explore the spatial association between these two indicators, this study conducted bivariate global and local spatial autocorrelation analyses following the procedures suggested by Anselin, Syabri, and Smirnov [37]. The Geoda software (version 1.22) was used to create a distance band-based spatial weight matrix, calculating high–high, high–low, low–high, and low–low spatial clustering patterns for in-depth analysis, a method widely applied in spatial correlation analysis of physical objects [38]. Previous studies have also used numerical rankings as a basis for clustering [23], although they did not consider the lag effect of adjacent spaces.
I = n j = 1 n k = 1 n w j k x j x ¯ y k y ¯ j = 1 n k = 1 n w j k j = 1 n x j x ¯ y j y ¯
where I is the bivariate global Moran’s I index, n is the total number of spatial units, w i j is the spatial weight matrix which determines the relationship of geographical units, x j and y k are the attributes of locations j and k , respectively, and x ¯ and y ¯ are the average values of x and y .
I i = α a i j = 1 n w i j α b j
α n i = X n i X ¯ n δ n
where I i is the local Moran’s I index at location i, n is the total number of spatial units, w i j is the spatial weight matrix, α n i is the standardized parameter, X n i is the observed value at location i, X ¯ n is the mean value of variable n, and δ n is the variance of variable n.

3. Results

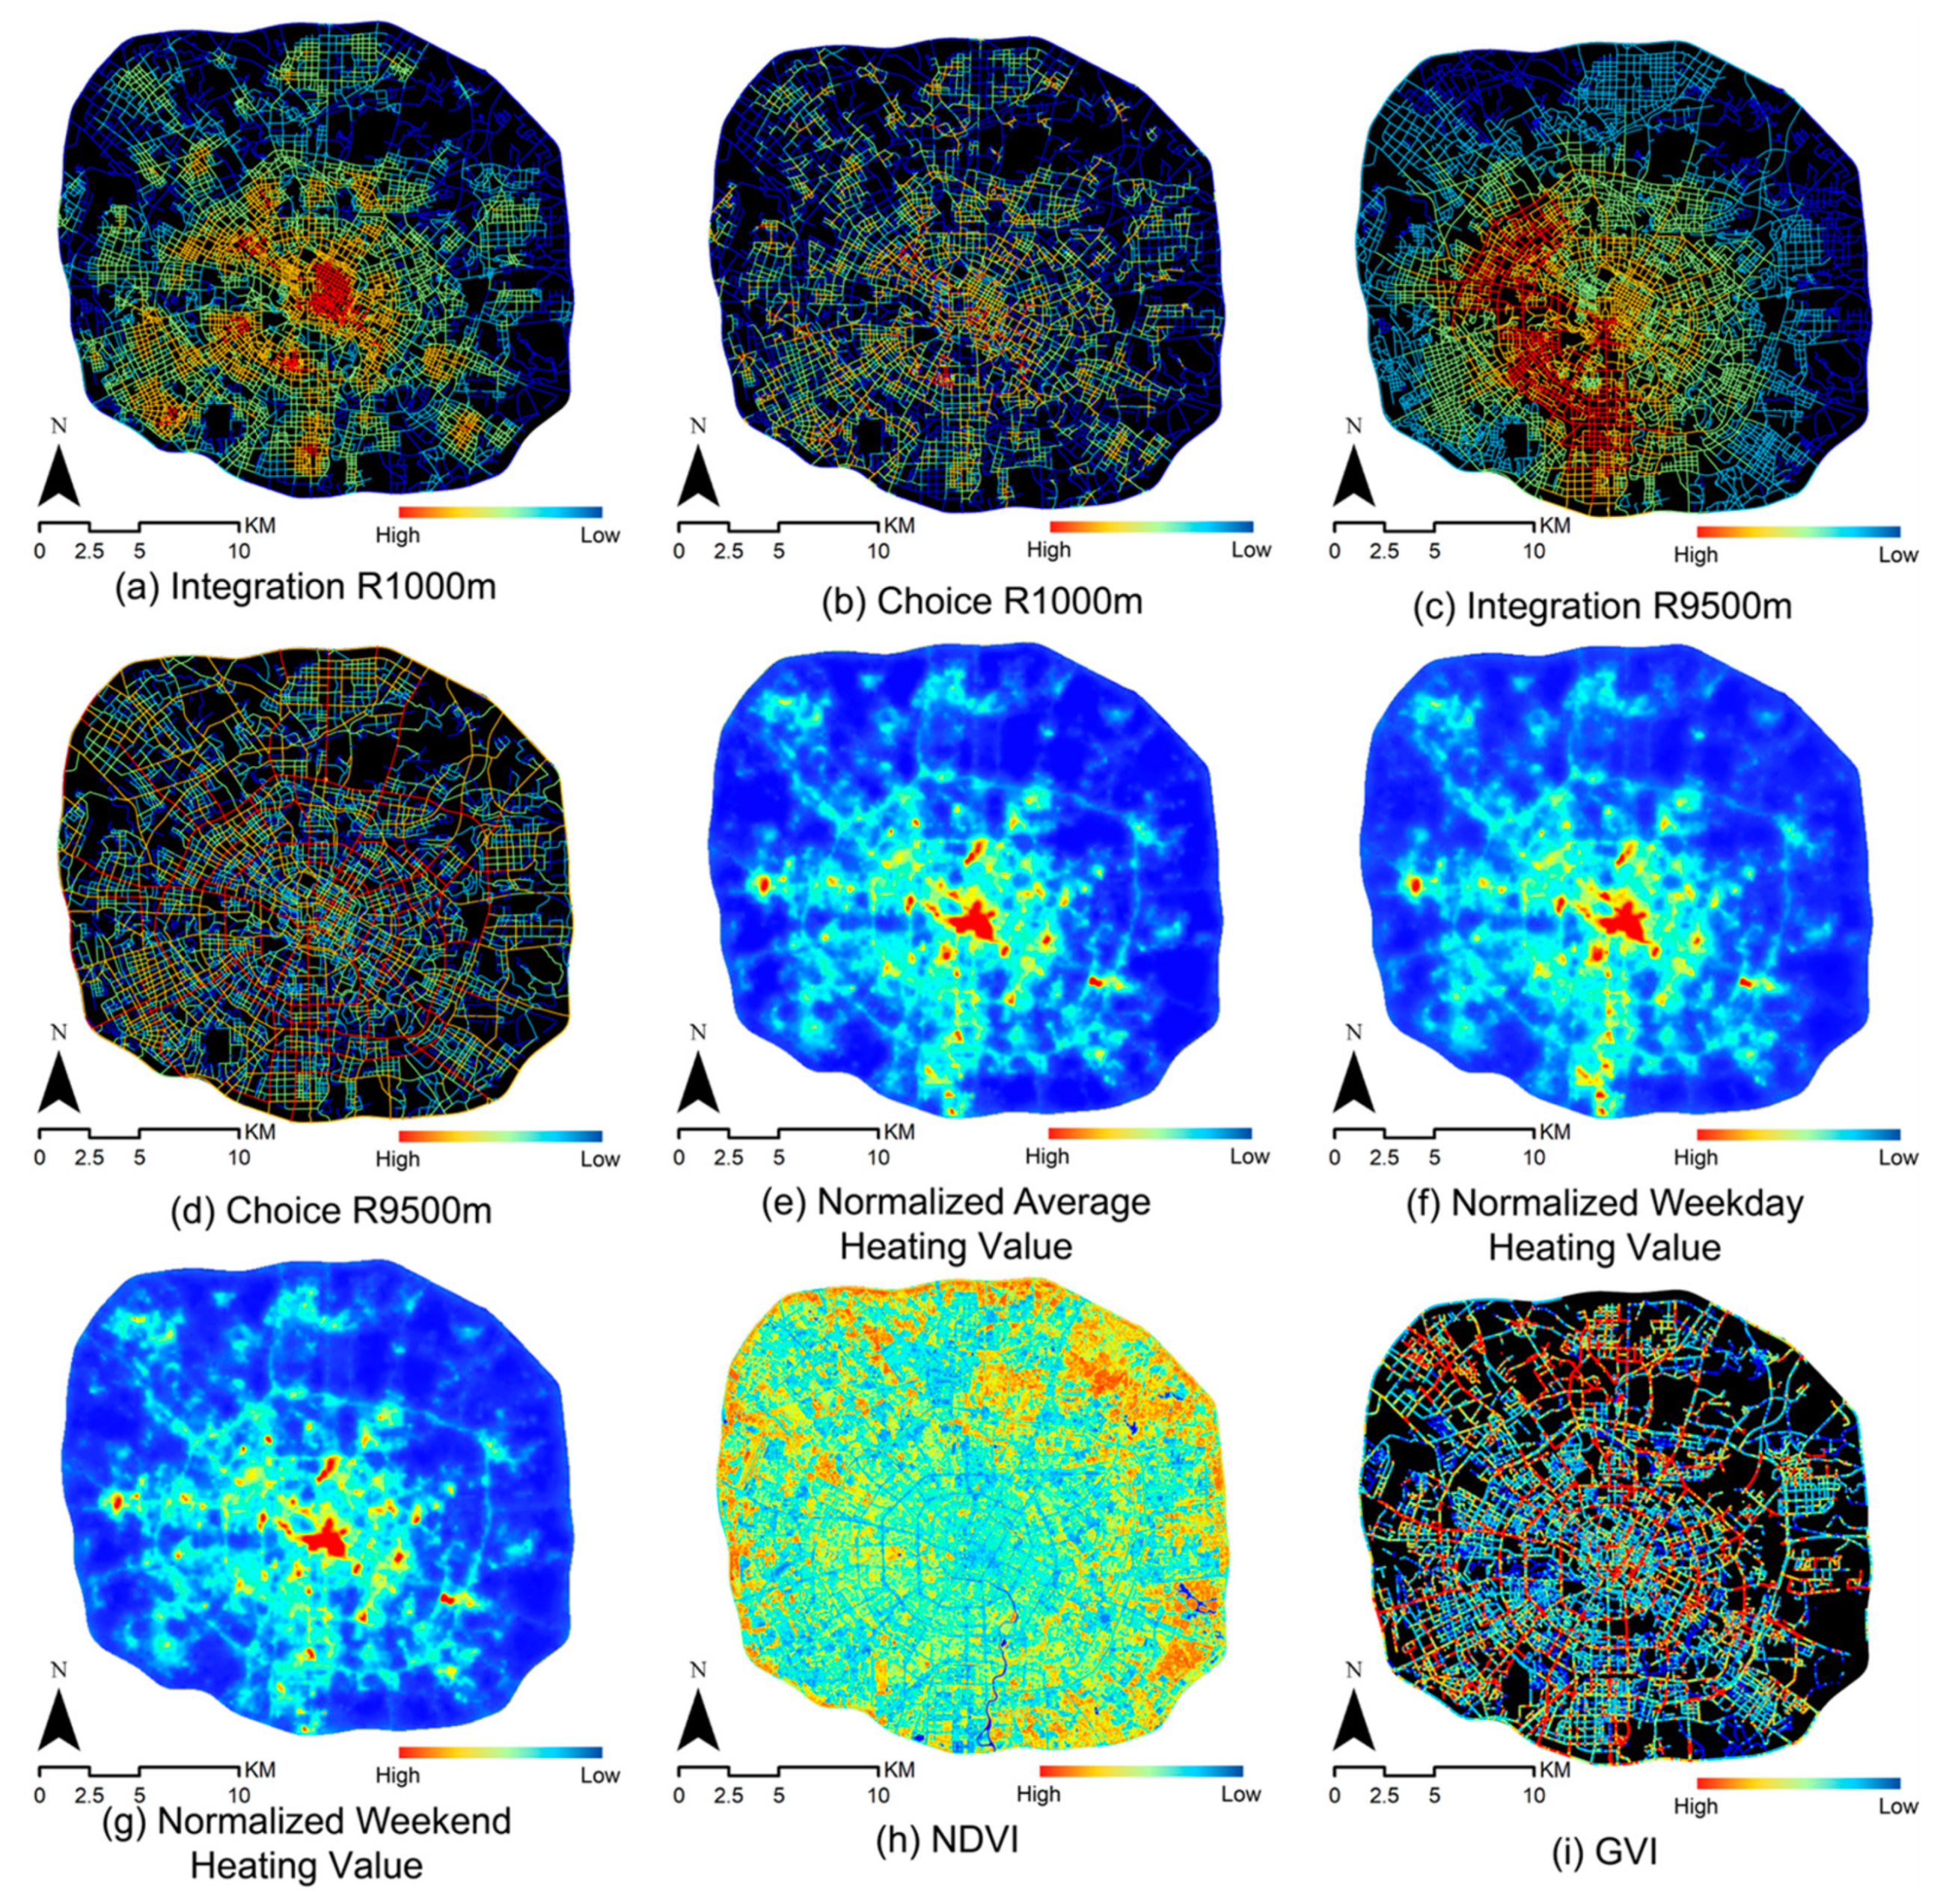
3.1. Spatial Heterogeneity of Different Indicators

Figure 4 displays the spatial distribution of nine calculated indicators in this study. A comparison between street integration and choice indices reveals a more concentrated distribution for integration, forming several peak areas within the city that effectively identify urban pedestrian centers likely to facilitate interaction, socialization, and even commerce [36]. Conversely, the choice index is more dispersed, better reflecting paths frequently traversed and known to locals, as these represent the shortest visual paths. The analysis at different scales shows that the 1000 m walking scale primarily reflects the local central areas, while the 9500 m commuting scale reflects the overall transportation hubs of the city. For instance, the commuting scale integration identified the southwestern areas of the city as dense work zones central to commuting activities, and the choice at the same scale identified key arterial roads and beltways as important commuting channels.
The differences between the weekday, weekend, and average heatmap values were notably significant in the southern part of the city along Tianfu Avenue, with higher values during workdays correlating with dense office distributions and a significant working population. Compared to the weekdays, the weekend heatmap values are more dispersed, with increased concentrations around residential clusters. However, all three exhibit a radiating pattern of decreasing thermal intensity from the city center towards the outskirts.
The spatial distribution of the urban greenery indicators shows lower central city NDVI values compared to higher peripheral values, especially around major transportation loops. The GVI distribution shows more specificity, with some rapid roads achieving high GVI values despite their features, and the overall distribution does not exhibit a clear centrifugal pattern. This is likely due to NDVI’s larger scale of measurement being easily influenced by surrounding buildings and water bodies. However, NDVI data retrieval and processing are relatively easier, allowing it to serve as an interpolative complement in areas where GVI is unobtainable.

3.2. Bivariate Global Spatial Distribution Characteristics

Table 2 presents the results of fourteen bivariate global spatial autocorrelation calculations. All the global Moran’s I index values are negative, indicating a widespread negative spatial autocorrelation between street flow and greenery, suggesting that areas with high GVI or NDVI values tend to neighbor areas with low choice indexes, integration indexes, and street heat. The highest global Moran’s I index value is found between the GVI and walking scale choice, indicating a suitable green environment for pedestrian activities in Chengdu. In contrast, the lowest value occurs between the NDVI and weekday heatmaps, highlighting the need for improved green coverage in office-dense areas. Additionally, the differences between the weekday and weekend analyses for the GVI and NDVI suggest the need for varied greenery strategies across different urban areas to support sustainable development. Furthermore, significant discrepancies between integration and choice suggest a combined analysis reflecting different travel modes is necessary. The commuting-scale matches outperform walking-scale ones, indicating future urban renewals should prioritize high-traffic pedestrian streets for enhanced accessible greenery.

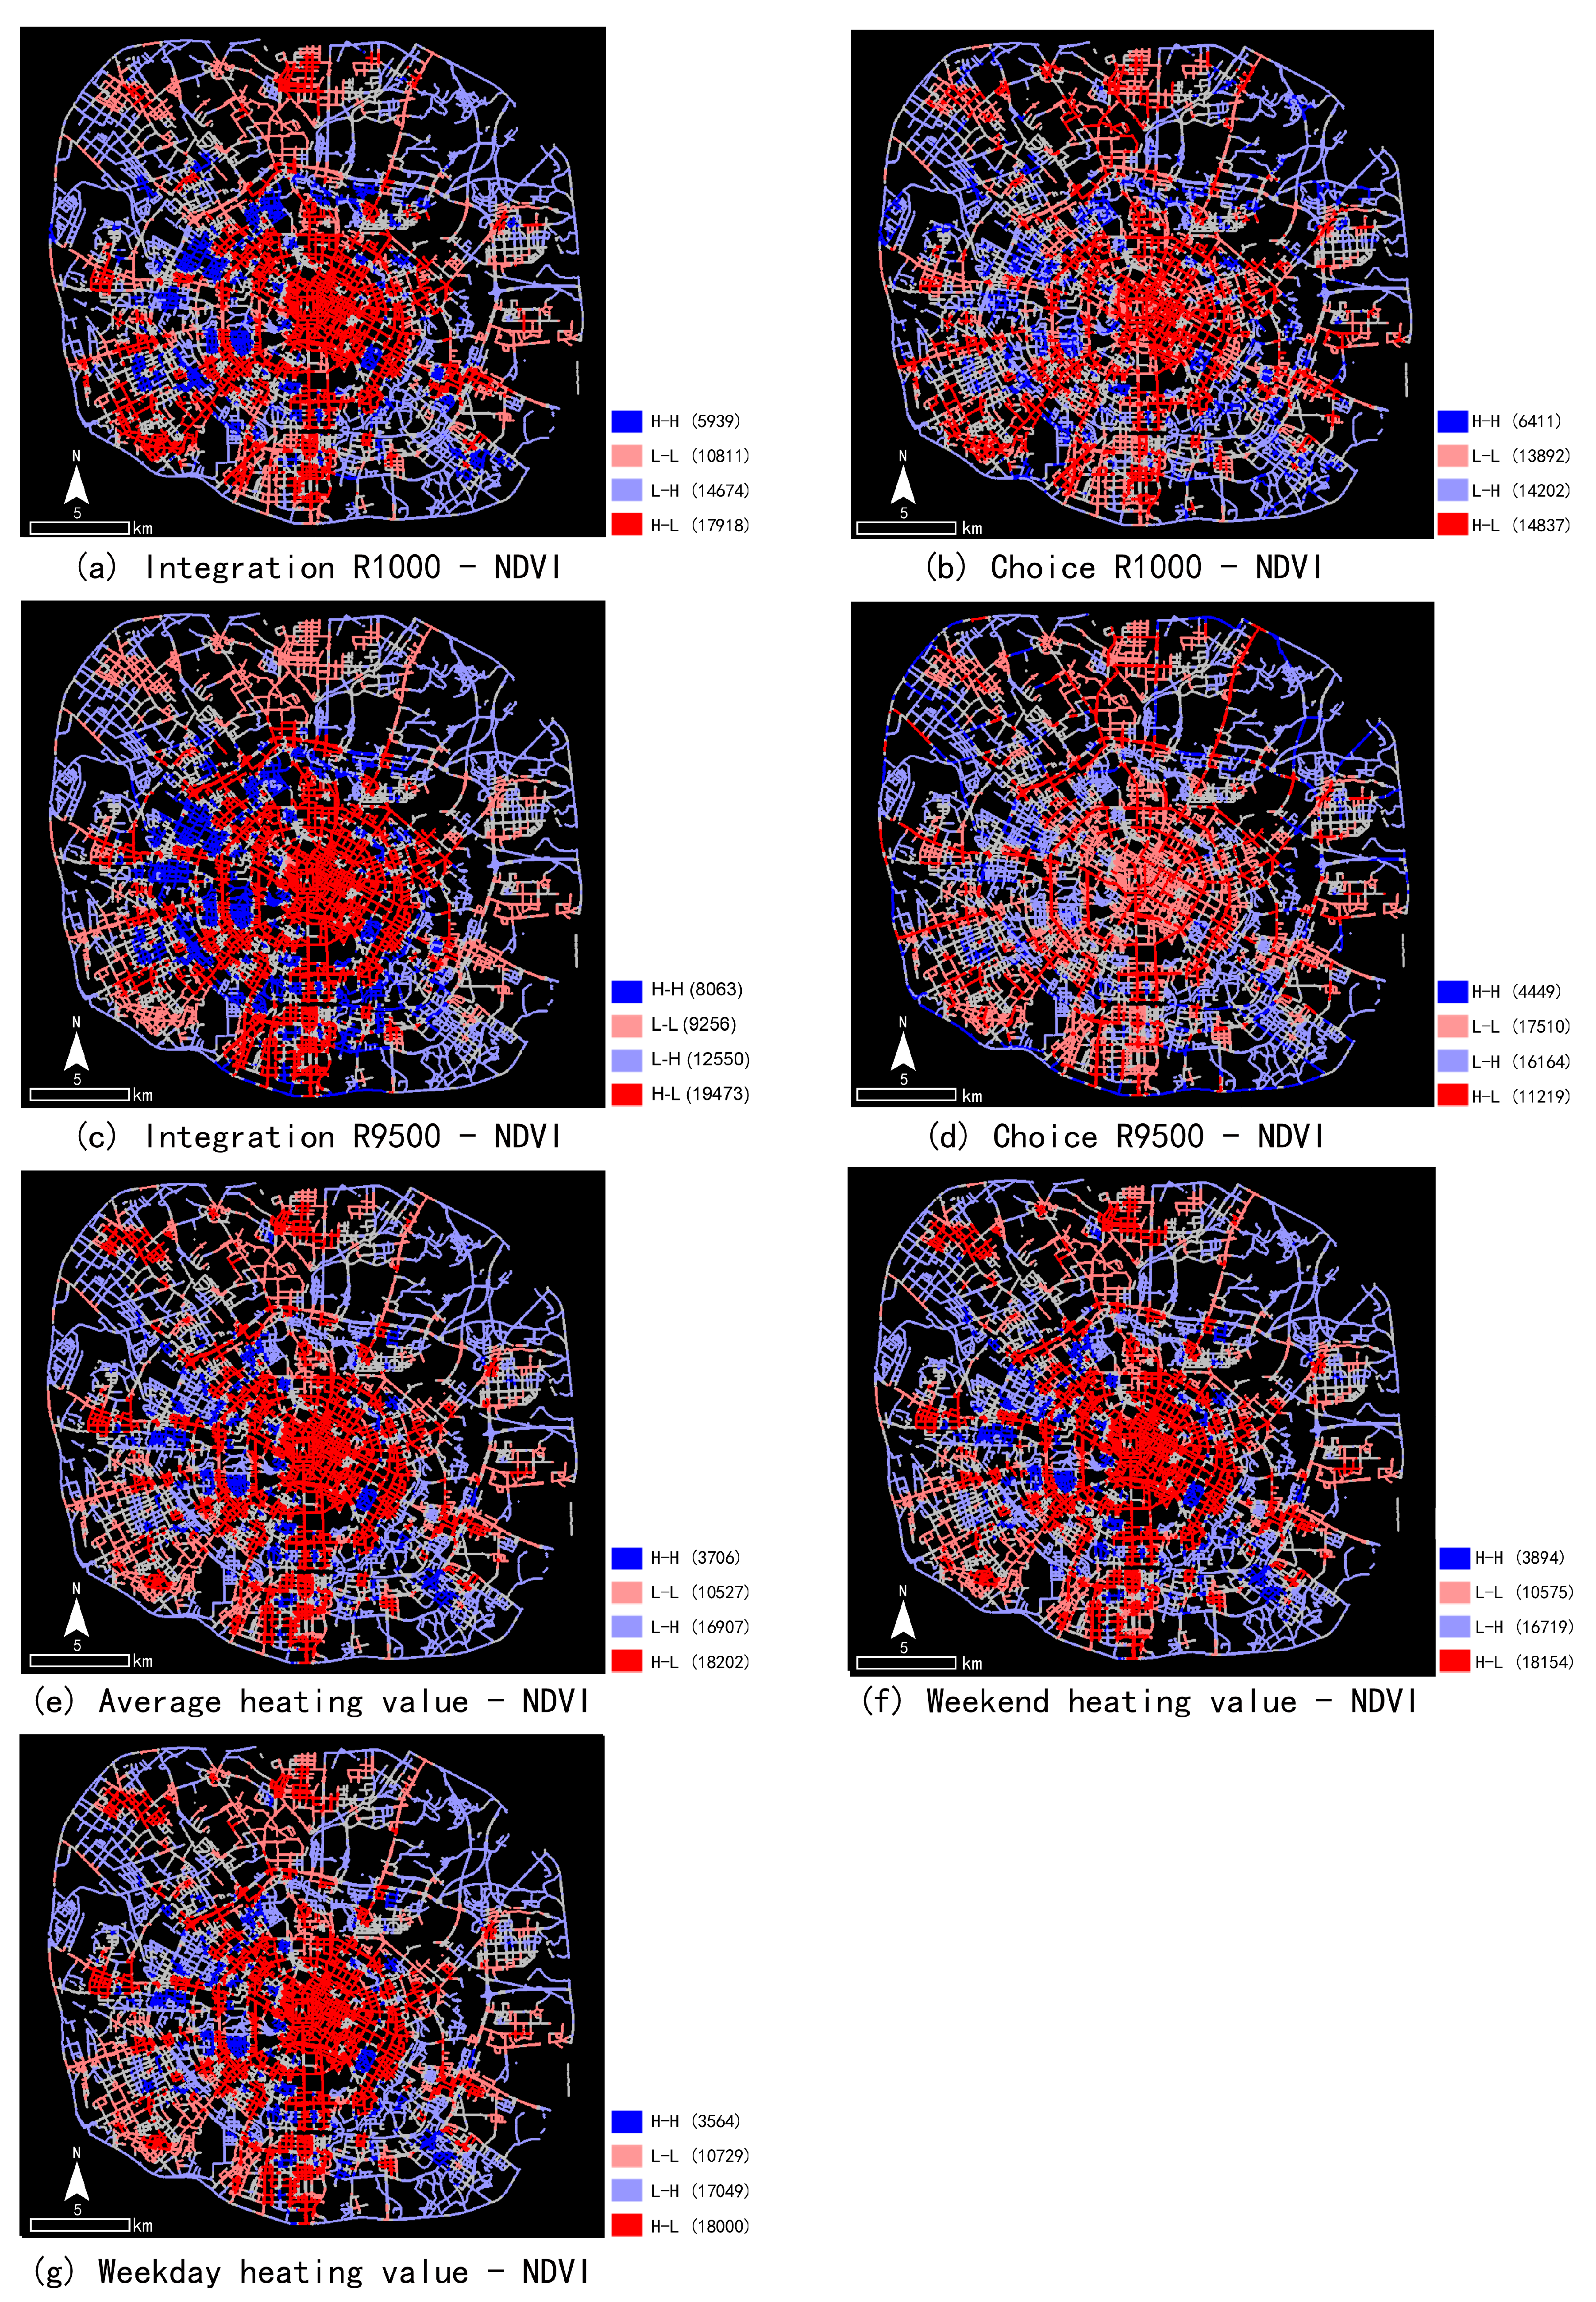
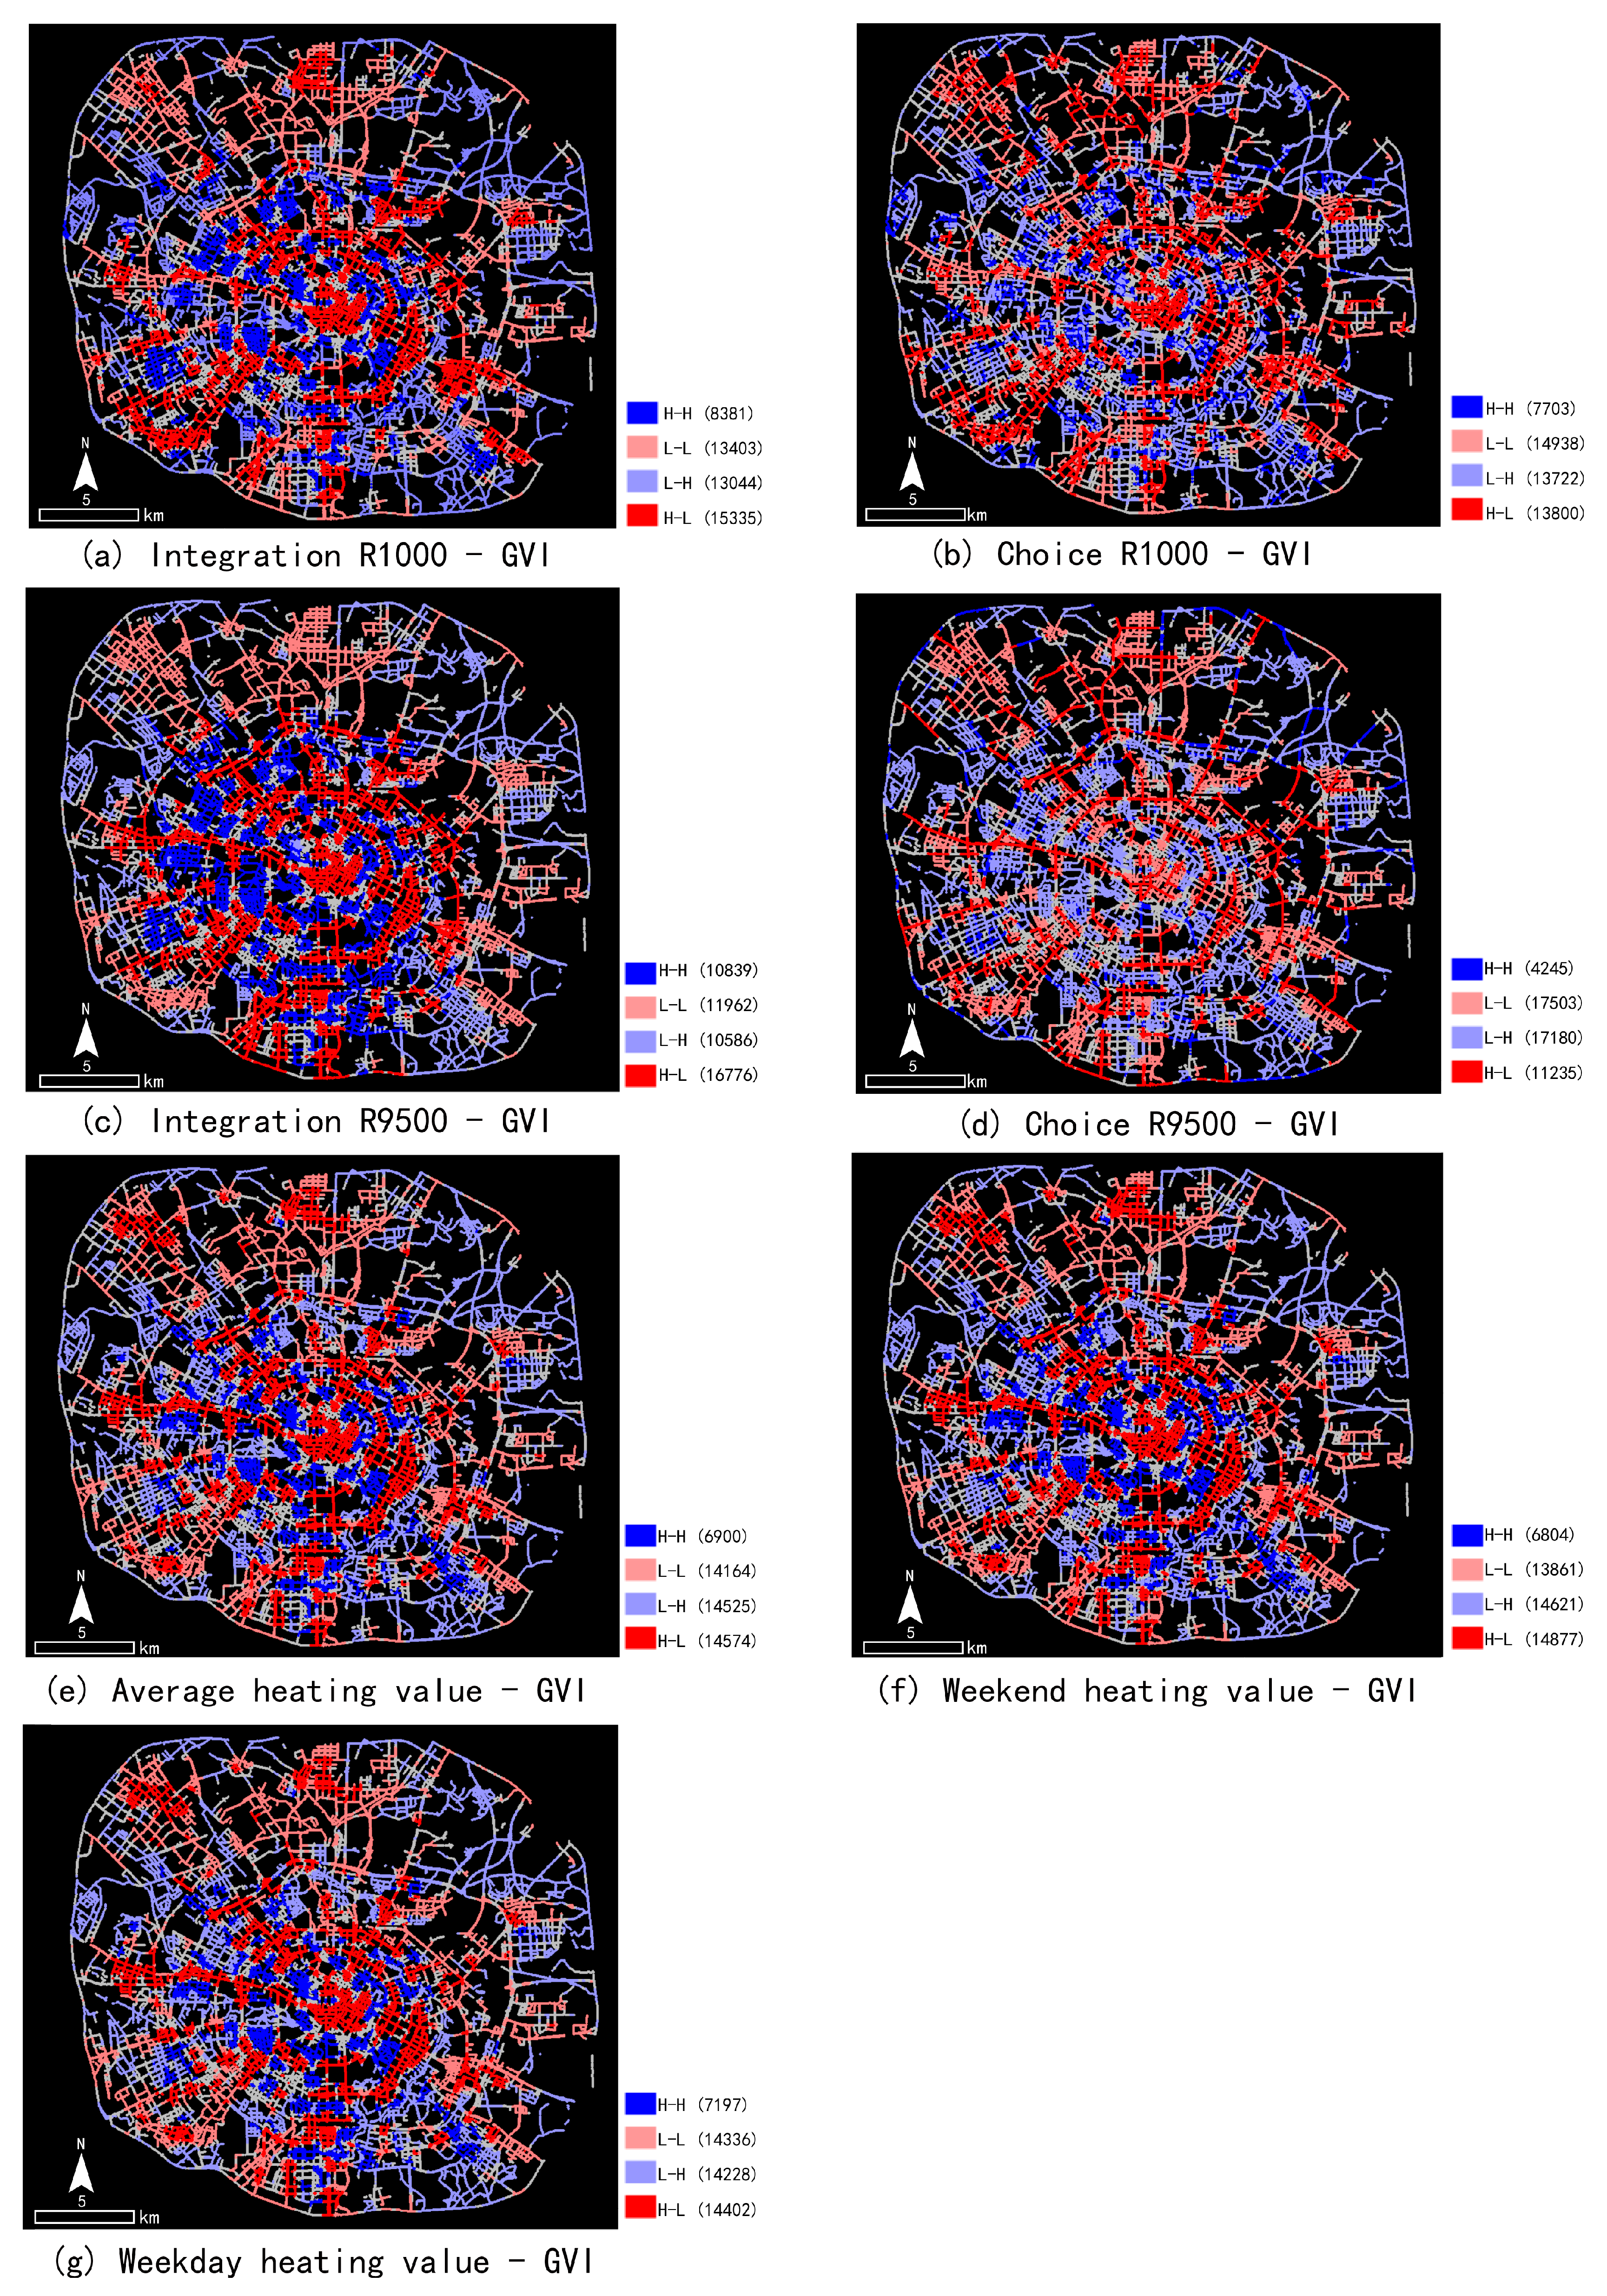
3.3. Bivariate Local Spatial Distribution Characteristics

This study conducted a bivariate local spatial autocorrelation analysis of seven different indicators representing street flow, alongside the GVI and NDVI for street greenery. The results across these indicators show a consistent overall structure, aligning with findings from previous research. Figure 5 depicts the entire study area, revealing a mismatch between the high pedestrian flow but low greenery in the city center regions and the low pedestrian flow but high greenery in the periphery. This misalignment between the street flow and greenery indicates that current street greening efforts are not adequately accessible to urban residents [14], also reflecting a disconnect between ecological flow and vitality flow within the city. In areas of high flow–high greenery and low flow–low greenery, a significant concentration is observed at the city center’s edge, suggesting spatial inequalities in the urban layout and public facility distribution.
The integration parameter tends to cluster more than the choice parameter, particularly in commuting scales where high flow–high greenery points are more numerous. This reveals streets that gather a wide range of vitality metrics were more focused on in past urban constructions and underscores the need for a network of walkable streets where people frequently travel, as a comprehensive pedestrian network offering a good walking experience is yet to be established [40]. Comparisons across different analytical scales show a more severe mismatch between street flow and greenery in the northern part of the city at the walking scale and in the southern part at the commuting scale, suggesting a need for finer urban renewal actions considering the primary travel modes of street users. The different analysis periods show a similar spatial distribution across four categories, but a slightly increased need for greenery optimization around residential areas during the weekends, indicating further improvements are needed for street greenery surrounding areas where weekend crowds concentrate. This research on urban street greenery and its dynamic utilization complements existing studies on the temporal differences in the use of urban park green spaces [27].
Comparing Figure 5 and Figure 6, the match between the GVI and street flow parameters is higher than that of the NDVI, especially in the city center areas where the NDVI values are lower than those of the GVI. This may be due to the NDVI’s larger calculation resolution being easily influenced by surrounding commercial buildings, making it less precise in representing street greenery. Therefore, using the GVI as a guide for urban street renewal and transformation is more accurate relative to the NDVI, consistent with the findings of previous research [41]. Table 3 compares the values of the NDVI and GVI between the city center and city periphery, showing that the NDVI values are significantly increased in the urban periphery compared to the city center. Additionally, this study selected a radius of 100 m for buffer zones centered on residential and commercial functional areas within the study region. This range was chosen because it represents a typical radius for frequent human activities [42]. The comparison results indicate that both the NDVI and GVI values are higher around residential areas, suggesting a better green environment compared to commercial areas. Similarly, the NDVI values show greater variation, indicating that the NDVI is less suitable for detailed urban renewal planning due to its changeability.
The calculation results also show that the heat distribution is more similar to the integration parameter results, possibly due to the influence of internal building equipment signals on the street heat maps, indicating that integration better reflects the city’s actual vitality, encompassing both pedestrian circulation and dwell times within the city. In contrast, the choice parameter supplements the daily use of streets by residents, suggesting the integration parameter should be used when identifying large-scale public streets, such as urban center commercial streets and civic activity plazas, for greenery transforming.

4. Discussion

4.1. Flow Perspective in Urban Design

Utilizing the concept of urban flow enhances our understanding of the relationship between street integration and the choice of space syntax. The choice index represents the frequency of street traffic, reflecting the planar aspect of urban flow, while the integration index signifies the accumulation of street traffic, reflecting the sectional aspect of urban flow. Thus, the results of the heatmap and integration parameters, both characterizing the sectional features of urban flow, exhibit similarities. This shows that consideration for different traffic characteristics corresponds to distinct travel modes: streets primarily used for transit should prioritize timely and adequate greening, whereas those used for gatherings should focus on esthetic and comfort enhancements in greening, in order to meet the 5D design standards of pedestrian greenway networks [43].

4.2. Temporal Mismatch in Urban Greenery

By incorporating weekday and weekend heat maps, this research compares the temporal differences in the spatial mismatch between street greenery and street pedestrian flow, suggesting vital points for greening construction in different urban functional areas. It was found that the spatial mismatch between street greenery and pedestrian flow is more severe during weekends, highlighting the necessity of enhancing greening near residential areas and shopping malls. This suggests that the planning of the overall urban greening system should differentiate targets for different functional areas. For example, in predominantly commercial or industrial urban areas, the focus should be on assessing the green coverage rate of surrounding streets, while in residential areas, the focus should be on the green view rate of the streets. Additionally, mobile greening methods such as greenery boxes could be used to dynamically adjust urban greening to achieve the optimal result under multiple objectives.

4.3. Guidance for Precise Urban Renewal

The detailed management of streets, tailored to the specific characteristics of different indicators and the intrinsic attributes of the streets themselves, is essential for guiding more precise urban renewal efforts. In this research area, there is a general spatial mismatch between street greenery and pedestrian flow. This mismatch occurs because urban green spaces are often designed to provide areas for leisure and relaxation rather than for efficient transit. Therefore, these areas may not be the preferred routes for pedestrians who have specific destinations and want to reach them quickly. Additionally, some rural green spaces, despite their good landscape and abundant vegetation, lack regular maintenance, which reduces the likelihood of pedestrians choosing these areas, as these areas often harbor potential for crime. This mismatch may also be due to the statistical time not covering all periods, leading to an underestimation of the actual pedestrian flow on streets. In future urban renewals, more attention should be paid to the streets frequently used by residents for greening construction, and there should be regular maintenance of green areas to increase people’s willingness to use these areas. Attention should also be given to the equitable distribution of resources within the city, especially by enhancing the quality of greenery and the accessibility of public facilities in peripheral areas. Urban peripheries often suffer from lower greenery and walkability due to land price factors, resulting in a concentration of low-greenery, low-accessibility sampling points in these areas.
Further urban studies should enhance the richness and accuracy of data, technical methods, and analytical frameworks. Consideration should be given to incorporating the surface data of urban green spaces, perceptible greenery within buildings, data on the functional points of buildings [44], subjective perception data [45], social evaluation data [46], and other indicators for a more accurate and in-depth analysis of the mismatch between greenery and street traffic. Additionally, combining demographic information such as the population composition of different blocks, average housing prices, and population density could further deepen the research on green justice in urban spaces.

5. Conclusions

This research utilized multi-source urban data, including open-source road networks, remote sensing images, street view data, and mobile signaling, which is often used for analyzing employment activity [47], to examine the spatial distribution differences between the street flow and greenery. It innovatively applied Baidu heat data in this research area, transforming previous static space syntax indicators used to represent pedestrian flow into dynamic ones. Additionally, building on the original focus on spatial distribution, this study incorporated a temporal variable, comparing the mismatch between the street greenery and street pedestrian flow on weekdays and weekends, and investigated the spatiotemporal mismatch between them.
This study discovered that the focus on greenery enhancement differs between weekdays and weekends; the GVI requires more attention during weekends when heatmap distributions indicate that people are concentrated in residential areas. Thus, there is a need to enhance perceptible greenery around communities to meet residents’ leisure needs, improving their satisfaction and wellbeing. During weekdays, the match between the green coverage indicators and population heatmaps is lower, suggesting an increase in the green space coverage around office areas to alleviate the severe urban heat island effect caused by concentrated land hardening. Although urban greenery is mostly static since trees and most plants cannot be easily moved or adjusted once planted, innovative mobile greenery could be implemented. On weekends, greenery could be placed around residential streets, and during weekdays, around office areas to optimize street greening maintenance schedules and frequencies, ensuring sufficient greenery and services are provided during peak flow times to enhance urban management efficiency and achieve balance between the supply and demand of public resources [48]. At the urban planning level, green recreational facilities could be strategically placed in areas of high weekend activity, with ecological buffer zones set around weekday work areas needing environmental stress relief, improving the overall rationality of urban greenery layouts. These findings highlight the distinction between green equity and green justice, suggesting that previous extensive research aimed at enhancing urban green equity may not necessarily improve urban green justice, as it often overlooks the actual needs of the residences.
This study found a negative correlation between the overall street flow and greenery, with significant spatial distribution differences between the city center and periphery. High flow–high greenery streets are concentrated in the city center, while low flow–low greenery streets are prevalent in the periphery, suggesting inequalities in the distribution of urban public resources. Existing research has already utilized methods such as the Gini coefficient to study the inequity of urban green spaces [22,49]. Therefore, future urban renewals should pay more attention to the equitable allocation of public resources. Moreover, urban developers should focus on enhancing the quality of streets with high pedestrian choice and connecting walkable streets with neighborhoods [8], as these have often been overlooked in previous large-scale constructions in favor of streets with high integration. This study’s integration parameters closely resemble the city’s heat distribution, viewing from the “urban flow” perspective; choice represents the planar distribution of the street pedestrian flow, while integration reflects the volumetric flow of street traffic. Hence, the dialectical relationship between street integration and choice should be utilized to create active points in the next urban setting. Comparing the commuting and walking perspectives, greening should be tailored to the primary mode of street use, with pollution- and dust-resistant plant species for vehicular streets to reduce urban environmental dust and esthetically pleasing plant species for pedestrian walking streets. The results indicate a current lack of accessible greenery for pedestrians.
Despite utilizing multi-source data for spatial analysis, this study has limitations, such as bias in the heat data due to its source from mobile signaling, capturing only devices with Baidu apps installed. This excludes users without smartphones, like the elderly and children, and those without Baidu apps, potentially causing data inaccuracies. Additionally, the resolution of data positioning means street heat can be influenced by signals from mobile users inside buildings, overestimating the actual heat flow on streets. Moreover, the Panoramic View Green View Index (PVGVI) can also be taken into consideration to achieve a more human-centered greenery measurement [4]. Similar to green spaces, the positive impact of urban blue spaces on physical and mental health has been documented, suggesting future research could incorporate urban blue space distribution data for a more comprehensive evaluation of the urban environment [13]. This study also found less “accessible green” for city residents on weekends compared to weekdays, with the weekend heatmaps showing a greater concentration in residential areas and less in work areas, indicating a need for further enhancement of perceivable greenery near residential streets in Chengdu. Considering most living and working hours are spent indoors, this study highlights the value of researching exterior perceptible greenery from within buildings. This study aims to promote more human-centered, high-quality urban renewal, creating a more sustainable green city.

Author Contributions

Conceptualization, Qicheng Ma and Jiaxin Zhang; methodology, Qicheng Ma, Jiaxin Zhang, and Yunqin Li; data curation, Qicheng Ma and Jiaxin Zhang; writing—original draft preparation, Qicheng Ma and Jiaxin Zhang; writing—review and editing, Qicheng Ma, Jiaxin Zhang, and Yunqin Li. All authors have read and agreed to the published version of the manuscript.

Funding

Key Research Base Program for Humanities and Social Sciences in Universities in Jiangxi Province: JD23003.

Data Availability Statement

Data are contained within the article.

Acknowledgments

We would like to thank the editors and anonymous reviewers for their constructive suggestions and comments, which helped improve this paper’s quality.

Conflicts of Interest

The authors declare no conflicts of interest.

References

  1. Wang, J.; Hu, Y.; Duolihong, W. Diagnosis and Planning Strategies for Quality of Urban Street Space Based on Street View Images. ISPRS Int. J. Geo-Inf. 2023, 12, 15. [Google Scholar] [CrossRef]
  2. Hasan, A.N.; Al-Khafaji, D.S.J. Integration of Intermodal Transport Stations as a Tool for Urban Renewal in the City of Baghdad. IOP Conf. Ser. Mater. Sci. Eng. 2021, 1067, 012030. [Google Scholar] [CrossRef]
  3. Ma, X.; Ma, C.; Wu, C.; Xi, Y.; Yang, R.; Peng, N.; Zhang, C.; Ren, F. Measuring human perceptions of streetscapes to better inform urban renewal: A perspective of scene semantic parsing. Cities 2021, 110, 103086. [Google Scholar] [CrossRef]
  4. Xia, Y.; Yabuki, N.; Fukuda, T. Development of a system for assessing the quality of urban street-level greenery using street view images and deep learning. Urban For. Urban Green. 2021, 59, 126995. [Google Scholar] [CrossRef]
  5. Wang, R.; Helbich, M.; Yao, Y.; Zhang, J.; Liu, P.; Yuan, Y.; Liu, Y. Urban greenery and mental wellbeing in adults: Cross-sectional mediation analyses on multiple pathways across different greenery measures. Environ. Res. 2019, 176, 108535. [Google Scholar] [CrossRef]
  6. Bain, L.; Gray, B.; Rodgers, D. Living Streets: Strategies for Crafting Public Space; Wiley: New York, NY, USA, 2012. [Google Scholar]
  7. Ananyeva, O.; Emmanuel, R. Street trees and Urban Heat Island in Glasgow: Mitigation through the ‘Avenues Programme’. Urban For. Urban Green 2023, 86, 128041. [Google Scholar] [CrossRef]
  8. Zhang, J.; Hu, A. Analyzing green view index and green view index best path using Google street view and deep learning. J. Comput. Des. Eng. 2022, 9, 2010–2023. [Google Scholar] [CrossRef]
  9. Tang, L.; He, M.; Li, X. Verification of Fractional Vegetation Coverage and NDVI of Desert Vegetation via UAVRS Technology. Remote Sens. 2020, 12, 1742. [Google Scholar] [CrossRef]
  10. Zhu, H.; Nan, X.; Yang, F.; Bao, Z. Utilizing the green view index to improve the urban street greenery index system: A statistical study using road patterns and vegetation structures as entry points. Landsc. Urban Plan. 2023, 237, 104780. [Google Scholar] [CrossRef]
  11. Meng, Y.; Xing, H.; Yuan, Y.; Wong, M.S.; Fan, K. Sensing urban poverty: From the perspective of human perception-based greenery and open-space landscapes. Comput. Environ. Urban Syst. 2020, 84, 101544. [Google Scholar] [CrossRef]
  12. Li, T.; Xu, H.; Sun, H. Spatial Patterns and Multi-Dimensional Impact Analysis of Urban Street Quality Perception under Multi-Source Data: A Case Study of Wuchang District in Wuhan, China. Appl. Sci. 2023, 13, 11740. [Google Scholar] [CrossRef]
  13. Helbich, M.; Yao, Y.; Liu, Y.; Zhang, J.; Liu, P.; Wang, R. Using deep learning to examine street view green and blue spaces and their associations with geriatric depression in Beijing, China. Environ. Int. 2019, 126, 107–117. [Google Scholar] [CrossRef] [PubMed]
  14. Yang, L.; Liu, J.; Liang, Y.; Lu, Y.; Yang, H. Spatially Varying Effects of Street Greenery on Walking Time of Older Adults. ISPRS Int. J. Geo-Inf. 2021, 10, 596. [Google Scholar] [CrossRef]
  15. Ye, Y.; Richards, D.; Lu, Y.; Song, X.; Zhuang, Y.; Zeng, W.; Zhong, T. Measuring daily accessed street greenery: A human-scale approach for informing better urban planning practices. Landsc. Urban Plan 2019, 191, 103434. [Google Scholar] [CrossRef]
  16. Yamu, C.; van Nes, A.; Garau, C. Bill Hillier’s Legacy: Space Syntax—A Synopsis of Basic Concepts, Measures, and Empirical Application. Sustainability 2021, 13, 3394. [Google Scholar] [CrossRef]
  17. Hillier, B.; Iida, S. Network and Psychological Effects in Urban Movement. In Proceedings of the Spatial Information Theory; Cohn, A.G., Mark, D.M., Eds.; Springer: Berlin/Heidelberg, Germany, 2005; pp. 475–490. [Google Scholar]
  18. Zhou, Q.; Zheng, Y. Research on the spatial layout optimization strategy of Huaihe Road Commercial Block in Hefei city based on space syntax theory. Front. Comput. Neurosci. 2023, 16, 1084279. [Google Scholar] [CrossRef] [PubMed]
  19. Yoo, C.; Lee, S. When Organic Urban Forms and Grid Systems Collide: Application of Space Syntax for Analyzing the Spatial Configuration of Barcelona, Spain. J. Asian Arch. Build. Eng. 2017, 16, 597–604. [Google Scholar] [CrossRef]
  20. Atakara, C.; Allahmoradi, M. Investigating the Urban Spatial Growth by Using Space Syntax and GIS—A Case Study of Famagusta City. ISPRS Int. J. Geo-Inf. 2021, 10, 638. [Google Scholar] [CrossRef]
  21. Zhang, J.; Hu, J.; Zhang, X.; Li, Y.; Huang, J. Towards a Fairer Green city: Measuring unfairness in daily accessible greenery in Chengdu’s central city. J. Asian Archit. Build. Eng. 2023, 1–20. [Google Scholar] [CrossRef]
  22. Huang, B.-X.; Chiou, S.-C.; Li, W.-Y. Accessibility and Street Network Characteristics of Urban Public Facility Spaces: Equity Research on Parks in Fuzhou City Based on GIS and Space Syntax Model. Sustainability 2020, 12, 3618. [Google Scholar] [CrossRef]
  23. Wang, L.; Han, X.; He, J.; Jung, T. Measuring residents’ perceptions of city streets to inform better street planning through deep learning and space syntax. ISPRS J. Photogramm. Remote Sens. 2022, 190, 215–230. [Google Scholar] [CrossRef]
  24. Tsai, M.-T.; Chang, H.-W. Contribution of Accessibility to Urban Resilience and Evacuation Planning Using Spatial Analysis. Int. J. Environ. Res. Public Health 2023, 20, 2913. [Google Scholar] [CrossRef] [PubMed]
  25. Zhang, F.; Ye, X. What Can We Learn from “Deviations” in Urban Science? In New Thinking in GIScience; Li, B., Shi, X., Zhu, A.-X., Wang, C., Lin, H., Eds.; Springer: Singapore, 2022; pp. 301–308. ISBN 978-981-19381-5-3. [Google Scholar]
  26. Kizilhan, T.; Kizilhan, S.B. The Rise of the Network Society-The Information Age: Economy, Society, and Culture. Contemp. Educ. Technol. 2016, 7, 277–280. [Google Scholar] [CrossRef] [PubMed]
  27. Dong, Q.; Cai, J.; Chen, S.; He, P.; Chen, X. Spatiotemporal Analysis of Urban Green Spatial Vitality and the Corresponding Influencing Factors: A Case Study of Chengdu, China. Land 2022, 11, 1820. [Google Scholar] [CrossRef]
  28. Zhang, S.; Zhang, W.; Wang, Y.; Zhao, X.; Song, P.; Tian, G.; Mayer, A.L. Comparing Human Activity Density and Green Space Supply Using the Baidu Heat Map in Zhengzhou, China. Sustainability 2020, 12, 7075. [Google Scholar] [CrossRef]
  29. Liu, Y.; Yang, D.; Timmermans, H.J.P.; de Vries, B. Simulating the effects of redesigned street-scale built environments on access/egress pedestrian flows to metro stations. Comput. Urban Sci. 2021, 1, 1–14. [Google Scholar] [CrossRef]
  30. Zhou, M.; Zhou, J. Structural change and spatial pattern of intentional travel groups: A case study of metro riders in Hong Kong. Appl. Geogr. 2023, 152, 102885. [Google Scholar] [CrossRef] [PubMed]
  31. Chen, L.; Huang, H.; Yao, D.; Yang, H.; Xu, S.; Liu, S. Construction of Urban Environmental Performance Evaluation System Based on Multivariate System Theory and Comparative Analysis: A Case Study of Chengdu-Chongqing Twin Cities, China. Int. J. Environ. Res. Public Health 2023, 20, 4515. [Google Scholar] [CrossRef] [PubMed]
  32. Li, Y.; Yabuki, N.; Fukuda, T. Exploring the association between street built environment and street vitality using deep learning methods. Sustain. Cities Soc. 2022, 79, 103656. [Google Scholar] [CrossRef]
  33. Labib, S.M.; Harris, A. The potentials of Sentinel-2 and LandSat-8 data in green infrastructure extraction, using object based image analysis (OBIA) method. Eur. J. Remote Sens. 2018, 51, 231–240. [Google Scholar] [CrossRef]
  34. Li, M.; Pan, J. Assessment of Influence Mechanisms of Built Environment on Street Vitality Using Multisource Spatial Data: A Case Study in Qingdao, China. Sustainability 2023, 15, 1518. [Google Scholar] [CrossRef]
  35. Sharmin, S.; Kamruzzaman, M. Meta-analysis of the relationships between space syntax measures and pedestrian movement. Transp. Rev. 2018, 38, 524–550. [Google Scholar] [CrossRef]
  36. Yang, C.; Qian, Z. Street network or functional attractors? Capturing pedestrian movement patterns and urban form with the integration of space syntax and MCDA. Urban Des. Int. 2023, 28, 3–18. [Google Scholar] [CrossRef]
  37. Anselin, L.; Syabri, I.; Smirno, O. Visualizing multivariate spatial correlation with dynamically linked Windows. In Proceedings of the CSISS Workshop on New Tools for Spatial Data Analysis, Santa Barbara, CA, USA, 10–11 May 2002. [Google Scholar]
  38. Teixeira De Oliveira, J.; Alves De Oliveira, R.; Milena Rojas Plazas, G.; Moreira Andrade, S.; França Da Cunha, F. Distribution and spatial autocorrelation of physical-water attributes of an Oxisol. Rev. Bras. Eng. Biossistemas 2023, 17, 1109. [Google Scholar] [CrossRef]
  39. Chen, Y.; Yue, W.; La Rosa, D. Which communities have better accessibility to green space? An investigation into environmental inequality using big data. Landsc. Urban Plan. 2020, 204, 103919. [Google Scholar] [CrossRef]
  40. Dong, L. Research on Quality Improvement and Reconstruction of Mixed-Function Urban Villages Based on Green View Index and Space Syntax. Sustain. Dev. 2021, 11, 531–539. [Google Scholar] [CrossRef]
  41. Gao, F.; Li, S.; Tan, Z.; Zhang, X.; Lai, Z.; Tan, Z. How Is Urban Greenness Spatially Associated with Dockless Bike Sharing Usage on Weekdays, Weekends, and Holidays? ISPRS Int. J. Geo-Inf. 2021, 10, 238. [Google Scholar] [CrossRef]
  42. Almanza, E.; Jerrett, M.; Dunton, G.; Seto, E.; Pentz, M.A. A study of community design, greenness, and physical activity in children using satellite, GPS and accelerometer data. Health Place 2012, 18, 46–54. [Google Scholar] [CrossRef] [PubMed]
  43. Tang, Z.; Ye, Y.; Jiang, Z.; Fu, C.; Huang, R.; Yao, D. A data-informed analytical approach to human-scale greenway planning: Integrating multi-sourced urban data with machine learning algorithms. Urban For. Urban Green 2020, 56, 126871. [Google Scholar] [CrossRef]
  44. Zhang, J.; Yu, Z.; Li, Y.; Wang, X. Uncovering Bias in Objective Mapping and Subjective Perception of Urban Building Functionality: A Machine Learning Approach to Urban Spatial Perception. Land 2023, 12, 1322. [Google Scholar] [CrossRef]
  45. Li, Y.; Yabuki, N.; Fukuda, T.; Zhang, J. A big data evaluation of urban street walkability using deep learning and environmental sensors-a case study around Osaka University Suita campus. In Proceedings of the 38th eCAADe Conference: Anthropologic: Architecture and Fabrication in the Cognitive Age, Berlin, Germany, 16–17 September 2020. [Google Scholar]
  46. Zhang, F.; Zu, J.; Hu, M.; Zhu, D.; Kang, Y.; Gao, S.; Zhang, Y.; Huang, Z. Uncovering inconspicuous places using social media check-ins and street view images. Comput. Environ. Urban Syst. 2020, 81, 101478. [Google Scholar] [CrossRef]
  47. Zhou, X.; Lang, W.; Yeh, A.G.; Niu, X. Understanding the compactness of employment activities in high-density cities through cellphone location data. Environ. Plan. B Urban Anal. City Sci. 2021, 48, 1398–1413. [Google Scholar] [CrossRef]
  48. Ren, Q.; Ni, J.; Li, H.; Mao, G.; Hsu, W.-L.; Yang, J. Analysis on Spatial Characteristics of Supply–Demand Relationship of Amenities in Expanding Central Urban Areas—A Case Study of Huai’an, China. Land 2022, 11, 1137. [Google Scholar] [CrossRef]
  49. Xiao, C.; Shi, Q.; Gu, C.-J. Assessing the Spatial Distribution Pattern of Street Greenery and Its Relationship with Socioeconomic Status and the Built Environment in Shanghai, China. Land 2021, 10, 871. [Google Scholar] [CrossRef]
Figure 1. Research framework for the present study.
Ijgi 13 00254 g001
Figure 2. Overview of the study area: (a) location of Chengdu, (b) location of Chengdu’s central urban district, (c) the elevation of Chengdu’s central urban district.
Ijgi 13 00254 g002
Figure 3. GVI calculating process: (a) an example of street view image acquisition, (b) different calculation results using semantic segmentation.
Ijgi 13 00254 g003
Figure 4. Spatial distribution of research data.
Ijgi 13 00254 g004
Figure 5. NDVI-related bivariate local spatial autocorrelation. The numbers in the legend represent the number of points for each high and low clustering result.
Ijgi 13 00254 g005
Figure 6. GVI-related bivariate local spatial autocorrelation. The numbers in the legend represent the number of points for each high and low clustering result.
Ijgi 13 00254 g006
Table 1. Summary of the data used in the study.
CategoryIndicatorData SourceDescription and Method
Research preparation dataRoad network dataOpenStreetMap (OSM)Linear data for road network; pre-processing
Area of Interest (AOI)Baidu mapPolygons of different functional areas; pre-processing
Street greenery indicatorGreen View Index (GVI)Baidu street mapStreet view images at 69,649 sampling points; semantic segmentation
Normalized Difference Vegetation Index (NDVI)Geospatial data cloud platformSatellite remote sensing images (Landsat8); NDVI calculation
Street pedestrian flow IndicatorHeatmap valueBaidu Huiyan population location dataHourly heatmaps for 23, 26 August 2023; Kriging interpolation
Integration indexSpace syntax analysisCentrality within the street network; calculated for 1000 m and 9500 m radii
Choice indexSpace syntax analysisLikelihood of pedestrian movement through a segment; calculated for 1000 m and 9500 m radii
Table 2. Bivariate global Moran’s I index (BGMI) spatial autocorrelation analysis. The Moran’s I index ranges from −1 to 1, with positive values indicating positive spatial correlation between the bivariate, and negative values indicating negative spatial correlation between the bivariate [39].
Variable BGMIp-Value
GVI vs. Integration R1000−0.112 0.001 *
GVI vs. Choice R1000−0.073 0.001 *
GVI vs. Integration R9500−0.093 0.001*
GVI vs. Choice R9500−0.098 0.001 *
GVI vs. Average heatmap−0.145 0.001 *
GVI vs. Weekday heatmap−0.140 0.001 *
GVI vs. Weekend heatmap−0.146 0.001 *
NDVI vs. Integration R1000−0.210 0.001 *
NDVI vs. Choice R1000−0.127 0.001 *
NDVI vs. Integration R9500−0.183 0.001 *
NDVI vs. Choice R9500−0.097 0.001 *
NDVI vs. Average heatmap−0.238 0.001 *
NDVI vs. Weekday heatmap−0.244 0.001 *
NDVI vs. Weekend heatmap−0.226 0.001 *
*: 5% level of significance.
Table 3. Comparison of NDVI and GVI value distribution in different areas of the study region.
AreaAverage NDVIVariance NDVIMax NDVIMin NDVIAverage GVIVariance GVIMax GVIMin GVI
City center0.020.020.62−0.510.220.020.710.01
City periphery0.110.030.68−0.470.230.020.910.01
Residential areas0.080.030.68−0.510.210.020.920.01
Commercial areas0.040.030.67−0.510.200.020.920.01
Disclaimer/Publisher’s Note: The statements, opinions and data contained in all publications are solely those of the individual author(s) and contributor(s) and not of MDPI and/or the editor(s). MDPI and/or the editor(s) disclaim responsibility for any injury to people or property resulting from any ideas, methods, instructions or products referred to in the content.

