Article

Enhancing Place Emotion Analysis with Multi-View Emotion Recognition from Geo-Tagged Photos: A Global Tourist Attraction Perspective

1
School of Geography and Information Engineering, China University of Geosciences, Wuhan 430078, China
2
School of Computer Science, China University of Geosciences, Wuhan 430078, China
3
National Engineering Research Center for Geographic Information System, Wuhan 430078, China
*
Author to whom correspondence should be addressed.
ISPRS Int. J. Geo-Inf. 2024, 13(7), 256; https://doi.org/10.3390/ijgi13070256
Submission received: 2 April 2024 / Revised: 5 July 2024 / Accepted: 12 July 2024 / Published: 16 July 2024
(This article belongs to the Topic Geocomputation and Artificial Intelligence for Mapping)

Abstract

:
User-generated geo-tagged photos (UGPs) have emerged as a valuable tool for analyzing large-scale tourist place emotions with unprecedented detail. This process involves extracting and analyzing human emotions associated with specific locations. However, previous studies have been limited to analyzing individual faces in the UGPs. This approach falls short of representing the contextual scene characteristics, such as environmental elements and overall scene context, which may contain implicit emotional knowledge. To address this issue, we propose an innovative computational framework for global tourist place emotion analysis leveraging UGPs. Specifically, we first introduce a Multi-view Graph Fusion Network (M-GFN) to effectively recognize multi-view emotions from UGPs, considering crowd emotions and scene implicit sentiment. After that, we designed an attraction-specific emotion index (AEI) to quantitatively measure place emotions based on the identified multi-view emotions at various tourist attractions with place types. Complementing the AEI, we employ the emotion intensity index (EII) and Pearson correlation coefficient (PCC) to deepen the exploration of the association between attraction types and place emotions. The synergy of AEI, EII, and PCC allows comprehensive attraction-specific place emotion extraction, enhancing the overall quality of tourist place emotion analysis. Extensive experiments demonstrate that our framework enhances existing place emotion analysis methods, and the M-GFN outperforms state-of-the-art emotion recognition methods. Our framework can be adapted for various geo-emotion analysis tasks, like recognizing and regulating workplace emotions, underscoring the intrinsic link between emotions and geographic contexts.

1. Introduction

Place emotions play a pivotal role in shaping human interactions with the environment [1]. Place emotion analysis involves extracting and analyzing human emotions associated with specific locations, allowing us to obtain a wealth of information about scenes, human emotions, behaviors, and their interconnections [2]. Recently, growing interest in this area has been evident, with research focusing on emotional geography and environment perception, such as quantifying park perceptions [3] and analyzing how the forest environment promotes the feelings of people [4]. Moreover, the intersection of intelligent emotion computing and geography in analyzing tourist place emotions has significant implications for tourist behaviors and scenic transformations [5,6].
In recent years, thanks to the advancement of social media, big data technology and emotion recognition [7,8], a sizable quantity of geo-tagged texts and user-generated geo-tagged photos (UGPs) on social networking sites (SNSs) [9] have provided extensive data support for place emotion analysis [10]. UGPs, as opposed to text data, provide a more objective and comprehensive view of emotions, such as facial expressions [11], human behaviors [12], and scene environments [13], without geographical variations, offering a broader perspective for studying emotional aspects worldwide. Consequently, there has been a surge in studies using UGPs to analyze place emotions at different geographic locations. For instance, [14] extracted smiling expressions from photos to describe worldwide geographic emotion patterns. And [15] categorized facial expressions from social media to study city emotion distribution and inter-city emotional similarities. The aforementioned studies offer a foundational theoretical framework for comprehending human emotions in place emotion analysis.
Despite the progress, current methods still pose two-fold challenges. Firstly, the existing methods mainly focus on extracting place emotions through off-the-shelf facial expression recognition (FER) technologies [16,17], overlooking the influence of human emotion relations in crowds, which are crucial for understanding individual behaviors. For instance, a laughing person in a serious parade does not change the overall serious mood. Current FER methods focus on individual faces, especially with posed expressions at tourist sites, often resulting in inaccurate emotion analysis. Secondly, they often neglect geographic and environmental contexts, such as natural landscapes and architectural designs, which are pivotal in determining human emotional responses [18]. Neglecting these factors may create an emotional gap in understanding scene emotions and hinder accurate analysis of place emotions [19].
To address the limitations of existing place emotion analysis methods, we propose an innovative computational framework for analyzing tourist place emotions leveraging UGPs. This framework mitigates the emotional gap by identifying multi-view emotions and understanding attraction-specific types. Through this, our framework offers a more holistic and accurate exploration of affective information, effectively addressing the gap in traditional methods. The primary contributions of this study are the following:
(1) We introduce a unique framework for analyzing tourist place emotions from user-generated photos (UGPs) globally, combining multi-view emotions and attraction types for a thorough emotion analysis at tourist sites;
(2) Our novel M-GFN model goes beyond just facial expressions in UGPs, capturing multi-view emotions, thus suppressing the emotional gap from individual expressions. We also create a new attraction-specific emotion index (AEI) for better emotion analysis in tourism;
(3) To validate our framework’s effectiveness and explore the differences and commonalities in place emotions across attraction types, we collected a global dataset of tourist place emotions, called TPE.

2. Related Work

2.1. Place Emotion Extraction

Existing place emotion analysis approaches are categorized into survey-based, natural language processing (NLP)-based, and FER-based methods. Compared with survey- and NLP-based methods, FER-based methods are more practical and objective for automatic place emotion analysis from large-scale UGPs. This section focuses on FER-based methods for analyzing place emotion from UGPs.
FER-based methods extract human emotions from facial expressions, offering advantages of worldwide universality and consistency across cultures for objective emotion analysis, including emotion extraction and analysis [15]. With abundant geo-tagged SNS photos and the achievements of deep learning [20,21,22], FER allows efficient, large-scale place emotion analysis. For instance, Li et al. [23] extracted human emotions from facial expressions in Flickr photos and mapped the global geographic distribution of human emotion. Svoray et al. [24] utilized Microsoft Emotion API, another FER-based tool, to detect smiles from Flickr photos, exploring human–environment emotion interactions. Despite the potential advantages of FER-based methods for place emotion analysis from UGPs, it is still challenging to directly apply the FER approaches to place emotion extraction. Primarily, existing methods with FER technologies tend to focus on individual facial expressions, often overlooking the posed expressions commonly found in settings like social media [25]. Such expressions might not authentically represent the genuine emotions of individuals. Beyond individual expressions, the mood of a place is largely shaped by crowd behaviors, as well as key scene contextual environmental information like local scene objects, natural landscapes, and weather conditions [26]. However, these crucial aspects are frequently ignored with FER-based methods.
Given these challenges, a holistic framework that integrates individual facial expressions with crowd dynamics and the overarching scene context is imperative for an accurate and comprehensive place emotion analysis.

2.2. Place Emotions in Tourism

Place emotions are tied to place types, influenced by their historical, cultural, or environmental aspects [27]. Different settings, like natural parks and historic monuments, evoke unique emotions [28]. This emotion–place connection is vital for place design to enhance visitor experiences [29].
Building on this idea, emotion is increasingly important in tourism research, as it is essential for tourist experiences [30]. The rise of social media platforms, such as Instagram and Flickr, allows travelers to express and share their emotions during travels. In light of this, Cheung et al. [31] studied the effect of social media-based destination brands on tourist emotions. Mehra et al. [32] used sentiment and emotion analysis to predict tourist behaviors from user-generated comments. Jiang et al. [33] constructed an emotional map of visitors based on emotional experiences and time–space dynamics within attractions.
Despite the importance of emotions in tourism research, there is still a research gap in analyzing the macro emotions of attractions, especially the correlation between different attraction types and place emotions. Different attraction types—natural landscapes or cultural landmarks—likely evoke different emotional responses. Despite this understanding, studies on how specific attraction types affect visitor emotions are still limited. Such an investigation is crucial, as it bridges a significant knowledge gap and thoroughly examines why different attraction types elicit distinct emotions. Filling this gap will provide valuable insights to help optimize tourist experiences and services for specific attractions.

3. Methodology

3.1. Study Area and Datasets

In this section, we first introduce the selected study areas for tourist place emotion analysis and then describe the emotion database used in this study in detail.

3.1.1. Study Areas

In order to mine the emotions of tourist places, 157 unique tourist attractions worldwide were selected for this study. These tourist sites span 38 nations across six continents, encompassing various cultures, place types, regional differences, and natural styles. Figure 1 depicts the distribution of our selected tourist attractions across the world’s continents. The specific distribution is as follows: 56 sites in Europe, 49 in Asia, 23 in North America, 12 in Oceania, 11 in South America, and 6 in Africa.

3.1.2. Datasets

We collected and established a large-scale, geo-tagged tourist place emotion dataset called TPE. TPE offers three types of annotations: scene sentiment category, geo-tagged information, and attraction type. The pipeline of data collection and processing for TPE is shown in Figure 2.
Data collection. We developed a crawler to collect over 100,000 user-generated photos (UGPs) with the .jpg format from Flickr and Weibo, using tourist attractions’ names and coordinates obtained via the Google Geocoding API (https://developers.google.cn/maps/documentation/geocoding/overview),accessed on 1 September 2020. These UGPs come from 38 countries from 6 continents and cover 157 tourist attractions from January 2001 to November 2020. We ensured diversity by collecting at least 1000 images within a 1 km radius of each attraction, prioritizing those rich in human presence and sentiment.
Data cleaning. With the UGPs and the corresponding geo-tagged coordinates, we cleaned the data in both automatic and manual mode. Firstly, we deleted photographs farther than one kilometer from the center of each attraction site. Then, a face detector was employed to detect and save photos with human faces. Thirdly, we manually removed the unqualified data with issues like occlusion (images where key features such as faces were obstructed, either partially or fully), low-resolution (images that did not meet our resolution threshold (e.g., at least 400p) were removed to ensure that all data used could support accurate facial emotion analysis), mis-detected faces (images where the algorithm incorrectly identified non-face objects as faces were carefully removed to maintain data quality), and so on, and finally obtained 85,022 UGPs with 233,898 faces from various global attractions.
Data annotation. Annotating such a sizeable database is challenging and time-consuming. Unlike other databases that only provide basic expression categories, our database offers three kinds of annotations for UGPs: the scene sentiment category, geo-tagged information, and attraction type. The geo-tagged information consists of the attraction names and the geo-tagged coordinates collected from Google Geocoding API. Figure 3 shows a few cases with compound annotations in our dataset. These three annotations are designed to comprehensively capture the emotional and contextual aspects of the tourist experiences depicted in the images.
For scene sentiment category annotation, we sampled over 15,000 images from the collected emotion images as an annotated TEP subset. To ensure the professionalism of the annotation, we employed five emotional knowledge-trained annotators and developed a software called Expression Label Tool to facilitate efficient annotation. Each UGP in the annotated TEP subset has five working independent annotators. Referring to [34], the UGPs were categorized as positive, neutral, or negative, which reflects the primary emotional responses to the location. For challenging neutral annotation, we rely on simple indicators such as calm facial expressions, scenes without much movement or bright colors, and scenes where people are dressed normally and not interacting much. For positive and negative annotation, we utilize clear emotional expressions and contextual cues: positive emotions are marked by smiles, vibrant colors, and lively interactions, while negative emotions are identified by frowns, dull colors, and signs of stress or conflict. A UGP was kept if most annotators agreed on its category; otherwise, it was discarded for annotation reliability. With a Kappa coefficient [35] of 0.78 indicating high consistency, we finalized a subset of 10,034 UGPs.
For geotagged information annotation, each photo in a tourist attraction is annotated with precise geographical coordinates and the name of the attraction, facilitating spatial analysis and correlation with specific locations. This subset was then split into training (8068 images) and testing (1966 images) sets, following existing scene sentiment dataset standards.
For attraction type annotation, 157 tourist attractions were categorized into 4 main categories with 15 fine-grained types according to types of attractions listed on Google Travel (https://www.google.com/travel/), Tourism Teacher (https://tourismteacher.com/), and the Classification of Tourist Attractions Group Standards, issued by the China Association of tourist sites on 15 November 2019. Table 1 provides descriptions of the coarse- and fine-grained attraction categories. Inspired by [36], a tourist attraction can be classified into one or multiple types. Like Machu Picchu, it may fit multiple categories (e.g., historical site and cultural heritage). Figure 4 presents the number of UGPs and faces under each tourist attraction type. The type of tourist attraction provides a contextual environment that helps with the analysis of the emotional response to different settings.
In all, we obtain a dataset with broad geographical coverage and cultural diversity, and Table 2 shows a summary of tourist attractions across different global regions, categorized by the number of attractions, the number of countries each region encompasses, and the variety of attraction types available in each region.

3.2. Overview

In this section, we present an overview of the proposed tourist place emotion analysis framework for accurate tourist place emotion extraction and analysis around the world, illustrated in Figure 5. The framework contains two main stages: multi-view emotion recognition and attraction-specific place emotion extraction. Particularly, in the first stage, to alleviate the gap between facial expressions and place emotions, we employ the Multi-view Graph Fusion Network (M-GFN) to effectively extract and identify multi-view emotions, including crowd emotions and scene implicit sentiments. In the second stage, with the recognized crowd emotions and scene sentiments from UGPs of different attractions, we design the novel attraction emotion index (AEI), alongside existing indices, the emotion intensity index [2] (EII) and Pearson correlation coefficient [37] (PCC), to facilitate a comprehensive analysis of place emotions at different tourist attractions. With both stages, we can obtain objective and accurate tourist place emotions from a large amount of UGPs.

3.3. M-GFN for Multi-View Emotion Recognition

Due to the tendency of users to post positive emotions on line [2], UGPs at tourist attractions may contain fake smiles and posed expressions, creating a gap between visible facial expressions and real place emotions. To address this, instead of only identifying individual facial expressions, we recognize multi-view emotions including crowd expressions and scene sentiments from UGPs through a novel M-GFN. This method fully considers the relations among facial expressions, crowd behaviors, and scene environments under different tourist attraction types. The M-GFN process (Figure 6) involves multi-view emotion representation and multi-view emotion recognition.

3.3.1. Multi-View Emotion Representation

In order to obtain multi-view emotion information from UGPs at different attractions, we first extract the features of facial expressions, attraction-specific environmental elements, and the scene.
In particular, with the help of normal DCNNs, such as a pre-trained RetinaFace [38], Faster RCNN [39], and ResNet50 [40], we apply three-level parallel attention augmentations for extracting multi-view environmental emotion characteristics. The first level extracts facial-level crowd expression attention, the second focuses on object-level local attention, and the third learns scene-level global attention.
For the first-level attention, we first use the off-the-shelf face detector RetinaFace and pre-trained Resnet50 to detect and extract the facial feature f j of each individual face region and then apply an LSTM to learn the attention weight of each face, which is able to model the expression relations between different faces in UGPs. Formally, the crowd expression features Xc of multi-faces can be calculated as
X c = L S T M f 1 , f 2 , , f N = w 1 f 1 , w 2 f 2 , , w N f N 1 R L 1 × N
where L S T M ( · ) represents the overall operation of LSTM, N represents the number of detected faces in a UGP, w j is the learned attention weight of the j-th facial feature, and L1 is the dimension of each facial feature vector, indicating the relevance of each face in contributing to the overall crowd emotion. The attention weights of each facial element are dynamically learned through the LSTM’s pretraining process.
For second-level attention, Faster RCNN is first used to extract different types of local environmental elements in UGPs, like transportation, urban infrastructure, outdoor activities, animals, food and dining, personal items, indoor furniture, and people, as illustrated in Table 3. Then, we introduced a gated attention network, namely SE-Resnet50 [41] pretrained on the ImageNet-1K database [42], to further identify and extract the features of tourism environmental elements in different attractions. The second-level feature stream, i.e., local attraction—specific environmental element features X l , can be expressed as
X l = S e 1 , e 2 , , e M = g 1 v 1 , g 2 v 2 , , g M v M R L 1 × N
where v i is the i-th element feature of e i , g i is the attention weight learned by the gated attention network, M is the number of salient objects in the UGP, and L2 is the dimension of each element feature vector. The attention weights are dynamically learned through the gated attention mechanism of SE blocks within the SE-ResNet50.
For third-level attention, to further utilize the global scene information, we first extract global scene features using the pre-trained ResNet50 and apply channel attention to focus on scene features most relevant to the overall sentiment of a UGP. This channel attention mechanism dynamically determines the attention weights, denoted as w c , by evaluating the relevance of each channel in contributing to the scene sentiment. Then, we use element-wise multiplication to obtain the attraction-specific scene feature X g = s · w c R L 3 , and L3 is the dimension of the attraction-specific scene feature.

3.3.2. Multi-View Emotion Recognition

With the obtained X c , X l , and X g , we first use a rectified linear unit (ReLU) operation to embed them into a unified vector space to obtain the environmentally-aware scene sentiment representation,
X s = R e L U X c , X l , X g
Then, we build the attraction-specific scene graph G ( X s ,   M s ) based on the global scene feature. M s = m i , is the aggregate messages set, node vector x i collects messages from neighboring nodes { x j } to form m i = W i x j + b i , and W i and b i are the weight parameter and the bias vector of the network, respectively. Using the constructed graph G ( X s , M s ) as input, 4-layer Gate Recurrent Units (GRUs) are also used to update node vectors in graph G ( X s ,   M s ) until convergence. After training, a simple full-connected layer followed by the Softmax is used to predict the final scene sentiment.

3.4. Attraction-Specific Place Emotion Extraction

Leveraging identified multi-view emotions, we further develop AEI with two indices, EII and PCC, for a comprehensive analysis of place emotions across global tourist attractions. This emotion extraction involves two phases: attraction type encoding and attraction-specific place emotion quantification (Figure 7).

3.4.1. Attraction Type Encoding

Several studies suggested that tourist attraction types may have a significant impact on human emotions. For example, attractions with water features often evoke joy, while concentration camp memorials typically induce neutral or negative emotions. Therefore, tourist attraction types need to be considered in the context of place emotion extraction from tourist places. Following the existing works [43,44], we define 15 types of tourist attractions as detailed in Table 1 in Section 3.1.2.
For each tourist attraction j, we construct a multi-label vector I j = ι j 1 , ι j 2 , , ι j t , , ι j 15 to encode their types. Where each element ι j t represents whether or not the attraction type t is included. Given each attraction j { 1 , 2 , . . . , n } , where n = 157, we label the attraction type label ι j t in a one-hot encoding manner as follows:
ι j t = 1 ,           i f   j   b e l o n g s   t o   t 0 ,                                 o t h e r w i s e
where ι j t = 1 represents that the attraction j is classified into the attraction type t.

3.4.2. Attraction-Specific Place Emotion Quantification

Using the recognized multi-view emotions and the attraction type encoded vector, we mine the attraction-specific place emotions via these three proposed indices, namely EII, AEI, and PCC.
Emotion Intensity Index (EII). EII quantifies the emotional intensity of each scene sentiment category across attraction types. With a certain attraction type t, E I I t c is calculated as the ratio of the number of photos in category c to the total number of photos in that type, symbolized as:
E I I t c = n t c n t a l l
where n t c is the number of photos with emotion category c, and n t a l l is the total photo count for attraction type t. Note that the closer the EII is to 1, the stronger the intensity of the emotion category c.
Attraction Emotion Index (AEI). AEI is a novel metric for quantifying emotions across different tourist attraction types. It incorporates multi-view emotions, crowd expressions, and scene sentiments. In one tourist attraction, we suppose that the total number of photos is N, the crowd facial expression value of each photo i is f e i , and C p and C n are the counts of photos with positive and negative sentiments, respectively. AEI under each tourist attraction j is represented as A E I j , which can be calculated as follows:
A E I j = C p C n C p + C n
A higher value represents that more people are happy or surprised at that place, which represents positive place emotion. On the contrary, a lower value indicates that more people may be sad, solemn, etc. This might point to a gloomy atmosphere there.
Pearson Correlation Coefficient (PCC). PCC assesses the correlation between place emotions and attraction types, potentially reflecting geographical influences. With A E I j of the attraction j and the type encoding ι j t of the attraction type t, we represent the PCC as P t , A E I , which is expressed as follows:
P t , A E I = j = 1 n ( A E I j - A E I ¯ ) ( ι j t - t ¯ ) j = 1 n A E I j A E I ¯ 2 j = 1 n ι j t Ι t ¯ 2 ,
where n denotes the number of attractions, A E I ¯ represents the mean of the A E I j across attractions, and ι t ¯ represents the mean of the attraction type elements. A positive PCC value indicates that the type of tourist attraction has a positive effect on the emotion index AEI, and vice versa.

4. Results and Analysis

In this section, we thoroughly evaluated and discussed our tourist place emotion analysis framework. We first evaluated the results of multi-view emotion recognition. Then, we confirmed the viability of the tourist place emotion analysis framework and explored the connection between place emotions and attraction types, as well as the emotional differences among different tourist attraction types.

4.1. Performance of M-GFN

4.1.1. Heatmap of Multi-View Emotion Representation

To demonstrate the criticality of our three attentions more intuitively, we visualized the heatmaps for crowd expression, local attraction-specific environmental element, and global scene features in Figure 8, respectively. In the hot spring scene, the heatmap on crowd facial features primarily illuminates the faces of the individuals, showcasing the model’s precision in identifying expressions in a positive setting. The local heatmap emphasizes handheld items like chairs and slippers, indicating a focus on smaller, significant objects within the interaction. The global scene heatmap outlines the main relaxation area occupied by the group. The second row features a crafting scene where the heatmaps illustrate faces and local items like pens, cups, and plants, with the global heatmap covering the entire activity area. In the park scene, the facial features heatmap focuses on the three individuals, capturing their expressions. The local features heatmap highlights nearby elements such as the bag and roof, while the global heatmap encompasses the surrounding park area. In all, this three-level approach illustrates the model’s adaptability in shifting focus according to scene content, adeptly analyzing various aspects of the scene to enrich understanding of complex environments.

4.1.2. Multi-View Emotion Recognition Results

To demonstrate the superiority of the proposed M-GFN for multi-view emotion recognition, we compared our method in terms of accuracy [7] with several deep learning models of Resnet50 [40], SE-ResNet50 [41], context-aware emotion recognition network (CAER-Net) [45], Long Short-Term Memory (LSTM) [46], Vision Transformer (ViT) [47], Graph neural network (GNN) [34], and a self-fusion network [48] based on contrastive learning (SFN). In practice, we used the annotated TEP subset and a popular scene emotion recognition dataset GroupEmoW [34] for comprehensive evaluation. Specifically, we utilized 8068 images from the annotated TEP subset for training, with the remaining 1966 images for testing. For the GroupEmoW, 12,714 images were used for training and 3178 for testing, as summarized in Table 4.
All experiments were implemented on Pytorch and TensorFlow libraries and ran on a PC with an Intel Core i7-10700 CPU at 2.90 GHz, 16 GB memory, and a NVIDIA GeForce GTX 2070 SUPER. For training, the learning rate was initialized as 2e−4 dropped by a factor of 10 per 4 epochs. The findings are summarized in Table 5. Compared to the second-best GNN method, our proposed M-GFN improved the recognition accuracy by 6.18% and 0.7% on the annotated TEP subset and GroupFmoW, respectively. This suggested that the M-GFN is more suitable for multi-view emotion recognition for such tasks.

4.2. Tourist Place Emotion Mapping and Analysis

In the section, we evaluated and discussed the effectiveness of the extracted tourist place emotions on the following two aspects: (1) the distribution of the attraction emotion index (AEI) in different continents, (2) analyzing the emotion intensity index (EII) under different attraction types, and (3) exploring the relations between the attraction types and tourist place emotions with the Pearson correlation coefficient (PCC).

4.2.1. Attraction Emotion Index Mapping

The spatial distribution of all 157 tourist attractions with their AEI values is illustrated in Figure 9, with color-coded circles indicating varying AEI levels. Darker blue circles signify more positive place emotions, while lighter blue suggests lower emotional values. The Basilica of Our Lady of Guadalupe has the lowest AEI of 0.292, because religious attractions may inspire solemn emotions. In contrast, Mackinac Island obtains the highest AEI of 0.875, and Orchard Road, Singapore’s famous shopping street, obtains an AEI of 0.644, highlighting that a beautiful and relaxing environment promotes a greater AEI. Additionally, an AEI average across continents shows Europe with the lowest at 0.601, likely due to its abundance of historical sites, aligning with findings of recent humanities studies [49]. The average AEI for African attractions is the highest, at 0.798. The high emotional value associated with attractions in Africa could be attributed to its beautiful natural landscapes, diverse wildlife, rich cultural heritage, adventure activities, and high-quality tourism services, offering visitors a uniquely enriching experience. This further demonstrates the relationship between the attraction types and specific cultural contexts, validating our framework.

4.2.2. Emotion Intensity Index Cross Attraction Types

Figure 10 provides the EII of the three classes of emotions under each tourist site type. It reveals varying emotional intensities among different tourist attractions. Notably, places like beaches, islands, lakes, forests, mountains, and national parks tend to evoke more positive emotions, often exceeding 50%. The UGPs from those tourist attractions usually contain open environments, beautiful views, or entertainment programs. In contrast, attraction types such as religious sites, historical sites, cultural heritages, and museums have significantly higher EII for negative emotions. This could be because these places often evoke a sense of reflection and mourning in people. Furthermore, neutral emotion constitutes a significant proportion in most cases. Neutral emotion predominates, often reflecting a baseline state when individuals process new information, as seen in tourists initially absorbing their surroundings [50]. Instead, it can represent a state of contemplation, absorption, or simply a momentary pause in emotional display.

4.2.3. Correlation of Attraction Types

To explore the relationship between different attraction types and emotions from the UGP, we calculated the cross-correlation matrix, as illustrated in Figure 11. The four coarse-grained types of tourist attractions have been marked: N (natural landscape), C (cultural landscape), P (purpose-built), and S (special events). Overall, there is a positive correlation among attraction types of religious sites, historic sites, cultural heritages, and museums. These tourist attraction types are all cultural landscapes that will elicit negative emotional reactions from participants. Moreover, there is a strong positive connection between islands and beaches. This could be due to their frequent co-occurrence as travel destinations, with many islands featuring their own beaches. Lakes, forests, mountains, national parks, and wildlife attractions also exhibit positive correlations due to their shared association with natural landscapes and outdoor recreational activities, which are commonly sought after in eco-tourism and adventure travel. On the contrary, there is a negative correlation between cultural landscapes (i.e., religious sites, historic sites, cultural heritages, and museums) and all other attraction types, except for performance arts. Specifically, the result indicates a weak positive association between performance arts and cultural heritages (r = 0.06) and museums (r = 0.01), suggesting the subtle connections between different types of cultural and artistic sites. For the correlations between the attraction emotions and attraction types, aside from cultural landscapes, all types of attractions have a positive impact on emotions. This finding is consistent with [49], which evaluated human emotions using faces in social media data.

4.2.4. Predicted Emotions of UGPs under Attraction Types

To further explain how the multi-view emotions of UGPs reflect the place emotions, Figure 12 shows the predicted results of our multi-view emotions and place emotions under different tourist attraction types. The rightmost shows the EII and PCC values of different attraction types, and the left shows the predicted multi-view emotions. In the first row for the attraction type of national parks, the EII for negative emotions is only 0.008, the lowest compared to other attraction types, and the PCC is 0.260, indicating that national parks have a positive effect on the AEI. In the second row, under the wildlife attractions, the multi-view emotions of UGPs show that tourists have positive and neutral emotions. Compared to national parks, the EII values of neutral emotions increase to 0.495 and PCC decreases to 0.175. For the third row of historical sites, the EII values of negative emotions increases, and PCC decreases to −0.226, indicating a negative effect of this attraction type on AEI. The predicted results of different UGPs explicitly corroborate that the emotions of different scenarios constitute place emotions and create place emotions.

4.3. Comparison with Facial Expression-Based Method

4.3.1. M-GFN on Complex Scenarios

Furthermore, to evaluate our method on complex scenes and images with ambiguous expressions, Figure 13 displays the emotion recognition results predicted with the face-based GNN method [34] and our M-GFN. These complex environments contain a variety of crowded scenes, lighting variations, pose variations, occlusion variations, resolution variations, cultural differences, and so on. In contrast to the face-based GNN method [34], our M-GFN demonstrates superior performance. For instance, although the individuals in the first photo of the first row are smiling, the M-GFN accurately identified the prevailing neutral emotion. These visualization results highlight the effectiveness of the M-GFN in suppressing emotion bias among UGPs, ensuring more accurate emotion recognition even in complex scenarios with mixed emotional cues. Unlike traditional models that rely solely on facial expressions, our M-GFN method integrates multiple sources of emotional data, resulting in more robust emotion recognition capabilities.

4.3.2. Assessment of the Framework

Recognizing the established reputation and adoption of facial expression-based emotion detection in numerous studies, we aimed to validate the reliability of our novel methodology by juxtaposing it against this conventional approach. For this comparative analysis, referring to Kang [49]’s study, which used facial expression tools to create a ‘Joy Index’, we found our AEI strongly correlates (0.796, p-value: 2.747e−21) with this index, validating our method’s reliability.
Furthermore, unlike traditional methods centered on facial expressions, which at times may misunderstand certain facial cues, our approach offers a more comprehensive insight. Relying only on facial expressions can overlook critical contextual information. Factors like scene objects and surrounding events can profoundly influence emotions, yet these are often disregarded in conventional methods. Our method, incorporating multi-view emotions from the M-GFN, aligns with environmental psychology principles by including such context, offering a more comprehensive and objective emotion understanding. Specifically, results from our multi-view emotion-based framework in Figure 14 reveal that natural and recreational sites like national parks and beaches have a positive impact on human emotions. Purpose-built sites of markets and performance arts also have some positive impact on human emotions. These places often provide experiences that connect individuals with nature, offer entertainment, and facilitate relaxation and physical activity, which can lead to increased happiness and reduced stress. In contrast, cultural landscapes of museums, religious sites, historic sites, and cultural heritages might have a negative impact on emotions. Visitors to these places often reflect on their histories and cultures, evoking solemn and reflective emotions. While results from the individual facial expressions-based framework on the TPE dataset show that amusement parks, markets, and performance arts have a negative connection to human emotions, our findings align more closely with common-sense expectations in our study area.
By considering the environment’s influence on emotions, our approach captures a wider range of emotional responses (e.g., facial expressions, scene elements, and contexts), making it suited for assessing complex emotional experiences at tourist attractions, indicating the importance of environmental perception of tourist destinations in shaping emotions [51].

4.4. Comparison with Website User Attraction Ratings

We employed the predicted attraction emotion indexes (AEI) that are the emotion experience of people at tourist attractions obtained from the UGPs, for evaluating the results of place emotion prediction. To verify the effectiveness and sensibility of the framework of our proposed place emotion prediction, we compared the predicted AEI and the user rating score in Tripadvisor. The graph in Figure 15 demonstrates remarkable consistency between our normalized emotional analysis results (orange points) and user ratings (blue points), highlighting the effectiveness of our emotion analysis methodology. Additionally, the advantage of our method is that it allows for a more nuanced understanding of visitor emotion responses beyond simple numerical ratings, enabling attractions to tailor experiences and marketing strategies more effectively to meet visitor expectations and enhance overall satisfaction.

5. Discussion

5.1. Data Sensitivity Test

Since the photos varied across different tourist attractions, a key issue is that more popular attractions may dominate the analysis and skew the findings. We employed a strategy that involves calculating the emotion intensity index (EII) in three data setting scenarios: using data from all attractions, excluding attraction with the most photos, and excluding attraction with the fewest photos. Additionally, we plotted the deviations of the three sets of results in Figure 16 and found that the variance was minimal. Notably, for attraction types like beaches, islands, markets, performance arts, and amusement parks, the variances are still small, all below 0.00015, indicating consistent findings across these three scenarios. This validates and confirms the robustness of our collected data and the place emotion analysis framework in addressing this potential bias.

5.2. Impact of Attraction-Type Perspective on Emotions

5.2.1. Differences in Place Emotions across Attraction Types

Due to the introduction of attraction type encoding, we observed that the mined emotional patterns of different tourist places are consistent with existing research, again validating the effectiveness of our framework. For example, Figure 10 further reveals that natural landscapes evoke positive emotions, while cultural sites like religious sites and museums may suppress positive expressions, as Kang et al. indicated [49].
Tourist place emotions are influenced by environmental and human geographical factors. Natural landscapes often induce positive feelings due to their tranquility and inherent beauty, providing a break from urban life [13]. Conversely, cultural sites in regions may prompt more deep emotions, influenced by societal norms and the environments of historical or religious sites [52]. These interactive factors offer a comprehensive perspective on the diverse emotional responses across various attractions.

5.2.2. Commonalities in Place Emotions across Attraction Types

We also observed a notable consistency in the emotional analysis results across both the overall datasets and various attraction types. The negative emotions accounted for the least, less than 5%. This aligns with the previous study [2], which found people may be more inclined to share positive experiences than negative ones on the public platforms. This consistency strengthens our observations.
This finding also emphasizes that, regardless of the type of attraction, they are generally attractive and positively affect tourists. Attractions, as an important part of tourism, are usually designed and managed to provide pleasurable and memorable experiences that generate positive emotions among tourists and reduce the generation of negative emotions [53,54].
To conclude, multiple factors influence the emotional responses of tourists at different attraction types, and a deeper understanding of these reactions could offer more comprehensive insights into tourist behavior.

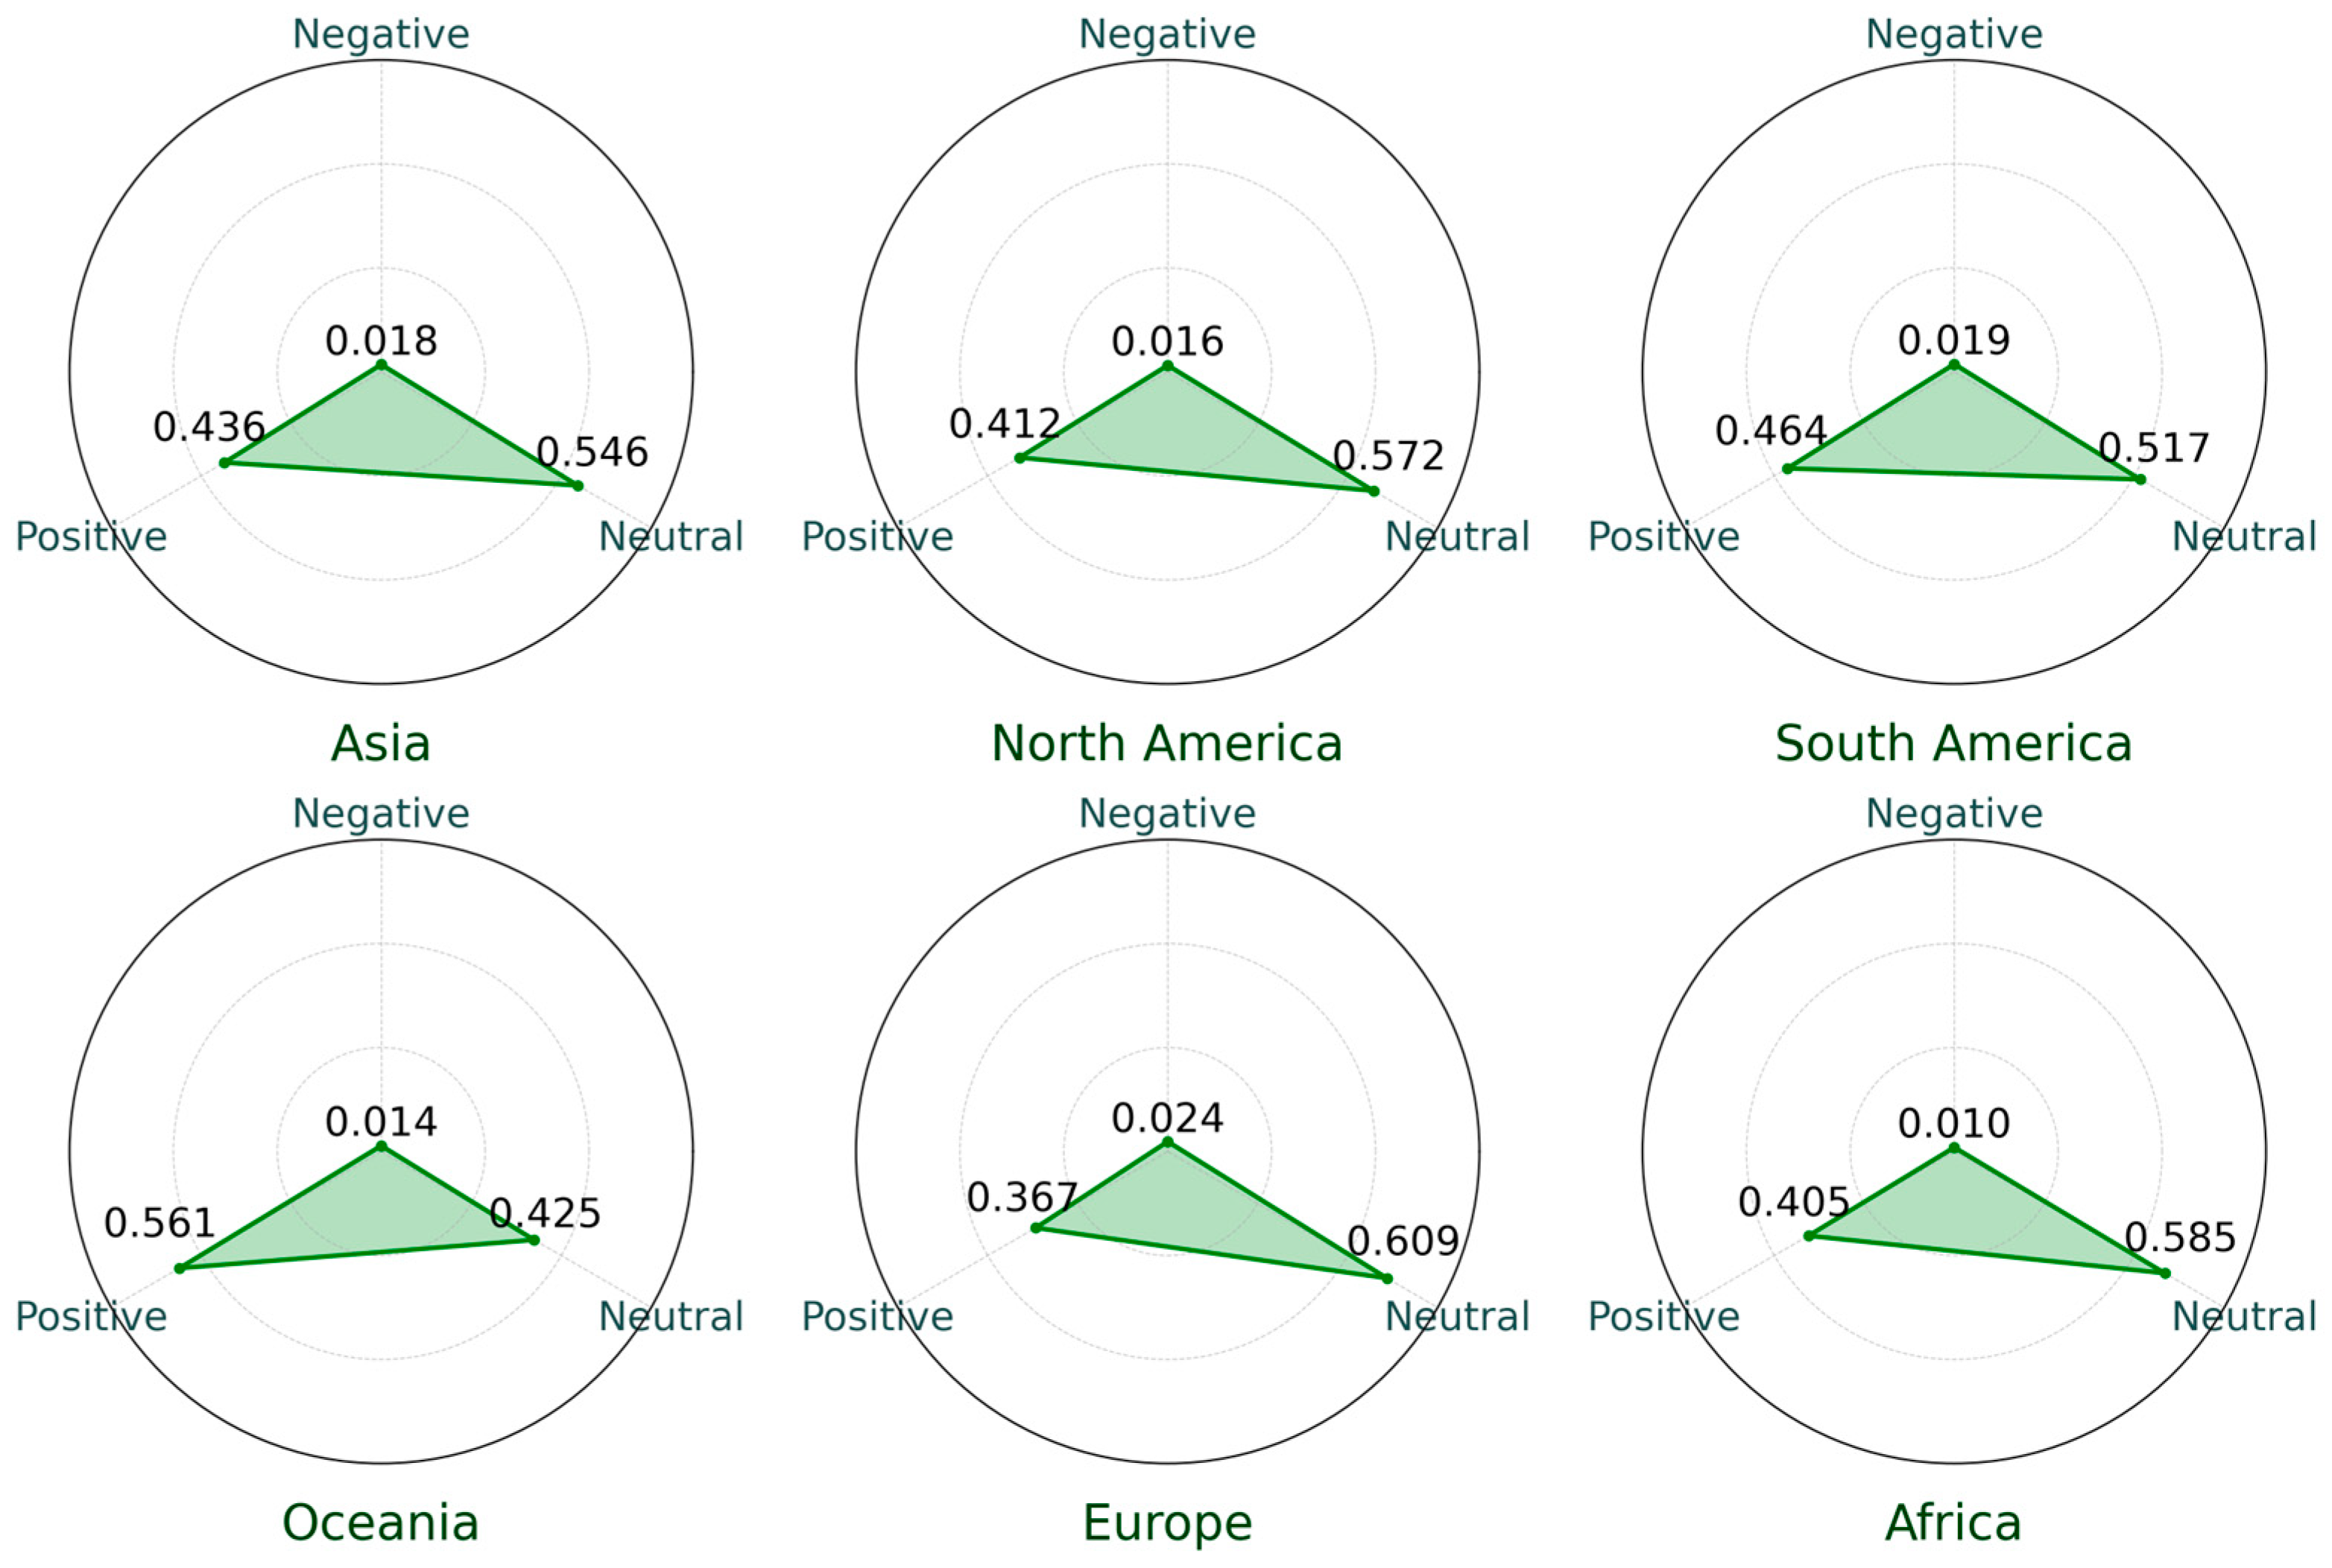
5.3. Place Emotion Analysis under Various Regions

Understanding the impact of regional culture differences on place emotions is crucial for a comprehensive analysis of tourist experiences. Figure 17 illustrates the EII distributions of each place emotion category under various regions with various culture differences. Regions like Oceania and South America exhibit high positive emotions, which can be attributed to their graceful natural landscapes [55,56]. In contrast, the predominance of neutral emotions in Europe and North America might be due to the fact that Europe has more human attractions, such as the British museum and Balboa Park. Africa’s low negative emotions reflect their unique and more differentiated tourism cultures and life contexts. These findings suggest that different regions have unique attraction cultures, influencing how visitors experience and enjoy these destinations.
Despite the emotional differences observed among regions, radar charts show that tourist attractions across all regions elicit primarily positive and neutral emotions, with negative emotions being consistently low. This finding highlight that although the types of tourist attractions and cultural differences across regions slightly influence the emotional distribution of tourists, overall tourist satisfaction remains high globally. This is largely due to the inherent appeal of scenic and culturally rich destinations [57].

5.4. Framework Performance, Limitations, and Future Perspective

Explicitly mapping human emotions of places has long been hampered by the lack of automatic methods. This study proposed the M-GFN, a deep learning model that effectively maps place emotions in tourist attractions, which effectively suppresses the side influence of the gap between facial expressions and place emotions due to possible posed expressions in social media [58]. The high overall accuracy suggests its robust performance in extracting and analyzing tourist place emotions.
Instead of the single smile emotion analysis, our framework used multi-view emotions to mine tourist place emotions from attraction type perspectives. Notably, more than half of the people express neutral feelings across attractions, unlike the assumption of most positive emotions in tourist places like shopping areas. There is a need to understand the detailed influences on emotions at tourist sites.
Despite its innovation, this study has limitations. Foremost, exploring the reasons behind the observed emotional differences or similarities across attractions is important. In this research, our primary goal was to develop a novel framework for tourist place emotion extraction using multi-view emotions, only briefly exploring the link between place emotions and attraction types due to the coarseness of the global dataset. In the future, we will differentiate between vacationers and regular visitors, analyzing emotional changes over time. Meanwhile, we will introduce time variation analysis and special event detection, like political situations and pandemics, to understand emotional cultural backgrounds, trends, and potential anomalies.

6. Conclusions

We presented a novel framework to extract and analyze emotions associated with various tourist attractions, leveraging multi-view emotions and attraction-specific indices from user-generated geo-tagged photos (UGPs). This is a growing form of urban big data that has permeated through urban informatics but is not yet used for such a purpose. Taking world-wide tourist attractions as diverse examples, we deployed a Multi-view Graph Fusion Network (M-GFN) to identify multi-view emotions, incorporating crowd facial emotions and implicit scene sentiments, effectively bridging the emotional gap posed by individual expressions in UGPs. Subsequently, we employ three attraction-specific indices—emotion intensity index (EII), attraction-specific emotion Index (AEI), and Pearson correlation coefficient (PCC) -to enhance the extraction and analysis of emotions at tourist locations by considering the diversity of attraction types.
The M-GFN model, which integrates meaningful environmental contexts, outperforms state-of-the-art (SOTA) methods in predicting multi-view emotions, highlighting its accuracy and establishing a solid foundation for the precise extraction of tourist place emotions. A quantitative comparative analysis conducted on the TPE dataset confirms our framework aligns with established emotional insights and outperforms another facial expression-based framework, thereby validating its effectiveness. Furthermore, our study exploring the relationships between types and regions of tourist attractions and place emotions reveals the diverse emotional effects that different attractions exert on visitors, while also highlighting common emotional impacts, providing essential insights into the emotional dynamics at global tourist sites.
This comprehensive framework not only advances the methodology of analyzing place emotions in global tourist destinations but also has significant implications for environmental management and tourism planning. This involves utilizing emotional data to balance tourism growth with environmental conservation, ultimately enhancing the emotional experiences of visitors at tourist attractions worldwide. By applying this approach, user-generated photos can be used more widely, such as urban perception studies at different spatial scales.

Author Contributions

Data curation, Software, Visualization, Methodology, Writing—original draft, Yu Wang; Validation, Supervision, Writing—review and editing, Shunping Zhou; Writing—review and editing, Qingfeng Guan; Writing—review and editing, Fang Fang; Writing—review and editing, Ni Yang; Software, Kanglin Li; Conceptualization, Methodology, Validation, Project administration, Writing—review and editing, Yuanyuan Liu. All authors have read and agreed to the published version of the manuscript.

Funding

This research was supported by the National Natural Science Foundation of China grant (No. 62076227), Natural Science Foundation of Hubei Province grant (No. 2023AFB527), and Hubei Key Laboratory of Intelligent Geo-Information Processing (No. KLIGIP-2022-B10).

Data Availability Statement

The user-generated geo-tagged photos that support the experiment of this study cannot be made public due to the data-use restrictions.

Acknowledgments

We thank people who have helped shape our knowledge. Their wisdom, generosity, and patience form the bedrock of our collaborative research frameworks and programs.

Conflicts of Interest

The authors declare no conflicts of interest.

References

  1. Ma, Z. Deep exploration of street view features for identifying urban vitality: A case study of Qingdao city. Int. J. Appl. Earth Obs. Geoinf. 2023, 123, 103476. [Google Scholar] [CrossRef]
  2. Huang, Y.; Li, J.; Wu, G.; Fei, T. Quantifying the bias in place emotion extracted from photos on social networking sites: A case study on a university campus. Cities 2020, 102, 102719. [Google Scholar] [CrossRef]
  3. Huai, S.; Van de Voorde, T. Which environmental features contribute to positive and negative perceptions of urban parks? A cross-cultural comparison using online reviews and Natural Language Processing methods. Landsc. Urban Plan. 2022, 218, 104307. [Google Scholar] [CrossRef]
  4. Wei, H.; Ma, B.; Hauer, R.J.; Liu, C.; Chen, X.; He, X. Relationship between environmental factors and facial expressions of visitors during the urban forest experience. Urban For. Urban Green. 2020, 53, 126699. [Google Scholar] [CrossRef]
  5. Zhou, H.; Wang, J.; Wilson, K. Impacts of perceived safety and beauty of park environments on time spent in parks: Examining the potential of street view imagery and phone-based GPS data. Int. J. Appl. Earth Obs. Geoinf. 2022, 115, 103078. [Google Scholar] [CrossRef]
  6. Chen, X.; Li, J.; Han, W.; Liu, S. Urban Tourism Destination Image Perception Based on LDA Integrating Social Network and Emotion Analysis: The Example of Wuhan. Sustainability 2021, 14, 12. [Google Scholar] [CrossRef]
  7. Liu, Y.; Wang, W.; Feng, C.; Zhang, H.; Chen, Z.; Zhan, Y. Expression snippet transformer for robust video-based facial expression recognition. Pattern Recognit. 2023, 138, 109368. [Google Scholar] [CrossRef]
  8. Yin, G.; Liu, Y.; Liu, T.; Zhang, H.; Fang, F.; Tang, C.; Jiang, L. Token-disentangling Mutual Transformer for multimodal emotion recognition. Eng. Appl. Artif. Intell. 2024, 133, 108348. [Google Scholar] [CrossRef]
  9. Zhou, T.; Cai, Z.; Liu, F.; Su, J. In Pursuit of Beauty: Aesthetic-Aware and Context-Adaptive Photo Selection in Crowdsensing. IEEE Trans. Knowl. Data Eng. 2023, 35, 9364–9377. [Google Scholar] [CrossRef]
  10. Harb, J.G.D.; Ebeling, R.; Becker, K. A framework to analyze the emotional reactions to mass violent events on Twitter and influential factors. Inf. Process. Manag. 2020, 57, 102372. [Google Scholar] [CrossRef]
  11. Ekman, P. Facial expression and emotion. AmP 1993, 48, 384. [Google Scholar] [CrossRef] [PubMed]
  12. Frijda, N.H. The Emotions; Cambridge University Press: Cambridge, UK, 1986. [Google Scholar]
  13. Kaplan, R.; Kaplan, S. The Experience of Nature: A Psychological Perspective; Cambridge University Press: Cambridge, UK, 1989. [Google Scholar]
  14. Kang, Y.; Zeng, X.; Zhang, Z.; Wang, Y.; Fei, T. Who are happier? Spatio-temporal analysis of worldwide human emotion based on geo-crowdsourcing faces. In Proceedings of the 2018 Ubiquitous Positioning, Indoor Navigation and Location-Based Services (UPINLBS), Wuhan, China, 22–23 March 2018; pp. 1–8. [Google Scholar]
  15. Ashkezari-Toussi, S.; Kamel, M.; Sadoghi-Yazdi, H. Emotional maps based on social networks data to analyze cities emotional structure and measure their emotional similarity. Cities 2019, 86, 113–124. [Google Scholar] [CrossRef]
  16. Lengen, C.; Kistemann, T. Sense of place and place identity: Review of neuroscientific evidence. Health Place 2012, 18, 1162–1171. [Google Scholar] [CrossRef] [PubMed]
  17. Zhu, X.; Gao, M.; Zhang, R.; Zhang, B. Quantifying emotional differences in urban green spaces extracted from photos on social networking sites: A study of 34 parks in three cities in northern China. Urban For. Urban Green. 2021, 62, 127133. [Google Scholar] [CrossRef]
  18. Kosti, R.; Alvarez, J.M.; Recasens, A.; Lapedriza, A. Context Based Emotion Recognition Using EMOTIC Dataset. IEEE Trans. Pattern Anal. Mach. Intell. 2020, 42, 2755–2766. [Google Scholar] [CrossRef] [PubMed]
  19. Sisco, M.R. The effects of weather experiences on climate change attitudes and behaviors. Curr. Opin. Environ. Sustain. 2021, 52, 111–117. [Google Scholar] [CrossRef]
  20. Zheng, Q.; Zhao, P.; Wang, H.; Elhanashi, A.; Saponara, S. Fine-Grained Modulation Classification Using Multi-Scale Radio Transformer with Dual-Channel Representation. IEEE Commun. Lett. 2022, 26, 1298–1302. [Google Scholar] [CrossRef]
  21. Zheng, Q.; Zhao, P.; Zhang, D.; Wang, H. MR-DCAE: Manifold regularization-based deep convolutional autoencoder for unauthorized broadcasting identification. Int. J. Intell. Syst. 2021, 36, 7204–7238. [Google Scholar] [CrossRef]
  22. Zhang, F.; Liu, K.; Liu, Y.; Wang, C.; Zhou, W.; Zhang, H.; Wang, L. Multitarget Domain Adaptation Building Instance Extraction of Remote Sensing Imagery with Domain-Common Approximation Learning. IEEE Trans. Geosci. Remote Sens. 2024, 62, 1–16. [Google Scholar] [CrossRef]
  23. Li, Y.; Fei, T.; Huang, Y.; Li, J.; Li, X.; Zhang, F.; Kang, Y.; Wu, G. Emotional habitat: Mapping the global geographic distribution of human emotion with physical environmental factors using a species distribution model. Int. J. Geogr. Inf. Sci. 2021, 35, 227–249. [Google Scholar] [CrossRef]
  24. Svoray, T.; Dorman, M.; Shahar, G.; Kloog, I. Demonstrating the effect of exposure to nature on happy facial expressions via Flickr data: Advantages of non-intrusive social network data analyses and geoinformatics methodologies. J. Environ. Psychol. 2018, 58, 93–100. [Google Scholar] [CrossRef]
  25. Hernwall, P.; Siibak, A. Writing Identity: Gendered values and user content creation in SNS interaction among Estonian and Swedish tweens. Glob. Stud. Child. 2011, 1, 365–376. [Google Scholar] [CrossRef]
  26. Joye, Y.; Kahn, P.H.; Hasbach, P.H. Can Architecture Become Second Nature? An Emotion-based Approach to Nature-oriented Architecture; MIT Press: Cambridge, MA, USA, 2012. [Google Scholar]
  27. Relph, E. Place and Placelessness; Pion London: London, UK, 1976; Volume 67. [Google Scholar]
  28. Junot, A.; Paquet, Y.; Fenouillet, F. Place attachment influence on human well-being and general pro-environmental behaviors. J. Theor. Soc. Psychol. 2018, 2, 49–57. [Google Scholar] [CrossRef]
  29. Gehl, J. Life between Buildings; VAN Nosrand Reinhold: New York, NY, USA, 2003. [Google Scholar]
  30. Moyle, B.D.; Moyle, C.-l.; Bec, A.; Scott, N. The next frontier in tourism emotion research. Curr. Issues Tour. 2019, 22, 1393–1399. [Google Scholar] [CrossRef]
  31. Cheung, M.L.; Ting, H.; Cheah, J.-H.; Sharipudin, M.-N.S. Examining the role of social media-based destination brand community in evoking tourists’ emotions and intention to co-create and visit. J. Prod. Brand Manag. 2021, 30, 28–43. [Google Scholar] [CrossRef]
  32. Mehra, P. Unexpected surprise: Emotion analysis and aspect based sentiment analysis (ABSA) of user generated comments to study behavioral intentions of tourists. Tour. Manag. Perspect. 2023, 45, 101063. [Google Scholar] [CrossRef]
  33. Jiang, M.; Li, J.; Du, Y. From on-site to memory: Study on the spatial characteristics of tourists’ emotional experiences. J. Qual. Assur. Hosp. Tour. 2023, 24, 279–310. [Google Scholar] [CrossRef]
  34. Guo, X.; Polania, L.; Zhu, B.; Boncelet, C.; Barner, K. Graph neural networks for image understanding based on multiple cues: Group emotion recognition and event recognition as use cases. In Proceedings of the IEEE Winter Conference on Applications of Computer Vision, Snowmass Village, CO, USA, 1–5 March 2020; pp. 2921–2930. [Google Scholar]
  35. Wan, T.; Jun, H.; Zhang, H.; Pan, W.; Hua, H. Kappa coefficient: A popular measure of rater agreement. Shanghai Arch. Psychiatry 2015, 27, 62. [Google Scholar]
  36. Petroman, C. Typology of tourism destinations. Sci. Pap. Anim. Sci. Biotechnol. 2015, 48, 338–342. [Google Scholar]
  37. Cohen, I.; Huang, Y.; Chen, J.; Benesty, J.; Benesty, J.; Chen, J.; Huang, Y.; Cohen, I. Pearson correlation coefficient. In Noise Reduction in Speech Processing; Springer: Berlin/Heidelberg, Germany, 2009; pp. 1–4. [Google Scholar] [CrossRef]
  38. Deng, J.; Guo, J.; Ververas, E.; Kotsia, I.; Zafeiriou, S. Retinaface: Single-shot multi-level face localisation in the wild. In Proceedings of the IEEE/CVF Conference on Computer Vision and Pattern Recognition, Seattle, WA, USA, 14–19 June 2020; pp. 5203–5212. [Google Scholar]
  39. Ren, S.; He, K.; Girshick, R.; Sun, J. Faster r-cnn: Towards real-time object detection with region proposal networks. Adv. Neural Inf. Process. Syst. 2015, 99, 2969239–2969250. [Google Scholar] [CrossRef]
  40. He, K.; Zhang, X.; Ren, S.; Sun, J. Deep residual learning for image recognition. In Proceedings of the IEEE Conference on Computer Vision and Pattern Recognition, Las Vegas, NV, USA, 27–30 June 2016; pp. 770–778. [Google Scholar]
  41. Hu, J.; Shen, L.; Sun, G. Squeeze-and-excitation networks. In Proceedings of the IEEE Conference on Computer Vision and Pattern Recognition, Salt Lake City, UT, USA, 18–22 June 2018; pp. 7132–7141. [Google Scholar]
  42. Russakovsky, O.; Deng, J.; Su, H.; Krause, J.; Satheesh, S.; Ma, S.; Huang, Z.; Karpathy, A.; Khosla, A.; Bernstein, M. Imagenet large scale visual recognition challenge. Int. J. Comput. Vis. 2015, 115, 211–252. [Google Scholar] [CrossRef]
  43. Taecharungroj, V.; Mathayomchan, B. Analysing TripAdvisor reviews of tourist attractions in Phuket, Thailand. Tour. Manag. 2019, 75, 550–568. [Google Scholar] [CrossRef]
  44. Dwyer, L.; Tomljenović, R.; Čorak, S. Evolution of destination planning and strategy. In The rise of tourism in Croatia; Springer: Berlin/Heidelberg, Germany, 2017. [Google Scholar]
  45. Lee, J.; Kim, S.; Kim, S.; Park, J.; Sohn, K. Context-aware emotion recognition networks. In Proceedings of the IEEE/CVF International Conference on Computer Vision, Seoul, Republic of Korea, 27–28 October 2019; pp. 10143–10152. [Google Scholar]
  46. Yu, Y.; Si, X.; Hu, C.; Zhang, J. A review of recurrent neural networks: LSTM cells and network architectures. Neural Comput. 2019, 31, 1235–1270. [Google Scholar] [CrossRef] [PubMed]
  47. Dosovitskiy, A.; Beyer, L.; Kolesnikov, A.; Weissenborn, D.; Zhai, X.; Unterthiner, T.; Dehghani, M.; Minderer, M.; Heigold, G.; Gelly, S. An image is worth 16x16 words: Transformers for image recognition at scale. arXiv 2020, arXiv:2010.11929. [Google Scholar]
  48. Wang, X.; Zhang, D.; Tan, H.-Z.; Lee, D.-J. A self-fusion network based on contrastive learning for group emotion recognition. IEEE Trans. Comput. Soc. Syst. 2022, 10, 458–469. [Google Scholar] [CrossRef]
  49. Kang, Y.; Jia, Q.; Gao, S.; Zeng, X.; Wang, Y.; Angsuesser, S.; Liu, Y.; Ye, X.; Fei, T. Extracting human emotions at different places based on facial expressions and spatial clustering analysis. Trans. GIS 2019, 23, 450–480. [Google Scholar] [CrossRef]
  50. Jones, S. The mediating effects of facial expression on spatial interference between gaze direction and gaze location. J. Gen. Psychol. 2015, 142, 106–117. [Google Scholar] [CrossRef]
  51. Yüksel, A. Tourist shopping habitat: Effects on emotions, shopping value and behaviours. Tour. Manag. 2007, 28, 58–69. [Google Scholar] [CrossRef]
  52. Lowenthal, D. The Past Is a Foreign Country-Revisited; Cambridge University Press: Cambridge, UK, 2015. [Google Scholar]
  53. Kim, J.-H. The antecedents of memorable tourism experiences: The development of a scale to measure the destination attributes associated with memorable experiences. Tour. Manag. 2014, 44, 34–45. [Google Scholar] [CrossRef]
  54. Zatori, A.; Smith, M.K.; Puczko, L. Experience-involvement, memorability and authenticity: The service provider’s effect on tourist experience. Tour. Manag. 2018, 67, 111–126. [Google Scholar] [CrossRef]
  55. D’Arcy, P. Oceania: The Environmental History of One-Third of the Globe. A Companion Glob. Environ. Hist. 2012, 196–221. [Google Scholar]
  56. Vincent, F. Around and about South America; D. Appleton & Company: New York, NY, USA, 1890. [Google Scholar]
  57. Vittersø, J.; Vorkinn, M.; Vistad, O.I.; Vaagland, J. Tourist experiences and attractions. Ann. Tour. Res. 2000, 27, 432–450. [Google Scholar] [CrossRef]
  58. Singh, V.K.; Atrey, A.; Hegde, S. Do individuals smile more in diverse social company? Studying smiles and diversity via social media photos. In Proceedings of the 25th ACM international conference on Multimedia, Mountain View, CA, USA, 23–27 October 2017; pp. 1818–1827. [Google Scholar]
Figure 1. Distributions of selected tourist attractions and UGPs, with colored rectangles indicating attraction numbers across continents.
Ijgi 13 00256 g001
Figure 2. Overview of the collection and the annotation of TPE. Note: SS, GI, and AT are the abbreviations of the scene sentiment, geo-tagged information, and attraction type, respectively.
Ijgi 13 00256 g002
Figure 3. Samples of the TPE at different tourist attractions.
Ijgi 13 00256 g003
Figure 4. The number of photos (blue) and faces (orange) per tourist attraction type.
Ijgi 13 00256 g004
Figure 5. Overall research workflow. It consists of two stages: (1) Training M-GFN on annotated TPE subset for multi-view emotion identification in UGPs from various attractions. (2) Integrating multi-view emotions with attraction types and evaluating place emotions using AEI, EII, and PCC.
Ijgi 13 00256 g005
Figure 6. Pipeline of multi-view emotion recognition from attraction UGPs. Given a UGP, the M-GFN first employs hierarchical attention modules to extract multi-view emotion representation and then employs the GNN to accurately identify crowd emotions and scene sentiments.
Ijgi 13 00256 g006
Figure 7. Block diagram of attraction-specific place emotion extraction.
Ijgi 13 00256 g007
Figure 8. Heatmaps of three-level attentions on sample UGPs.
Ijgi 13 00256 g008
Figure 9. The distributions of AEI for 157 tourist attractions in different continents.
Ijgi 13 00256 g009
Figure 10. EII of the three classes of emotions for 15 fine-grained tourist attraction types.
Ijgi 13 00256 g010
Figure 11. Cross-correlation between the tourist attraction types and AEI.
Ijgi 13 00256 g011
Figure 12. Predicted results of multi-view emotions, EII, and PCC under different attraction types.
Ijgi 13 00256 g012
Figure 13. The emotions predicted with the face-based GNN method and the proposed M-GFN on complex scenes. Obviously, our M-GFN achieved a more robust performance.
Ijgi 13 00256 g013
Figure 14. PCC of attraction types and place emotions. AEI via recognized multi-view emotions; Joy Index through single facial expression.
Ijgi 13 00256 g014
Figure 15. Scatterplot of predicted AEI and rating score of places.
Ijgi 13 00256 g015
Figure 16. Variance of EII across attraction types with different data settings.
Ijgi 13 00256 g016
Figure 17. The EII distributions of three classes of emotions for 6 regions with various cultures.
Ijgi 13 00256 g017
Table 1. The classification and description of the attraction types.
Coarse CategoriesFine-Grained TypesDescription
Natural
landscape
MountainsLandscapes dominated by naturally occurring mountains, such as Mountain Tai
ForestsLike Qiandaohu National Forest Park, Halong Bay sea forest, and so on
LakesSuch as Lake Superior, Riyuetan Pool, and so forth
RiversLike the Mississippi River, Amazon River and so on
National parksAreas are protected because of their diverse fauna and/or lovely surroundings, like Kakadu National Park
IslandsLands that are separated from the mainland by water, like Mackinac Island
BeachesAreas with pleasant weather and soft sand that attract tourists, like the shores
Cultural
landscape
MuseumsPlaces constructed around history, science, culture, or another topic, such as the Metropolitan Museum of Art
Historic sitesLocations where people go primarily to learn about their histories, like Macchu Picchu
ReligionsPlaces where people visit mostly for religious-related activities, like cathedrals
Cultural heritagesPlaces with the aim of preserving the cultural premises of outstanding universal value to humanity worldwide, like the Great Wall
Purpose-builtAmusement parksPlaces built with the sole purpose of providing entertainment for visitors, such as Disneyland
Wildlife attractionsAreas that enable tourists to see wildlife, such as the zoos and aquariums
Special eventsMarketsDestinations where travelers can shop for goods, like the Central Market
Performance artsLocations that combine artistic performance and entertainment through forms of cultural expression, like the Paris Opera
Table 2. Global tourist attraction distribution of our dataset.
RegionsAttraction
Amounts
Country
Amounts
Attraction Type
Amounts
Europe561015
Asia491215
North America23415
Oceania12211
South America11314
Africa6612
Table 3. Local environment list.
Environment-Related CategoriesSubdivided Local Environment Elements
TransportationBicycle, car, boat, bus, etc.
Urban infrastructureTraffic light, fire hydrant, parking meter, etc.
Outdoor activitiesKite, skateboard, frisbee, sports ball, etc.
AnimalsBird, elephant, giraffe, horse, etc.
Food and DiningDining table, sandwich, hot dog, cup, etc.
Personal itemsBackpack, handbag, umbrella, suitcase, etc.
Indoor furnitureChair, sofa, potted plant, vase, etc.
PeoplePerson
Table 4. Configuration of sample numbers.
DatasetAnnotated TEP SubsetGroupEmoW
Training806812,714
Testing19663178
Table 5. Quantitative evaluation of M-GFN versus other methods on two datasets. The best results are in bold.
MethodsAccuracy (%)
Annotated TEP SubsetGroupFmoW
Resnet50 [40]62.6471.58
SE-Resnet50 [41]67.5769.79
CAER-Net [45]68.9880.61
LSTM [46]69.7182.76
VIT [47]68.8283.47
GNN [34]75.1784.62
SFN [48]68.7384.15
M-GFN (proposed in this study)81.3585.32
Disclaimer/Publisher’s Note: The statements, opinions and data contained in all publications are solely those of the individual author(s) and contributor(s) and not of MDPI and/or the editor(s). MDPI and/or the editor(s) disclaim responsibility for any injury to people or property resulting from any ideas, methods, instructions or products referred to in the content.

