Article

A Maximal Multimodal Accessibility Equality Model to Optimize the Equality of Healthcare Services

Faculty of Geographical Science, Beijing Normal University, Beijing 100875, China
*
Author to whom correspondence should be addressed.
ISPRS Int. J. Geo-Inf. 2024, 13(8), 278; https://doi.org/10.3390/ijgi13080278
Submission received: 30 May 2024 / Revised: 25 July 2024 / Accepted: 6 August 2024 / Published: 7 August 2024

Abstract

:
The equality of healthcare services has been a focus among researchers and policymakers. The maximal accessibility equality (MAE) model is a widely used location-allocation model for the optimization of the accessibility equality of facilities. However, it might produce biased results due to the overlooking of multiple transport mode options for urban residents. This study develops a maximal multimodal accessibility equality (MMAE) model by incorporating the multimodal two-step floating catchment area (2SFCA) accessibility model. It reflects the multimodal context in cities and aims to maximize the equality of multimodal accessibility. A case study of healthcare facilities in Shenzhen demonstrates that the proposed MMAE model can significantly improve the equality of multimodal accessibility. However, the traditional single-modal MAE model generates unequal multimodal accessibility, which might yield biased planning recommendations in multimodal contexts. The findings highlight the superiority of the MMAE model against the traditional single-modal MAE model in terms of pursuing equal accessibility for all residents. The MMAE model can serve as a scientific tool to support the rational planning of healthcare facilities or other types of public facilities in multimodal contexts.

1. Introduction

Equality has drawn extensive attention and debate among researchers and policymakers [1,2]. Essential public services, e.g., healthcare services, play a vital role in residents’ daily lives and well-being. The spatial distribution of facilities influences residents’ accessibility, which is defined as the potential opportunities for residents to reach services provided at facilities [3,4,5,6]. Furthermore, healthcare accessibility is typically associated with the utilization of services [7,8] and residents’ health status [9]. Therefore, the equality of accessibility is widely considered an operational definition of the equity of healthcare services [10,11,12].
Researchers have developed a set of location-allocation models for the determination of the optimal distribution of public facilities in recent decades [13,14,15]. However, traditional location-allocation models are focused on efficiency objectives, with equality largely overlooked [6]. The maximal accessibility equality (MAE) model, developed by Wang and Tang [16], seeks to maximize the equality of accessibility to facilities by minimizing the disparities in accessibility across various locations. The MAE model is considered a promising methodological advancement in incorporating equality into location-allocation models and has been widely applied and improved [17,18,19]. However, little attention has been given to the role of multiple transport modes in accessibility in location-allocation analyses. To our knowledge, most existing MAE models assume that all people travel to facilities by driving [16,17,18,19,20].
Recent studies have placed a particular emphasis on the consideration of multiple transport modes in healthcare accessibility measurement. A gap between accessibility via various transport modes, e.g., driving, public transport, and bicycling, has been revealed in various cities [21,22,23]. The multimodal two-step floating catchment area (2SFCA) method further underlines the competition effect among demanders by various transport modes [24,25,26]. In large cities with multimodal transport networks, it is infeasible to achieve equal accessibility to facilities without considering multiple transport modes.
Addressing the above drawbacks, this study aims to develop an extended MAE model, namely the maximal multimodal accessibility equality (MMAE) model, to optimize the equality of accessibility to facilities (e.g., healthcare facilities) in multimodal contexts. The model integrates the MAE model and the multimodal 2SFCA model. The feasibility of the proposed model and its advantages compared to the traditional MAE model are demonstrated using a case study of hospitals in Shenzhen, China. The MMAE model is useful in supporting the spatial planning of healthcare facilities in cities or regions with multiple transport modes.

2. Literature Review

2.1. Equality of Healthcare Accessibility

Accessibility is typically conceptualized as the potential opportunities of people to reach a certain set of destinations (e.g., public facilities) [3,4]. Furthermore, accessibility can be classified into spatial versus nonspatial accessibility. The former focuses on the spatial distribution of facilities and how easily demanders from various locations can travel to these facilities, while the latter considers socioeconomic barriers to accessing services [4,6]. Spatial accessibility is more closely related to the spatial distribution of facilities and is thus widely adopted in location-allocation models [27,28]. In this study, healthcare accessibility is interpreted as spatial accessibility to healthcare facilities. Spatial accessibility to healthcare services plays a vital role in promoting residents’ utilization of services and their health outcomes [7,8,9,29].
As an essential type of service in residents’ daily lives, healthcare services and their equality are of great importance in developing public policy. Although equality has long been considered a policy goal, it is a challenging task to define and measure the equality of healthcare services [30]. Researchers have proposed various principles of equity, including equal access to healthcare services, equal utilization of healthcare services, and equal health outcomes, among which equal access to healthcare services is considered easier to quantify and operationalize [11,12]. Many studies have attempted to evaluate the equality of healthcare services from the perspective of the equality of accessibility [31,32]. Accessibility equality has also been applied in the location optimization of healthcare facilities in some pilot studies [16,18,19,20].

2.2. Accessibility Measures Considering Multiple Transport Modes

Accessibility depends on the available transport modes for people to reach facilities [5]. Owing to advances in travel time estimation, a growing number of studies have considered multiple transport modes in measuring accessibility [21,22,23]. In these studies, the reality that people (especially urban residents) usually travel by multiple transport modes can be reflected in the models. Some studies attempt to measure accessibility by different transport modes separately and compare the modal disparities in accessibility [21,33,34,35,36]. However, these studies assume that the service resources at each facility are repetitively calculated in the analysis by each transport mode, which might be unrealistic. In contrast, demanders traveling by various transport modes are likely to select the same facility for a service [24].
In this regard, some researchers have appealed for the consideration of competition for services among demanders by various transport modes [24,25,26]. Mao and Nekorchuk [24] proposed an extended 2SFCA model, namely the multimodal 2SFCA model, which incorporates multiple transport modes into the widely used 2SFCA model. In this model, the demanders living in each spatial unit are divided into various subgroups based on the transport modes that they can use. There is competition for facility services among these subgroups depending on the travel time costs to and the coverage areas of facilities. Langford et al. [25] and Tao et al. [26] further improved the formulation of the multimodal 2SFCA model. Overall, the existing studies reveal significant inequalities in accessibility to resources (e.g., healthcare services, parks, schools, or job opportunities) among different transport mode subgroups [24,25,26,37,38,39]. These findings highlight the necessity of incorporating multiple transport modes into the measurement and optimization of accessibility to facilities.

2.3. Models for the Optimization of the Equality of Accessibility

Location-allocation models have been developed to optimize the spatial distribution of facilities [13,14,15]. Although both efficiency and equality are important goals in the planning of public facilities, most previous location-allocation modeling studies have focused on efficiency goals [6]. Efficiency-oriented optimization objectives include a minimized travel cost from demanders to the closest facilities (i.e., the p-median problem) [14], a minimized number of facilities that can cover all demanders (i.e., the location set covering problem or LSCP) [40], or a maximized coverage of demanders by a given number of facilities (i.e., the maximal covering location problem or MCLP) [41]. As Wang and Tang [16] have noted, the equality of public services is difficult to measure and optimize in location-allocation problems.
The maximal accessibility equality (MAE) model, proposed by Wang and Tang [16], is an important advancement in location-allocation modeling that operationalizes the equality of public services as the degree of disparity in spatial accessibility to public services. The maximal equality problem is then transformed into a quadratic programming problem to determine the distribution of services that minimizes the disparity in accessibility. Subsequent studies have applied and improved the MAE model in terms of introducing a new solution algorithm [20], combining location optimization and capacity optimization [18], and balancing equality and efficiency [19,42,43,44].
However, most existing location-allocation models (both the MAE model and traditional models) have limitations in the consideration of transport modes. In previous studies, it was assumed that people would travel for public services via a single transport mode (usually by car) [16,17,18,19,20]. A recent study [45] further revealed that transport modes have significant impacts on the optimization results of the MAE model. However, the study implemented the MAE model based on car travel and public transport separately, overlooking the competition among various subgroups by transport modes.
In summary, the existing location-allocation models overlook the possibility that residents travel by multiple transport modes and thus might bias the optimization results and lead to incorrect policy suggestions. The distribution of resources suggested by traditional single-modal location-allocation models might lead to unequal accessibility for residents using different transport modes. Therefore, there is an urgent need to incorporate multimodal spatial accessibility into the MAE model, which can significantly improve the equality-oriented location-allocation models. This study aims to fill this gap by developing a maximal multimodal accessibility equality (MMAE) model.

3. Materials and Methods

In this section, we first describe the multimodal 2SFCA method for the measurement of multimodal accessibility. Then, the maximal multimodal accessibility equality (MMAE) model is developed. Finally, the study area and data for the case study are introduced.

3.1. Measuring Multimodal Accessibility

From the perspective of multimodal accessibility [24,46], residents at a location might rely on various transport modes to travel to facilities and thus can be divided into various subgroups by transport mode. These subgroups are potential demanders and will compete for services. However, the accessibility of different subgroups might be unequal because the travel time typically differs by transport mode. Such competition effects among different subgroups cannot be modeled by separately measuring accessibility based on each transport mode. The multimodal 2SFCA method proposed by Mao and Nekorchuk [24] incorporates the competition effect into the framework of 2SFCA, one of the most popular accessibility measures. The method was further advanced by subsequent studies [25,26].
It is a key issue to decide which transport modes should be included in the MMAE model. According to a survey in Beijing [47], motorized transport modes (including subway, bus, car, taxi) account for about 90% of hospital trips. Two transport modes, i.e., car and public transport, are considered in this study due to the following reasons. First, the two modes can reflect the differences in the available travel routes for different transport modes. The former includes the modes (e.g., private car and taxis) that can travel on most roads, while the latter includes the subway and buses, which can only travel on fixed routes [26]. Second, the shares of different transport modes are essential variables in the multimodal 2SFCA model and MMAE model. These data were obtained from the household travel survey of Shenzhen [26], which only involves motorized transport modes. This study classified this dataset into the car and public transit modes. Third, these two modes can also represent the affordability of different socioeconomic groups. Private cars are available to only a fraction of households, whereas public transport can be accessed by all residents. Fourth, as for public general hospitals whose service ranges are relatively large, most people need to travel relatively long distances to general hospitals. Therefore, they are more likely to take cars (private cars or taxis) or public transport than walking or bicycling.
In the following equations, the public transport and car modes are denoted by superscripts p and c, respectively. The accessibility for each mode that accounts for intermodal competition can be calculated as follows:
A i p = j S j f ( d i j p ,     D p   ) k [ H k p f ( d k j p , D p ) + H k c f ( d k j c ,     D c ) ]
A i c = j S j f ( d i j c ,     D c   ) k [ H k p f ( d k j p , D p   ) + H k c f ( d k j c ,     D c ) ]
where A i p and A i c are the accessibility at location i for public transport and cars, respectively; S j is the resources of hospital j (i.e., the number of physicians); H k p and H k c are the populations in zone k that use the two modes, respectively, calculated from the share of each transport mode and the population in each zone; d k j p and d k j c are the travel times from zone k to facility j by the two modes, respectively; D p and D c are the catchment area sizes of the facilities in the two modes, respectively; f is the distance decay function, which takes a Gaussian function form:
f ( d i j m , D m ) = { e 1 / 2 × ( d i j m / D m ) 2 e 1 / 2 1 e 1 / 2 ,       d i j m D m 0 ,       d i j m > D m
where m represents the transport mode, which can be public transport (p) or car (c); D m is the catchment area size of the facilities; the other variables are the same as in Equations (1) and (2).
When applying the multimodal 2SFCA model, a key step is to set up the catchment area size of the facilities ( D m ), which reflects the maximum travel time that people are willing to travel to access a hospital. According to the estimated travel time data, the shortest travel times to the nearest facilities by the car and public transit modes were first calculated (about 50 and 90 min, respectively). Following the procedure for determining the catchment area size in existing studies [26,45], to ensure that all demanders can reach at least one healthcare facility within this threshold via either transport mode, D c and D p were both set as 90 min. Note that although D c equals D p , the distance that can be reached is different for the two modes. Generally, the average travel speed by car is faster than that by public transit. Therefore, more hospitals can be accessed within the 90 min catchment area from a given location by car than by public transit, but the accessibility to these hospitals would be more significantly discounted by the distance decay effect. This unified setting can reflect the advantages of the car mode against the public transit mode, but also significantly simplify the modeling.
The overall multimodal accessibility at each location can be calculated by integrating the accessibility by the two modes as follows:
A i o = H k p A i p + H k c A i c H k p + H k c
where A i o is the overall accessibility in zone i considering the two modes. It can be interpreted as the supply-to-demand ratio, i.e., physicians/people. It is further multiplied by 1000 to make the scores more concise. Therefore, the unit of the accessibility score displayed in the Results section is “physicians/thousand persons”. The other variables are the same as in Equations (1) and (2).

3.2. The Maximal Multimodal Accessibility Equality Model

The maximal accessibility equality model proposed by Wang and Tang [16] leverages the disparity in accessibility across various locations to quantify the inequality of public services (e.g., healthcare services). The objective of the model is to maximize the equality of accessibility (i.e., to minimize inequality) by finding a solution with minimal disparity in accessibility. In this study, we extend the MAE model (i.e., MMAE model) by incorporating multimodal accessibility. In the multimodal context, residents living in each zone travel to healthcare facilities via different modes. Therefore, multimodal accessibility, rather than the single-modal accessibility adopted in existing studies, is superior in representing the overall healthcare accessibility of residents. To improve the equality of healthcare services, the disparity in multimodal healthcare accessibility across all locations in a city should be reduced. Therefore, in the newly proposed MMAE model, the objective function is established using multimodal accessibility, rather than the single-modal accessibility employed in the traditional MAE model.
The maximal multimodal accessibility equality (MMAE) model can be formulated in two parts. The first part is the objective function, which seeks to minimize the disparity in multimodal healthcare accessibility. Various indicators can be used to measure (in)equality [48,49]. As verified by Tao et al. [45], the MAE model performs better in maximizing the equality of accessibility when the mean absolute deviation (MAD) indicator is adopted in the objective function. The MAD is a measure of disparity or inequality. The smaller the MAD of accessibility is, the better the equality. The objective function taking an MAD form can be expressed as
m i n i m i z e   M A D = i n H i | A i o i n H i A i o i n H i | i n H i
where A i o is the overall multimodal healthcare accessibility in zone i; H i is the total population in zone i; the expression within the absolute value sign represents the absolute deviation between A i o and the population-weighted average accessibility; n is the number of zones.
The second part is the constraints of the optimization model. First, the decision variable, i.e., the supply size S j at each candidate facility location, determines healthcare accessibility and is related to the objective function. These constraints are formulated according to the multimodal 2SFCA method expressed by Equations (1)–(4). The size of each facility ( S j ) was constrained by the lower and upper bounds. The former was set slightly smaller than the smallest size of the actual facilities (20 physicians), while the latter was set slightly larger than the largest size of the actual facilities (1000 physicians). Note that the distribution of healthcare facilities can be optimized via location optimization or capacity optimization [18]. The former optimizes the locations of facilities, whereas the latter retains the actual facility locations but optimizes their service capacities. When applying the location optimization strategy, it is necessary to determine the candidate locations, which is unavoidably arbitrary. Therefore, the capacity optimization strategy was adopted in this study. Following previous studies [20,45], the MAE model and the improved MMAE model were solved via the particle swarm optimization (PSO) algorithm developed by Kennedy and Eberhart [50].

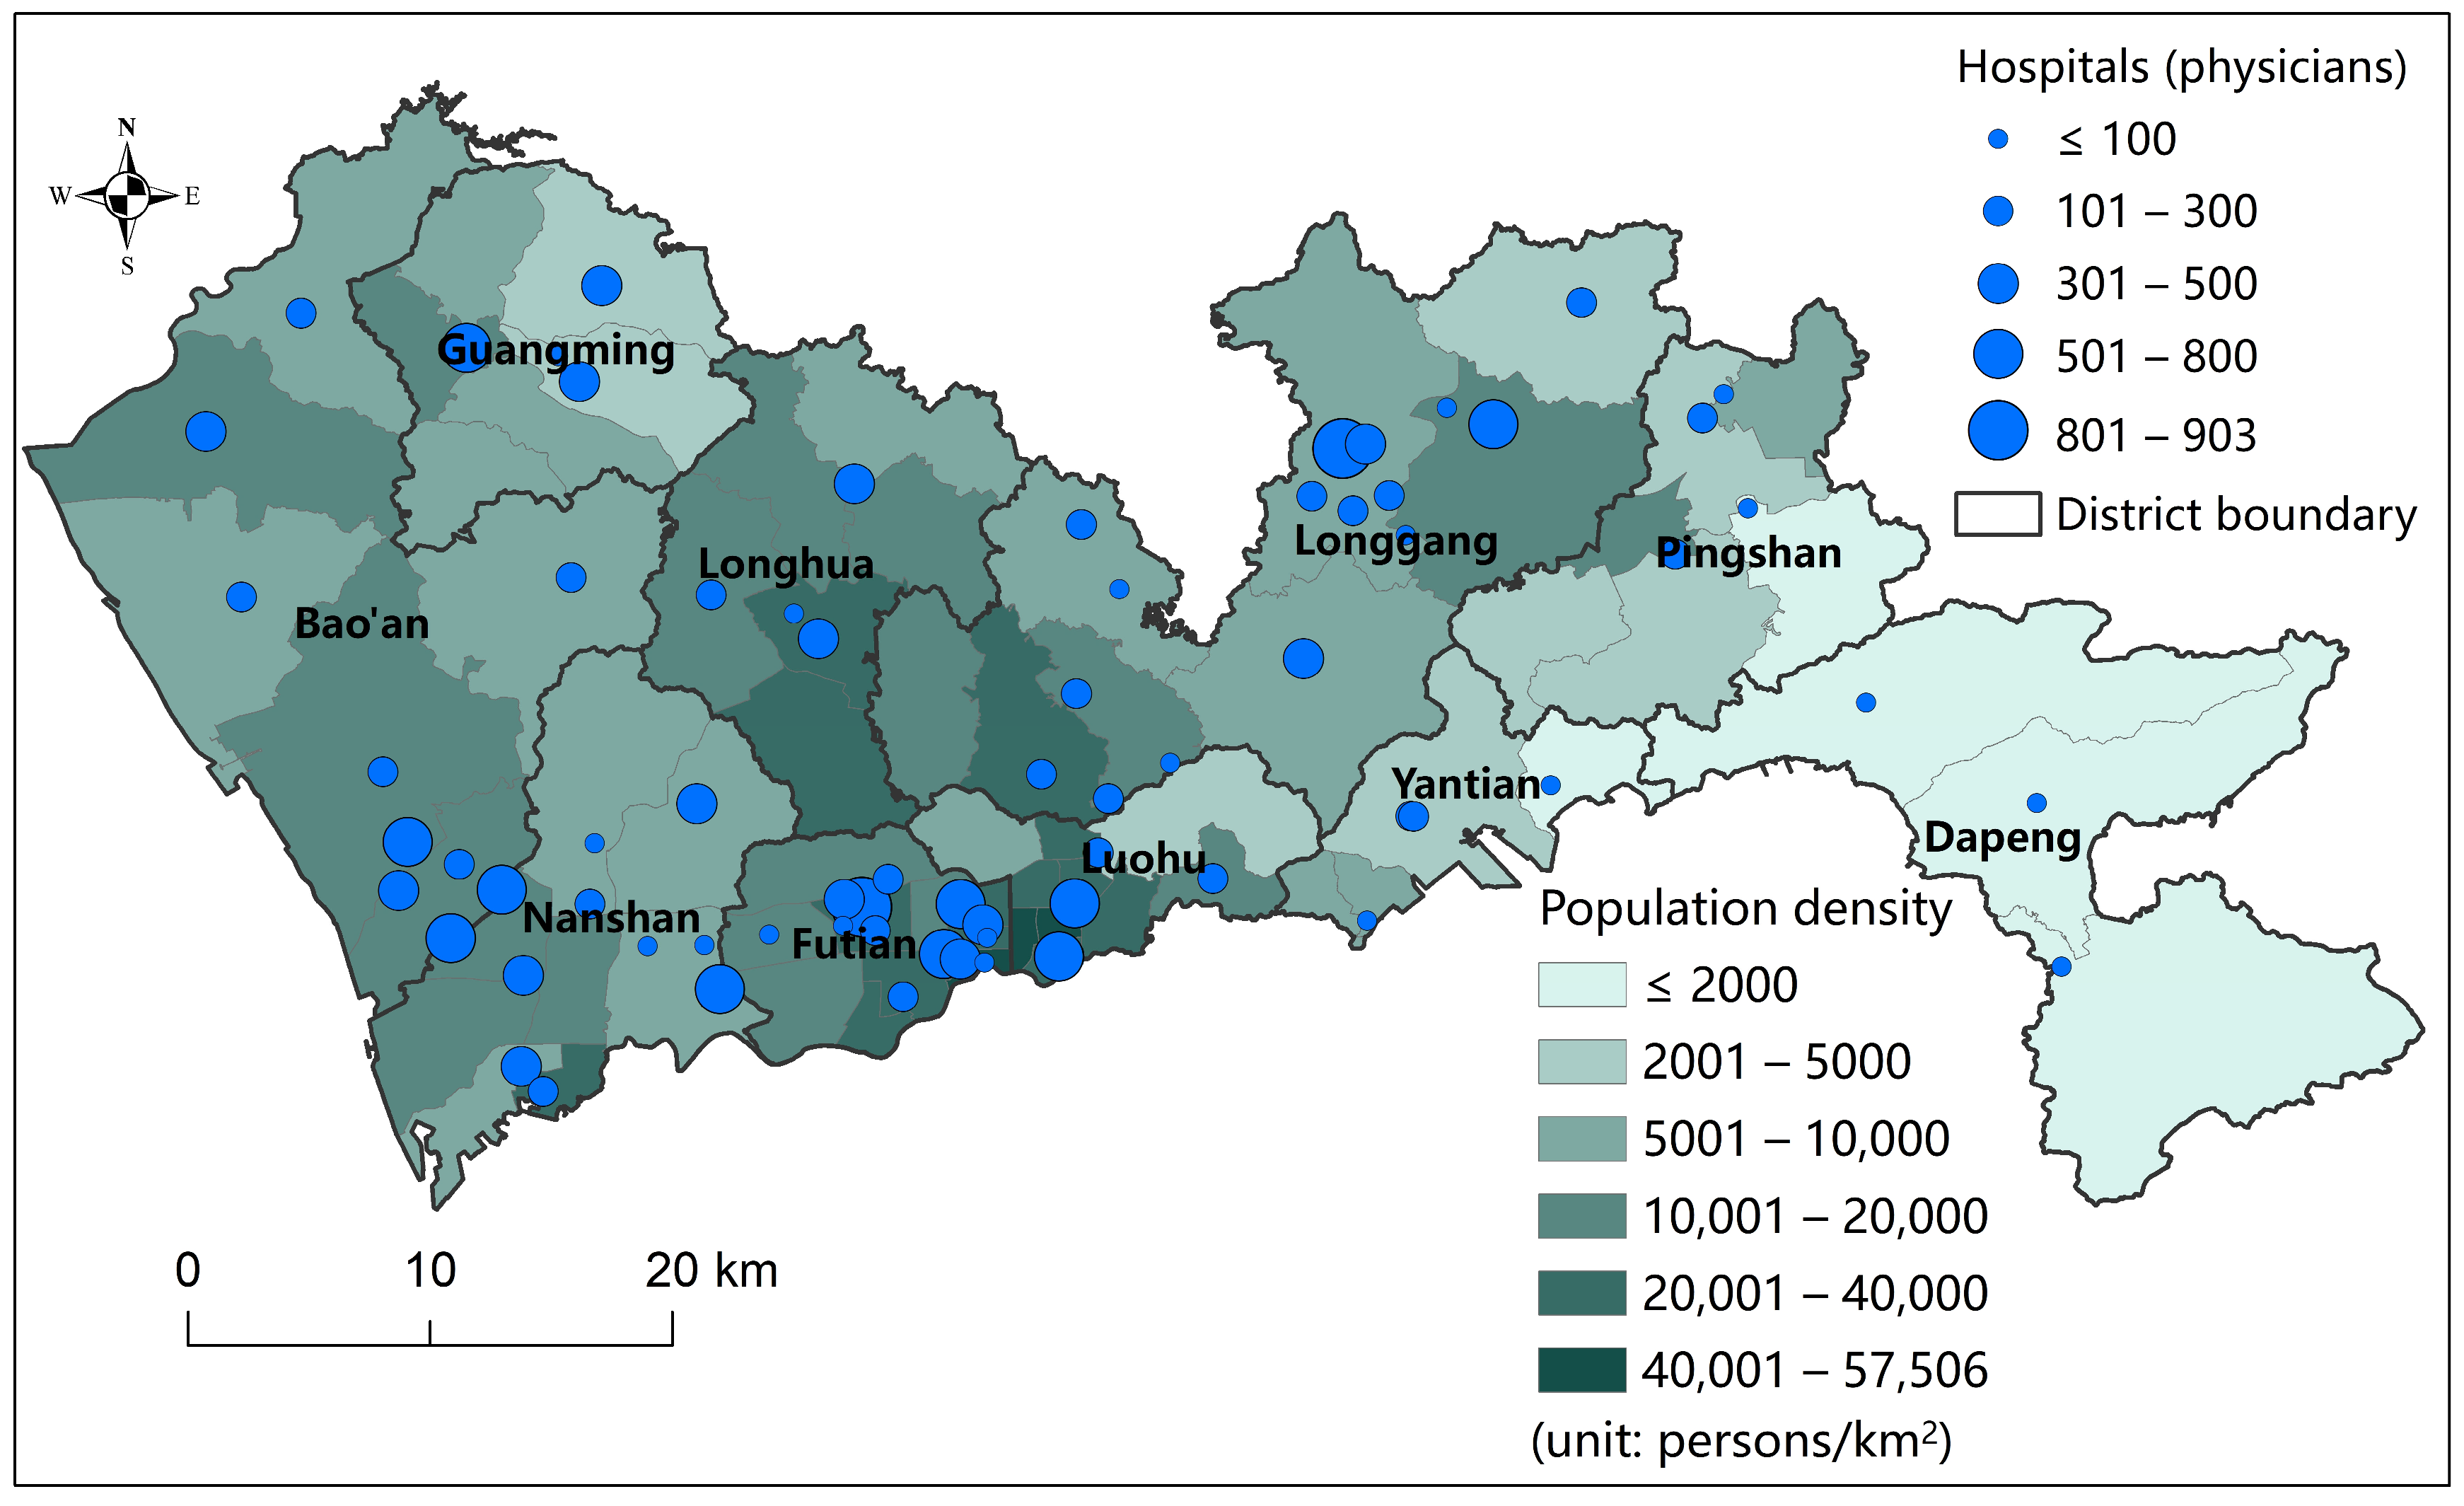
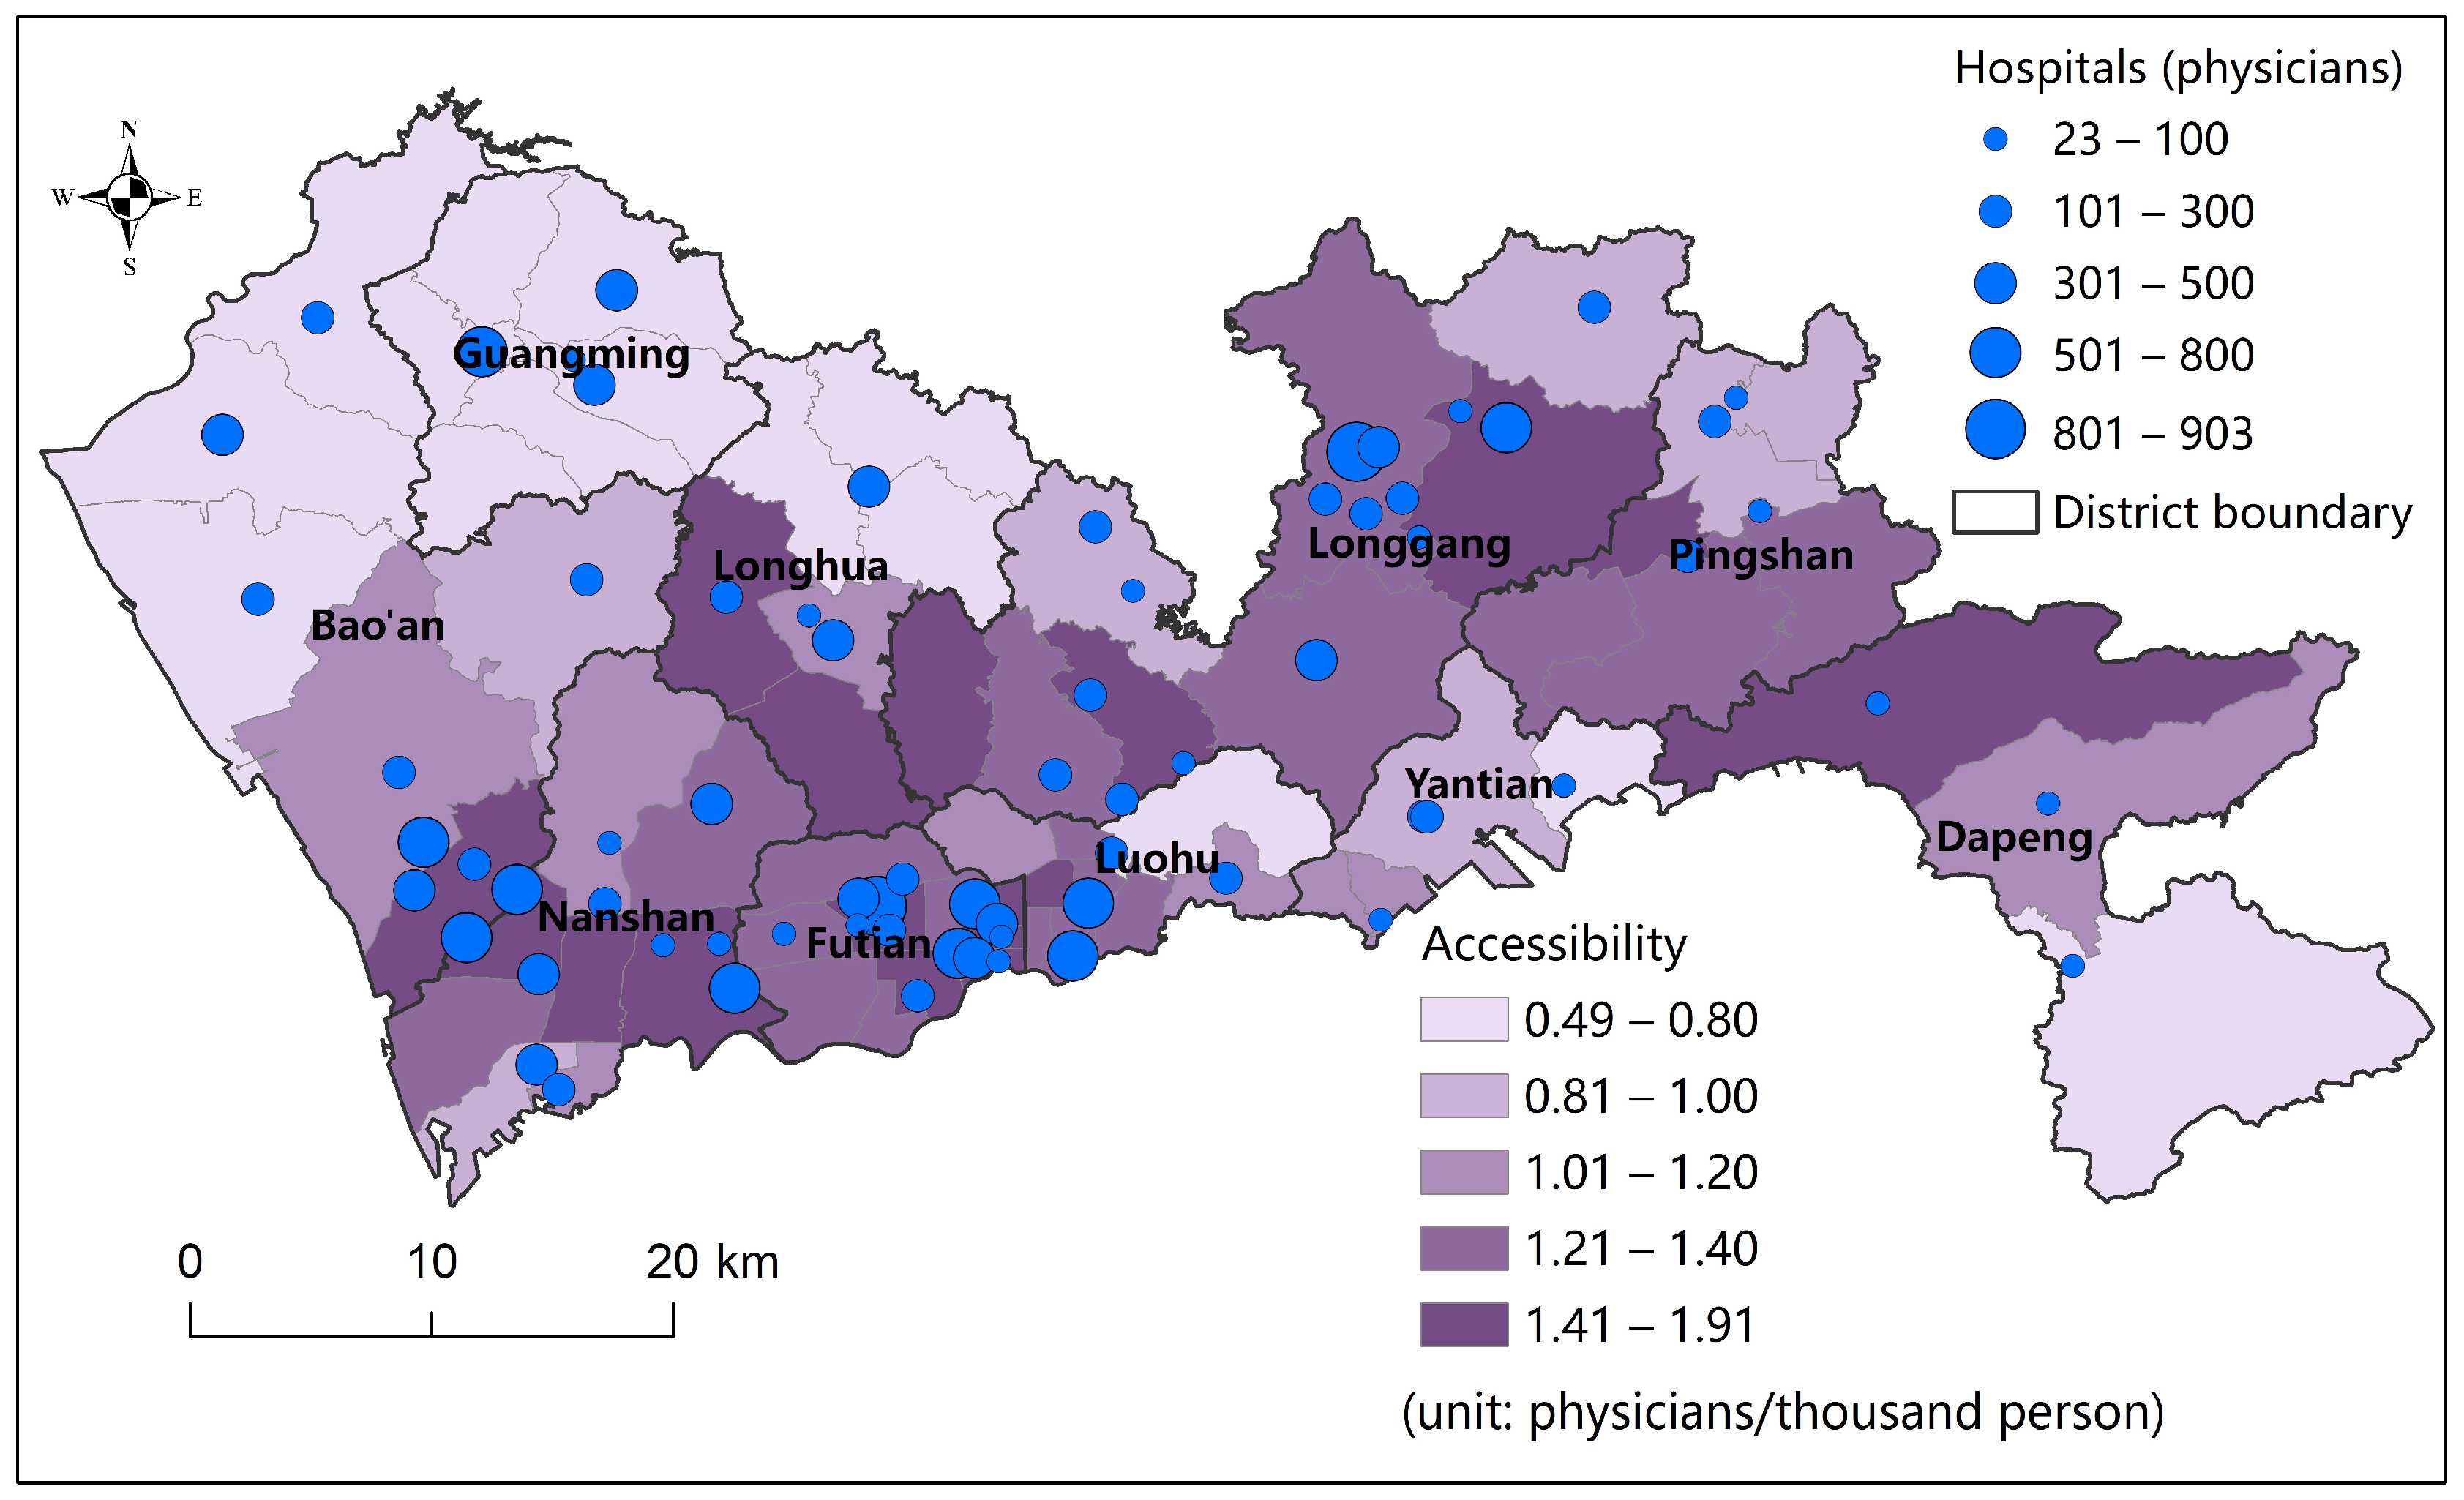
3.3. The Study Area and Data

The methods are applied to a case study of Shenzhen, China. Shenzhen, located in Guangdong Province, is a megacity with a total population of 17.56 million in 2020. After more than 40 years of rapid urbanization and industrialization, Shenzhen has made considerable progress in its economic development but still faces great challenges in providing accessible and equal public services to the growing population. Previous studies have revealed significant inequalities in accessibility to healthcare services in Shenzhen and appealed for improvements in healthcare service equality [33].
Three types of data were collected and used in the case study. First, the permanent population at the subdistrict level in 2020 was collected from the seventh national population census [51], the most reliable population dataset in China. There were 74 subdistrict units with an average population of 237.30 thousand persons and an average area of 26.99 km2. These subdistricts were under the jurisdiction of ten districts, among which the Luohu, Futian, and Nanshan Districts are usually regarded as the central districts of Shenzhen.
Second, the healthcare facility data were collected from the official website of the Health Commissions of Shenzhen Municipality [52]. In total, 71 public general hospitals were included in our analyses. Their information, including their names, addresses, and numbers of physicians, was collected in July 2021. The geographical coordinates of these facilities were then obtained using the Geocoding Application Programming Interface (API) of Baidu Maps. The distributions of the population density and healthcare facilities are shown in Figure 1.
Third, to improve the accuracy of the travel time estimation, the population data at the community level in 2010 were also collected. The locations of communities were represented by the community service centers. The travel times from the communities to the healthcare facilities were estimated by calling the Direction API of Baidu Maps. The Direction API is widely considered an accurate and reliable approach to estimating travel times because it comprehensively considers the distributions of stations, traffic conditions (e.g., vehicle speed limit and waiting time for public transport), and travel strategies (e.g., fastest or less transfer) [26,33,39]. More information is available in the official instructions provided by Baidu Maps (https://lbsyun.baidu.com/faq/api?title=webapi/direction-api-v2, accessed on 23 July 2024). The data collection was conducted between 10 a.m. and 5 p.m. on weekdays to avoid extreme travel times during peak hours. The Driving Direction API and Transit Direction API were used to estimate travel times by driving or by public transit (including subway, buses, a mixture of them, and also transfer times and walking times to/from stations), respectively. Due to the lack of the latest community-level population data in 2020, the travel times from communities to facilities were then aggregated into population-weighted average travel times at the subdistrict scale based on the community-level population data in 2010. The travel times from subdistricts to facilities were used in calculating the accessibility and solving the MMAE model. The shares of driving and public transit are two essential variables in the multimodal 2SFCA model. They were set up based on the shares of driving and public transit in each district according to the household travel survey of Shenzhen [26].
Inspired by previous studies [45], we considered two optimization scenarios. In the first scenario, termed the resource reallocation scenario, the locations of existing facilities were kept fixed, and the aim was to optimize the resource reallocation among these facilities. The resource reallocation scenario can serve as a baseline for the comparison of various models and the actual situation. However, this scenario could only provide limited reference value for the planning of healthcare facilities since large-scale adjustments of existing facilities were costly.
To better support planning, the second scenario was introduced, namely the new resource allocation scenario. In this scenario, the existing facilities were preserved with their actual sizes, and a given number of resources was added. The aim was to optimize the allocation of these newly added resources among the facilities. According to the “14th Five-Year Plan of Health Development in Shenzhen” [53], the total number of physicians is expected to increase by 23.2% from 2020 to 2025. Therefore, in the new resource allocation scenario, 4622 physicians were added and allocated to the existing 71 facilities.

4. Results

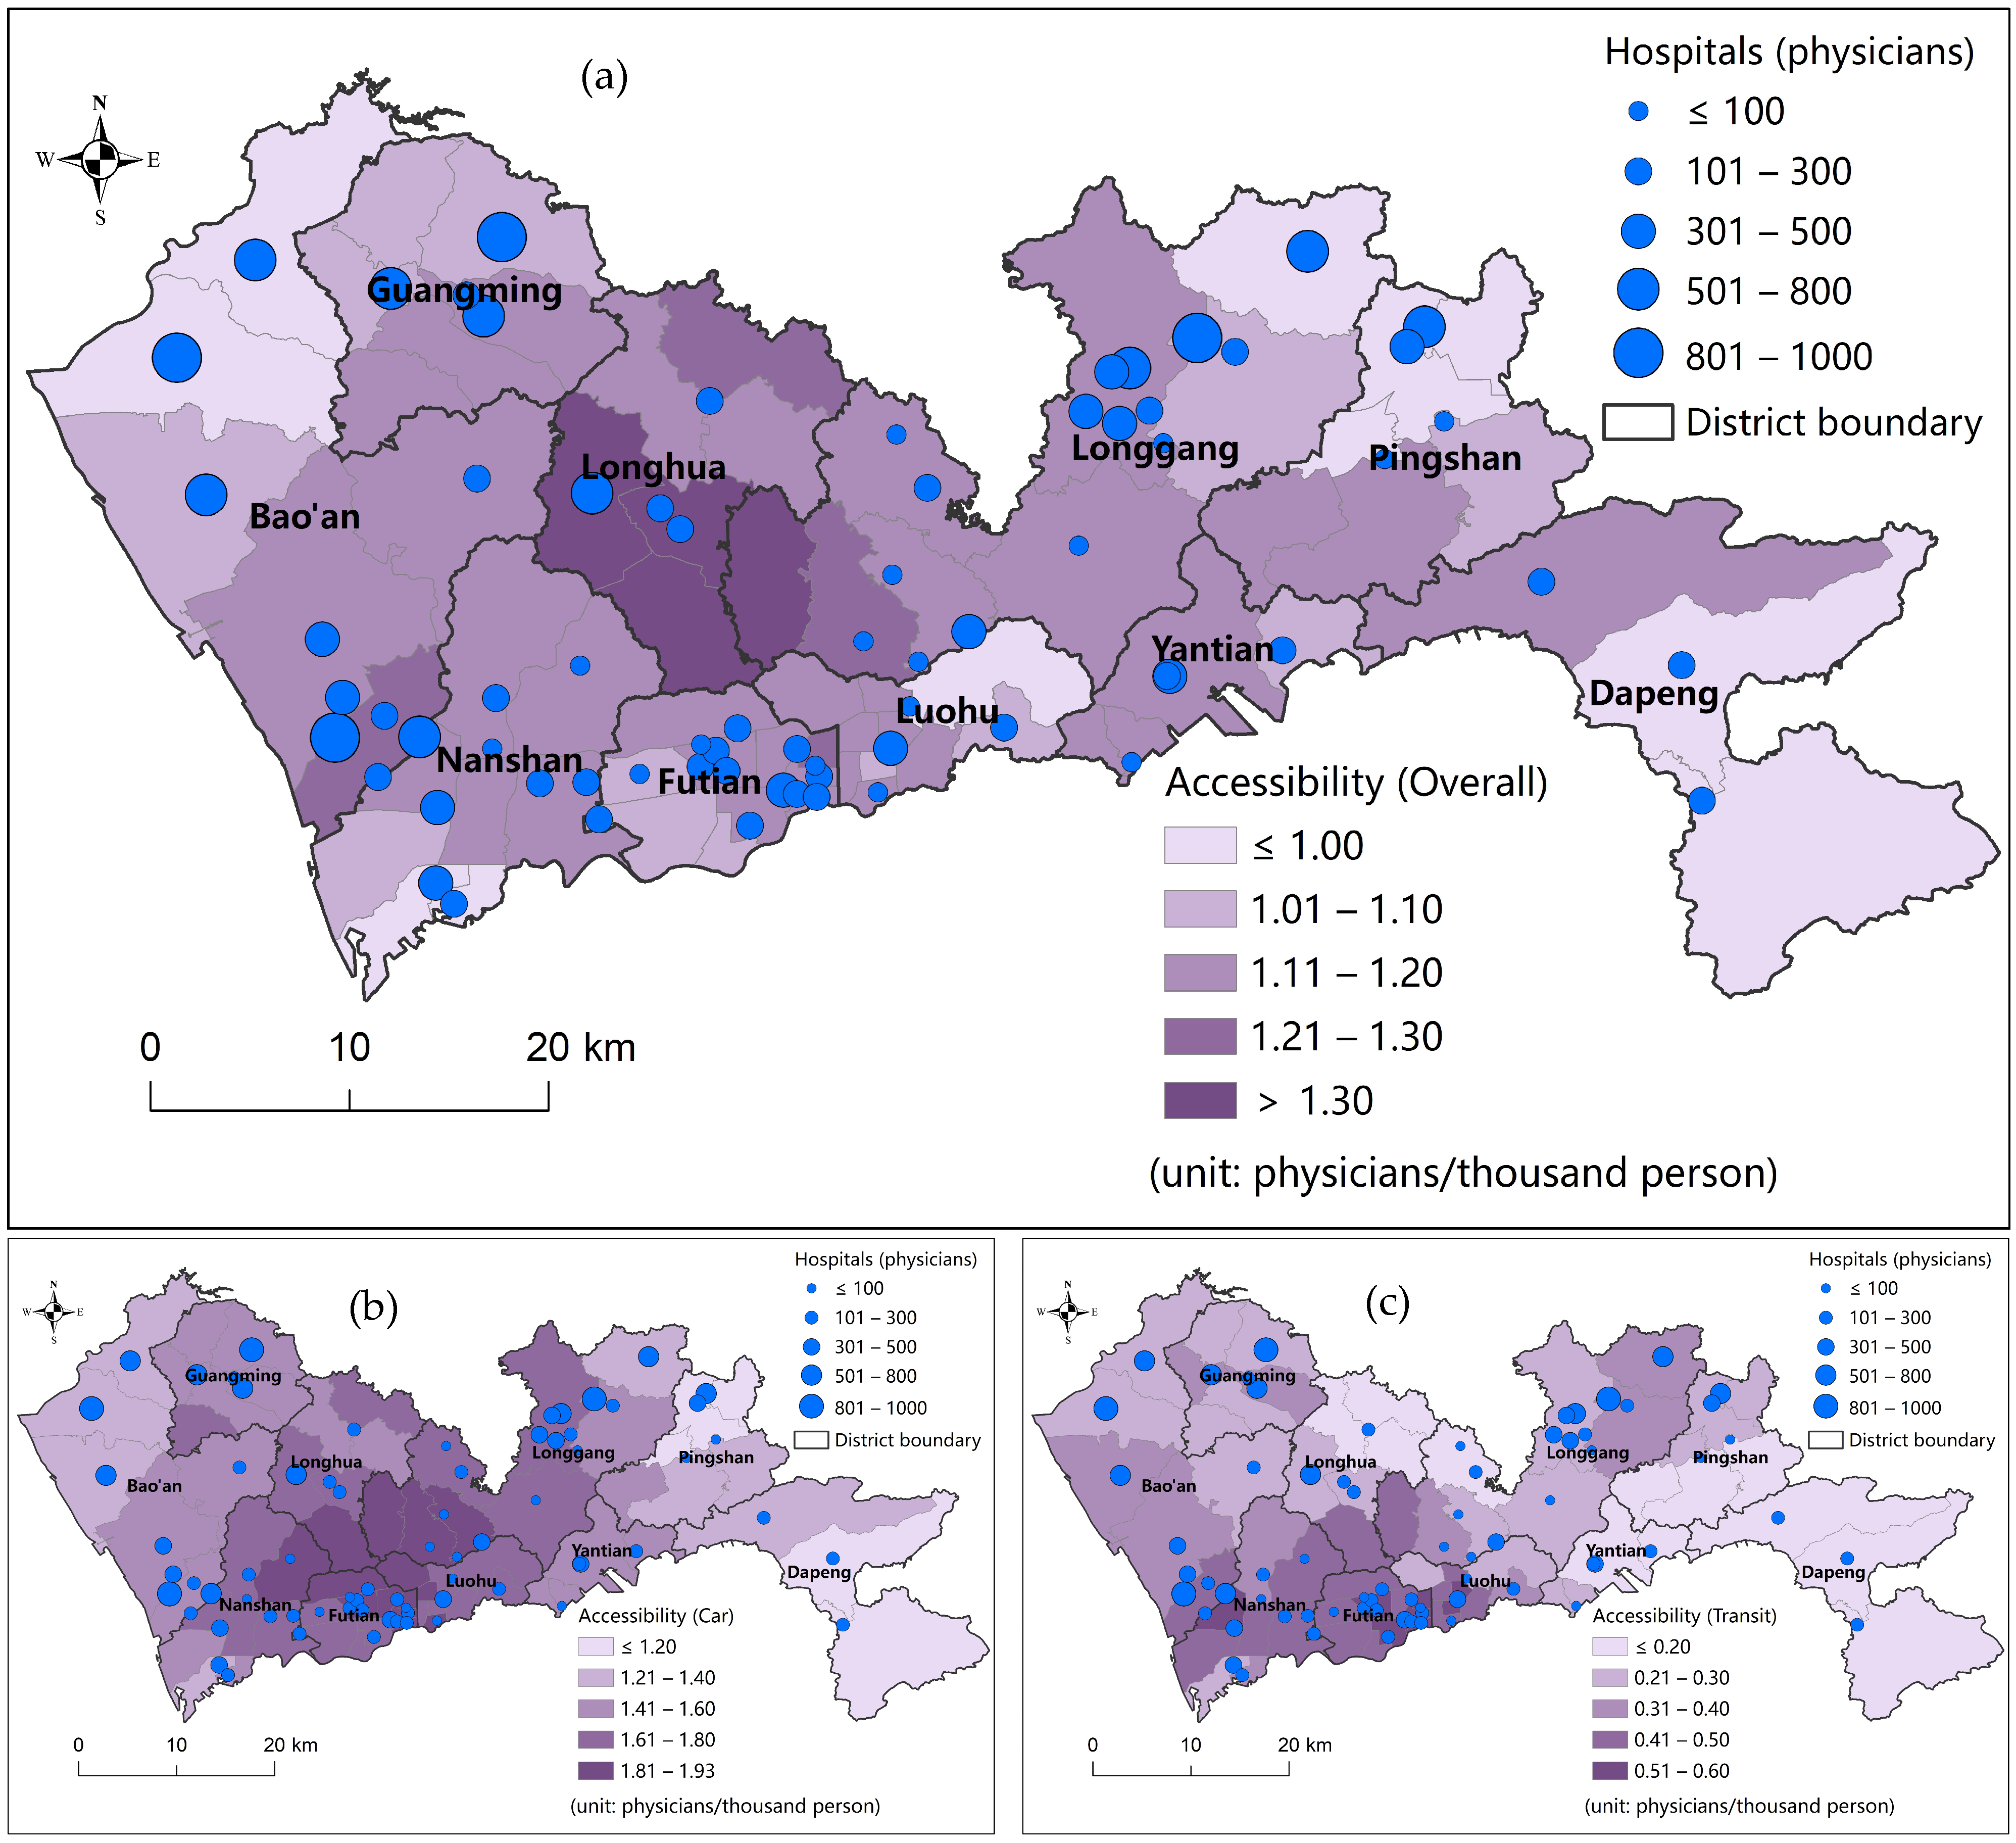
4.1. Optimization Results of the MMAE Model

The distribution of the actual overall multimodal accessibility to general hospitals measured by the multimodal 2SFCA method is shown in Figure 2. In Shenzhen, the existing hospitals are densely distributed in the central districts but relatively sparsely distributed in the peripheral districts (e.g., Bao’an, Guangming, Longhua, Pingshan, Yantian, and Dapeng). The actual multimodal accessibility to hospitals shows an uneven distribution pattern. High accessibility is observed mainly in the three central districts and the adjacent areas in Longhua and Longgang. In Pingshan and Dapeng, the accessibility is relatively high due to both a relatively poor supply of (i.e., sparse and small-sized facilities) and demand (i.e., low population density) for healthcare services. In contrast, the accessibility in Guangming, Northern Bao’an, and Northern Longhua is relatively low.
The optimization results of the MMAE model are visualized in Figure 3. After optimization, more large facilities (>800 physicians) are located in peripheral districts such as Bao’an, Guangming, Longgang, Pingshan, and Longhua. In contrast, most facilities in the central districts are allocated medium sizes (301–500 physicians), where the facilities are densely distributed and serve high-density populations. The optimized overall healthcare accessibility (Figure 3a) is obviously more equal than the actual accessibility (Figure 2), with the MAD of the accessibility values being 0.087 and 0.287 physicians per thousand persons, respectively. The equality of multimodal healthcare accessibility is significantly improved by 69.7% compared to the status quo (see Table 1).
Despite the overall multimodal accessibility, optimized car- and transit-modal accessibility can also be obtained from the MMAE model. As shown in Figure 3b, the optimized car-modal accessibility is slightly higher in the adjacent areas of Futian, Luohu, Nanshan, Longhua, and Longgang, which are proximate to the geometric center of Shenzhen. It gradually decreases from this center to the peripheral areas. As shown in Figure 3c, the optimized transit-modal accessibility is higher in the central areas, i.e., Futian, Luohu, and Nanshan, because the transit network is more developed in these central areas.

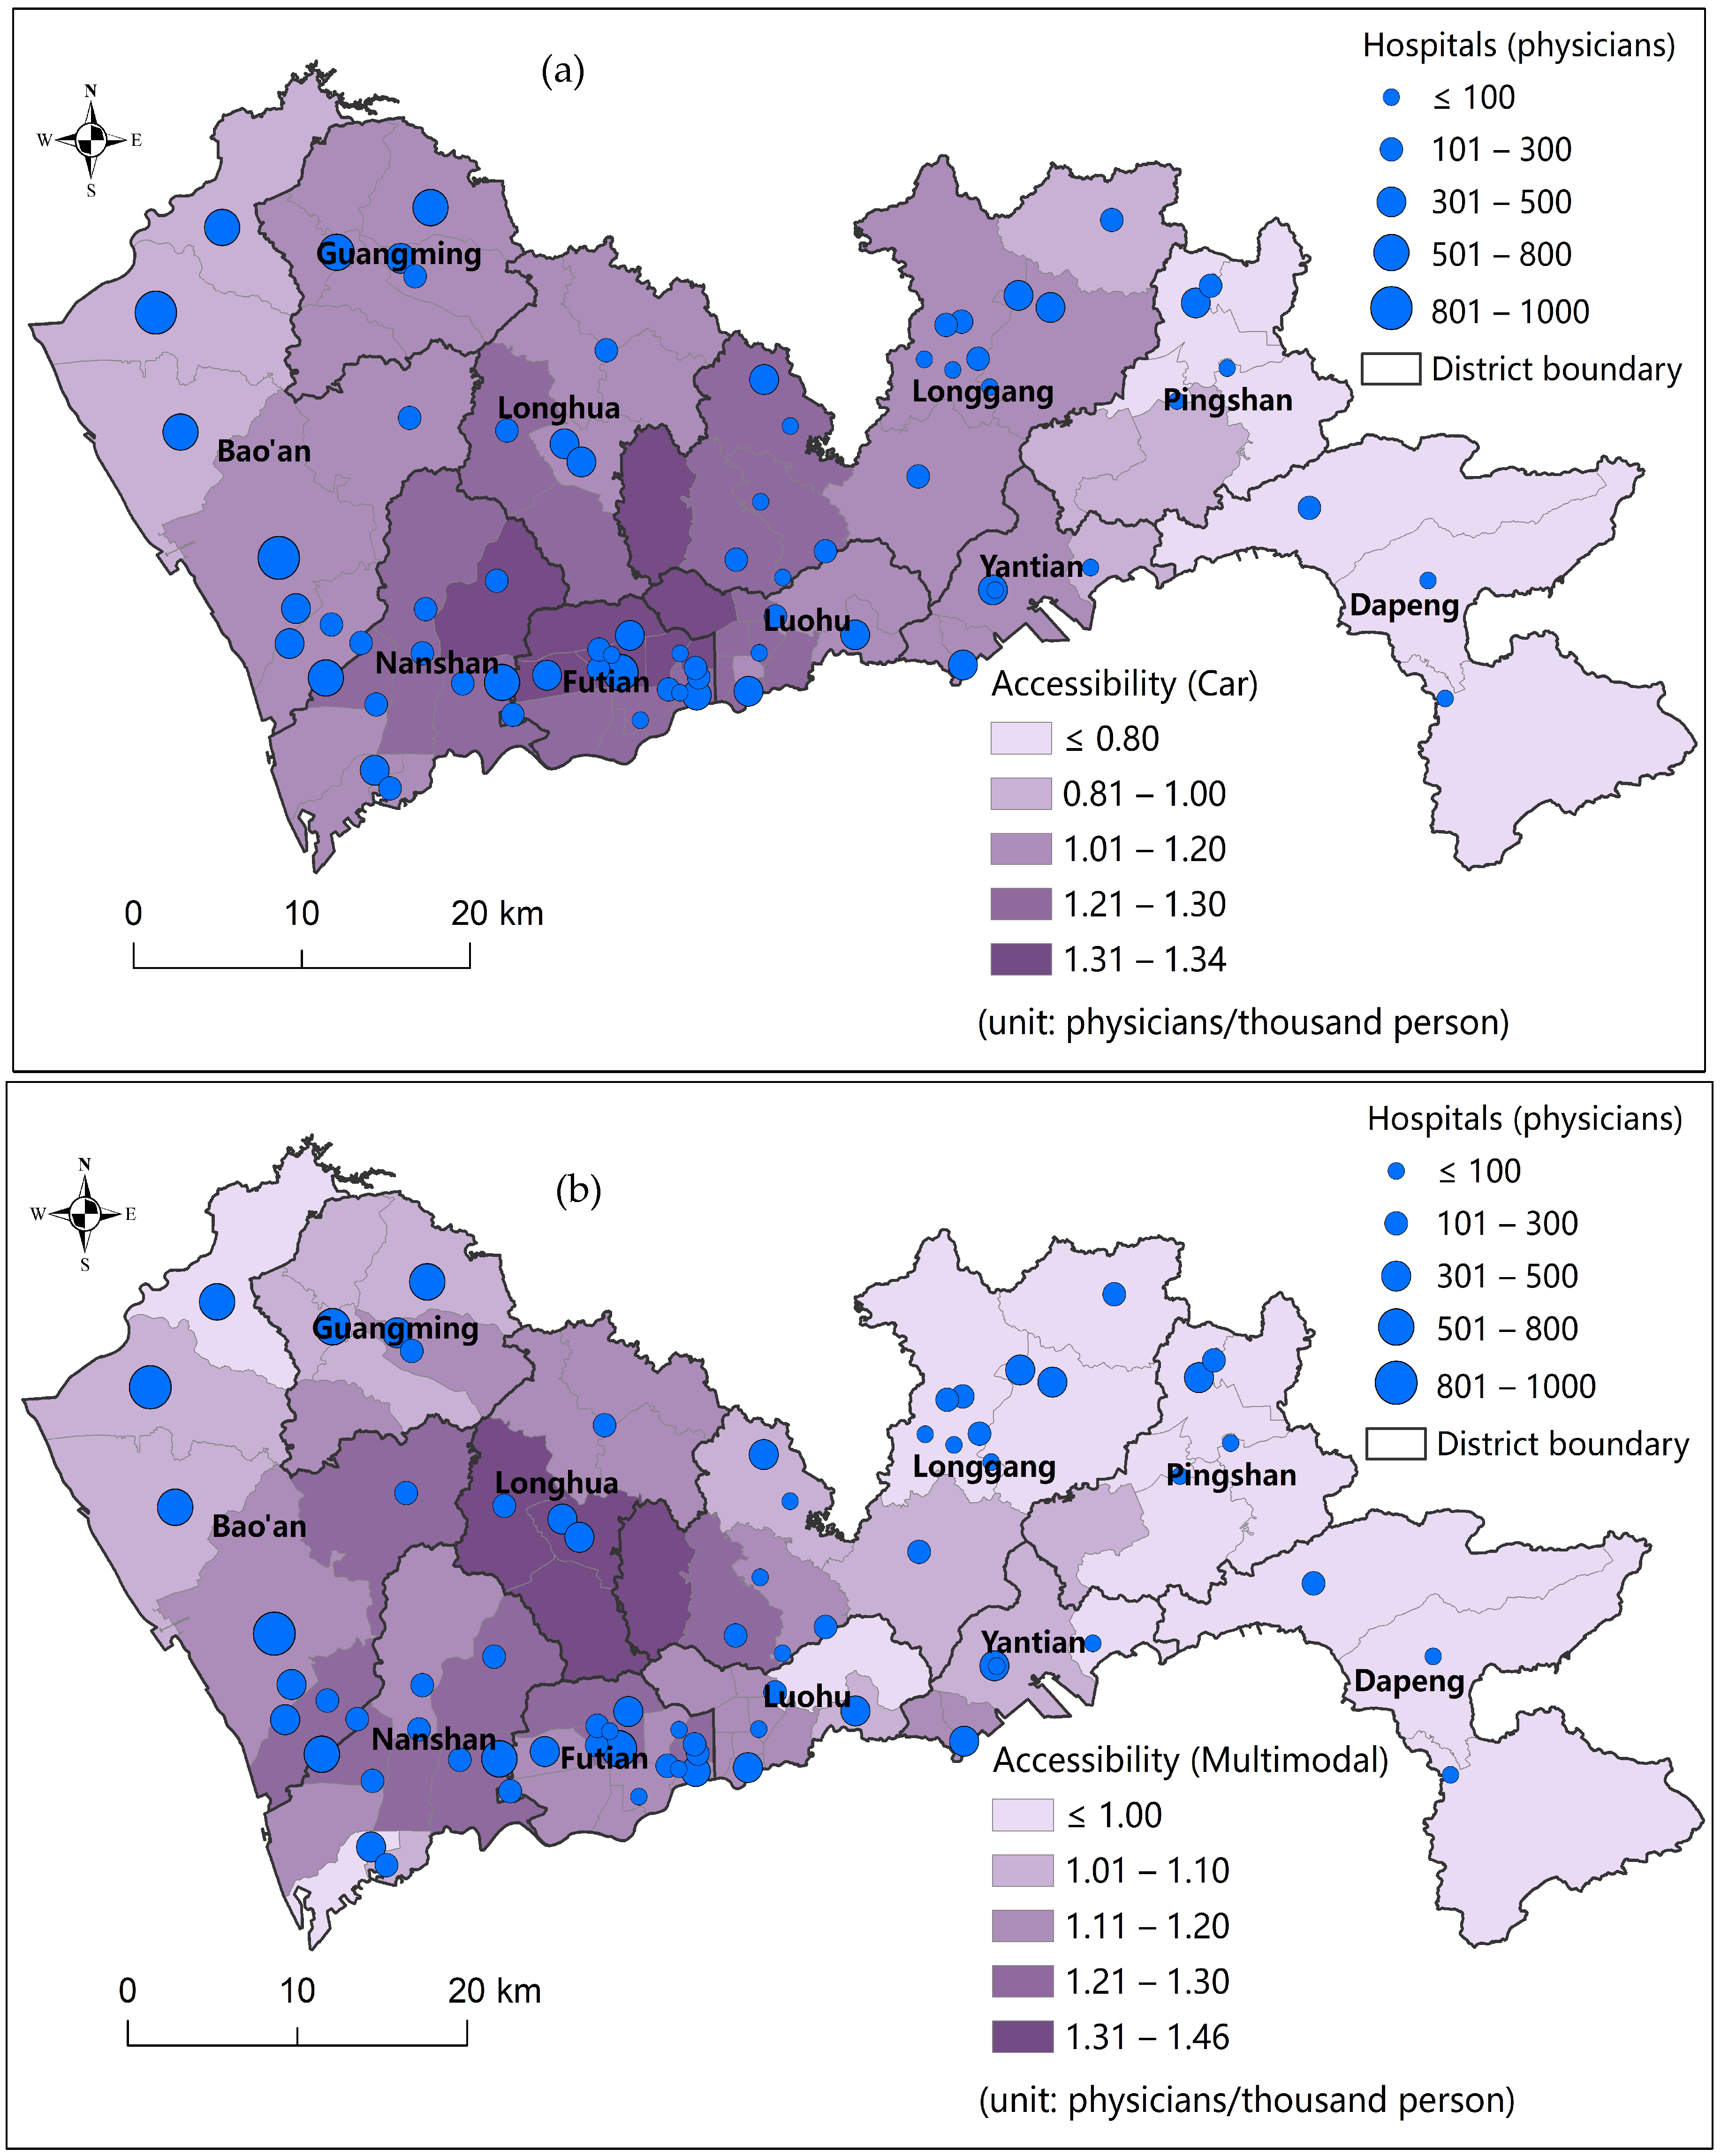
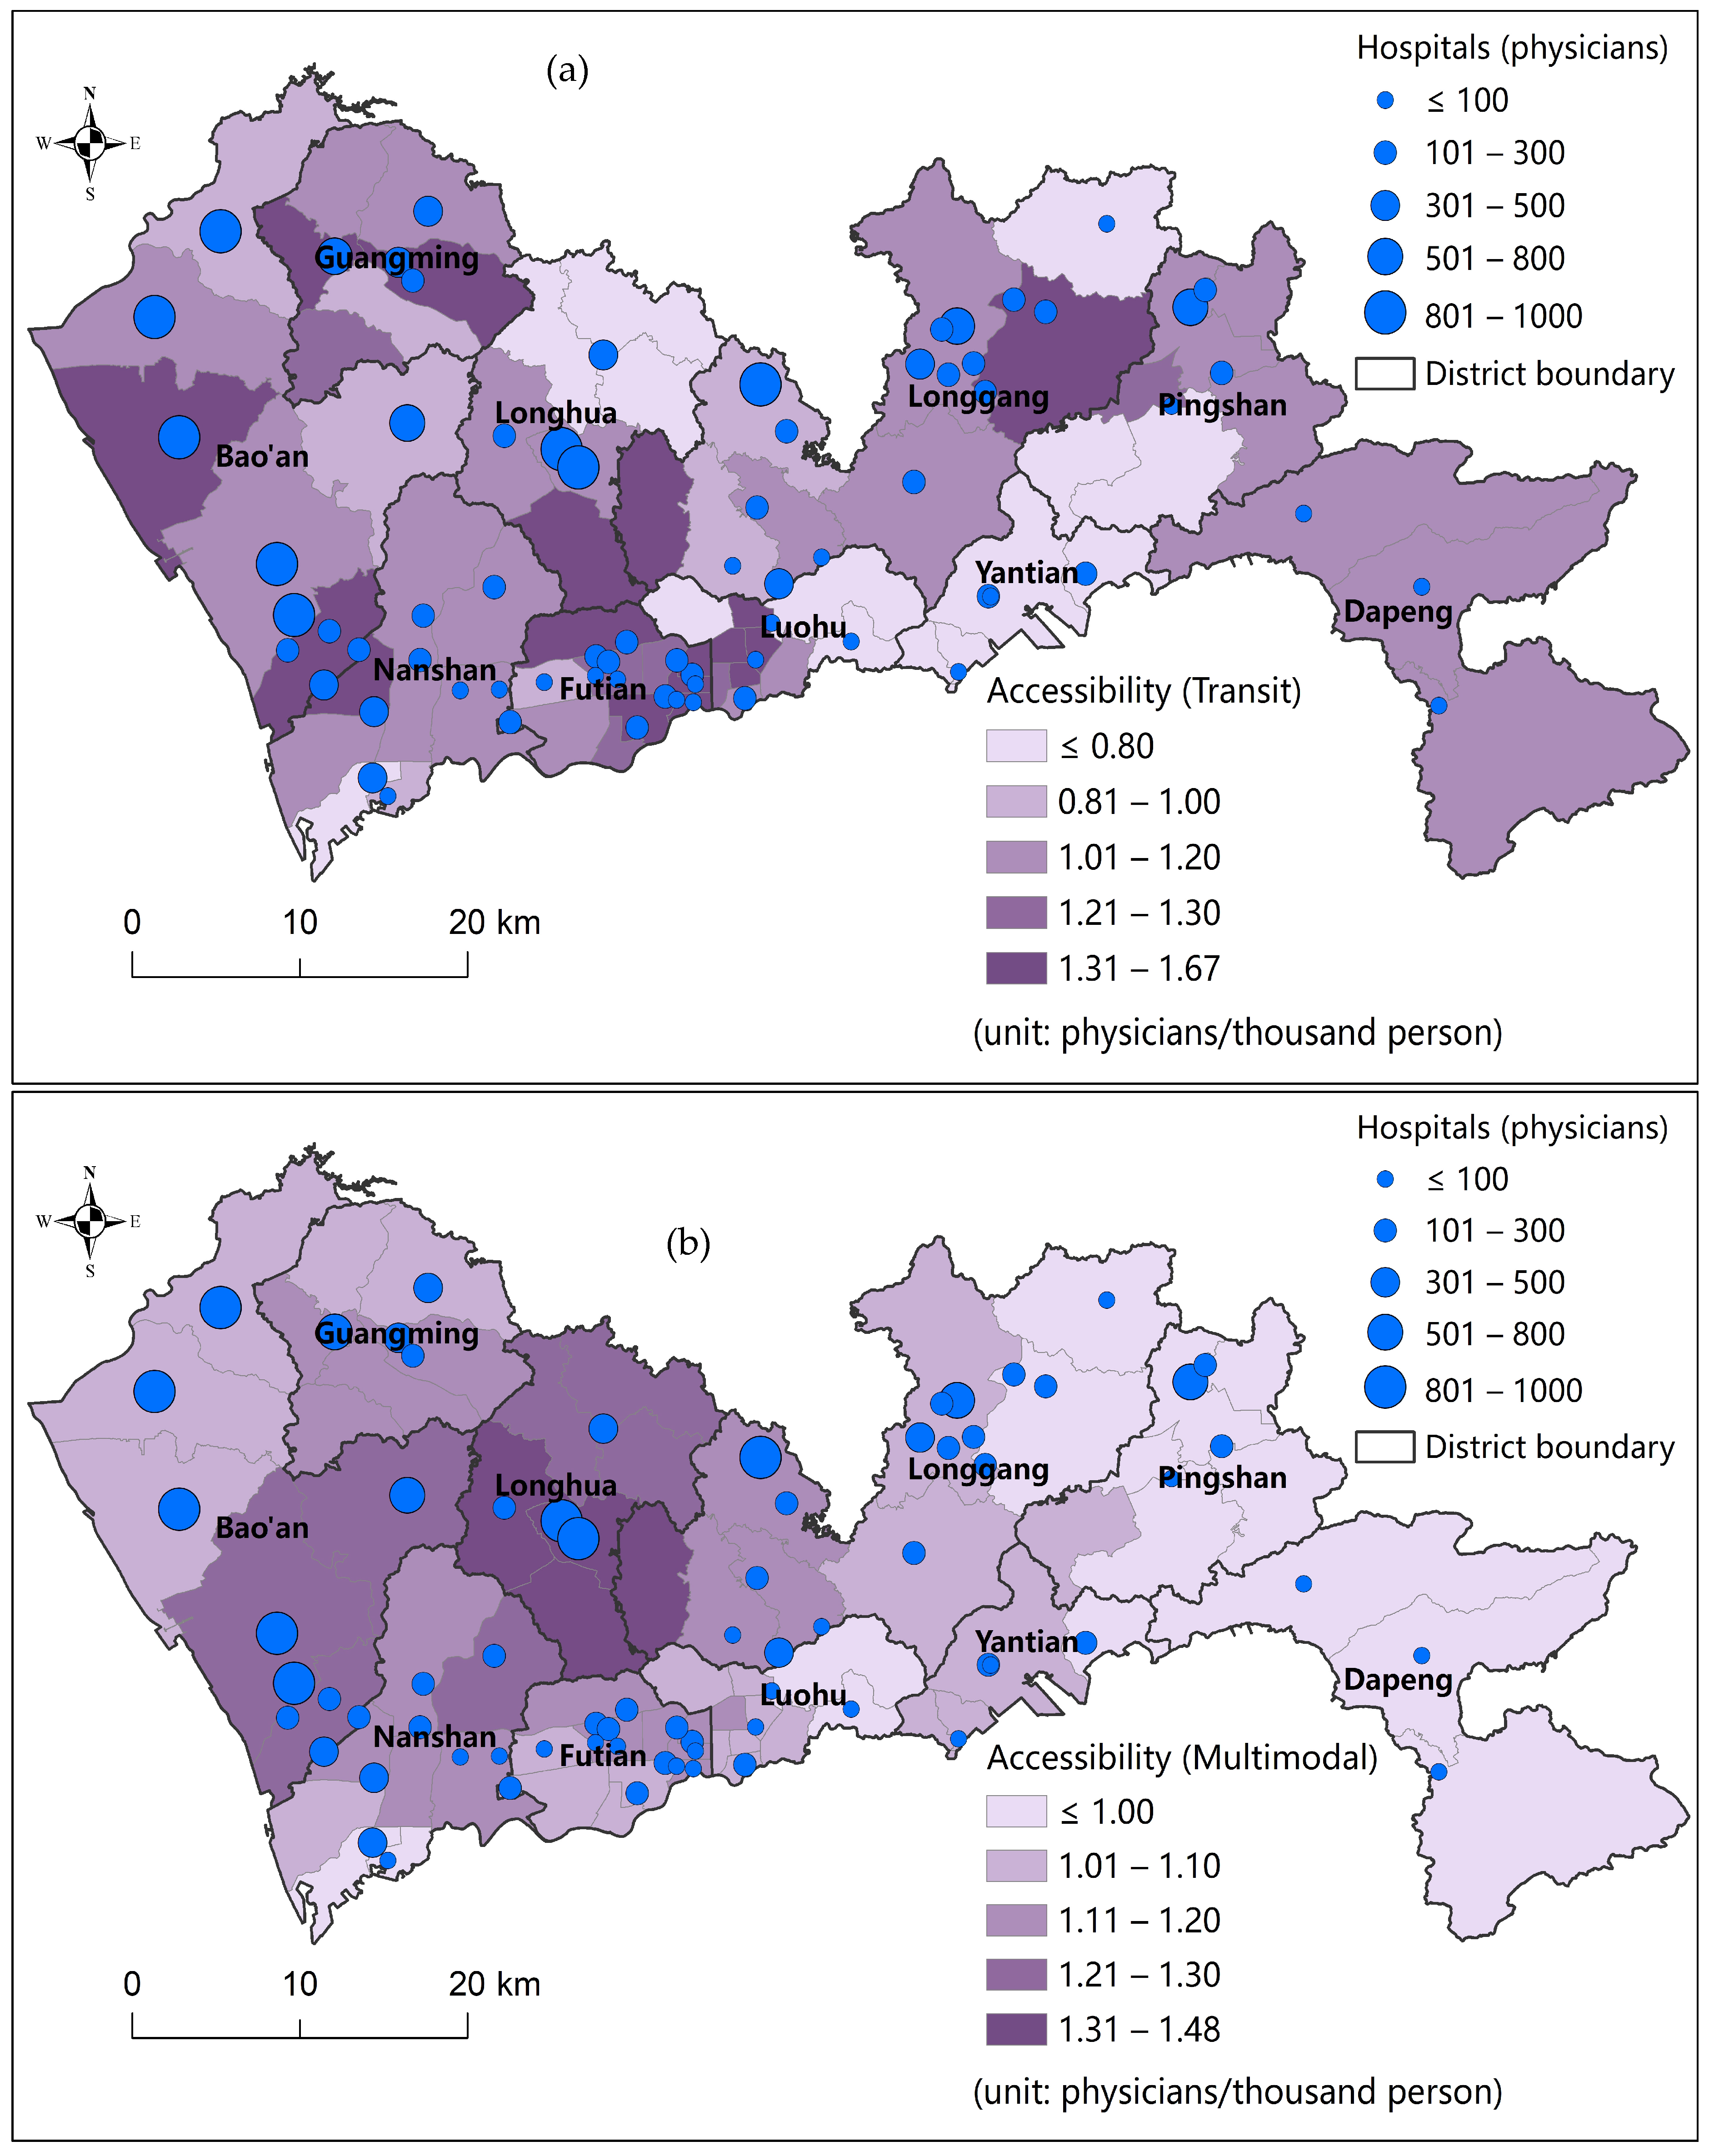
4.2. Comparisons with the Single-Modal MAE Model

In contrast, the optimization results of the traditional single-modal (car or transit) MAE model are also analyzed. As shown in Figure 4a, the single car-modal MAE model can also generate relatively equal car-modal healthcare accessibility, with a monocentric spatial structure. The accessibility is relatively low in Pingshan and Dapeng in Eastern Shenzhen. Overall, the MAD of car-modal healthcare accessibility is 0.114 physicians per thousand persons, which is larger than that of multimodal accessibility in the MMAE model (0.087).
In addition, although the single-modal car MAE model considers only one transport mode in the optimization, it can also influence the multimodal accessibility perceived by residents. This can be measured by the multimodal 2SFCA method based on the optimal healthcare facilities given by the single-modal car MAE model, as shown in Figure 4b. Note that the distribution of the healthcare facilities is the same in Figure 4a,b. However, the distribution of multimodal accessibility is much more unequal. The MAD of multimodal healthcare accessibility is 0.124 physicians per thousand persons, approximately 9% and 43% higher than those of single-modal car accessibility and multimodal accessibility in the MMAE model, respectively. This result clearly demonstrates that the single-modal car MAE model generates unequal multimodal healthcare accessibility.
Similar analyses can also be conducted for the single transit-modal MAE model. As shown in Figure 5a, the distribution of the optimal accessibility is different from that of the car-modal results. The subdistricts with the highest accessibility are scattered in several districts but close to metro lines. The overall MAD of transit-modal accessibility is relatively low (0.188 physicians per thousand persons) but is 64.9% higher than that of car-modal accessibility (0.114). Similarly, the single transit-modal MAE model generates unequal multimodal healthcare accessibility. The MAD is 0.199 physicians per thousand persons, 6% and 129% higher than the single car-modal accessibility and the accessibility by the MMAE model, respectively. The above comparisons reveal that the single-modal MAE model cannot ensure the equality of accessibility by multiple transport modes.

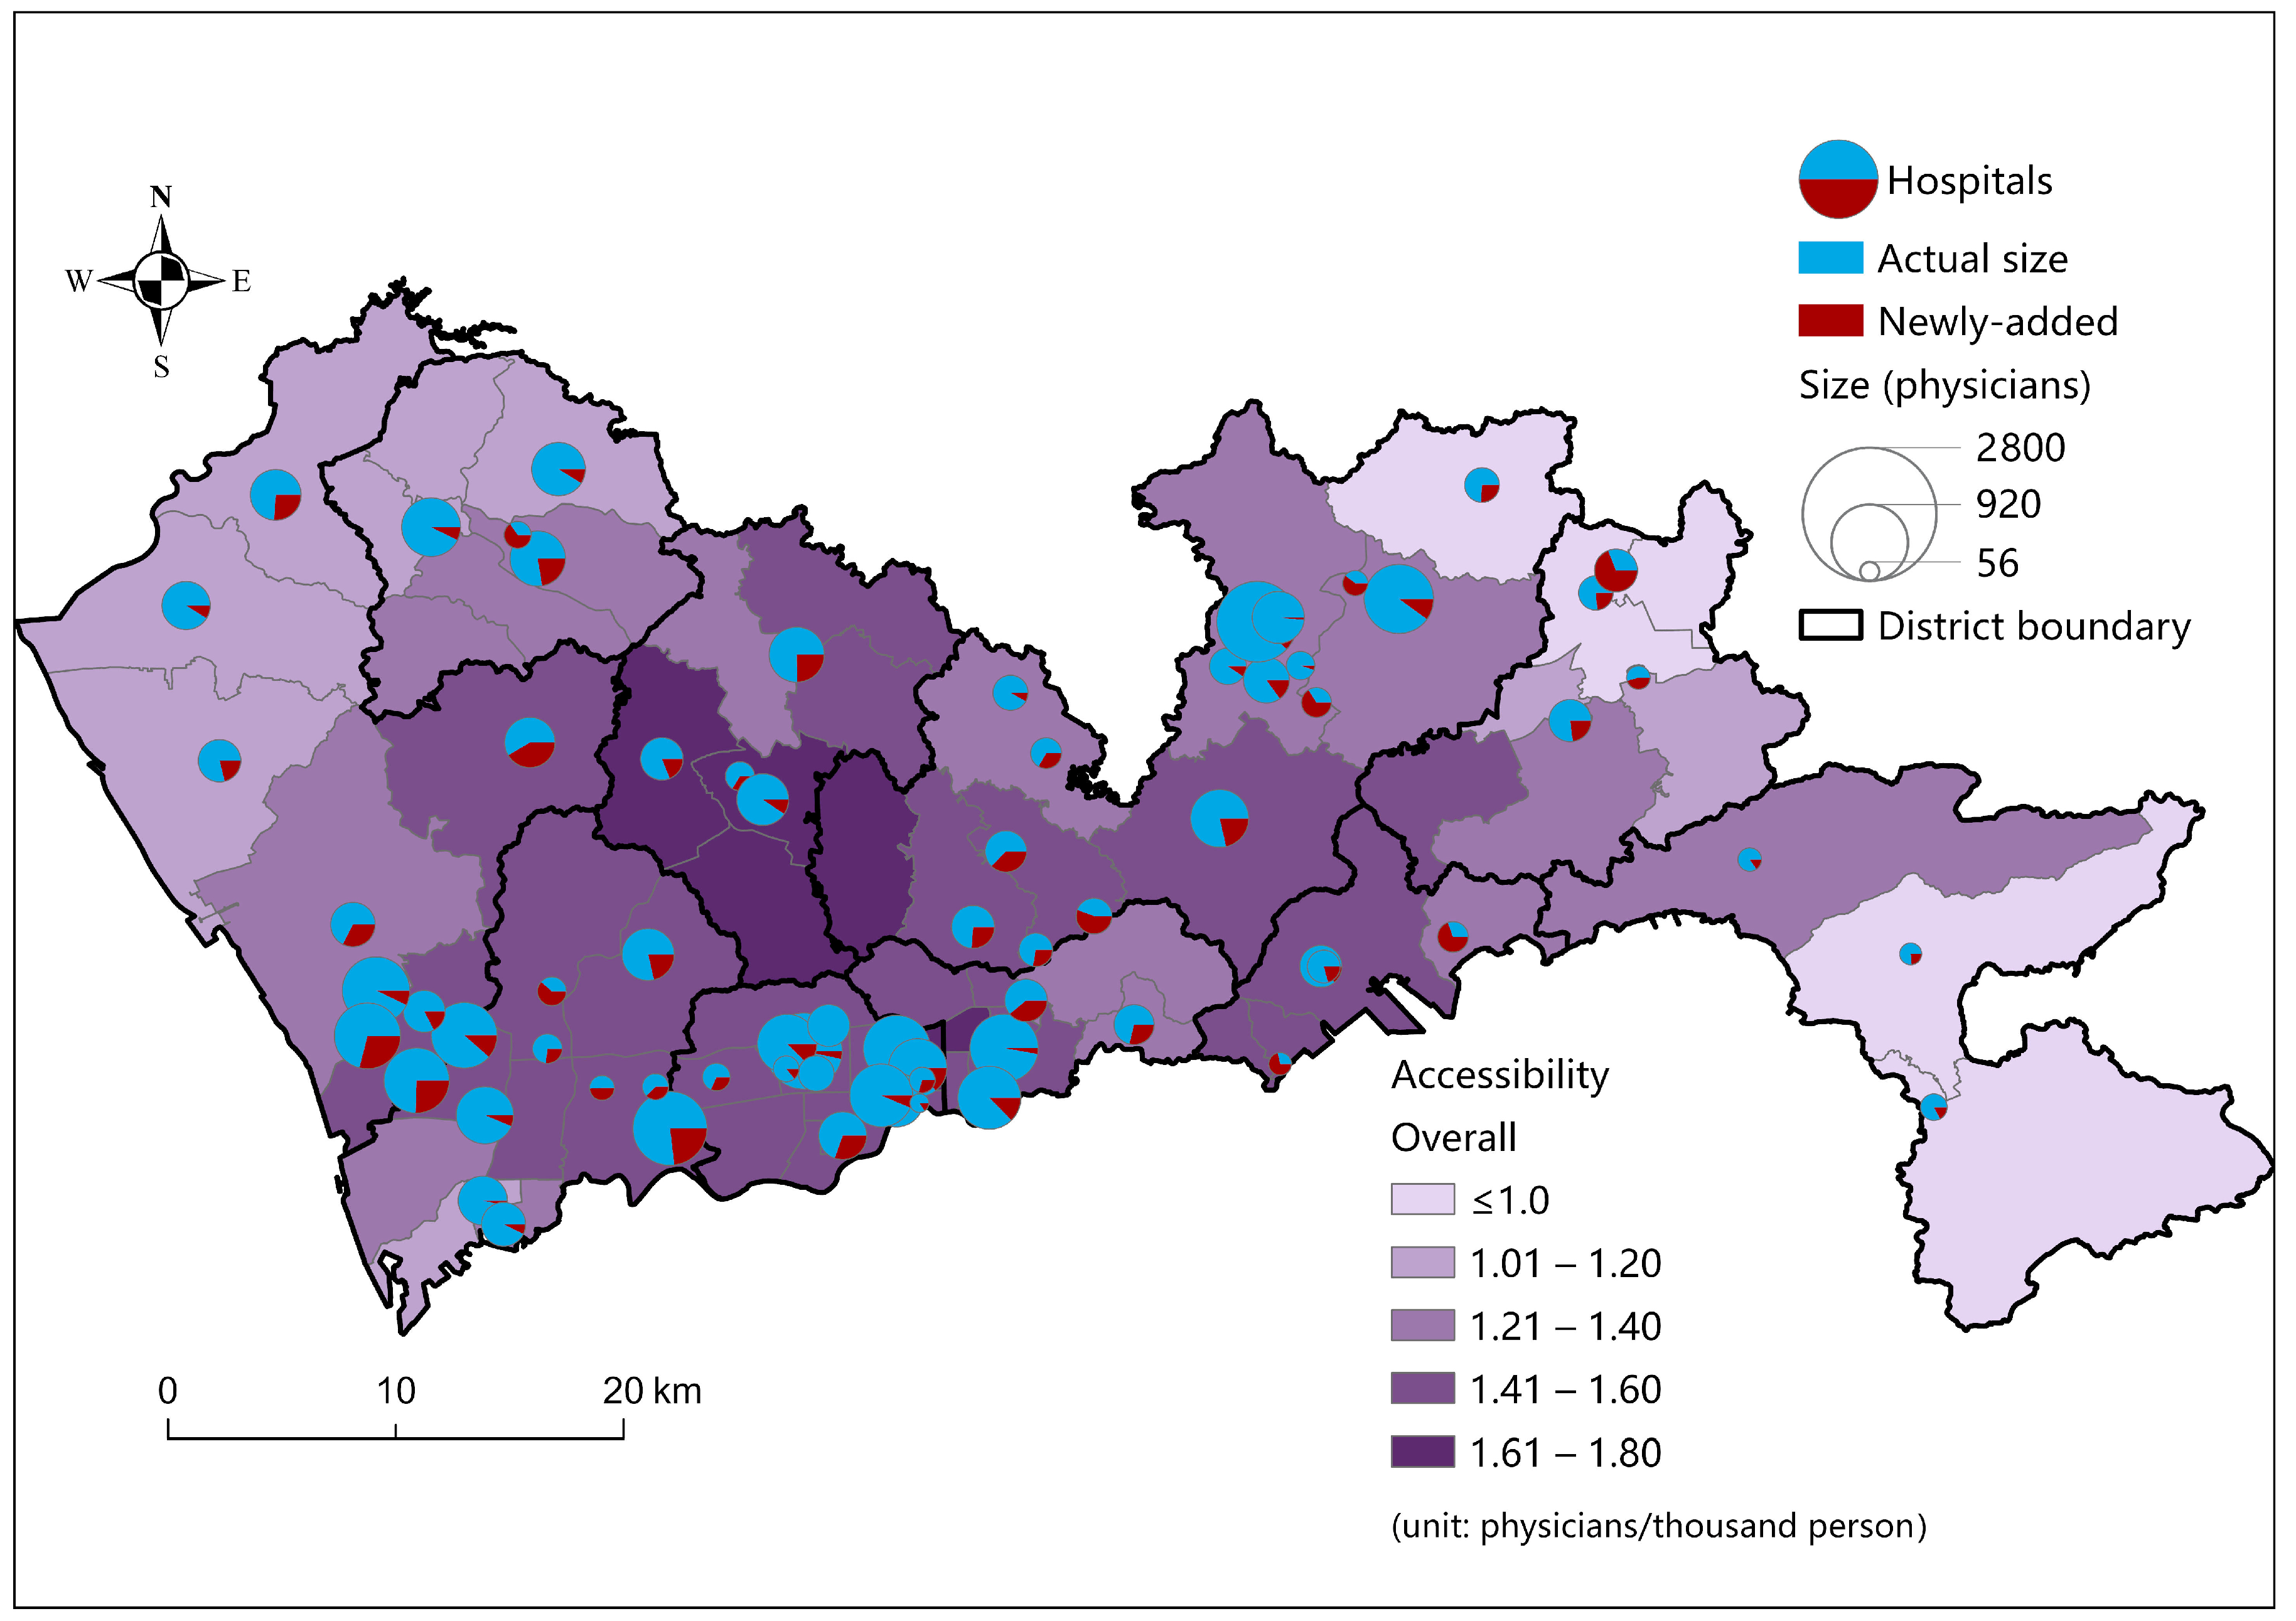
4.3. Optimal Allocation of Newly Added Resources

This section analyzes the results of the new resource allocation scenario, where 4622 newly added physicians are allocated among the existing facilities to achieve the maximal equality of multimodal accessibility. After optimization, the MAD of multimodal accessibility decreases to 0.168 physicians per thousand persons, 41.5% lower than the status quo. That is, the equality of multimodal accessibility can be significantly improved by adding a moderate portion of new resources (i.e., expanding existing facilities), without changing the facility locations or adding new facilities.
Figure 6 shows the optimal allocation of the newly added healthcare resources. The pie sizes denote the total number of physicians of the hospitals, with the blue part denoting the actual resources and the red part denoting the newly added resources. More newly added resources are allocated to Pingshan, Yantian, Guangming, Northern Bao’an, and Northern Longhua, where the actual multimodal accessibility is relatively low. As a result, the equality of multimodal accessibility is greatly improved in the new resource allocation scenario.

5. Discussion

The equality of healthcare and other public services is an important topic, drawing widespread attention from researchers and policymakers. Among the abundant location-allocation models, the MAE model shows promise in addressing the equality issue. However, the MAE model overlooks the reality that urban residents rely on multiple transport modes in their daily travel, including healthcare-seeking travel. In many cities, private cars are available to only some residents due to income inequalities or private car restriction policies. Other residents must utilize public transport to meet their travel demands. In this context, this study develops a maximal multimodal accessibility equality (MMAE) model to consider multiple transport modes in the optimization of the equality of public services.
This study contributes to the literature by developing a maximal multimodal accessibility equality (MMAE) model to optimize the equality of accessibility via multiple transport modes. The MMAE model is an extended multimodal version of the MAE model incorporating the multimodal 2SFCA accessibility model. The MMAE model inherits the strengths of the multimodal 2SFCA model in modeling the competition for resources among subgroups by various transport modes [24,25,26]. The multimodal accessibility calculated by the model reflects the overall accessibility for all residents within each area. Therefore, the MMAE model is superior to the traditional single-modal MAE model in terms of “equality optimization for everyone”.
The MMAE model is useful in supporting the spatial planning of healthcare facilities in cities or regions with multiple transport modes. It is also applicable for other public facilities. First, this study suggests that an emphasis should be placed on the integration of multiple transport modes and the siting of public facilities. According to the 14th Five-Year Plan for Shenzhen’s National Economic and Social Development and the Outline of the 2035 Long-Term Goals [54], it is necessary to implement a public transport priority development strategy, and, by 2025, the share of green transport modes will reach 81%. It is recommended to focus on the integration of public transport with public facilities. Second, this study highlights the necessity to consider people’s diversified preferences for transport modes in the study and planning practice towards the equality of public services. Third, in the practice of healthcare planning, it is usually infeasible to reallocate existing facilities or to reallocate existing resources between facilities [45]. This study illustrates that the MMAE model can support the scenario of allocating new resources, which is more practical in real-world planning. The results indicate that the equality of multimodal accessibility can be significantly improved by adding a certain number of new resources.
Despite the above contributions, there remain some limitations in the current study. First, only the capacity optimization strategy was considered, whereas the location optimization strategy must be combined with the MMAE model in the future. Second, due to the lack of the latest community-level population data, the analysis units in this study were set as subdistricts. To improve the analysis accuracy, the travel times were estimated at the community scale and then aggregated into the subdistrict scale. More efforts are needed to explore finer spatial units and the modifiable areal unit problem (MAUP) in location-allocation modeling. Third, only car and public transit modes were considered in this study. In future studies, the MMAE model can be easily extended to incorporate more transport modes when data on modal shares are available. Fourth, due to computational limitations, the catchment area sizes for different travel modes and districts were uniformly set to the same values. Advanced algorithms need to be introduced to meet the demands of diverse catchment area sizes. Fifth, this study might suffer from edge effects due to overlooking the possibility that residents might travel across city boundaries for healthcare services.

6. Conclusions

This study develops an MMAE model and compares it with the traditional single-modal MAE model using a case study of healthcare facilities in Shenzhen. The case study yields three main findings. First, the MMAE model can significantly improve the equality of multimodal accessibility compared to the status quo. Second, the traditional single-modal (car or transit) MAE model generates unequal multimodal accessibility. Therefore, when applied in a multimodal context, the traditional MAE model fails to maximize the equality of accessibility and provides biased planning recommendations. This greatly highlights the value and importance of the proposed MMAE model. Third, this study introduces a new resource allocation scenario, which is set up based on the real-world plan in Shenzhen. The analyses prove that the plan can greatly improve the equality of healthcare accessibility by adding 23.2% additional resources. More importantly, it provides an optimal allocation solution to achieve such improvements. The findings highlight the superiority of the MMAE model against the traditional single-modal MAE model in terms of pursuing equal accessibility for all residents. The MMAE model can serve as a scientific tool to support the rational planning of healthcare or other types of public facilities in multimodal contexts.

Author Contributions

Conceptualization, Zhuolin Tao and Yinuo Dang; methodology, Zhuolin Tao, Qianyu Zhong and Yinuo Dang; software, Zhuolin Tao and Qianyu Zhong; validation, Zhuolin Tao and Qianyu Zhong; formal analysis, Zhuolin Tao and Yinuo Dang; investigation, Zhuolin Tao; resources, Zhuolin Tao and Yinuo Dang; data curation, Zhuolin Tao and Qianyu Zhong; writing—original draft preparation, Zhuolin Tao; writing—review and editing, Zhuolin Tao, Qianyu Zhong and Yinuo Dang; visualization, Zhuolin Tao and Qianyu Zhong; project administration, Zhuolin Tao; funding acquisition, Zhuolin Tao. All authors have read and agreed to the published version of the manuscript.

Funding

This research was funded by the National Natural Science Foundation of China, grant number 42101189, and the Fundamental Research Funds for the Central Universities.

Data Availability Statement

All data used in this study are free to access. The information on healthcare facilities in Shenzhen can be obtained from the Shenzhen Municipal Health Commission (http://wjw.sz.gov.cn/bmfw/wycx/fwyl/yycx/index.html, accessed on 9 May 2024). The population data have been published in a book: Office of the Leading Group of the State Council for the Seventh National Population Census. 2022. Tabulation on 2020 China Population Census by Township. Beijing: China Statistics Press. The travel time data were obtained by using the Baidu Maps Direction API (https://lbsyun.baidu.com/faq/api?title=webapi/direction-api-v2, accessed on 23 July 2024). The codes and data used in this study are available on GitHub: https://github.com/tazilurn/Multi-modal-MAE-model.git (accessed on 23 July 2024).

Acknowledgments

The authors would like to thank the editor and anonymous reviewers for their suggestions.

Conflicts of Interest

The authors declare no conflicts of interest.

References

  1. Sen, A. Equality Reexamined; Harvard University Press: Cambridge, MA, USA, 1992. [Google Scholar]
  2. Krugman, P. Why Inequality Matters. New York Times, 17 December 2013; Volume 163, p. A23. [Google Scholar]
  3. Guagliardo, M.F. Spatial accessibility of primary care: Concepts, methods and challenges. Int. J. Health Geogr. 2004, 3, 3. [Google Scholar] [CrossRef]
  4. Khan, A.A. An integrated approach to measuring potential spatial access to health care services. Socio-Econ. Plan. Sci. 1992, 26, 275–287. [Google Scholar] [CrossRef]
  5. Neutens, T. Accessibility, equity and health care: Review and research directions for transport geographers. J. Transp. Geogr. 2015, 43, 14–27. [Google Scholar] [CrossRef]
  6. Wang, F. Measurement, optimization and impact of healthcare accessibility: A methodological review. Ann. Assoc. Am. Geogr. 2012, 102, 1104–1112. [Google Scholar] [CrossRef]
  7. Shen, Y.; Tao, Y. Associations between spatial access to medical facilities and health-seeking behaviors: A mixed geographically weighted regression analysis in Shanghai, China. Appl. Geogr. 2022, 139, 102644. [Google Scholar] [CrossRef]
  8. Yuan, B.; Zhang, T.; Li, J. Travel experience and health service amongst older people from the perspective of social exclusion: Policy implications of alleviating transport deprivation. Health Soc. Care Community 2022, 30, E4894–E4908. [Google Scholar] [CrossRef] [PubMed]
  9. Wang, F.; McLafferty, S.; Escamilla, V.; Luo, L. Late-Stage Breast Cancer Diagnosis and Health Care Access in Illinois. Prof. Geogr. 2008, 60, 54–69. [Google Scholar] [CrossRef] [PubMed]
  10. Hay, A.M. Concepts of Equity, Fairness and Justice in Geographical Studies. Trans. Inst. Br. Geogr. 1995, 20, 500–508. [Google Scholar] [CrossRef]
  11. Oliver, A.; Mossialos, E. Equity of access to health care: Outlining the foundations for action. J. Epidemiol. Community Health 2004, 58, 655–658. [Google Scholar] [CrossRef]
  12. Whitehead, J.; Pearson, A.L.; Lawrenson, R.; Atatoa-Carr, P. How can the spatial equity of health services be defined and measured? A systematic review of spatial equity definitions and methods. J. Health Serv. Res. Policy 2019, 24, 270–278. [Google Scholar] [CrossRef]
  13. Drezner, Z.; Hamacher, H.W. Facility Location: Applications and Theory; Springer: New York, NY, USA, 2002. [Google Scholar]
  14. Hakimi, S.L. Optimum locations of switching centers and the absolute centers and medians of a graph. Oper. Res. 1964, 12, 450–459. [Google Scholar] [CrossRef]
  15. Owen, S.H.; Daskin, M.S. Strategic facility location: A review. Eur. J. Oper. Res. 1998, 111, 423–447. [Google Scholar] [CrossRef]
  16. Wang, F.; Tang, Q. Planning toward equal accessibility to services: A quadratic programming approach. Environ. Plan. B Plan. Des. 2013, 40, 195–212. [Google Scholar] [CrossRef]
  17. Dai, T.; Liao, C.; Zhao, S. Optimizing the spatial assignment of schools through a random mechanism towards equal educational opportunity: A resemblance approach. Comput. Environ. Urban Syst. 2019, 76, 24–30. [Google Scholar] [CrossRef]
  18. Li, X.; Wang, F.; Yi, H. A two-step approach to planning new facilities towards equal accessibility. Environ. Plan. B Urban Anal. City Sci. 2017, 44, 994–1011. [Google Scholar] [CrossRef]
  19. Li, M.; Wang, F.; Kwan, M.-P.; Chen, J.; Wang, J. Equalizing the spatial accessibility of emergency medical services in Shanghai: A trade-off perspective. Comput. Environ. Urban Syst. 2022, 92, 101745. [Google Scholar] [CrossRef]
  20. Tao, Z.; Cheng, Y.; Dai, T.; Rosenberg, M.W. Spatial optimization of residential care facility locations in Beijing, China: Maximum equity in accessibility. Int. J. Health Geogr. 2014, 13, 33. [Google Scholar] [CrossRef] [PubMed]
  21. Dony, C.C.; Delmelle, E.M.; Delmelle, E.C. Re-conceptualizing accessibility to parks in multi-modal cities: A Variable-width Floating Catchment Area (VFCA) method. Landsc. Urban Plan. 2015, 143, 90–99. [Google Scholar] [CrossRef]
  22. Sharma, G.; Patil, G.R. Public transit accessibility approach to understand the equity for public healthcare services: A case study of Greater Mumbai. J. Transp. Geogr. 2021, 94, 103123. [Google Scholar] [CrossRef]
  23. Tahmasbi, B.; Mansourianfar, M.H.; Haghshenas, H.; Kim, I. Multimodal accessibility-based equity assessment of urban public facilities distribution. Sustain. Cities Soc. 2019, 49, 101633. [Google Scholar] [CrossRef]
  24. Mao, L.; Nekorchuk, D. Measuring spatial accessibility to healthcare for populations with multiple transportation modes. Health Place 2013, 24, 115–122. [Google Scholar] [CrossRef] [PubMed]
  25. Langford, M.; Higgs, G.; Fry, R. Multi-modal two-step floating catchment area analysis of primary health care accessibility. Health Place 2016, 38, 70–81. [Google Scholar] [CrossRef] [PubMed]
  26. Tao, Z.; Zhou, J.; Lin, X.; Chao, H.; Li, G. Investigating the impacts of public transport on job accessibility in Shenzhen, China: A multi-modal approach. Land Use Policy 2020, 99, 105025. [Google Scholar] [CrossRef]
  27. Tong, D.; Murray, A.T. Spatial Optimization in Geography. Ann. Assoc. Am. Geogr. 2012, 102, 1290–1309. [Google Scholar] [CrossRef]
  28. Zhang, W.; Cao, K.; Liu, S.; Huang, B. A multi-objective optimization approach for health-care facility location-allocation problems in highly developed cities such as Hong Kong. Comput. Environ. Urban Syst. 2016, 59, 220–230. [Google Scholar] [CrossRef]
  29. Chang, J.; Deng, Q.; Hu, P.; Guo, M.; Lu, F.; Su, Y.; Sun, J.; Qi, Y.; Long, Y.; Liu, J. Geographic Variation in Mortality of Acute Myocardial Infarction and Association with Health Care Accessibility in Beijing, 2007 to 2018. J. Am. Heart Assoc. 2023, 12, e029769. [Google Scholar] [CrossRef] [PubMed]
  30. Culyer, A.; Wagstaff, A. Equity and equality in health and health care. J. Health Econ. 1993, 12, 431–457. [Google Scholar] [CrossRef] [PubMed]
  31. Lu, C.; Zhang, Z.; Lan, X. Impact of China’s referral reform on the equity and spatial accessibility of healthcare resources: A case study of Beijing. Soc. Sci. Med. 2019, 235, 112386. [Google Scholar] [CrossRef] [PubMed]
  32. Harrington, D.W.; Rosenberg, M.W.; Wilson, K. Comparing health status and access to health care in Canada’s largest metropolitan areas. Urban Geogr. 2014, 35, 1156–1170. [Google Scholar] [CrossRef]
  33. Cheng, G.; Zeng, X.; Duan, L.; Lu, X.; Sun, H.; Jiang, T.; Li, Y. Spatial difference analysis for accessibility to high level hospitals based on travel time in Shenzhen, China. Habitat Int. 2016, 53, 485–494. [Google Scholar] [CrossRef]
  34. Liao, Y.; Gil, J.; Pereira, R.H.M.; Yeh, S.; Verendel, V. Disparities in travel times between car and transit: Spatiotemporal patterns in cities. Sci. Rep. 2020, 10, 4056. [Google Scholar] [CrossRef] [PubMed]
  35. Salonen, M.; Toivonen, T. Modelling travel time in urban networks: Comparable measures for private car and public transport. J. Transp. Geogr. 2013, 31, 143–153. [Google Scholar] [CrossRef]
  36. Zhang, F.; Li, D.; Ahrentzen, S.; Zhang, J. Assessing spatial disparities of accessibility to community-based service resources for Chinese older adults based on travel behavior: A city-wide study of Nanjing, China. Habitat Int. 2019, 88, 101984. [Google Scholar] [CrossRef]
  37. Hu, S.; Song, W.; Li, C.; Lu, J. A multi-mode Gaussian-based two-step floating catchment area method for measuring accessibility of urban parks. Cities 2020, 105, 102815. [Google Scholar] [CrossRef]
  38. Cheng, S.; Liao, Z.; Zhu, Y. Dynamic Changes in Community Deprivation of Access to Urban Green Spaces by Multiple Transport Modes. Front. Public Health 2021, 9, 615432. [Google Scholar] [CrossRef]
  39. Wang, Y.; Liu, Y.; Xing, L.; Zhang, Z. An Improved Accessibility-Based Model to Evaluate Educational Equity: A Case Study in the City of Wuhan. ISPRS Int. J. Geo-Inf. 2021, 10, 458. [Google Scholar] [CrossRef]
  40. White, J.A.; Case, K.E. On covering problems and the central facilities location problem. Geogr. Anal. 1974, 6, 281–294. [Google Scholar] [CrossRef]
  41. Church, R.; ReVelle, C.S. The maximal covering location problem. Pap. Reg. Sci. 1974, 32, 101–118. [Google Scholar] [CrossRef]
  42. Luo, J.; Tian, L.; Luo, L.; Yi, H.; Wang, F. Two-Step Optimization for Spatial Accessibility Improvement: A Case Study of Health Care Planning in Rural China. BioMed Res. Int. 2017, 2017, 2094654. [Google Scholar] [CrossRef]
  43. Liao, C.; Scheuer, B.; Dai, T.; Tian, Y. Optimizing the spatial assignment of schools to reduce both inequality of educational opportunity and potential opposition rate. Socio-Econ. Plan. Sci. 2020, 72, 100893. [Google Scholar] [CrossRef]
  44. Mu, L.; Xing, L.; Jing, Y.; Hu, Q. Spatial Optimization of Park Green Spaces by an Improved Two-Step Optimization Model from the Perspective of Maximizing Accessibility Equity. Land 2023, 12, 948. [Google Scholar] [CrossRef]
  45. Tao, Z.; Zhao, M. Planning for equal transit-based accessibility of healthcare facilities: A case study of Shenzhen, China. Socio-Econ. Plan. Sci. 2023, 88, 101666. [Google Scholar] [CrossRef]
  46. Shen, Q. Location Characteristics of Inner-City Neighborhoods and Employment Accessibility of Low-Wage Workers. Environ. Plan. B Plan. Des. 1998, 25, 345–365. [Google Scholar] [CrossRef]
  47. Du, F.; Mao, L.; Wang, J. Determinants of travel mode choice for seeking healthcare: A comparison between elderly and non-elderly patients. J. Transp. Geogr. 2021, 92, 103023. [Google Scholar] [CrossRef]
  48. Wang, F.; Dai, T. Spatial Optimization and Planning Practice towards Equal Access of Public Services. J. Urban Reg. Plan. 2020, 12, 28–40. [Google Scholar]
  49. Tao, Z.; Dai, T.; Song, C. Improving spatial equity-oriented location-allocation models of urban medical facilities. Acta Geogr. Sin. 2023, 2, 474–489. [Google Scholar]
  50. Kennedy, J.; Eberhart, R.C. Particle swarm optimization. In Proceedings of the IEEE International Conference on Neural Networks, Perth, Australia, 27 November–1 December 1995; Nedlands Yianni, A., Ed.; IEEE: Perth, Australia, 1996; pp. 42–48. [Google Scholar]
  51. Office of the Leading Group of the State Council for the Seventh National Population Census. Tabulation on 2020 China Population Census by Township; China Statistics Press: Beijing, China, 2022. [Google Scholar]
  52. Shenzhen Municipal Health Commission. List of Healthcare Facilities in Shenzhen. 2021. Available online: http://wjw.sz.gov.cn/bmfw/wycx/fwyl/yycx/index.html (accessed on 9 May 2024).
  53. Shenzhen Municipal Health Commission. The 14th Five-Year Plan of Health Development in Shenzhen. 2022. Available online: http://wjw.sz.gov.cn/gkmlpt/content/9/9713/post_9713146.html#2496 (accessed on 30 May 2024).
  54. The People’s Government of Shenzhen Municipality. The 14th Five-Year Plan for Shenzhen’s National Economic and Social Development and the Outline of the 2035 Long-Term Goals. 2021. Available online: http://szfb.sz.gov.cn/attachment/1/1453/1453217/11345233.pdf (accessed on 23 July 2024).
Figure 1. The distribution of the subdistrict-level population density and healthcare facilities.
Ijgi 13 00278 g001
Figure 2. The distribution of the actual multimodal accessibility.
Ijgi 13 00278 g002
Figure 3. The distribution of optimal healthcare facility sizes and accessibility by MMAE. (a) Overall accessibility; (b) car-modal accessibility; (c) transit-modal accessibility.
Ijgi 13 00278 g003
Figure 4. The distribution of (a) the car-modal accessibility and (b) the multimodal accessibility based on optimal healthcare facility sizes by the single car-modal MAE.
Ijgi 13 00278 g004
Figure 5. The distribution of (a) the transit-modal accessibility and (b) the multimodal accessibility based on optimal healthcare facility sizes by the single transit-modal transit MAE.
Ijgi 13 00278 g005
Figure 6. The distribution of the optimal newly added healthcare resources and multimodal accessibility.
Ijgi 13 00278 g006
Table 1. Equality of accessibility in various scenarios.
ScenarioMAD of Accessibility *Equality Improvement **
Actual allocation0.287/
Multimodal optimization0.08769.7%
Car-modal optimization, car-modal accessibility0.11460.3%
Car-modal optimization, multimodal accessibility0.12456.8%
Transit-modal optimization, transit-modal accessibility0.18834.5%
Transit-modal optimization, multimodal accessibility0.19930.7%
New resource allocation scenario0.16841.5%
* The unit is physicians per thousand persons; ** the improvement is calculated relative to the status quo, equal to the percentage decrease in the MAD compared to the actual allocation.
Disclaimer/Publisher’s Note: The statements, opinions and data contained in all publications are solely those of the individual author(s) and contributor(s) and not of MDPI and/or the editor(s). MDPI and/or the editor(s) disclaim responsibility for any injury to people or property resulting from any ideas, methods, instructions or products referred to in the content.

