


Ecological Network Construction Based on Red, Green and Blue Space: A Case Study of Dali City, China


Abstract
:1. Introduction
2. Materials and Methods
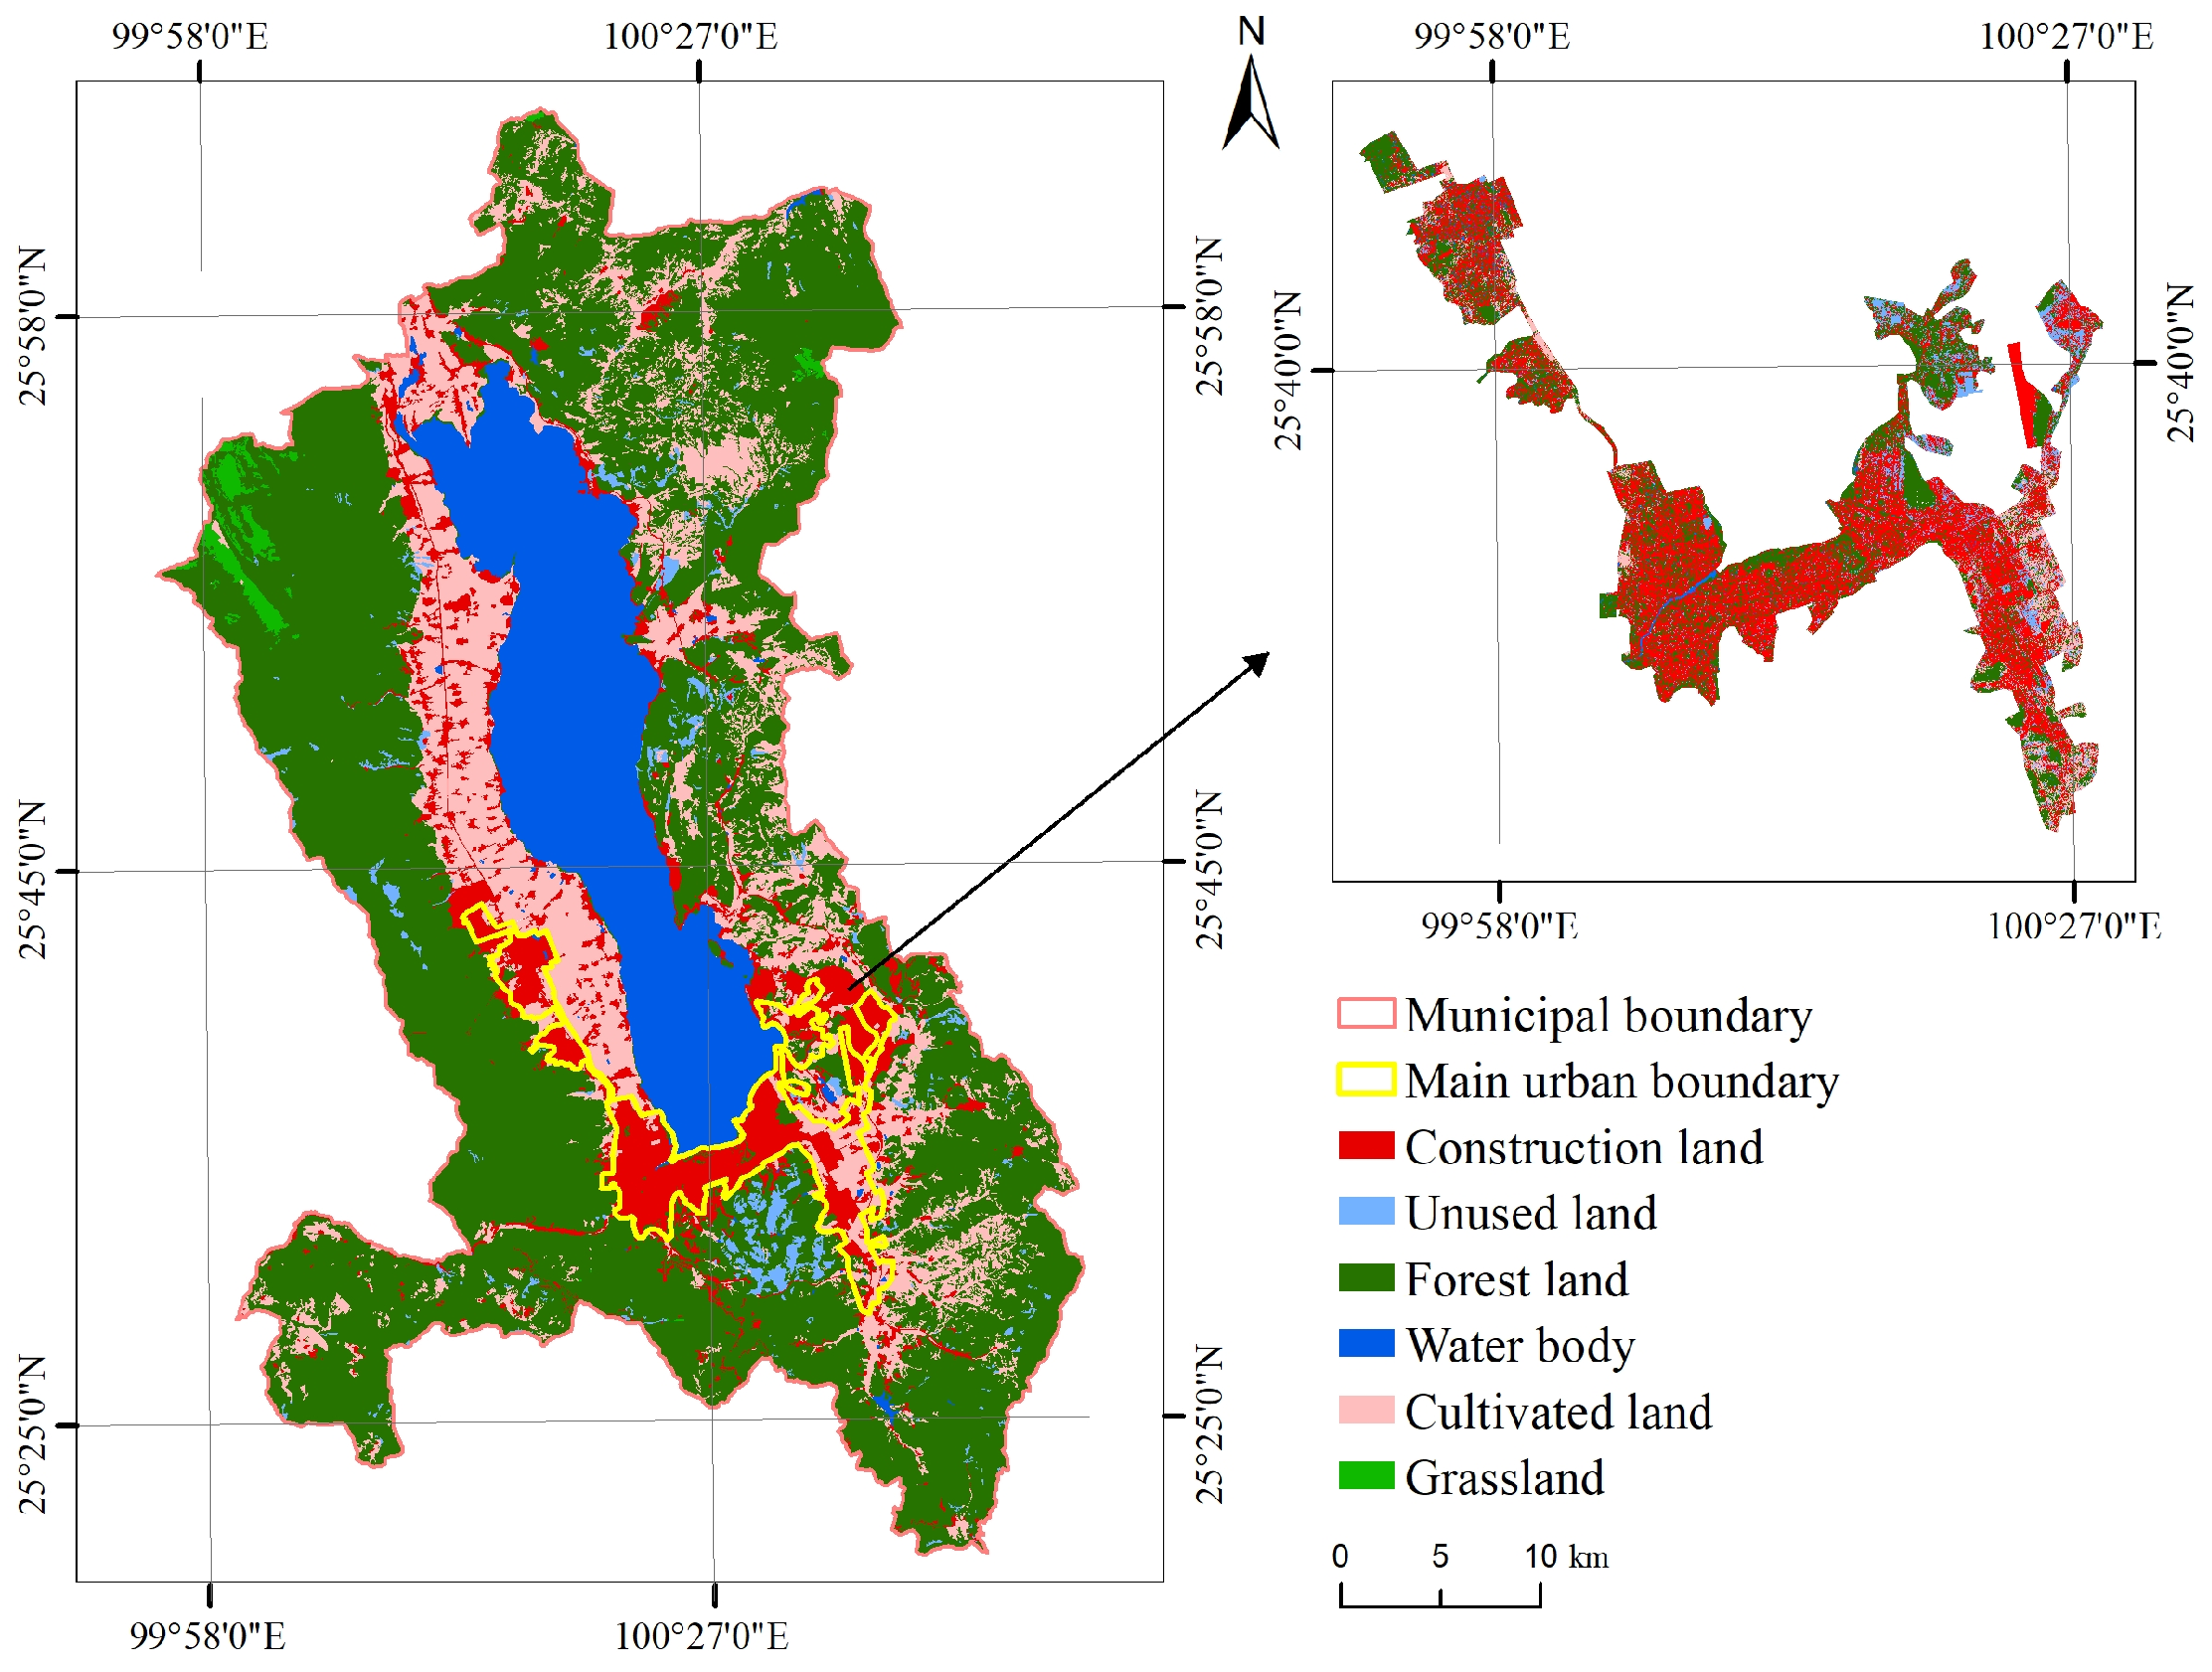
2.1. Study Area
2.2. Data Sources and Pre-Processing
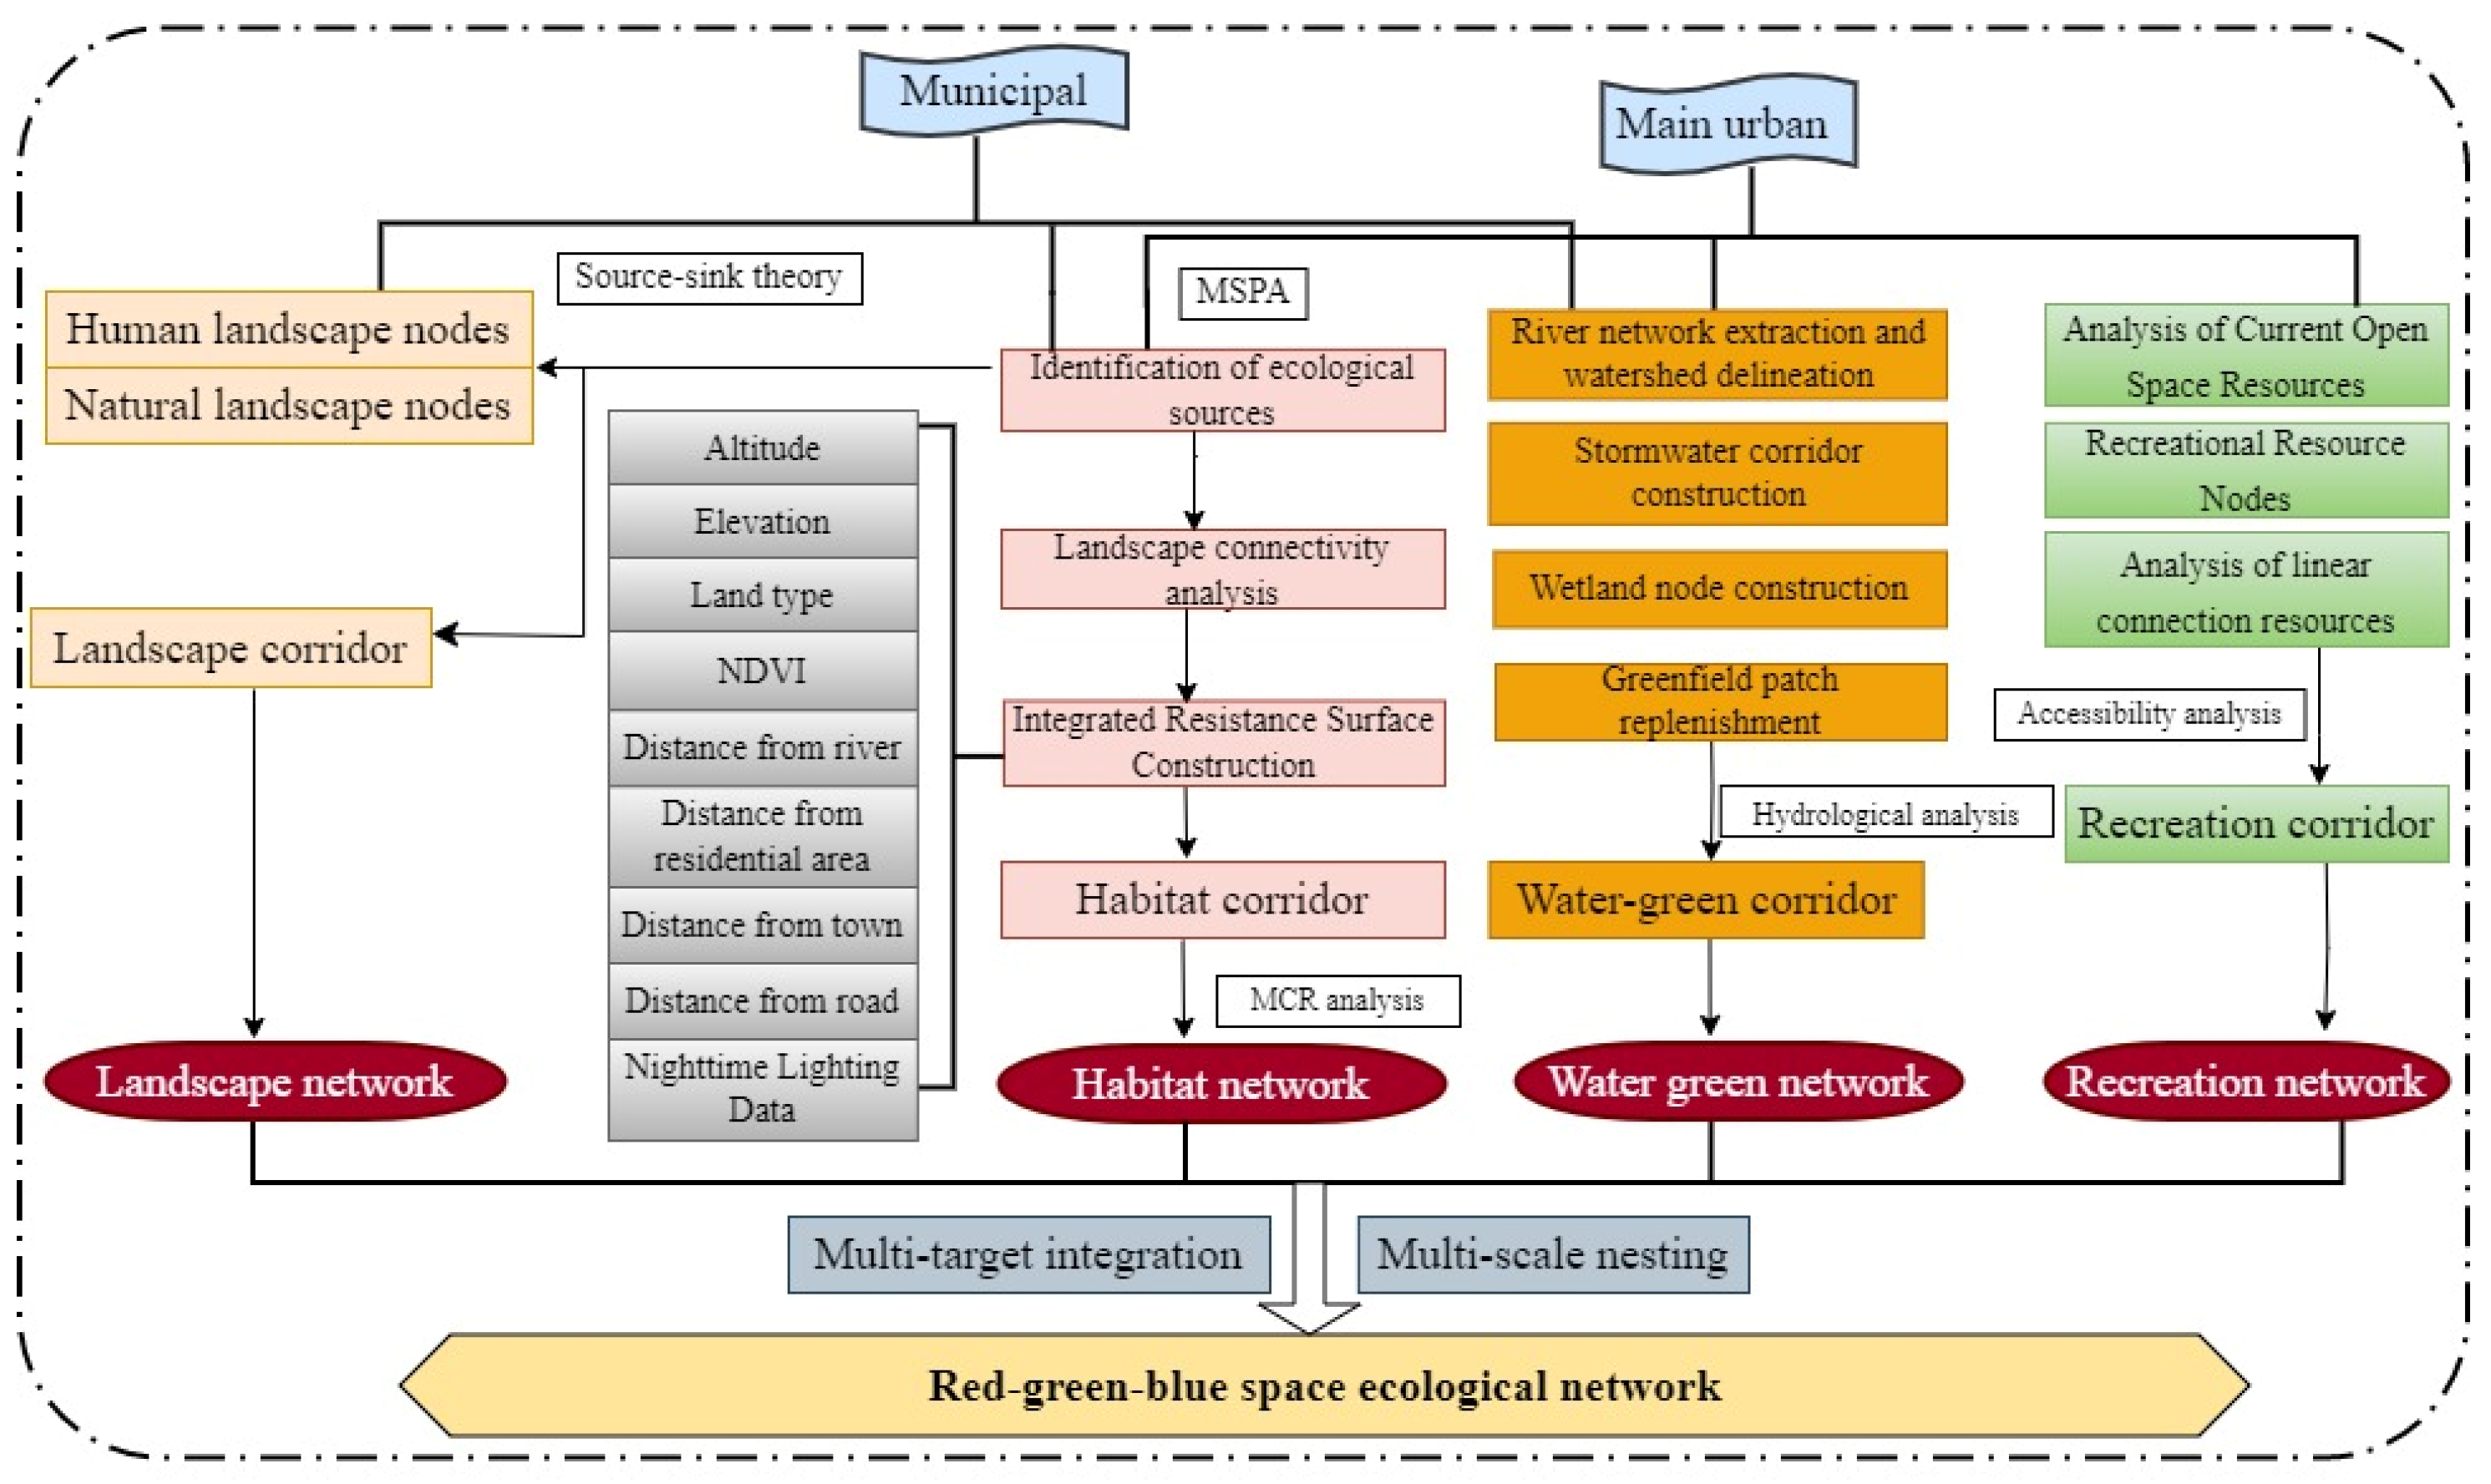
2.3. Research Methodology
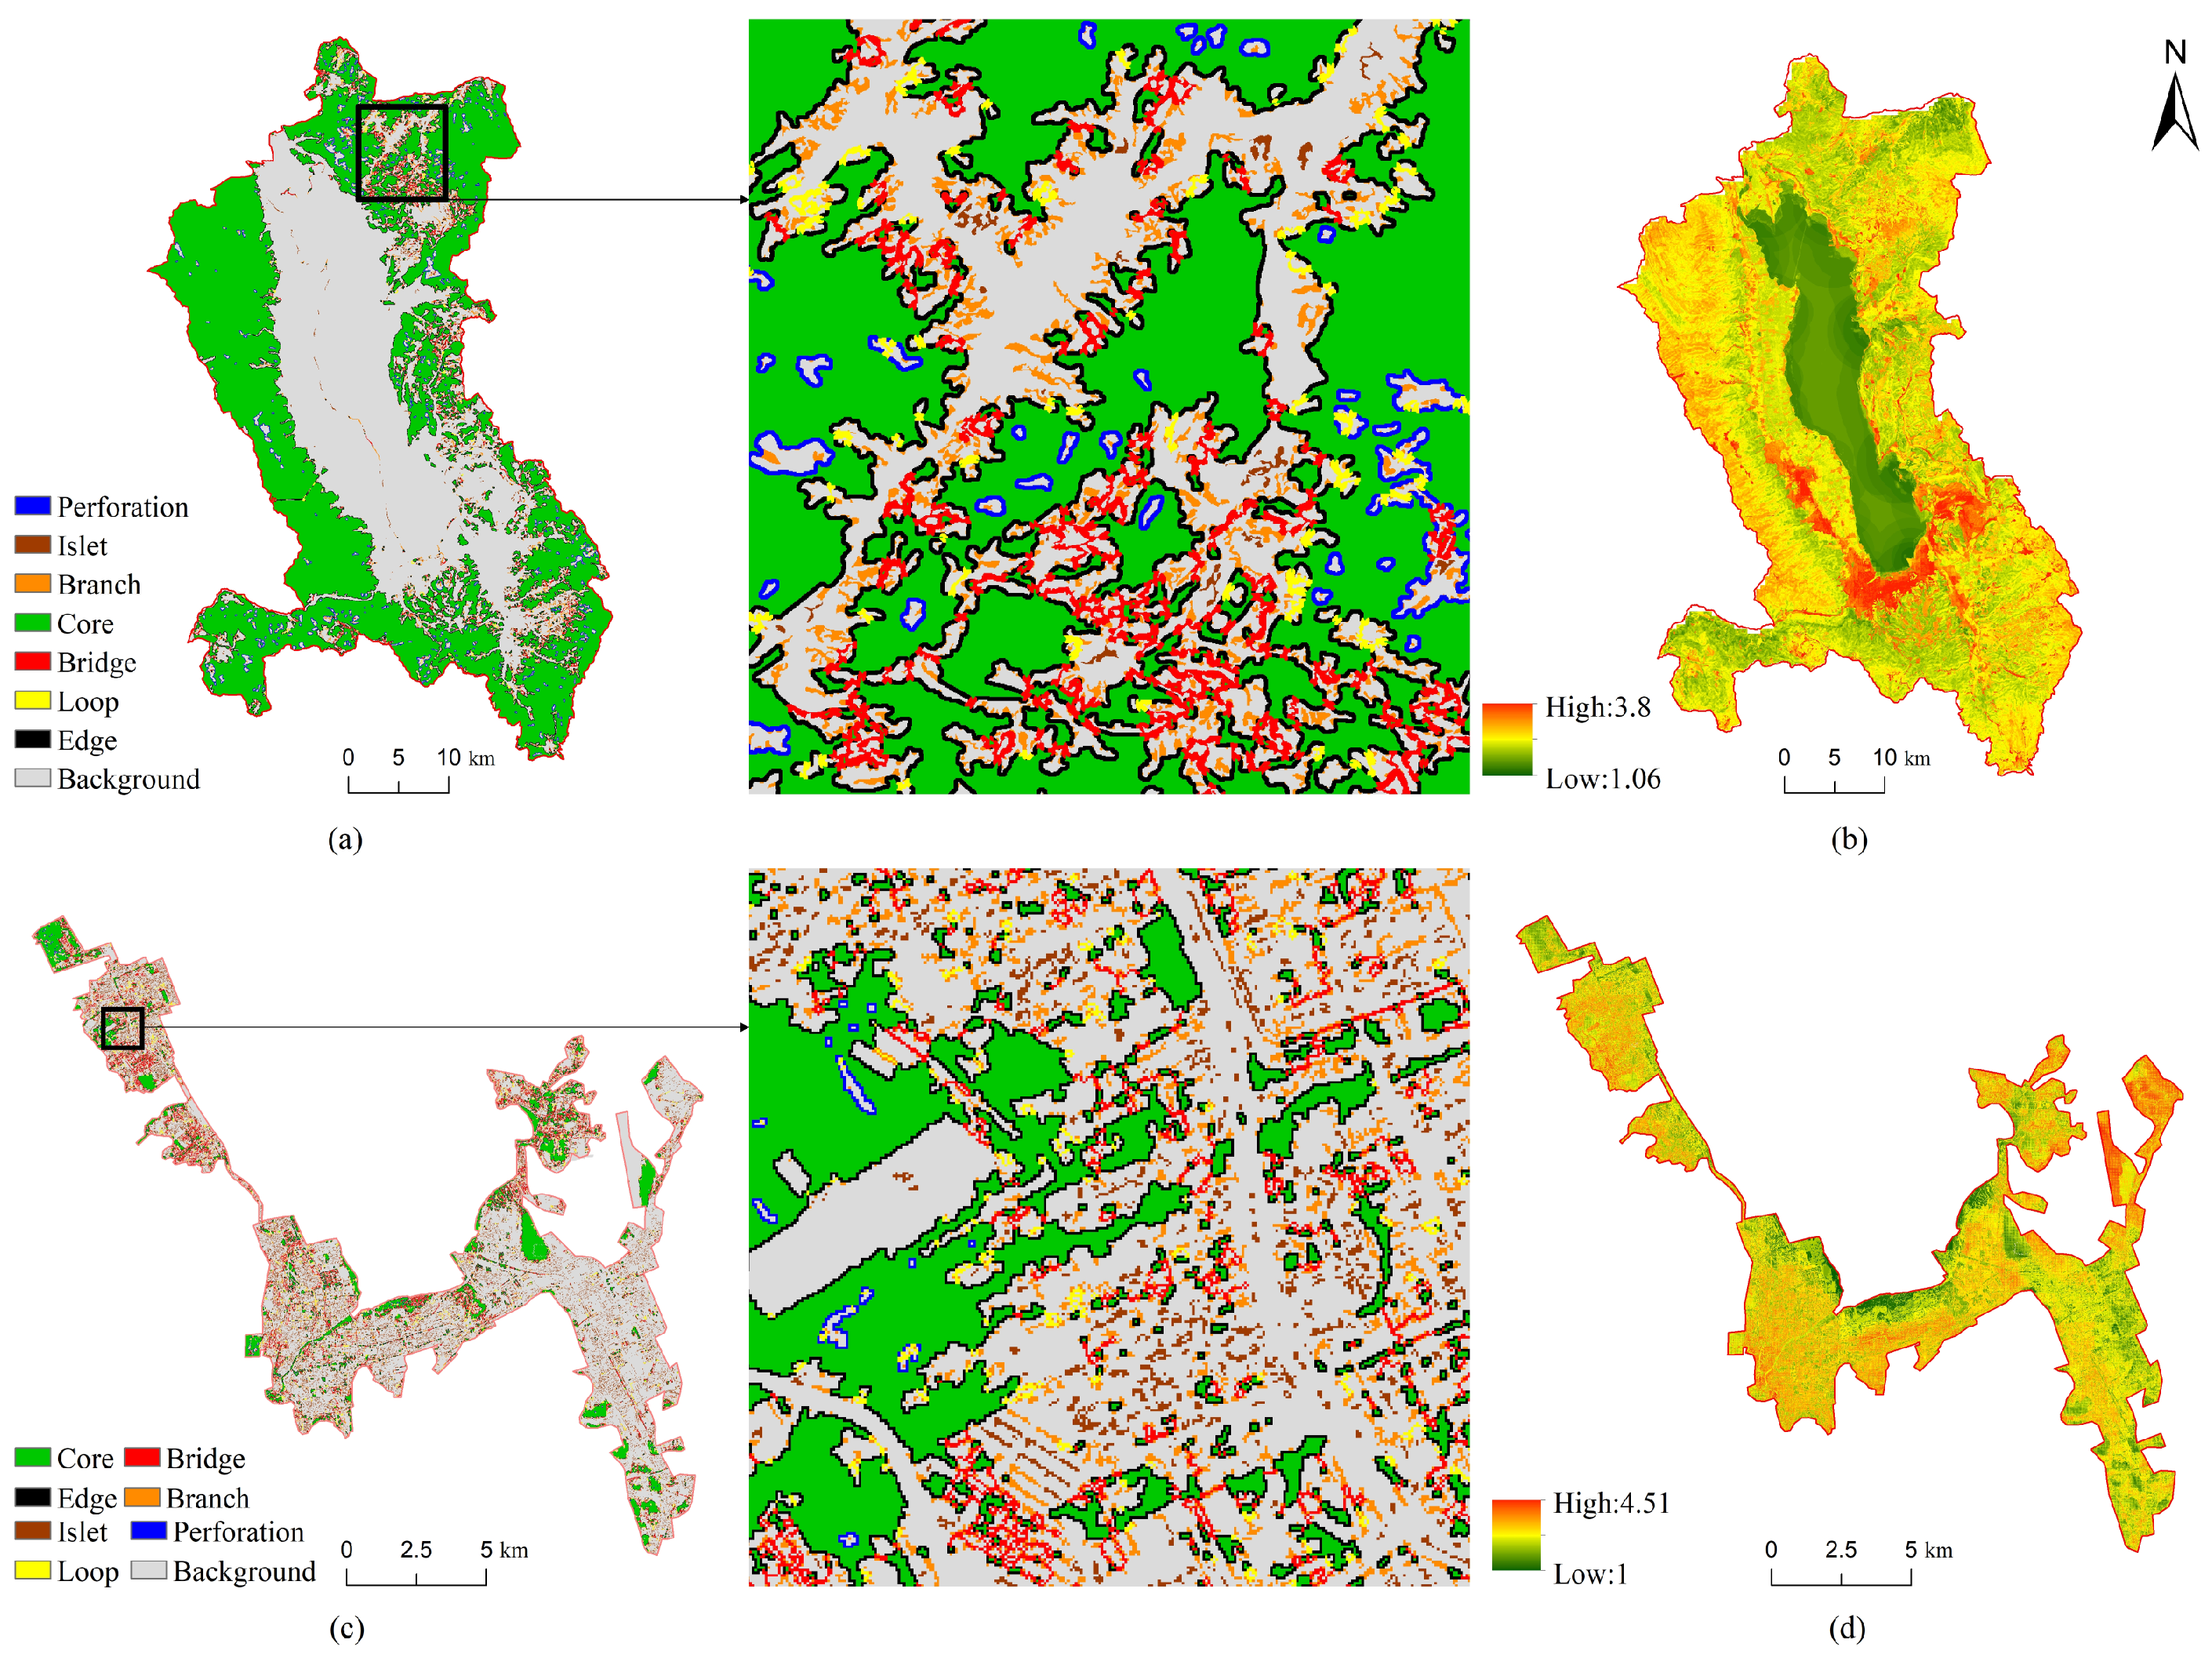
2.3.1. Habitat Network Construction
- (1)
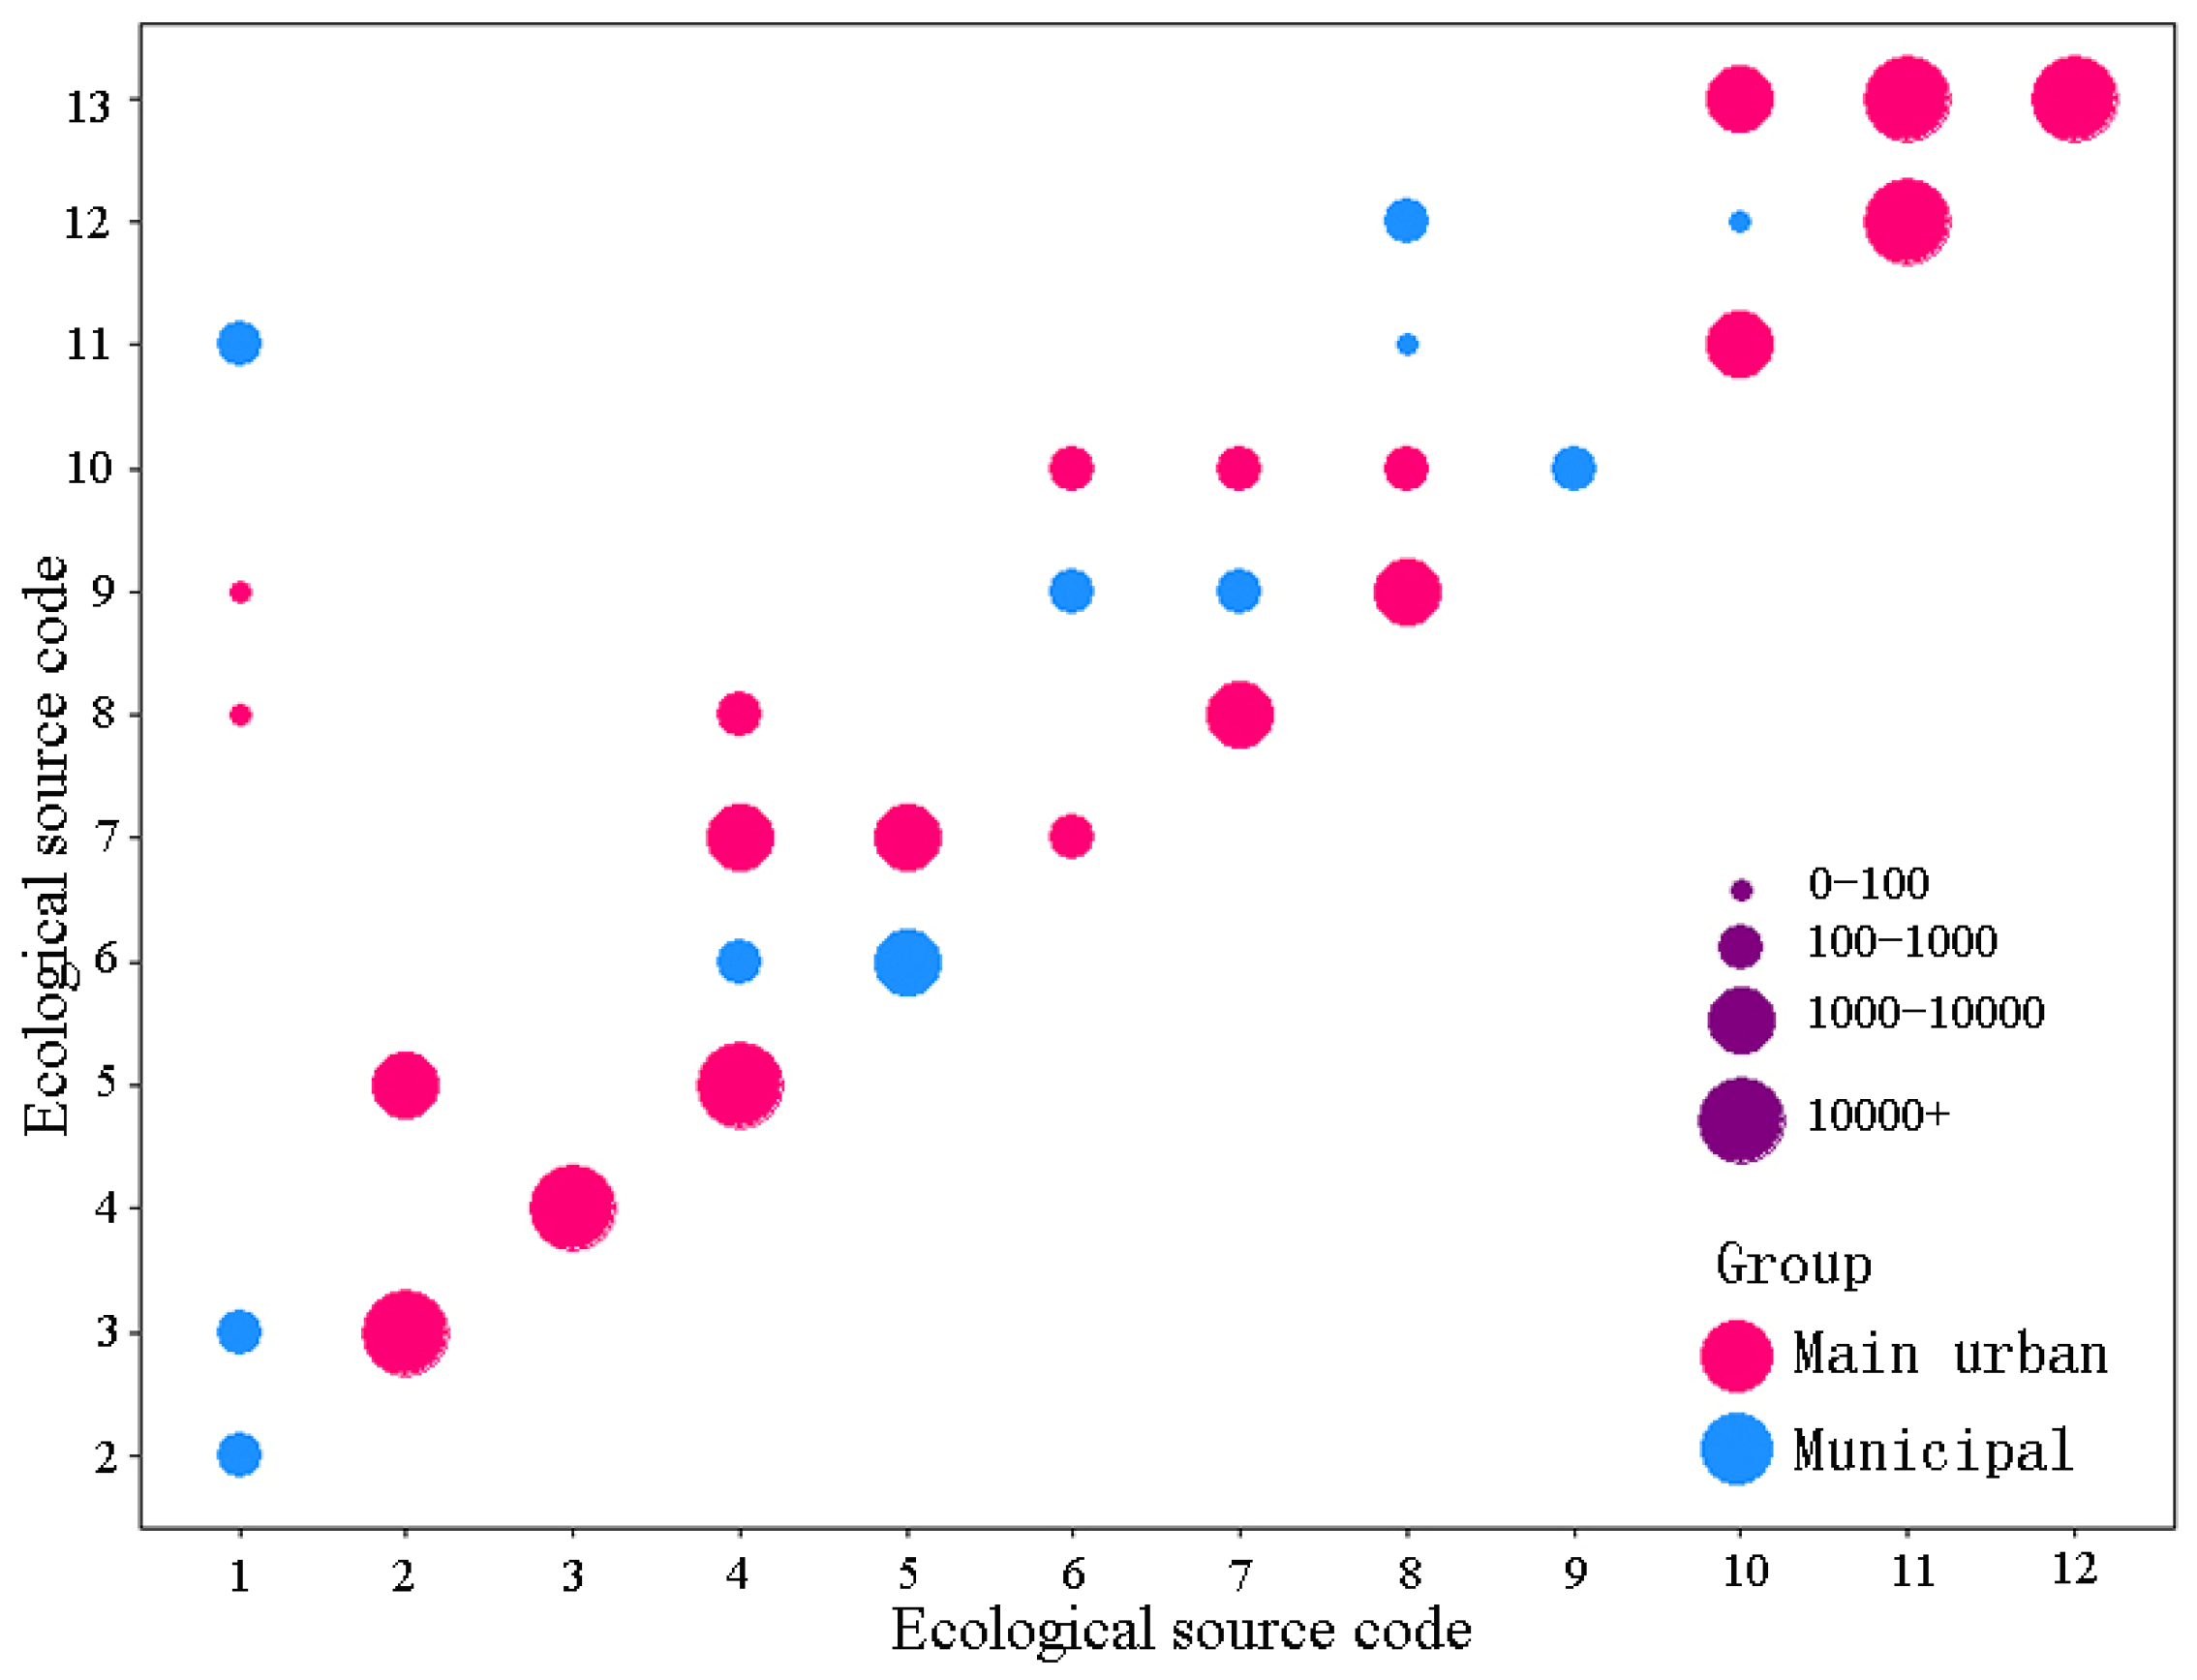
- Ecological source area identification
- (2)
- Ecological resistance surface construction
- (3)
- Ecological network construction and optimization
2.3.2. Water Green Network Construction
2.3.3. Landscape Network Construction
2.3.4. Recreation Network Construction
2.3.5. Corridor Width Optimization
2.3.6. Multi-Scale Nesting and Multi-Target Integration
3. Results
3.1. Municipal Network Construction
- (1)
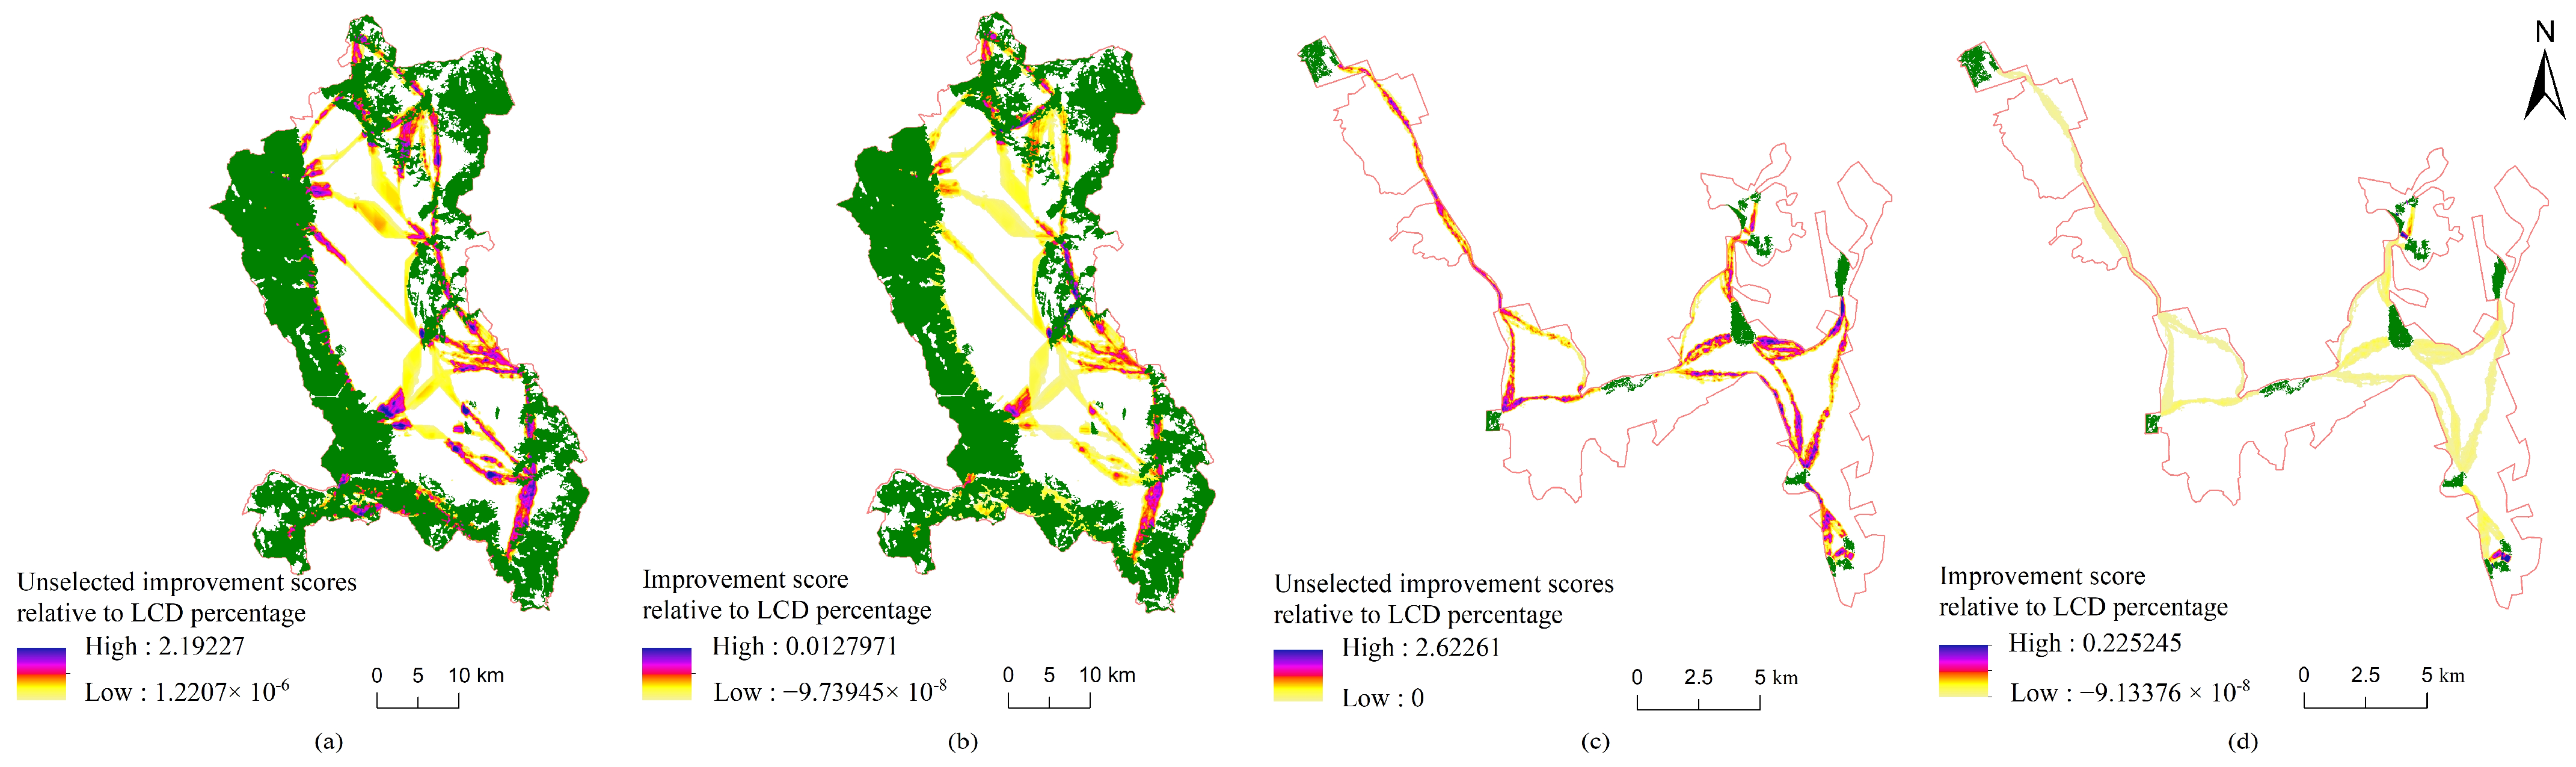
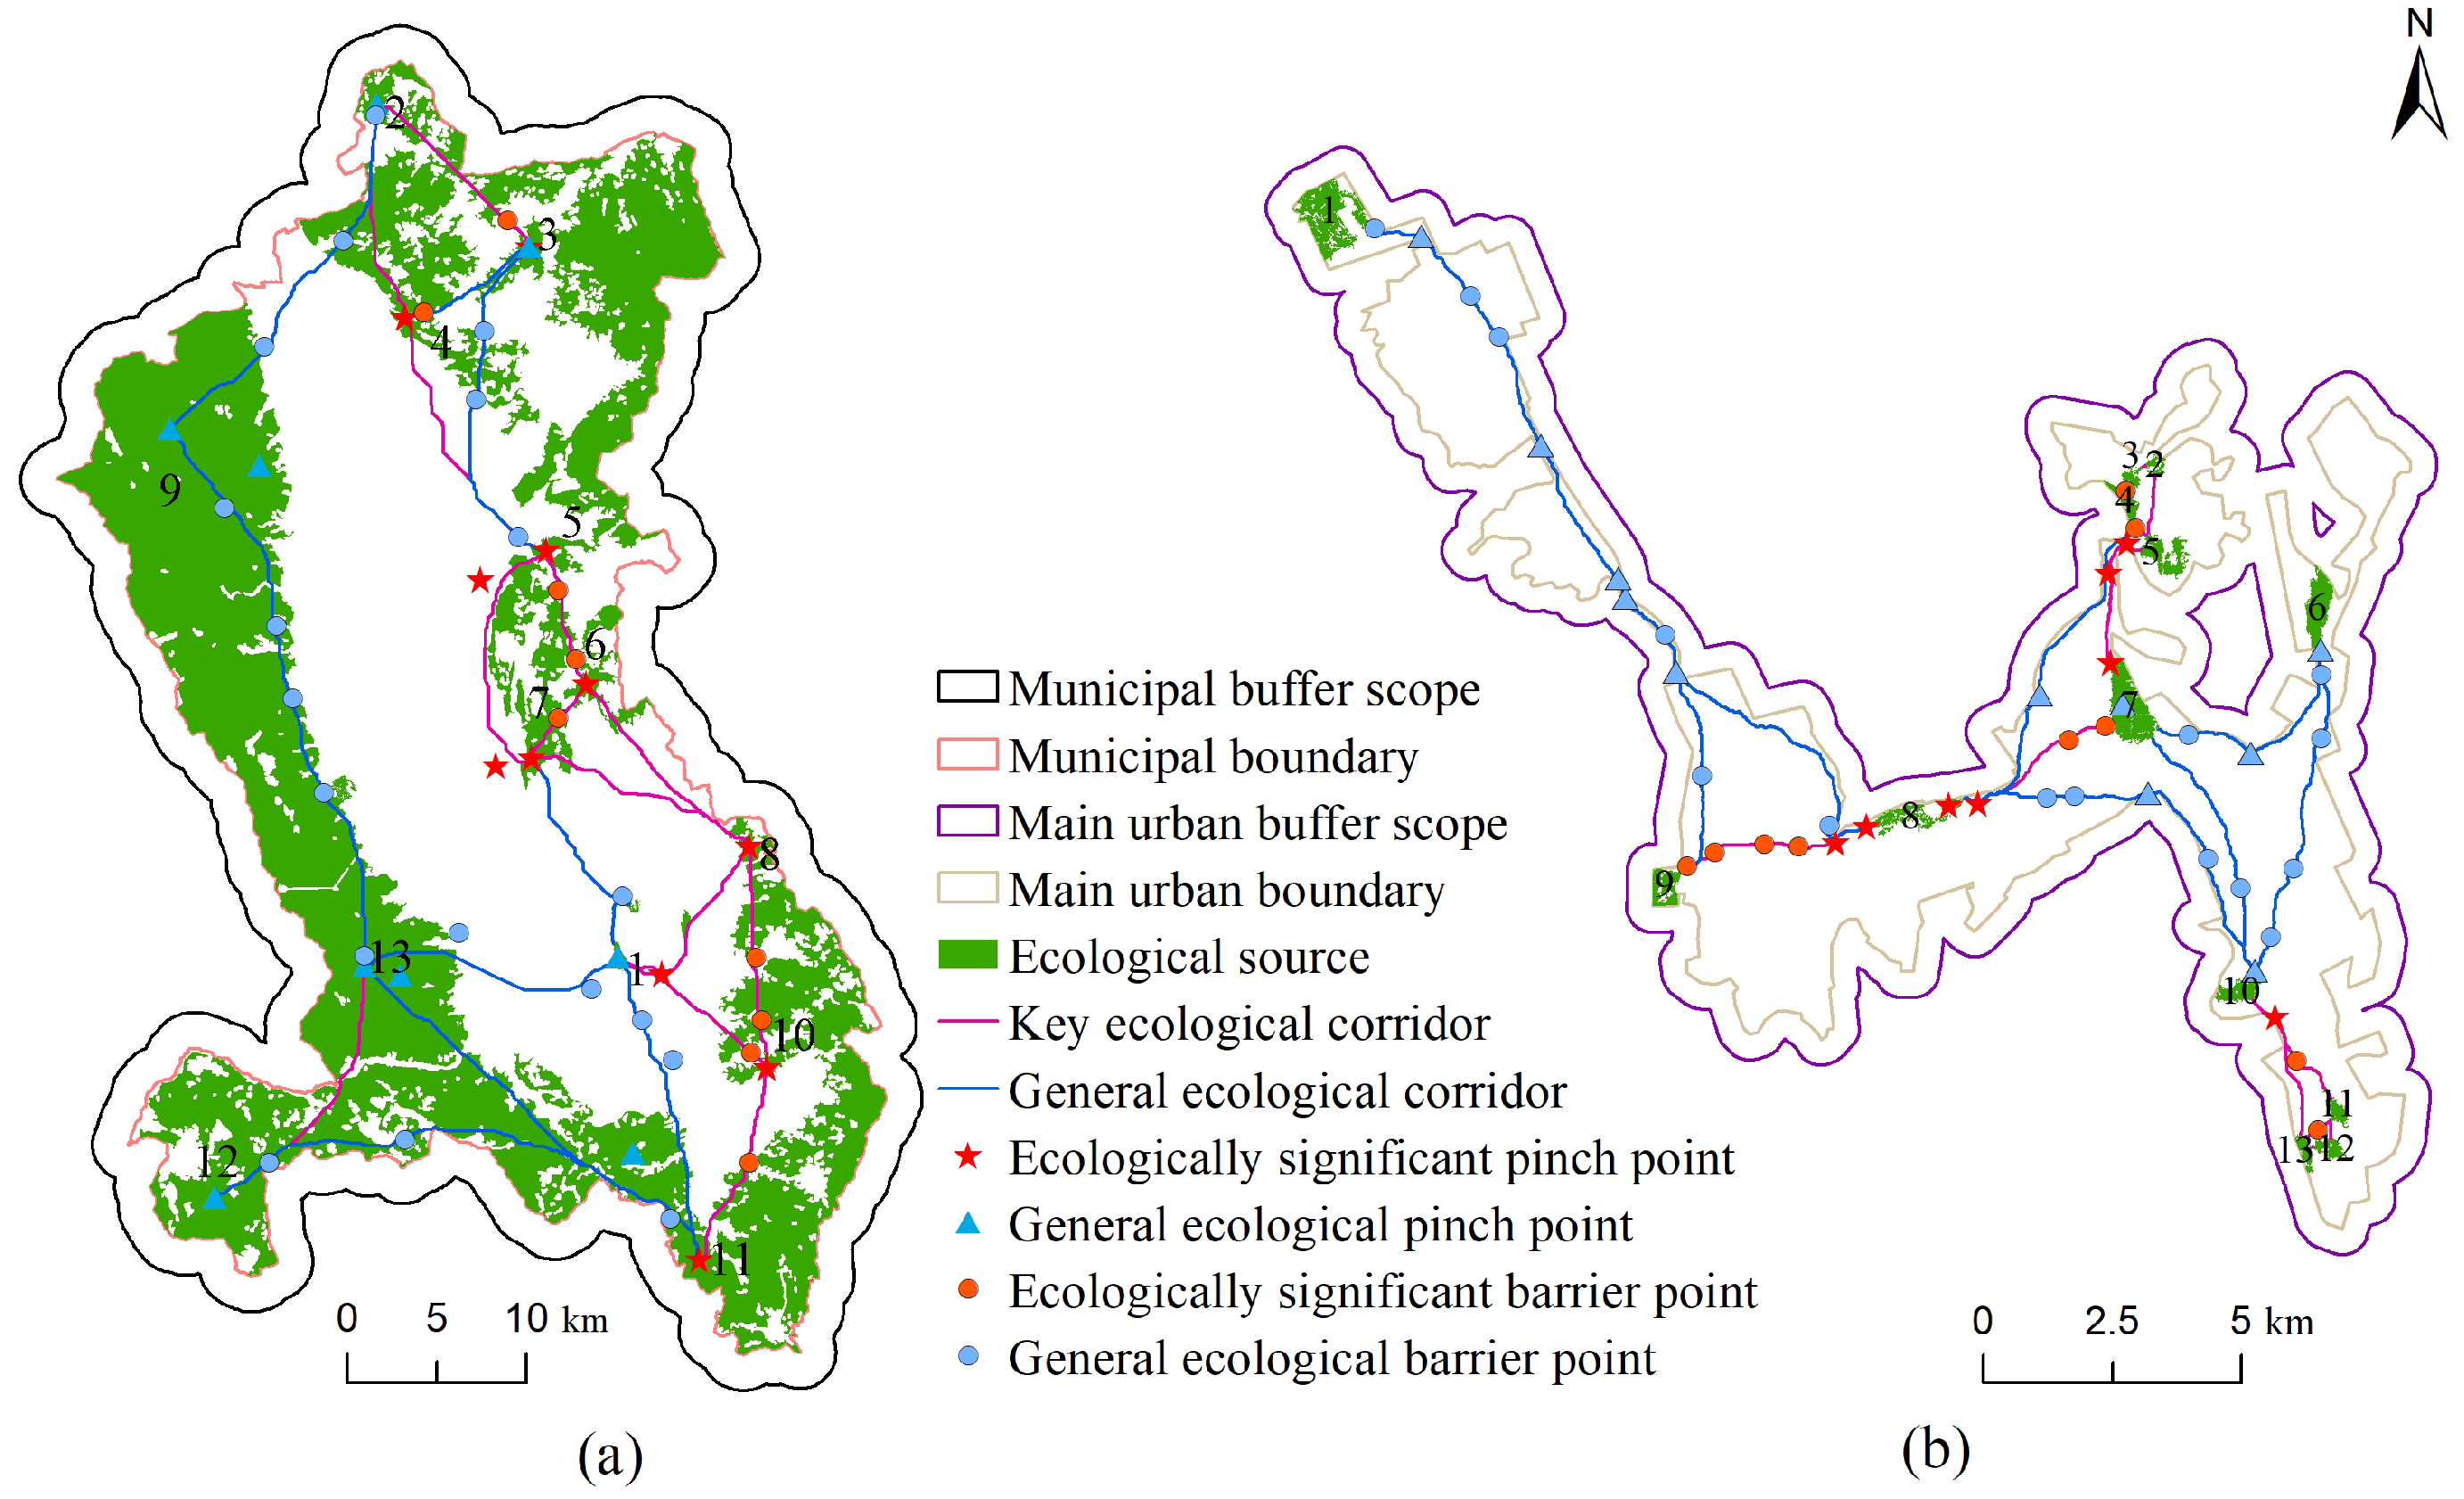
- Habitat network
- (2)
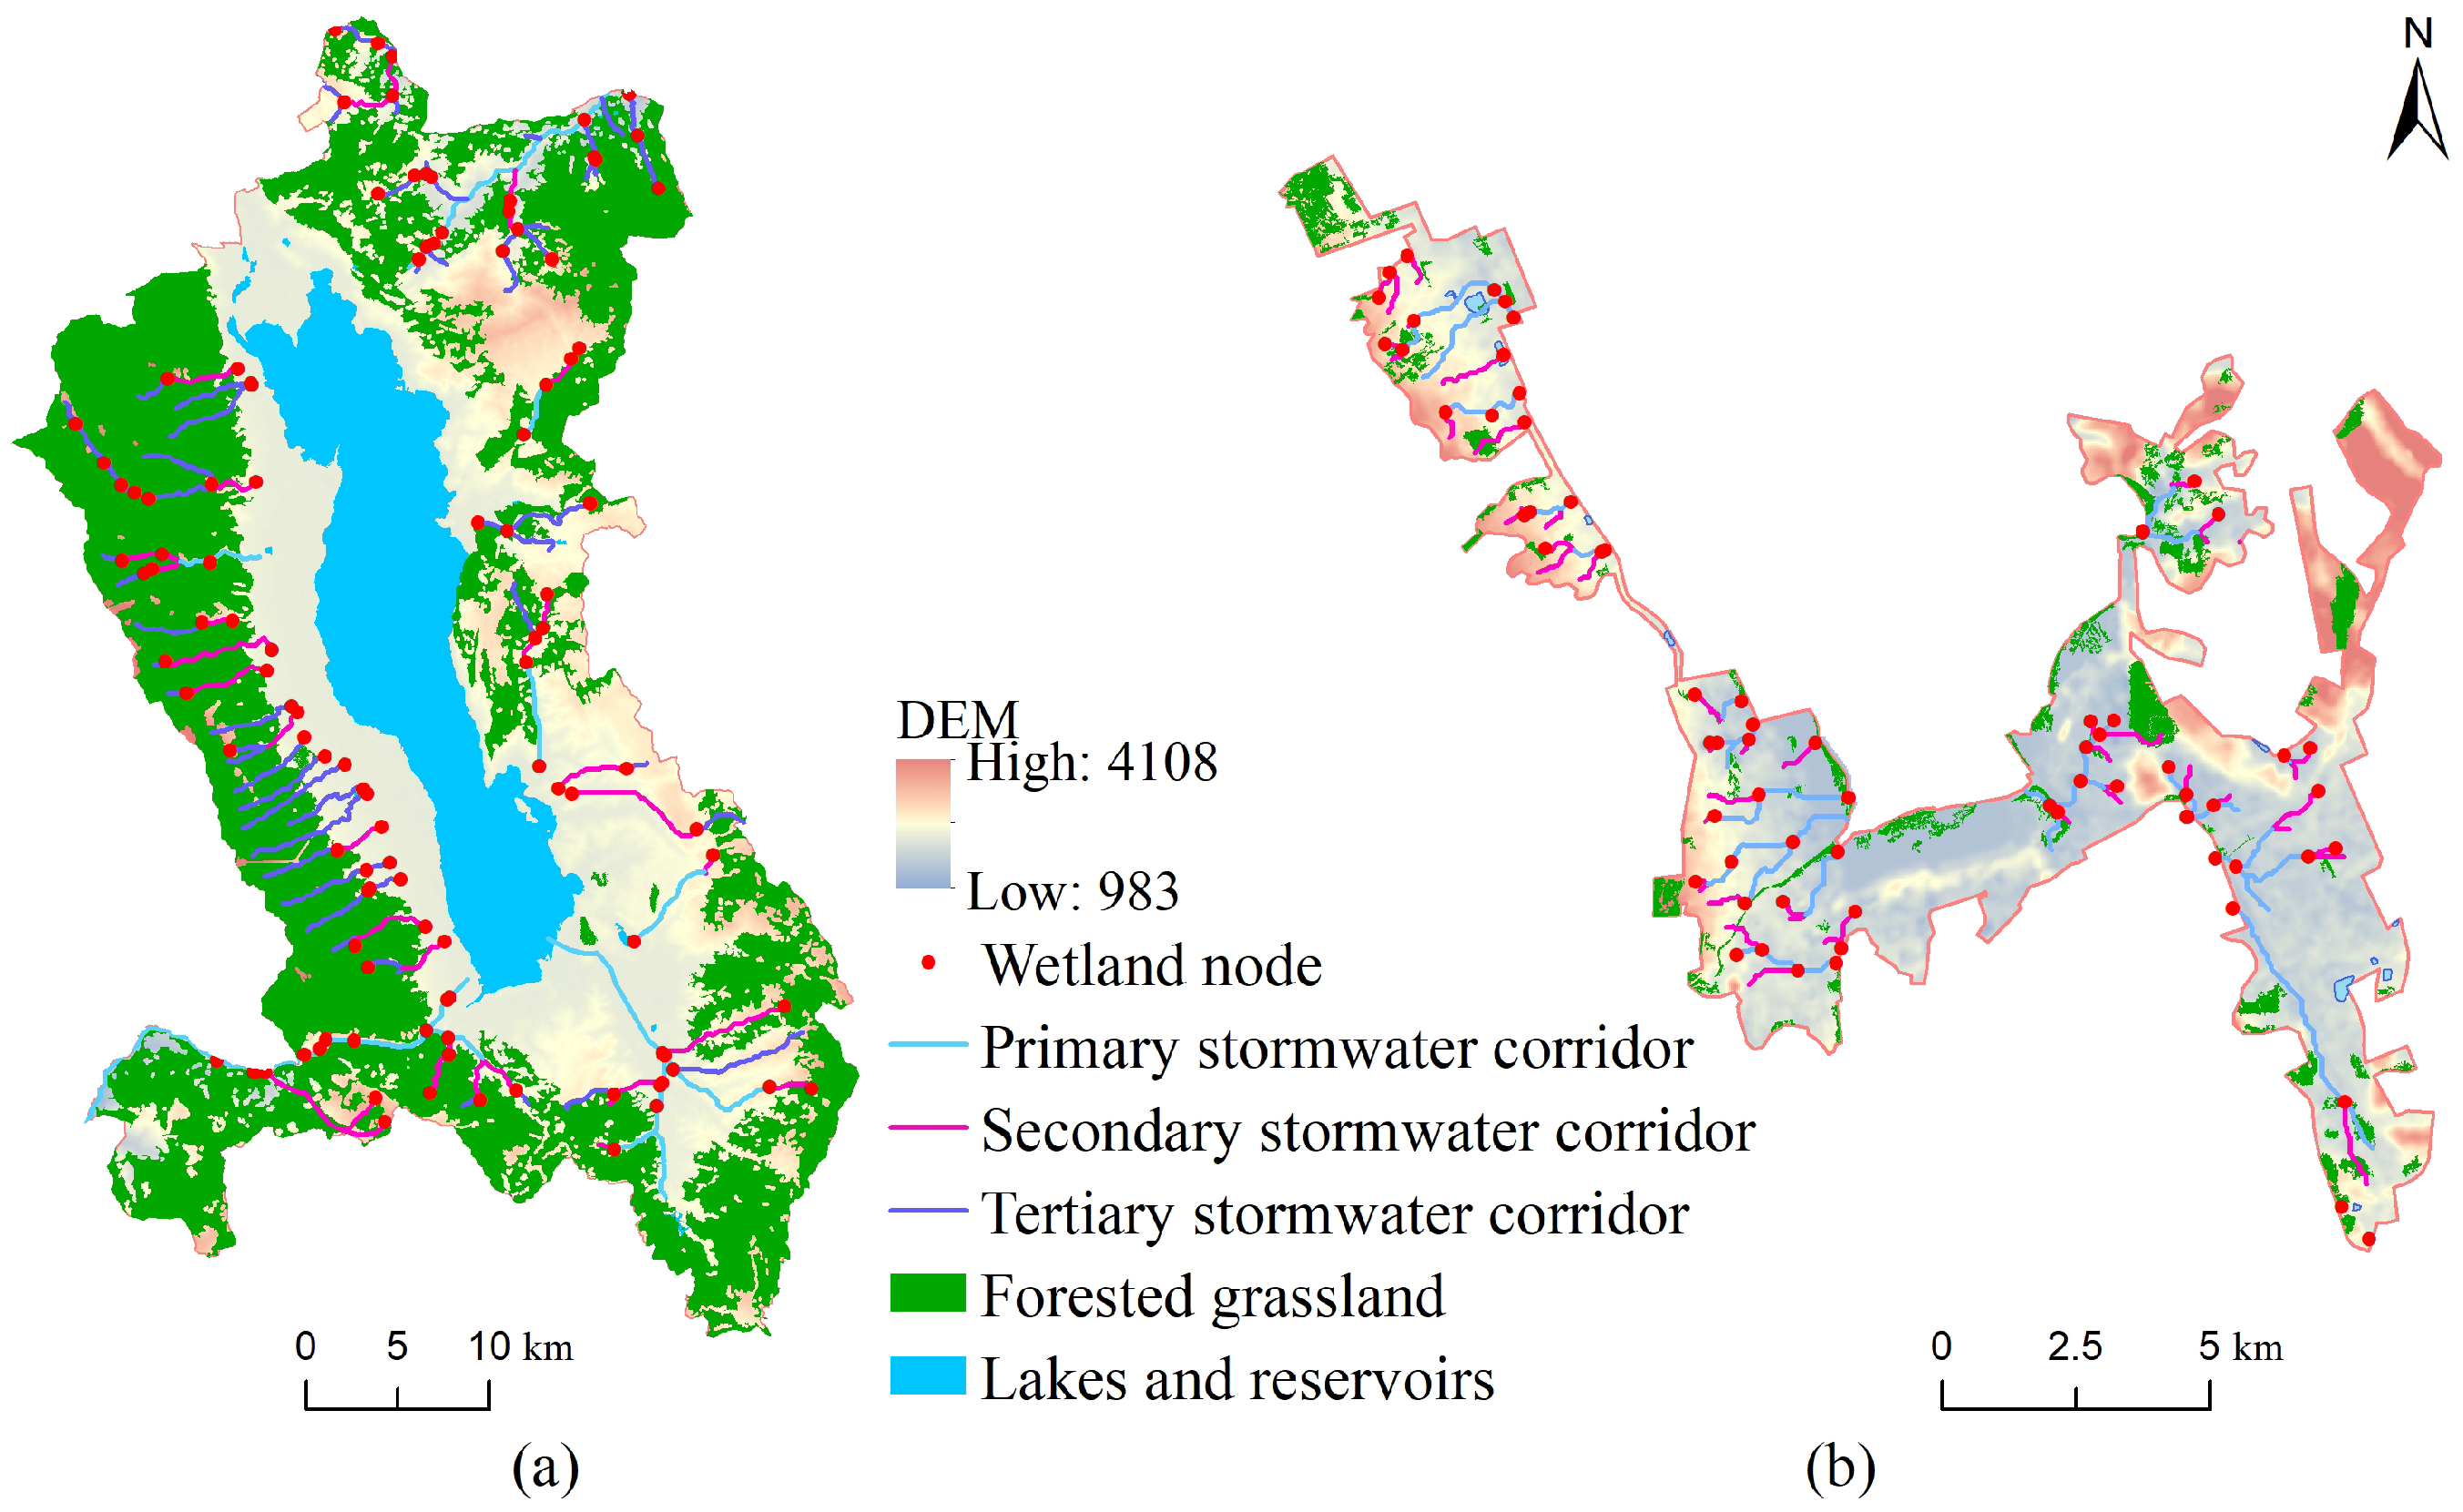
- Water Green Network
- (3)
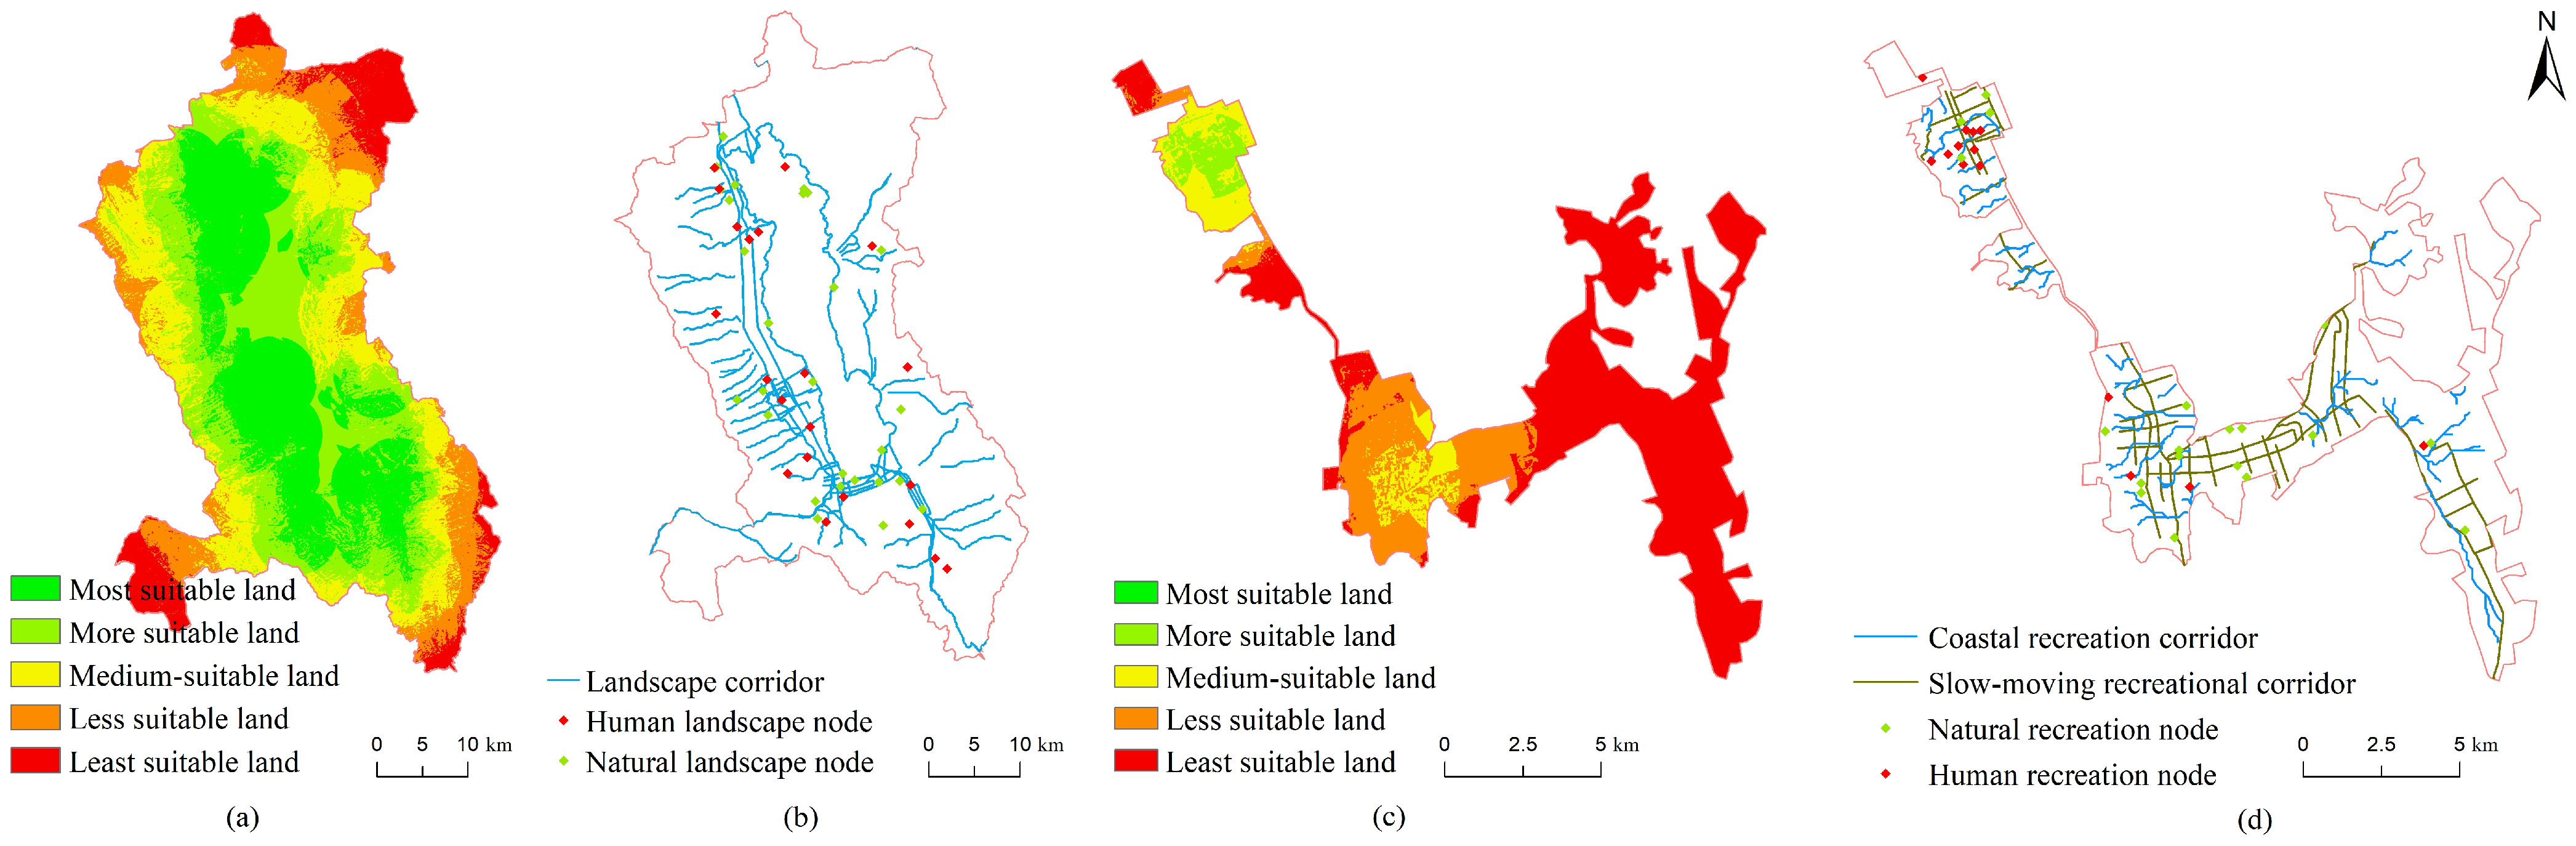
- Landscape networks
3.2. Network Construction in Main Urban
- (1)
- Habitat networks
- (2)
- Water Green Network
- (3)
- Recreation Network
3.3. Complex Ecological Network Construction
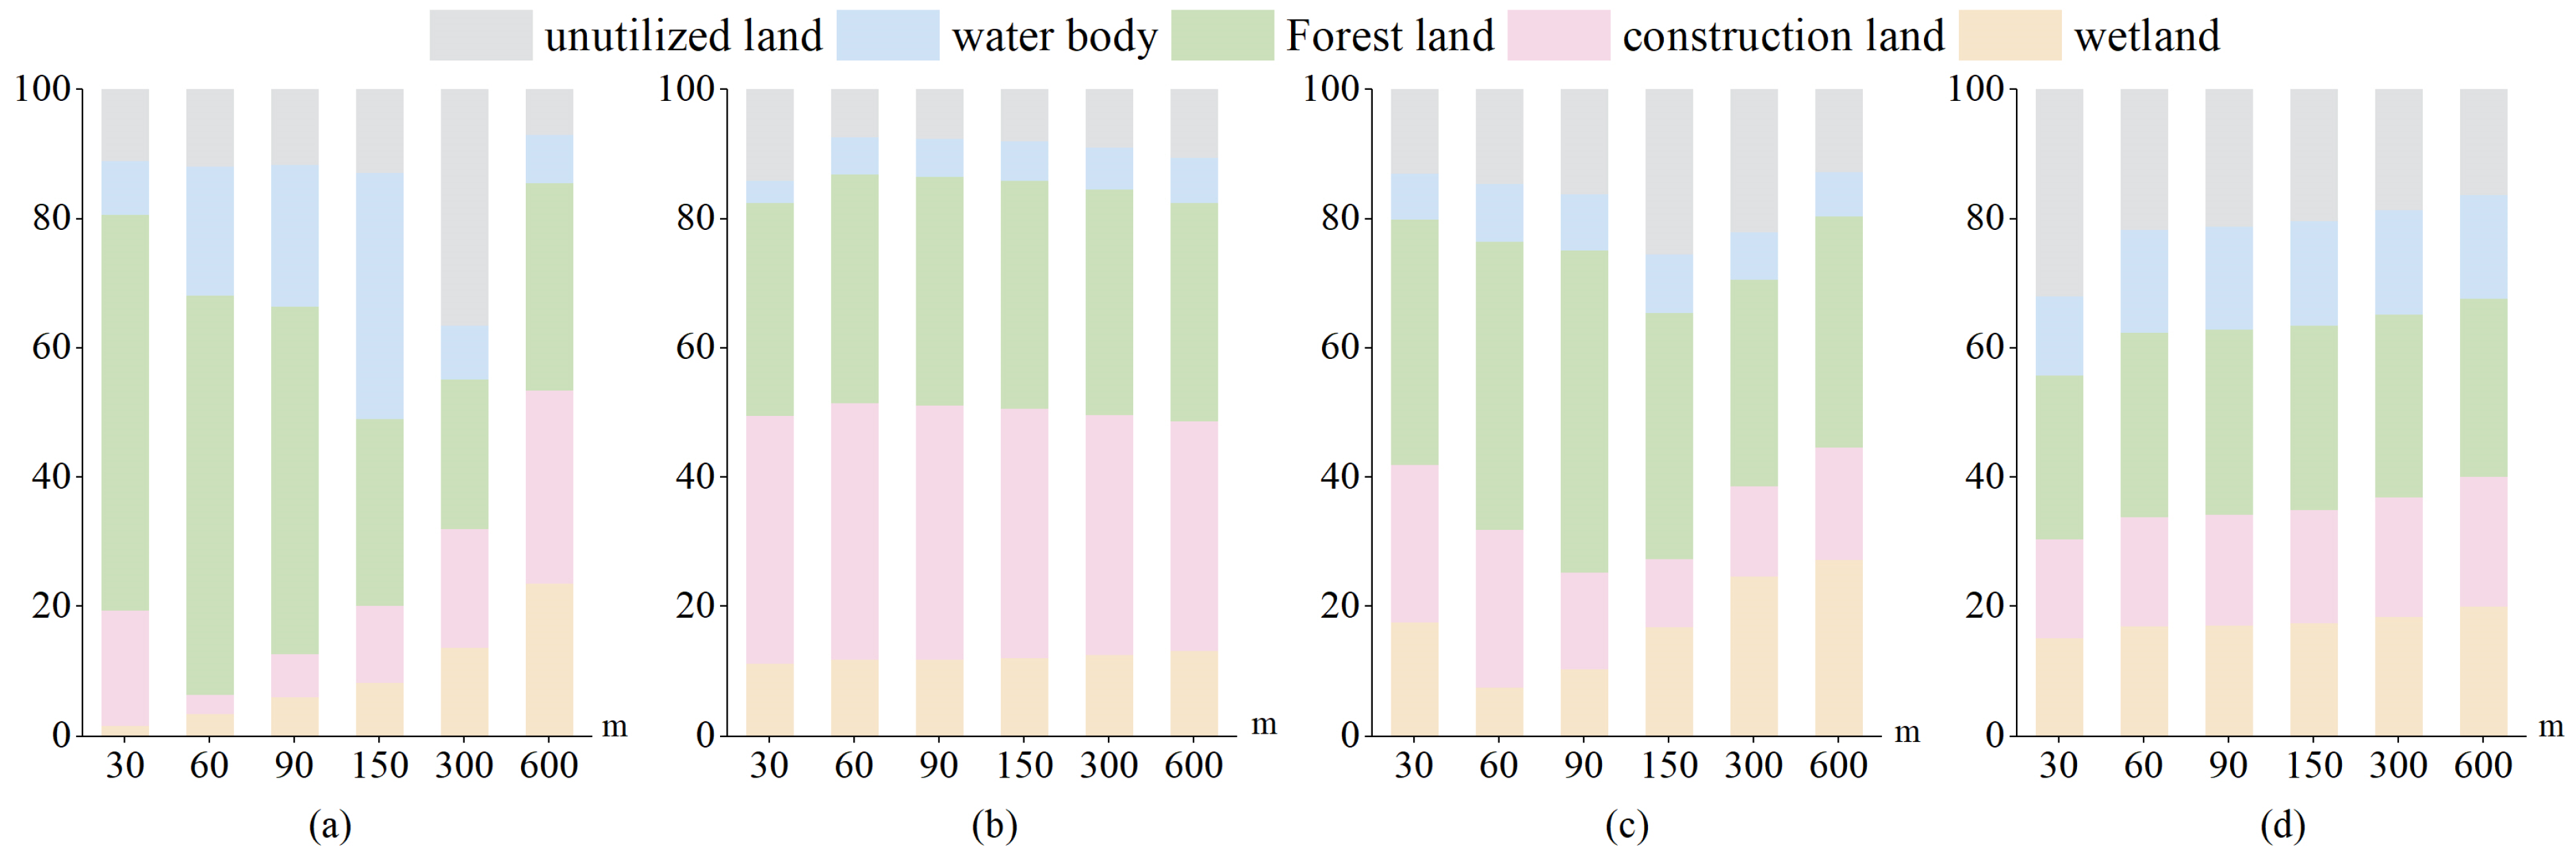
3.3.1. Appropriate Widths for Different Corridors
3.3.2. Nested Multi-Scale Ecological Networks
3.3.3. Multi-Targeted Ecological Network Integration
3.3.4. Multi-Functional Composite Ecological Network Pattern Optimization Strategy
4. Discussion
5. Conclusions
- (1)
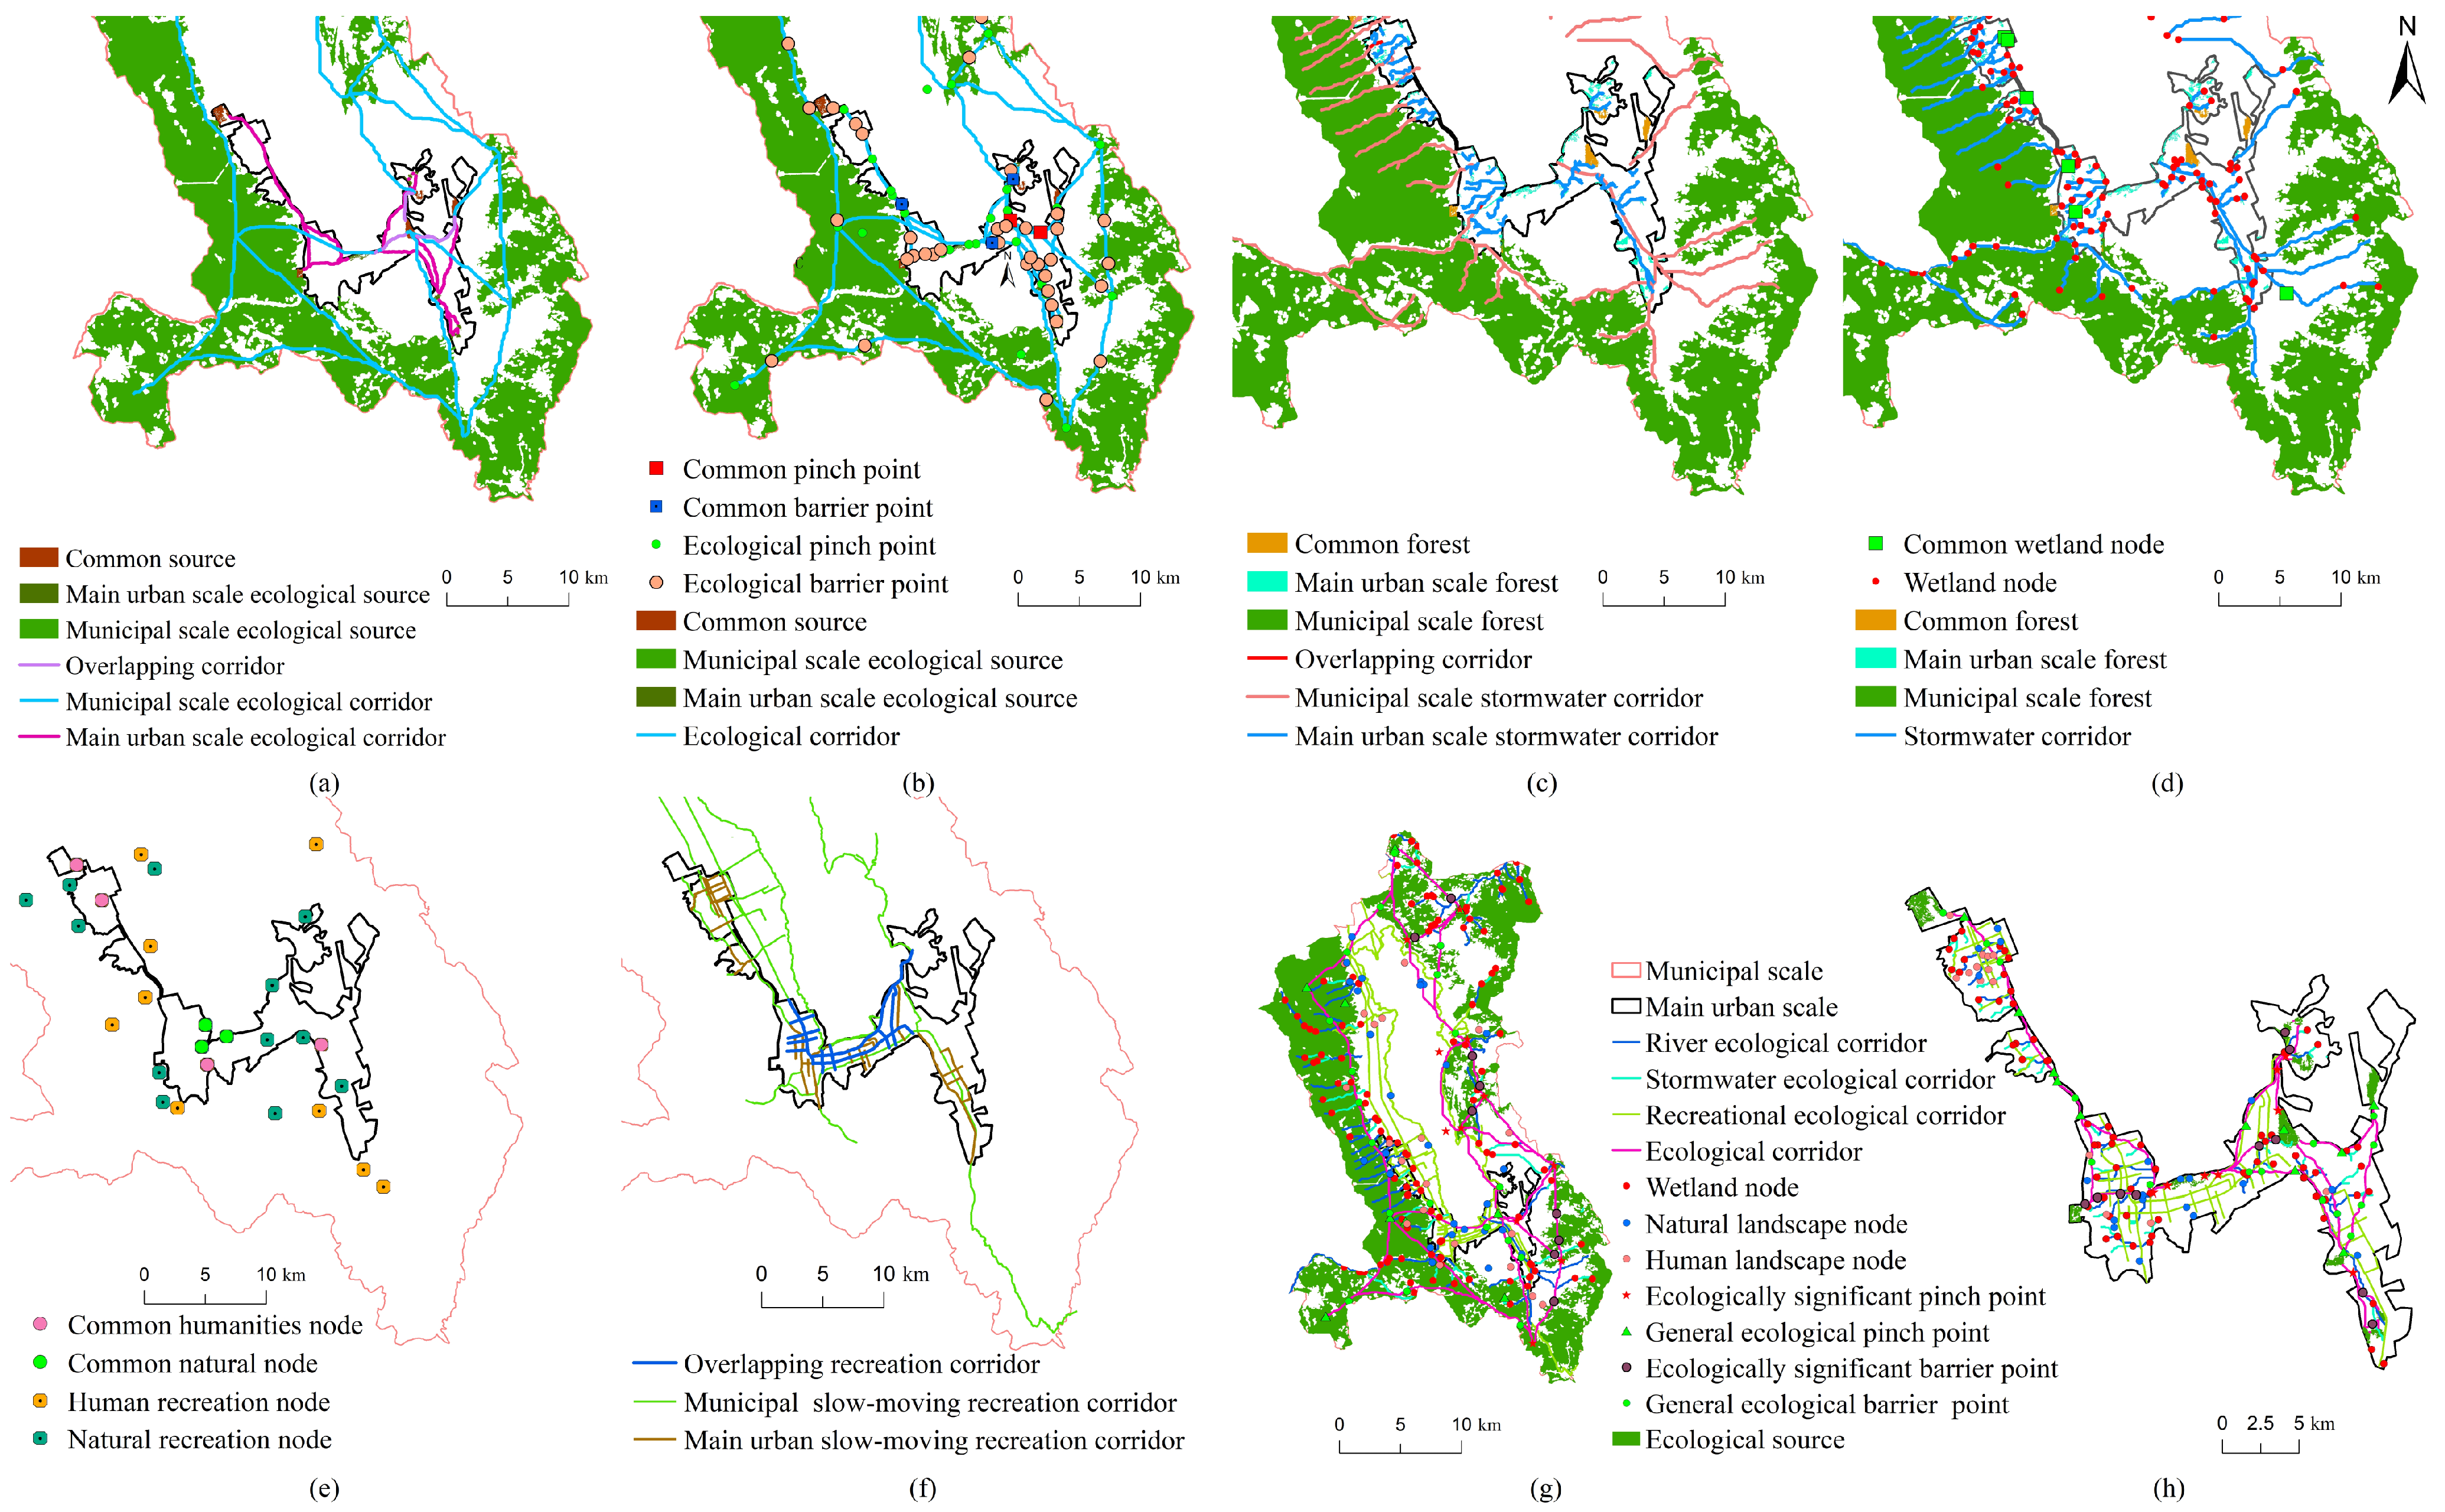
- In the “source-corridor-key node” ecological network, 3.65 km2 of overlapping ecological sources was identified, mainly concentrated in the main urban area of the study area. There are 11 overlapping ecological corridors, 3 stormwater corridors, and 17 recreational corridors. The overlapping areas are the key to achieving overall ecological sustainability and biodiversity in the region and should be protected as a priority.
- (2)
- Two overlapping pinch points, three obstacle points, four wetland nodes, and seven open space nodes were identified between the municipal and the main urban area. The ecological pinch points and barrier points are areas where species migration and movement between source areas are strongly impeded, and ecological problems can be addressed through the nested integration of multi-scale spatial structures.
- (3)
- The triple-function corridors are mainly distributed in the central part of the study area and around Erhai Lake, with stormwater corridors and recreational corridors dominating in the west and ecological corridors mostly distributed in Fengyi Town and Haidong Town in the southeast. Therefore, in the future, the protection of Shuanglang Town and Xiaguan Town should be increased to build ecological sources and ecological corridors with stronger connectivity. At the same time, the protection of ecologically fragile areas in the west and south should be increased to reduce ecological damage and prohibit indiscriminate logging and deforestation to maintain ecological functions.
- (4)
- This study emphasizes the importance of a composite ecological network for ecological sustainability, which can be applied to different levels of territorial space restoration. In terms of constructing low corridors, corridors can be constructed through measures such as restricting land development and implementing vegetation restoration. In addition, according to the actual situation, additional protective measures can be installed in the watersheds where the population is concentrated, at the policy level, in order to strictly control the pollution of the watersheds caused by agricultural production and the sewage discharge from domestic life. This study can provide a reference for the composite ecological network of similar cities.
Author Contributions
Funding
Institutional Review Board Statement
Informed Consent Statement
Data Availability Statement
Conflicts of Interest
References
- Jones, K.R.; Venter, O.; Fuller, R.A.; Allan, J.R.; Maxwell, S.L.; Negret, P.J.; Watson, J.E.M. One-third of global protected land is under intense human pressure. Science 2018, 360, 788–791. [Google Scholar] [CrossRef] [PubMed]
- Heynen, N.; Perkins, H.A.; Roy, P. The political ecology of uneven urban green space: The impact of political economy on race and ethnicity in producing environmental inequality in Milwaukee. Urban Aff. Rev. 2006, 42, 3–25. [Google Scholar] [CrossRef]
- Ma, C.; Deng, J.; Zhao, X.; Zhang, Y.C. Theory and practice of ecological city construction. IOP Conf. Ser. Earth Environ. Sci. 2018, 186, 012058. [Google Scholar] [CrossRef]
- Cui, S.Q.; Zhou, G.H.; Dai, L.Y. Progress and prospect of research on urban-rural integration development based on geography perspective. Econ. Geogr. 2022, 42, 104–113. [Google Scholar] [CrossRef]
- Dong, Y.; Jin, G.; Deng, X.; Wu, F. Multidimensional measurement of poverty and its spatio-temporal dynamics in China from the perspective of development geography. Geogr. Sci. 2021, 31, 130–148. [Google Scholar] [CrossRef]
- Brose, U. Improving nature conservancy strategies by ecological network theory. Basic Appl. Ecol. 2010, 11, 1–5. [Google Scholar] [CrossRef]
- Yang, Y.; Feng, Z.; Wu, K.; Lin, Q. How to construct a coordinated ecological network at different levels: A case from Ningbo city, China. Ecol. Inform. 2022, 70, 101742. [Google Scholar] [CrossRef]
- Wang, S.F.; Liu, L.B. From Corridor to Whole Region: Construction of Urban and Rural Blue-Green Space Network Under the Guidance of Green Urban Design. Landsc. Archit. 2021, 28, 45–50. [Google Scholar] [CrossRef]
- Jongman, R.H.G. Nature conservation planning in Europe: Developing ecological networks. Landsc. Urban Plan. 1995, 32, 169–183. [Google Scholar] [CrossRef]
- Naveh, Z.; Lieberman, A.S. Landscape Ecology: Theory and Application; Springer: Berlin/Heidelberg, Germany, 1994; pp. 27–109. [Google Scholar] [CrossRef]
- Wu, J.G. Landscape Ecology: Pattern, Process, Scale and Levels, 2nd ed.; Higher Education Press: Beijing, China, 2007; pp. 27–125. [Google Scholar]
- Cunha, N.S.; Magalhães, M.R. Methodology for map** the national ecological network to mainland Portugal: A planning tool towards a green infrastructure. Ecol Indic. 2019, 104, 802–818. [Google Scholar] [CrossRef]
- Zhou, D.; Song, W. Identifying ecological corridors and networks in mountainous areas. Int. J. Environ. Res. Public Health 2021, 18, 4797. [Google Scholar] [CrossRef] [PubMed]
- Bascompte, J. Structure and dynamics of ecological networks. Science 2010, 329, 765–766. [Google Scholar] [CrossRef] [PubMed]
- Baguette, M.; Blanchet, S.; Legrand, D.; Stevens, V.M.; Turlure, C. Individual dispersal, landscape connectivity and ecological networks. Biol. Rev. 2013, 88, 310–326. [Google Scholar] [CrossRef] [PubMed]
- Säterberg, T.; Sellman, S.; Ebenman, B. High frequency of functional extinctions in ecological networks. Nature 2013, 499, 468–470. [Google Scholar] [CrossRef] [PubMed]
- Gurrutxaga, M.; Lozano, P.J.; del Barrio, G. GIS-based approach for incorporating the connectivity of ecological networks into regional planning. J. Nat. Conserv. 2010, 18, 318–326. [Google Scholar] [CrossRef]
- Pocock, M.J.O.; Evans, D.M.; Memmott, J. The robustness and restoration of a network of ecological networks. Science 2012, 335, 973–977. [Google Scholar] [CrossRef]
- Geng, J.; Yu, K.; Sun, M.; Xie, Z.; Huang, R.; Wang, Y.; Zhao, Q.; Liu, J. Construction and Optimization of Ecological Networks in High-Density Central Urban Areas: The Case of Fuzhou City, China. Remote Sens. 2023, 15, 5666. [Google Scholar] [CrossRef]
- Li, Q.Y.; Tang, L.N.; Qiu, Q.Y.; Li, S.T.; Xu, Y. Construction of urban ecological security pattern based MSPA and MCR Model: A case study of Xiamen. Acta Ecol. Sin. 2024, 44, 2284–2294. [Google Scholar] [CrossRef]
- Xu, Z.Y.; Wang, S.H.; Gu, T.; Wang, S.Y.; Pei, C.Y.; Zhang, Q.F. Ecological network-based identification of critical areas for ecological restoration—A case study of Yan’an City. J. Arid. Land. 2024, 47, 1073–1083. [Google Scholar]
- Chen, W.; Liu, H.; Wang, J. Construction and optimization of regional ecological security patterns based on MSPA-MCR-GA Model: A case study of Dongting Lake Basin in China. Ecol. Indic. 2024, 165, 112169. [Google Scholar] [CrossRef]
- Huang, L.; Chen, Z.; Yang, Z.; Chen, M.; Chen, X.; Zhai, T.; Qiu, T. Integrating “quality-risk-demand” framework and circuit theory to identify spatial range and priority area of ecological security pattern in a rapidly urbanizing landscape. Ecol. Inform. 2024, 82, 102673. [Google Scholar] [CrossRef]
- Zeng, W.; He, Z.; Bai, W.; He, L.; Chen, X.; Chen, J. Identification of ecological security patterns of alpine wetland grasslands based on landscape ecological risks: A study in Zoigê County. Sci. Total Environ. 2024, 928, 172302. [Google Scholar] [CrossRef]
- Wang, M.; Liang, S.; Wang, Y.C. Comparison and Synthesis of Scenarios of Greenland Ecological Network Construction in the Context of Urban Shuangxiu—Based on the Perspective of “Socio-Ecological” Functional Composite. South Archit. 2019, 1–8. [Google Scholar] [CrossRef]
- Wang, B.; Liu, Z. Study on the optimization strategy of ecological network in Beijing central area under the background of urban renewal. Urban Stud. 2022, 29, 113–120. [Google Scholar]
- Dong, J.; Peng, J.; Liu, Y.; Qiu, S.T.; Han, Y.N. Integrating spatial continuous wavelet transform and kernel density estimation to identify ecological corridors in megacities. Landsc. Urban Plan. 2020, 199, 103815. [Google Scholar] [CrossRef]
- Shen, J.; Wang, Y. An improved method for the identification and setting of ecological corridors in urbanized areas. Urban Ecosyst. 2023, 26, 141–160. [Google Scholar] [CrossRef]
- Yu, Q.; Yue, D.P.; Wang, Y.H.; Kai, S.; Fang, M.Z.; Ma, H.; Zhang, Q.B.; Huang, Y. Optimization of ecological node layout and stability analysis of ecological network in desert oasis: A typical case study of ecological fragile zone located at Deng Kou County (Inner Mongolia). Ecol. Indic. 2018, 84, 304–318. [Google Scholar] [CrossRef]
- Zhou, Y.; Li, B.; Li, P.Y.; Yao, J.; Chen, M.K.; Tang, M.; Zhang, L.; Chen, J. Optimization of ecological network pattern of composite green space based on multi-functional coupling of “ecology-climate adaptation- recreation”. Acta Ecol. Sin. 2024, 44, 5854–5866. [Google Scholar] [CrossRef]
- Shen, Z.; Wu, W.; Tian, S.; Wang, J. A multi-scale analysis framework of different methods used in establishing ecological networks. Landsc. Urban Plan. 2022, 228, 104579. [Google Scholar] [CrossRef]
- Wei, Q.; Halike, A.; Yao, K.; Chen, L.; Balati, M. Construction and optimization of ecological security pattern in Ebinur Lake Basin based on MSPA-MCR models. Ecol. Indic. 2022, 138, 108857. [Google Scholar] [CrossRef]
- Wang, T.; Li, H.; Huang, Y. The complex ecological network’s resilience of the Wuhan metropolitan area. Ecol. Indic. 2021, 130, 108101. [Google Scholar] [CrossRef]
- Koen, E.L.; Bowman, J.; Sadowski, C.; Walpole, A.A. Landscape connectivity for wildlife: Development and validation of multispecies linkage maps. Methods Ecol. Evol. 2014, 5, 626–633. [Google Scholar] [CrossRef]
- Liu, J.; Yin, H.W.; Kong, F.H.; Li, M.H. Structure optimization of circuit theory-based green infrastructure in Nanjing, China. Acta Ecol. Sin. 2018, 38, 4363–4372. [Google Scholar] [CrossRef]
- Hu, C.; Wang, Z.; Wang, Y.; Sun, D.; Zhang, J. Combining MSPA-MCR model to evaluate the ecological network in Wuhan. China. Land 2022, 11, 213. [Google Scholar] [CrossRef]
- Zhou, Y.; Tang, M.; Chen, J.; Li, B. Optimization of green space ecological network in Chengdu city based on morphological spatial pattern analysis and mapping theory. Chin. J. Ecol. 2023, 42, 1527–1536. [Google Scholar] [CrossRef]
- Yu, H.; Wang, Y.; Eme, C.; Fan, X.; Rong, Y.; Zhang, Q.; Liang, Z. Construction of ecological network based on multi-scale conversion and nesting. Water 2021, 13, 1278. [Google Scholar] [CrossRef]
- Fan, J.; Wang, Q.; Sun, M.Y.; Feng, Y.; Yang, F.; Zhang, Z. Ecological network construction and gradient zoning optimization strategy in urban-rural fringe: A case study of Licheng District, Jinan City. China. Ecol. Indic. 2023, 150, 110251. [Google Scholar] [CrossRef]
- Hashemi, R.; Darabi, H. The review of ecological network indicators in graph theory context: 2014–2021. Int. J. Environ. Res. 2022, 16, 1–26. [Google Scholar] [CrossRef]
- Lu, J.; Jiao, S.; Han, Z.W.; Yin, J.W. Promoting Ecological Restoration of Deeply Urbanized Hilly Areas: A Multi-Scale Ecological Networks Approach. Ecol. Indic. 2023, 154, 110655. [Google Scholar] [CrossRef]
- McRae, B.H.; Dickson, B.G.; Keitt, T.H.; Shan, V.B. Using circuit theory to model connectivity in ecology, evolution, and conservation. Ecology 2008, 89, 2712–2724. [Google Scholar] [CrossRef]
- Chen, J.; Mei, Z.; Wang, B.; Wei, J. Construction of Ecological Security Patterns Based on Circuit Theory under the Resistance Distance Principle. Int. J. Envirn. Res. Public Health. 2022, 19, 6298. [Google Scholar] [CrossRef] [PubMed]
- Zhu, J.; Su, J.; Yin, H.W.; Kong, F.H. Construction of an ecological network in Xuzhou based on comprehensive identification of source sites and multiscale nesting. J. Nat. Resour. 2020, 35, 1986–2001. [Google Scholar] [CrossRef]
- An, Y.; Liu, S.L.; Sun, Y.X.; Shi, F.N.; Beazley, R. Construction and optimization of an ecological network based on morphological spatial pattern analysis and circuit theory. Landsc. Ecol. 2021, 36, 2059–2076. [Google Scholar] [CrossRef]
- Wei, B.J.; Su, J.; Hu, X.J.; Xu, K.H.; Zhu, M.L.; Lin, L.Y. Comprehensive identification of eco-corridors and eco-nodes based on principle of hydrological analysis and LinkageMapper. Acta Ecol. Sin. 2022, 42, 2995–3009. [Google Scholar] [CrossRef]
- Ahmad, I. Digital elevation model (DEM) coupled with geographic information system (GIS): An approach towards erosion modeling of Gumara watershed, Ethiopia. Environ. Monit. Assess. 2018, 190, 568. [Google Scholar] [CrossRef] [PubMed]
- Pan, Y.; Yuan, X.; Wang, F.; Zhou, L.; Zhang, D.; Yu, X.H. Ecological network construction and optimal regulation based on rural water ponds. J. Hydroecol. 2023, 44, 99–106. [Google Scholar] [CrossRef]
- Shao, J.; Huang, K.; Tang, W.; Liang, X.; Wu, W.; Huang, G. Discussion on the Construction of Ecological Water Network in Guangxi Province of China. Res. Ecol. 2021, 3, 8–13. [Google Scholar] [CrossRef]
- Ma, R.; Xie, M.; Yun, W.; Zhu, D. Evaluating responses of temperature regulating service to landscape pattern based on “Source-Sink” theory. Isprs. Int. J. Geo-Inf. 2020, 9, 295. [Google Scholar] [CrossRef]
- Lu, J.; Wu, X. Research on Urban Greenway Alignment Selection Based on Multisource Data. Sustainability 2022, 14, 12382. [Google Scholar] [CrossRef]
- Peng, J.; Zhao, H.; Liu, Y. Urban ecological corridors construction: A review. Acta Ecol. Sin. 2017, 37, 23–30. [Google Scholar] [CrossRef]
- Zhou, G.; Huan, Y.; Wang, L.; Lan, Y.; Liang, T.; Shi, B.; Zhang, Q. Linking ecosystem services and circuit theory to identify priority conservation and restoration areas from an ecological network perspective. Sci. Total Environ. 2023, 873, 162261. [Google Scholar] [CrossRef]
- Cui, L.; Wang, J.; Sun, L.; Lv, C.D. Construction and optimization of green space ecological networks in urban fringe areas: A case study with the urban fringe area of Tongzhou district in Beijing. J. Clean. Prod. 2020, 276, 124266. [Google Scholar] [CrossRef]
- Shuai, N.; Hu, Y.; Gao, M.; Guo, Z.; Bai, Y. Construction and optimization of ecological networks in karst regions based on multi-scale nesting: A case study in Guangxi Hechi, China. Ecol. Inform. 2023, 74, 101963. [Google Scholar] [CrossRef]
- Kang, J.; Qing, Y.; Lu, W. Construction and optimization of the Saihanba ecological network. Ecol. Indic. 2023, 153, 110401. [Google Scholar] [CrossRef]
- Shi, F.; Liu, S.; Sun, Y.; An, Y.; Zhao, S.; Liu, Y.; Li, M.Q. Ecological network construction of the heterogeneous agro-pastoral areas in the upper Yellow River basin. Agric. Ecosyst. Environ. 2020, 302, 107069. [Google Scholar] [CrossRef]
- Nie, W.; Shi, Y.; Siaw, M.J.; Yang, F.; Wu, R.; Wu, X.; Zheng, X.; Bao, Z. Constructing and optimizing ecological network at county and town Scale: The case of Anji County, China. Ecol. Indic. 2021, 132, 108294. [Google Scholar] [CrossRef]
- Cui, Y.; Guo, B.; Li, W.; Kong, X.M. Assessment of urban blue-green space cooling effect linking maximum and accumulative perspectives in the Yangtze River Delta, China. Environ. Sci. Pollut. Res. 2023, 30, 121834–121850. [Google Scholar] [CrossRef]
- Qian, Y.M.; Huang, Y.T.; Cao, Y.R.; Wu, J.Y.; Xiong, Y.M. Ecological network construction and optimization in Guangzhou from the perspective of biodiversity conservation. J. Environ. Manag. 2023, 336, 117692. [Google Scholar] [CrossRef]
- Wang, T.; Huang, Y.; Cheng, J.; Xiong, H.; Yin, Y.; Feng, Y.; Wang, J. Construction and optimization of watershed-scale ecological network based on complex network method: A case study of Erhai Lake Basin in China. Ecol. Indic. 2024, 160, 111794. [Google Scholar] [CrossRef]


| Scale | Drag Factor | Resistance Value Rating | Weight | ||||
|---|---|---|---|---|---|---|---|
| 1 | 2 | 3 | 4 | 5 | |||
| Municipal | Land use type | Forest, waters | Grasslands | Cultivated land | Unutilized land | Building land | 0.28 |
| Elevation (m) | <1500 | 1500–2000 | 2000–2500 | 2500–3000 | >3000 | 0.19 | |
| Slope (°) | 0–6.20 | 6.20–14.63 | 14.63–23.20 | 23.20–33.33 | 33.33–70.99 | 0.14 | |
| NDVI | −0.21 | 0.02–0.16 | 0.16–0.25 | 0.25–0.34 | 0.34–0.56 | 0.06 | |
| Main urban | Land use type | Forest | Water | Cultivated land | Unutilized land | Building land | 0.24 |
| Elevation (m) | <2000 | 2000–2100 | 2100–2200 | 2200–2300 | >2300 | 0.15 | |
| Slope (°) | 0–6.05 | 6.05–18.45 | 18.45–31.69 | 31.69–45.87 | 45.87–75.22 | 0.15 | |
| NDVI | −0.14 | 0.01–0.11 | 0.11–0.20 | 0.20–0.29 | 0.29–0.55 | 0.06 | |
| Distance from river (m) | <500 | 500–1000 | 1000–1500 | 1500–2000 | >2000 | 0.07 | |
| Distance from road (m) | <500 | 500–1000 | 1000–1500 | 1500–2000 | >2000 | 0.07 | |
| Distance from residential area (m) | <1000 | 1000–2000 | 2000–3000 | 3000–4000 | >4000 | 0.12 | |
| Nighttime Light index | <5 | 10 | 15 | 20 | >20 | 0.14 | |
| Category | Indicator Layer | Evaluation Criteria | Weight |
|---|---|---|---|
| Accessibility | Resource accessibility | Assign 4, 3, 2, 1, and 0 points for distance from landscape nodes | 0.18 |
| Accessibility to transportation facilities | 4, 3, 2, 1, 0 points for distance from important transportation terminals | 0.29 | |
| Existing linear landscape resources | Assigned 4, 3, 2, 1, and 0 points for distance from existing linear landscape resources | 0.12 | |
| Scenic | Characteristic of the place | 4, 3, 2, 1, 0 points according to whether it is a historical and cultural district under key protection and has good landscape and windscape | 0.12 |
| River | Assign 4, 3, 2, 1, 0 points for distance from the river | 0.08 | |
| NDVI | 4, 3, 2, 1, 0 points were assigned according to the vegetation cover class | 0.05 | |
| Serviceability | Distribution density of visitor services | 4, 3, 2, 1, 0 points according to space heat level | 0.08 |
| Distribution density of civic service facilities | 4, 3, 2, 1, 0 points based on space heat level | 0.08 |
| Level 1 Element | Secondary Element | Evaluation Methodology | ||
|---|---|---|---|---|
| Element | Weight | Element | Weight | |
| Ecological background | 0.16 | Elevation | 0.1 | 4, 3, 2, 1, 0 points are assigned according to the slope classification |
| NDVI | 0.06 | 4, 3, 2, 1, 0 points were assigned according to the vegetation cover class | ||
| Natural resources | 0.4 | River | 0.12 | Assign 4, 3, 2, 1, 0 points for distance from the river |
| City parks and squares | 0.18 | Distance from city parks and squares are given 4, 3, 2, 1, 0 points | ||
| Forest parks, scenic areas | 0.1 | 4, 3, 2, 1, 0 points for the popularity, grade and area of forest parks and scenic areas | ||
| Human resources | 0.24 | Unit of cultural relic protection | 0.08 | 4, 3, 2, 1, 0 points for distance from the heritage conservation unit |
| Characteristic Historical Neighborhoods | 0.08 | 4, 3, 2, 1, and 0 points for distance from the Distinctive Historic District | ||
| Museums | 0.08 | Assigned 4, 3, 2, 1, 0 points for distance from the museum respectively | ||
| Transportation facilities | 0.2 | Road traffic network | 0.06 | 4, 3, 2, 1, 0 points given for distance from road traffic network |
| Major transportation terminal | 0.04 | 4, 3, 2, 1, 0 points for distance from important transportation terminals | ||
| Slow-moving road network | 0.1 | Assign 4, 3, 2, 1, 0 points for distance from the slow-moving road network | ||
Disclaimer/Publisher’s Note: The statements, opinions and data contained in all publications are solely those of the individual author(s) and contributor(s) and not of MDPI and/or the editor(s). MDPI and/or the editor(s) disclaim responsibility for any injury to people or property resulting from any ideas, methods, instructions or products referred to in the content. |
© 2024 by the authors. Licensee MDPI, Basel, Switzerland. This article is an open access article distributed under the terms and conditions of the Creative Commons Attribution (CC BY) license (https://creativecommons.org/licenses/by/4.0/).
Share and Cite
Chen, R.; Zhang, S.; Huang, X.; Li, X.; Peng, J. Ecological Network Construction Based on Red, Green and Blue Space: A Case Study of Dali City, China. ISPRS Int. J. Geo-Inf. 2024, 13, 279. https://doi.org/10.3390/ijgi13080279
Chen R, Zhang S, Huang X, Li X, Peng J. Ecological Network Construction Based on Red, Green and Blue Space: A Case Study of Dali City, China. ISPRS International Journal of Geo-Information. 2024; 13(8):279. https://doi.org/10.3390/ijgi13080279
Chicago/Turabian StyleChen, Rong, Shunmin Zhang, Xiaoyuan Huang, Xiang Li, and Jiansong Peng. 2024. "Ecological Network Construction Based on Red, Green and Blue Space: A Case Study of Dali City, China" ISPRS International Journal of Geo-Information 13, no. 8: 279. https://doi.org/10.3390/ijgi13080279