Article

Examining Spatial Disparities in Electric Vehicle Public Charging Infrastructure Distribution Using a Multidimensional Framework in Nanjing, China

College of Landscape Architecture, Nanjing Forestry University, Nanjing 210037, China
*
Author to whom correspondence should be addressed.
ISPRS Int. J. Geo-Inf. 2024, 13(8), 296; https://doi.org/10.3390/ijgi13080296
Submission received: 2 June 2024 / Revised: 3 August 2024 / Accepted: 19 August 2024 / Published: 20 August 2024

Abstract

:
With the increasing demand for electric vehicle public charging infrastructure (EVPCI), optimizing the charging network to ensure equal access is crucial to promote the sustainable development of the electric vehicle market and clean energy. Due to limited urban land space and the large-scale expansion of charging infrastructure, determining where to begin optimization is the first step in improving its layout. This paper uses a multidimensional assessment framework to identify spatial disparities in the distribution of EVPCI in Nanjing Central Districts, China. We construct a scientific evaluation system of the public charging infrastructure (PCI) layout from four spatial indicators: accessibility, availability, convenience, and affordability. Through univariate and bivariate local indicators of spatial autocorrelation (LISA), the spatial agglomeration pattern of the EVPCI service level and its spatial correlation with social factors are revealed. The results of this study not only identify areas in Nanjing where the distribution of PCI is uneven and where there is a shortage but also identify areas down to the community level where there are signs of potential wastage of PCI resources. The results demonstrate that (1) urban planners and policymakers need to expand the focus of PCI construction from the main city to the three sub-cities; (2) it is necessary to increase the deployment of PCI in Nanjing’s old residential communities; and (3) the expansion of PCI in Nanjing must be incremental and optimized in terms of allocation, or else it should be reduced and recycled in areas where there are signs of resource wastage. This study provides targeted and implementable deployment strategies for the optimization of the spatial layout of EVPCI.

1. Introduction

With increasingly serious energy and environmental problems and vehicle exhaust emissions, new-energy vehicles, as a clean and sustainable mode of transportation, have received increasing attention, and their development has become common around the world to reduce greenhouse gas emissions and improve the environment [1]. Under the Paris Agreement, electrification of the urban transport sector has been recognized as an essential component of the achievement of low-carbon goals [2], and green and sustainable development is being actively promoted. Several countries have already announced the ban of the sale of pure gasoline and diesel cars in the next 2–10 years [3]. The UK plans to achieve zero emissions for all new cars and trains by 2035 by actively pursuing the development and sale of ultra-low and zero-emission vehicles [4]. China’s Hainan Province has required 100% use of new-energy vehicles in the official sector in 2021 [5] and plans to ban the sale of fuel vehicles from 2030 [6]. China’s new-energy vehicle sales have shown a rapid growth trend since 2019, and the number of vehicles had exceeded 20 million by the end of 2023. In 2020, China issued the “New Energy Vehicle Industry Development Plan (2021–2035)”, which requires the implementation of a national strategy for the development of new-energy vehicles. Therefore, it is of great practical significance to construct a reasonable charging infrastructure layout planning method [7].
The increasing market share of new-energy vehicles has made it a challenge to locate charging stations [8]. The configuration and planning of public charging infrastructure (PCI) is critical to meeting the needs of new-energy vehicle users and sustainable urban development. A PCI is not only a common urban service; it helps realize the potential of the new-energy vehicle market. In most cities, the high accessibility of a charging infrastructure is conducive to promoting the popularity of electric vehicles (EVs) [9]. The charging infrastructure can also become a distributed data center for new-energy vehicles, providing valuable traffic information for urban planning and energy management [10].
As shown in Table 1 and Figure 1, the data released by the China Electric Vehicle Charging Infrastructure Promotion Alliance indicate that 10 years ago, China had only about 80,000 electric vehicles and about 28,000 charging piles. The new-energy vehicle market was very small, and the state had not formally introduced policies related to charging infrastructure [11]. There is no reasonable planning method for the construction of charging infrastructure in China, which leads to the imbalance of supply and demand and an imperfect support system [12]. In March 2020, the construction of PCI in China was officially included in the seven key areas of “new infrastructure”. By the end of 2023, China’s charging infrastructure had accumulated more than 8.5 million units, and the number of public charging piles exceeded 2.7 million units. The ratio of new-energy vehicles to public charging piles is 7.4:1, reflecting an apparent imbalance between supply and demand. In addition, due to China’s past rapid urbanization, old residential communities with limited space and complex renovations have not been reserved for the installation of charging piles, and blindly deploying a charging infrastructure will not solve the problem [13]. In view of the shortcomings and challenges faced by the current EVPCI construction, it is necessary that urban planners and policymakers optimize the charging network and improve the configuration of charging piles.
The contributions of this paper are as follows: (1) A multidimensional spatial scale evaluation system is proposed, which breaks the single EVPCI spatial layout evaluation method and whose measurement results are more scientific, accurate, and comprehensive. (2) Combining spatial and social dimensions, we explore in more detail the disparities in the service levels of EVPCI across communities and their association with social factors. (3) The bivariate local spatial autocorrelation analysis of social factor indexes and EVPCI spatial equity possesses two-sidedness. It can find the short board area of urban EVPCI construction and areas with potential resource waste. Urban planners and policymakers can be provided with more specific and actionable optimization recommendations to drive the adoption of EVs and the development of clean energy.
This paper is organized as follows. Section 2 presents a literature review in this domain, while Section 3 shows the study areas and data sources. After that, Section 4 describes the methodology. The results of empirical studies and discussion are presented in Section 5 and Section 6 before the concluding remarks.

2. Literature Review

2.1. Demand for Public Charging Infrastructure

Accelerated urbanization and rapid population growth have led to a scarcity of land resources, and the rational allocation of urban infrastructure has become a research priority in the field of urban planning [14]. As an important supporting facility for electric vehicles, how to reasonably plan and layout the charging station has become a current research hotspot, as shown in Table 2. The deployment and management of a charging infrastructure has become a new challenge for researchers as EV sales increase [15]. There must be some positive correlation between the EV market and PCI [16], the lack of which is a potential obstacle to their purchase [17]. Studies indicate that consumers do not necessarily respond to the number of public chargers but pay more attention to charging speed [18], and charging stations with higher power and larger capacity are the future trend [19].
Comprehensive insights into consumers’ behavioral preferences and propensity to choose charging infrastructure are of great relevance for optimizing EVPCI [20]. For users, the planning of EV charging stations must prioritize convenience, reduced waiting times, availability, and efficiency [21]. Range anxiety and charging inconvenience have been found to be the main reasons that Chinese consumers decline to buy EVs. Comparing satisfaction surveys of consumers using charging piles in 2019 and 2023, they currently have lower requirements for charging time and price but higher requirements for the distribution of charging infrastructure [22]. In addition, users with high income, high waiting tolerance, and long driving distances tend to choose PCI; price-sensitive users who like night charging tend to use private charging infrastructure [23]; and users are extremely sensitive to the trouble of charging [24,25]. Through the simulation of demand, the optimal locations of charging stations can be determined [26]. There is also literature that models charging behavior, travel demand, and EV adoption to predict charging demand, providing further information for charging infrastructure planning policies and optimization of its deployment [15].
The demand for public charging infrastructure is unequal in metropolitan areas, and the availability of private charging infrastructure is an important factor influencing the demand for PCI [27]. Due to poor design and planning in the past and the recent rapid growth of the number of new-energy vehicles, the number of reserved parking spaces in old residential communities often cannot meet the needs of residents for private charging pile installation [13]. Unlike developed countries such as the United States, which have mostly independent homes and focus on the construction of private charging piles, China’s urban development trends and built environment have spurred a high demand for PCI, especially in old residential communities and high-density mega-cities [28]. Therefore, some researchers have proposed a hierarchical management structure with a multi-level coordination strategy to solve the problem of difficult charging in these areas [13].
Table 2. Studies related to demand and spatial equity of PCI.
CitationCategory Case Study Methodology Objective
Li et al. [9]Equity analysisThe top ten cities in China by EVCSOpportunity-based approach, Global and Local Moran’s I indexSpatial equity in the distribution of EVCSs
Yu et al. [13]Spatial analysisShenzhen, ChinaA cost-effective and high-efficient shared fast charging scheme Difficult-to-charge issue in old residential communities
Peng et al. [29]Equity analysisHong Kong, China2SFCA, Global and Local Moran’s I, Gini coefficient, GWRAssessing EV charging equity
Al-Dahabreh et al. [30]Demand analysisQuebec, CanadaQoE performance metrics, Machine Learning modelEV charging demand forecasting
Yang et al. [31]Demand analysisShanxi, ChinaData-driven analysis, cluster analysisDifferences in demand for charging facilities
He et al. [32]Spatial analysisHong Kong, ChinaLocation-allocation modelOptimal deployment of public charging infrastructure
Li et al. [33]Spatial analysisChengdu, ChinaA two-layer genetic algorithm with a local search (TLGALS), simulated annealing (SA)Public charging station localization and route planning of electric vehicles
Carlton et al. [34]Equity analysisUnited StatesNegative binomial regression, friction raster, Lorenz curves, Gini coefficientEV charging equity and accessibility
Loni et al. [35]Equity analysisSan Francisco, USANSGA-II, TOPSISEquitable placement for electric vehicle charging stations
Lin et al. [22]Demand analysisChinaIndependent samples t-test, ordered logit model, SEM Consumer satisfaction with electric vehicle charging

2.2. Spatial Equity of Public Charging Infrastructure

Spatial equity assessment is helpful to evaluate the effectiveness of urban infrastructure services [36]. In the context of EVPCI, equity is an important prerequisite for the construction of PCI [9], and hence it is necessary to evaluate the spatial equity of its distribution to ensure that users in all regions can enjoy the same level of charging service [37,38]. As shown in Table 3, this paper combs through the research methods of spatial equity evaluation of PCI and other urban infrastructures as a comparison of the research models in this paper. Commonly used methods to measure spatial equity include accessibility, the Gini coefficient, the Lorentz curve [39], and local spatial autocorrelation [40]. Accessibility, in particular, is widely used to evaluate the spatial equity of urban infrastructure [37,41]. A large number of researchers have used accessibility to evaluate the equity of the spatial distribution of urban infrastructure such as Healthcare Facilities, Community-based Service Resources, and Urban Parks [42,43,44]. Some researchers have also used Global and Local Moran’s I index to analyze the spatial distribution relationship of urban public facilities [45]. Luo et al. used Theil index to analyze the spatial equity of the distribution of High-speed Rail in China [46]; Chen et al. used Lorenz Curves and Gini Coefficient to evaluate the equity of Urban Bus Transit [41]. Li et al. proposed a spatial statistical method using accessibility indicators to assess whether electric vehicle charging services (EVCSs) are equitably distributed, and they verified its effectiveness by examining EVCS capacity in the top 10 cities in China [9]. Luo et al. defined spatial equity as the difference in accessibility distribution and proposed an improved accessibility measurement method with frequency as an important factor [46]. Other literature uses the distance between charging infrastructure and consumers’ living locations to measure equity [32], or evaluates the distribution and density of charging infrastructure in certain areas. Moreover, urban development cannot separate spatial and social aspects; as important urban infrastructure, PCI should achieve a balanced distribution in space and highlight its equity at the social level. In addition to the difference in housing quality, the opportunity structure provided by public service infrastructure is different in the spatial concretization of urban communities with different levels of wealth. Social classes have different demands for public services. Compared with high- and middle-income groups, those with low incomes are limited by their consumption power and depend more on community-level public service infrastructure [47].
However, a single index is not enough to evaluate the service level of charging infrastructure. Some researchers have explored the key variables that lead to disparities in the accessibility of EV charging stations, analyzing factors such as EV percentage, geographic region, population density, energy costs, average household income, transportation patterns, and climate [49]. Further, at the micro level, factors such as the type, location, and number of charging points, along with their total capital and operating expenditure, are also of great significance to the planning and optimization of EV charging infrastructure [50].

2.3. Evaluation of Equity in Charging Infrastructure Distribution

The concept of accessibility has been widely used in scientific fields, such as transportation planning, urban planning, and geography [51]. However, PCI is different from public facilities such as Urban Park and Urban Public Facilities, where the standard opportunity-based approach also comes at the expense of accuracy [44,45,52]. In terms of charging demand, as each charging pile is exclusive to a single user, the opportunities to access PCI are limited and competed for by all the individuals within the scope of the services [9]. And there are disparities in the users’ choices of charging locations and types of charging piles [53,54], which are the factors we need to consider when constructing the evaluation model. Most of the current research on EVPCI focuses only on how to optimize the layout and locations of charging stations, etc. The research method in this article fills the gap in the evaluation of the spatial equity of PCI.
In view of the unitary purpose and method of the current research on the planning and construction of charging infrastructure, this paper establishes a multidimensional framework to evaluate the distributional equity of PCI on both the spatial and social levels. First, the spatial indexes of accessibility, availability, convenience, and affordability are proposed to measure the comprehensive service level of the EVPCI. Previous studies related to charging infrastructure focused on cities, regions, or higher spatial units and hence the “last kilometer” can be neglected [55]. Second, we consider social, economic, and environmental factors in terms of social equity and perform a bivariate local spatial autocorrelation analysis between 14 social indicators and the spatial service level of the EVPCI. In this way, the association between the social indicators and the spatial equity distribution of the EVPCI can be investigated so as to capture how well the PCI is allocated in each community. We adopt three indicators of social and economic factors: population density, housing prices, and dwelling age. Some researchers estimate charging infrastructure demand based on the number of charging points needed to meet current car travel needs [56]. Transportation hubs, parking spaces, and POI are the key factors of EVCP location suitability evaluation [57]. We use POI density to express the places where users may park and charge, and we select 11 kinds of POI places where users need to do so.
In summary, this study establishes a scientific and complete multidimensional assessment framework for the spatial distribution of charging infrastructure, utilizing multiple spatial–quantitative and social factor indicators and comprehensively analyzing the rationality and spatial disparities in PCI allocation in urban communities.

3. Study Area and Data Sources

3.1. Study Area

Nanjing, the capital of Jiangsu Province, is located on the lower Yangtze River in eastern China. Its population of more than 9 million is one of the densest in China. According to the latest administrative division of Nanjing, the city has jurisdiction over 11 municipal districts and one state-level new district, with a total area of 6587 km2. This paper focuses on Nanjing Central Districts (Figure 2), which includes the main city and three sub-cities (Dongshan, Xianlin, and Jiangbei), subdivided into nine district-level administrative areas, with a total area of approximately 834 km2 and a population density of 8033 per km2.
Over the past two years, in order to follow China’s strategic measures to cope with climate change and promote green development, Nanjing has actively promoted the development of new-energy vehicles. The “Implementation Program for the Promotion of New Energy Vehicles in Nanjing for the Year 2022” and the “Measures for the Management of Electric Vehicle Charging Infrastructure Construction in Nanjing Residential Communities” have been issued to accelerate the popularization of new-energy vehicles and the optimization and standardized construction of charging infrastructure. According to the statistics of the Nanjing Transportation Bureau, in 2023, in Nanjing, Jiangsu Province, there is a charging pile every 900 m in Nanjing Central Districts, and the ratio of new-energy vehicles to public charging piles has reached 6.9:1, which is slightly higher than the national ratio of 7.4:1. From this, it can be seen that the charging infrastructure configuration in Nanjing Central Districts is close to the national average, which is representative to a certain extent. Compared to first-tier cities, consumers in non-first-tier cities are more likely to accept charging infrastructure farther from home [22]. The high-density living environment and traffic network of first-tier cities require us to pay more attention to the convenience of PCI [28]. Therefore, this paper takes the Nanjing Central Districts as the research object to evaluate the configuration of EVPCI in multiple dimensions and explore a more scientific and comprehensive evaluation system.

3.2. Data and Preprocessing

We collected data on the population, charging station coordinates, number of charging piles, road networks, dwelling age, housing prices, and POI in Nanjing. The location addresses, coordinate point data, and numbers of fast-charging and slow-charging piles in each charging station of Nanjing were obtained from the Charging Bar (www.bjev520.com, accessed on 3 March 2023) website. We searched for “charging station” in AutoNavi, obtained the numbers of the fast- and slow-charging piles of each charging station from a mobile phone to supplement the data, and integrated and filtered the duplicated items. A total of 710 public charging stations and nearly 10,000 public charging piles were found in Nanjing Central Districts (Figure 3). The population data come from the sixth census of the Nanjing Bureau of Statistics, and 545 communities were provided by Nanjing administrative divisions. Finally, the housing price and dwelling age data of all the residential districts in Nanjing Central Districts were obtained from Fangtianxia and Loupanwang, respectively.

4. Methodology

Establishing a multidimensional evaluation framework that matches user needs is a core issue in the planning of and improvement in a charging infrastructure layout, as illustrated in Figure 4. PCI should achieve a balanced and fair distribution in space and highlight its equity at the social level. We combine spatial and social equity to comprehensively evaluate PCI allocation and identify spatial disparities in the distribution of charging infrastructure. Spatial indicators of accessibility, availability, convenience, and affordability are established to comprehensively evaluate the equity of the spatial distribution of PCI in various communities. Considering the competitive characteristics of the PCI in use [9] and the fact that traditional accessibility is always calculated using the standard opportunity-based approach, this inevitably reduces the accuracy [44,45,52]. In this paper, the supply aspect of accessibility uses the number of charging piles in each community, which greatly improves the calculation accuracy. In addition we have improved the availability algorithm through the user’s behavioral preferences when using PCI [53,54] by distinguishing between direct current (DC) and alternating current (AC) charging to precisely compute the results. At the social level, 14 indicators of community economy and environment are established (Table 4). A spatial correlation analysis between the service level of PCI and social indicators explores the disparities in the perception of using PCI under the influence of different factors. Considering the diversity of equations, this paper also explains the notations used in the models incorporated in the analytical framework (Table 5).

4.1. Spatial Equity Analysis

4.1.1. Accessibility

A reasonable evaluation of the accessibility of PCI is of great significance to protect the rights and benefits of users and build a high-quality charging facility system. Accessibility evaluates the physical accessibility of facility services based on the spatial interaction between supply and demand [58], and it is commonly measured by the shortest distance, chance accumulation, gravity model, and two-step floating catchment area (2SFCA) [9].
We use the 2SFCA method to evaluate the spatial accessibility of PCI. This is widely used in the research on the spatial accessibility of public service infrastructure, and it has many extension forms [59]. It calculates the supply–demand ratio and sums it up to get accessibility by performing a secondary search based on supply points and demand points. We extend the 2SFCA method by establishing a decay law that accounts for travel time, using the time between the points of demand and supply as a cost. In the process of searching, a Gaussian function adjusts the time and provides a more accurate measurement model for reachability.
For the supply position of a charging station, the demand position of all communities is within the time threshold of the charging station ( t 0 ), which is used to calculate the ratio of supply and demand ( R j ), i.e., the ratio of the number of charging piles in the charging station to the total population in the community, given by
R j = S j i { t i j t 0 } D i × g ( t i j )
where i and j refer to the demand and supply points, respectively. D i is the demand scale at point i , i.e., the population of the community; S j is the facility scale at point j , i.e., the number of charging piles at a charging station; and t i j is the time from demand point i to supply point j. For each position within threshold time t 0 , the attenuation function is given by [60]
g t i j = e 1 2 × t i j t 0 2 e 1 2 1 e 1 2 , t i j t 0 0 ,   t i j > t 0
For a community, the model searches for supply points ( j ) that are accessible by all communities within the threshold range ( t 0 ), multiplies all supply–demand ratios ( R j ) by the time fraction ( g t i j ), and then sums them to obtain the accessibility of point i , as follows:
A i = i { t i j t 0 } R j × g t i j

4.1.2. Availability

Availability refers to the charging opportunities available to users within an acceptable time or distance. In general, the more charging stations are accessible, or more charging piles are available within an ideal time frame, the greater the availability of PCI in a community. This paper measures this availability by the supply and demand relationship between demand objects and the quantity and type of PCI. We calculate the quantity choice chance and the kind choice chance and obtain the availability index by the normalization of these two sets of data. Quantity selection refers to the number of charging stations available at demand point i within the threshold value t 0 . Type selection refers to the direct current (DC) and alternating current (AC) charging opportunities available at demand point i within threshold t 0 , i.e., the number of charging stations available at demand point i , given by
Q i = n [ 1 , N ] N E n ,   E n = 1 ,   t i j t 0 0 ,   t i j > t 0
where N is the total number of all charging stations, and E n is the index of charging stations. If t i j t 0 , then supply point j is the charging station within the threshold value, and E n is 1; otherwise, E n is 0.
The type selection opportunity is given by
h f = H f I , T i f = m [ t i j t 0 ] M F m f   ,   F m f = 1 ,   h i f h f 0 ,   h i f < h f
h l = H l I ,     T i l = m [ t i j t 0 ] M F m l ,   F m l = 1 ,   h i l h l 0 ,   h i l < h l
T i = T i f + T i l
where M is the type of charging post and T i f and T i l represent the community’s choice between DC and AC power within threshold t 0 . H f and H l are the total number of DC and AC charging piles, I is the total number of communities, and h f and h l are the average numbers of DC and AC charging piles in each community in the downtown area of Nanjing. h i f and h i l are the numbers of DC and AC charging piles in community i within threshold t 0 . F m is the variety index of charging stations, and T i is the total availability of charging types in community i .
To eliminate dimensional influence between indicators, we normalize the values of Q i and T i . The data are standardized as follows [44]:
X n o r = X n X m i n X m a x X m i n
where X n is the actual value of the NTH value in a set of data, and X m a x and X m i n are the respective maximum and minimum values of the data.
The availability index at demand point i is
A V i = Q i ( n o r ) + T i ( n o r ) 2
where Q i ( n o r ) and T i ( n o r ) are, respectively, the number of choices and variety choice after normalization of the index.

4.1.3. Convenience

Convenience refers to the ease with which a user can reach a charging station, and there is no clear way to measure this. Some scholars have described six categories, among which time utilization and handiness were mostly used in subsequent research. Therefore, we judge user feelings about the convenience of PCI from the time and place levels, i.e., for community i , the farther the nearest charging station, and the longer it takes to get there, the more inconvenient it is to use. There is a negative correlation between them, so we define the convenience of the charging service to community i as the inverse distance of the nearest charging station,
C i = 1 d n ,     d n = d i j ( m i n )
where d n is the distance from the nearest charging station to i , and d i j ( m i n ) is the minimum distance from demand point ( i ) to supply point ( j ) in the central urban area of Nanjing.

4.1.4. Affordability

Affordability is the charging demand that the charging piles in community i can withstand, i.e., the degree to which the number of charging piles matches the needs of the community. We use the density of charging piles at the community level to measure affordability, i.e., the number of piles per capita in community i, given by
A F i = E i D i
where E i is the total number of charging piles, and D i is the population.

4.1.5. Spatial Equity Score

Evaluation indicators can have different dimensions and units. To eliminate dimensional influence between indicators, we standardized them so that they have the same order of magnitude, enabling the comprehensive evaluation of the equity of PCI, and we define the community public charging infrastructure space equity index as follows:
S E i = A i ( n o r ) + A V i ( n o r ) + C i ( n o r ) + A F i ( n o r ) 4
where A i ( n o r ) , A V i ( n o r ) , C i ( n o r ) , and A F i ( n o r ) are the normalized accessibility, availability, convenience, and affordability, respectively.

4.2. Local Indicators of Spatial Autocorrelation (LISA)

Global and local spatial autocorrelation measures the clustering of spatial variables. We use univariate and bivariate local spatial autocorrelation. The Local Moran’s I index (i.e., LISA) [61] is utilized to characterize the spatial agglomeration pattern of the equity score in each community with that of its neighboring communities, and the correlation between the spatial equity of PCI and social factors in the study area is characterized by a map of the distribution of the bivariate local indicators of spatial autocorrelation (i.e., the LISA values).
For bivariate measurement, we adopt the factors of community economy and environment, with 14 indicators, including population density, housing prices, and dwelling age. The community environment indicator refers to 11 places where a user must charge a service or will stay for a long time, such as catering, hotel accommodation, and sports and fitness. A bivariate local spatial autocorrelation analysis was conducted using the community POI distribution density and spatial equity of PCI at these sites. A LISA distribution map was drawn on the basis of a z test (p < 0.05),
L o c a l   M o r a n s   I = n ( y i y ¯ ) j = 1 m W i j × ( y j y ¯ ) j = 1 m ( y i y ¯ ) 2
where y i and y j are the respective equity scores of communities i and j , n is the number of communities, m is the number of communities around community i , and W i j is the spatial weight matrix.

5. Results

5.1. Equity Analysis of EVPCI Based on Multidimensional Spatial Indicators

5.1.1. Spatial Distribution of Multidimensional Indicators

We used the spatial indicators of accessibility, availability, convenience, and affordability to comprehensively evaluate the spatial equity of PCI. There are significant disparities in the results of the four dimensions of spatial indicators. As shown in Figure 5a, in Nanjing Central Districts, the accessibility of PCI in the main city is significantly less than that in the surrounding sub-city, and the accessibility in the sub-city of Jiangbei is generally higher. Most residents north of the Yangtze River in Nanjing have better access to PCI than those south of the river. Figure 5b shows a radial pattern of high availability at the center and low availability in the periphery, with significant disparities among communities. This indicates that the closer to the main city, the greater the availability of charging infrastructure. However, the community area of the surrounding sub-city is wide, and the number of charging stations or piles that can be reached within a certain time threshold is small. The distribution of convenience in Figure 5c shows that the convenience of the three sub-districts is poor, and a large number of communities have convenience values in the lowest range, which indicates that they cannot reach the nearest charging station within 10 min. The main city has relatively good convenience due to the concentration of communities and the concentrated distribution of charging infrastructure, while convenience becomes worse when approaching the sub-city. The distribution in Figure 5d shows that the affordability of the main city is poor, while that of the three sub-cities is relatively good, which indicates that the number of charging piles in the main city cannot service the high-density population, and the number of charging piles in each community cannot be balanced with user needs.
We found significant disparities in the results of each spatial indicator. The spatial distribution of the charging service level in the four dimensions is either good in the main city and poor in the sub-city, or good in the sub-city and poor in the main city. The results show the necessity of the selected multidimensional spatial indicators to provide more precise methodological support for the spatial equity metrics of PCI.

5.1.2. Spatial Distribution of Equity in EVPCI Service

We normalized the spatial indicators across the four dimensions to produce a composite spatial equity result for EVPCI in the study area. As shown in Figure 6, communities with better levels of charging services are largely concentrated at the center of the main city, while spatial equity is generally lower in the three sub-cities, especially on the urban fringe. Based on these results, we found that only the West Beijing Road community in Nanjing Central Districts has an equity of 0, which indicates that those in this community are unable to access charging service within 10 min. However, the dwellings in the community are an average of 30 years old, making it almost impossible for each household to have a private charging pile. Therefore, charging will be very inconvenient here, and there is an urgent need to provide greater charging infrastructure. Equity in charging services in the Xianlin sub-city is higher in areas bordering the main city and lower in marginal communities. Nine communities in the Jiangbei sub-city have more equitable charging services, while the rest have lower levels, especially in the northwest and southwest. The overall equity of the Dongshan sub-area is low, with relatively equitable charging services in only three communities, which indicates an urgent need to optimize the number and layout of charging infrastructure.

5.2. Spatial Disparity of Equity in EVPCI Service

Based on the Local Moran’s I index, the spatial agglomeration pattern of equity in the EVPCI of all 545 communities in Nanjing Central Districts is divided into four types, the HH cluster, LL cluster, HL outlier, and LH outlier, and not significant. Figure 7 shows the EVPCI spatial equity cluster types differentiated by color. The HH cluster types (red) indicate that communities with high equity scores are surrounded by communities with similar scores, and the LL cluster types (blue) indicate that communities with low equity scores are surrounded by low-scoring communities with similar scores. The HL (pink) and LH (purple) cluster types indicate that communities with high equity scores are surrounded by communities with low scores, and vice versa. Areas with no significant clustering (gray) have neither significantly high nor low equity score aggregation.
Tests on the clustered data indicate significant spatial variation in the equity of charging services across communities. As can be seen from Figure 8, the spatial disparities between the Gulou, Qixia, Jiangning, and Liuhe districts are relatively insignificant. The Gulou, Jiangning, and Liuhe districts are dominated by HH and insignificant clustering, while Qixia District is dominated by LL and insignificant clustering, and only one community in Gulou District is the base of LH clustering. This shows that users living in these four areas have a more equal level of charging service, with Gulou, Jiangning, and Liuhe being the most desirable areas to live in Nanjing, and some communities in Qixia District require a longer period of time to access public charging services. There is little spatial variation in the Qinhuai, Xuanwu, Jianye, and Yuhuatai districts; most equity scores in these four communities are in the HH and not significant clusters, while a few are in LL clusters, and users in these communities must overcome barriers of time and distance to recharge. The construction of PCI should focus more on communities with poor equity in these areas. Finally, Pukou has more serious spatial disparities, dominated by LL and not significant clustering, with a small number of communities with HH, LH, and HL clustering. The construction of infrastructure in Pukou District has been in an incremental stage, and it is a new district of Nanjing, which provides a scientific direction for the construction of public infrastructure in the new district of Jiangbei.

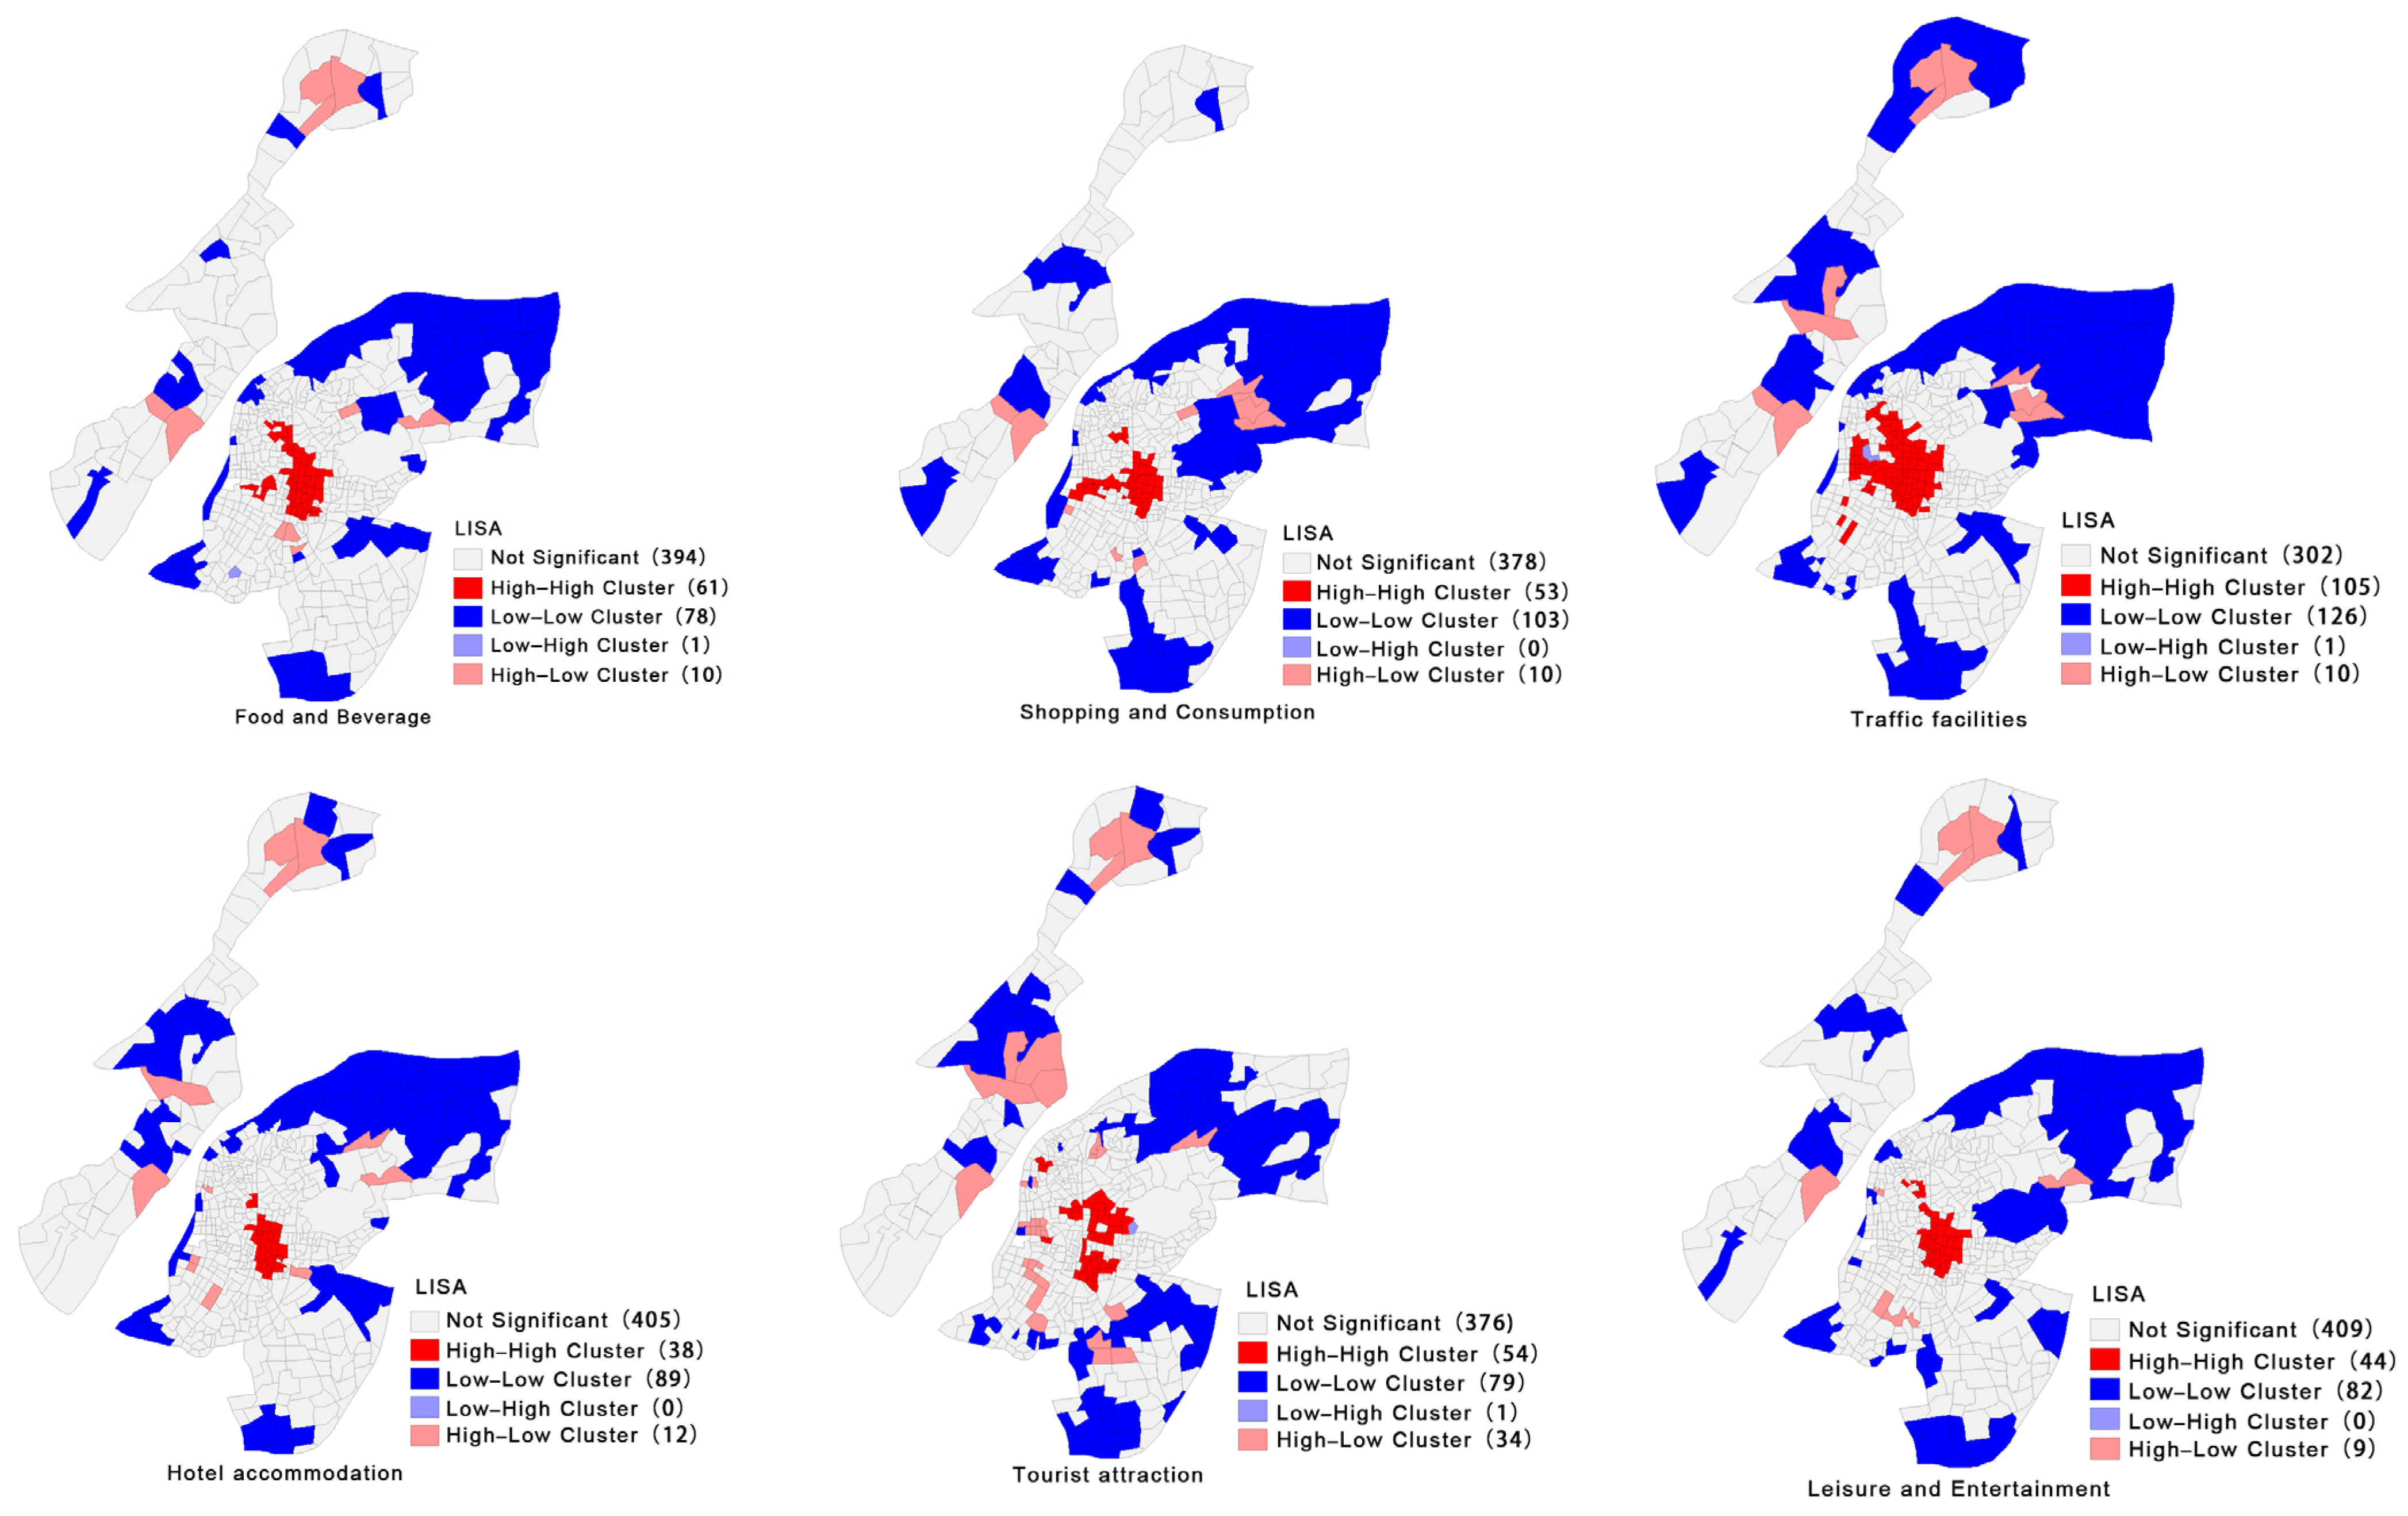
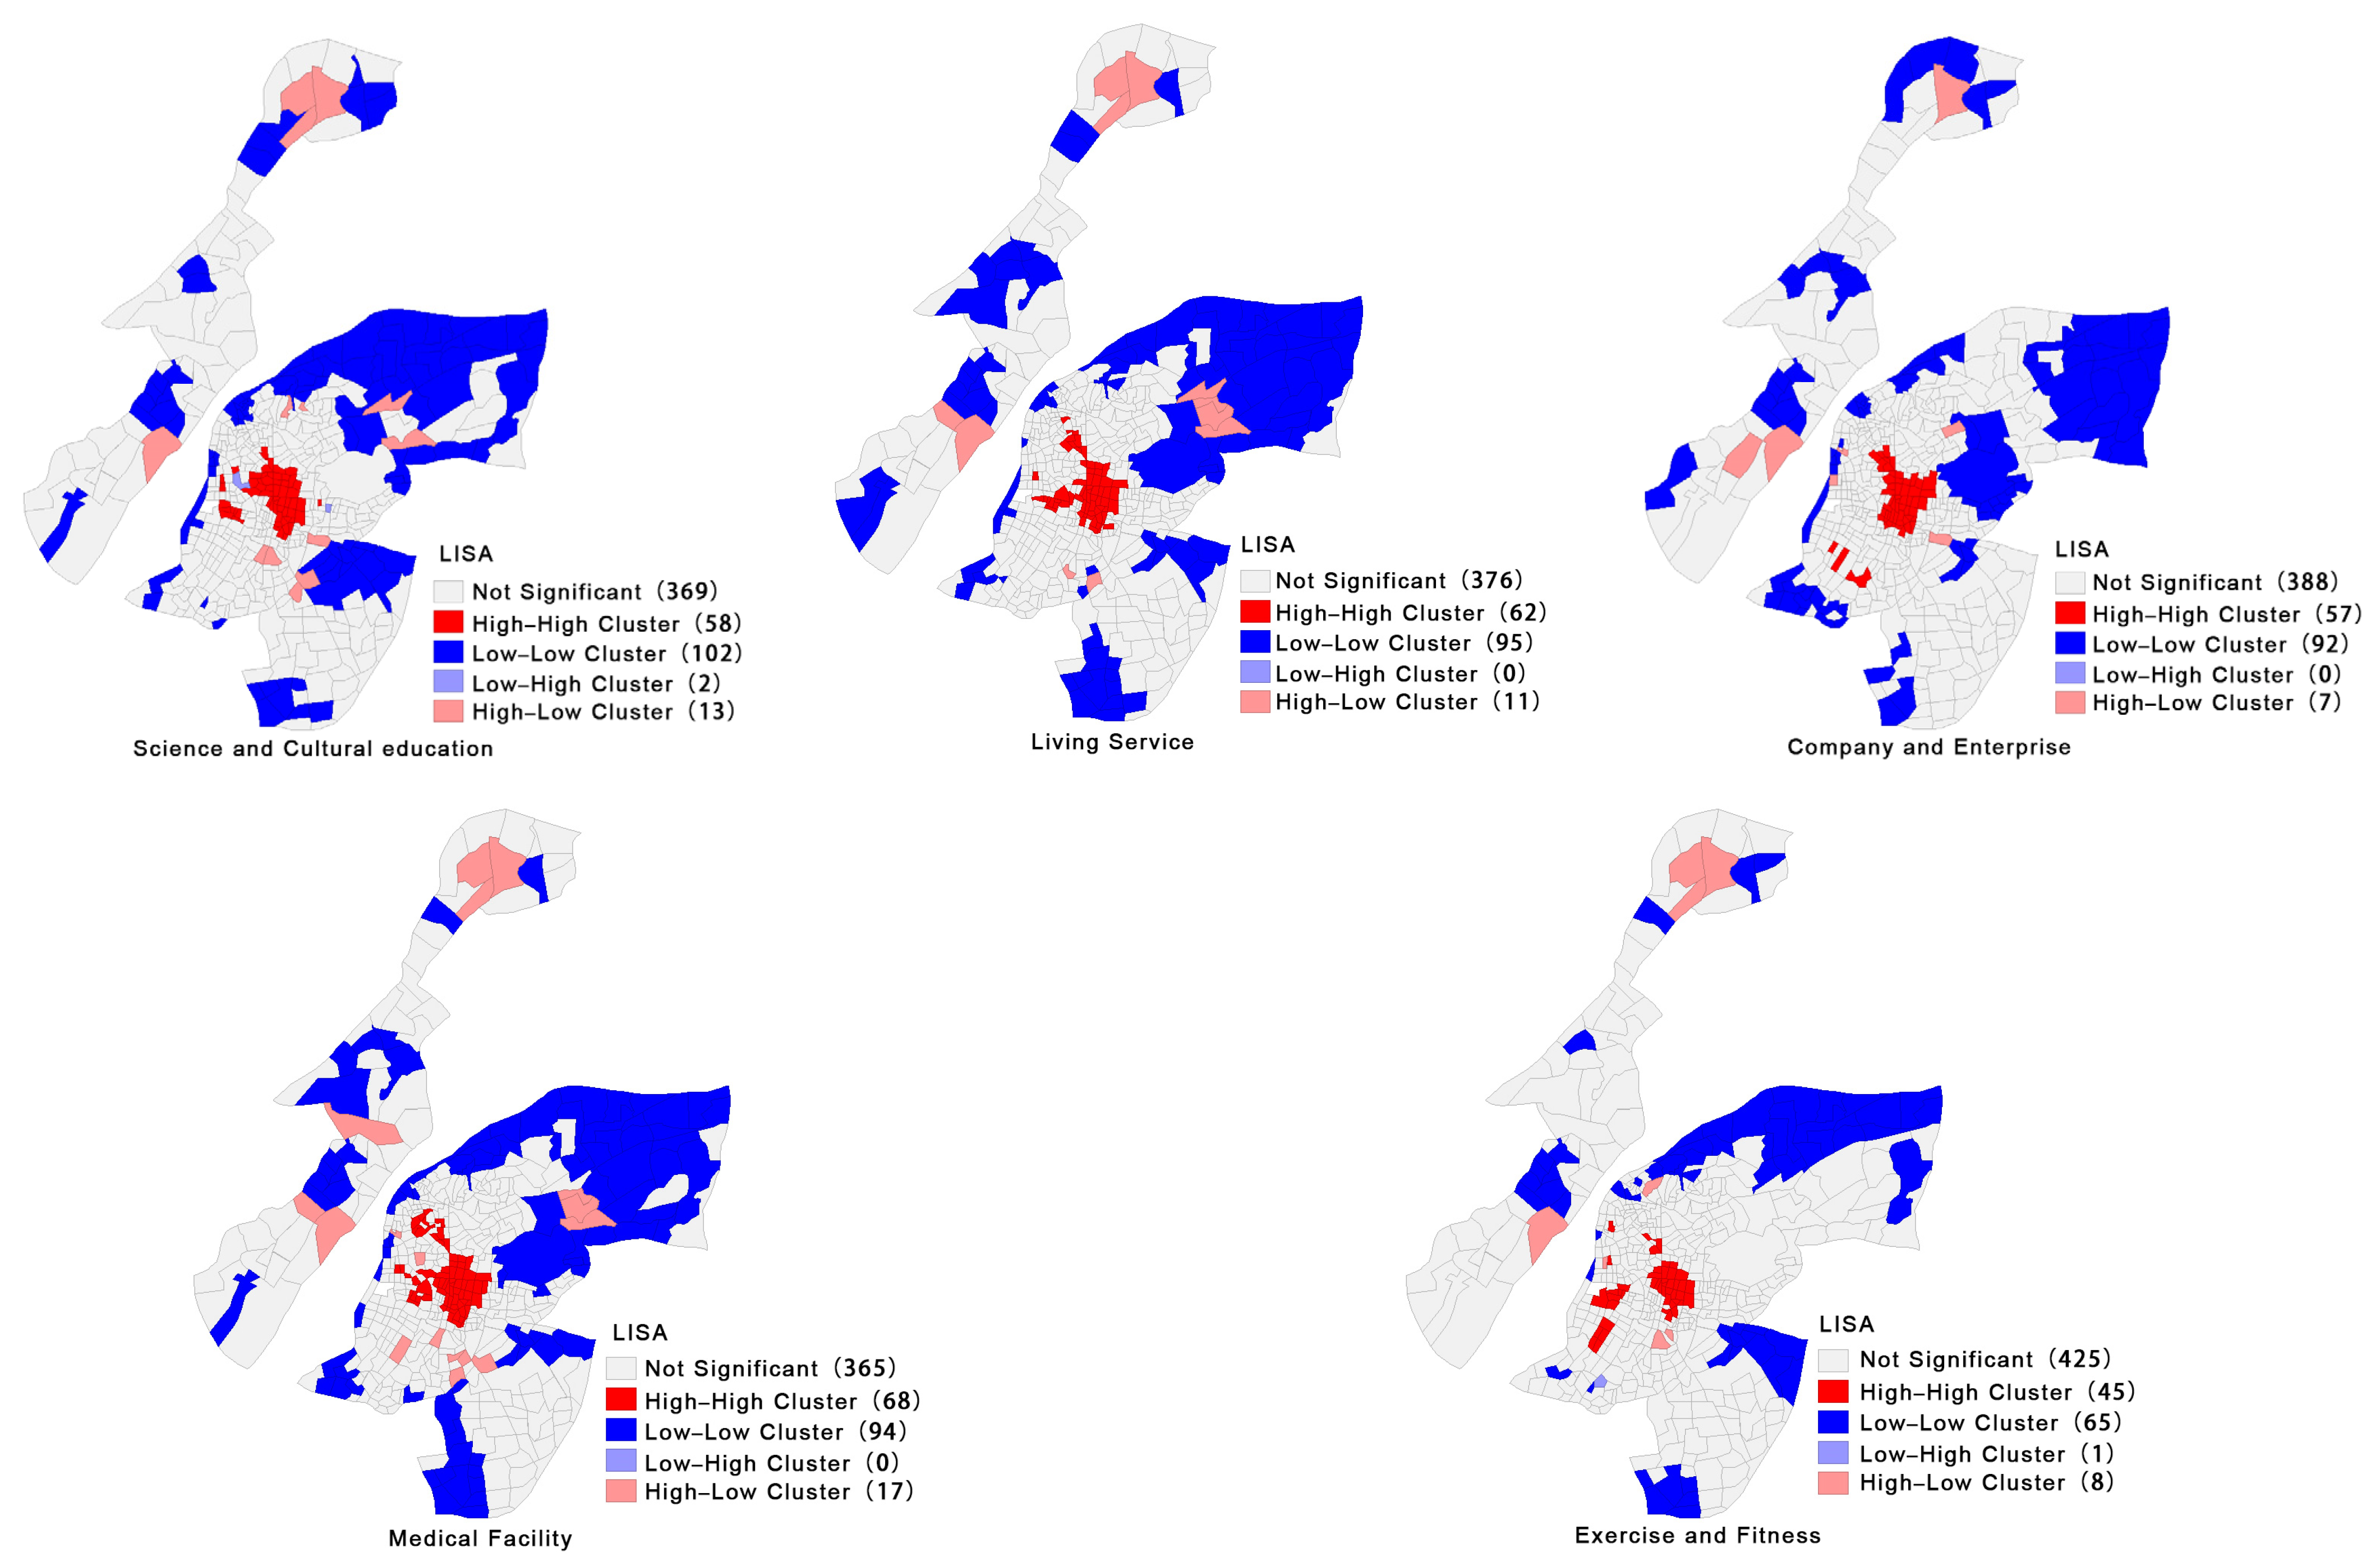
5.3. Bivariate Local Spatial Autocorrelation Based on Social Factors

To further clarify the spatial tradeoff and synergistic relationship between the EVPCI service level and social factors, we start from the two levels of community economy and environment. The indicators of population density, housing prices, and dwelling age are selected from the economic level, and 11 POIs where users may need to park and charge are selected from the environmental level. A bivariate local spatial autocorrelation analysis is then performed in conjunction with Equation (13), with the spatial equity of the EVPCI.
It can be seen from Table 6 that the Local Moran’s I indexes of the 14 indicators are all greater than 0, and the p-values of all the indicators except for the dwelling age factor are less than 0.001. The results show that the social factors, except dwelling age, and EVPCI equity show a significant spatial positive correlation. The Local Moran’s I index of the dwelling age is close to 0, and the p-value is too large, which indicates that the spatial agglomeration characteristics are not significant [62]. Hence, there is little spatial correlation between the dwelling age and EVPCI service level. However, this contradicts the phenomenon that charging is difficult in old high-density residential communities and does not reflect vertical equity, i.e., communities with older dwellings have better characteristics of charging service agglomeration [63]. This provides important guidance for the planning of PCI in Nanjing. It is necessary to accelerate the construction of PCI in old residential communities and solve the problem of difficult charging.
The spatial clustering characteristics of the social factor indicators and EVPCI service levels can be seen in Figure 9 and Figure 10. The HH clustering and LL clustering indicate synergistic relationships, i.e., there is relative consistency between the layouts of the charging infrastructure and indicator demand, while the HL clustering and LL clustering indicate tradeoffs, i.e., a mismatch between the distribution of the charging infrastructure in these areas and indicator demand. Overall, the results of the bivariate local spatial autocorrelation analysis based on social factor indicators are more similar to those of the spatial difference analysis of the equity of EVPCI, with HH aggregation mainly located at the center of the main city and LL aggregation located in the three sub-cities.
From the perspective of community economic factors, population density has the most significant synergistic relationship with EVPCI spatial equity. All three indicators are spatially characterized by the highest number of LL clusters, and most are distributed in the three sub-cities, with the Xianlin sub-city having the highest number of LL clusters. The second is the HH clustering category, which is mainly located in the Gulou, Qinhuai, and Xuanwu districts in the main city. In addition, the Taipingmen and Minggugongyuan communities in Xuanwu District, Gaoqiao community in Jiangning District, and Erbanqiao and Sipinglu communities in Gulou have a high population density but low levels of charging services. Hence, users in these communities lack equitable access to charging services and may face strong competition for charging. Therefore, these communities must increase the PCI. In contrast, communities such as Xinghua, Fuxing, and Gunpowder Island in Jianye District; Waigang and Xiashui in Jiangning; and Dazhuang, Xianhemen, Yaosheng, and Yaohua in Qixia present a high level of charging services with low population density. These areas may have deserted and unused charging piles. To avoid wasting resources, we suggest that the PCI in these communities be sorted out, clearing out waste and zombie piles and transferring them to communities that need them.
In terms of community environment factors, HH aggregation is also mainly distributed in the main city, and LL aggregation is mainly distributed in the three sub-cities, with the most significant LL aggregation in the Xianlin sub-city. The Pingzhi community in Yuhuatai District, the Cibi She community in Gulou, the Fuli Shanzhuang community in Qinhuai, and the Taipingmen community in Xuanwu have a high density of POIs but a lower level of charging services. This means that users coming to these communities for shopping, healthcare, parking, accommodation, and other activities are less likely to have access to public charging piles. This hinders travel planning for new-energy vehicle users and requires planners and policymakers to increase the PCI in these communities. The Pukou, Liuhe, Xuanwu, and Qixia districts each have three–five neighborhoods with high levels of charging service but low densities of POIs, which may be a waste of resources for PCI. Therefore, as with community economic factors, charging infrastructure should be sorted out and cleaned up in such communities in order to build a virtuous cycle of charging infrastructure.

6. Discussion

6.1. Methodological Contribution

This study breaks away from the single spatial equity evaluation of EVPCI, analyzing the equity of PCI using the multidimensional spatial metrics of accessibility, availability, convenience, and affordability. Composite equity scores were found to differ significantly from commonly used accessibility results, which suggests that traditional single-accessibility models that measure the level of spatial layout of a facility alone are not sufficient, and they may even yield opposite results. In addition, the higher level of charging services in Nanjing Central Districts are clustered in the heart of the main city—Gulou, Xuanwu, and Qinhuai—while the fringes of the main city and the three sub-cities possess relatively poor charging service levels, and there is a large imbalance in the spatial equity of EVPCI between regions. This suggests that urban planners and policymakers should pay attention to the construction of PCI in fringe areas of the main city and in sub-cities to meet the charging needs of local residents.
We introduced LISA to explore the correlation between EVPCI service levels and social indicators using bivariate local spatial autocorrelation. The results show areas with unbalanced PCI distribution, such as Pukou District in the Jiangbei sub-city. Other areas lack charging piles, such as the West Beijing Road community in the main city and the urban fringes of the three sub-cities. It also reveals areas with threats of resource wastage, such as the Xinghua, Fuxing, and Huoyaozhou communities in Jianye District and the Waigang and Xiashui communities in Jiangning, providing a more comprehensive and detailed strategy for optimizing the layout of EVPCI. Previous studies have shown that 50–80% of EV users charge their vehicles at home [17], and some densely populated areas have a greater need for public charging facilities to replace this [16]. Our LISA results also show significant spatial correlation between population density and EVPCI equity, suggesting the need to focus on population density factors in the siting of charging stations and the configuration of PCI. Studies in Hong Kong have also concluded that housing type is an important social characteristic that affects the accessibility of EVPCI [29]. This paper distinguishes between housing types through house prices and finds no significant spatial correlation between these and EVPCI equity. Hence, the influence of housing type on the spatial layout of PCI requires further research. Our results reveal an urgent need to focus on the construction of PCI in old residential communities in Nanjing Central Districts and to safeguard users’ charging interests from the perspective of vertical equity [63].

6.2. Implications for PCI Planning

The realization of infrastructure from an equity perspective is multidimensional and complex, and traditional models are no longer sufficient [64]. We must continuously expand research to find the influencing factors. For areas with a high population density and low level of charging services, more investment in charging infrastructure should be made to meet the basic needs of users. In areas with a high charging service level but low population density, the wastage of resources can be avoided by optimizing their allocation. For example, planning can consider the combination of communities and commercial areas to form a multi-functional charging service network [56]. Moreover, urban planning and policymakers can encourage the construction of charging infrastructure through policy guidance and market mechanisms [65] so as to improve the charging network and form a virtuous cycle.

6.3. Limitations and Future Research

We achieved some results in terms of methodology, but this study has limitations. It does not consider demographic stratification indicators when using social factors, such as racial characteristics, age, gender, and occupation. Hsu et al. compared the probability of EVCI use across income and racial groups in California and found that black- and Hispanic-majority community groups were significantly less likely to use public chargers [66]. This demonstrates a relationship between population stratification indicators and charging demand. In the future, the spatial equity of PCI can be further explored by integrating population stratification factors based on our method of dual evaluation of multidimensional spatial and social factor indicators.
We did not consider user behavioral factors in the analysis, such as charging habits, travel patterns, and willingness to purchase EVs [28]. Understanding charging behavior is a key factor in the optimization of PCI [67]. In the future, it is important to expand data sources and combine more dimensions of information and to perform quantitative research to improve the accuracy and comprehensiveness of the results.
We used the density of POI points in each type of location to illustrate demand in the community environment factor, and we did not use spatiotemporal modeling or stakeholder interviews to predict charging demand [68,69]. Future research could consider fine quantification of charging needs, or surveys to assess user experiences [30], allowing for the evaluation model to be refined in a more precise and scientific direction.
In addition to the above, because PCI involves very diversified organizations, including EV manufacturers, government, commercial organizations, private individuals, etc. [70], we should also consider its rationality in terms of commercial interests. For example, the interests related to the investment and construction of PCI, who should invest in it, the setting of charging price, and so on [71]. Of course, commercial interests are not independent, which is also relevant to the focus of this paper. In the EV charging network, the density and reasonable location of charging facilities determine the convenience of charging and its investment cost, which largely affects the setting of the EV charging price [72,73]. New business models are also urgently needed to accelerate the future development of the public charging infrastructure [72]. This is a perspective that should be explored in depth in our future research to assess the rationality of EVPCI allocation by combining commercial and public interests.

7. Conclusions

We proposed a PCI performance assessment method based on a dual spatial and social evaluation system. Four dimensions of spatial indicators were used to precisely evaluate EVPCI service levels. Bivariate local spatial autocorrelation with social factors comprehensively reflected areas with unbalanced distributions of EVPCI and a lack of charging piles in Nanjing Central Districts. Areas with signs of potential PCI wastage were also identified, as well as a lack of PCI construction in old residential communities in Nanjing.
To be specific, (1) urban planners and policymakers must expand the focus of PCI from the main city to the three sub-cities; (2) increased deployment of PCI is necessary in Nanjing old residential communities; and (3) PCI must increase, and the allocation optimized, or recycling reduced in areas showing signs of resource waste.
Based on this research, we conclude that in the deployment and management of EVPCI, it is necessary to consider multiple factors such as space allocation, social economy, and user demand, especially in high-density cities with constrained land space resources. Urban planners and policymakers should pay attention to areas where charging problems are prominent, and they should formulate multi-level coordination strategies to optimize the layout of PCI, meeting the charging needs of different communities and users, promoting the popularization and development of new-energy vehicles, and thus forming a virtuous cycle of green and sustainable development.

Author Contributions

Conceptualization, Moyan Wang and Zhengyuan Liang; methodology, Moyan Wang and Zhengyuan Liang; software, Moyan Wang and Zhengyuan Liang; validation, Moyan Wang and Zhengyuan Liang and Zhiming Li; formal analysis, Moyan Wang; investigation, Moyan Wang; resources, Moyan Wang; data curation, Moyan Wang; writing—original draft preparation, Moyan Wang; writing—review and editing, Moyan Wang; visualization, Moyan Wang and Zhengyuan Liang; supervision, Zhiming Li; project administration, Zhiming Li; funding acquisition, Zhiming Li. All authors have read and agreed to the published version of the manuscript.

Funding

This research received no external funding.

Data Availability Statement

No new data created due to privacy issues.

Acknowledgments

Thanks to our team for all their contributions to this study.

Conflicts of Interest

The authors declare no conflicts of interest. The funders had no role in the design of the study; in the collection, analyses, or interpretation of data; in the writing of the manuscript; or in the decision to publish the results.

References

  1. Cai, Q.; Ji, Z.; Ma, F.; Liang, H. The Green Effects of Industrial Policy-Evidence from China’s New Energy Vehicle Subsidies. Energies 2023, 16, 6811. [Google Scholar] [CrossRef]
  2. Hill, G.; Heidrich, O.; Creutzig, F.; Blythe, P. The role of electric vehicles in near-term mitigation pathways and achieving the UK’s carbon budget. Appl. Energy 2019, 251, 113111. [Google Scholar] [CrossRef]
  3. Pereirinha, P.G.; Gonzalez, M.; Carrilero, I.; Ansean, D.; Alonso, J.; Viera, J.C. Main Trends and Challenges in Road Transportation Electrification. Transp. Res. Procedia 2018, 33, 235–242. [Google Scholar] [CrossRef]
  4. GOV.UK. Transitioning to Zero Emission Cars and Vans: 2035 Delivery Plan. Available online: https://www.gov.uk/government/publications/transitioning-to-zero-emission-cars-and-vans-2035-delivery-plan (accessed on 3 August 2024).
  5. Yin, Y.; Li, Y.; Zhang, Y. Influencing factor analysis of household electric vehicle purchase intention of HaiNan Free Trade Port under the background of low-carbon lifestyle. Energy Rep. 2022, 8, 569–579. [Google Scholar] [CrossRef]
  6. Xu, M.; Qin, Z. How does vehicle emission control policy affect air pollution emissions? Evidence from Hainan Province, China. Sci. Total Environ. 2023, 866, 161244. [Google Scholar] [CrossRef] [PubMed]
  7. Cai, R.; Huang, K.; Zheng, S.; Liang, J.; Dong, X. Including research on optimization planning of multi-energy complementary electric vehicle charging station. Energy Rep. 2023, 9, 1037–1047. [Google Scholar] [CrossRef]
  8. Bachiri, K.; Yahyaouy, A.; Gualous, H.; Malek, M.; Bennani, Y.; Makany, P.; Rogovschi, N. Multi-Agent DDPG Based Electric Vehicles Charging Station Recommendation. Energies 2023, 16, 6067. [Google Scholar] [CrossRef]
  9. Li, G.; Luo, T.; Song, Y. Spatial equity analysis of urban public services for electric vehicle charging-Implications of Chinese cities. Sustain. Cities Soc. 2022, 76, 103519. [Google Scholar] [CrossRef]
  10. Li, C.; Dong, Z.; Chen, G.; Zhou, B.; Zhang, J.; Yu, X. Data-Driven Planning of Electric Vehicle Charging Infrastructure: A Case Study of Sydney, Australia. IEEE Trans. Smart Grid 2021, 12, 3289–3304. [Google Scholar] [CrossRef]
  11. Deng, L.; Liu, M. A review of research on electric vehicle charging facilities planning in China. In Proceedings of the 2017 2nd International Conference Sustainable and Renewable Energy Engineering (ICSREE), Hiroshima, Japan, 10–12 May 2017; pp. 27–32. [Google Scholar]
  12. Yang, T.; Long, R.; Li, W.; Rehman, S.U. Innovative Application of the Public-Private Partnership Model to the Electric Vehicle Charging Infrastructure in China. Sustainability 2016, 8, 738. [Google Scholar] [CrossRef]
  13. Yu, H.; Tu, J.; Lei, X.; Shao, Z.; Jian, L. A cost-effective and high-efficient EV shared fast charging scheme with hierarchical coordinated operation strategy for addressing difficult-to-charge issue in old residential communities. Sustain. Cities Soc. 2024, 101, 105090. [Google Scholar] [CrossRef]
  14. Chen, Y.; Zhang, Z.; Lang, L.; Long, Z.; Wang, N.; Chen, X.; Wang, B.; Li, Y. Measuring the Spatial Match between Service Facilities and Population Distribution: Case of Lanzhou. Land 2023, 12, 1549. [Google Scholar] [CrossRef]
  15. Patil, P.; Kazemzadeh, K.; Bansal, P. Integration of charging behavior into infrastructure planning and management of electric vehicles: A systematic review and framework. Sustain. Cities Soc. 2023, 88, 104265. [Google Scholar] [CrossRef]
  16. Funke, S.Á.; Sprei, F.; Gnann, T.; Plötz, P. How much charging infrastructure do electric vehicles need? A review of the evidence and international comparison. Transp. Res. Part D Transp. Environ. 2019, 77, 224–242. [Google Scholar] [CrossRef]
  17. Hardman, S.; Jenn, A.; Tal, G.; Axsen, J.; Beard, G.; Daina, N.; Figenbaum, E.; Jakobsson, N.; Jochem, P.; Kinnear, N.; et al. A review of consumer preferences of and interactions with electric vehicle charging infrastructure. Transp. Res. Part D Transp. Environ. 2018, 62, 508–523. [Google Scholar] [CrossRef]
  18. Illmann, U.; Kluge, J. Public charging infrastructure and the market diffusion of electric vehicles. Transp. Res. Part D Transp. Environ. 2020, 86, 102413. [Google Scholar] [CrossRef]
  19. Qin, Y.; Dai, Y.; Huang, J.; Xu, H.; Lu, L.; Han, X.; Du, J.; Ouyang, M. Charging patterns analysis and multiscale infrastructure deployment: Based on the real trajectories and battery data of the plug-in electric vehicles in Shanghai. J. Clean. Prod. 2023, 425, 138847. [Google Scholar] [CrossRef]
  20. Wang, Y.; Chi, Y.; Xu, J.; Li, J. Consumer Preferences for Electric Vehicle Charging Infrastructure Based on the Text Mining Method. Energies 2021, 14, 4598. [Google Scholar] [CrossRef]
  21. Mohammed, A.; Saif, O.; Abo-Adma, M.; Fahmy, A.; Elazab, R. Strategies and sustainability in fast charging station deployment for electric vehicles. Sci. Rep. 2024, 14, 283. [Google Scholar] [CrossRef]
  22. Lin, B.; Yang, M. Changes in consumer satisfaction with electric vehicle charging infrastructure: Evidence from two cross-sectional surveys in 2019 and 2023. Energy Policy 2024, 185, 113924. [Google Scholar] [CrossRef]
  23. Chen, Y.; Lin, B. Are consumers in China’s major cities happy with charging infrastructure for electric vehicles? Appl. Energy 2022, 327, 120082. [Google Scholar] [CrossRef]
  24. Xu, S.; Wang, H.; Tian, X.; Wang, T.; Tanikawa, H. From efficiency to equity: Changing patterns of China’s regional transportation systems from an in-use steel stocks perspective. J. Ind. Ecol. 2022, 26, 548–561. [Google Scholar] [CrossRef]
  25. Kontou, E.; Liu, C.; Xie, F.; Wu, X.; Lin, Z. Understanding the linkage between electric vehicle charging network coverage and charging opportunity using GPS travel data. Transp. Res. Part C Emerg. Technol. 2019, 98, 1–13. [Google Scholar] [CrossRef]
  26. Anjos, M.F.; Gendron, B.; Joyce-Moniz, M. Increasing electric vehicle adoption through the optimal deployment of fast-charging stations for local and long-distance travel. Eur. J. Oper. Res. 2020, 285, 263–278. [Google Scholar] [CrossRef]
  27. Hall, D.; Lutsey, N. Emerging Best Practices for Electric Vehicle Charging Infrastructure; International Council on Clean Transportation: Washington, DC, USA, 2017. [Google Scholar]
  28. Zhu, Y.; Ding, Y.; Wei, S.; Zafar, H.M.Y.; Yan, R. Electric Vehicle Charging Facility Configuration Method for Office Buildings. Buildings 2023, 13, 906. [Google Scholar] [CrossRef]
  29. Peng, Z.; Wang, M.W.H.; Yang, X.; Chen, A.; Zhuge, C. An analytical framework for assessing equitable access to public electric vehicle chargers. Transp. Res. Part D Transp. Environ. 2024, 126, 103990. [Google Scholar] [CrossRef]
  30. Al-Dahabreh, N.; Sayed, M.A.; Sarieddine, K.; Elhattab, M.; Khabbaz, M.J.; Atallah, R.F.; Assi, C. A Data-Driven Framework for Improving Public EV Charging Infrastructure: Modeling and Forecasting. IEEE Trans. Intell. Transp. Syst. 2023, 25, 5935–5948. [Google Scholar] [CrossRef]
  31. Yang, X.; Guo, X.; Li, Y.; Yang, K. The sequential construction research of regional public electric vehicle charging facilities based on data-driven analysis-Empirical analysis of Shanxi Province. J. Clean. Prod. 2022, 380, 134948. [Google Scholar] [CrossRef]
  32. He, S.Y.; Kuo, Y.; Sun, K.K. The spatial planning of public electric vehicle charging infrastructure in a high-density city using a contextualised location-allocation model. Transp. Res. Part A Policy Pract. 2022, 160, 21–44. [Google Scholar] [CrossRef]
  33. Li, J.; Liu, Z.; Wang, X. Public charging station localization and route planning of electric vehicles considering the operational strategy: A bi-level optimizing approach. Sustain. Cities Soc. 2022, 87, 104153. [Google Scholar] [CrossRef]
  34. Carlton, G.J.; Sultana, S. Electric vehicle charging equity and accessibility: A comprehensive United States policy analysis. Transp. Res. Part D Transp. Environ. 2024, 129, 104123. [Google Scholar] [CrossRef]
  35. Loni, A.; Asadi, S. Data-driven equitable placement for electric vehicle charging stations: Case study San Francisco. Energy 2023, 282, 128796. [Google Scholar] [CrossRef]
  36. Taleai, M.; Sliuzas, R.; Flacke, J. An integrated framework to evaluate the equity of urban public facilities using spatial multi-criteria analysis. Cities 2014, 40, 56–69. [Google Scholar]
  37. Tahmasbi, B.; Mansourianfar, M.H.; Haghshenas, H.; Kim, I. Multimodal accessibility-based equity assessment of urban public facilities distribution. Sustain. Cities Soc. 2019, 49, 101633. [Google Scholar] [CrossRef]
  38. Ashik, F.R.; Mim, S.A.; Neema, M.N. Towards vertical spatial equity of urban facilities: An integration of spatial and aspatial accessibility. J. Urban Manag. 2020, 9, 77–92. [Google Scholar] [CrossRef]
  39. Jang, S.; An, Y.; Yi, C.; Lee, S. Assessing the spatial equity of Seoul’s public transportation using the Gini coefficient based on its accessibility. Int. J. Urban Sci. 2017, 21, 91–107. [Google Scholar] [CrossRef]
  40. Stanley, B.W.; Dennehy, T.J.; Smith, M.E.; Stark, B.L.; York, A.M.; Cowgill, G.L.; Novic, J.; Ek, J. Service Access in Premodern Cities: An Exploratory Comparison of Spatial Equity. J. Urban Hist. 2016, 42, 121–144. [Google Scholar] [CrossRef]
  41. Chen, Y.; Bouferguene, A.; Shen, Y.; Al-Hussein, M. Assessing accessibility-based service effectiveness (ABSEV) and social equity for urban bus transit: A sustainability perspective. Sustain. Cities Soc. 2019, 44, 499–510. [Google Scholar] [CrossRef]
  42. Ghorbanzadeh, M.; Kim, K.; Ozguven, E.E.; Horner, M.W. Spatial accessibility assessment of COVID-19 patients to healthcare facilities: A case study of Florida. Travel Behav. Soc. 2021, 24, 95–101. [Google Scholar] [CrossRef]
  43. Zhang, F.; Li, D.; Ahrentzen, S.; Zhang, J. Assessing spatial disparities of accessibility to community-based service resources for Chinese older adults based on travel behavior: A city-wide study of Nanjing, China. Habitat. Int. 2019, 88, 101984. [Google Scholar] [CrossRef]
  44. Li, Z.; Liang, Z.; Feng, L.; Fan, Z. Beyond Accessibility: A Multidimensional Evaluation of Urban Park Equity in Yangzhou, China. ISPRS Int. J. Geo-Inf. 2022, 11, 429. [Google Scholar] [CrossRef]
  45. Chang, H.; Liao, C. Exploring an integrated method for measuring the relative spatial equity in public facilities in the context of urban parks. Cities 2011, 28, 361–371. [Google Scholar] [CrossRef]
  46. Luo, H.; Zhao, S.; Cui, M.; Zhong, S.; Ma, J. The evolution of spatial equity of high-speed rail accessibility in China: An operation frequency based approach. Int. J. Sustain. Transp. 2023, 17, 1265–1277. [Google Scholar] [CrossRef]
  47. Walsh, F.J.; Musonda, M.; Mwila, J.; Prust, M.L.; Vosburg, K.B.; Fink, G.; Berman, P.; Rockers, P.C. Improving Allocation And Management Of The Health Workforce In Zambia. Health Affair 2017, 36, 931–937. [Google Scholar] [CrossRef]
  48. Dadashpoor, H.; Rostami, F.; Alizadeh, B. Is inequality in the distribution of urban facilities inequitable? Exploring a method for identifying spatial inequity in an Iranian city. Cities 2016, 52, 159–172. [Google Scholar] [CrossRef]
  49. Alanazi, F.; Alshammari, T.O.; Azam, A. Optimal Charging Station Placement and Scheduling for Electric Vehicles in Smart Cities. Sustainability 2023, 15, 6030. [Google Scholar] [CrossRef]
  50. Farhadi, F.; Wang, S.; Palacin, R.; Blythe, P. Data-driven multi-objective optimization for electric vehicle charging infrastructure. Iscience 2023, 26, 107737. [Google Scholar] [CrossRef]
  51. Soldatke, N.; Sydorow, M.; Zukowska, S. Assessment of the accessibility of public transport in the Tricity (Poland): Analytical use of geographical information systems (GIS) in the context of selected public transport measures. Int. J. Digit. Earth 2024, 17, 2344586. [Google Scholar] [CrossRef]
  52. Li, Z.; Fan, Z.; Song, Y.; Chai, Y. Assessing equity in park accessibility using a travel behavior-based G2SFCA method in Nanjing, China. J. Transp. Geogr. 2021, 96, 103179. [Google Scholar] [CrossRef]
  53. Hu, L.; Dong, J.; Lin, Z. Modeling charging behavior of battery electric vehicle drivers: A cumulative prospect theory based approach. Transp. Res. Part C Emerg. Technol. 2019, 102, 474–489. [Google Scholar] [CrossRef]
  54. Chen, J.; Li, F.; Yang, R.; Ma, D. Impacts of Increasing Private Charging Piles on Electric Vehicles’ Charging Profiles: A Case Study in Hefei City, China. Energies 2020, 13, 4387. [Google Scholar] [CrossRef]
  55. Miletic, M.; Shahine, F.; Sarkar, M.; Quandt, A. A Native American Perspective on Sustainable and Resilient Infrastructure in Southern California. Sustainability 2022, 14, 12811. [Google Scholar] [CrossRef]
  56. Gnann, T.; Funke, S.; Jakobsson, N.; Ploetz, P.; Sprei, F.; Bennehag, A. Fast charging infrastructure for electric vehicles: Today’s situation and future needs. Transp. Res. Part D Transp. Environ. 2018, 62, 314–329. [Google Scholar] [CrossRef]
  57. Karolemeas, C.; Tsigdinos, S.; Tzouras, P.G.; Nikitas, A.; Bakogiannis, E. Determining Electric Vehicle Charging Station Location Suitability: A Qualitative Study of Greek Stakeholders Employing Thematic Analysis and Analytical Hierarchy Process. Sustainability 2021, 13, 2298. [Google Scholar] [CrossRef]
  58. Luo, W.; Wang, F. Measures of Spatial Accessibility to Health Care in a GIS Environment: Synthesis and a Case Study in the Chicago Region. Environ. Plan. B Plan. Des. 2003, 30, 865–884. [Google Scholar] [CrossRef]
  59. Chen, X.; Jia, P. A comparative analysis of accessibility measures by the two-step floating catchment area (2SFCA) method. Int. J. Geogr. Inf. Sci. 2019, 33, 1739–1758. [Google Scholar] [CrossRef]
  60. Luo, W. Luo and Qi, 2009, an enhanced two-step floating catchment area (E2SFCA) method for measuring spatial accessibility to primary care physicians (vol 15, pg 1100, 2009). Health Place 2011, 17, 394. [Google Scholar] [CrossRef]
  61. Moran, P.A.P. Notes on continuous stochastic phenomena. Biometrika 1950, 37, 17–23. [Google Scholar] [CrossRef]
  62. Li, H.; Li, H.; Ding, Z.; Hu, Z.; Chen, F.; Wang, K.; Peng, Z.; Shen, H. Spatial statistical analysis of Coronavirus Disease 2019 (COVID-19) in China. Geospat. Health 2020, 15, 11–18. [Google Scholar] [CrossRef] [PubMed]
  63. Wang, S.; Yaung, C. Vertical equity of healthcare in Taiwan: Health services were distributed according to need. Int. J. Equity Health 2013, 12, 12. [Google Scholar] [CrossRef]
  64. Dean, H.D.; Roberts, G.W.; Bouye, K.E.; Green, Y.; McDonald, M. Sustaining a Focus on Health Equity at the Centers for Disease Control and Prevention Through Organizational Structures and Functions. J. Public Health Manag. Pract. 2016, 22, S60–S67. [Google Scholar] [CrossRef] [PubMed]
  65. Huang, X.; Lin, Y.; Lim, M.K.; Zhou, F.; Ding, R.; Zhang, Z. Evolutionary dynamics of promoting electric vehicle-charging infrastructure based on public-private partnership cooperation. Energy 2022, 239, 122281. [Google Scholar] [CrossRef]
  66. Hsu, C.; Fingerman, K. Public electric vehicle charger access disparities across race and income in California. Transp. Policy 2021, 100, 59–67. [Google Scholar] [CrossRef]
  67. Helmus, J.R.; Lees, M.H.; van den Hoed, R. A data driven typology of electric vehicle user types and charging sessions. Transp. Res. Part C Emerg. Technol. 2020, 115, 102631–102637. [Google Scholar] [CrossRef]
  68. Arias, M.B.; Kim, M.; Bae, S. Prediction of electric vehicle charging-power demand in realistic urban traffic networks. Appl. Energy 2017, 195, 738–753. [Google Scholar] [CrossRef]
  69. He, S.Y.; Kuo, Y.; Wu, D. Incorporating institutional and spatial factors in the selection of the optimal locations of public electric vehicle charging facilities: A case study of Beijing, China. Transp. Res. Part C Emerg. Technol. 2016, 67, 131–148. [Google Scholar] [CrossRef]
  70. Kumar, R.R.; Chakraborty, A.; Mandal, P. Promoting electric vehicle adoption: Who should invest in charging infrastructure? Transp. Res. Part E Logist. Transp. Rev. 2021, 149, 102295. [Google Scholar] [CrossRef]
  71. Zhang, L.; Zhao, Z.; Xin, H.; Chai, J.; Wang, G. Charge pricing model for electric vehicle charging infrastructure public-private partnership projects in China: A system dynamics analysis. J. Clean. Prod. 2018, 199, 321–333. [Google Scholar] [CrossRef]
  72. Zhang, Q.; Li, H.; Zhu, L.; Campana, P.E.; Lu, H.; Wallin, F.; Sun, Q. Factors influencing the economics of public charging infrastructures for EV—A review. Renew. Sust. Energy Rev. 2018, 94, 500–509. [Google Scholar] [CrossRef]
  73. Sierzchula, W.; Bakker, S.; Maat, K.; van Wee, B. The influence of financial incentives and other socio-economic factors on electric vehicle adoption. Energy Policy 2014, 68, 183–194. [Google Scholar] [CrossRef]
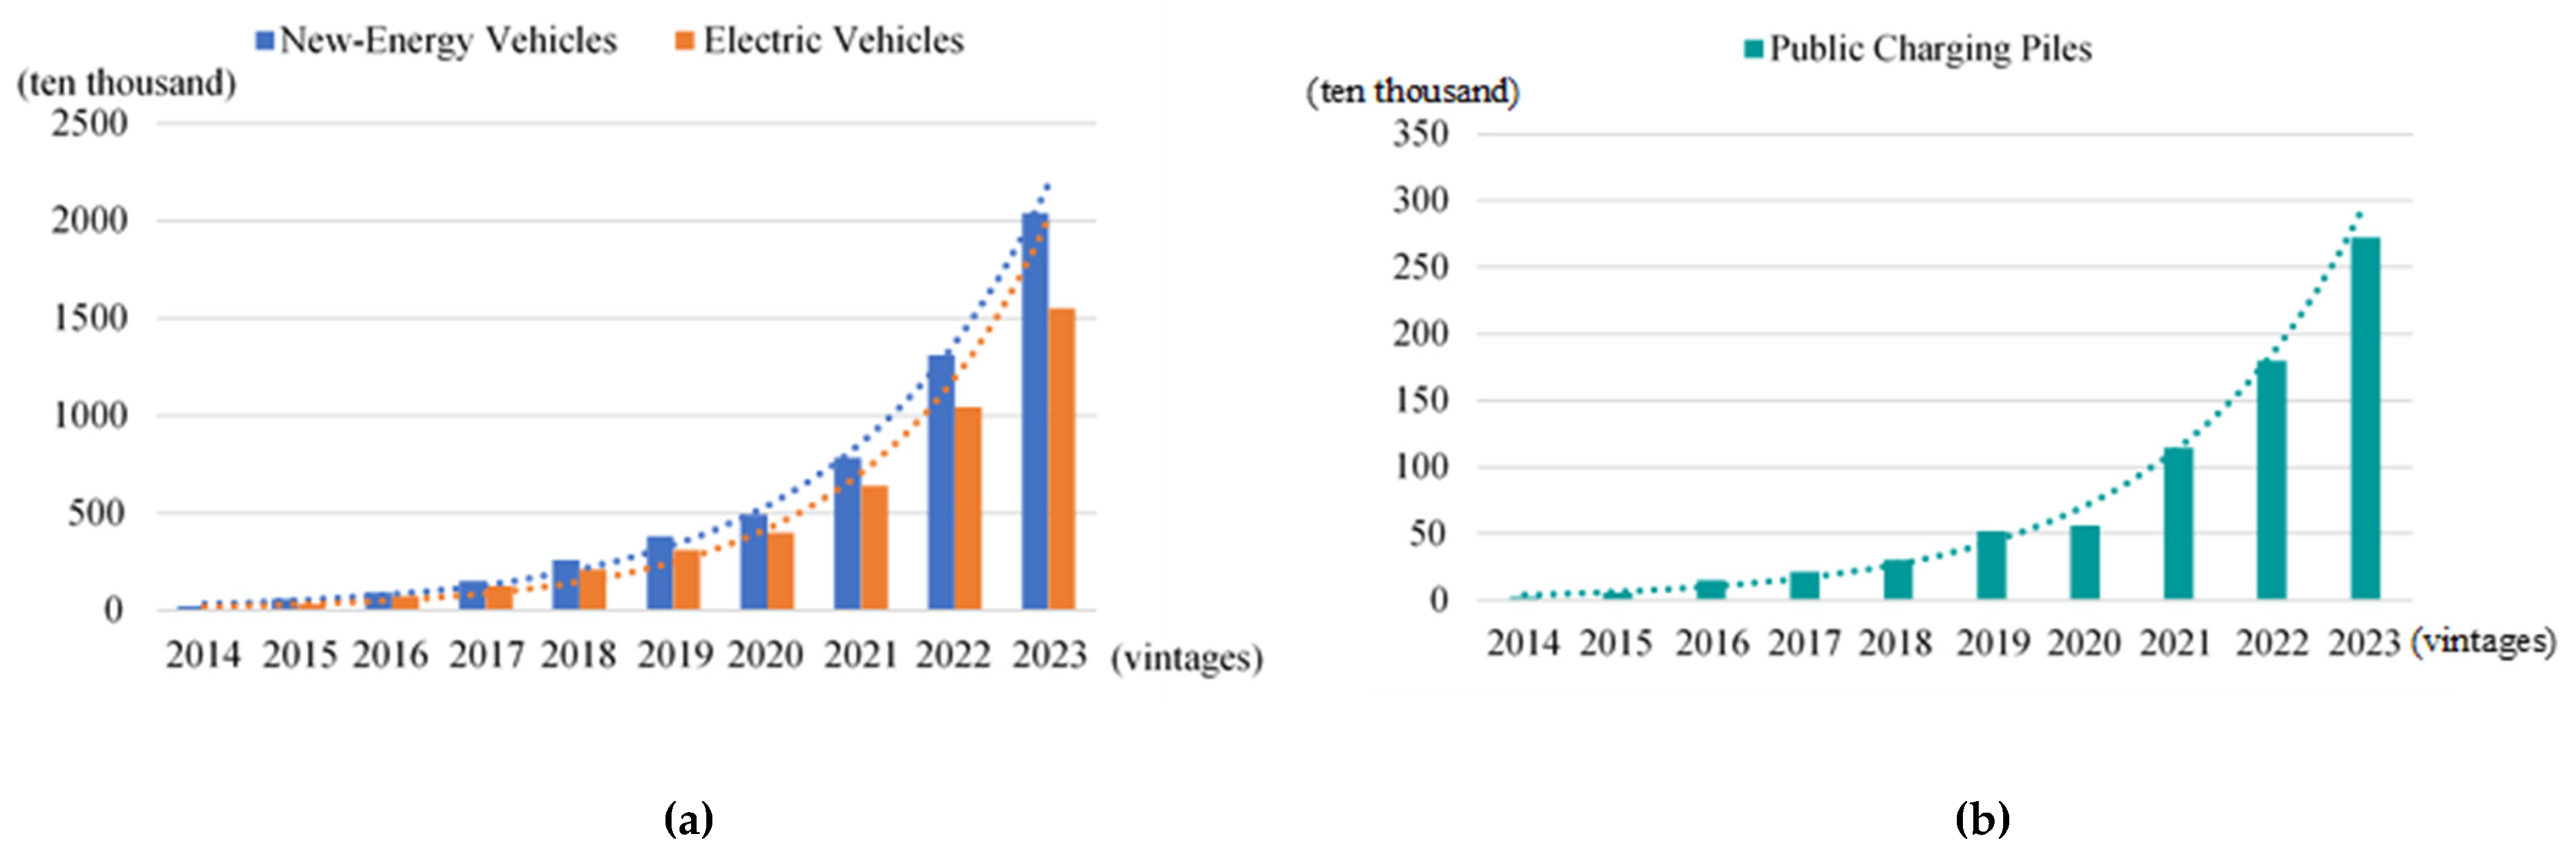
Figure 1. Trend map of volume growth: (a) new-energy vehicles and electric vehicles and (b) charging piles.
Ijgi 13 00296 g001
Figure 2. Map of Nanjing Central Districts (right) and its location. (a) Map of China. (b) Map of Jiangsu Province.
Ijgi 13 00296 g002
Figure 3. A map of the numbers of charging piles.
Ijgi 13 00296 g003
Figure 4. Methodological framework.
Ijgi 13 00296 g004
Figure 5. Maps of equity in EVPCI with multidimensional spatial indicators: (a) accessibility, (b) availability, (c) convenience, and (d) affordability.
Ijgi 13 00296 g005
Figure 6. Map of equity in EVPCI with multidimensional spatial indicators.
Ijgi 13 00296 g006
Figure 7. Map of cluster types of equity in EVPCI with multidimensional spatial indicators.
Ijgi 13 00296 g007
Figure 8. Spatial disparity of equity in charging service by district.
Ijgi 13 00296 g008
Figure 9. Map of cluster types of equity in EVPCI and community economic indicator.
Ijgi 13 00296 g009
Figure 10. Map of cluster types of equity in EVPCI and community environment indicators.
Ijgi 13 00296 g010aIjgi 13 00296 g010b
Table 1. The number of new-energy vehicles and charging piles in China in the last 10 years (unit/ten thousand).
VintagesNew-Energy VehiclesElectric VehiclesCharging Piles
20142282.8
201558335.7
2016917315
201715312521.4
201826121130
201938131051.6
202049240055.8
2021784640114.7
202213101045179.7
202320411552272.6
Table 3. Studies of spatial equity evaluation modeling.
CitationResearch Subjects Case Study Methodology
Ghorbanzadeh et al. [42]Healthcare FacilitiesFlorida, USA2SFCA, ARD
Li et al. [9]EV Charging Services The top ten cities in China by EVCSOpportunity-based approach, Global and Local Moran’s I index
Zhang et al. [43]Community-based Service ResourcesNanjing, ChinaG2SFCA, Local Moran’s I index
Chang et al. [45]Urban Public FacilitiesTaiwan, ChinaIntegrated Equity index, Local Moran’s I index
Luo et al. [46] High-speed Rail ChinaTheil index
Li et al. [44]Urban ParkYangzhou, China2SFCA, Lorenz Curve and Gini Coefficient
Dadashpoor et al. [48]Urban FacilitiesHamadan, IranianSIM model, Density index, Proximity coefficient, AHP
Chen et al. [41]Urban Bus TransitEdmonton, CanadaDEA model, Lorenz Curves, Gini Coefficient
Table 4. Spatial and social dimension indicators.
Explanation
Dimension IndicatorsDescription
Spatial level AccessibilitySum of the ratio of service capacity to community demand for charging piles
AvailabilityOpportunities for users to choose the number and type of charging facilities they use
ConvenienceInverse of distance to the nearest charging station for users within thresholds
AffordabilityDensity of charging posts per neighborhood
Social levelCommunity economic indicatorsPopulationPopulation density
Housing pricesAverage price per dwelling unit
Dwelling ageDate of completion of dwelling
Community environment indicatorsFood and beverageRestaurants, cafes, etc.
Company and enterpriseCompanies, factories, etc.
Shopping and consumptionDepartment stores, shopping streets, etc.
Traffic facilitiesStations, parks, service areas, etc.
Hotel accommodationHotels, guest houses, etc.
Science and culture educationSchools, libraries, palaces of culture, etc.
Tourist attractionParks, attractions, memorials, etc.
Living servicePublic toilets, baths and saunas, utilities, etc.
Leisure and entertainmentCinemas, playgrounds, bars, etc.
Medical facilitiesHospitals, health centers, etc.
Exercise and fitnessBall fields, campgrounds, fitness centers, etc.
Table 5. The notations used in the models incorporated in the analytical framework.
NotationDescription
Indices
iThe demand point
jThe supply point
MThe type of charging post
fThe direct current (DC) charging
lThe alternating current (AC) charging
Parameters
D i The demand scale at point i
S j The facility scale at point j
t i j The time from demand point i to supply point j
t 0 The threshold time
NThe total number of all charging stations
E n The index of charging stations
T i f The   community s   choice   for   DC   power   within   threshold   t 0
T i l The   community s   choice   for   AC   power   within   threshold   t 0
H f The total number of DC charging piles
H l The total number of AC charging piles
h f The average numbers of DC charging piles in each community
h l The average numbers of AC charging piles in each community in Nanjing Central Districts
h i f The   numbers   of   DC   charging   piles   in   community   i   within   threshold   t 0
h i l The   numbers   of   AC   charging   piles   in   community   i   within   threshold   t 0
F m The variety index of charging stations
d n The distance from the nearest charging station to i
d i j ( m i n ) The minimum distance from demand point I to supply point j
E i The total number of charging piles
D i The community population
Variables
R j The ratio of the number of charging piles in the charging station to the total population in the community
g t i j The   attenuation   function   considering   traveling   time   t i j
A i The accessibility of point i
Q i The number of charging stations available at demand point i
T i The total availability of charging types in community i
A V i The availability index at demand point i
C i The charging service to community i as the inverse distance of the nearest charging station
A F i The number of piles per capita in community i
S E i The community public charging infrastructure space equity index
Table 6. Local indicators of spatial autocorrelation.
EVPCI Local Indicators of Spatial Autocorrelation
Local Moran’s I Zp-Value
Spatial levelSpatial equity0.66127.0230.001
Social levelCommunity economic indicatorsPopulation density0.31516.8190.001
Housing prices0.315.3720.001
Dwelling age0.0140.74740.218
Community environment indicatorsFood and beverage0.35517.6910.001
Company and enterprise0.37218.8030.001
Shopping and consumption0.30915.9090.001
Traffic facilities0.4923.6340.001
Hotel accommodation0.26813.6870.001
Science and culture education0.31616.0580.001
Tourist attraction0.2513.0560.001
Living service0.34717.310.001
Leisure and entertainment0.315.1520.001
Medical facilities0.35918.4370.001
Exercise and fitness0.24712.7460.001
Disclaimer/Publisher’s Note: The statements, opinions and data contained in all publications are solely those of the individual author(s) and contributor(s) and not of MDPI and/or the editor(s). MDPI and/or the editor(s) disclaim responsibility for any injury to people or property resulting from any ideas, methods, instructions or products referred to in the content.

