Article

The Symbolization of Regional Elements Based on Local-Chronicle Text Mining and Image-Feature Extraction

School of Geoscience and Technology, Zhengzhou University, Zhengzhou 450001, China
*
Author to whom correspondence should be addressed.
ISPRS Int. J. Geo-Inf. 2024, 13(9), 299; https://doi.org/10.3390/ijgi13090299
Submission received: 4 July 2024 / Revised: 12 August 2024 / Accepted: 22 August 2024 / Published: 23 August 2024

Abstract

:
In the context of the information age, the symbolization of regional elements has become a crucial component in modern cartographic practice. The targeted identification of regional elements and the design of map symbols are prerequisites for realizing the symbolization of regional elements. Therefore, we propose a method to symbolize regional elements by combining textual analysis and image processing. Firstly, local chronicles are used as the textual information source, and regional elements are extracted through textual data mining. Second, the real image data of the elements are selected, and the image segmentation algorithm, clustering algorithm, etc., are used to extract contours and colors from the images and carry out corresponding symbol simplification and color matching, to create highly recognizable symbols. Finally, we apply the symbols to two map types: the thematic map and the tourist map, and design a questionnaire to evaluate the outcomes of the symbol design. After a thorough review, it has been found that the method is superior to related symbolization studies in terms of data source authority, symbol generation efficiency, and symbol information carrying. In conclusion, guided by interdisciplinary thinking, this study effectively combines theoretical analysis and design practice, proposes a new idea of symbolization, and opens up a new way for geographic information visualization.

1. Introduction

In the contemporary research field of geographic information science, local chronicles serve as a significant documentary resource for recording comprehensive information on local history, geography, humanities, economy, and other pertinent aspects. The study of regional geography based on local chronicles has garnered considerable attention from scholars [1,2,3]. The regional elements contained within these chronicles are crucial for understanding the geographic characteristics and cultural background of a region [4,5]. However, traditional research on local chronicles has primarily focused on interpreting and analyzing textual content, often neglecting the in-depth exploration of visual expressions of feature elements. With the development of geographic information systems and digital map technology, map symbol design has emerged as an important means of visualizing geographic information, offering new perspectives and technical support for the representation of feature elements in local chronicles.
As a unique historical source in China, local chronicles can provide detailed and authoritative local information with full research potential in exploring local history. For example, Li [6] used Local chronicles as a basic corpus to analyze the distribution of specialty products in Shanxi Province, China, from a spatial and temporal perspective. Local chronicle-oriented research is an important part of exploring local historical changes and cultural characteristics [7], but there is still a lack of research related to the use of local chronicles as a textual information source to analyze local characteristics. While exploring local characteristics, how to carry out effective visualization methods and thus promote the development and inheritance of local culture is also a matter of great concern. Some scholars have already started to try the map visualization method based on local chronicle information to reflect the local cultural connotation [8,9]. However, this research often starts from the perspective of the concept of map composition, while the symbolization process of features, which is the key to maps, still lacks systematic research and discussion. In recent years, related research in computer vision has broadened the ideas for the process of feature symbolization. With computer text processing and visualization technology in the public view, more and more research has begun to focus on the use of digital means of in-depth analysis and mining of text information, especially the extraction of local characteristics of the elements. For example, Xie [10] used text data to analyze and locate popular areas, thus discovering the unique urban cultural characteristics of Beijing, China; Miray Kas [11] proposed that text network diagrams can effectively reveal the potential correlations between texts and discover the key information therein. The above scholars proposed that data mining methods can discover cultural features from the text perspective, which provides valuable technical support and research direction for discovering local chronicle information. Meanwhile, as an important part of geographic information visualization, the symbolization of featured features plays a crucial role in visualizing and disseminating geographic culture. From the aspect of symbolization, relevant research first started from the perspective of symbol artistry and composition [12,13]. For example, Bertin [14] first applied semiotics to cartography and proposed six “visual variables” to guide the design of map symbols; Jiang [15] explored the variables and basic features of symbol composition from the perspectives of science, artistry, and computer controllability. In recent years, with the rapid development of computer graphics, computer-vision processing technology can assist the generation of symbols to a certain extent. Relevant research includes image subject extraction [16,17,18], image segmentation [19,20], color extraction [21,22] and cross-platform information sharing, etc., which can effectively extract the contour and color elements necessary for symbol generation and provide complete technical support for feature symbolization. Therefore, the introduction of computer-vision processing technology into the symbolization process of features can effectively expand the research ideas of map symbol design.
Existing studies have provided valuable experiences and methods for digital analysis [23] and visualization of geographic information [24,25] in local chronicles. However, exploring how to comprehensively use text analysis and image processing techniques to mine and express the regional elements remains a pertinent issue. Accordingly, this study focuses on the Dengfeng chronicles as the research subject, aiming to thoroughly investigate and visualize the regional elements within these local chronicles by integrating text mining and map-symbol-design methodologies. First, text mining technology is employed to analyze the chronicle, extracting key feature elements and revealing the correlations among these elements by constructing a word co-occurrence network. Subsequently, based on the extracted feature elements, image processing technology is used to design map symbols to visualize the features and connotations of the feature elements. This study not only enriches the research content of local chronicles but also offers innovative new ideas and technical support for the visualization of geographic information, thereby further promoting the dissemination of local culture and the popularization of geographic knowledge.

2. Case Study and Data Source

Dengfeng City (34°35′–34°15′ N, 112°49′–113°19′ E) is located in Henan Province, near to and administered by Zhengzhou City (Figure 1). Dengfeng has a significant historical background dating back to the 11th century BC, when Confucianism founder Zhou referred to it as ‘The Centre of Heaven and Earth’. This area is known for its diverse natural landscapes and deep human history [26]. Selecting Dengfeng as the experimental area demonstrates the rich and colorful cultural heritage of the Central Plains of Henan Province, reflects the unique value of the region in terms of history, culture, and nature, and aids in deeply excavating and preserving the excellent traditional Chinese culture.
The data for this study mainly comprise two types: text and image data (Table 1). The source of the textual data is the latest edition of the Dengfeng City Chronicle [27], published in 2008. The compilation of local chronicles is generally led by the local official government, which organizes and gathers professionals from various industries to make detailed records of local politics, economy, culture, etc., which can effectively ensure the authority and comprehensiveness of its contents. Furthermore, the compilation and revision of local chronicles in China have persisted for over 2000 years. Despite experiencing wars, natural disasters, and man-made calamities, these chronicles have been passed down through generations, becoming a unique cultural phenomenon within global civilization. Unlike most historical records, which are based on a specific point in time, the compilation of local chronicles is updated every 15 years, based on preserving the original information. This ensures the unique continuity of local chronicles and enables their contents to be consistent throughout history. Dengfeng City Chronicle is a local chronicle for Dengfeng, and is a comprehensive “general chronicle” that records the local natural conditions, human environment, history, economy, culture, and other aspects [9]. The textual information in this paper is mainly selected from the fourth volume of the Dengfeng City Chronicle, i.e., the chapter on “cultural relics and monuments” (pages 203 to 301, totaling over 130,000 words). This volume provides a detailed account of the regional cultural characteristics of Dengfeng City, encompassing historical development, ancient architecture, and cultural relics, thereby effectively reflecting the unique cultural characteristics of the region.
The image data for this study were primarily collected from the official website of the Dengfeng City Government, Baidu Gallery, and Dengfeng City Chronicle, focusing on landmarks and folk culture in Dengfeng City. Our analysis particularly emphasized the cultural display section of the “Into Dengfeng” section on the official website of the Dengfeng Municipal Government. This website serves as an authoritative platform for promoting the city’s local characteristics, thereby providing a reliable source for summarizing and expressing Dengfeng culture. For instance, the selected landmarks, such as the Shaolin Temple, Astronomical Observation Terrace, and Buddhist monks, exemplify the humanistic features captured in the image data. By selecting shooting angles based on their visual characteristics and expressive requirements, we ensured that the image content effectively represents the regional characteristics of the features depicted.

3. Methods

This study primarily focuses on two key aspects: mining information from local chronicles and designing symbols representing regional cultural elements. The first aspect involves extracting elements from local chronicle texts to identify the most significant regional characteristics within the target area. This process aims to clarify and enrich the representation of objects in the local chronicle map-symbol database, which is achieved through three main steps: text pre-processing, text mining, and the construction of a text co-occurrence network. The second step is to collect the real image data of the featured elements in the network with regional characteristics and remove the interference of the shooting background by extracting the main information of the features. This is followed by meticulous extraction of the elements’ contour attributes and colors. Following the synthesis of extracted contour attributes and color properties, alongside the implementation of symbol simplification techniques, representative map symbols for regional elements are systematically constructed. This process lays the foundational groundwork for the subsequent creation of local chronicle atlases. The technical roadmap of this study is illustrated in Figure 2.

3.1. A Method for Extracting Semantic Relations of Regional Cultural Elements

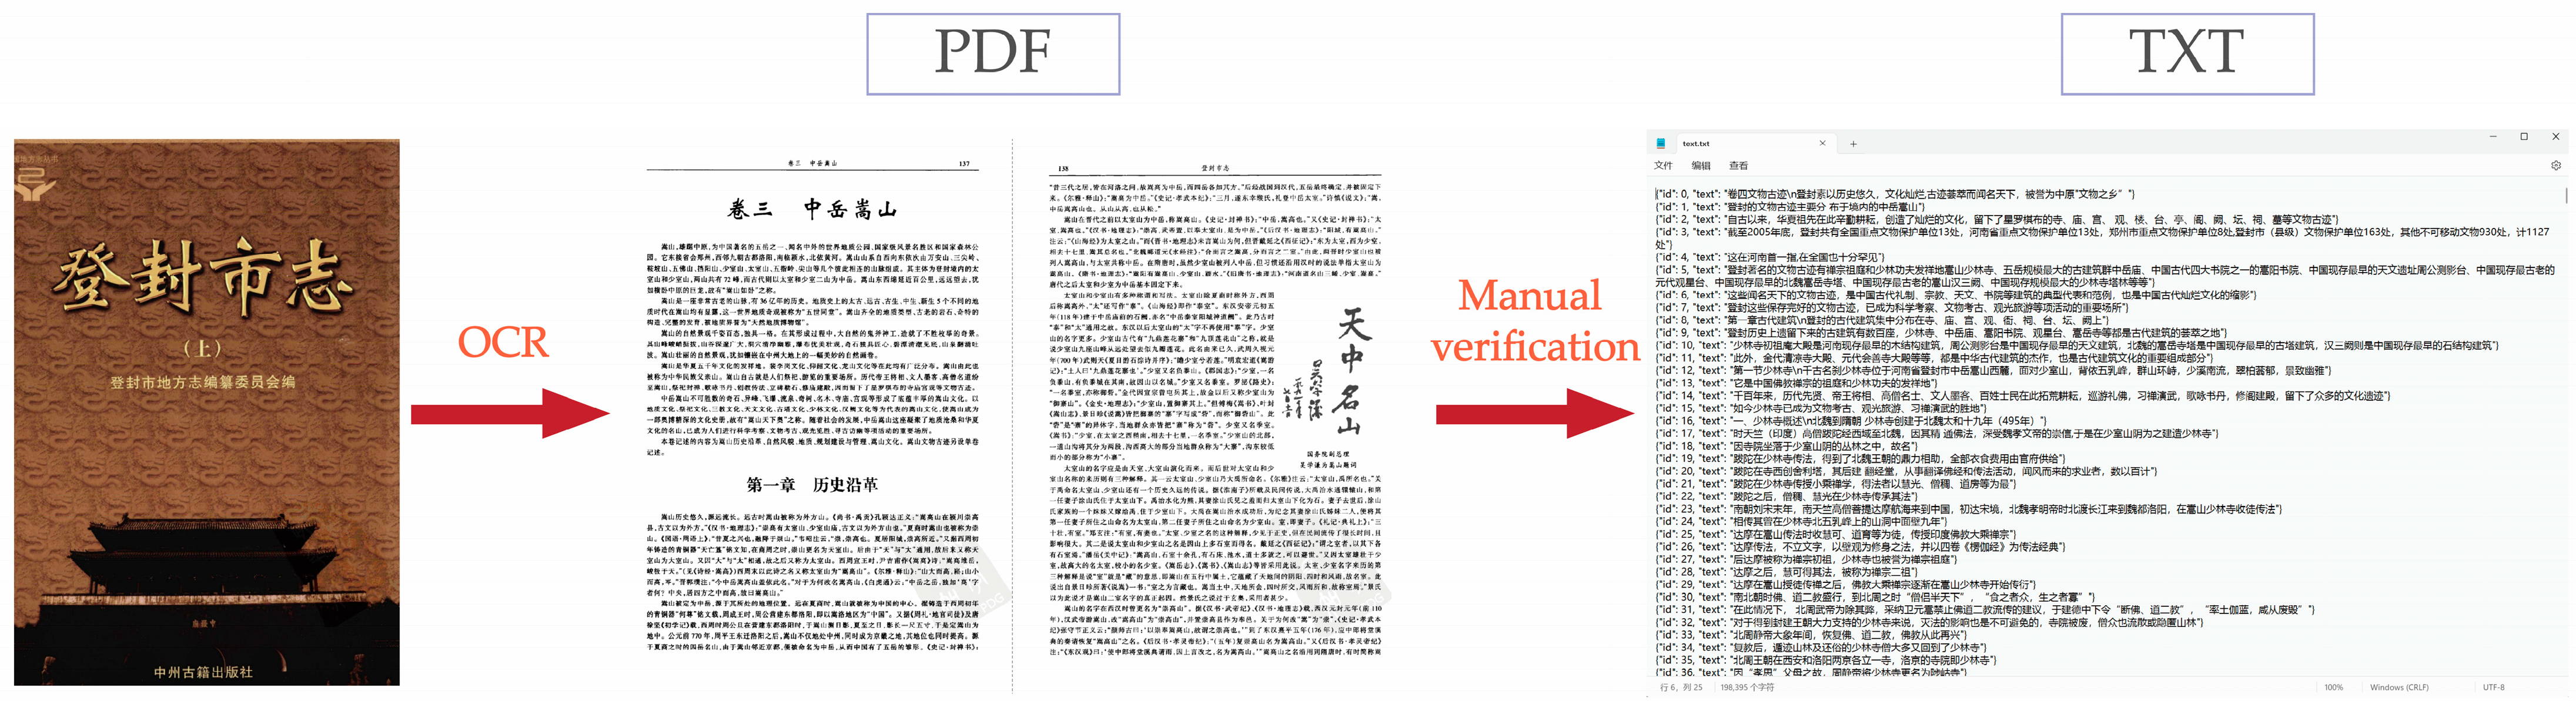
3.1.1. Text Pre-Processing

Local chronicles are mainly recorded in paper form. First, we scanned each page of the book using OCR technology and saved it as an editable document image format. The content of the document was manually verified and corrected and finally converted into a plain text format recognizable by the Python programming language (Figure 3). Secondly, a stop list and specialized word list were created to improve the accuracy of subsequent word classification tasks by filtering out common interference words and preserving specialized vocabulary. The stop lists from Harbin Institute of Technology, Sichuan University Machine Intelligence Laboratory, and Baidu are widely recognized in the field of Chinese language processing. By merging and deduplicating these lists, a comprehensive stop list was compiled, containing a total of 2694 Chinese words, numbers, and symbols. The specialized word lists were curated from the Dictionary of Chinese Thought and Culture and Dengfeng’s local terminology, resulting in 94 unique terms. Additionally, the word list will be continuously refined through statistical analysis to incorporate any new specialized vocabulary that may emerge.

3.1.2. Text Information Mining Based on Jieba Word Separation Package

Words are the fundamental units that can be used independently in language. Unlike English text, where words are delineated by spaces, Chinese text lacks such explicit delimiters to define word boundaries. Therefore, word segmentation becomes a fundamental and critical task in the analysis of Chinese text. Without effective methods for word segmentation, quantitative analysis of Chinese content is challenging to achieve. The Jieba word separation package, as an open-source project, offers high accuracy and speed, making it a widely used tool for Chinese word segmentation in contemporary text mining research. It is frequently utilized to decompose complete Chinese texts into individual words for subsequent text information processing [28,29]. Jieba was employed to segment words, remove deactivated words, merge synonyms, count high-frequency words (Table 2), and construct a word co-occurrence network matrix (Table 3) in the digital text of the local chronicle. This step helps to normalize the core content of the text to some extent, thereby laying the foundation for the formation of the text co-occurrence network in subsequent steps.

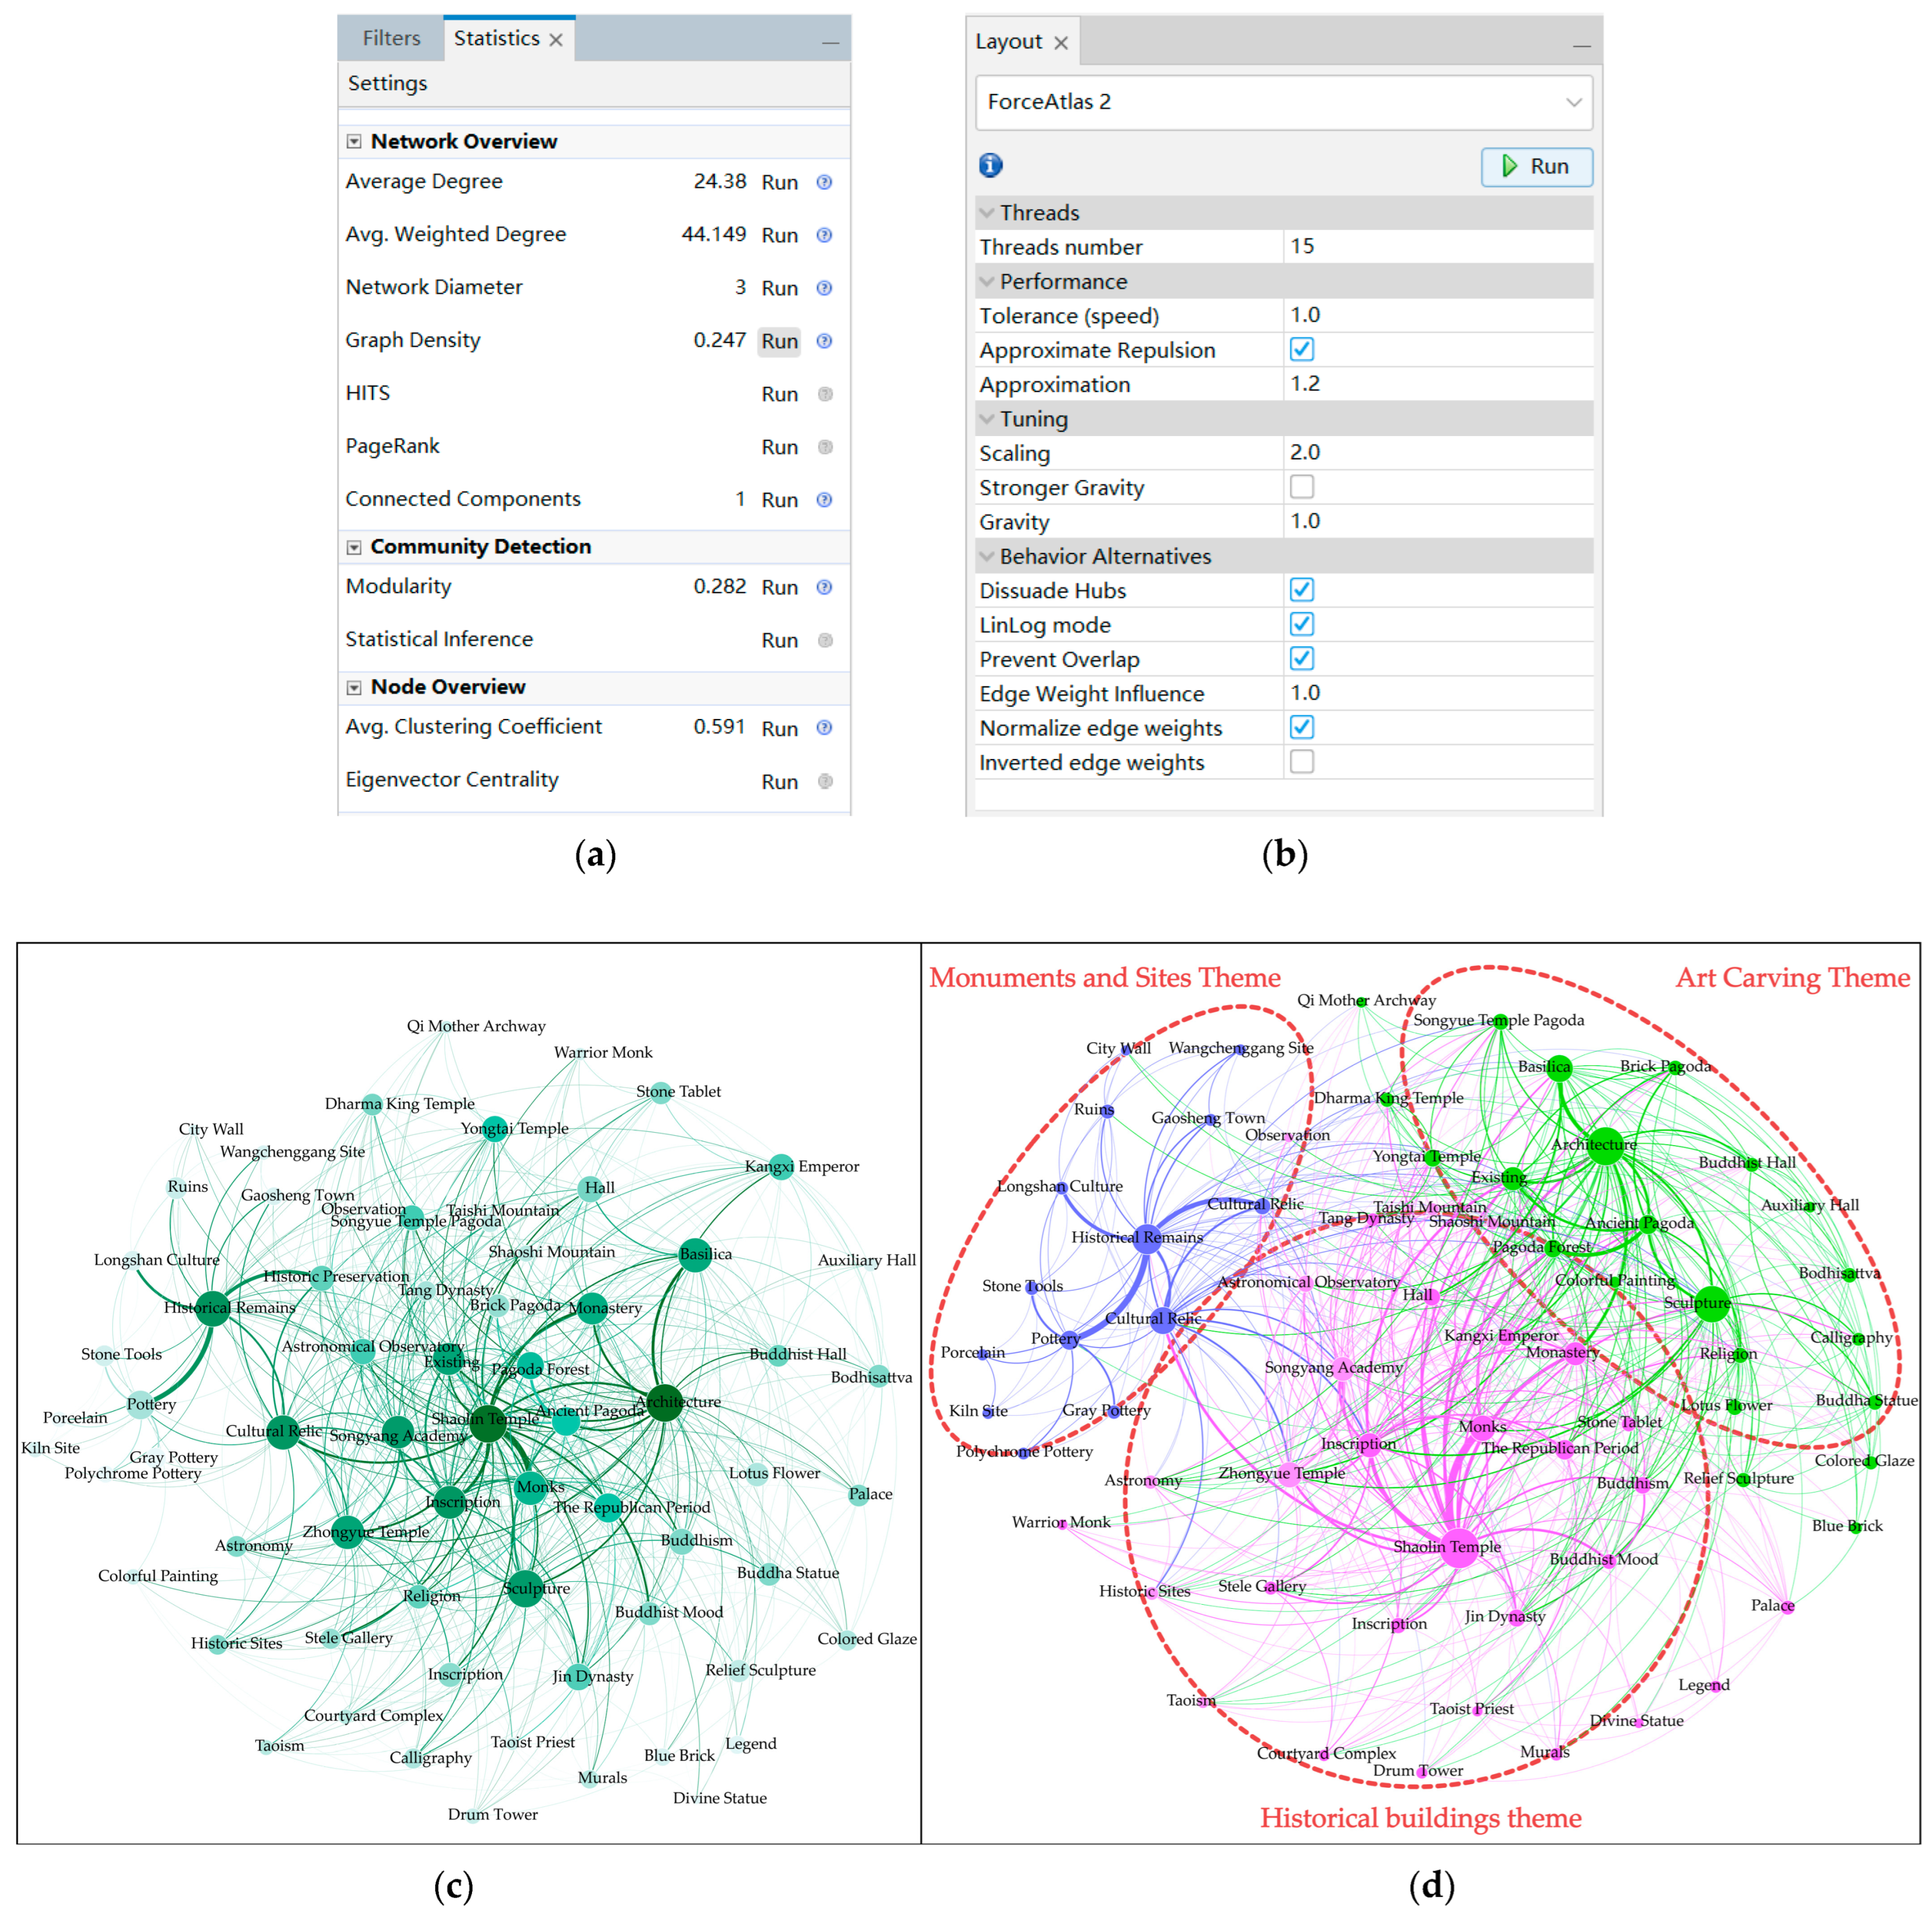
3.1.3. Constructing Text Co-Occurrence Networks Based on Gephi Software

Gephi is complex network analysis software based on the Java Virtual Machine, employed primarily for visualizing interactions within complex systems [30]. To effectively display node information and correlations, this study utilized Gephi (0.10.1) software to construct a word co-occurrence network and optimized the text network based on topics. Initially, a word co-occurrence matrix was imported into Gephi to construct an undirected graph model. To enhance the relevance and clarity of the network analysis, points exerting minimal influence on the overall structure or lacking discernible co-occurrence relationships were removed. Subsequently, key network statistical metrics were calculated, based on the preliminary network structure.
  • Average Degree: this is the average value of the degree (number of connections to other nodes) of all nodes in the network. It can be used to reflect the average connectivity of nodes in the network.
  • Graph density is defined as the ratio of the number of edges present in the network to the maximum number of edges that could be present. It is used as a measure of the network’s connectivity.
  • Average clustering coefficient: the average of the clustering coefficients of individual nodes in the network, which reflects the local clustering characteristics of the network and indicates the tendency of keywords to cluster in the network.
  • Modularity: an indicator of the quality of the community structure in the network. Modular community detection allows the identification of keyword clusters that may correspond to different topics or concepts in the text.
Ultimately, the Force Atlas 2 layout algorithm was leveraged to manipulate the pertinent visual attributes of nodes, effectively revealing the patterns of associations among individual words and their inherent thematic distributions (Figure 4).

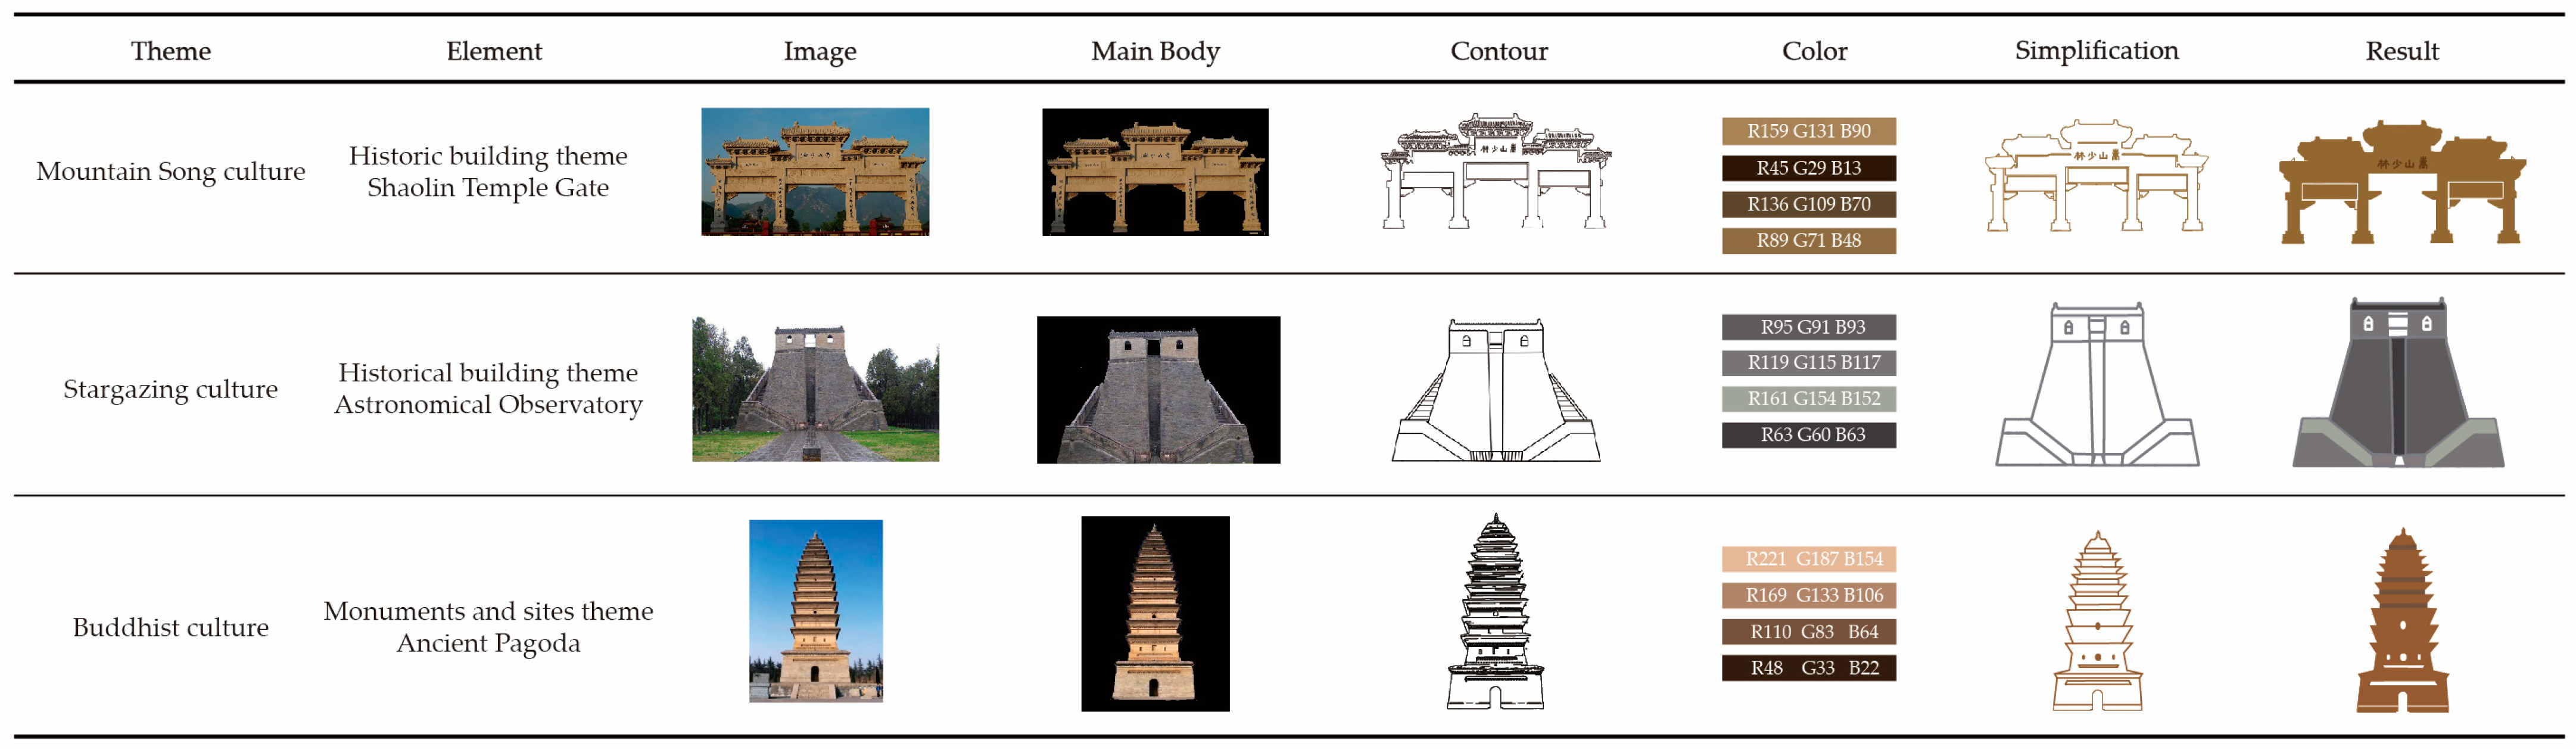
3.2. Symbol Design Methodology for Regional Cultural Elements

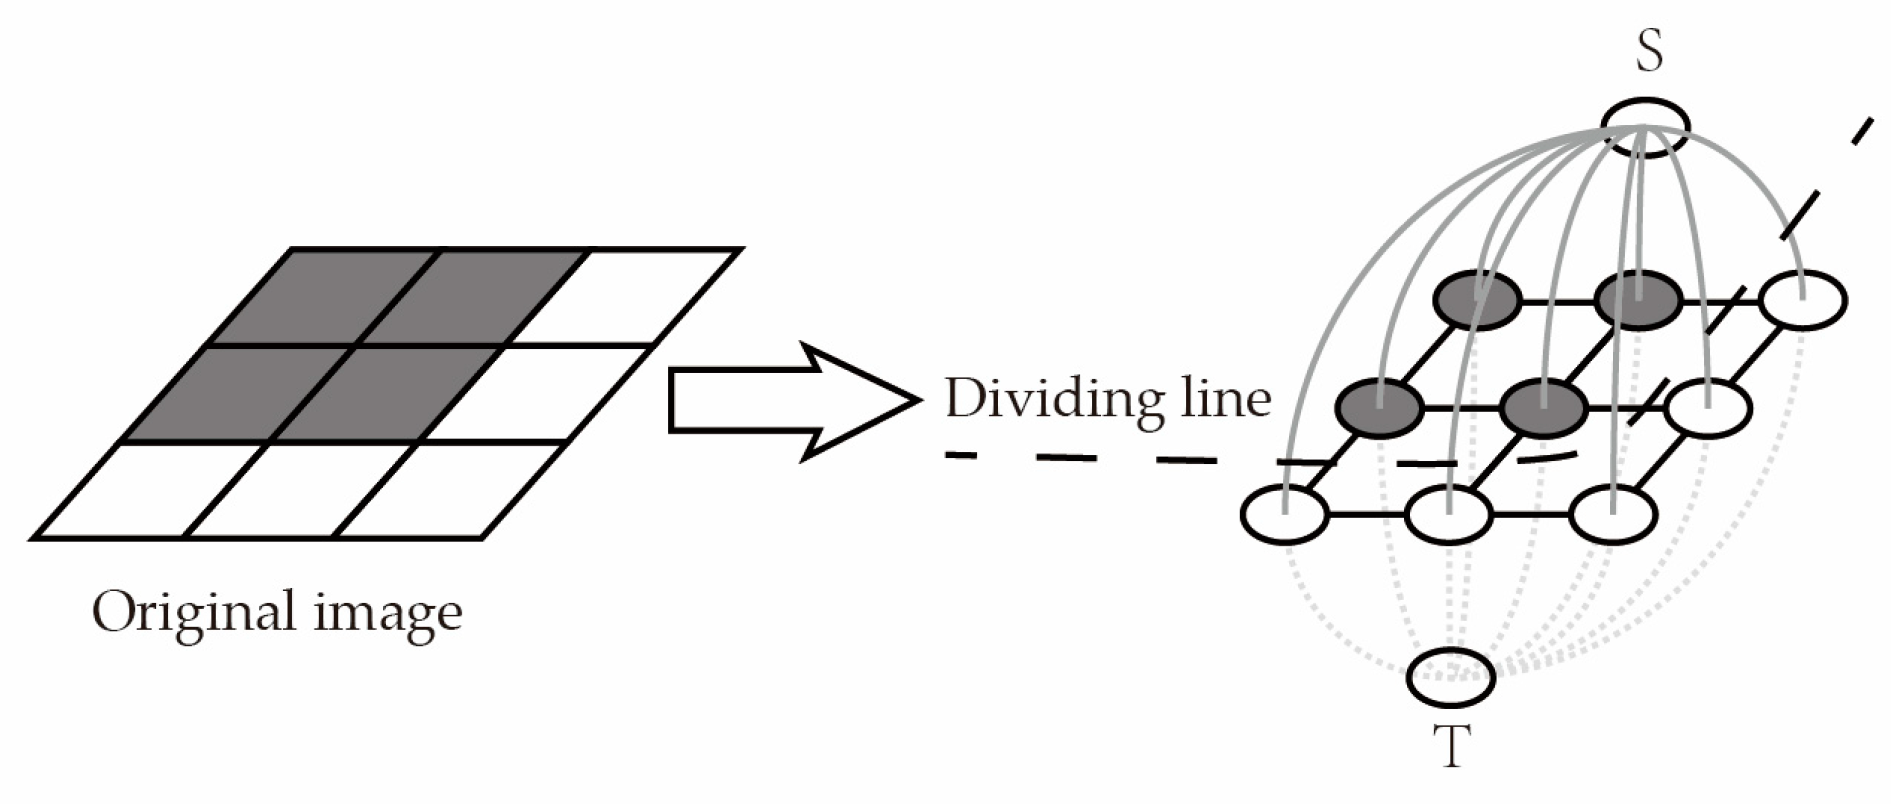
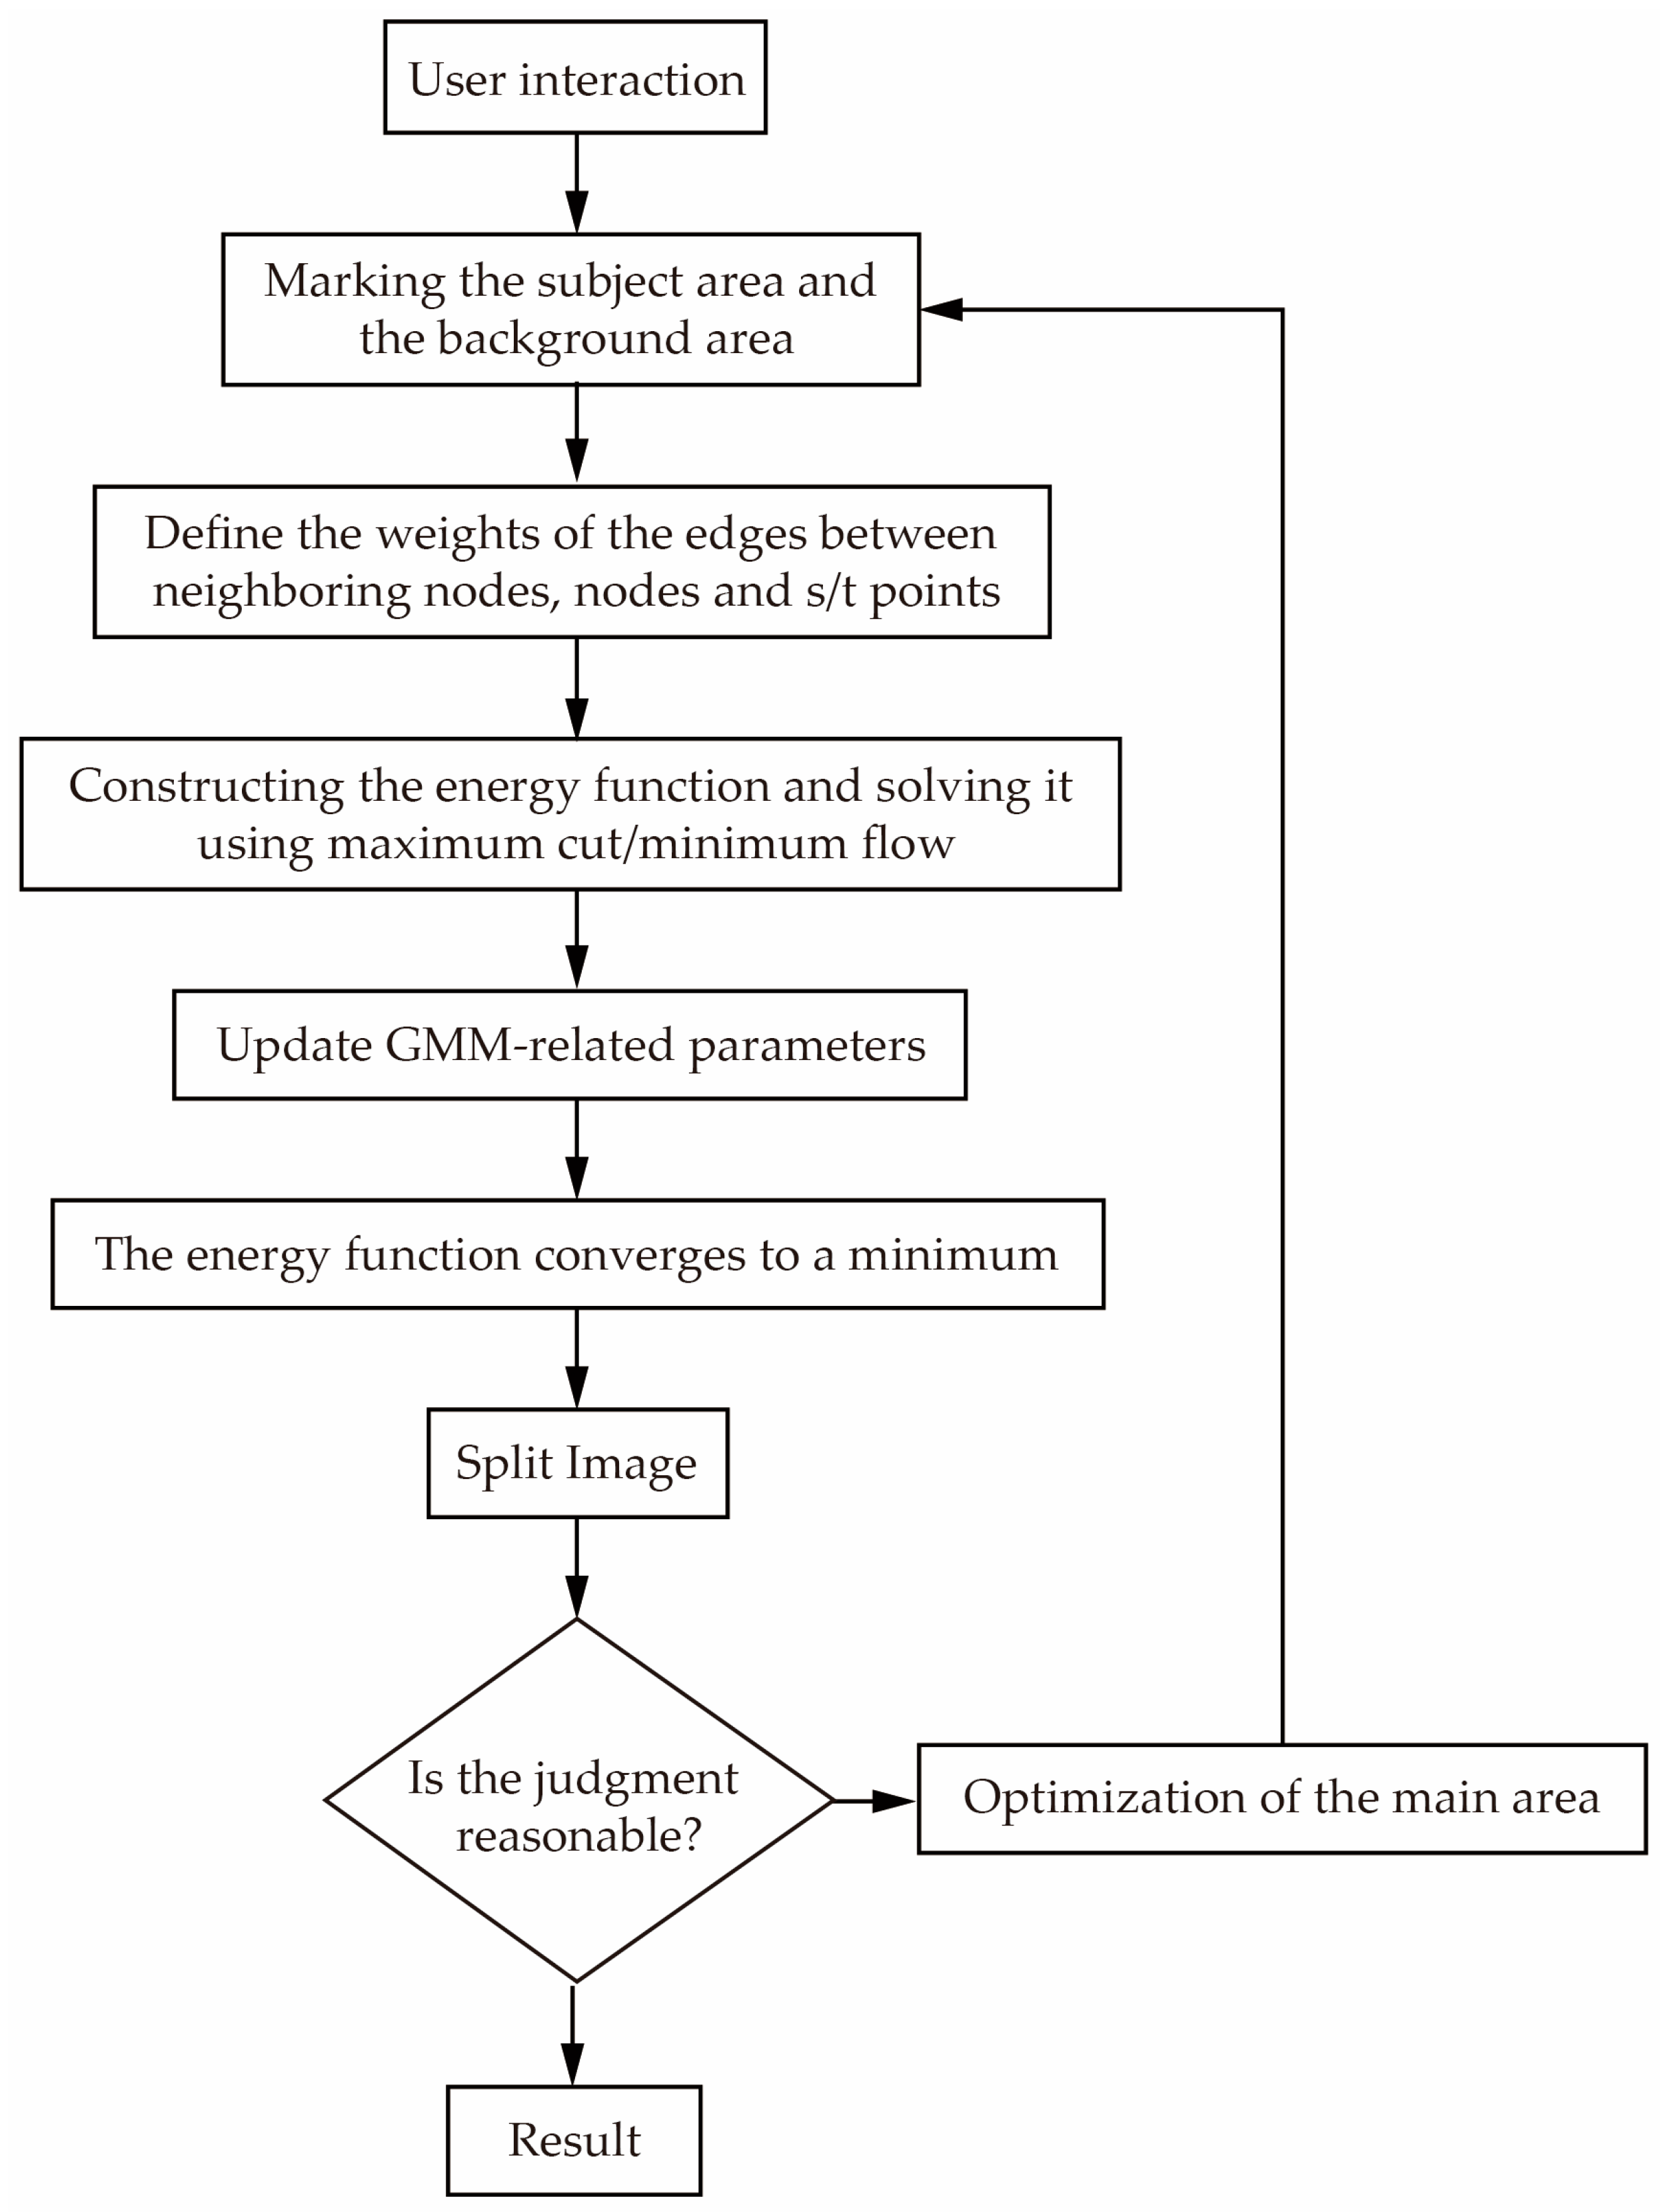
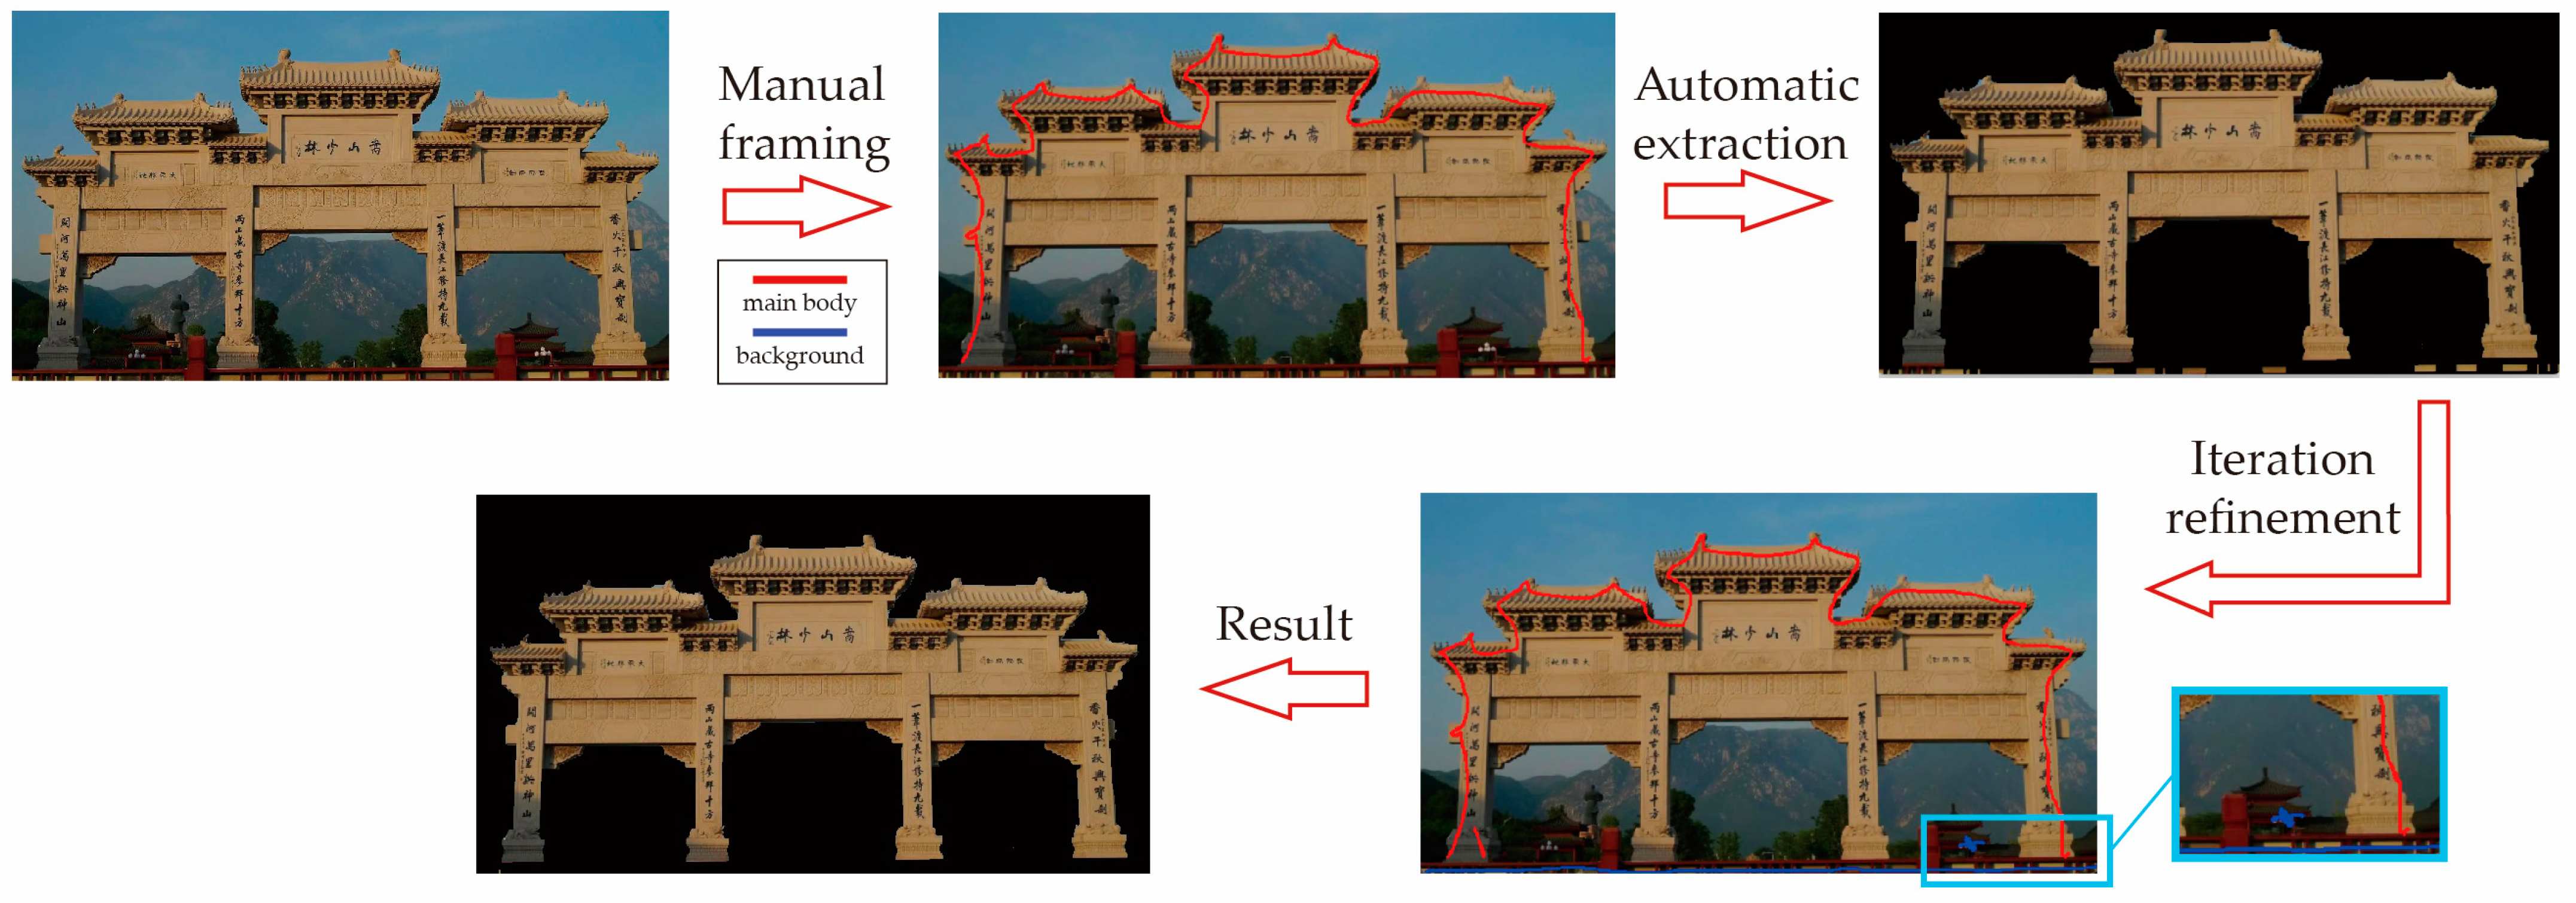
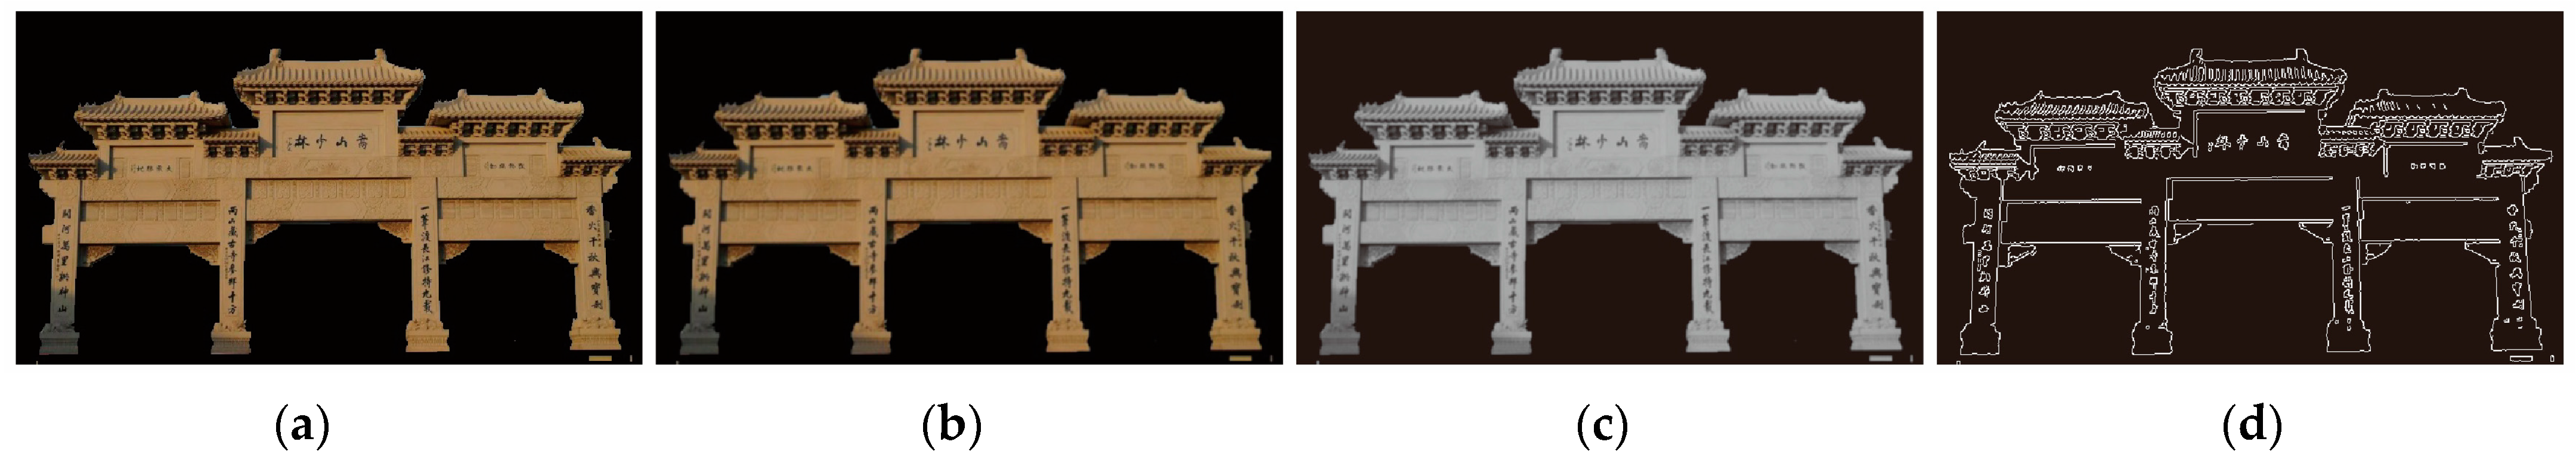
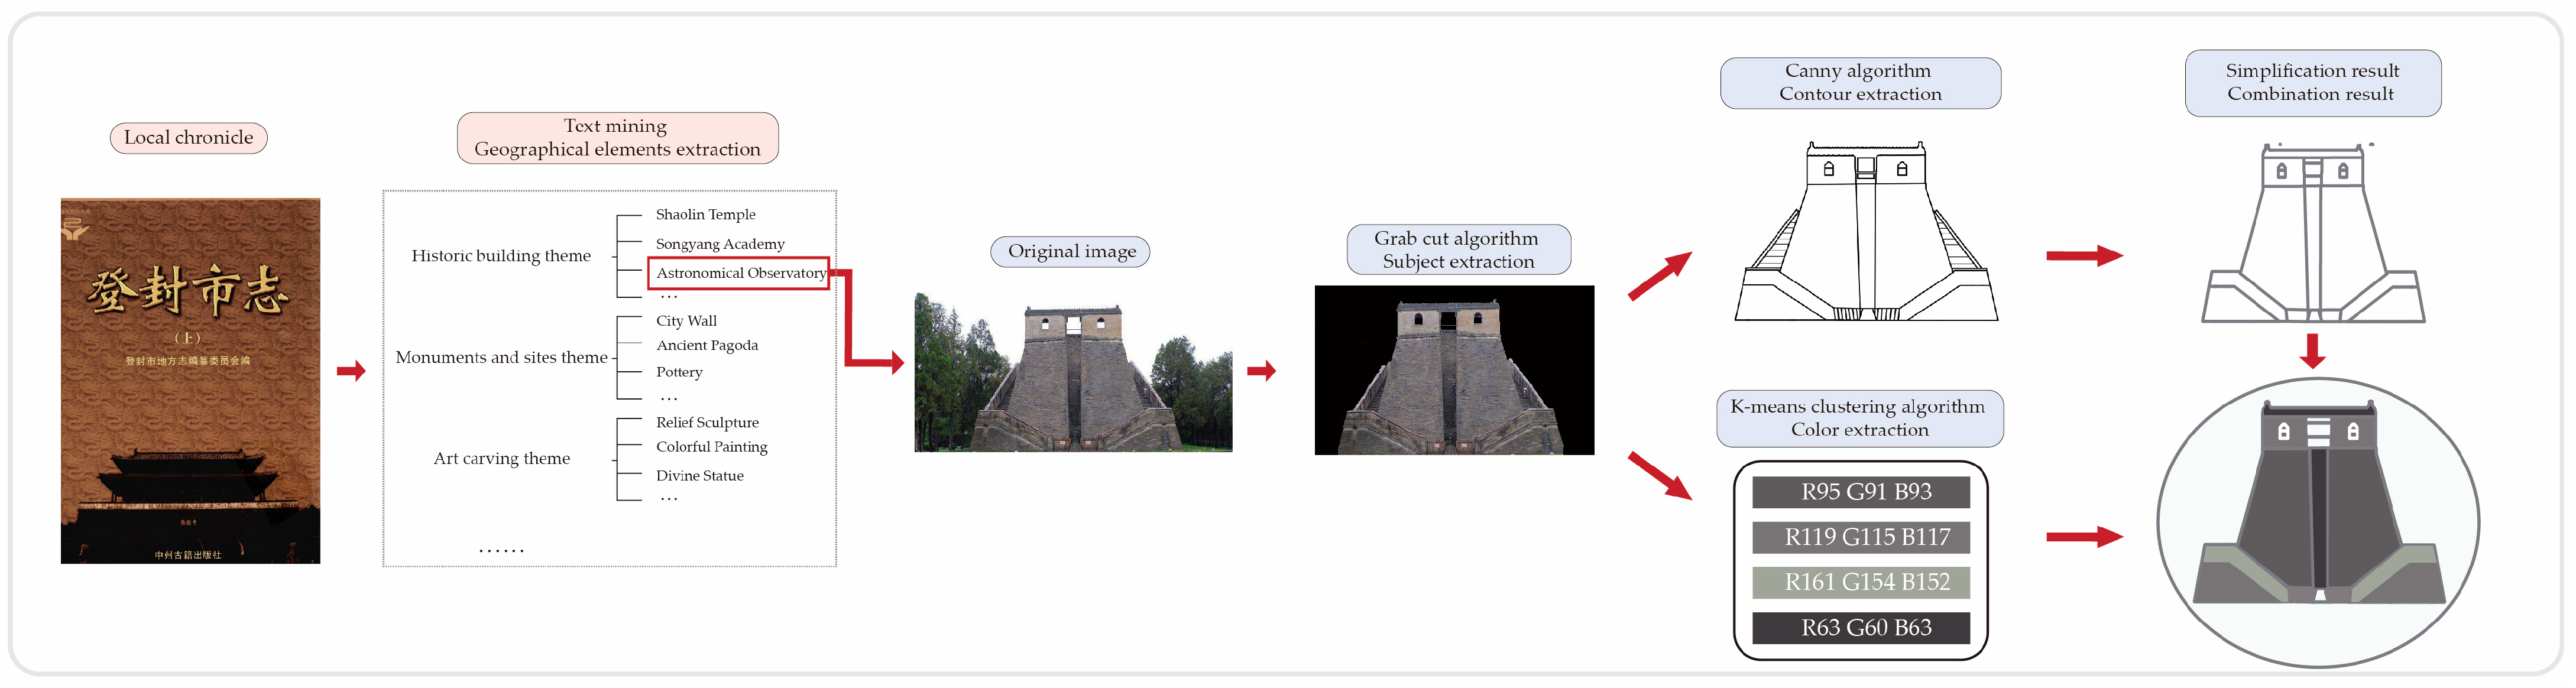
3.2.1. Segmenting the Main Body of the Image Based on GrabCut Algorithm

To effectively reduce excessive interference noise from the background of the feature element image and optimize the extraction of the target feature’s contour and color, we employed the GrabCut algorithm for precise image segmentation, isolating the main body of the feature element.
The GrabCut algorithm is an interactive image segmentation technique based on iterative graph cutting, first proposed by Carsten Rother et al. in 2004. It primarily facilitates the interactive segmentation of RGB color images by using the hybrid Gaussian model and minimizing the energy function [31,32]. This algorithm relates the image segmentation problem to the graph minimum-cut problem by mapping the entire pixel block of the original image into an s–t (foreground–background) network graph (Figure 5).
The method employs artificial auxiliary markers to differentiate the foreground target from the background of the image, employs the Gaussian mixed model (GMM) to model the probability density distributions of the target and background pixels, constructs the Gibbs energy model using this information, and utilizes the maximum flow–minimum-cut theory for an iterative solution to refine the Gaussian mixture model, ensuring the target image is effectively separated from the background.
In the GrabCut algorithm, both foreground and background regions are modeled within the RGB color space. To model these regions, a full covariance GMM with K components is used separately for the foreground and background. Consequently, a vector k = {k1, …, kn, …, kN} is introduced, where kn denotes the Gaussian component to which the nth pixel belongs, with kn ∈ {1, …K}. The Gibbs energy function is composed of a regional term U and a smoothness term V, as defined by the following equation:
E ( α , k , θ , z ) = U ( α , k , θ , z ) + V ( α , z )
Here, k represents the GMM component variable, αn is a constant (either 0 or 1), θ denotes the GMM parameters for color, and zn represents the pixels in the RGB color space.
The regional term U is given by
U α , k , θ , z = n D α n , k n , θ , z n
D α n , k n , θ , z n = l o g p z n α n , k n , θ l o g π α n , k n
where D(·) represents the penalty for assigning the nth pixel to the foreground or background based on the GMM. In this context, p(·) represents the Gaussian probability distribution of pixel zn, given the label αn, Gaussian component kn, and parameters θ. The term π(·) denotes the mixture weight coefficient.
The smoothness term V is expressed as
V ( α , z ) = γ ( m , n ) C   α n α m e x p β z m z n 2
where C denotes pairs of adjacent pixels, and γ and β are constants.
The specific steps of the algorithm implementation are depicted in Figure 6.
In this study, we utilized OpenCV2 and NumPy in Python to execute the algorithm through a step-by-step coding approach. We designed a human–computer interaction interface that allows users to select the target feature, thereby enhancing the actual segmentation results through continuous interaction. Unlike the traditional algorithms that employ a rectangular box for feature selection, our method incorporates a custom brush within the code. This allows users to use the left mouse button to draw a customized area for selecting the primary feature. If the selection is inappropriate, users can use the right mouse button to manually designate it as background. In addition, this paper enabled users to perform multiple divisions of the target area. Users can iteratively refine the segmentation of the primary region based on real-time feedback, continuing until they achieve a satisfactory result, before finalizing the output. This algorithmic approach significantly enhances the autonomy and precision of image segmentation. The specific practical effect is shown in Figure 7.

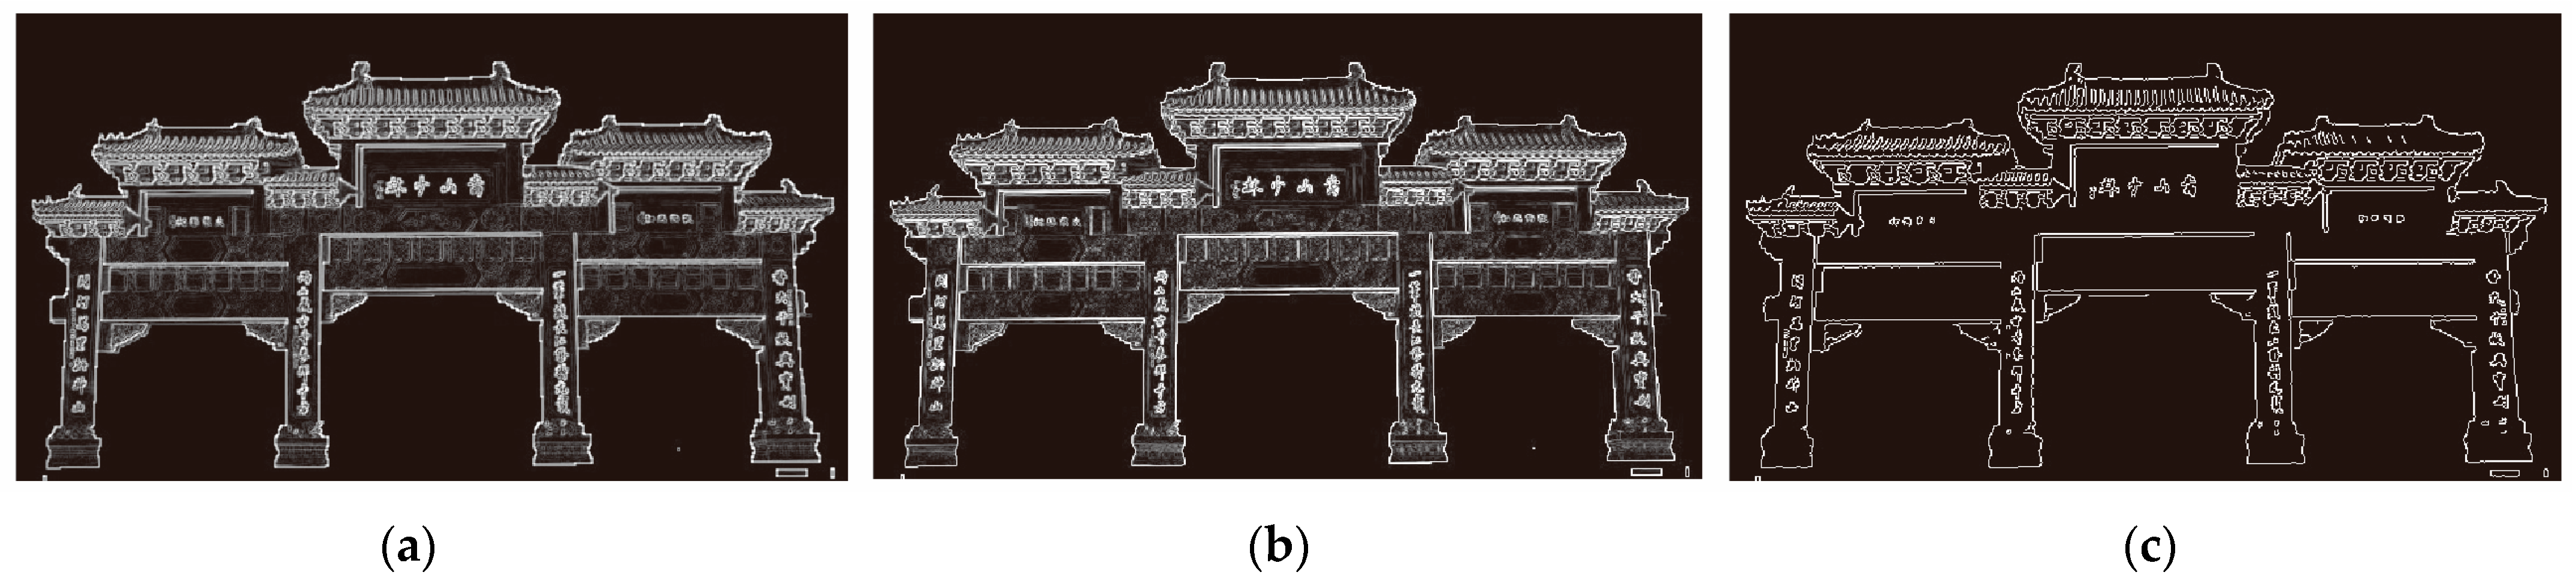
3.2.2. Extracting Image Subject Contour Based on Canny Algorithm

To enhance the clarity and accuracy of feature contours, this study initially compared the contour extraction capabilities of three commonly used edge detection operators: Sobel, Robert, and Canny [33,34]. We used the Shaolin Temple Gate as an illustrative example, and we illustrate the impact of each algorithm on contour extraction in Figure 8.
As shown in the figure, the Canny operator demonstrates superior noise suppression compared to both the Sobel and Roberts operators. It exhibits enhanced contour-edge connectivity, achieving the highest levels of precision and clarity, which significantly minimizes the need for subsequent manual processing. Consequently, we have selected the Canny operator for extracting the contours of the main feature body. The specific steps are as follows:
(1) Removing noise
The Gaussian filter is used to smooth the image, reducing the impact of noise on the accuracy of the edge detection results. For an n × n convolution kernel, the Gaussian function is given as follows:
    G x , y = 1 2 π σ 2 e x p x 2 + y 2 2 σ 2
where x and y denote the position of the pixel in the convolution kernel, and σ denotes the standard deviation of the Gaussian function.
(2) Grayscale conversion and image enhancement
The color image is converted into a grayscale format to facilitate subsequent processing. Image contrast is enhanced using Contrast Limited Adaptive Histogram Equalization (CLAHE). This method involves dividing the image into several small blocks and setting contrast limits to prevent noise amplification that may arise from excessive contrast enhancement in localized areas. Histogram equalization is then performed independently on each block. Finally, bilinear interpolation is applied to smooth the boundaries between these blocks, resulting in a uniformly enhanced image with improved contrast.
(3) Calculating the magnitude and direction of the gradient
The gradients in the X and Y directions are computed for each pixel, utilizing the Sobel operator. The gradient magnitude, denoted as G, which indicates the rate of intensity change at each pixel, is calculated using the following formula:
    G = G x 2 + G y 2
where Gx and Gy are the gradient values of the pixel in the X and Y directions, respectively. The angular direction then indicates the direction of the fastest luminance increase, which is calculated as
      θ = a r c t a n G y G x
(4) Edge refinement and confirmation
After calculating the gradient magnitude and direction, edge refinement is performed using non-maximum suppression. This process entails comparing the gradient magnitude of the current pixel with the magnitudes of neighboring pixels along the gradient direction. If the current pixel exhibits the maximum magnitude, it is classified as an edge point and retained; otherwise, it is discarded.
Following this, a dual threshold algorithm is employed to further enhance edge detection. By establishing high and low thresholds, the pixels in the edge image are categorized into strong edges and weak edges. Strong edges are preserved, as they represent the most significant contours, while weak edges are either connected to strong edges or discarded, based on their magnitude. This method effectively eliminates false edges, ensuring that only genuine edges remain in the final result. The high and low thresholds are dynamically determined by calculating the median value V of the image pixels:
Low threshold:
      T l o w = m a x ( 0 , ( 1.0 W ) × V )
High threshold:
      T h i g h = min ( 255 , ( 1.0 + W ) × V )
The variable w serves as a regulatory factor, usually commonly set to 0.33 or 0.66.
We implemented the algorithm using OpenCV2 in Python. Due to variations in shooting angles and techniques, the extracted contours are often curved, zigzagging, or incomplete, and cannot be directly regarded as the symbols themselves. Therefore, based on the detected edges of the subject, we utilize the SVGWriter library to save each detected edge pixel point, with the final result being saved as an SVG image. This method effectively facilitates the subsequent use of mapping software to customize the outline correction and simplification. The specific practical effect is shown in Figure 9.

3.2.3. Extraction of Image Theme Colors Based on K-Means Clustering Algorithm

Based on the target feature-body extraction, the theme color extraction can avoid the interference of the background color, which is more representative of the feature color extraction. In this study, the K-means clustering algorithm was mainly used to quantify the color in the theme color-extraction part of the image. The K-means algorithm is a distance-based clustering algorithm that adopts the distance as the evaluation index of similarity, i.e., it is assumed that the closer the distance between two objects, the greater their similarity [35]. The algorithm considers that clusters are composed of objects that are close in distance, and therefore takes obtaining compact and independent clusters as the ultimate goal. Since we set the background to black by default when performing feature extraction, we set a certain threshold to reduce the interference of black pixel values when performing data reading.
The procedure is as follows: first, the image is loaded and converted into a NumPy array, followed by filtering to eliminate nearly black pixels. The remaining pixels are visualized within a three-dimensional RGB color space, and clustering is performed using the K-means algorithm. Upon completion of the clustering process, the RGB values of the cluster centers are extracted for subsequent color collection. The clustering results are then displayed again in RGB color space to provide an intuitive representation of the main color distribution within the image. Finally, the RGB values of the clustered colors are combined with the previously extracted symbol bodies, allowing the colors to be applied to the edges and fills of the symbols. This configuration ensures that the map symbols preserve the thematic colors of the features. The main steps of feature color-scheme extraction and the specific practical effects are shown in Figure 10 and Figure 11.

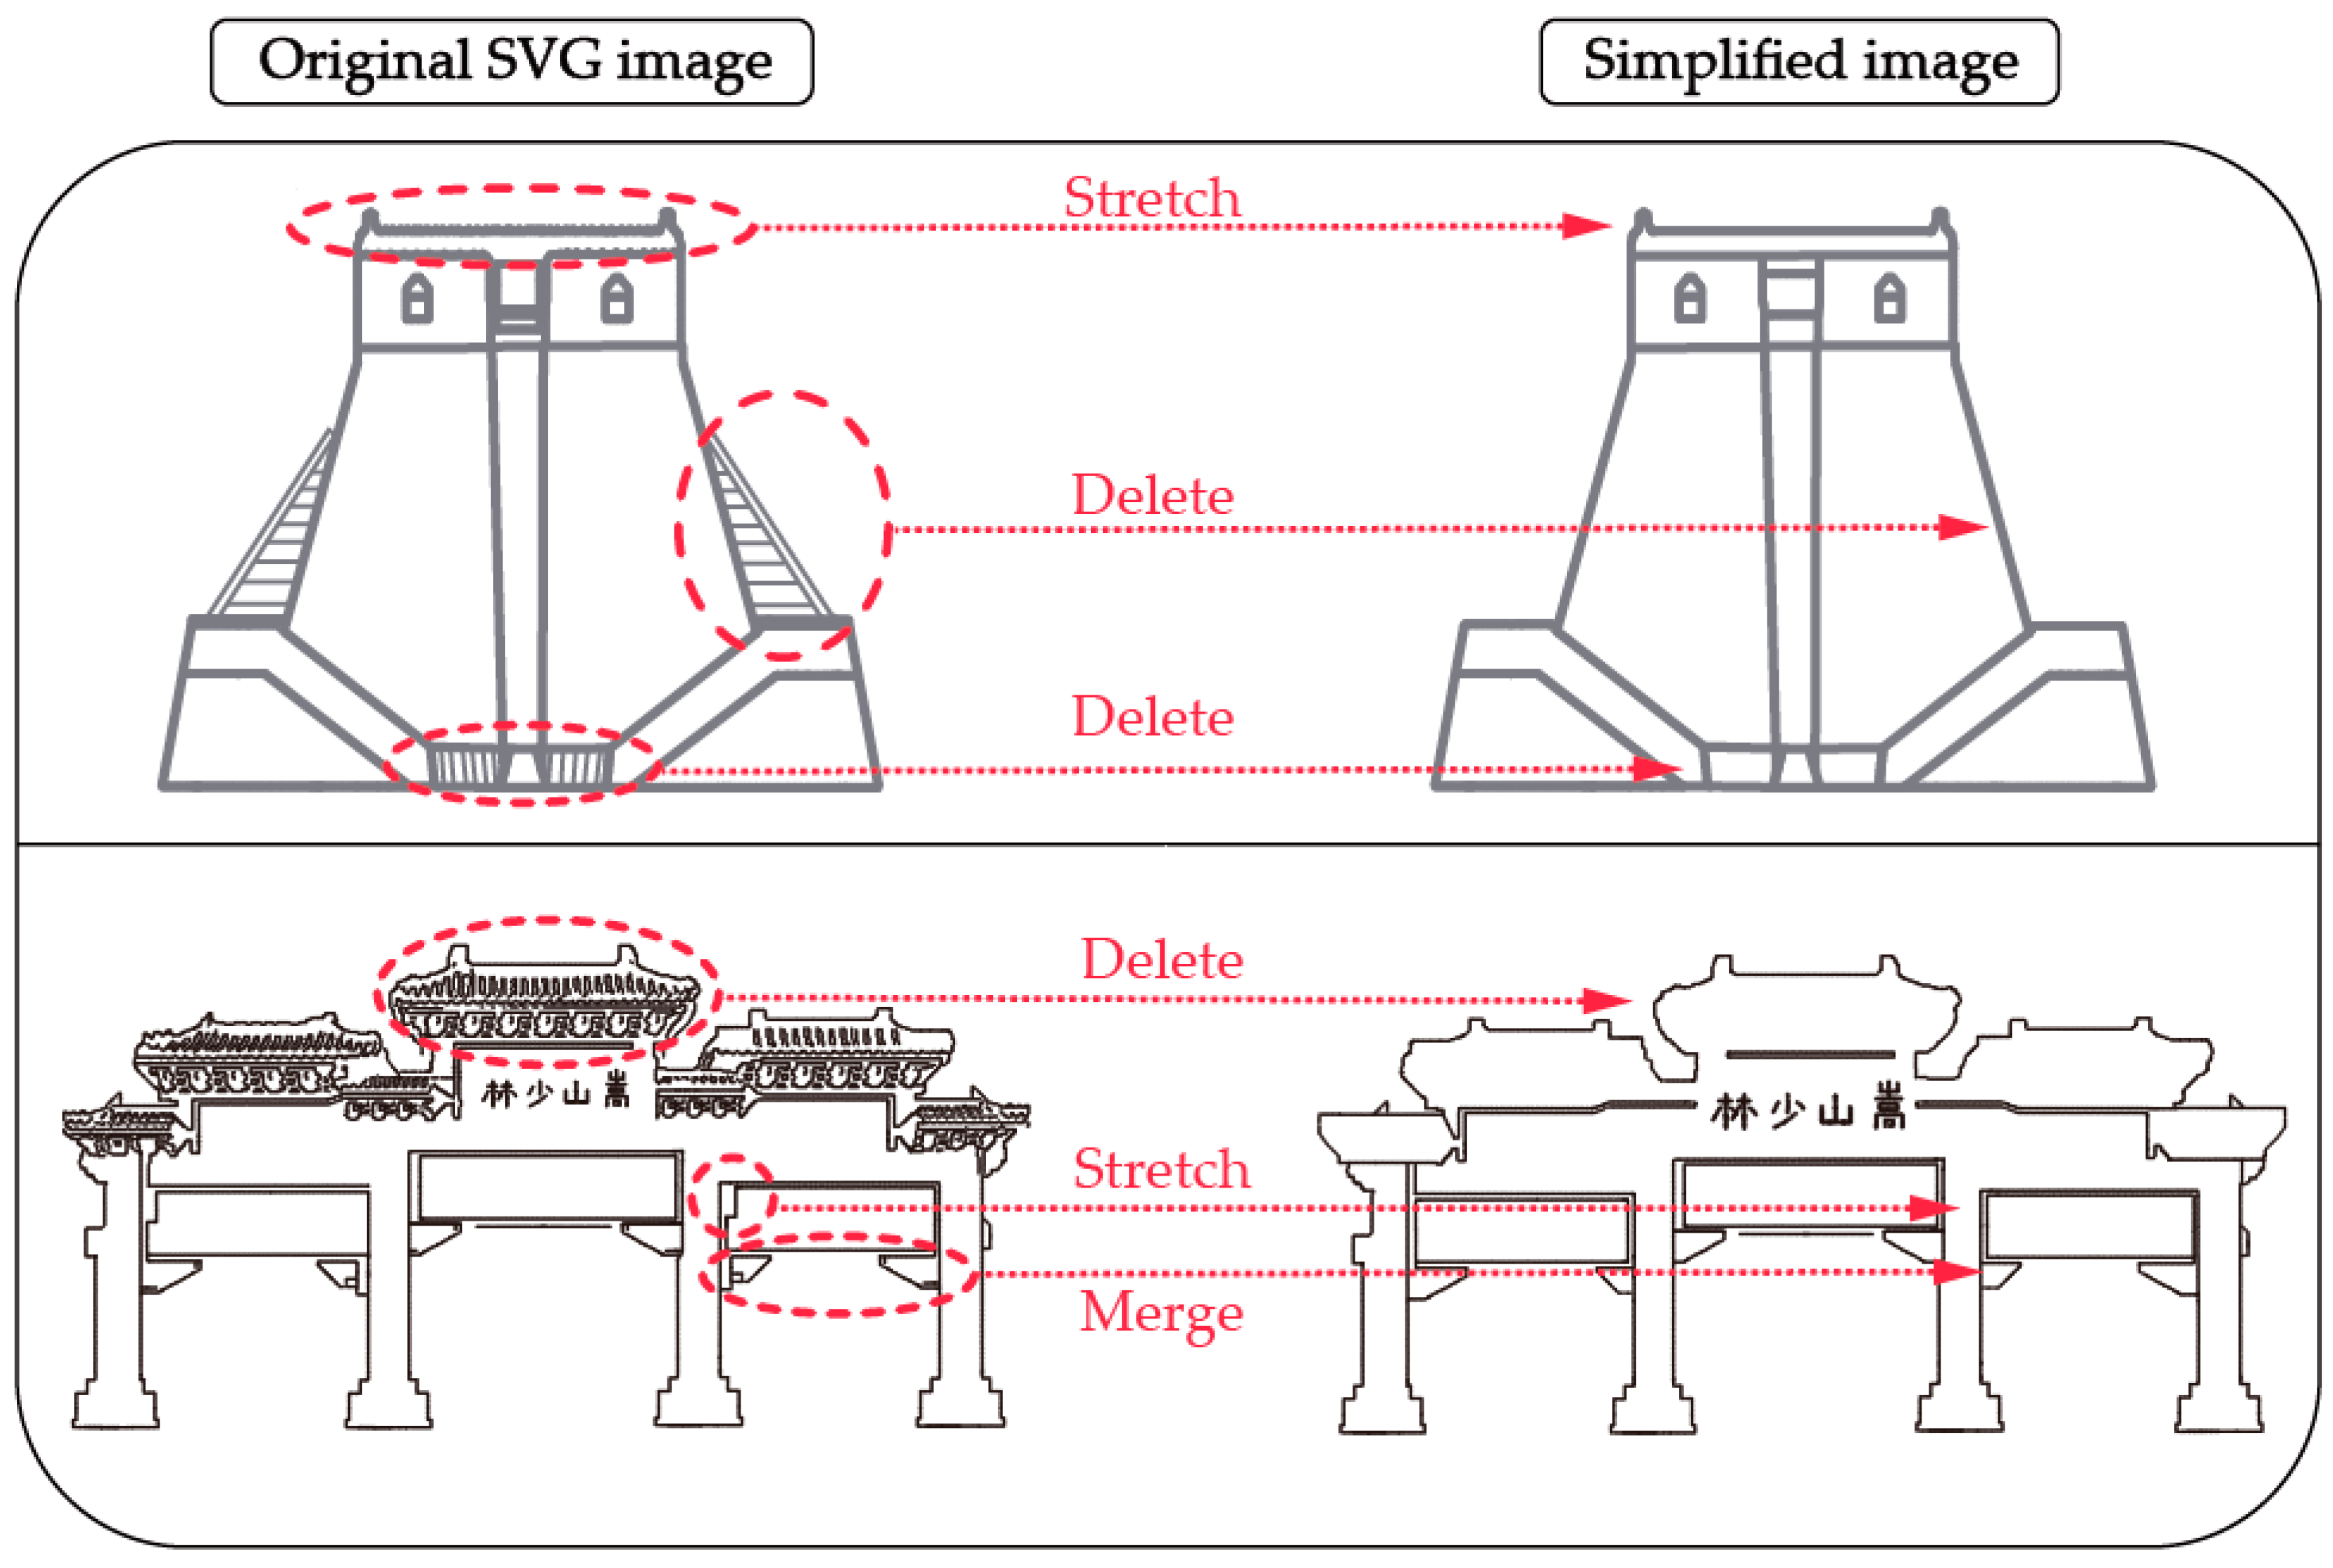
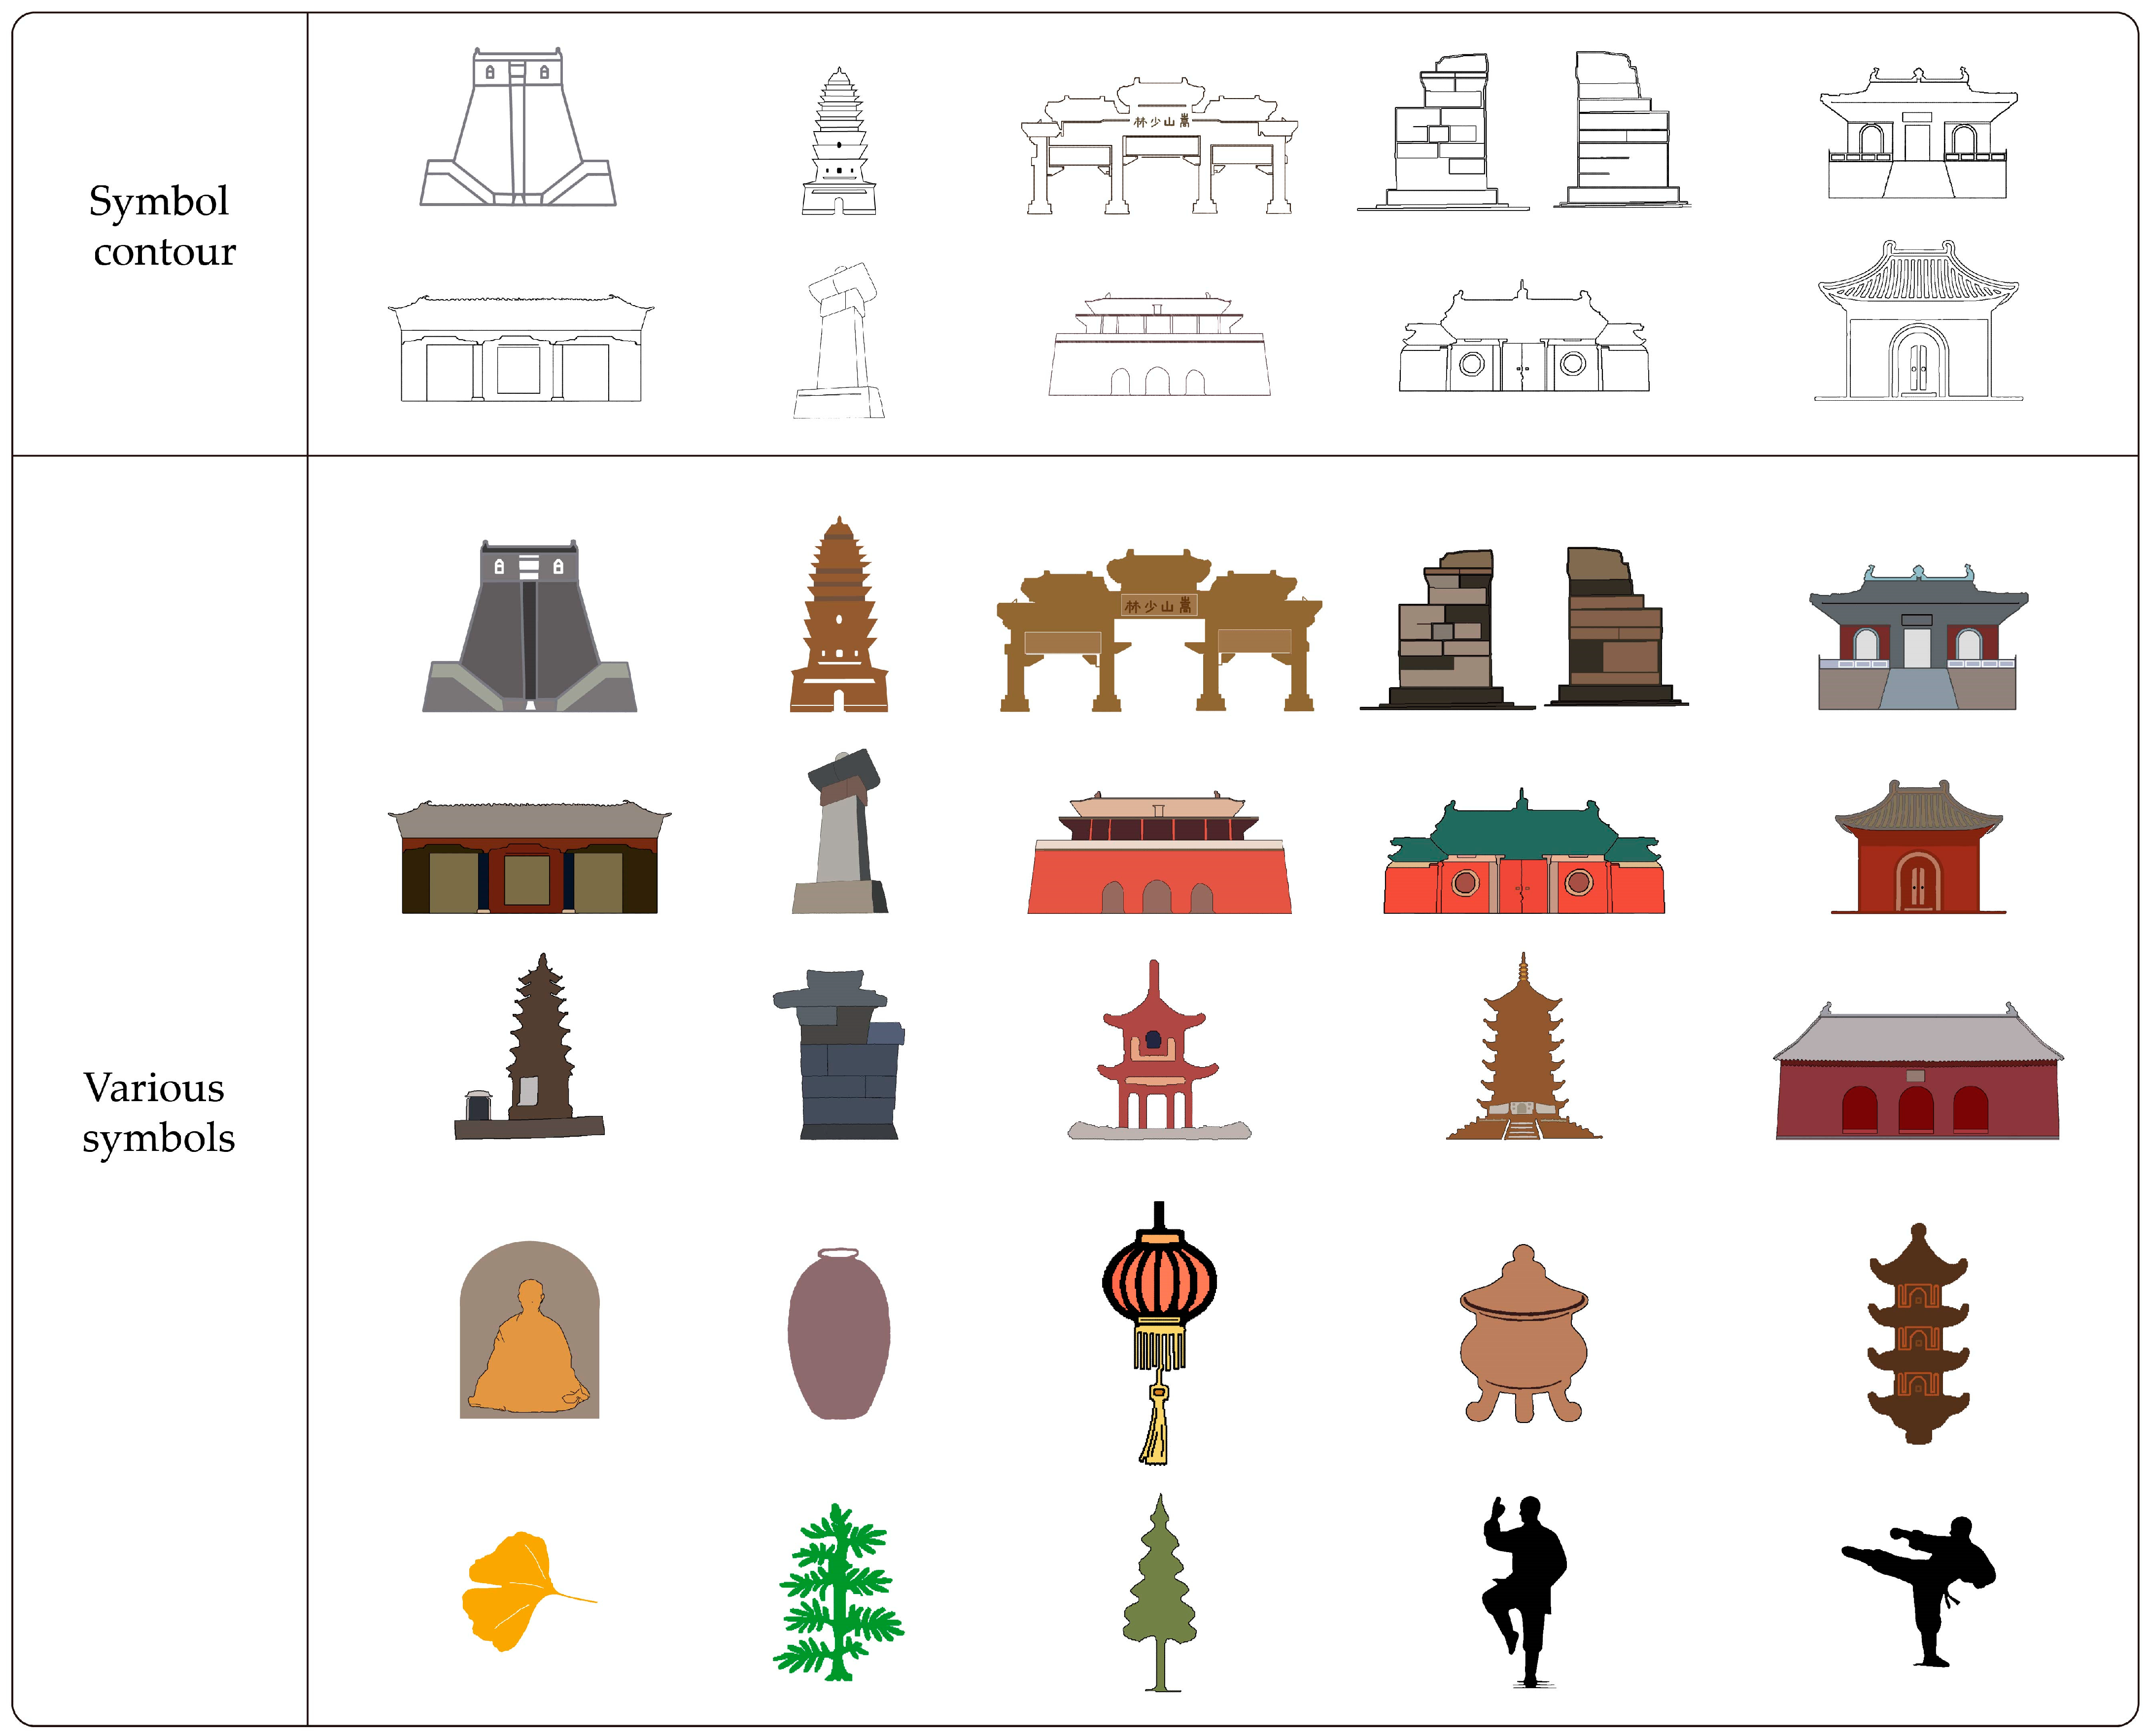
3.2.4. Symbol Simplification Based on Cartographic Generalization Ideas

In the design and use of map symbols, overly complex designs can increase the intricacy of map representations, thereby diminishing the map’s effectiveness in conveying information. This cascading effect may lead to confusion during map interpretation, ultimately hindering users from effectively understanding and analyzing the map. Consequently, simplifying the design concept is essential. This process primarily involves manual revision, utilizing Adobe Illustrator to analyze the previously extracted SVG outlines, and revising and simplifying the symbol outlines according to the principles of symbol simplification. The map symbols discussed in this article are predominantly point symbols; however, due to their complex outline features and the presence of numerous line elements, we employed the shape simplification method derived from element symbols in cartographic generalization during the symbol simplification process [36]. The core principle of shape simplification is to preserve the fundamental characteristics of the symbol while eliminating non-essential elements, thereby streamlining both the internal structure and external outline of the symbol and emphasizing the overall graphic features. In conjunction with relevant academic research and the specific requirements of this study, we have summarized three basic contour feature-simplification methods and provided examples, as illustrated in Table 4 and Figure 12.

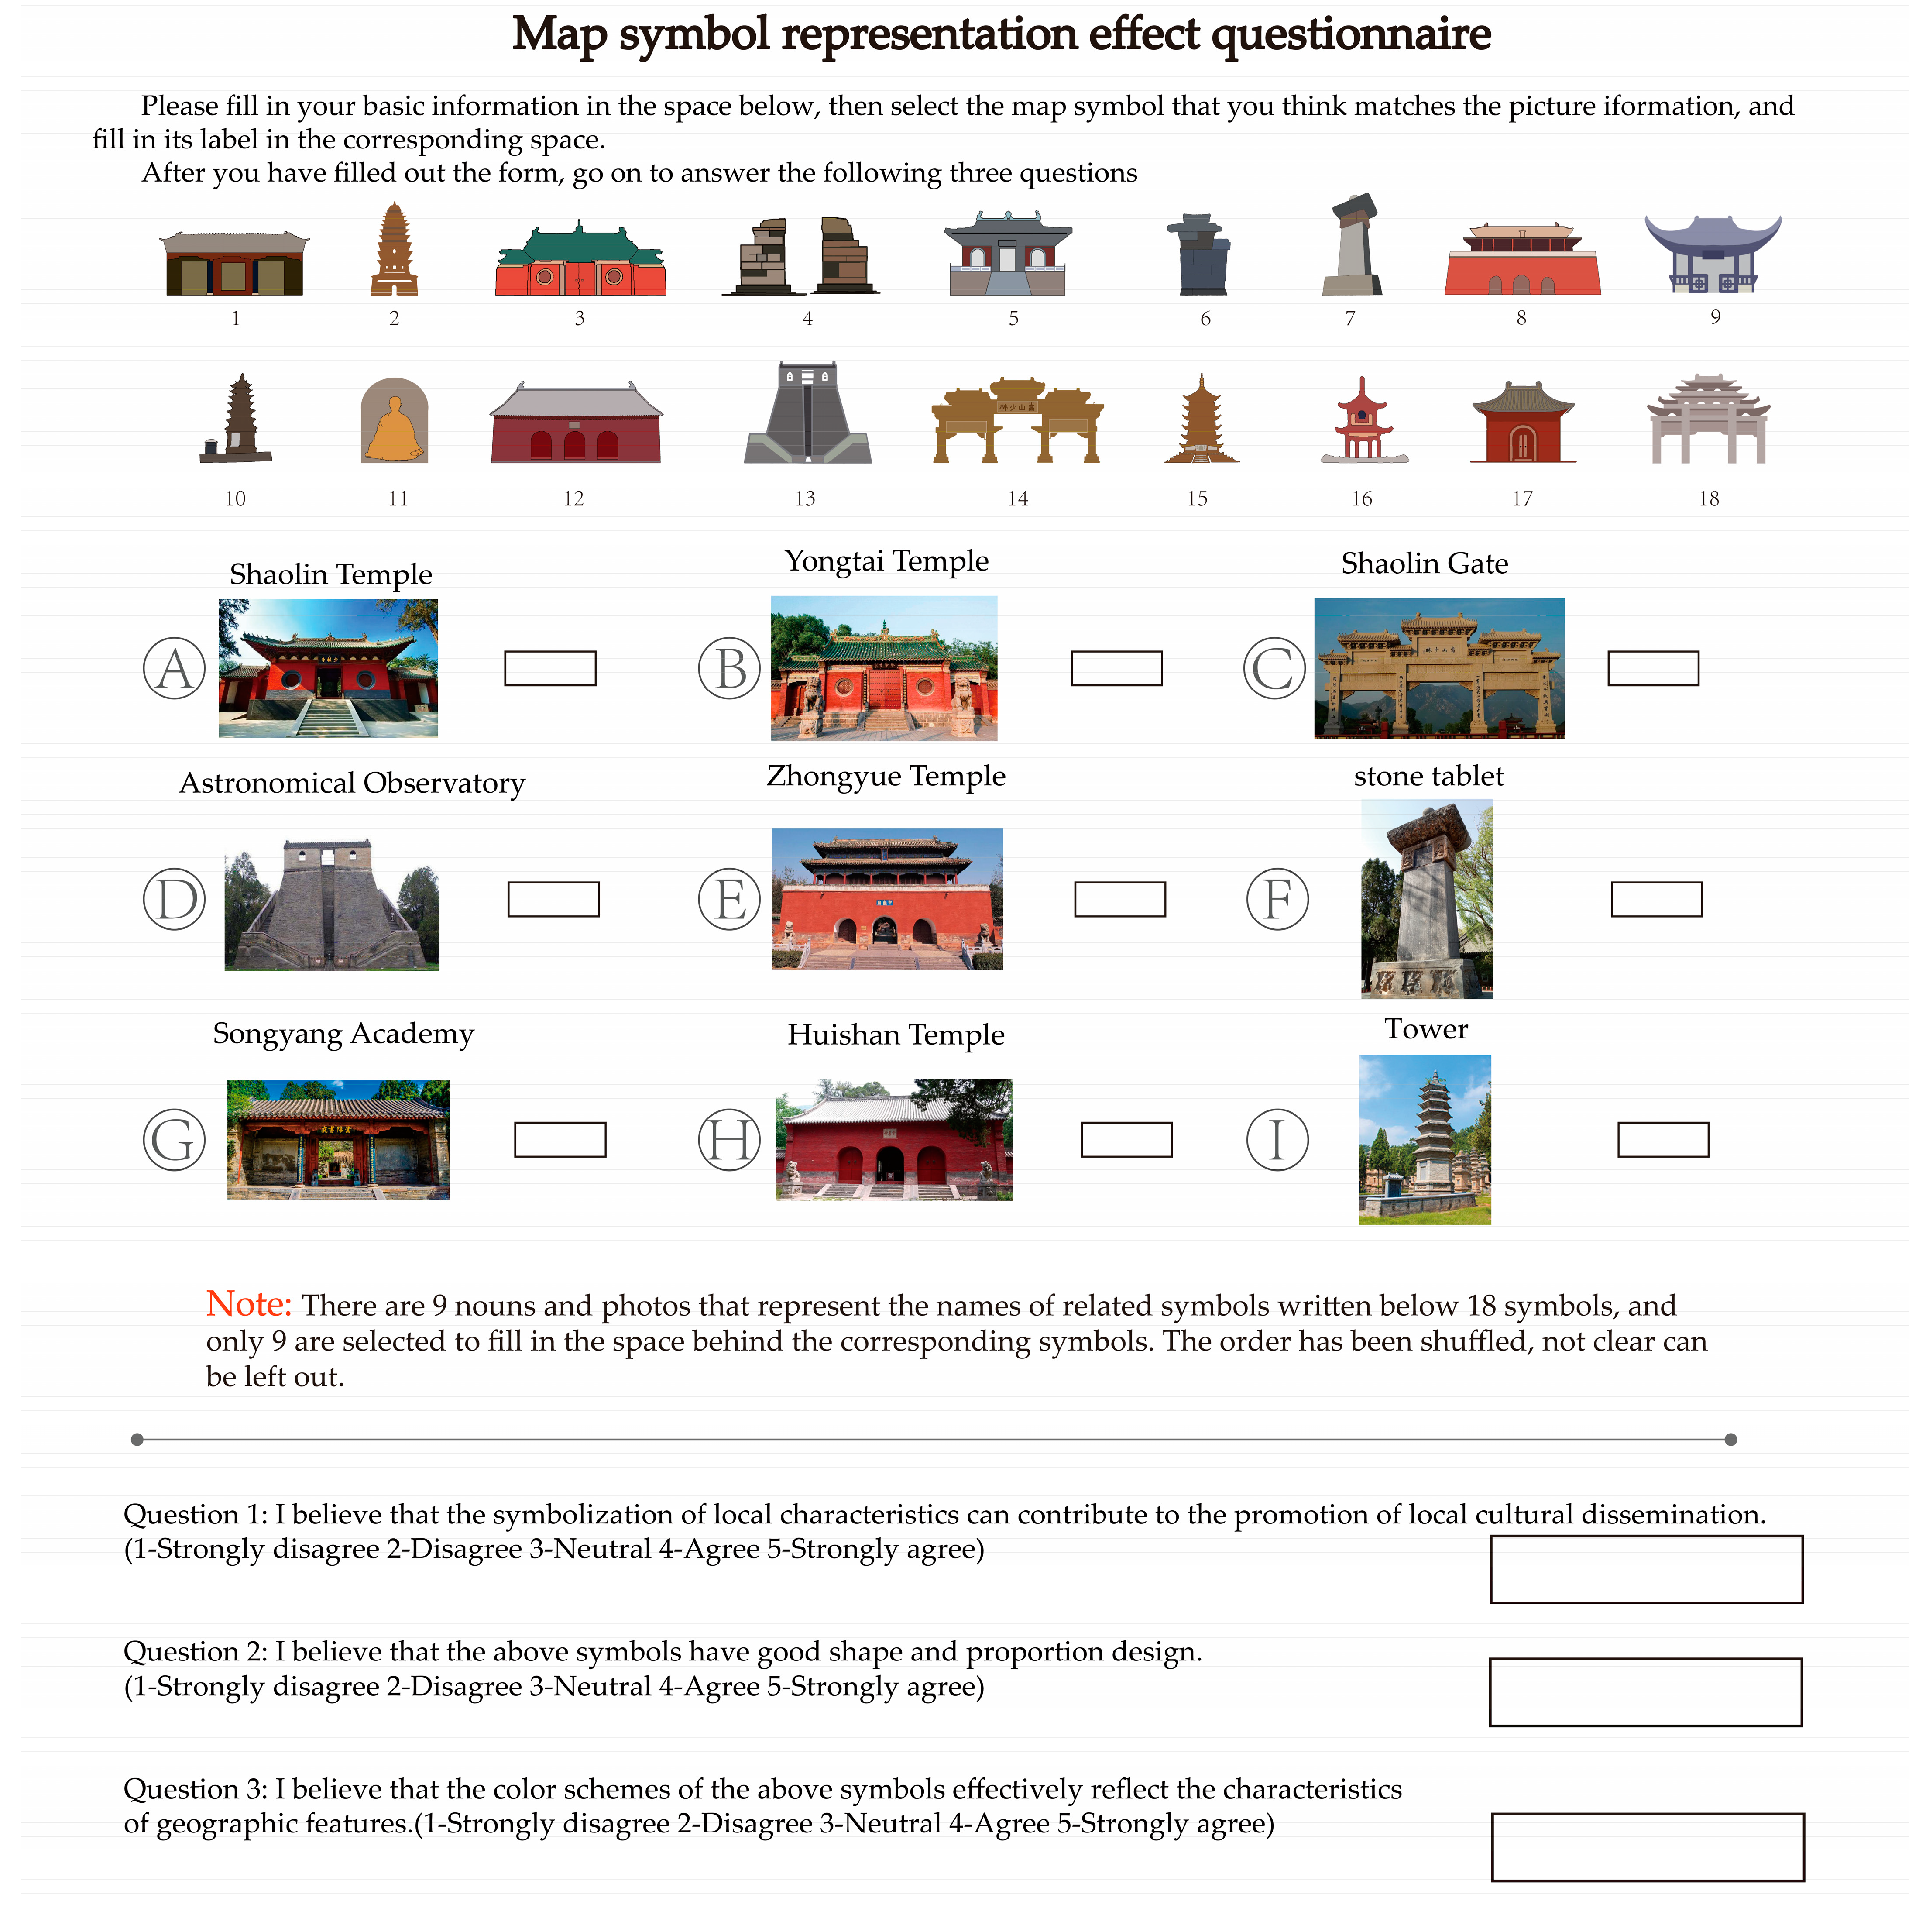
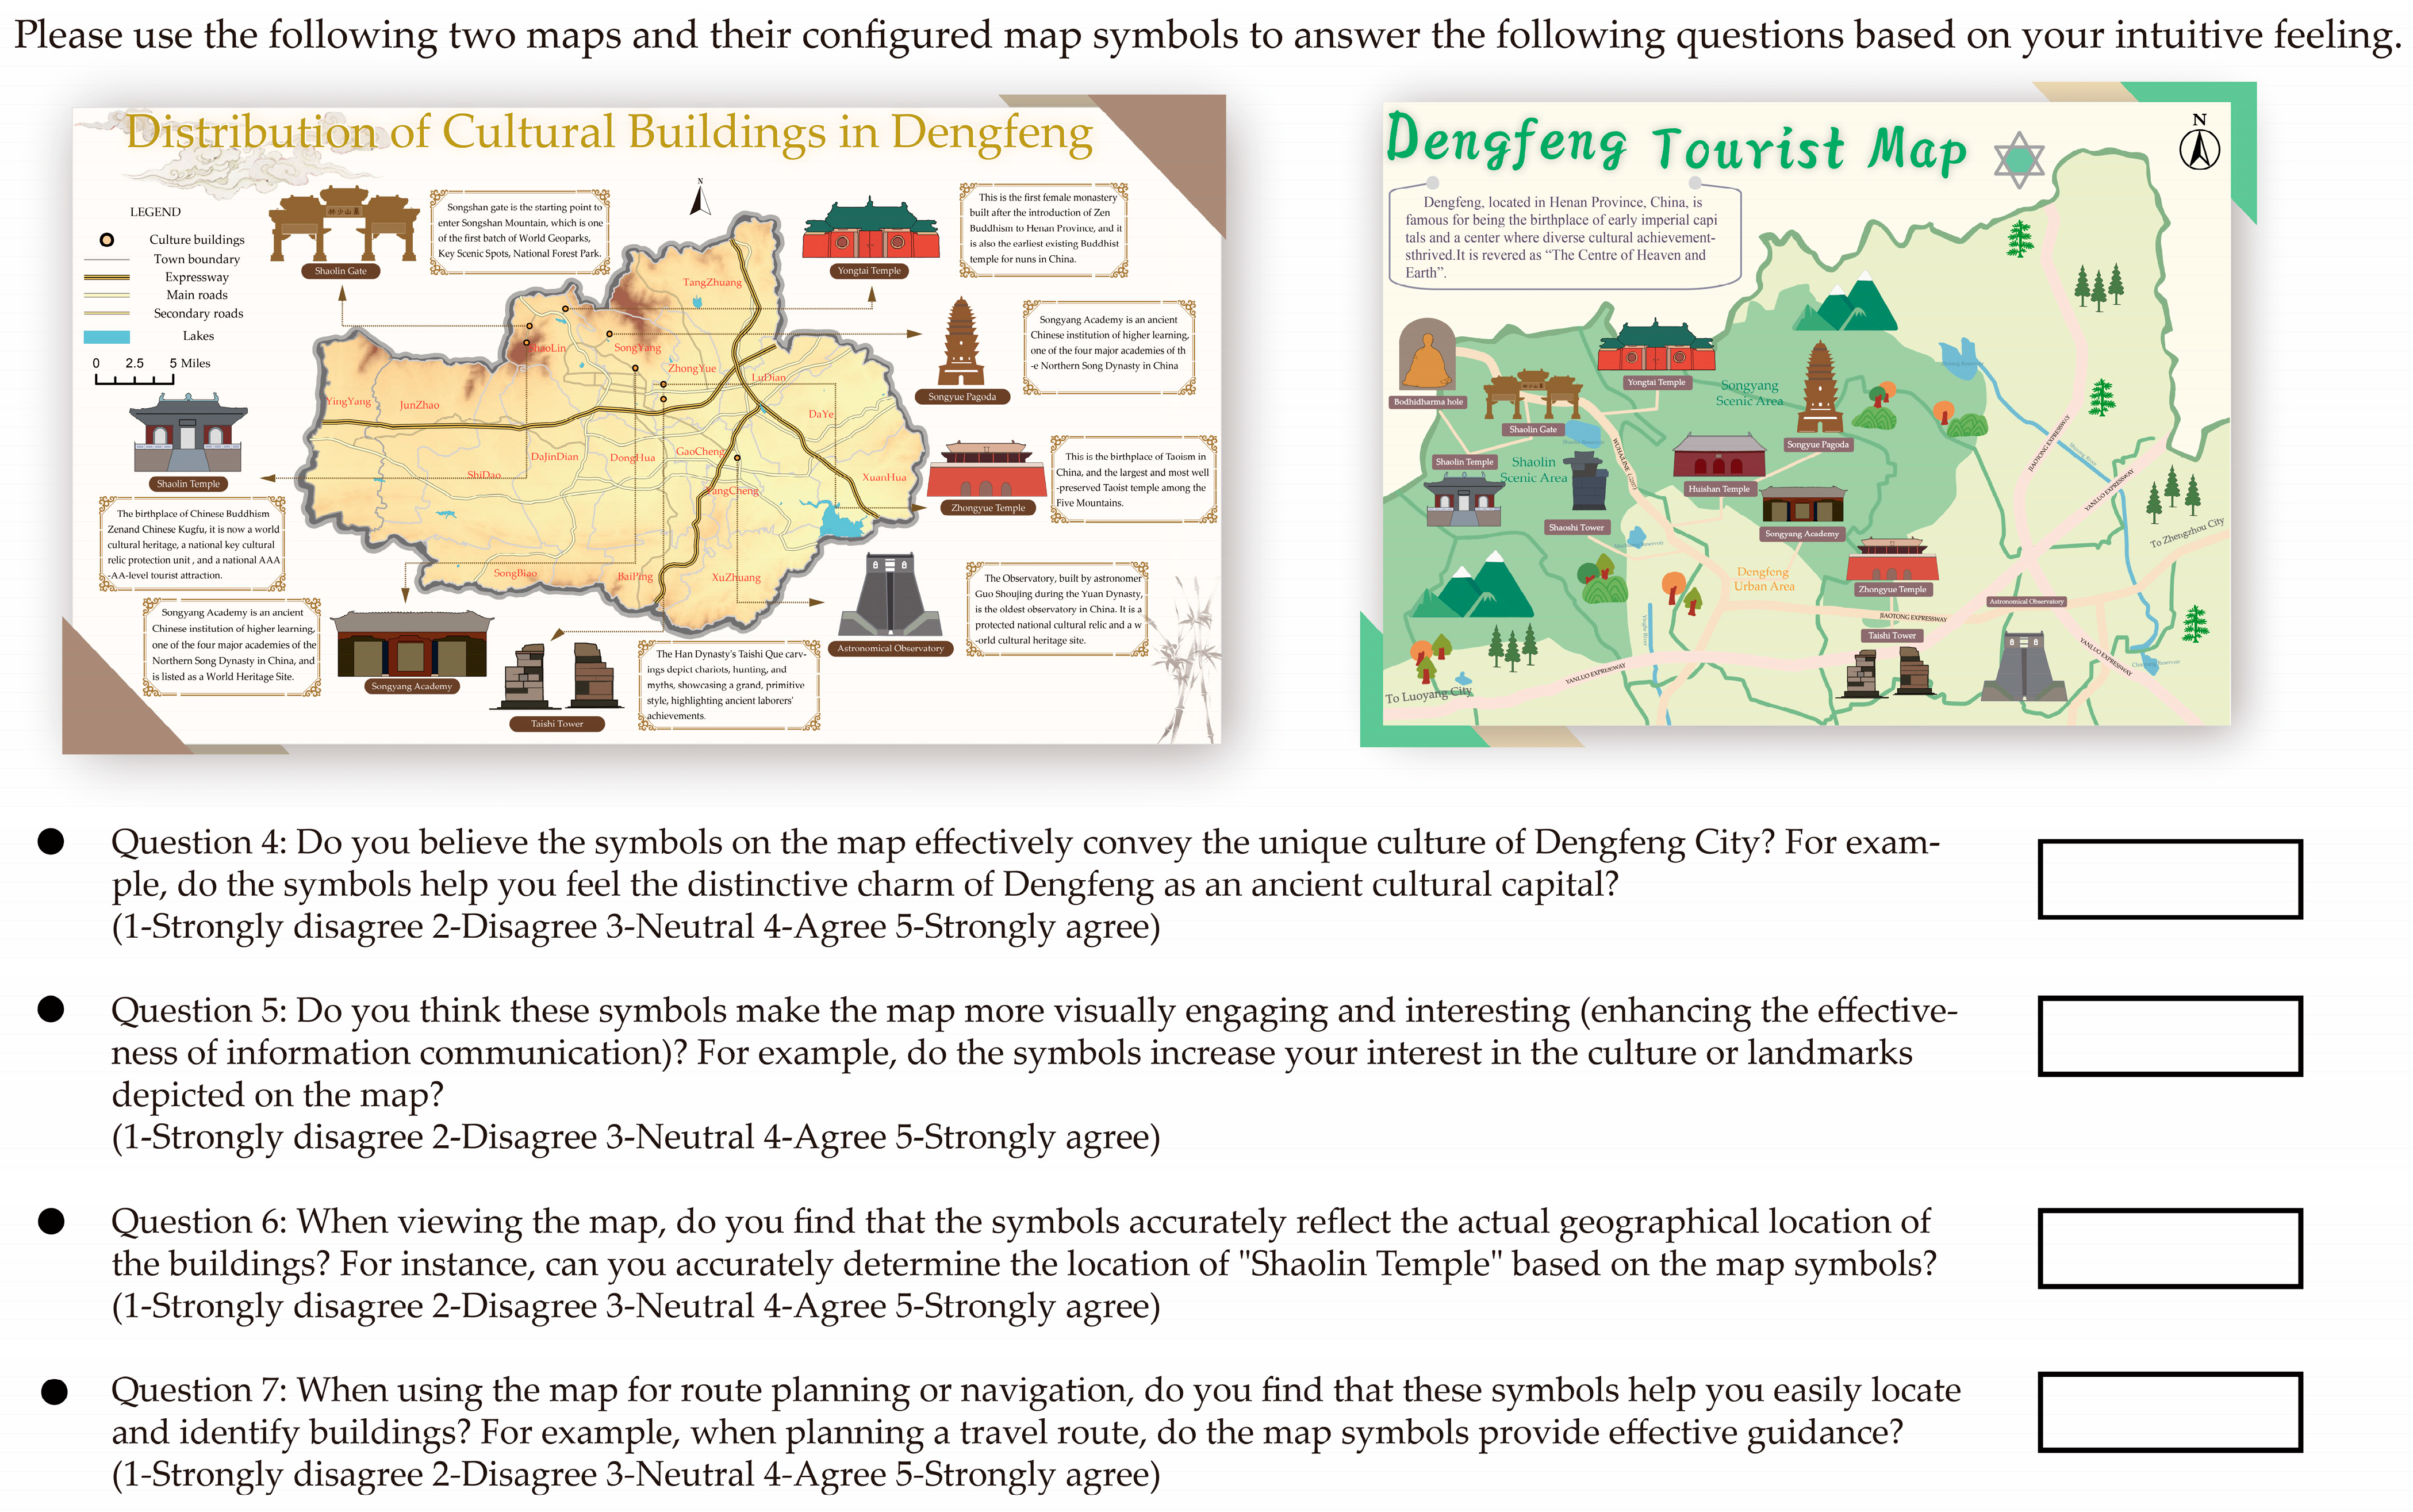
3.2.5. Symbol Evaluation Based on Questionnaire Survey

The ultimate goal of symbol production is to convey information to readers more efficiently; thus, effective evaluation of symbol design outcomes can accurately reflect the success of the design process [37]. However, evaluations of the same symbol often vary among individuals. Consequently, this article employs a questionnaire survey to assess the effectiveness of the map symbols developed herein. We selected a total of 50 participants, comprising undergraduates and graduate students majoring in geosciences, college students with an interest in maps, and several adults who share this interest. The demographics of the participants are illustrated in Figure 13. Among these groups, there were 26 males and 24 females, with ages predominantly ranging from 20 to 40 years, and an average age of 27.5 years. Regarding professional background, 70% of the participants have received education in earth information science. Additionally, 76% of the participants reported using maps frequently or occasionally. Participation in the questionnaire was voluntary, and all interviewees consented to the use of their results for related research in this article. The questionnaire survey (refer to Appendix A Figure A1 and Figure A2) was divided into two sections: a symbol-confusion-judgment experiment and a map-recognition experiment. In the symbol-confusion-judgment experiment, participants will first read the nouns and view images of the nine landmarks provided, after which they will select the map symbols they believe correspond to these landmarks from a set of 18 symbols. This process will assess the effectiveness of the symbols designed in this article in accurately reflecting the external characteristics of the land features. In the map-cognition experiment, after respondents have thoroughly reviewed the map and its symbols, we will employ a Likert scale [38] to gauge their agreement with various statements. This will help evaluate the suitability and expressive effects of the symbols used in the map.

4. Results

After pre-processing the textual information from local chronicles and improving the network graph, a text co-occurrence network consisting of 67 nodes and 547 edges was obtained by removing invalid data. The subsequent results are derived from an analysis of the network elements:
  • The textual information was primarily categorized into three thematic contents: monuments and sites, historical buildings, and literary and artistic carvings.
  • The regional elements characterized by distinct local features predominantly included the Shaolin Temple, Ancient Pagoda, Zhongyue Temple, and so on.
  • The regional elements with strong relevance included the Shaolin Temple and monks, the Shaolin Temple and monasteries, sites and cultural relic protection, and so on.
After clarifying the object of symbol visualization expression, the exploration of the map-symbol-design method was carried out regarding the textual co-occurrence network map and the most characteristic regional cultural representatives of Dengfeng City. Using Songshan culture, stargazing culture, and ancient pagoda culture as examples, we identified three representative features: the Shaolin Temple Gate, Stargazing Terrace, and Shaolin Temple Pagoda. The design process and experimental results of their corresponding map symbols are elaborated in detail (Figure 14 and Figure 15). Additionally, more symbol design examples are shown in Figure 16.
Then, we symbolized various types of feature elements and comprehensively applied the resulting map symbols to the thematic map of cultural architecture distribution in Dengfeng, as well as to the tourism map of Dengfeng. This application further illustrates the information expression effect of the symbols, as shown in Figure 17 and Figure 18. Taking the thematic map of cultural buildings as an example, the symbols, as part of the map annotation, intuitively convey attribute information such as shape structure and color configuration of the featured elements. The integration of text and symbols significantly aids readers in visually comprehending the local cultural buildings, thereby enriching their understanding of the local culture. Furthermore, the tourism map is uniquely designed as a thematic map focused on local tourists and tourism information, distinguishing it from conventional navigation roadmaps, which prioritize precision and information density. In addition to ensuring map accuracy, the schematic representation assumes a more prominent role. In the tourism map, we will utilize tourism objects as the primary graphic elements, while incorporating landmarks, main roads, and rivers as essential geographical features. This approach can significantly enhance the intuitiveness and appeal of tourist maps, facilitating easier route planning for travelers. And in the abstract and symbolic map expression, the more complex image symbols can more effectively express the external characteristics of the features, to help tourists choose the tour route. From the results, the symbols designed in this paper can be well adapted to the two map types and effectively convey the regional cultural information.
In terms of final symbol evaluation, after all respondents completed the questionnaire, we systematically collected and organized their responses, as shown in Table 5. Furthermore, we compiled the results into visual charts to enhance clarity of interpretation.
In the symbol-confusion experiment section, we employed a confusion matrix and a histogram to present the results (Figure 19). The diagonal elements of the matrix indicate the number of respondents who accurately identified the ground objects, while the accompanying histogram clearly depicts the respondents’ accuracy in selecting each symbol. The findings reveal that the recognition accuracy for all nine ground-feature elements involved in the study is above 80%, suggesting that the symbols developed in this article effectively represent the characteristics of these ground features and that the symbol design is sound.
In the map-cognition experiment, we presented the results in the form of a stacked column chart. This chart effectively illustrates the percentage of respondents’ answers to each question, utilizing different colors to differentiate between the responses. Notably, none of the respondents selected option 1—Strongly disagree; thus, this option is absent from the statistical chart (Figure 20). The data indicate that the percentage of positive responses (including options 4 and 5) across all questions exceeds 84%. The maximum percentage of positive responses is 88%, while the minimum is 84%, and the median stands at 86%. Ultimately, a comprehensive analysis of these evaluation results confirms that the map symbols designed in this article effectively convey the characteristics of the represented features, and their adaptability on the map has been positively recognized by users. We conclude that the overall evaluation of the map symbols designed in this article is favorable.

5. Discussion

In the realm of text mining, we select local chronicles with distinct local characteristics as our source of textual information. This choice ensures a certain degree of authenticity, comprehensiveness, and objectivity in the text data. In contrast to the prevalent online digital footprint information, the use of local chronicles offers two notable advantages: firstly, data from microblogging, travelogues, or shopping evaluations can be influenced by users’ immediate emotions, preferences, personal experiences, and even the prevailing atmosphere of public opinion on the internet. Consequently, this can lead to a lack of stability and objectivity in uncovering local cultural characteristics. Secondly, most publishers of digital footprint information tend to focus on younger demographics, resulting in fragmented information due to data diversion across various online platforms. In comparison, local chronicles, which are field-researched, edited, organized, and uniformly reviewed by professionals, provide a more comprehensive and objective source of information. In this study, we employ text mining and the construction of a word co-occurrence network based on the Dengfeng City Chronicle to elucidate the regional characteristics and related elements of Dengfeng City. This approach aims to facilitate the rapid identification of local features and provide targets for the subsequent phase of symbolization of regional elements. By utilizing local chronicles as a source of textual information, this research distinguishes itself from studies that rely on social network data. It circumvents the problems of subjective bias, group bias, and information fragmentation that are usually inherent in social network data.
In examining the graphical representation of the symbols, a comparison of current mainstream digital network maps, the old map symbols, and the symbols developed in this paper (Figure 21), it can be seen that the symbols of regional culture in the digital network maps are often simple combinations of basic graphics. This design concept sacrifices the information-carrying capacity of the symbols for the pursuit of simplicity. The understanding of the symbols requires a certain amount of public knowledge, which leads to a weakening of the information dissemination effect of the symbols. This symbol often cannot reflect the characteristics of the object itself, only as a point on the map to indicate the location. In contrast, regional cultural symbols on old maps are more personalized and realistic. Restricted by the concept of mapping and technical means, the mapping method of old maps is more like a kind of landscape painting, which combines the mapper’s ideological concepts and painting techniques, while retaining the main features of the characteristics of a specific period, fully interpreting the artistry and informativeness of the symbols. However, due to the preservation of old maps and the differences between old and modern cultures, the existing stock and practicality of regional cultural map symbols do not meet the current demands for diversified mapping. The symbol design method based on computer graphics proposed in this paper effectively depicts the main features of elements in detail, allowing map readers to recognize these features even without prior knowledge, thereby enhancing the guiding role of the symbols in thematic maps.

6. Conclusions

This study utilized text-mining and image-processing technologies to investigate and propose solutions to two primary issues: how to accurately extract the characteristic elements of a region and how to implement targeted map symbol design.
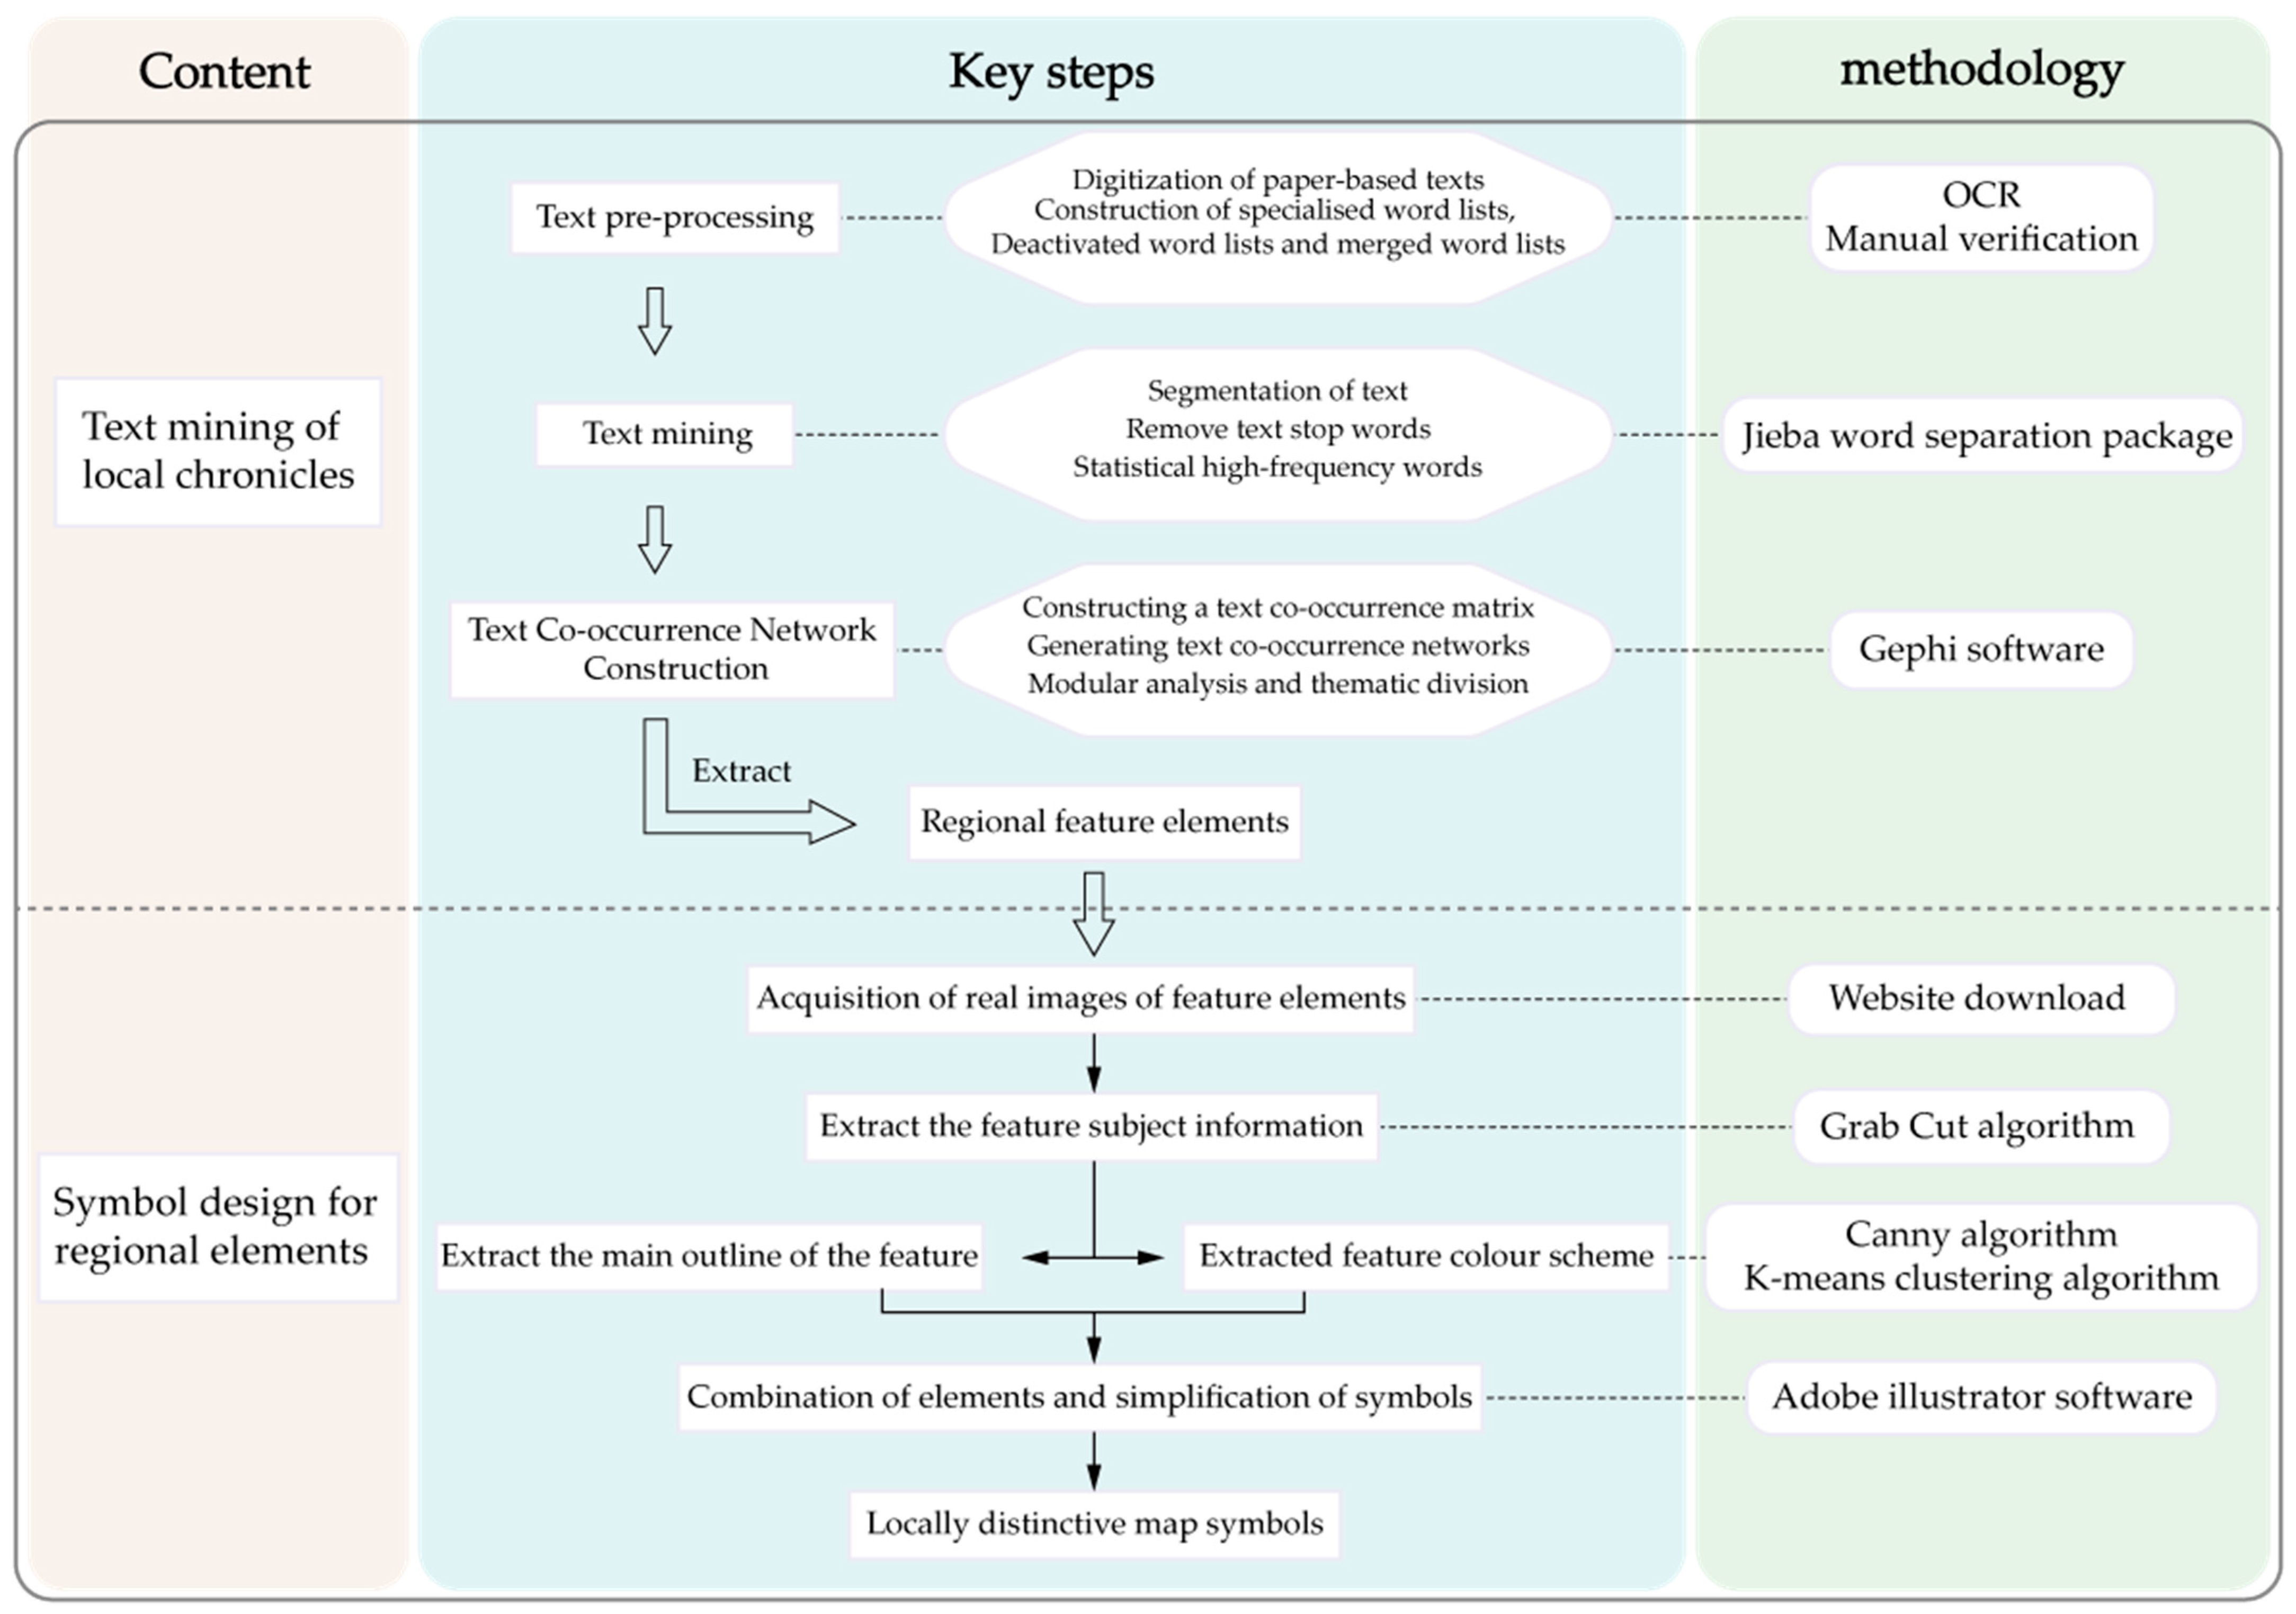
  • In terms of regional-element extraction, this study took local chronicles as the research object, utilized text mining technology to extract keywords in local chronicle texts through Jieba, and then applied Gephi software to construct a word co-occurrence network. This effectively revealed the correlation and mutual influence between different feature elements, allowing for the accurate identification of the regional elements in the study area.
  • In terms of map symbol design, this study adopted a series of image-processing techniques. The GrabCcut algorithm was used to effectively segment the main body of the features, the Canny edge-detection algorithm was used to accurately identify the edges and shapes of the features, and the K-means clustering algorithm was used to extract the color schemes. Finally, Adobe Illustrator (2020) software was used to combine the symbols and simplify their shapes, creating map symbols with regional characteristics that were easy to identify. This effectively improved the information transfer efficiency and visual aesthetics of the map.
Through this series of research methods and steps, this study effectively solves the problem of recognizing regional features and designing map symbols. Beyond the experimental area proposed in this article, this method can also be applied to symbolization research into image information in other domains. It possesses characteristics such as repeatability, ease of operation, and strong applicability, thereby fulfilling the requirements for personalized design. These findings will significantly advance the construction of regional comprehensive atlases and facilitate the digital transformation of local chronicle information, contributing greatly to the development of geographic information science and the protection and dissemination of local culture.
Despite the results achieved in this study, several limitations must be acknowledged. For instance, the text analysis and image processing algorithms employed may be affected by the quality of the specific data and the inherent limitations of the algorithms themselves, potentially leading to inaccuracies or insufficient comprehensiveness in the extraction and visualization of certain feature elements. In addition, the design and optimization process of map symbols still requires manual involvement in decision-making, which may introduce subjective bias and affect the general applicability and recognition of the final symbols.
The follow-up work of this study will focus on three main points: first, integrating Natural Language Processing technology to further mine local chronicle information for a more detailed characterization of regional culture; second, applying Deep Learning algorithms to improve the graphic processing algorithms, thereby increasing the accuracy and automation level of contour extraction; and third, continuing to explore the design of map symbols under different themes and scales, and constructing a quantitative symbol-evaluation system to ensure the rationality of symbol design.

Author Contributions

Conceptualization, Lili Wu; methodology, Lili Wu; validation, Di Cao; formal analysis, Di Cao; investigation, Jinjin Yang; data curation, Xinran Yan; writing—original draft preparation, Di Cao and Lili Wu; writing—review and editing, Di Cao and Lili Wu; visualization, Ruoyi Zhang; supervision, Lili Wu; project administration, Lili Wu; funding acquisition, Lili Wu. All authors have read and agreed to the published version of the manuscript.

Funding

This research was funded by the National Natural Science Foundation of China, grant number 42101455.

Data Availability Statement

The data presented in this study are available from the author upon reasonable request.

Acknowledgments

The authors would like to acknowledge all of reviewers and editors.

Conflicts of Interest

The authors declare no conflicts of interest.

Appendix A

Figure A1. The questionnaire 1.
Ijgi 13 00299 g0a1
Figure A2. The questionnaire 2.
Ijgi 13 00299 g0a2

References

  1. Heng, Z.; Hou, H. Produce mining in the local chronicle and its system construction. J. China Soc. Sci. Tech. Inf. 2009, 28, 175–181. [Google Scholar] [CrossRef]
  2. Wang, Y.; Wang, H.; Yu, W.; Zhou, Z. Extracting Relationship Among Characters from Local Chronicles with Text Structures and Contents. Data Anal. Knowl. Discov. 2022, 6, 318–328. [Google Scholar]
  3. Xiao, L.; Yan, J. Reconstruction of poor/bumper autumn harvest index series based on historical chorography and its relationship with climate change in North China from 1736 to 1911. Acta Geogr. Sin. 2019, 74, 1777–1788. [Google Scholar]
  4. Ge, T.; Pei, W.; Ji, H.; Li, S.; Chang, B.; Sui, Z. Bring you to the past: Automatic Generation of Topically Relevant Event Chronicles. In Proceedings of the 7th International Joint Conference on Natural Language Processing of the Asian-Federation-of-Natural-Language-Processing (IJCNLP), Beijing, China, 26–31 July 2015; pp. 575–585. [Google Scholar]
  5. Akaishi, M.; Sato, M.; Hori, K.; Ishikawa, T. A Visual Analysis Tool for Finding Embedded Relations in Chronicles. In Proceedings of the 2012 16th International Conference on Information Visualisation, Montpellier, France, 11–13 July 2012; pp. 302–307. [Google Scholar]
  6. Li, D.; Liang, H. The alternation and contradiction between thrift and luxury: Headdress custom recordedin local chronicles in the Jiangnan area of the Ming Dynasty. J. Silk 2023, 60, 149–155. [Google Scholar]
  7. Ye, L.; Lin, H.; Chen, X. Narrative Design of Red Cultural Heritage Landscape in Jiangxi Province—Take Fang Zhimin Martyrs’ Memorial Park as An Example. J. Res. Sci. Eng. 2024, 6. [Google Scholar] [CrossRef]
  8. Zhen, W.; Huang, S.; Tian, Z.; Yang, X. A Novel Visual Narrative Framework for Tourist Map Design Based on Local Chronicles: A Case Study of the Songshan Scenic Area. Isprs Int. J. Geo-Inf. 2024, 13, 45. [Google Scholar] [CrossRef]
  9. He, X.; Liu, C.; Wu, L.; Wang, Y.; Tian, Z. Thematic Content and Visualization Strategy for Map Design of City-Specific Culture Based on Local Chronicles: A Case Study of Dengfeng City, China. Isprs Int. J. Geo-Inf. 2022, 11, 542. [Google Scholar] [CrossRef]
  10. Xie, Y.; Peng, X.; Huang, Z.; Liu, Y. Image perception of Beijing’s regional hotspots based on microblog data. Prog. Geogr. 2017, 36, 1099–1110. [Google Scholar]
  11. Kas, M.; Carley, K.M.; Carley, L.R. Trends in science networks: Understanding structures and statistics of scientific networks. Social Netw. Analys. Min. 2012, 2, 169–187. [Google Scholar] [CrossRef]
  12. Bartonek, D.; Andelová, P. Method for Cartographic Symbols Creation in Connection with Map Series Digitization. Isprs Int. J. Geo-Inf. 2022, 11, 105. [Google Scholar] [CrossRef]
  13. Field, K.; Demaj, D. Reasserting Design Relevance in Cartography: Some Concepts. Cartogr. J. 2012, 49, 70–76. [Google Scholar] [CrossRef]
  14. Jacques, B. Graphics and Graphic Information Processing; DE GRUYTER: Berlin, Germany, 1981; p. 280. [Google Scholar]
  15. Cao, Y.; Jiang, N.; Zhang, Y.; Zhang, X. Constitution Variables and Generation Modes of Electronic Map Symbols. Acta Geod. Cartogr. Sin. 2012, 41, 784–790. [Google Scholar]
  16. Shuang, L.; Sasaki, J. A Study on the Tourism Features Extraction from Photos in a Tourism Website by Image Analysis. In Proceedings of the 2019 IEEE 10th International Conference on Awareness Science and Technology (iCAST), Morioka, Japan, 23–25 October 2019; p. 5. [Google Scholar]
  17. Rekha, V.; Natarajan, K.; Innila, R.J. Foreground algorithms for detection and extraction of an object in multimedia. Int. J. Electr. Comput. Eng. 2020, 10, 1849–1858. [Google Scholar]
  18. Zhang, K.; Chen, H. Building Extraction from High-Resolution Remote Sensing Images Based on GrabCut with Automatic Selection of Foreground and Background Samples. Photogramm. Eng. Remote Sens. 2020, 86, 235–245. [Google Scholar] [CrossRef]
  19. Sasikala, N.; Shruthi, C.; Mohana, A.; Harika, M.; Supriya, S. An Adaptive Edge Detecting Method for Satellite Imagery Based on Canny Edge Algorithm. Int. J. Adv. Eng. Res. Sci. 2020, 7, 293–298. [Google Scholar] [CrossRef]
  20. Libor, L.; Martin, K. Automatic buildings detection using Sobel, Roberts, Canny and Prewwitt detector. J. Electr. Eng. 2021, 72, 278–282. [Google Scholar]
  21. Molada-Tebar, A.; Marqués-Mateu, Á.; Lerma, J.L.; Westland, S. Dominant Color Extraction with K-Means for Camera Characterization in Cultural Heritage Documentation. Remote Sens. 2020, 12, 520. [Google Scholar] [CrossRef]
  22. Takahashi, N.; Sakamoto, T.; Kato, T. Color-analysis of Image Photography of Interior Brand based on Extraction of Representative Colors and Clustered Color-features. Trans. Jpn. Soc. Kansei Eng. 2016, 15, 203–212. [Google Scholar] [CrossRef]
  23. Thordarson, T.; Larsen, G. Volcanism in Iceland in historical time: Volcano types, eruption styles and eruptive history. J. Geodyn. 2007, 43, 118–152. [Google Scholar] [CrossRef]
  24. Kubo, M.; Hara, S.; Sekino, T. Three-dimensional Spatiotemporal Model and its Application to Analysis of Research Resources: Toward Constructing Historical Knowledge. J. Jpn. Soc. Artif. Intell. 2010, 25, 50–55. [Google Scholar]
  25. Zhu, S.; Bao, P. The use of Geographic Information System in the development and utilization of ancient local chronicles. Libr. Hi Tech 2015, 33, 356–368. [Google Scholar] [CrossRef]
  26. Tian, Z.; Liu, Y.; Wang, Y.; Wu, L. A Tourist Behavior Analysis Framework Guided by Geo-Information Tupu Theory and Its Application in Dengfeng City, China. Isprs Int. J. Geo-Inf. 2022, 11, 250. [Google Scholar] [CrossRef]
  27. Lv, H. Dengfeng City Chronicle; Zhongzhou Ancient Books: Zhengzhou, China, 2008. [Google Scholar]
  28. Liu, Q.; Zheng, Z.; Zheng, J.; Chen, Q.; Liu, G.; Chen, S.; Chu, B.; Zhu, H.; Akinwunmi, B.; Huang, J.; et al. Health Communication Through News Media During the Early Stage of the COVID-19 Outbreak in China: Digital Topic Modeling Approach. J. Med. Internet Res. 2020, 22. [Google Scholar] [CrossRef] [PubMed]
  29. Peng, K.-H.; Liou, L.-H.; Chang, C.-S.; Lee, D.-S. Predicting Personality Traits of Chinese Users Based on Facebook Wall Posts. In Proceedings of the 24th Wireless and Optical Communication Conference (WOCC), Taipei, Taiwan, 23–24 October 2015; pp. 9–14. [Google Scholar]
  30. Jacomy, M.; Venturini, T.; Heymann, S.; Bastian, M. ForceAtlas2, a Continuous Graph Layout Algorithm for Handy Network Visualization Designed for the Gephi Software. PLoS ONE 2014, 9. [Google Scholar] [CrossRef]
  31. Rother, C.; Kolmogorov, V.; Blake, A. “GrabCut”—Interactive foreground extraction using iterated graph cuts. ACM Trans. Graph. 2004, 23, 309–314. [Google Scholar] [CrossRef]
  32. Ning-Yu, A.; Chi-Man, P. Iterated graph cut integrating texture characterization for interactive image segmentation. In Proceedings of the 2013 10th International Conference on Computer Graphics, Imaging and Visualization (CGIV), Los Alamitos, CA, USA, 6–8 August 2013; pp. 79–83. [Google Scholar] [CrossRef]
  33. Canny, J. A Computational approach to edge-detection. IEEE Trans. Pattern Anal. Mach. Intell. 1986, 8, 679–698. [Google Scholar] [CrossRef] [PubMed]
  34. Rong, W.B.; Li, Z.J.; Zhang, W.; Sun, L.N. An Improved Canny Edge Detection Algorithm. In Proceedings of the 11th IEEE International Conference on Mechatronics and Automation (ICMA), Tianjin, China, 3–6 August 2014; pp. 577–582. [Google Scholar]
  35. Hartigan, J.A.; Wong, M.A. A K-means clustering algorithm. Appl. Stat. 1979, 28, 100–108. [Google Scholar] [CrossRef]
  36. Jiayao, W.; Haizhong, Q. Cartographic-generalization-knowledge and Its Application. Geomat. Inf. Sci. Wuhan Univ. 2006, 31, 382. [Google Scholar]
  37. Zagata, K.; Gulij, J.; Halik, L.; Medynska-Gulij, B. Mini-Map for Gamers Who Walk and Teleport in a Virtual Stronghold. Isprs Int. J. Geo-Inf. 2021, 10, 96. [Google Scholar] [CrossRef]
  38. Medynska-Gulij, B.; Zagata, K. Experts and Gamers on Immersion into Reconstructed Strongholds. Isprs Int. J. Geo-Inf. 2020, 9, 655. [Google Scholar] [CrossRef]
Figure 1. Location and administrative division of Dengfeng: (a) Dengfeng City, Henan Province; (b) The administrative division map of Dengfeng.
Ijgi 13 00299 g001
Figure 2. Technology roadmap.
Ijgi 13 00299 g002
Figure 3. Text pre-processing process.
Ijgi 13 00299 g003
Figure 4. Statistical analysis and construction of networks of co-occurrence of texts: (a) Node statistical analysis; (b) Force Atlas 2 Layout Adjustments; (c) Textual semantic co-occurrence network (word frequency); (d) Textual Semantic Co-occurrence Network (Topic).
Ijgi 13 00299 g004
Figure 5. S-T diagram.
Ijgi 13 00299 g005
Figure 6. GrabCut Algorithm Segmentation Procedure.
Ijgi 13 00299 g006
Figure 7. Feature Body Extraction Process.
Ijgi 13 00299 g007
Figure 8. Comparison of edge extraction effect of different operators:(a) Sobel operator; (b) Robert operator; (c) Canny operator.
Ijgi 13 00299 g008
Figure 9. Elemental contour extraction process:(a) Original image; (b) Gaussian blur; (c) Grayscale image conversion; (d) Result.
Ijgi 13 00299 g009
Figure 10. K-means Algorithm Color Extraction Steps.
Ijgi 13 00299 g010
Figure 11. Color matching extraction process: (a) Original image; (b) Original color space; (c) Color space after clustering; (d) Result; (e) Color application example.
Ijgi 13 00299 g011
Figure 12. Example of symbol simplification.
Ijgi 13 00299 g012
Figure 13. Details of the participants.
Ijgi 13 00299 g013
Figure 14. Diagram of the complete experiment.
Ijgi 13 00299 g014
Figure 15. Diagram of the symbol design results.
Ijgi 13 00299 g015
Figure 16. Symbol design examples.
Ijgi 13 00299 g016
Figure 17. Thematic map of the distribution of cultural buildings.
Ijgi 13 00299 g017
Figure 18. Tourist Map of Dengfeng City.
Ijgi 13 00299 g018
Figure 19. The statistical chart of questionnaire results for symbol-confusion experiment.
Ijgi 13 00299 g019
Figure 20. The statistical chart of questionnaire results for map-cognition experiment.
Ijgi 13 00299 g020
Figure 21. Diagram of the comparison of multiple types of map symbols.
Ijgi 13 00299 g021
Table 1. Type and source of data.
TypeContentSourceData Advantage
TextMonuments and heritage section
Ijgi 13 00299 i001
Dengfeng City Chronicle in 2008Official
Detailed
Logical
ImageFolklore and cultural elements, landmarks, etc.
Shaolin Temple Ijgi 13 00299 i002
Astronomical Observation Terrace Ijgi 13 00299 i003
Buddhist monks Ijgi 13 00299 i004
Dengfeng City Government Official Website
(www.dengfeng.gov.cn/)
Baidu Gallery
(image.baidu.com/)
Authoritative
Rich variety
High-resolution
Table 2. Statistical results of high-frequency words (partial).
NumberWordFrequencyPart of Speech
1Shaolin Temple147Noun—place name
2Architecture125Noun
3Sculpture94Verb
4Historical remains86Noun
5Cultural relic74Noun
6Basilica74Noun
7Monks69Noun
8Zhongyue Temple68Noun—place name
9Inscription64Noun
10Songyang Academy63Noun—place name
11Monastery60Noun
12Existing47Time word
13The republican period45Time word
14Ancient pagoda40Noun
Table 3. Word co-occurrence network matrix (partial).
WordShaolin TempleHistorical RemainsArchitectureCultural RelicSculptureInscriptionMonasteryMonkSongyang Academy
Shaolin Temple021701713336
Historical remains00240110013
Architecture14101511213
Cultural relic12192038016
Sculpture834107052
Inscription103000578
Monastery200006032
Monk13020101203
Songyang Academy510007000
Table 4. Summary of shape simplification methods.
MethodPrincipleTypical Example
DeleteTo better display and emphasize key features of a map object, it is occasionally necessary to exaggerate fragmented areas that may be overlooked at conventional scales of demarcation. This approach serves to highlight their significance or unique characteristics within the overall context.
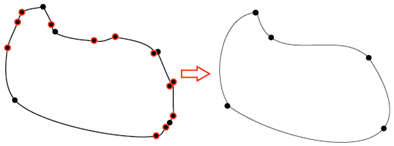
Ijgi 13 00299 i005
StretchBy reducing the number of bends in the line, the outline becomes smooth and clear, eliminating unnecessary complexity and preserving the more intuitive shape characteristics.Ijgi 13 00299 i006
MergeTo simplify the overall map structure, adjacent or functionally similar contours should be combined into a larger unit. This approach not only reduces the over-representation of detail, but also enhances map readability by emphasizing key features.Ijgi 13 00299 i007
Table 5. Questionnaire answers from all respondents.
IDQ1Q2Q3Q4Q5Q6Q7IDQ1Q2Q3Q4Q5Q6Q7
15544445264445444
24444444274444455
35435455285355445
44545454295543545
55454454304454554
64445354314544544
75444544324555544
84454454334554445
95454445344444455
105455554355445455
114545444363433233
123434244375445554
135445454385554454
145455545395454545
155544454404555455
164455454414342343
175345445423443433
184544454432424324
194554544443434244
205455545454555554
214455554464244442
225445535473343423
235545455485433424
244545444494233423
254454554505434235
Disclaimer/Publisher’s Note: The statements, opinions and data contained in all publications are solely those of the individual author(s) and contributor(s) and not of MDPI and/or the editor(s). MDPI and/or the editor(s) disclaim responsibility for any injury to people or property resulting from any ideas, methods, instructions or products referred to in the content.

