Abstract
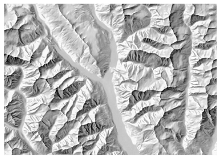
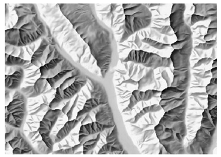
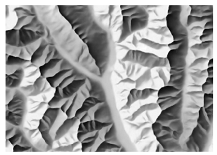
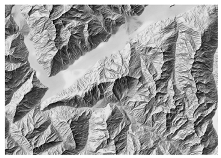
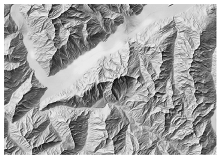
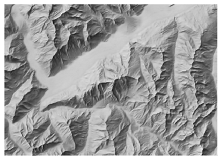
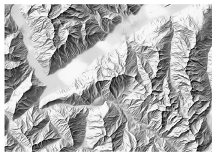
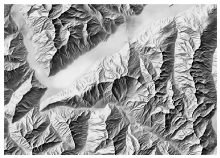
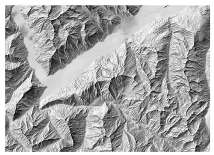
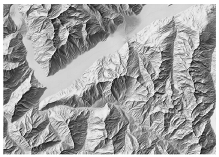
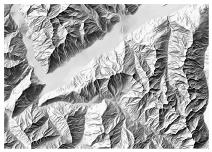
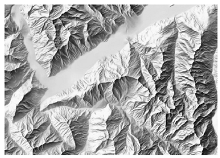
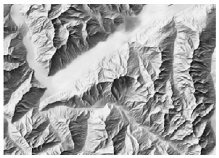
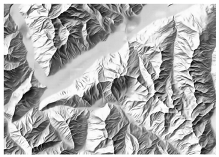
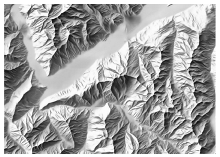
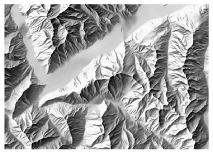
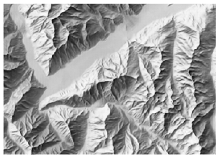
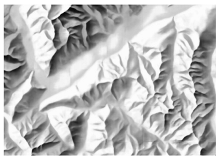
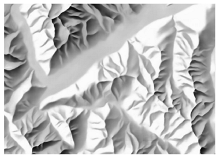
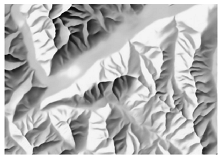
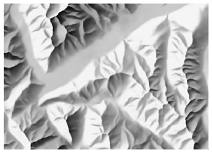
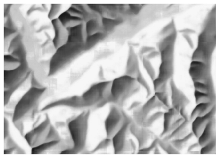
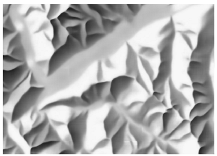
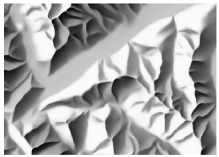
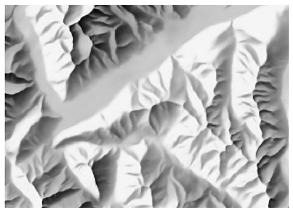
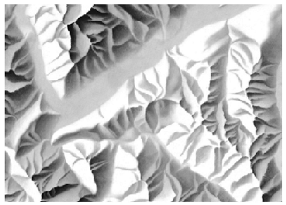
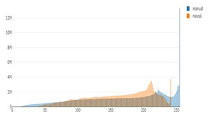
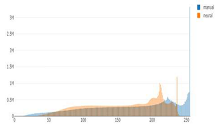
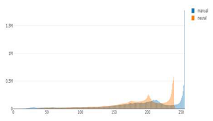
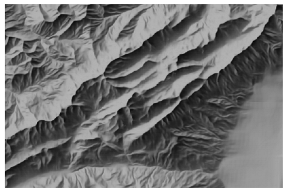
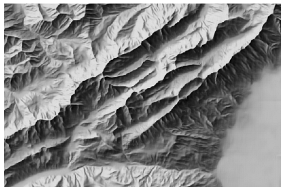
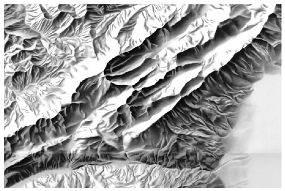
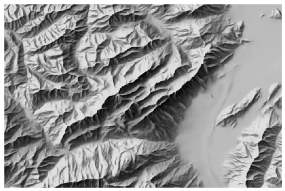
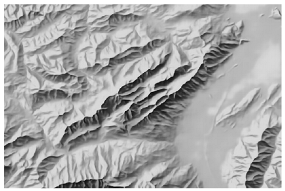
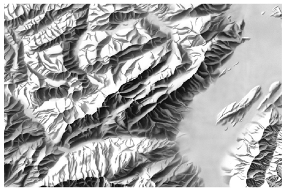
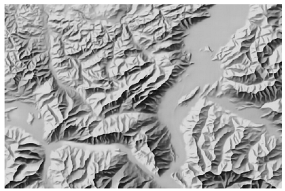
On many maps, relief shading is one of the most significant graphical elements. Modern relief shading techniques include neural networks. To generate such shading automatically at an arbitrary scale, one needs to consider how the resolution of the input digital elevation model (DEM) relates to the neural network process and the maps used for training. Currently, there is no clear guidance on which DEM resolution to use to generate relief shading at specific scales. To address this gap, we trained the U-Net models on swisstopo manual relief shadings of Switzerland at four different scales and using four different resolutions of SwissALTI3D DEM. An interactive web application designed for this study allows users to outline a random area and compare histograms of varying brightness between predictions and manual relief shadings. The results showed that DEM resolution and output scale influence the appearance of the relief shading, with an overall scale/resolution ratio. We present guidelines for generating relief shading with neural networks for arbitrary areas and scales.
1. Introduction
Relief shading, or hill shading, is used on maps to represent the terrain in an intuitive way [1]. Being originally a manual technique, it underwent numerous automation attempts over decades, and analytical (i.e., automatic) relief shading is nowadays primarily used for topographic visualisation [2].
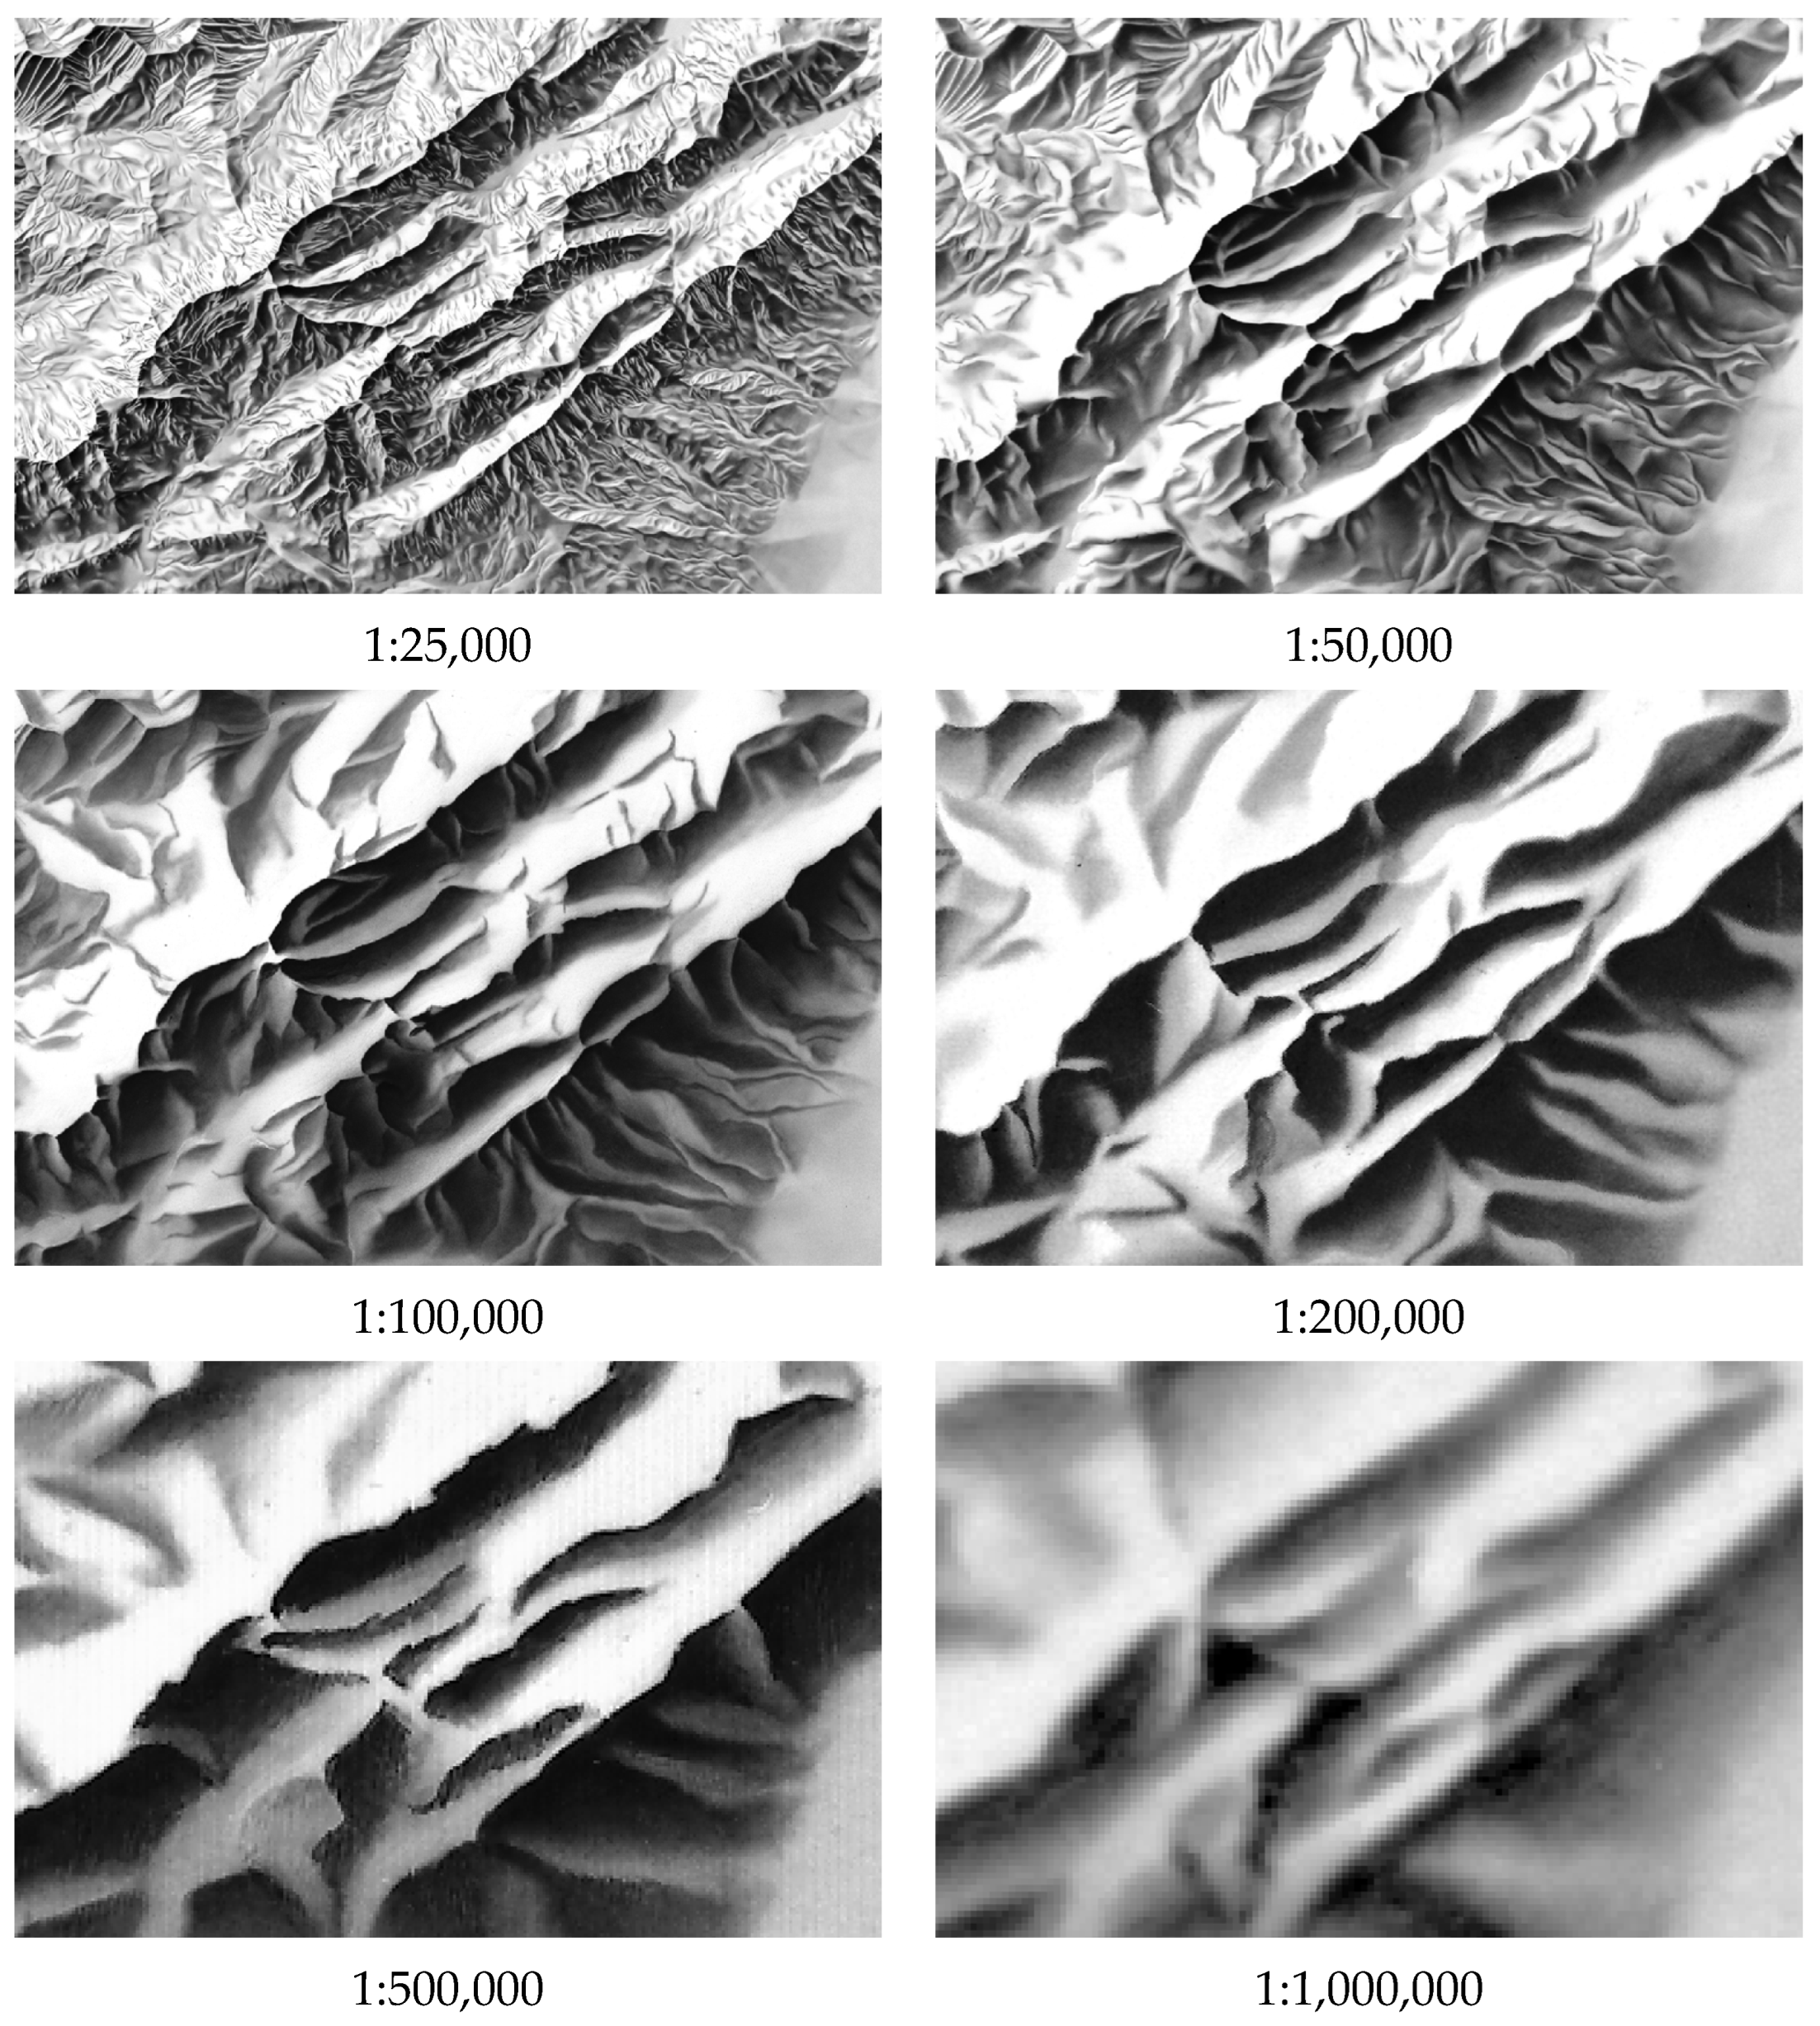
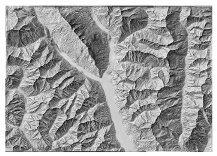
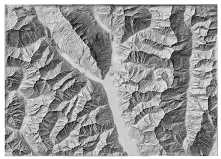
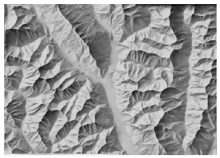
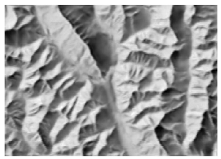
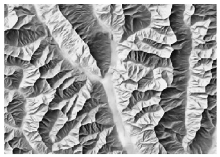
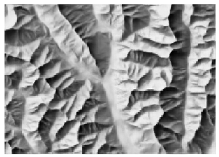
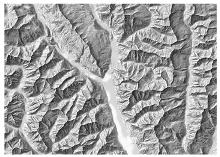
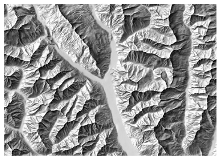
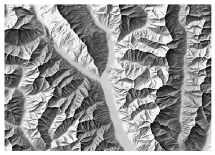
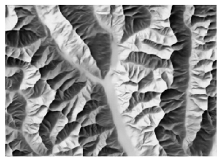
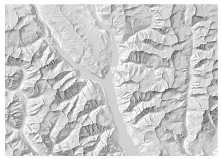
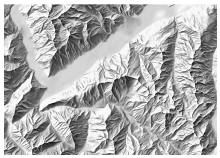
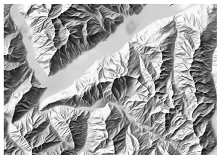
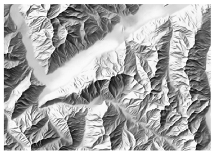
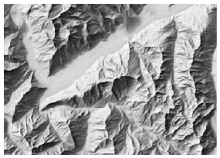
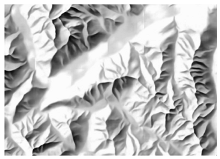
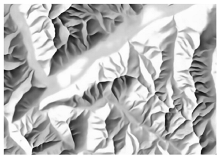
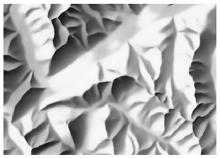
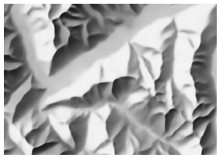
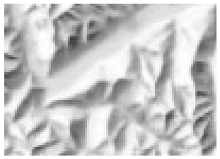
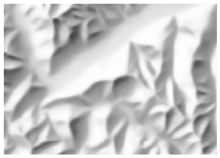
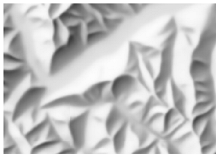
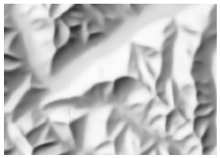
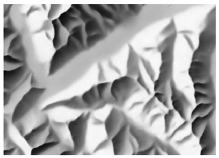
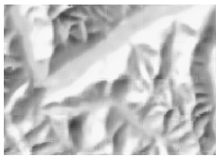
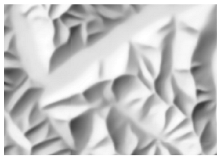
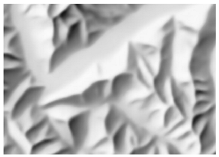
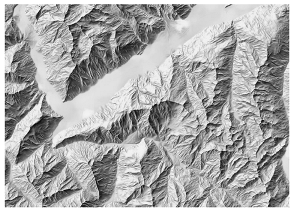
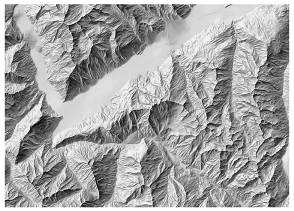
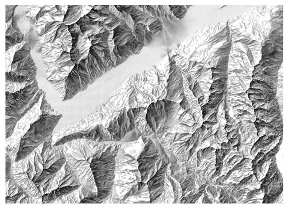
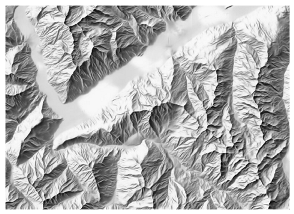
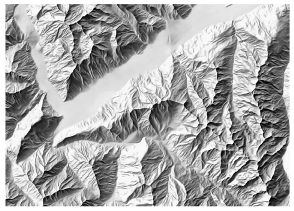
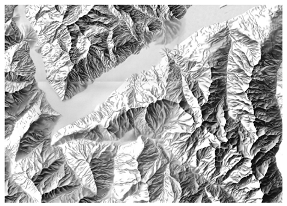
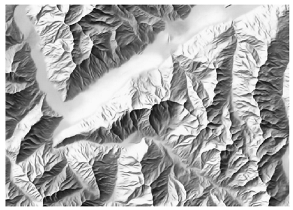
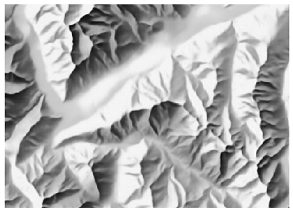
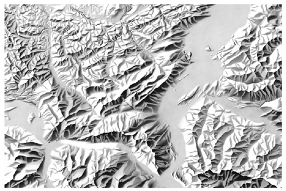
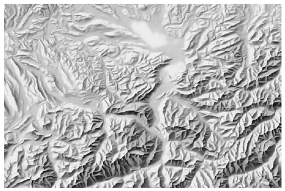
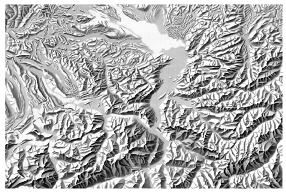
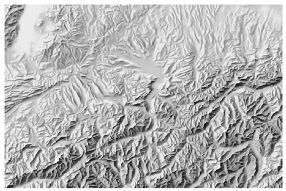
Not only the technical improvements like computers and software advancements fostered the rapid development of analytical relief shading, but also the widespread use and employment of raster DEMs [3]. The size of the cells, or DEM resolution, influences the relief shading appearance [4]. Over time, the resolution of DEMs was constantly increased, and multi-resolution sets were developed and collected for some mountain areas [5]. Detailed and accurate data are crucial for large-scale mapping, but when it comes to small-scale depictions of extended mountain areas and large terrain features, cartographers prefer to emphasise them and reduce noise, which would require less detail and lower-resolution data [4]. Figure 1 demonstrates the stepwise removal of detail scale by scale inspired by Eduard Imhof’s example of the Säntis group in the northeastern part of Switzerland [1]. While the most detailed shading at 1:25,000 requires very precise input data, it proves the importance of considering resolution when generating shaded relief at a specific scale. Therefore, this research focuses on finding out which DEM resolution is appropriate to use for a specific output scale with the help of machine learning. It should result in guidelines on a DEM resolution and scale choice.
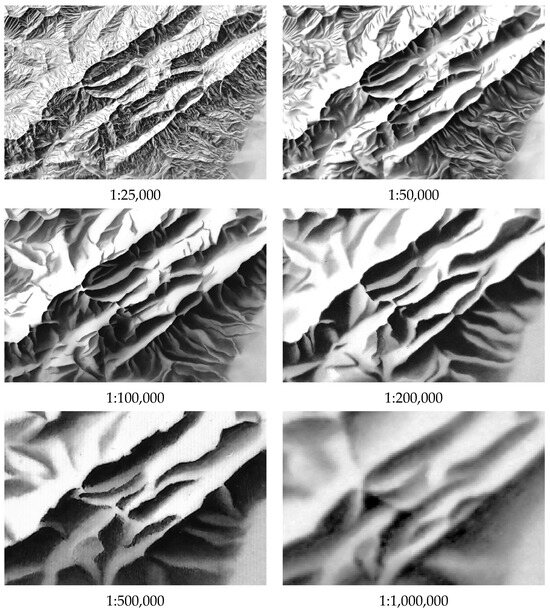
Figure 1.
Relief shading generalisation at various scales; Säntis group, Swiss Alps, swisstopo manual relief shadings.
Generalisation of relief shading can be conducted on the DEM prior to hill shading [6], and different DEM resolutions can be used to match the level of detail for a specific scale or adjustments at the later stage may contribute to relief shading generalisation [3,7] and emphasizing major landforms [8]. With the help of Terrain Sculptor [9,10,11], DEM is modified by a number of raster operations, including a low-pass filter, curvature coefficients to detect and accentuate important relief features, and further exaggeration of terrain and smoothing. Another way to modify DEMs applies line integral convolution along slope lines to the elevation values and focuses on terrain edges in order to generalise the terrain [12]. It was further enhanced to accentuate mountain ridges, to control the level of detail on slopes, and to effectively generalise terrain, removing excessive details [13].
Finally, a recent work focuses on training neural networks with manual relief shadings [14] and allows for instant changes in the level of generalisation with the help of the Eduard software [15]; it only takes seconds to produce shaded reliefs with different levels of detail and at different scales. One can make those adjustments by moving macro and micro sliders together or separately from each other. Such tunings testify to a user-defined level of detail.
The objective of this research is to find out whether there is a certain correlation between input data and output scale to best rely on. To achieve this, we will carry out qualitative and quantitative assessments of the neural shadings’ quality and will provide users with recommendations on the proper selection of the two parameters to train neural shadings models. Trained with manual relief shadings, the resulting neural shadings will also adopt local light direction changes that are inherent to manual shadings.
2. Methodology
In this section, we describe the study area and data used for training, the choice of map scales and image resolutions, and the training workflow and results.
2.1. Study Area and Data
We trained the network on an area of Switzerland based on the availability of swisstopo manual relief shadings at scales of 1:25,000, 1:50,000, 1:100,000, 1:200,000, 1:500,000, and 1:1,000,000, and a 2 m resolution swissALTI3D digital elevation model [16] downsampled according to our research objectives.
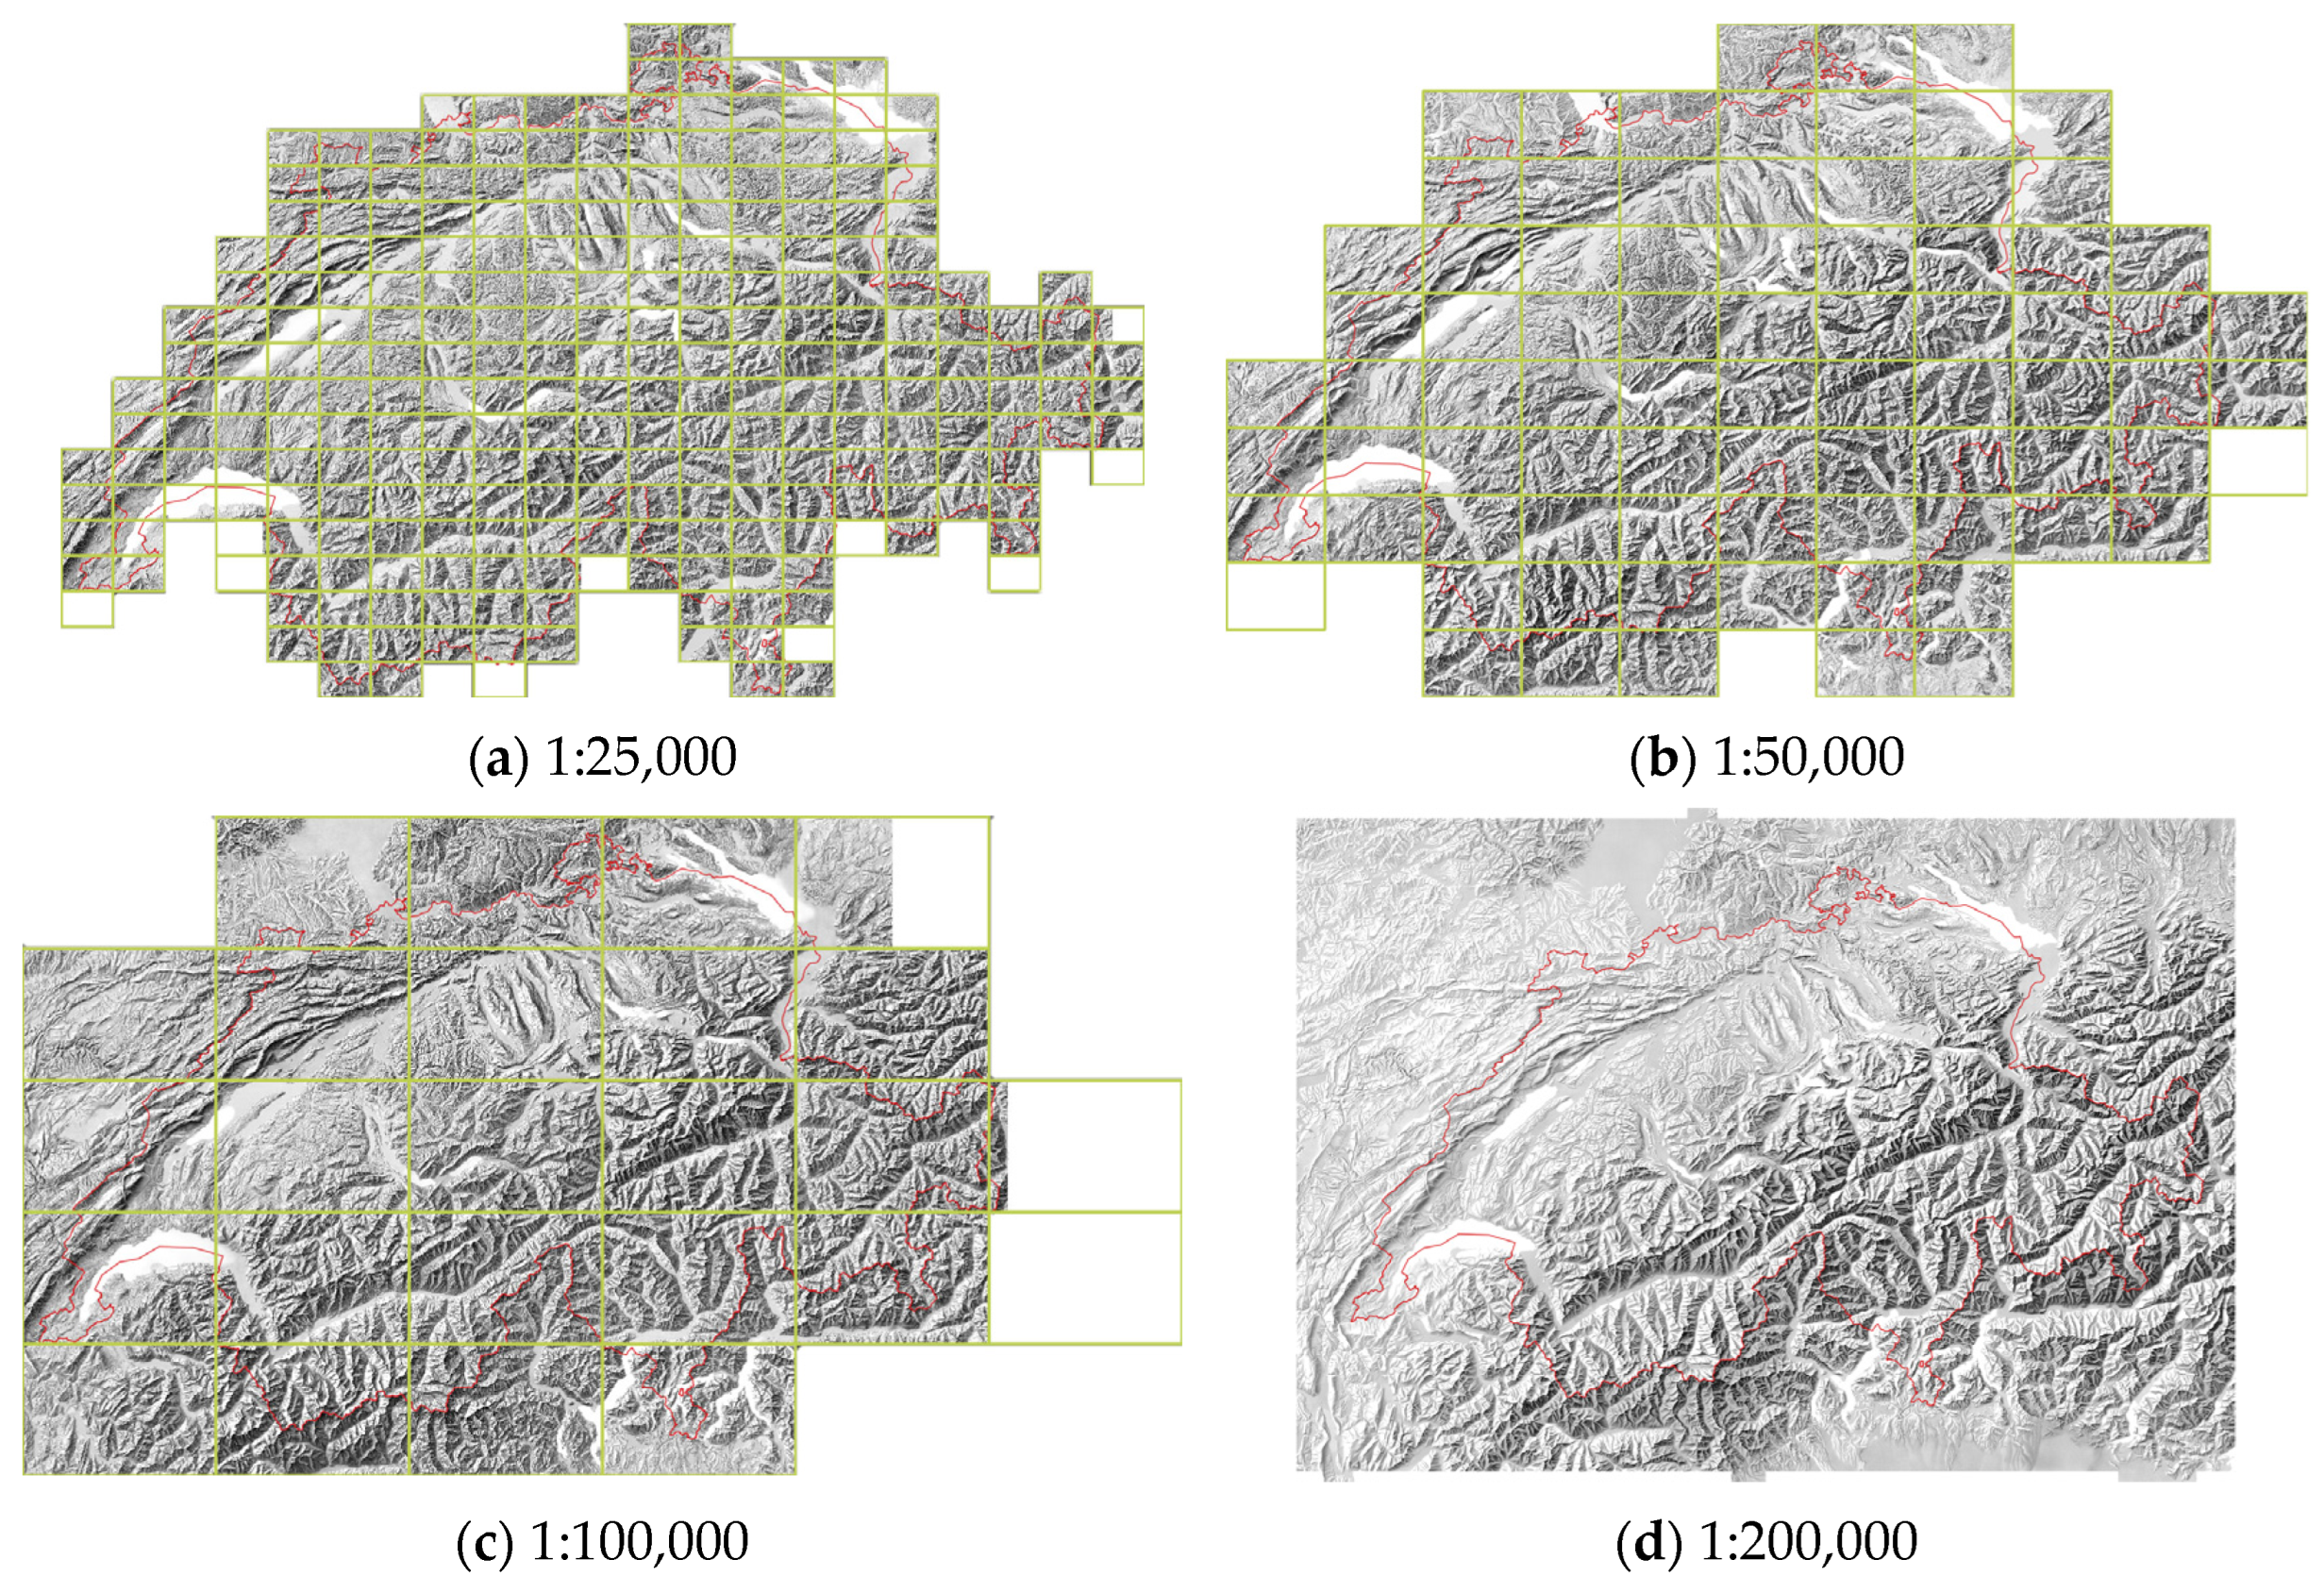
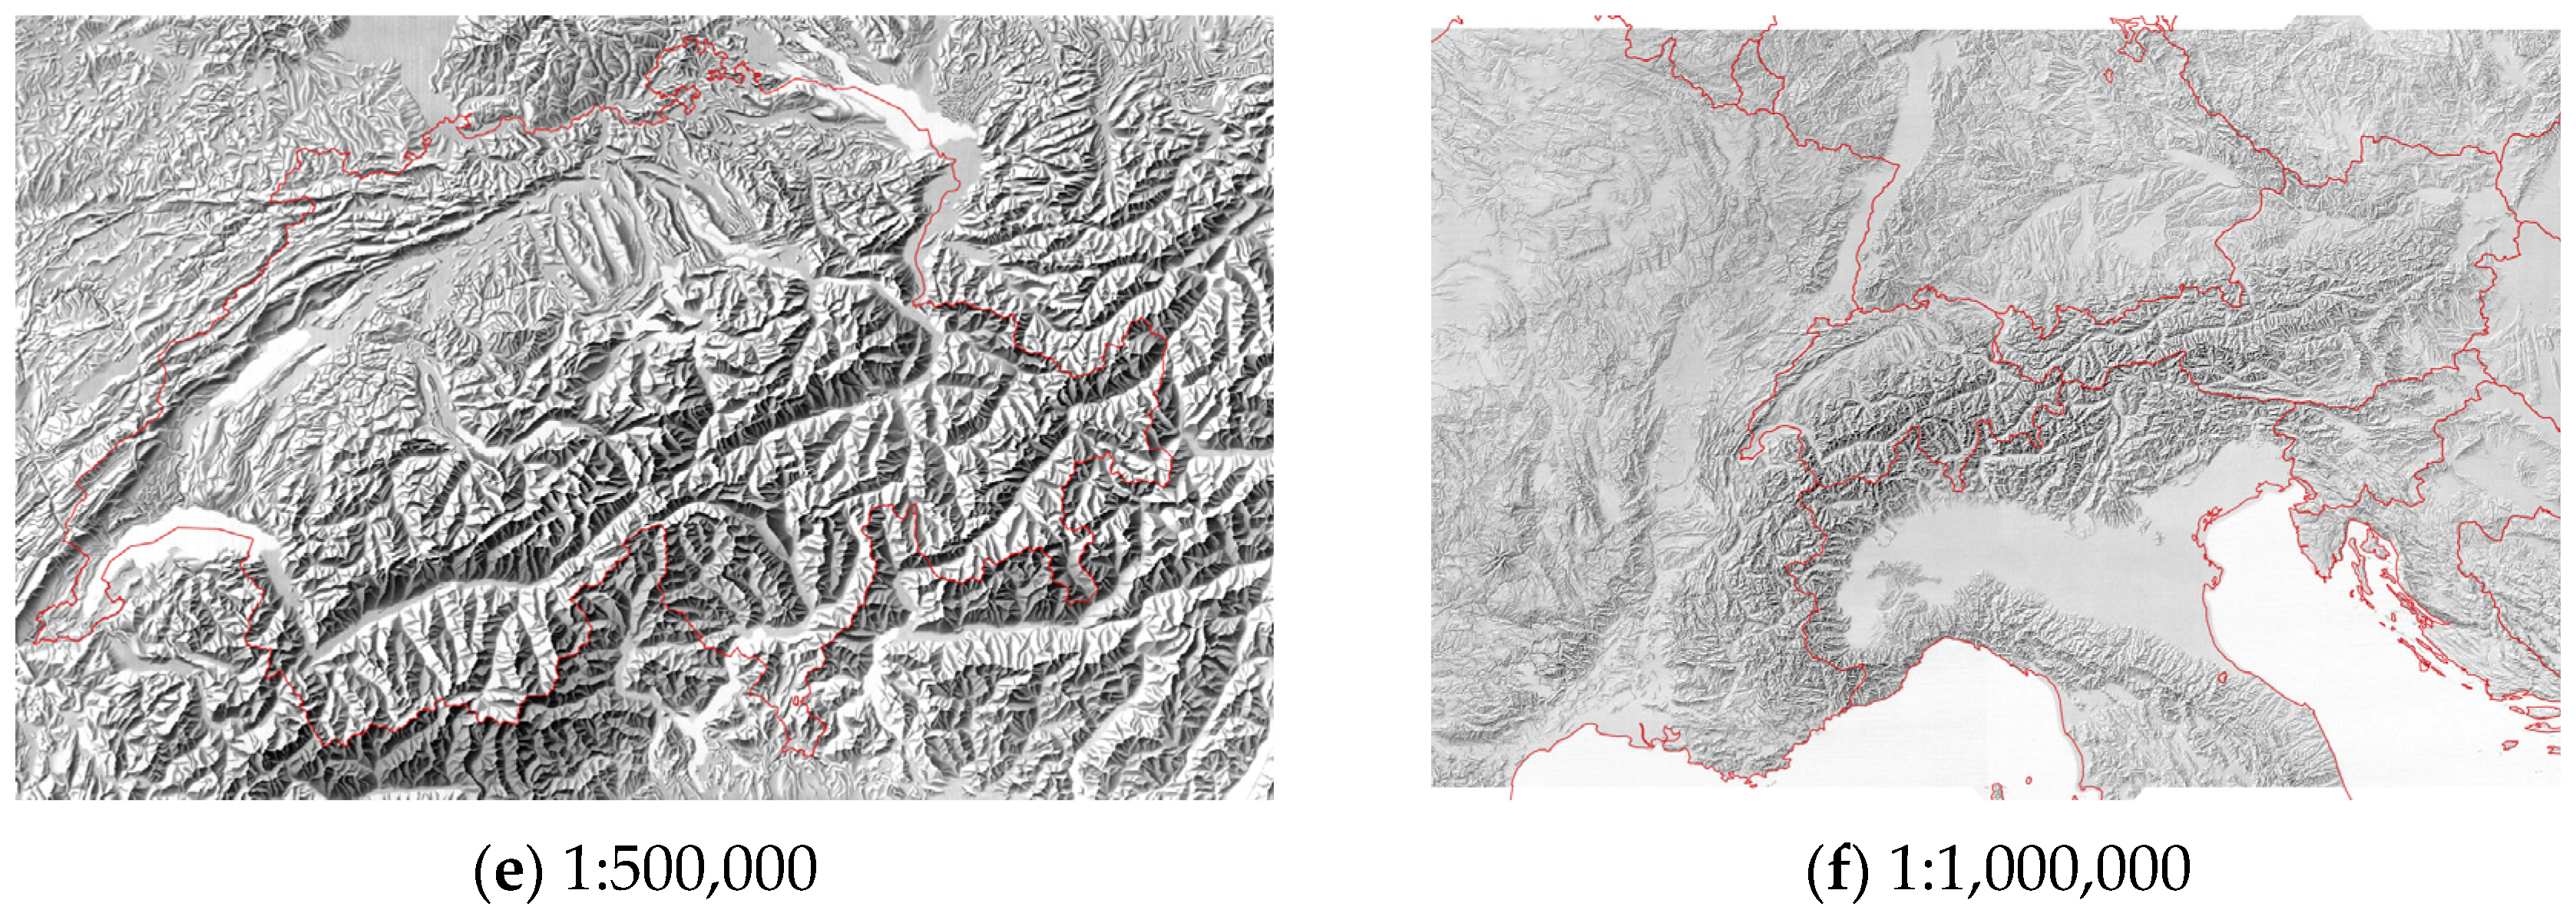
The 1:25,000 manual relief shading contains 259 tiles (Figure 2) and has an original (scanning) resolution of 1.25 m, the 1:50,000 shading has 80 tiles and 5 m resolution, the 1:100,000 shading has 25 tiles and 10 m resolution, and at the scales 1:200,000, 1:500,000, 1:1,000,000, there are single raster files with resolutions of 20 m, 50 m and 100 m, respectively. As one can see from Figure 2, the extent of the data for training varies depending on the scale, from just covering the territory of Switzerland to offering more area outside the Swiss border within a polygon. The manual shading at 1:1,000,000 offers a much larger extent covering neighbouring territories.
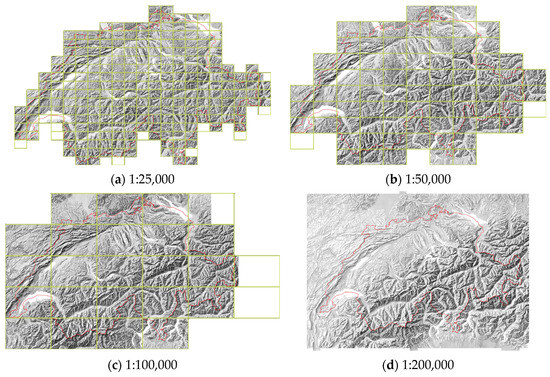
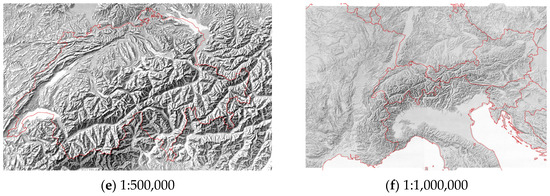
Figure 2.
Extents of the swisstopo manual relief shadings of Switzerland with the Swiss border (red) and the tiles footprints (green).
2.2. Scale and Resolution
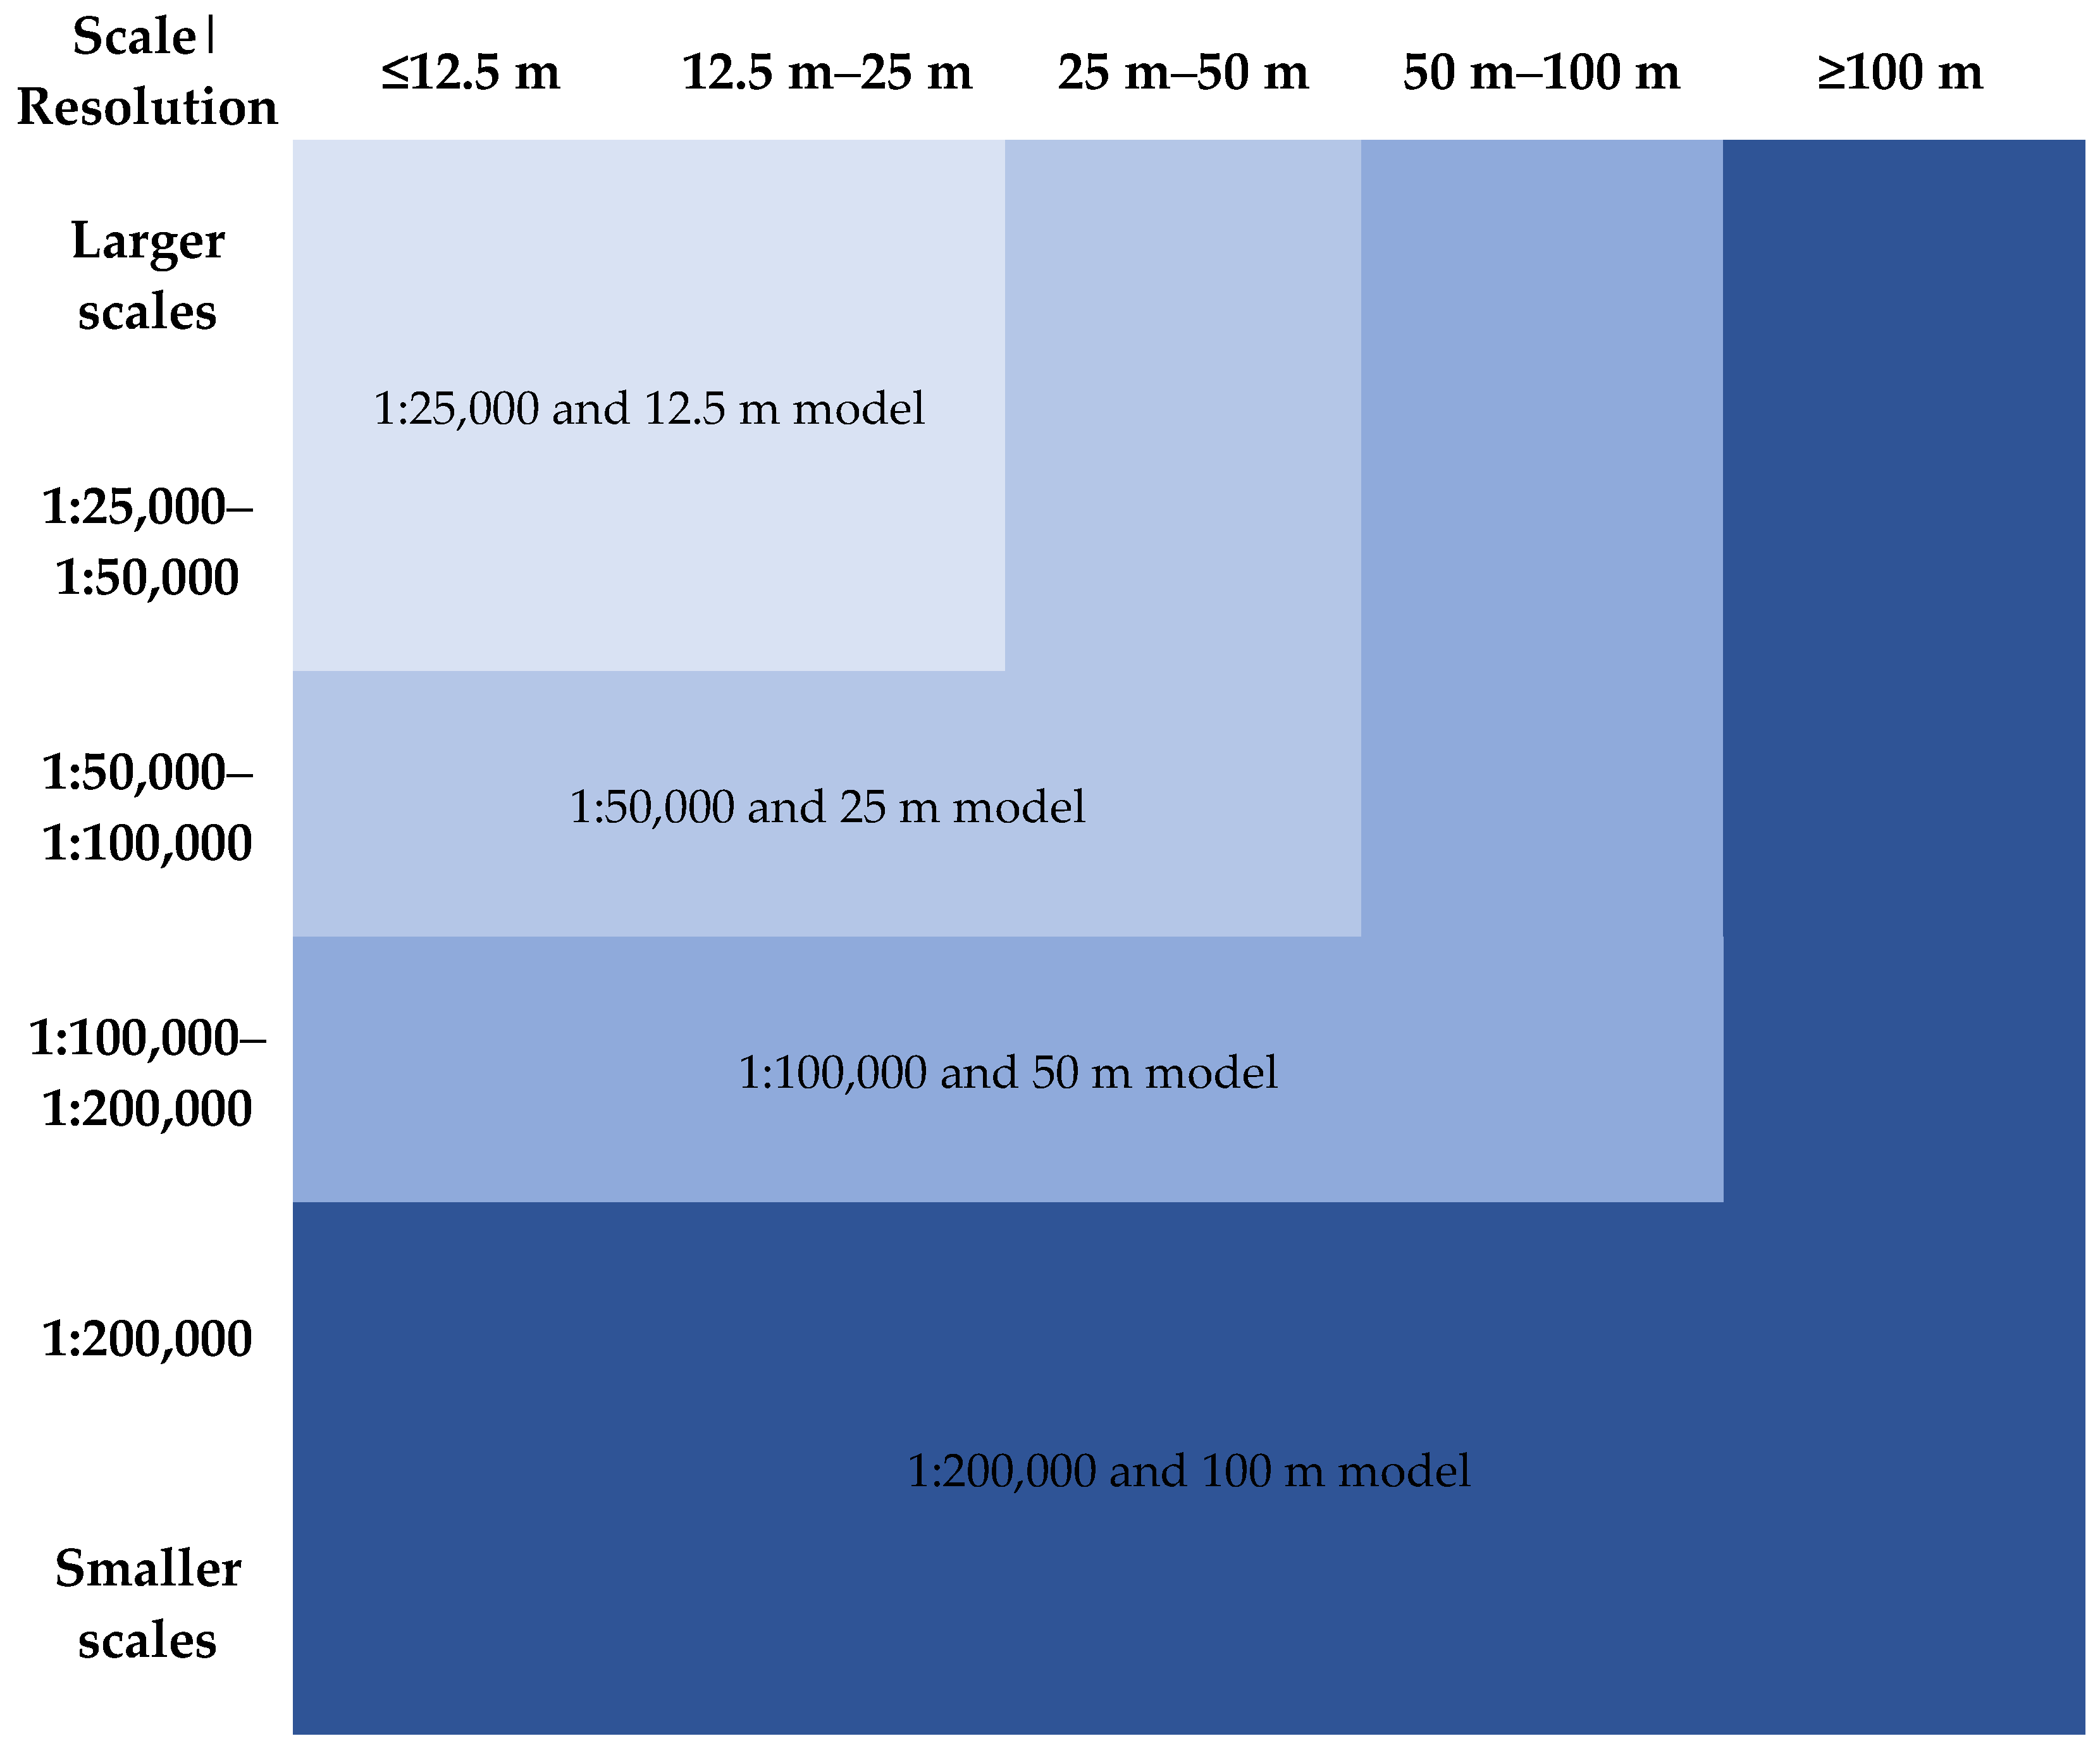
The level of detail of relief shading is different for each scale. To define the resolution, we refer to Tobler’s rule [17] in written form as follows:
Raster resolution (m) = map scale denominator/1000/2
Even though Tobler mainly refers to imagery and photographic film as graphical output mediums, the rule is valid for printed maps in general and is a good base for this research. Given this rule, we use the following set of map scales and image resolutions, since they are related. Table 1 comprises the available scales of manually shaded reliefs by swisstopo, the corresponding detectable sizes, i.e., the distances on the ground corresponding to 1 mm on the map and that are twice the resolutions, and image resolutions in meters.

Table 1.
Map scales and their corresponding resolutions.
2.3. Training
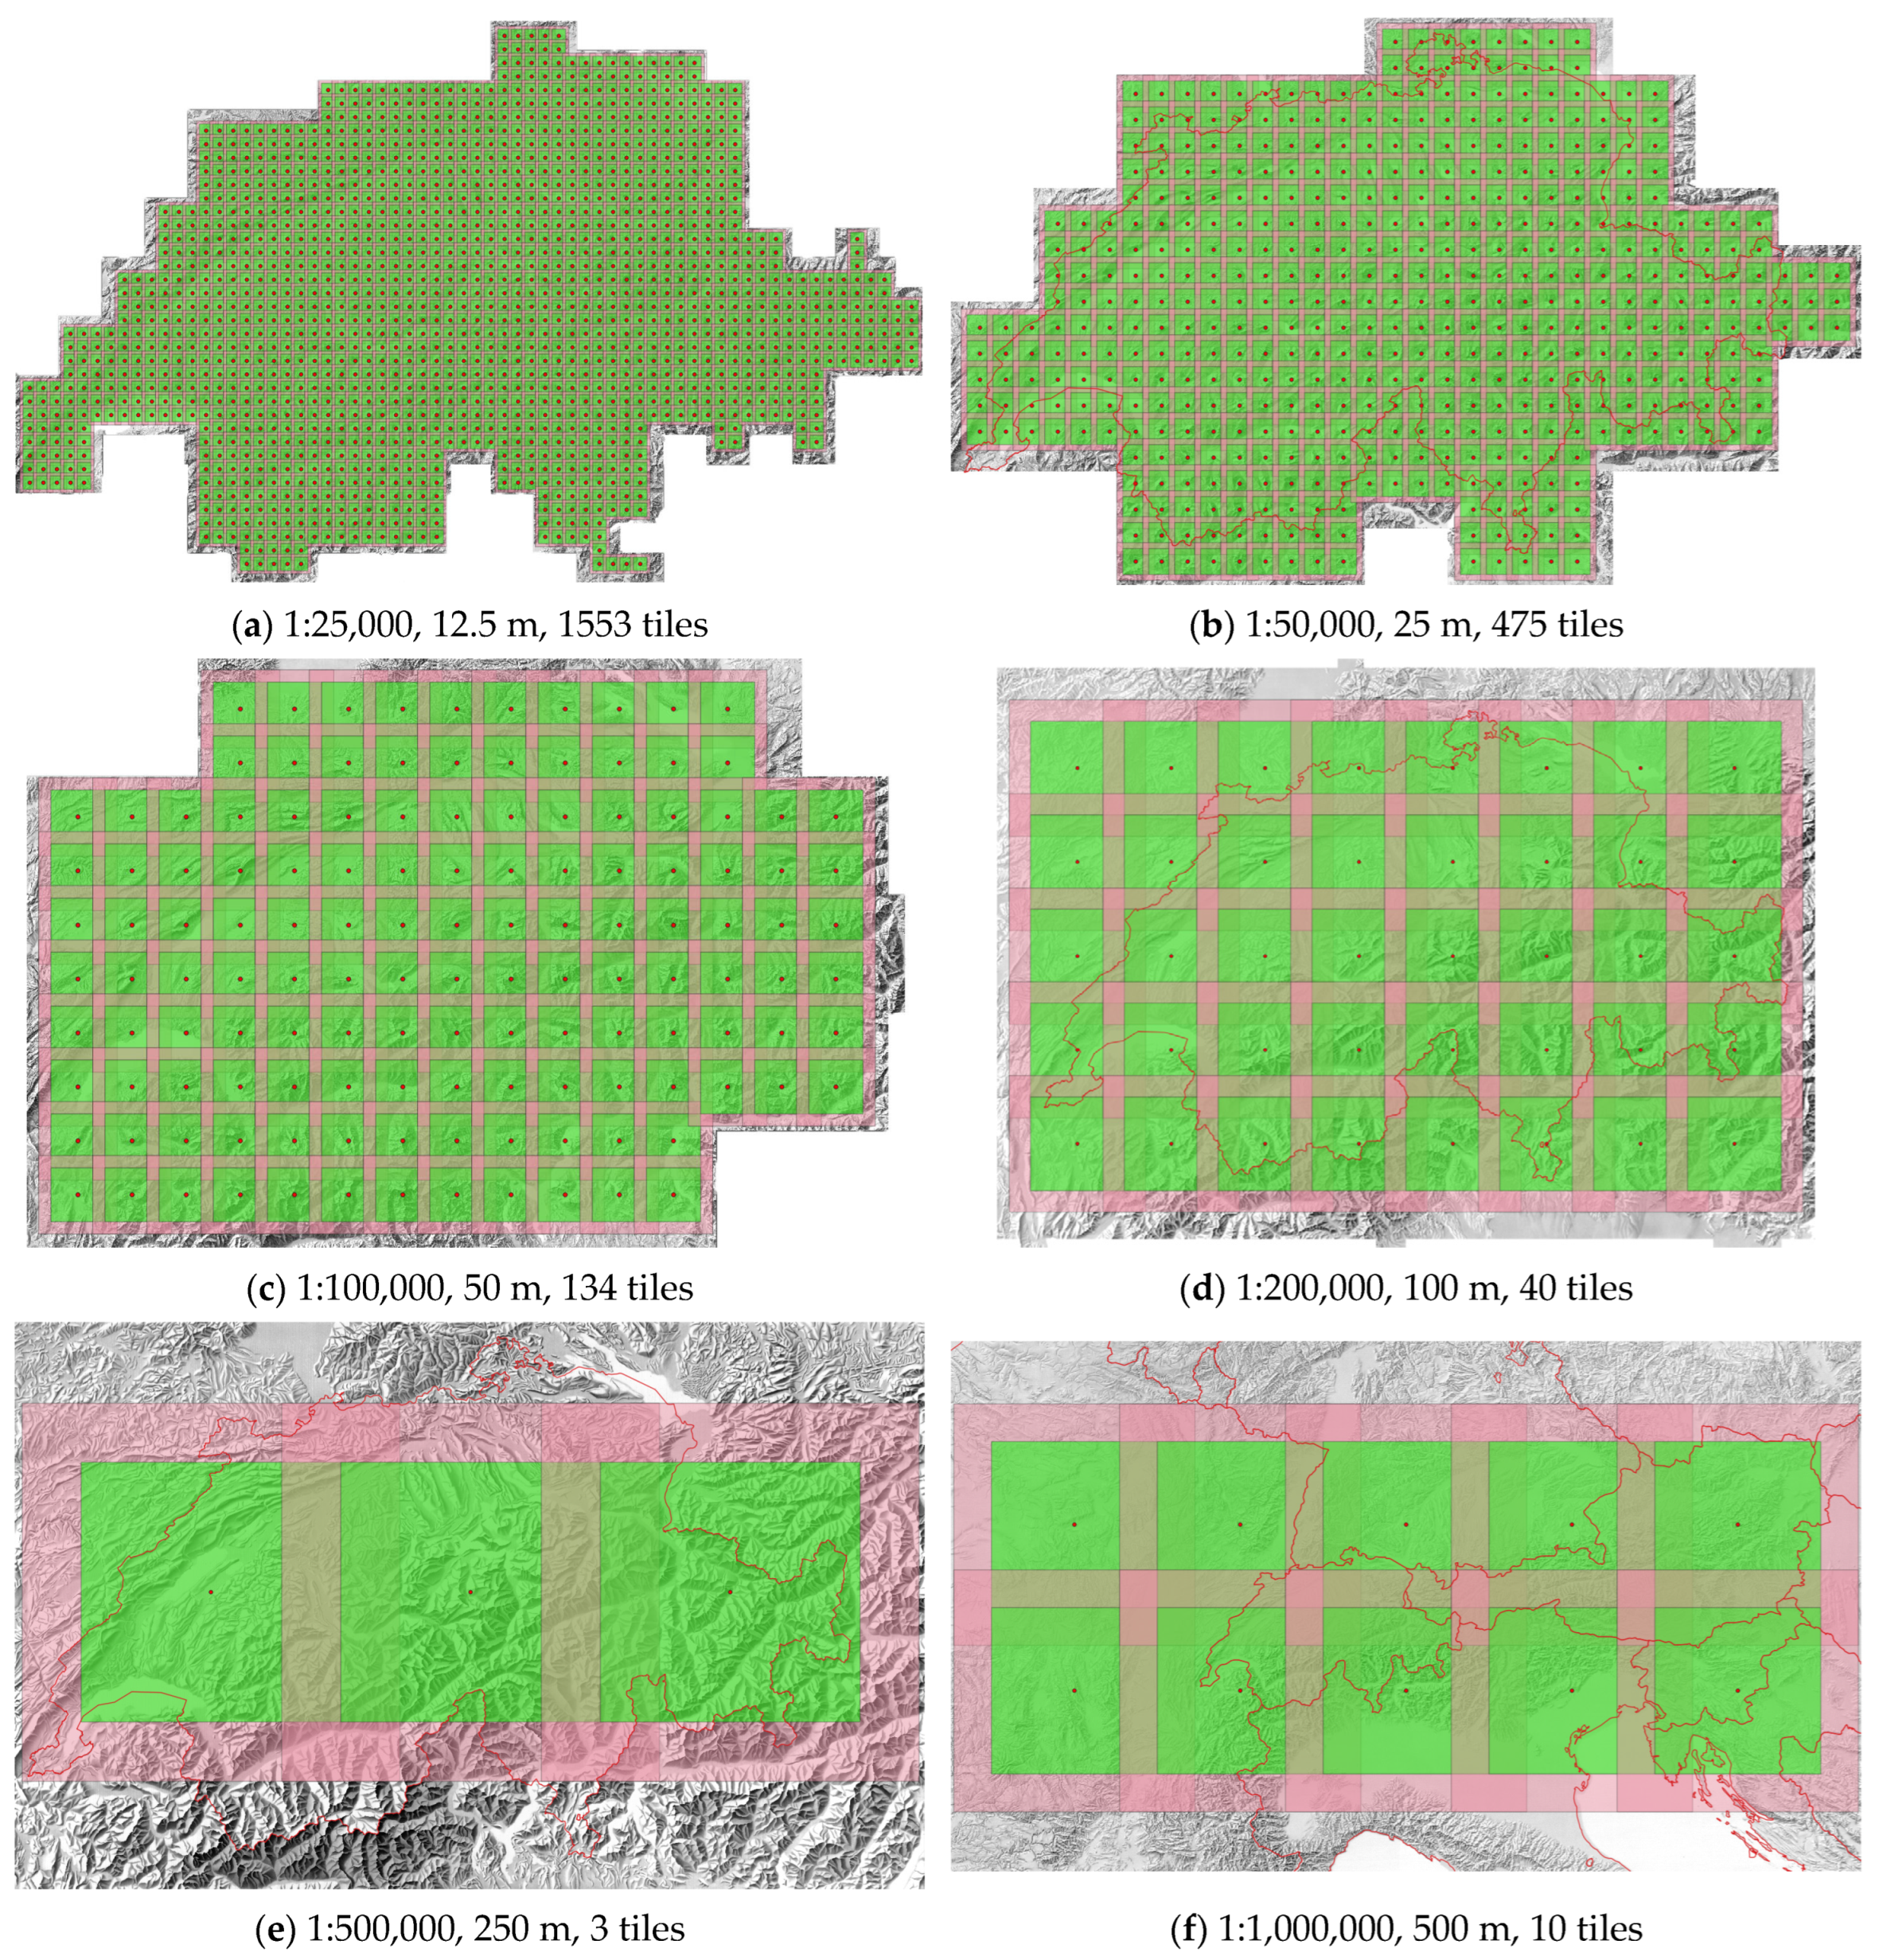
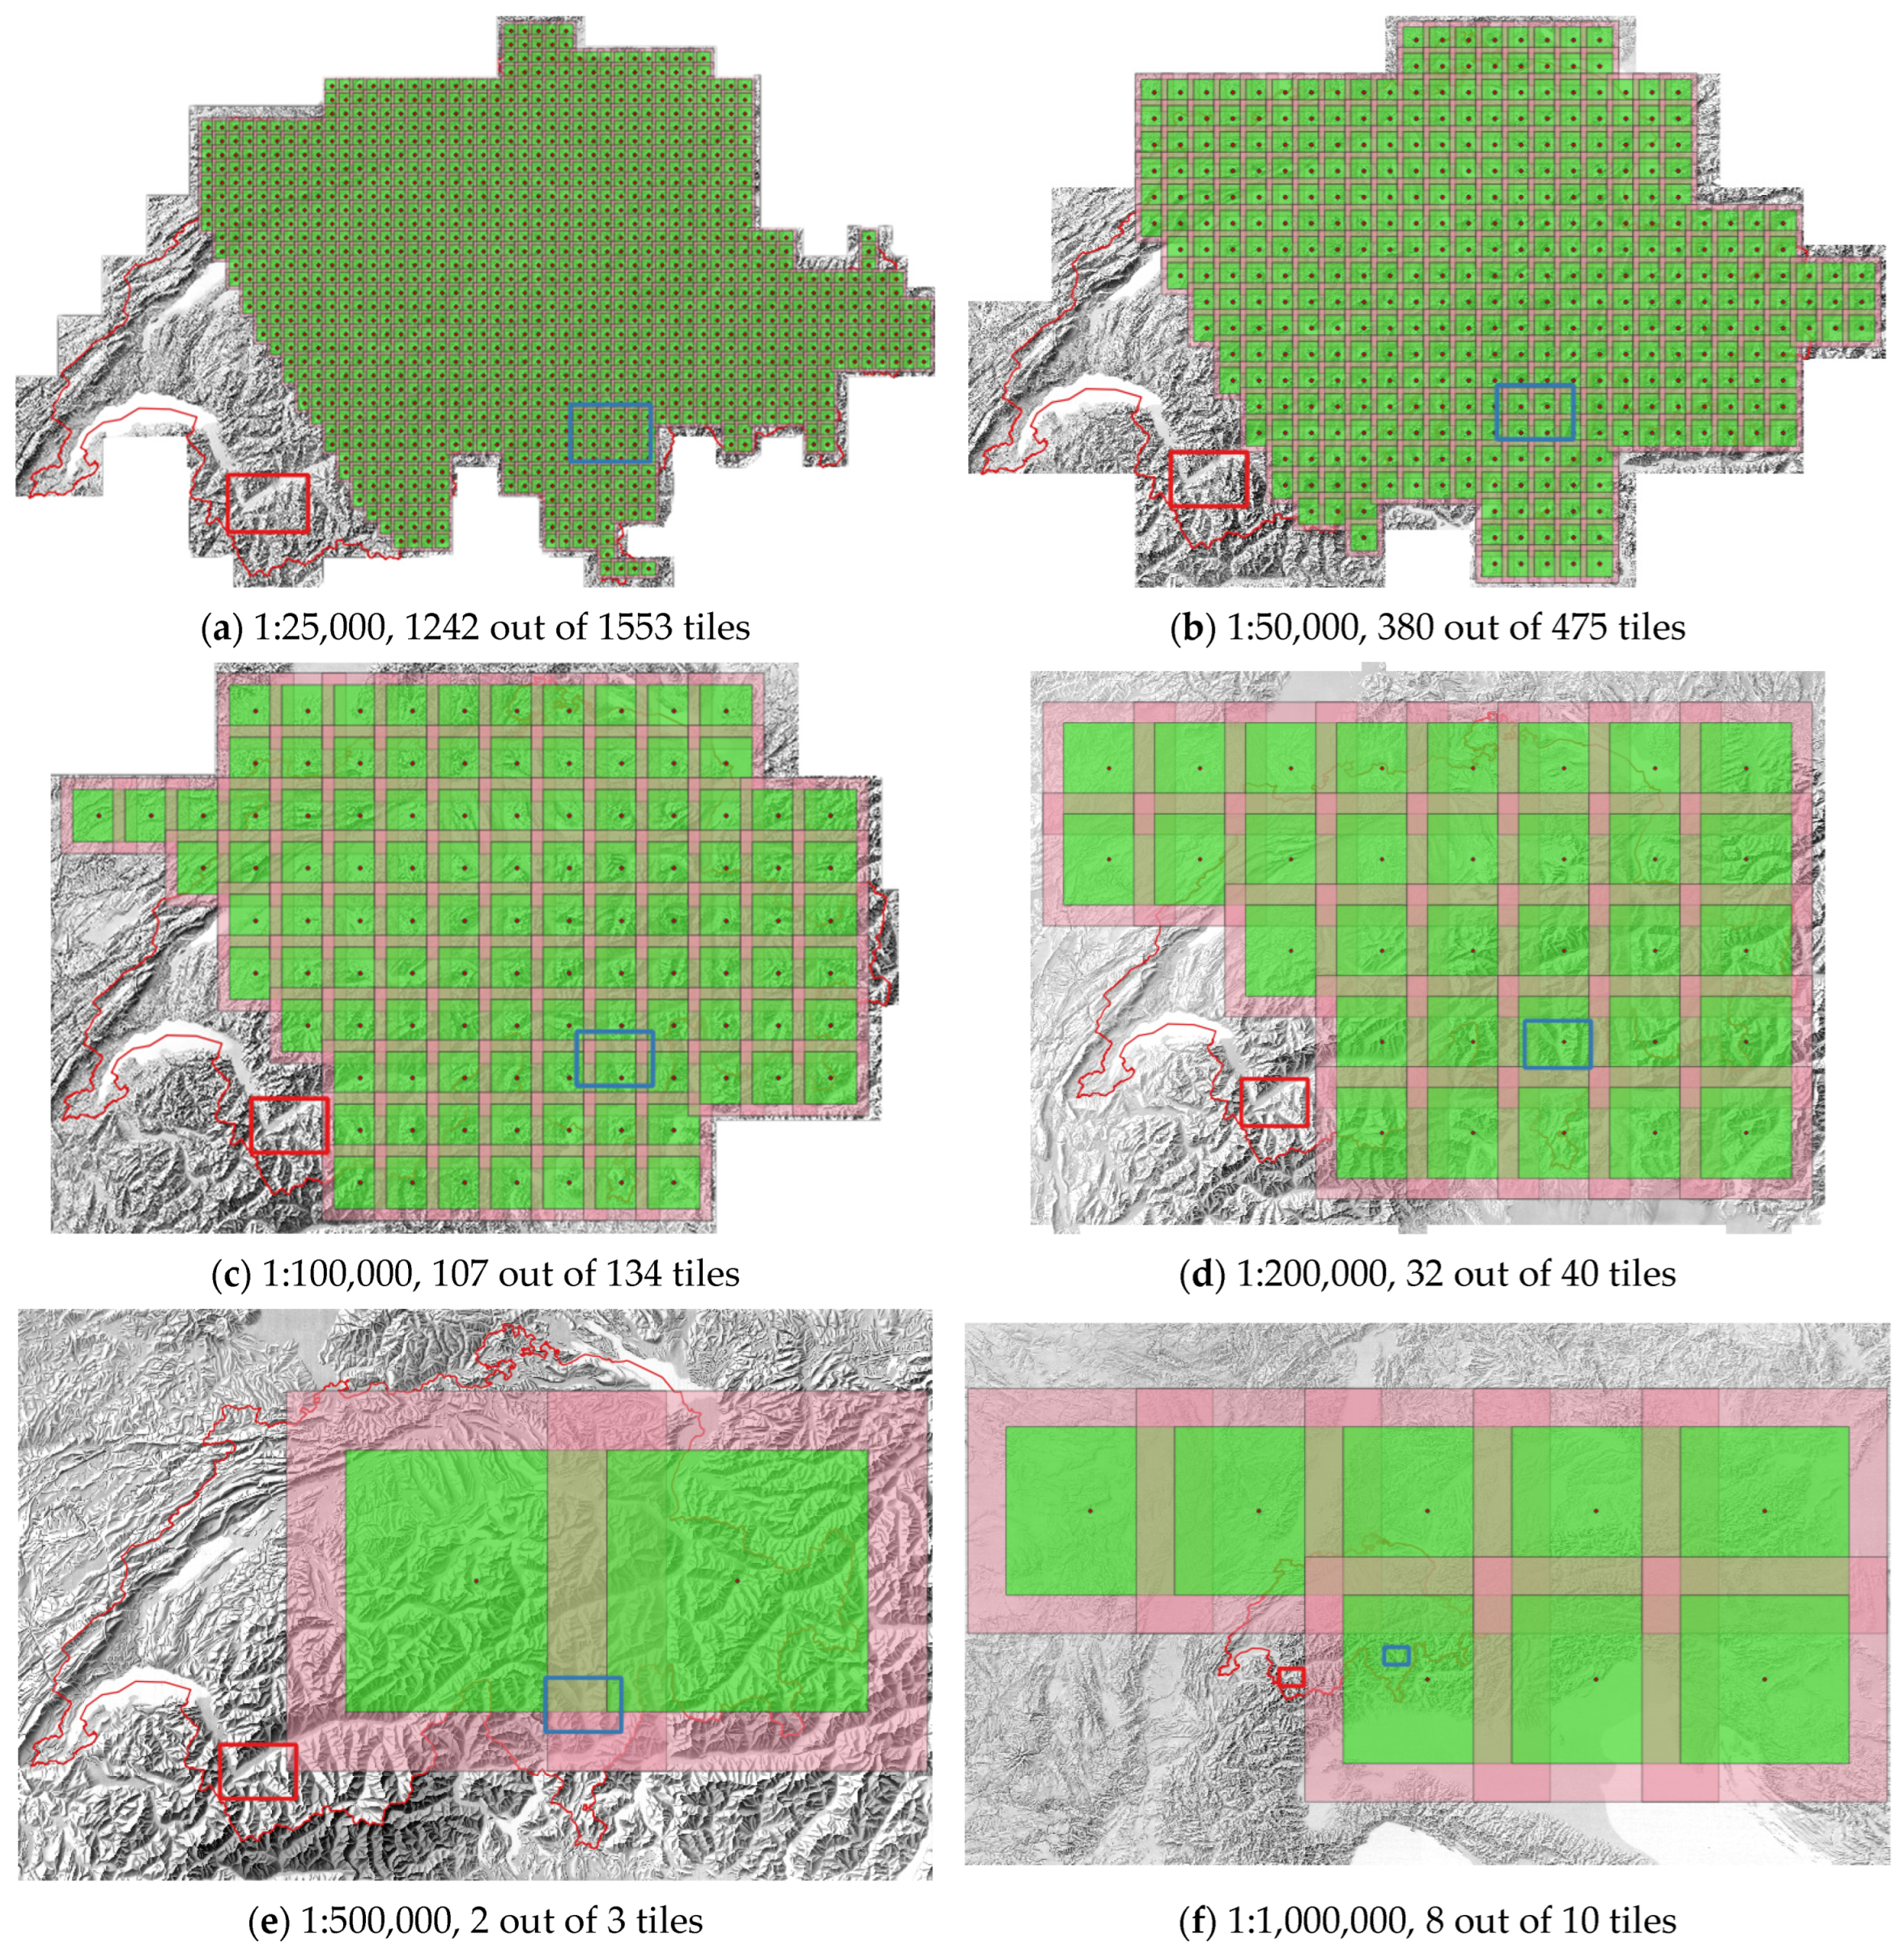
For this project, we trained the network using the following U-Net architecture [18]. We used a training window equal to 440 pixels for a base, or core extent, and 100 pixels for the padding, or perimeter, around it. To add a geographic extent in meters, we multiplied the window size by each of the given resolutions. Figure 3 demonstrates the input tiles for the network, where the base is in green, the padding around it is in pink, and the padding of neighbouring tiles is overlapping.
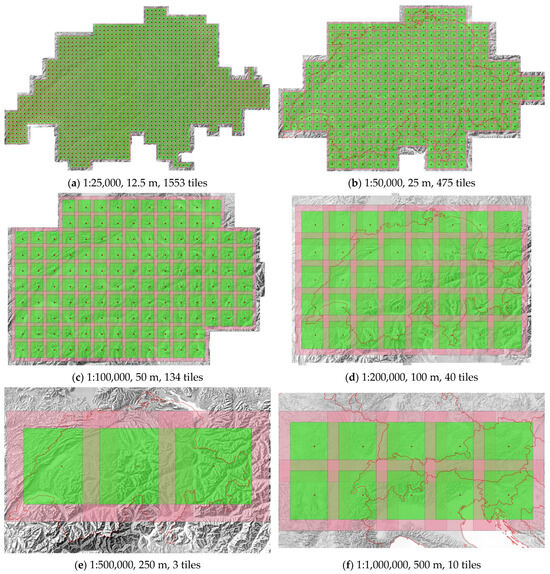
Figure 3.
Training points and tiles, where green is a base and pink is a padding.
Since the network “looks” as far as the padding areas, they have to fit within the training area. The coarser the resolution, the larger the distance between the training points gets. At resolutions of 250 m and 500 m, the distance between the training points gets as large as 110 km and 220 km and the paddings are 25 km and 50 km, respectively. This allows for only a few training points (Figure 2f and Figure 3e below).
The extent of the available manual shadings varies from scale to scale and does not offer much area for testing outside the Swiss border for all the scales (Figure 2). We left out the southwestern area of Switzerland for the same reason as we described in the former paper [19], i.e., to leave some parts where a variety of landforms occurs, and at the same time where all those landforms are present in both parts. This way we can get a good impression of the performance of the model on different landform types. At the same time, we wanted to exploit as much training data as possible to get the high-performance models; thus, we trained our network on (1) 80% of the points (Figure 4) chosen for training and validation and (2) all the training points (Figure 3). This allows us to (1) apply our models to areas other than those we trained the network on, given that testing the area in southwestern Switzerland (Figure 4) against the ground truth (manual relief shading) gives good results; and (2) see whether exploiting more training points leads to considerably better results.
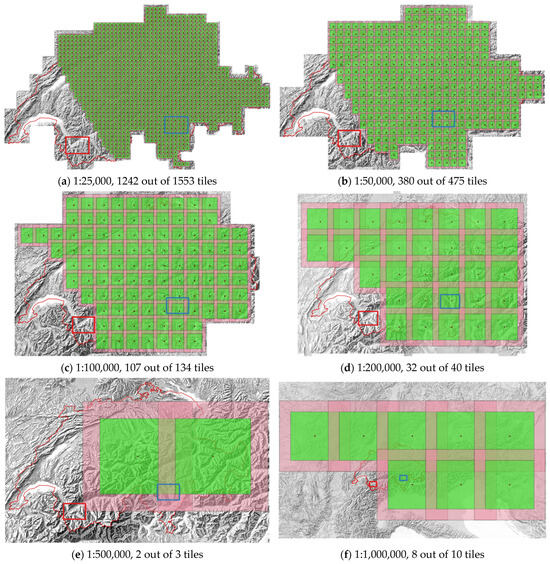
Figure 4.
Training with 80% of the training points; the polygon outlined in red represents the testing area and the polygon outlined in blue shows the clipped area in the canton of Ticino for predictions in the next table.
The training was conducted first with fixed resolutions of 12.5 m, 25 m, 50 m, and 100 m across different scales (4 models) to observe the impact of resolution on predictions, if any. Next, we trained the network with both changing resolutions and scales (6 scales × 4 resolutions, i.e., 24 models) twice, using 80% and 100% of the training points and early stopping. We trained the network at least once for each setting, which resulted in more than 48 models and predictions. Testing was performed on an area in the southern–western part of Switzerland, outside of the training area (Figure 4).
3. Results
This section gives an overview of the results of this research, their interpretation, and quality assessment. The predictions should show the right level of detail and brightness, which we should identify for each scale and resolution based on both visual and quantitative inspection. By the right level of detail, we mean the level of geographic detail that is useful to read a map and does not overload it [17], and with regard to the relief, the balanced level of smaller detail and yet identifiable larger relief forms.
3.1. Predictions
Table 2 assembles the predictions received from the four models corresponding to the four scales 1:25,000, 1:50,000, 1:100,000, and 1:200,000 trained with all the training points. The scales 1:500,000 and 1:1,000,000 were excluded from this table since the number of training points (2 out of 3 and 8 out of 10) was not enough to get eligible predictions. Here, the resolutions when training the network at each of the four scales correspond to those from Table 1 and are outlined in green. It means that the first model is the result of training the network with 1:25,000 manual relief shading at 12.5 m resolution, the second model with 1:50,000 shading at 25 m resolution, the third model with 1:100,000 shading at 50 m resolution, and the fourth model with 1:200,000 shading at 100 m resolution. The rest of the images in a row were generated using the corresponding models for a certain scale but the other three input resolutions were from 12.5 m to 100 m. To demonstrate the training results, we clipped smaller areas from the canton of Ticino for better readability.

Table 2.
Predictions table for different resolutions based on the models trained for scale/resolution ratios from Table 1 (outlined in green).
Naturally, models trained at specific resolutions would not perform the same at other resolutions. Coarser resolutions result in blurry images, as for 1:25,000 and 1:50,000, while finer resolutions for smaller scales end up de-emphasizing larger landforms. The latter is also clear, since the smaller the search window is, the less area the network has access to and learns from.
On the other hand, Table 3 and Table 4 display the predictions of 24 models (6 scales × 4 resolutions) generated with 80% and 100% training points at each of the scales and each of the resolutions with the aim of finding the most appropriate scale–resolution combination visually corresponding to its manual shaded relief analogue. As in Table 2, we outline in green the predictions based on the input resolutions from Table 1. The adjacent resolution images in every row next to those outlined in green are the ones potentially also matching the quality of manual relief shadings, which will be found at the evaluation stage. Since the goal of this research is to apply the generated models to any area, the testing area here is located outside the training area as shown in Figure 4, but within Switzerland to make the comparison possible.

Table 3.
Predictions at different resolutions and different scales with 80% training points, where scale/resolution ratios from Table 1 are outlined in green.

Table 4.
Predictions at different resolutions and different scales with 100% training points, where scale/resolution ratios from Table 1 are outlined in green.
Table 3 and Table 4 show that the predictions highlighted in green deliver a more optimal ratio between detail level and tonal brightness in contrast to those located further from them in each line, though visual differences between predicted values at adjacent resolutions are often barely noticeable.
The 1:500,000 and 1:1,000,000 scales are also included. They demonstrate rather similar predictions with slight contrast and brightness differences and some artefacts at the finest resolution of 12.5 m, which means that much finer resolutions than those needed for the two scales would result in nearly no change in the predictions but unnecessarily large image sizes; thus, small scales do require coarser resolutions. To obtain the predictions at coarser resolutions of 250 m and 500 m, we would have to get more training points by changing the base and the padding (the size of the training window), whereas it is important to keep the same base and padding of the training window for consistency and further comparison between the scales. Therefore, for our research, we only evaluate the predictions based on resolutions of up to 100 m, and the resulting predictions for the smallest scales prove the eligibility of the scale/resolution ratios by Tobler from Table 1.
When comparing the highlighted predictions from the last two tables to the manual relief shadings as our ground truth data in Table 5, one can see that the neural relief shadings generally show a slightly lower level of detail (especially on the slopes) and slightly less contrast between opposing slopes on different sides of ridgelines. At the same time, there is a slightly higher degree of aerial perspective effect in terms of subtle, blurry transitions from lowlands to slopes and the highest peaks [19], as suggested by Imhof [1].

Table 5.
Comparison of the outlined predictions and manual shaded reliefs (outlined in green) at the same scales.
If at large scales manual shadings reveal more detail on slopes compared to both predictions, at small scales of 1:100,000 and 1:200,000, manual relief presents a higher level of generalisation than neural reliefs. Small relief features such as alluvial fans (at the top middle) are clearly better emphasised at all the scales of the manual reliefs. On neural shadings, they either do not display enough detail and merge with the valley at large scales, or do not have a convex upward appearance or well-defined edge at small scales.
The white patches in the middle of the valley in the predictions generated with 80% of the training points are not artefacts; they appear on predictions since lakes on manual shadings are depicted as white. However, this is well learnt by the network with more training data, and in the middle column of Table 5, we see no white patches within valleys where there are no lakes. The neural shadings also show less obvious borders between the sheets (tiles) as seen, for instance, at the manual shadings at scales of 1:50,000 and 1:100,000, where the lighter to darker grey boundary in the valleys moving from north to south is caused by seems between paper sheets of manual relief shadings.
To sum up, the more training data are available, the better the neural shadings are expected after the training. However, overall, the models trained with 80% of the training points deliver fine predictions with levels of detail and brightness comparable to those of manual shadings.
The predictions with higher resolutions than those highlighted in green (Table 3 and Table 4) bear the missing details, but not necessarily the overall contrast level and focus on larger relief forms. Thus, we proceed with quantitative evaluation in order to assess the validity of the scales and resolutions from Table 1 with regard to relief shading.
3.2. Evaluation
When interpreting the neural shadings in the previous section, we performed a brief visual similarity check of the predictions vs. manual relief shadings. In this section, we quantitatively evaluate them by means of pixel subtraction, tonal distribution, and heat maps.
3.2.1. Interactive Web Application for Manual Relief Shadings and Prediction Comparisons
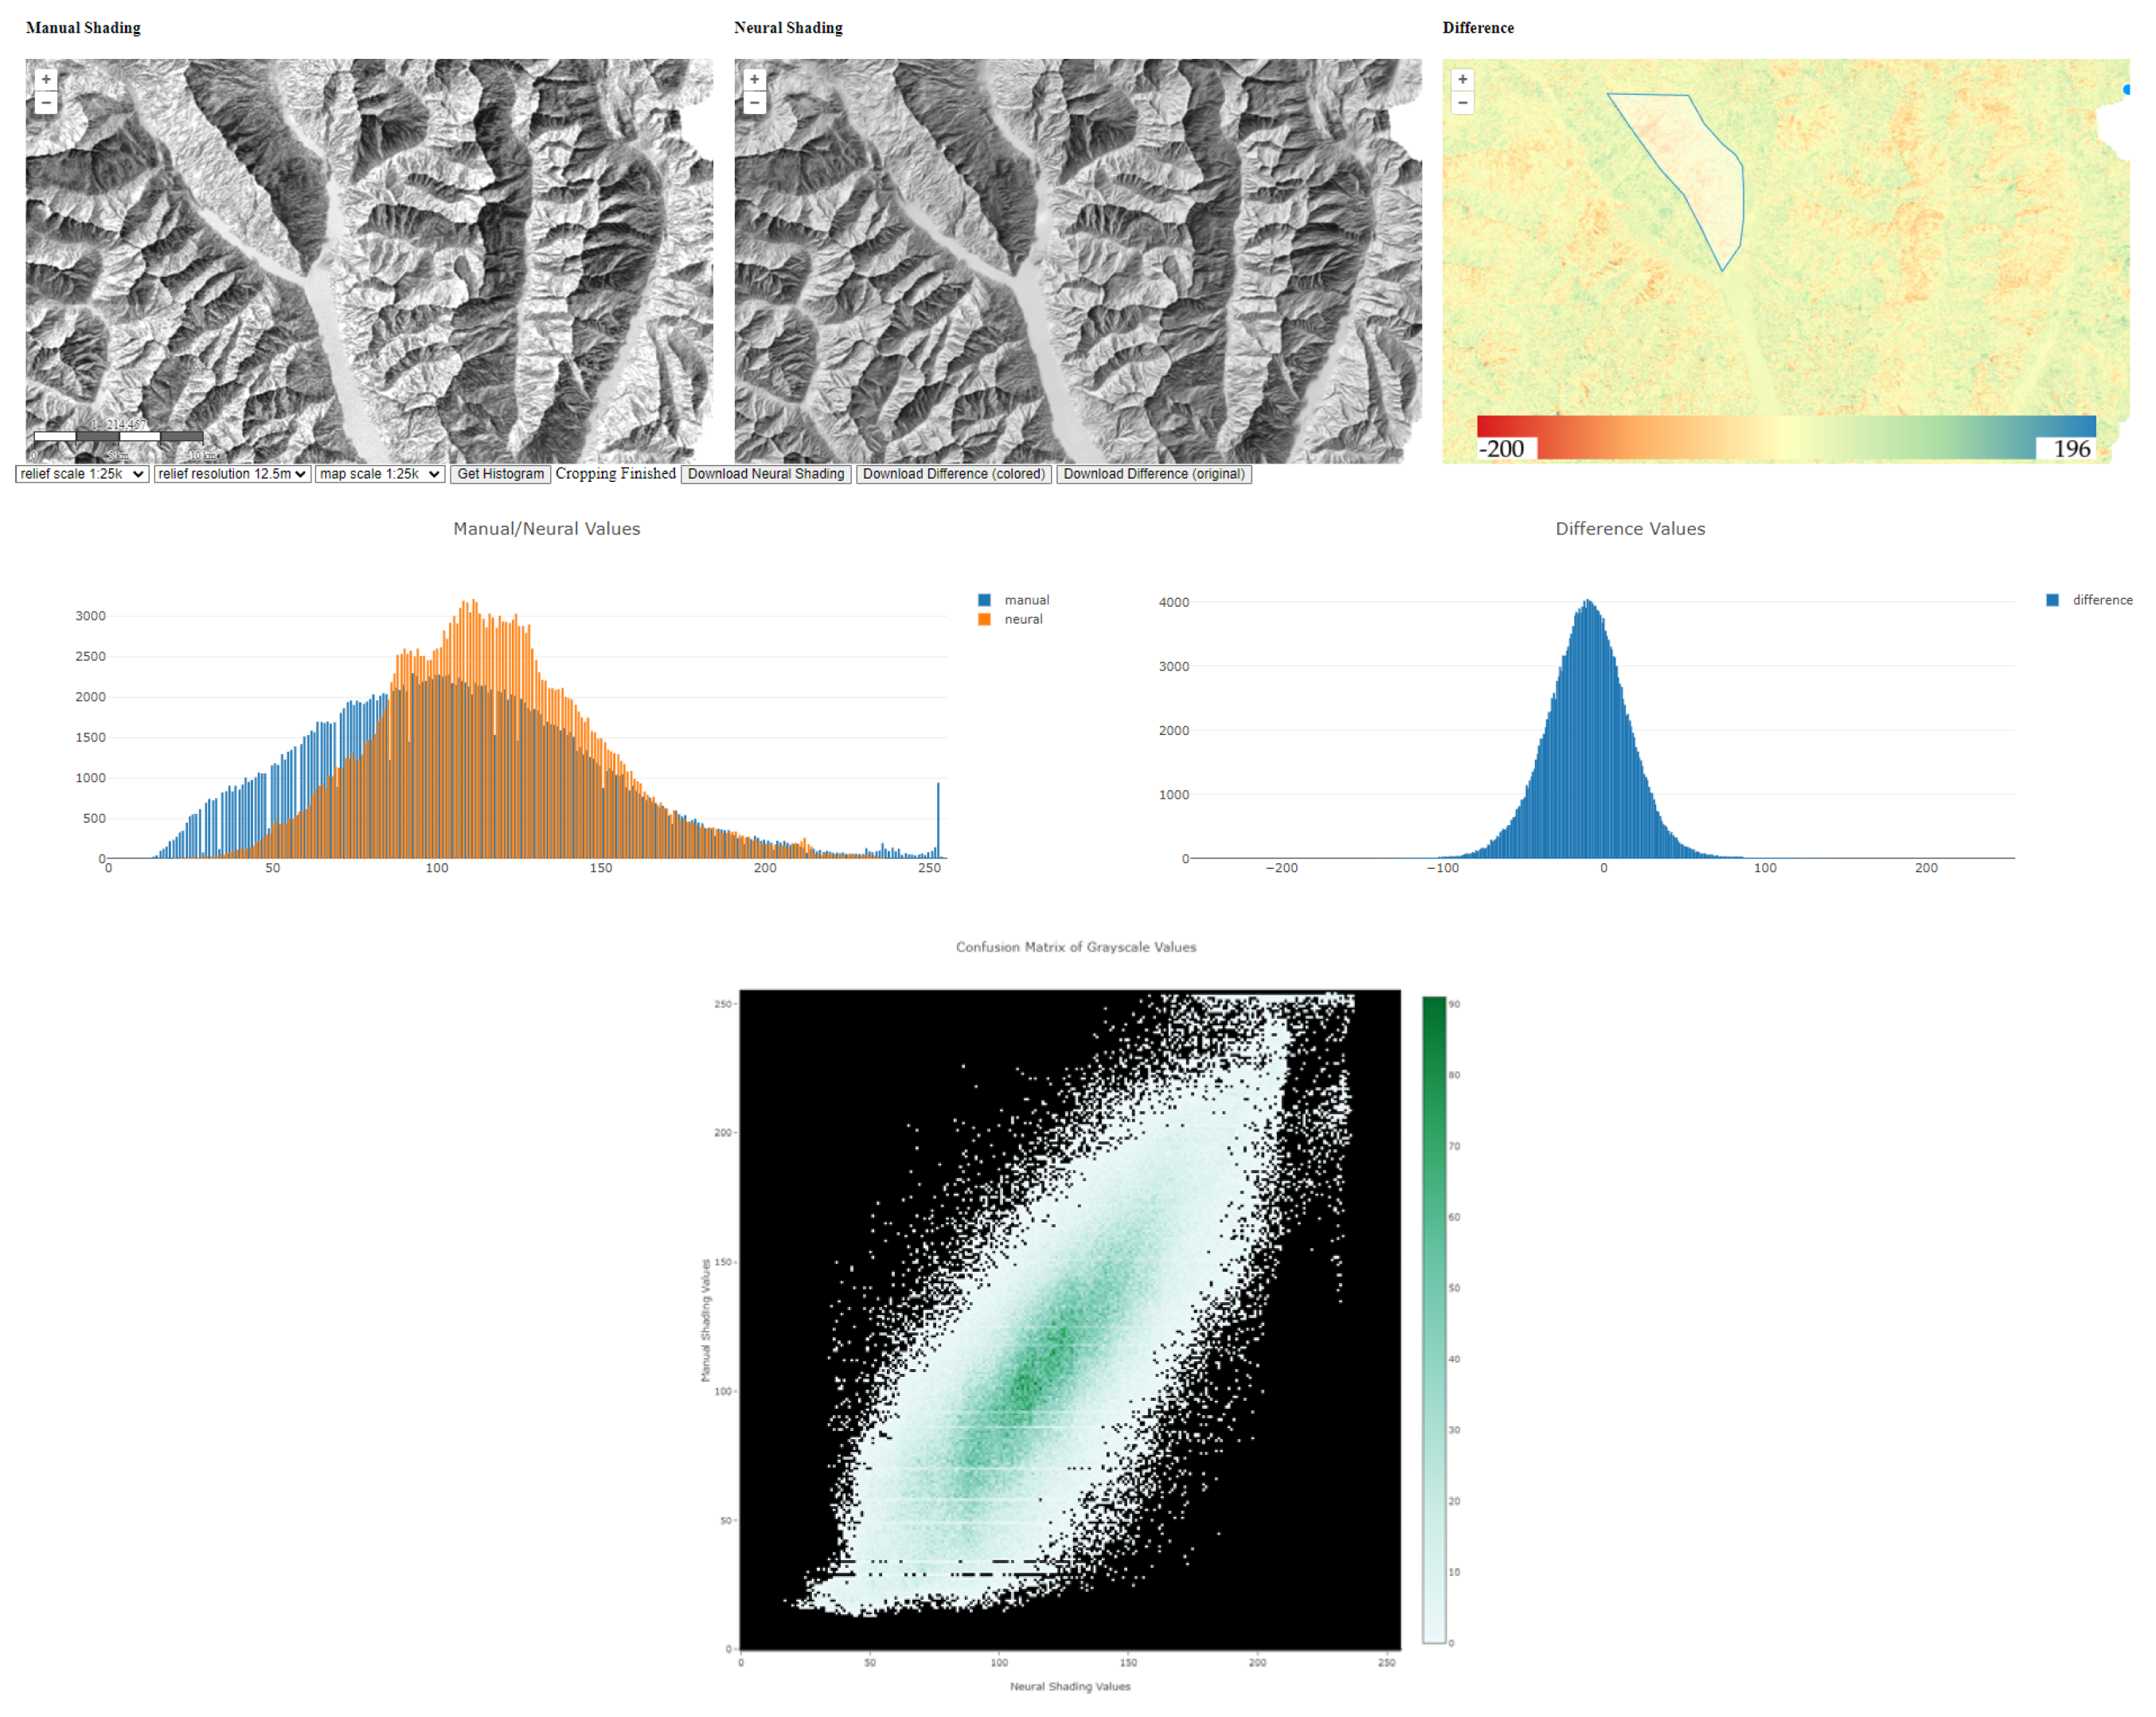
We designed a web application that should help users explore the manual and neural relief shadings and compare them when placed next to each other (Figure 5). It displays the swisstopo manual relief shadings, already generated predictions according to Table 3 for the area of Switzerland, and their difference images. In addition, it allows for outlining an area, for instance, an illuminated or a shadowed slope, downloading the cropped raster files, showing overlaid histograms of varying brightness between manual and neural shadings and of their difference values, and delivering confusion matrices for the outlined areas presented as a sort of heat map. This interactive tool can be found and tested at www.reliefshading.ethz.ch (accessed on 3 September 2024).
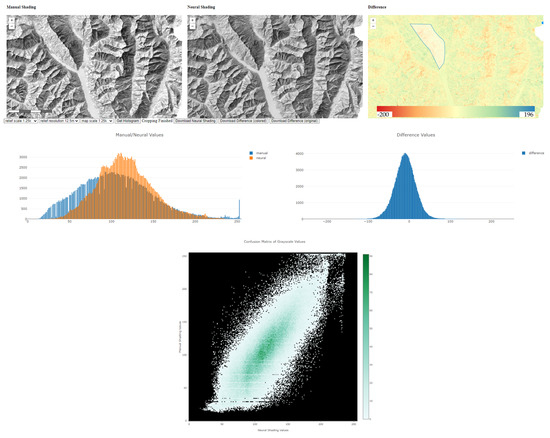
Figure 5.
Interactive web tool allowing users to outline an area and show histograms of varying brightness between manual and neural shadings (left), histograms of difference values (right), overlaid statistical values, and a confusion matrix of grayscale values.
The histogram of the outlined area, visible on the rightmost difference image, indicates that neural shading is too dark on non-illuminated slopes with a more middle-grey tone in the range 90–160, but much less dark tones (less contrast) and no or almost no bright values in the range 240–255. The histogram of the difference values shows how close mean values are to zero and whether they are on a darker or brighter side. In the subsections below, we have a closer look at these differences.
3.2.2. Subtraction
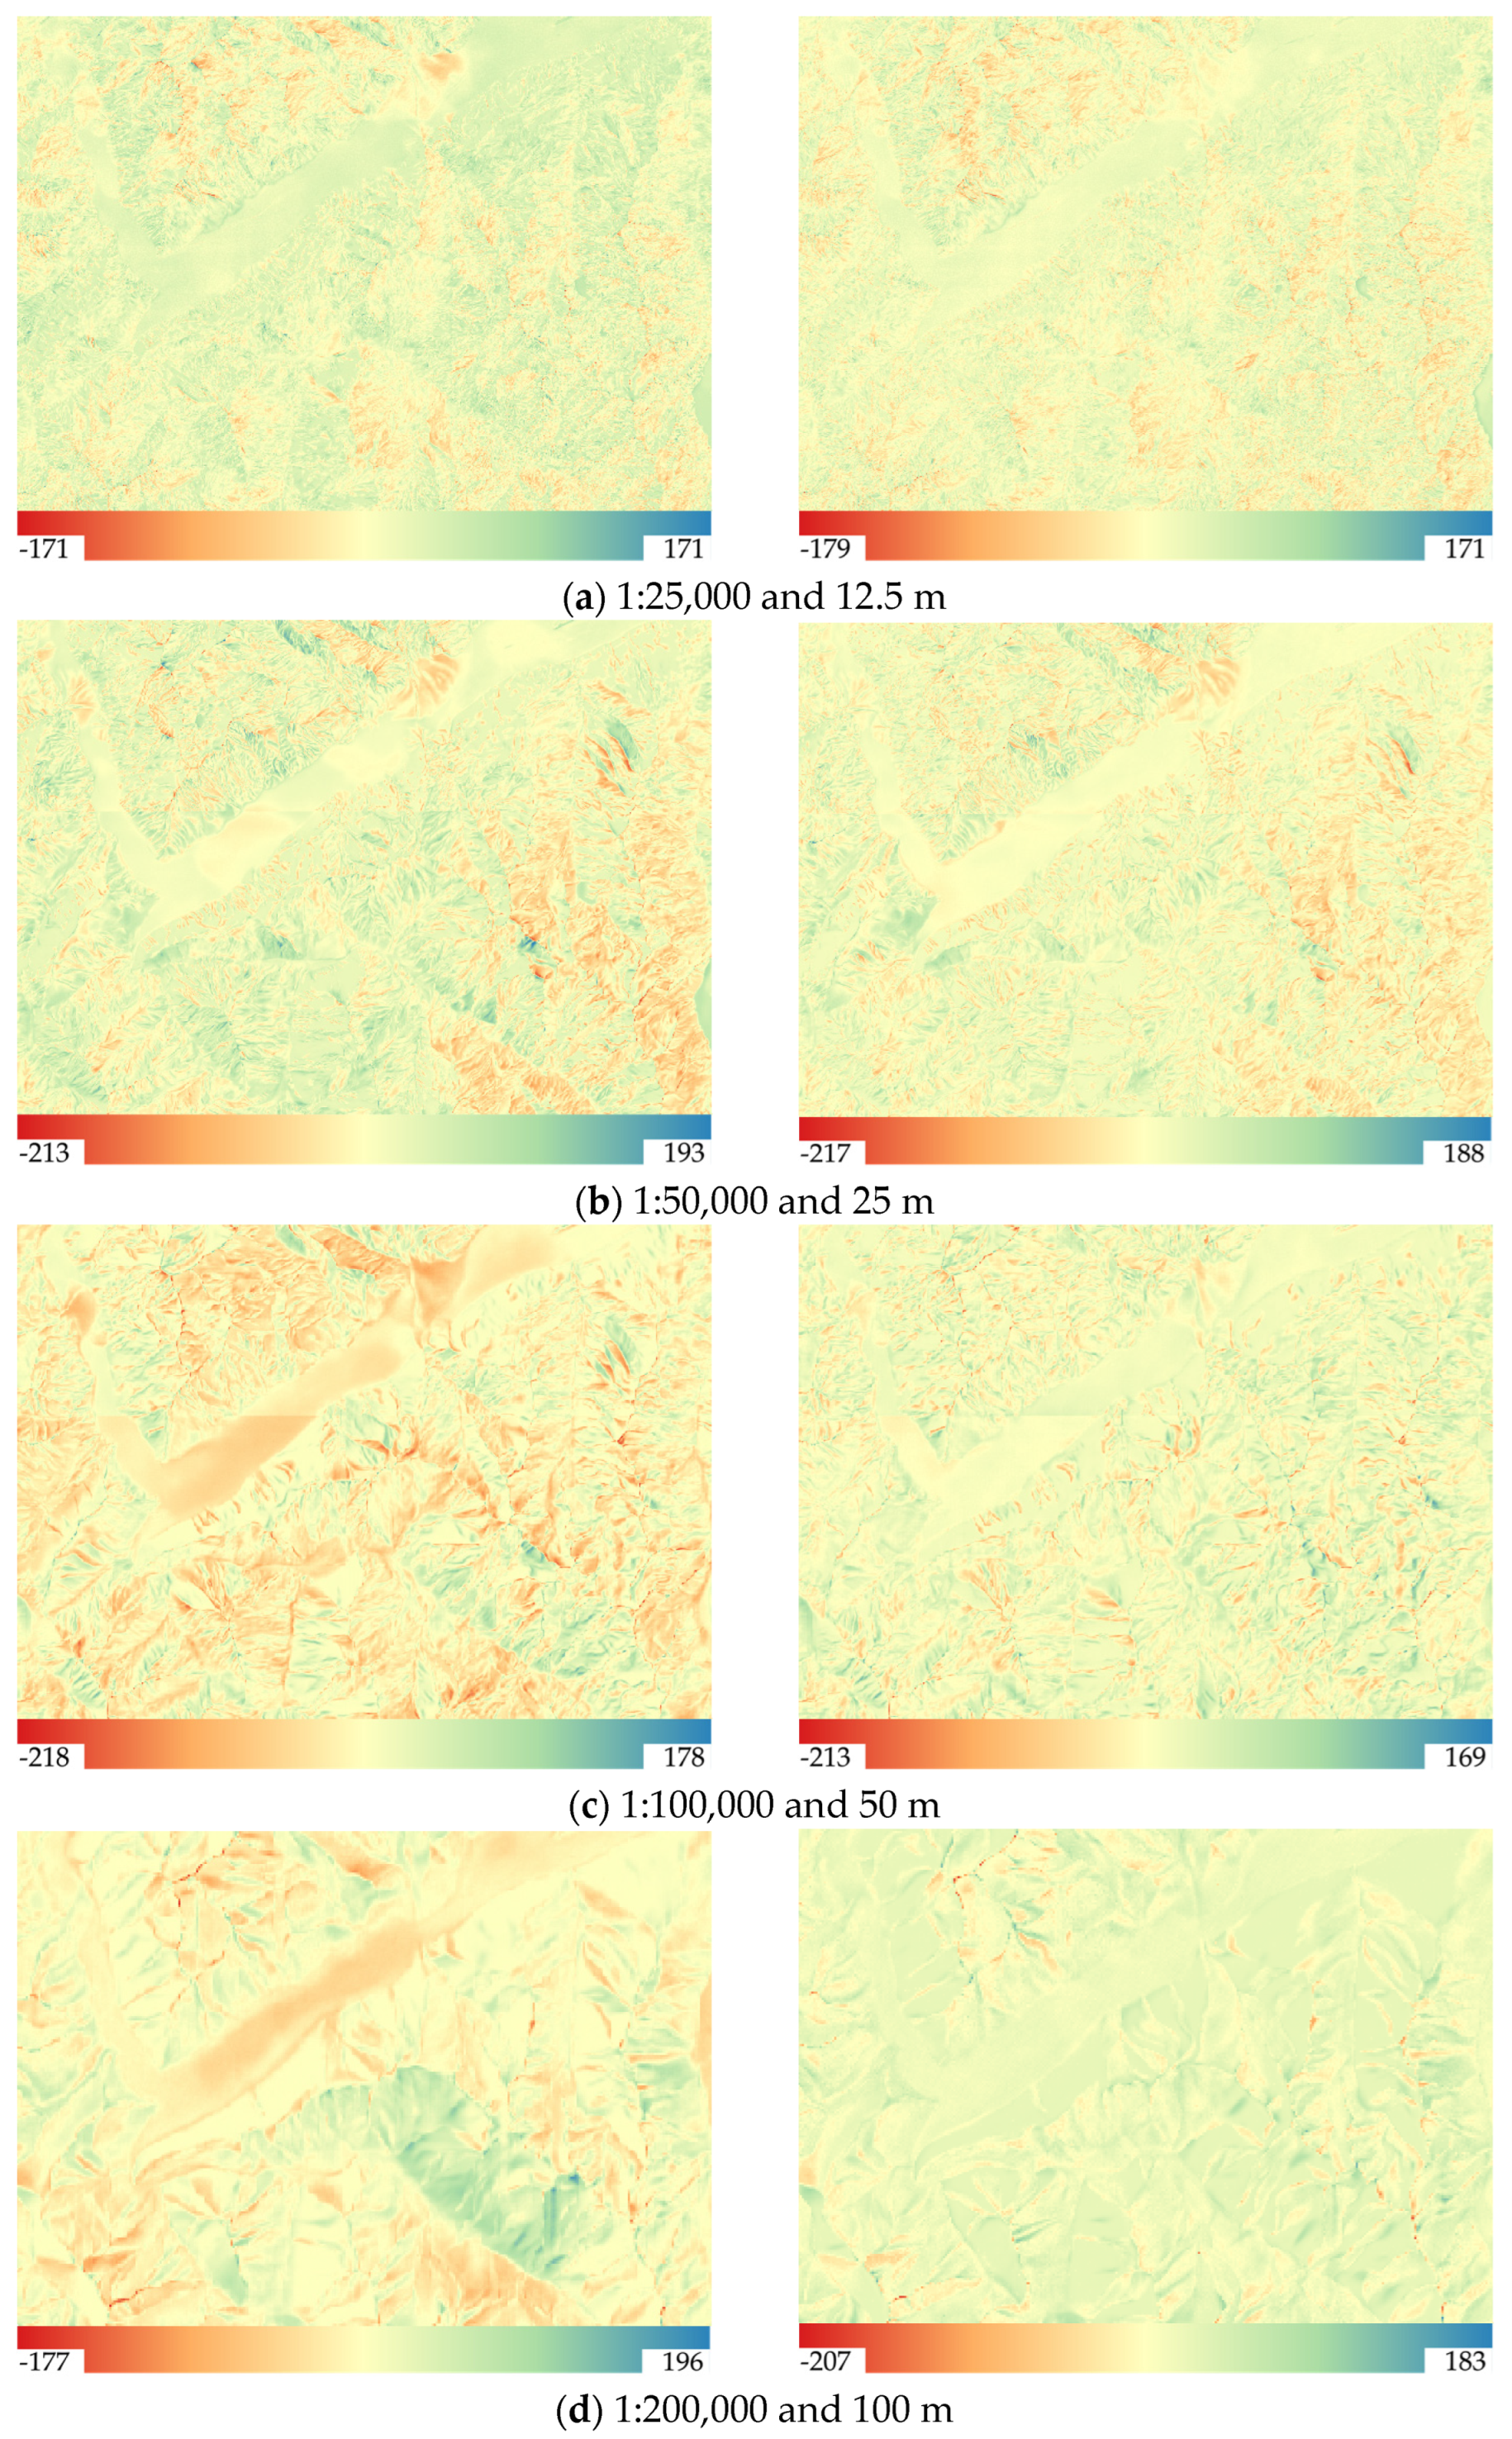
To visualise differences between manual and neural shadings, we performed pixel-based subtraction (Figure 6), where yellow and close-to-yellow tones show similar values, red tones demonstrate values that are darker on manual reliefs, and green tones depict lighter areas on manual reliefs.
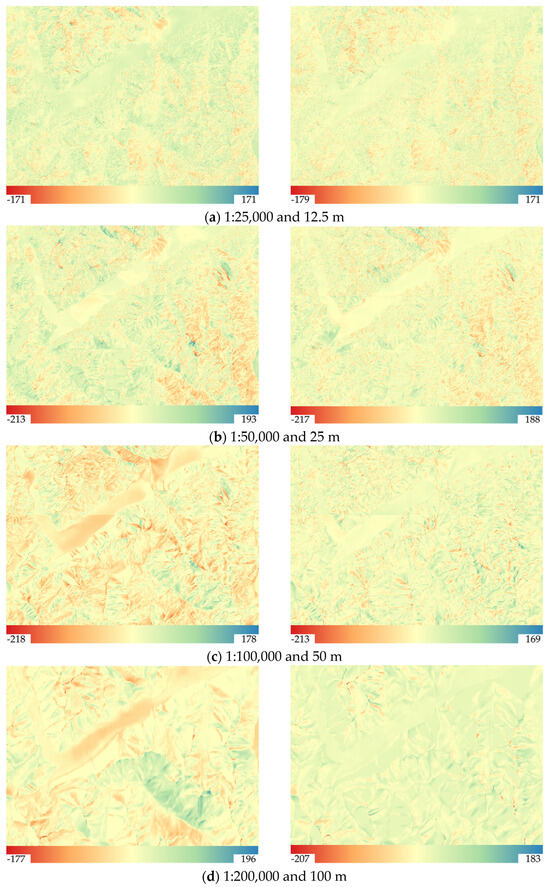
Figure 6.
Neural relief shadings trained with 80% of the points (left) and 100% of the points (right) subtracted from the manual relief shadings with the minimum and maximum tonal difference values for that specific area at (a) 1:25,000 and 12.5 m resolution, (b) 1:50,000 and 25 m resolution, (c) 1:100,000 and 50 m resolution, and (d) 1:200,000 and 100 m resolution.
Based on this, we may see similar patterns at the large scales (Figure 6a,b). Here, the illuminated slopes are clearly overall lighter on manual reliefs, whereas the shadowed slopes are consistently darker than those on neural shadings are. This means that reliefs created manually still represent higher contrast at the ridges and shadowed slopes with a large presence of white and close-to-white values on the illuminated slopes. In addition, there is a higher level of detail present on manual relief shadings, while neural networks tend to smooth the smallest details and only leave the bigger ones. Big valleys also show a consistently lighter grey tone on manual relief shading, and neural shadings deliver overall darker middle-grey tones, which gets better with more training data. At the same time, the range of the difference values is lowest among the four scales.
At the smaller scales, i.e., 1:100,000 and 1:200,000, there are higher contrast differences, and the overall pattern changes (Figure 6c,d). There is mainly missing detail on slopes, and the tonal changes are equally spread on both illuminated and shadowed slopes with overall darker values on manual shadings, and ridges still lack variation in greyscale from one side to the other.
Figure 6c shows the subtraction at 1:100,000, and here we can again see tonal differences scattered on the slopes independent of the illumination direction, although these are remarkably higher differences than those at larger scales. In general, at smaller scales, manual relief shadings tend to deliver higher contrasts between light and dark values, while the predictions, in turn, give darker middle-grey values and even smoother slope shading.
The latter relates also to the smallest scale of 1:200,000 presented in Figure 6d. At the small scales, there are again both long and short ridgelines that represent the break between tonal differences, while more of the tonal values across slopes tend to match for both manual relief shadings and predictions.
At small scales, there are yellowish stripes at the foot of the mountains, which mean very similar tonal values and may speak in favour of the aerial perspective effect, well preserved in the predictions at all the scales. At the same time, it can also be because we employ the elevation of the DEM, thus the differences in elevations of valley floors can be accounted for.
To sum up, the tonal differences demonstrated that despite the generally high quality of predictions, there are still contrast changes present at all the scales to a certain degree. Manual relief shadings still possess much more bright tones and deliver more contrast at the ridge lines and overall.
3.2.3. Tonal Distribution
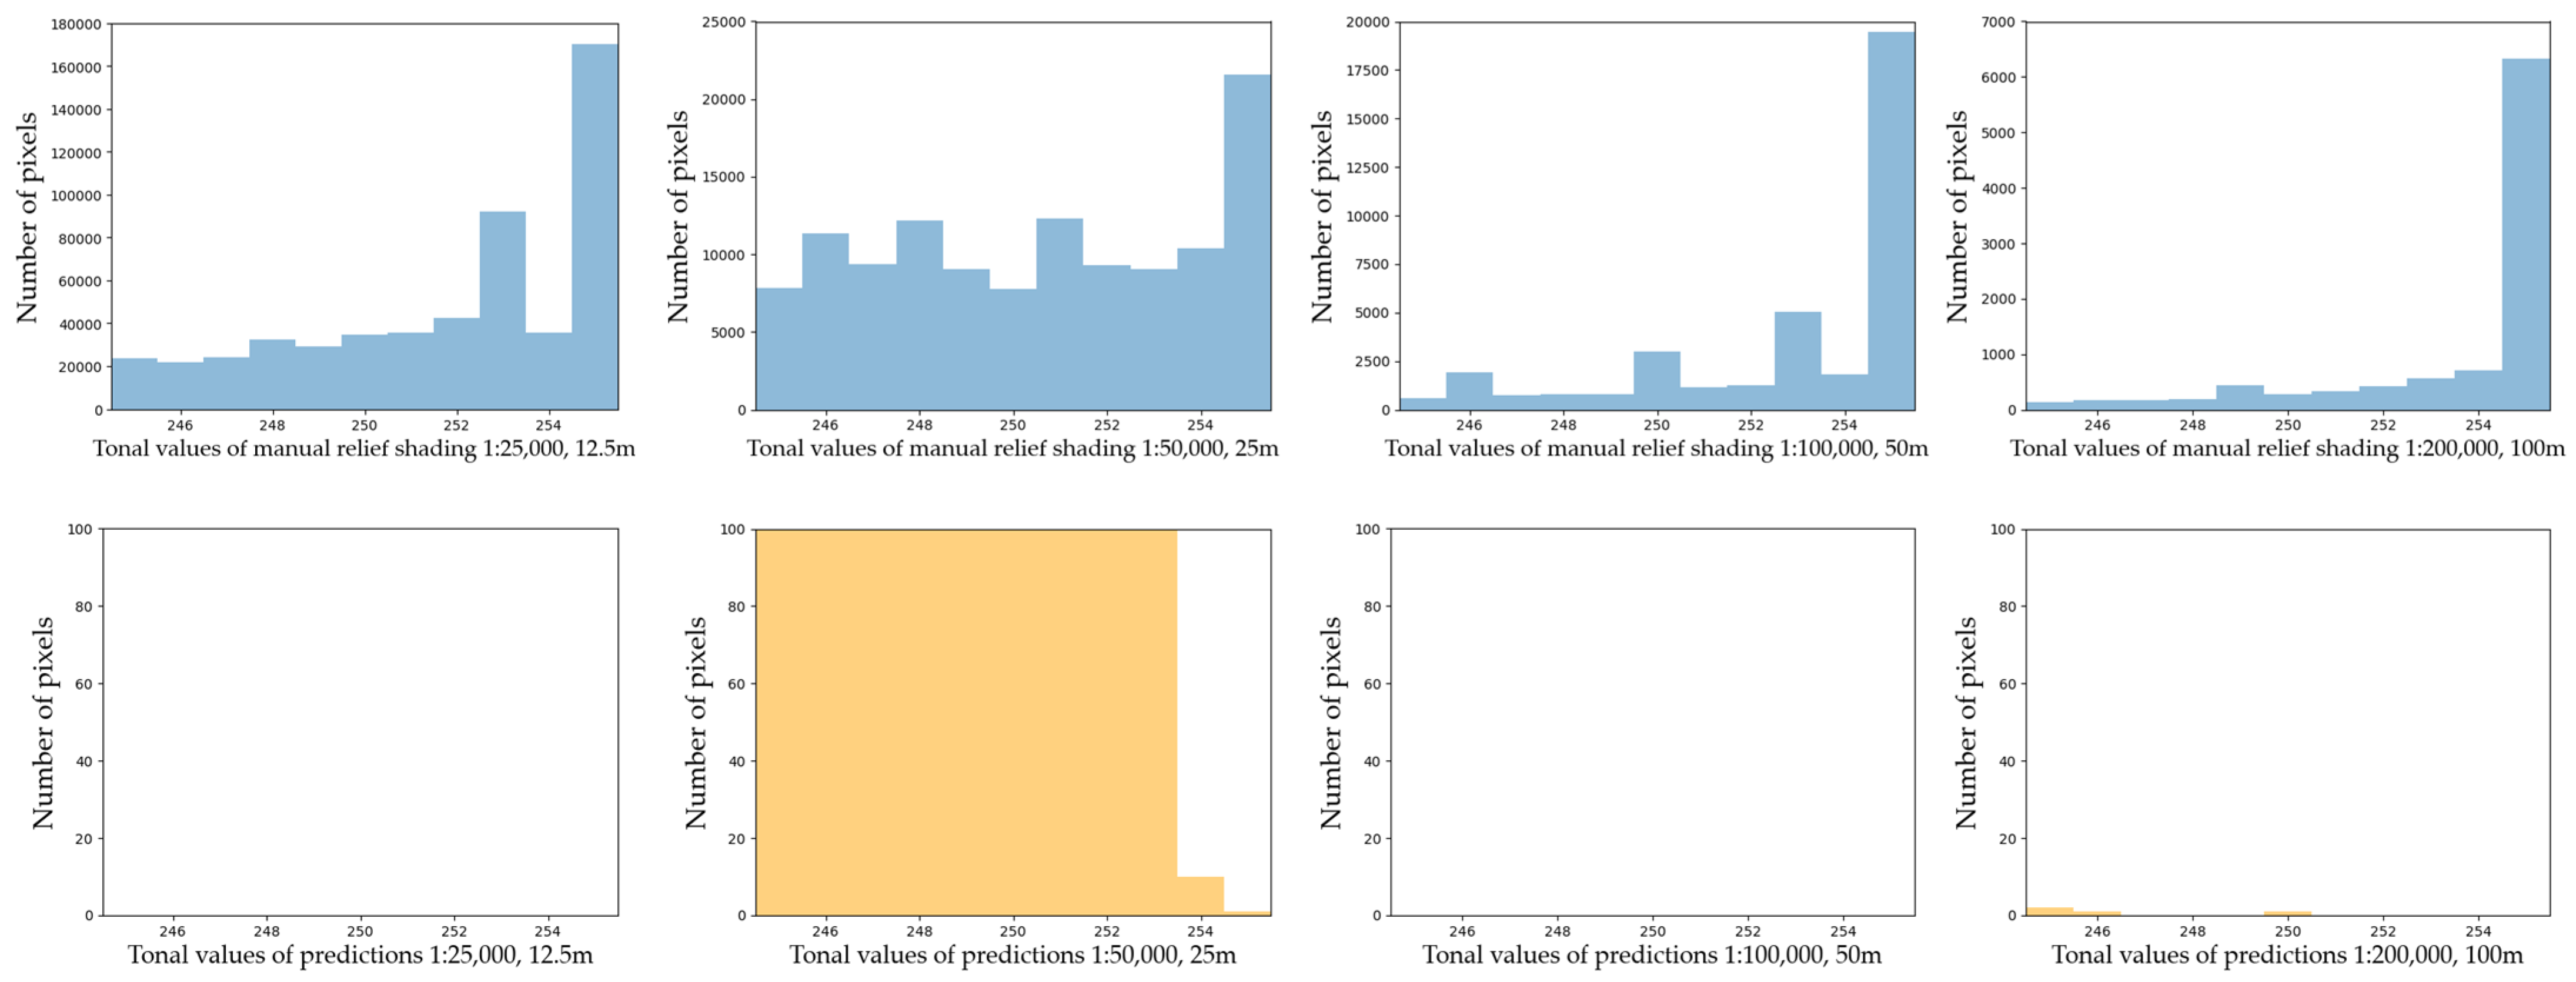
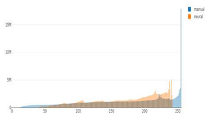
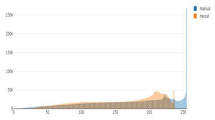
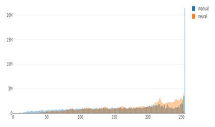
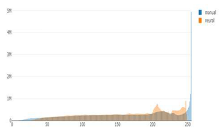
In this subsection, we check if tonal variations in predictions and our ground truth data, i.e., manual relief shadings, have similarities. Table 6 shows comparisons of the tonal distribution of predictions at different scales and resolutions.

Table 6.
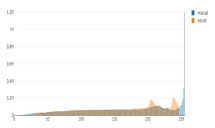
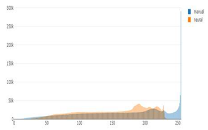
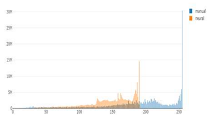
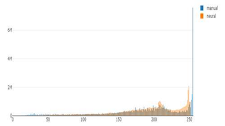
Tonal distribution of predictions (orange) and manual (blue) relief shadings for the whole area of Switzerland.
The first noticeable trend is that the number of the brightest pixels in manual shadings is up to ten times higher than that of neural shadings. The brightest values are only present in such a high amount in manually shaded reliefs, which is probably due to the presence of bright spots left white on paper, and not so much in neural shadings. These bright values are essentially paper-white values. In addition, cartographers largely used white gouache in the drawing process to emphasise the bright areas.
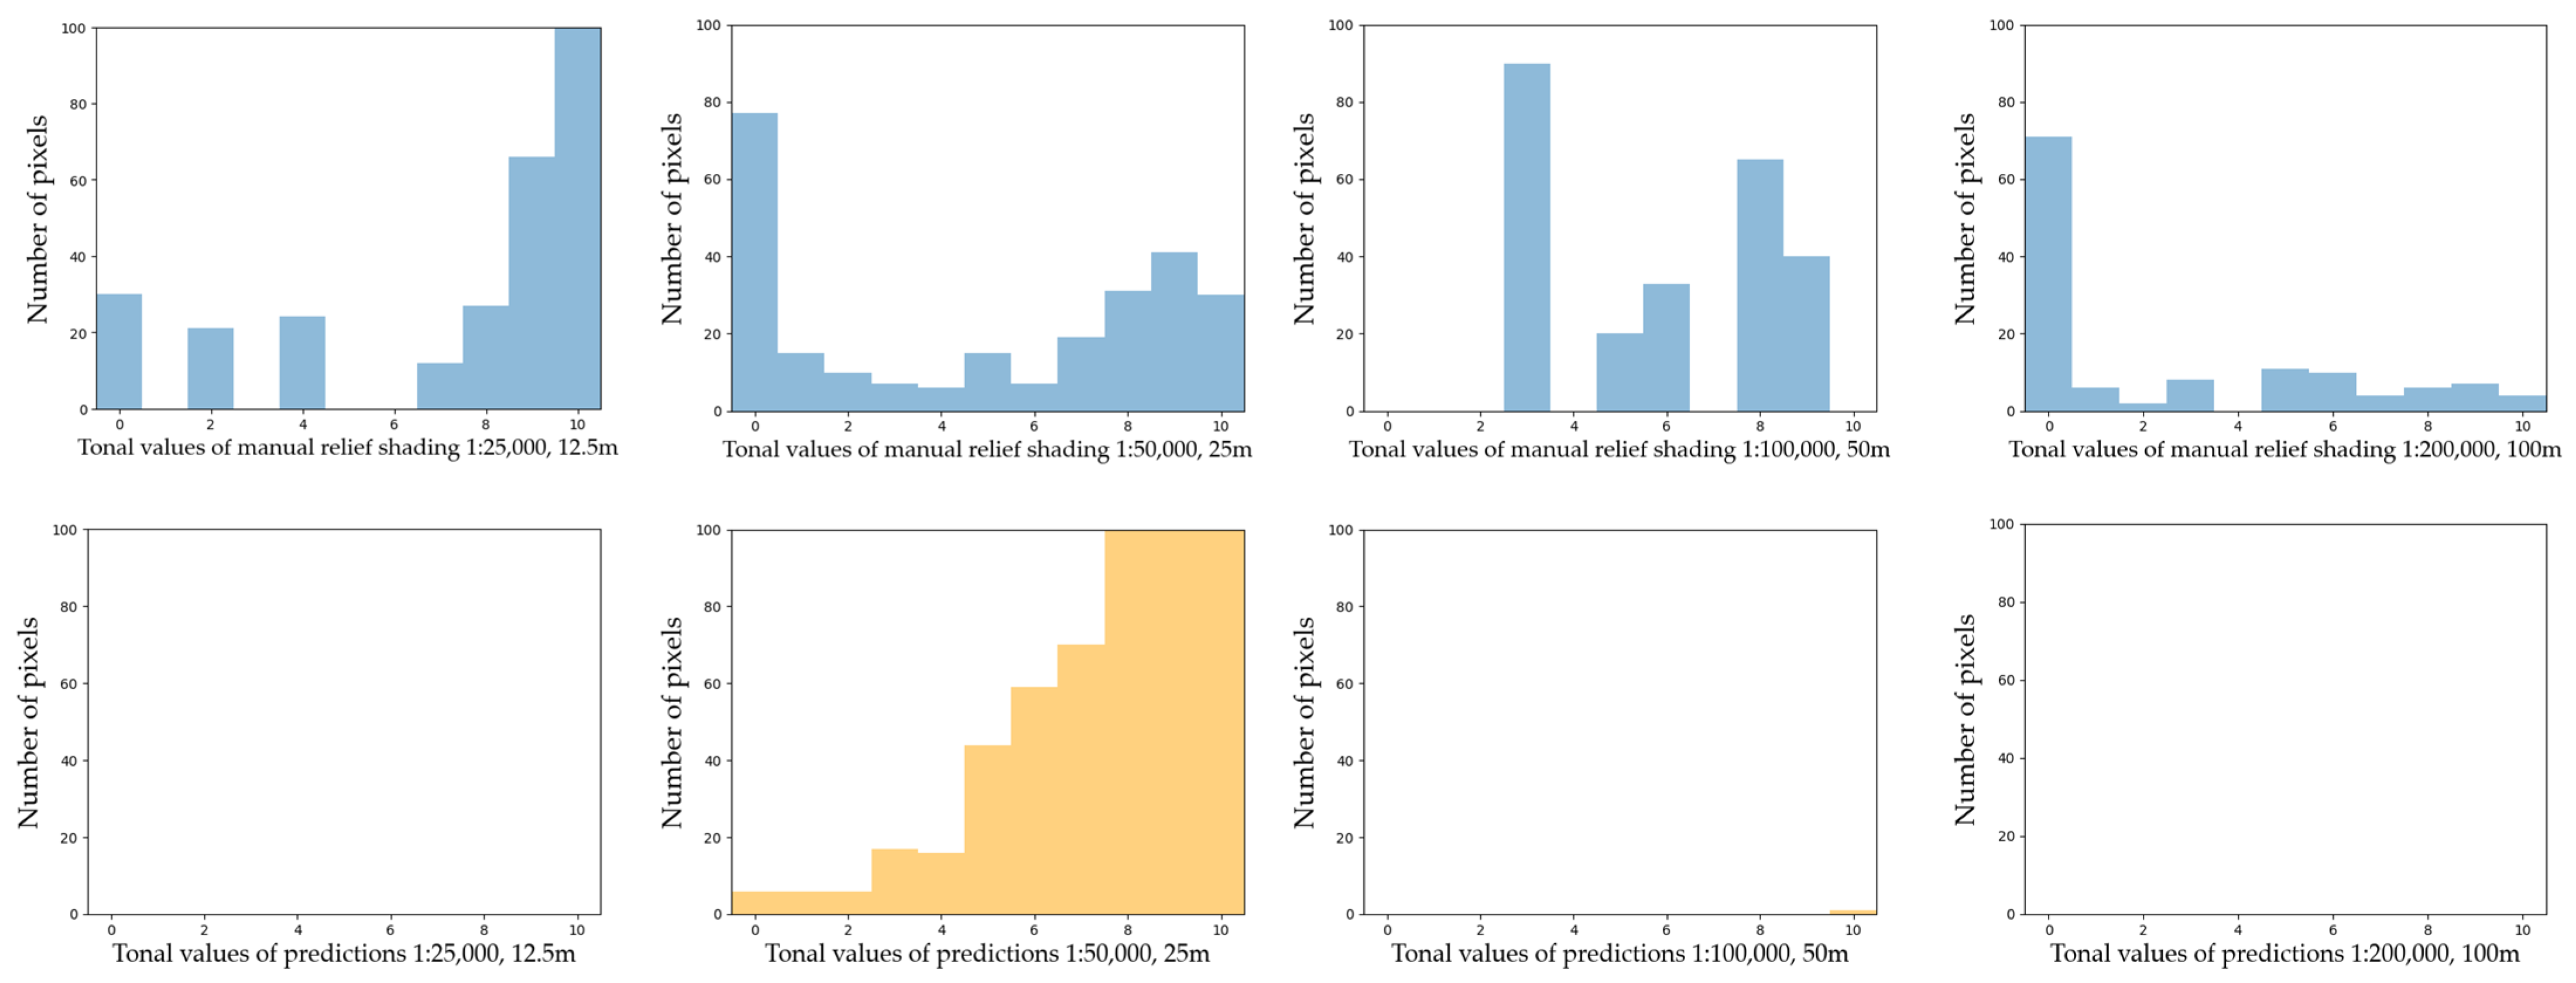
Second, the prediction distribution curves tend to repeat those of manual shadings in most of the cases, but they appear shifted towards the middle tones and are shorter in length, excluding the brightest and the darkest values. By adjusting the range of pixel numbers, we can see if black and white values are present on manual relief shadings and predictions at the corresponding scales (Figure 7 and Figure 8).
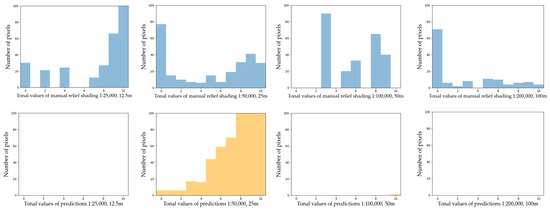
Figure 7.
The darkest values on both manual relief shadings and predictions for the clipped area of Switzerland in the y range 0–100.
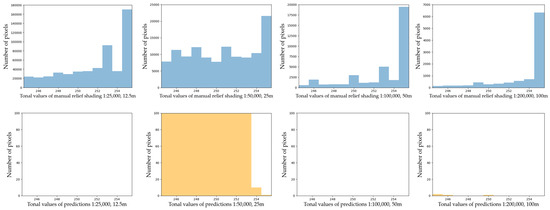
Figure 8.
The brightest values on manual relief shadings and predictions for the clipped area of Switzerland in the y range 0–100 for the predictions.
There are more dark values present on manual relief shadings in comparison to predictions. One of the reasons is that the network tries to even out extreme values during the training. The same happens to the bright values (Figure 8), where the y range for manual shadings stays unchanged to emphasise the large number of bright values.
When looking closer at the clipped area, one can notice outliers on manual shadings at 1:100,000 and 1:200,000 (Figure 9) scales, which may be scanning artefacts. At the same time, manual relief shadings at small scales miss a number of values, while neural shadings prove to have a more consistent distribution of tonal values with all the values present. Generally, smoother tonal values of predictions compared to rather grainy manual shadings can probably also be explained by the fact that manual relief shadings were originally scanned with five times higher resolutions than those presented in Table 1; thus, they were downsampled to match the resolution of the predictions.

Figure 9.
Outliers and missing tonal values in the manual relief shadings and predictions.
Overall, the histograms of differently generated shaded reliefs at the same scales and resolutions share higher numbers of bright values and similar patterns, but with more outliers, missing values, and grainy distribution curves of manual relief shadings vs. smoother curves and more middle-grey values of neural relief shadings.
3.2.4. Confusion Matrices as Heat Maps
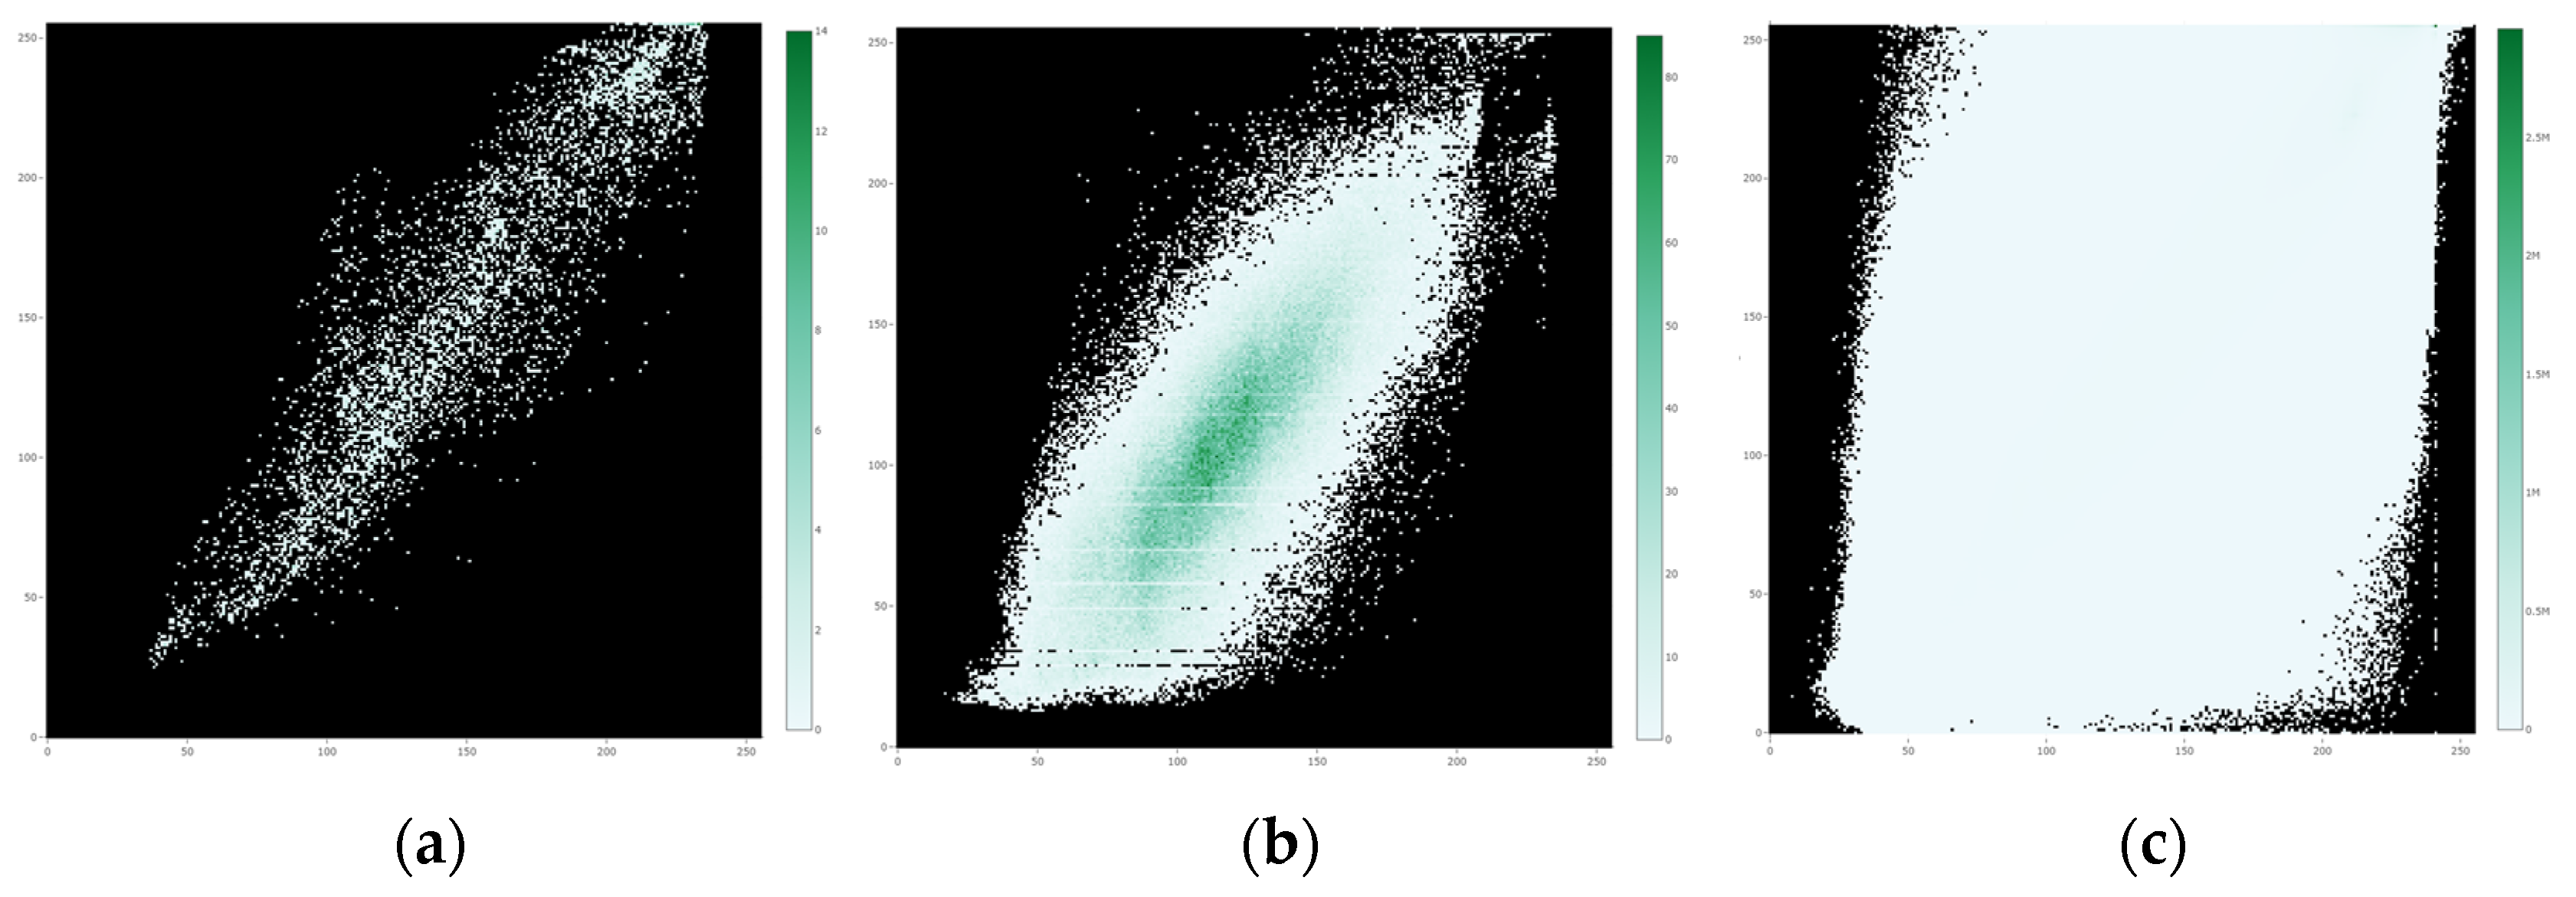
When cropping an area in the web interactive tool, along with histograms the user will see a confusion matrix for that area. It resembles a heat map and essentially shows the pixel values of manual reliefs on the x-axis and the predicted values on the y-axis. For example, for each pixel that has a certain value on the manual relief, the user can see the frequency of the values for the pixels of the predicted relief. The greener the pixel, the more instances the model predicted for a certain manual value. If the model were perfectly reconstructing the manual reliefs, this diagram would show a straight diagonal line. One can see that there is roughly a straight line surrounded by a lot of noise (Figure 10). The larger the cropping area, the more balanced or even distribution of green values should occur. While heat maps can be useful for obtaining a better understanding of the predictive quality of relief shading models, it is suggested to only use them for clearly delineated features (e.g., spatially delineated landforms, single slopes, ridges), as their expressiveness might diminish when computed for larger areas (e.g., Figure 10c).
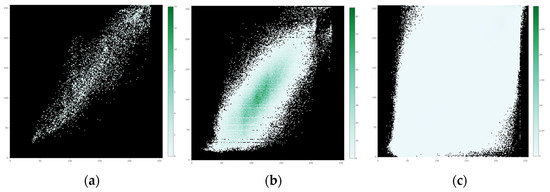
Figure 10.
Confusion matrices of grey values as heat maps with manual values in the x-axis and neural values in the y-axis: (a) a slope, (b) a larger area, and (c) the whole of Switzerland at 1:25,000 and 12.5 m resolution.
3.2.5. Final Assessment
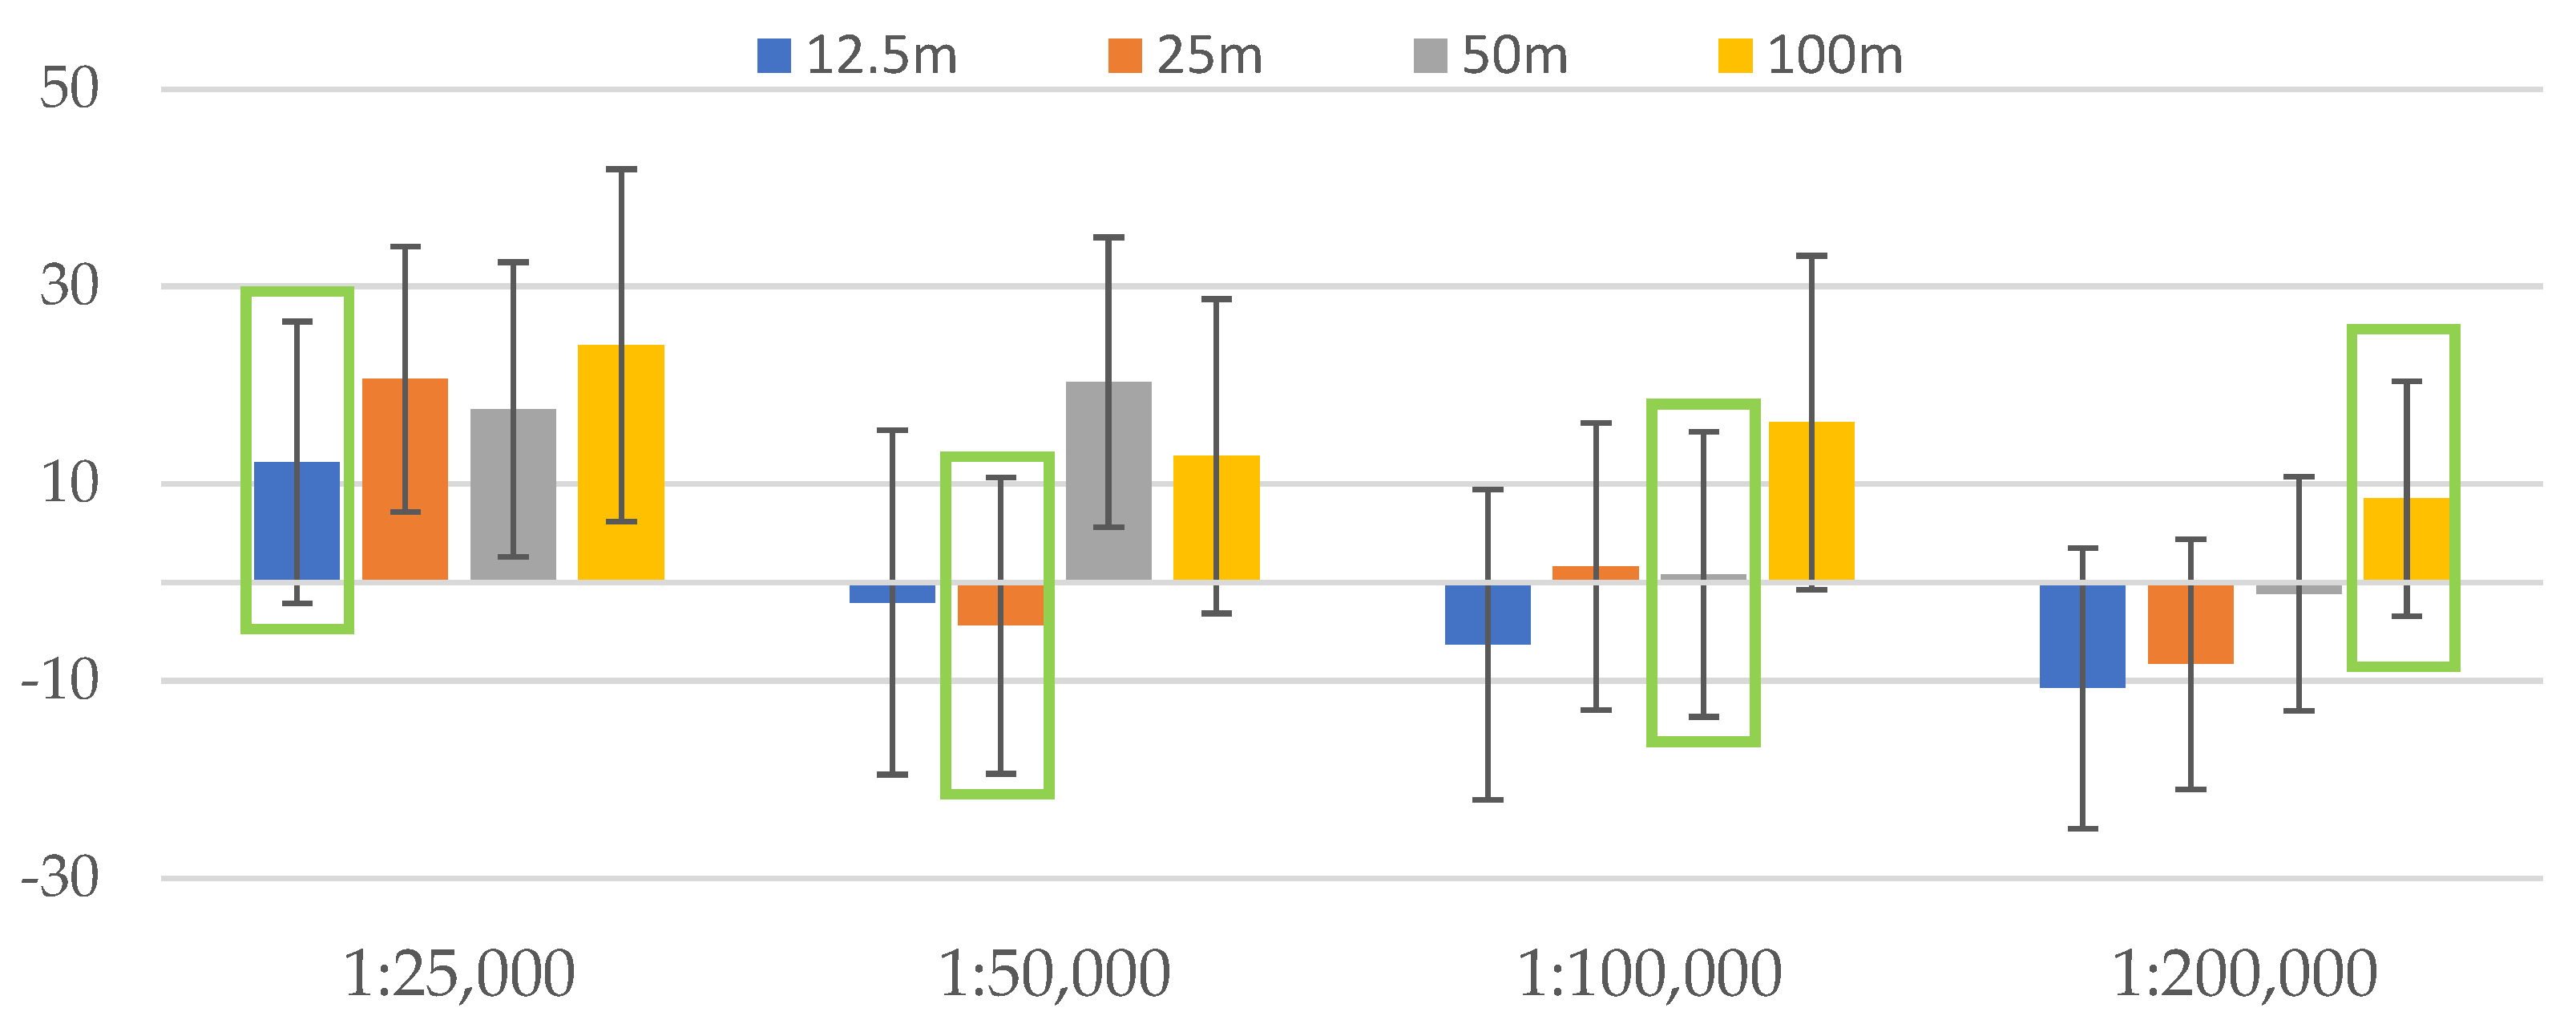
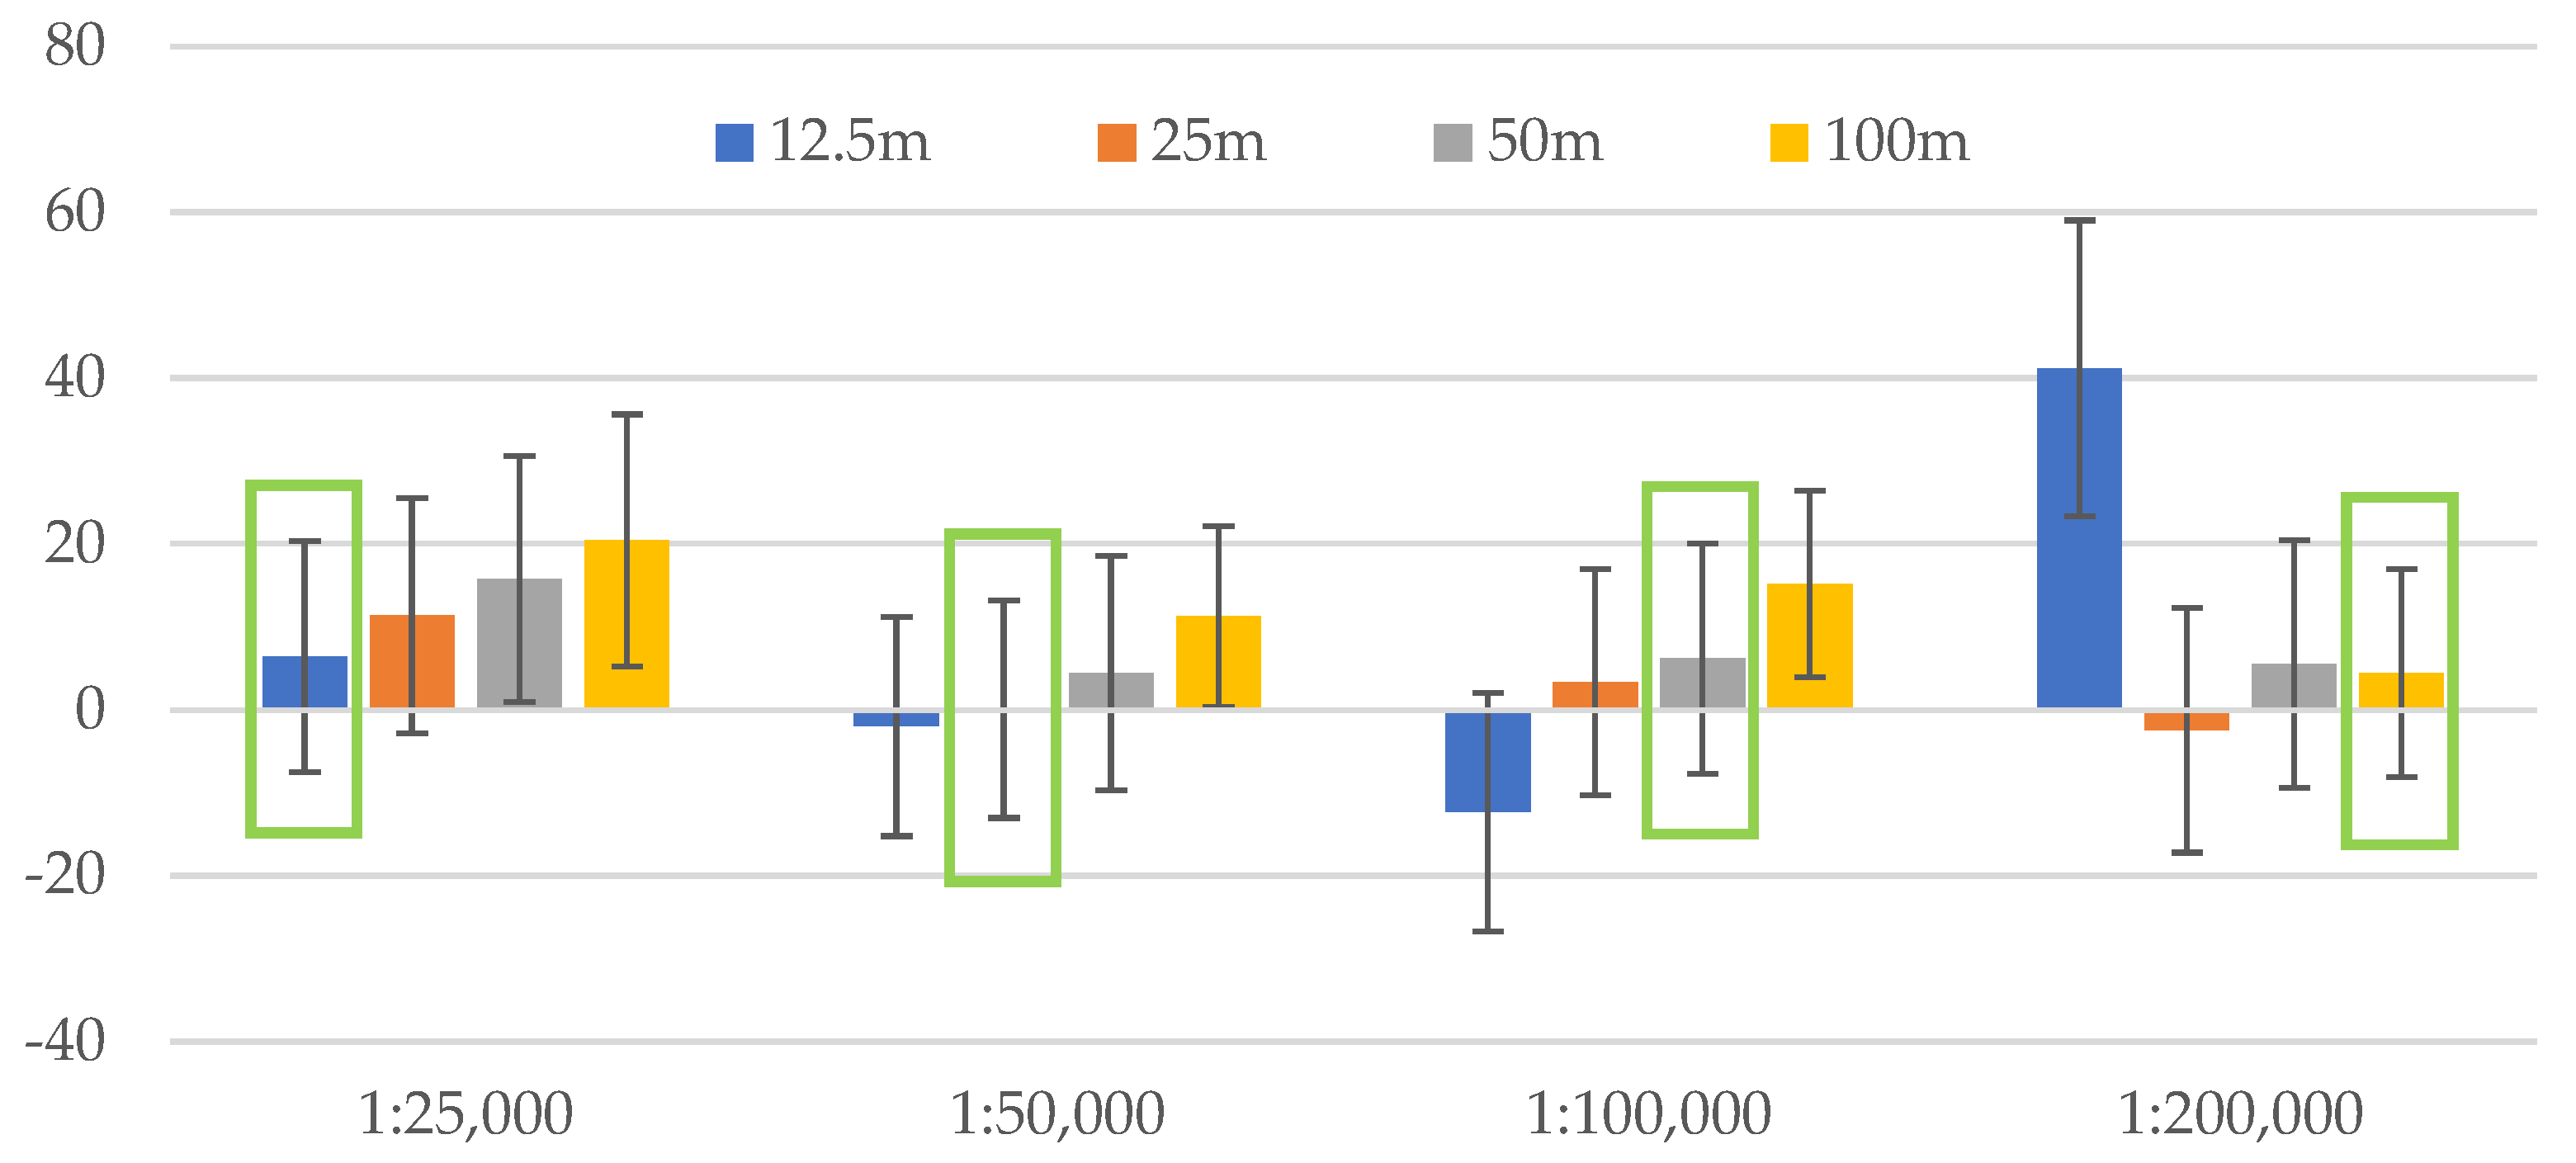
We present the quantification of the differences from the previous subsections by the mean values and their standard deviations in Table 7 and Table 8 (80% and 100% of the training points) and visualise mean values as clustered columns and standard deviations as error bars (Figure 11 and Figure 12).

Table 7.
Mean values and standard deviations of difference raster files with 80% of the training points (values highlighted in green correspond to the scale/resolution ratios from Table 1).

Table 8.
Mean values and standard deviations of difference raster files with 100% of the training points (values highlighted in green correspond to the scale/resolution ratios from Table 1).
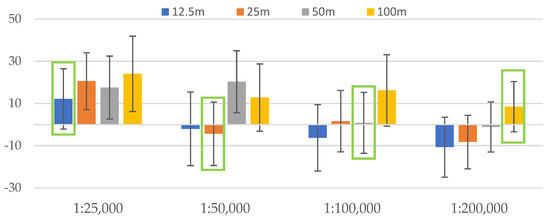
Figure 11.
Mean and standard deviation values plotted against different resolutions for each of the scales (80% of the training points) with the bars outlined in green according to Table 1.
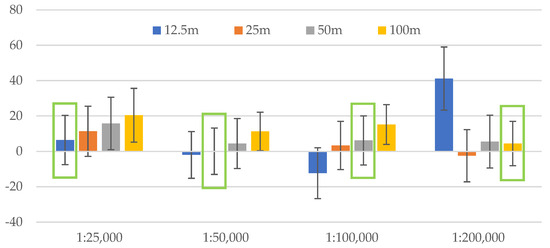
Figure 12.
Mean and standard deviation values plotted against different resolutions for each of the scales (100% of the training points) with the bars outlined in green according to Table 1.
The lower the absolute mean values, the closer the tonal values of the predictions to those of manual relief shadings. Tonal values on manual shadings do not depict the absolute heights, but “the approximate appearance of differences in relative elevation” [1]. Thus, it is not the absolute measure to refer to, but in our research comparing the predicted shadings to manual ones helps us to see whether there is a correlation between scale and resolution, since manual relief shadings present a historically important and carefully considered level of detail for a certain scale. As we can see, at scales of 1:25,000 and 1:100,000 (Figure 11) and 1:25,000 and 1:50,000 (Figure 12), the lowest absolute mean values are those of the resolutions 12.5 m and 100 m and 12.5 m and 25 m (the numbers closest to zero for each of the scales). The negative values here only guide us on which side (darker or lighter) the mean values are, and what we look at is how close the value is to zero. For smaller scales, the 50 m (Figure 11) and 25 m resolutions (Figure 12) show the values closest to zero, while 50 m and 100 m resolutions give the second-best values (Figure 12). Here, the difference between the quantities of training data is not high; the main distinction is about the consistency of values. Overall, there is a tendency of ascending mean values for each of the resolutions within one scale, which fits the scale/resolution ratios from Table 1. There are outliers, e.g., the highest values of 50 m resolution for the 1:50,000 scale (Figure 11) or the 12.5 m resolution for the 1:200,000 scale (Figure 12) and the second-best values for certain scales and resolutions, and given that every single model gives a slightly different prediction, we may assume that further models would give a potentially better and more consequent picture. For some scales, mean values are not the closest to zero for best-fit resolutions but are still much lower than the least-fit ones.
As one can see from Table 7 and Table 8, standard deviation values are fairly close to one another and yet tend to slightly change horizontally along the scale in favour of the suitable resolutions from Table 1.
This lets us affirm that the correlation between scales and resolutions presented in Table 1 is not a coincidence and that the scale does require and define the ideal resolution, and vice versa, based on the assessment conducted.
3.3. Testing
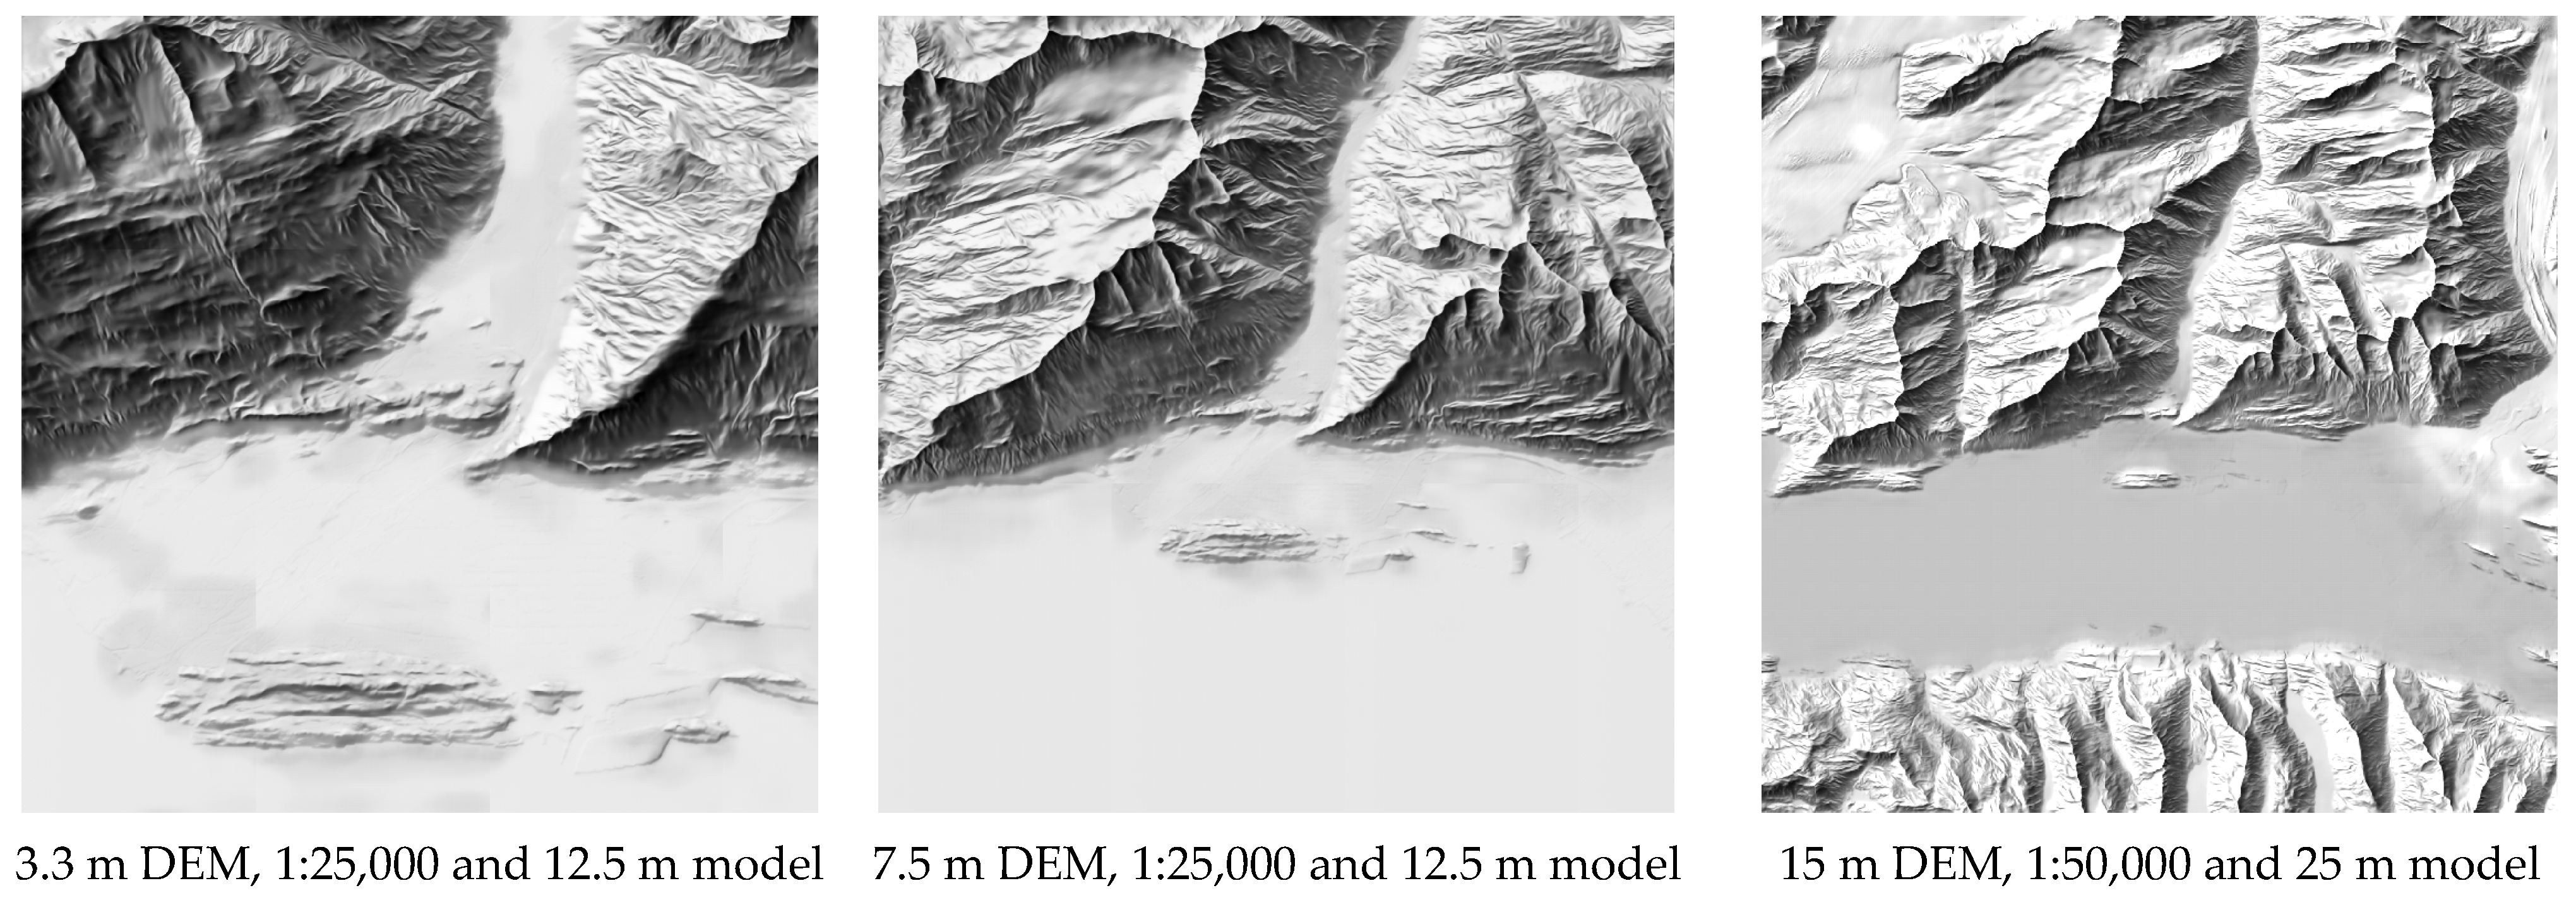
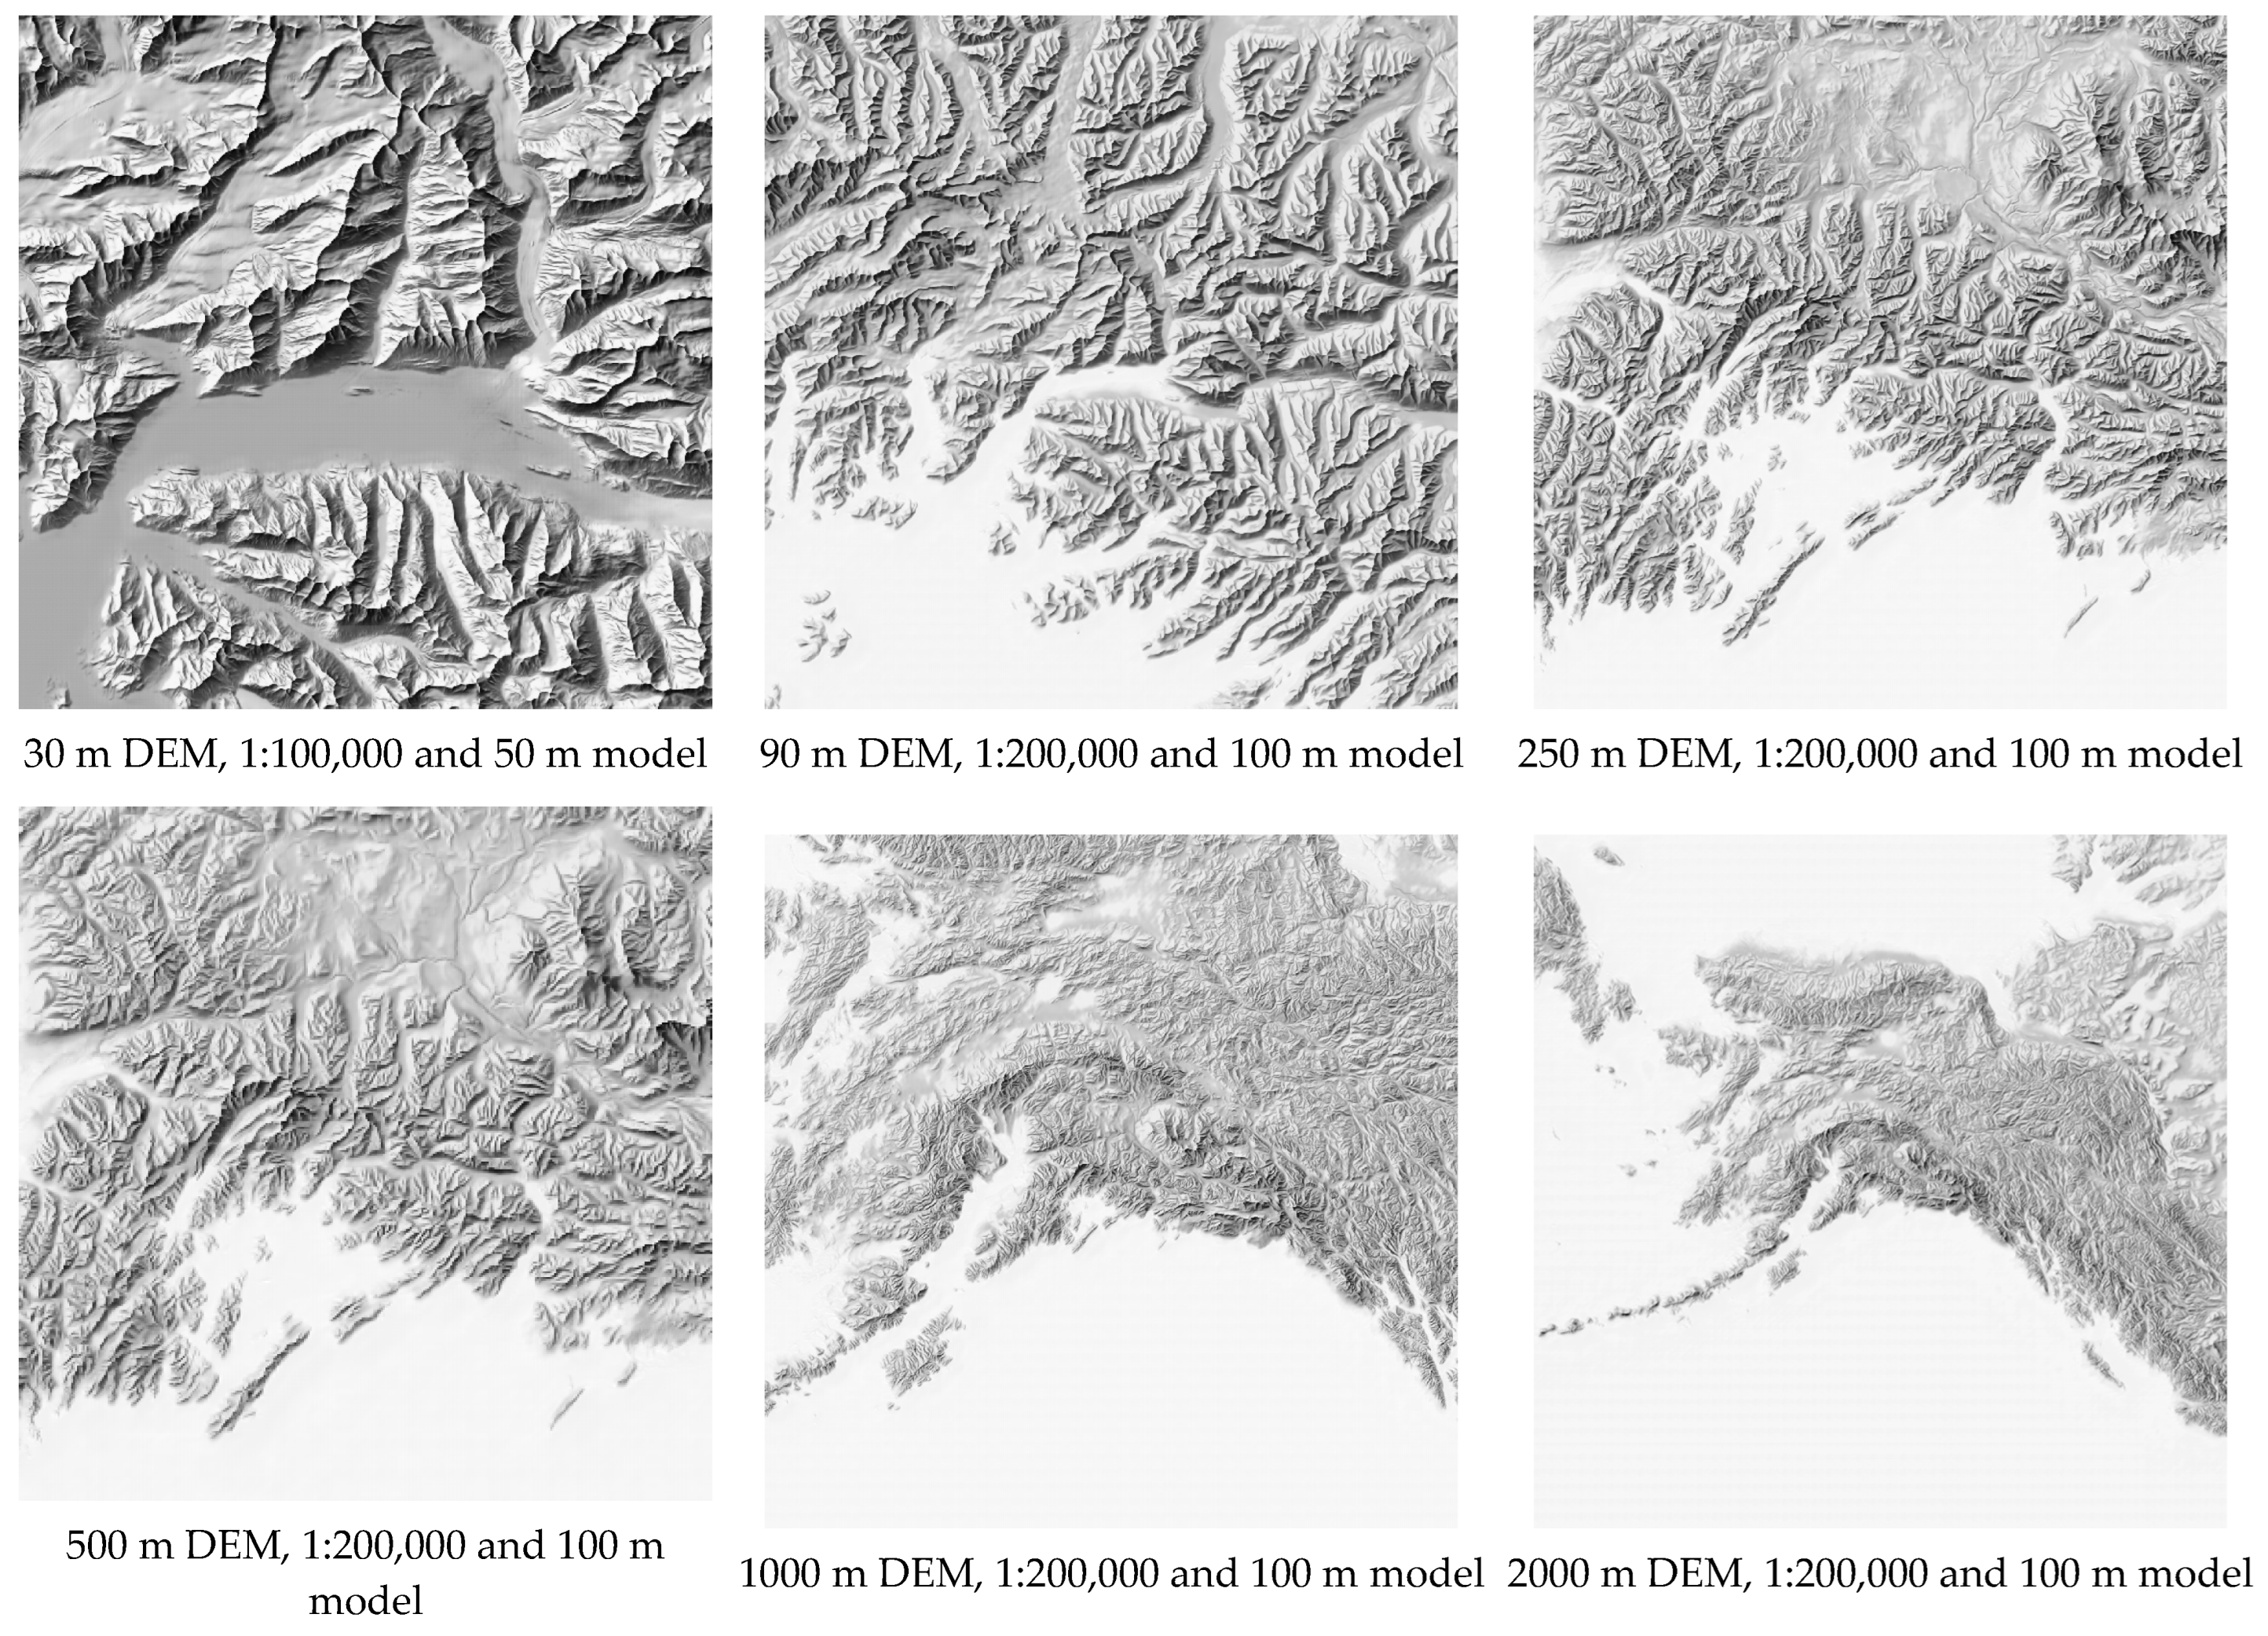
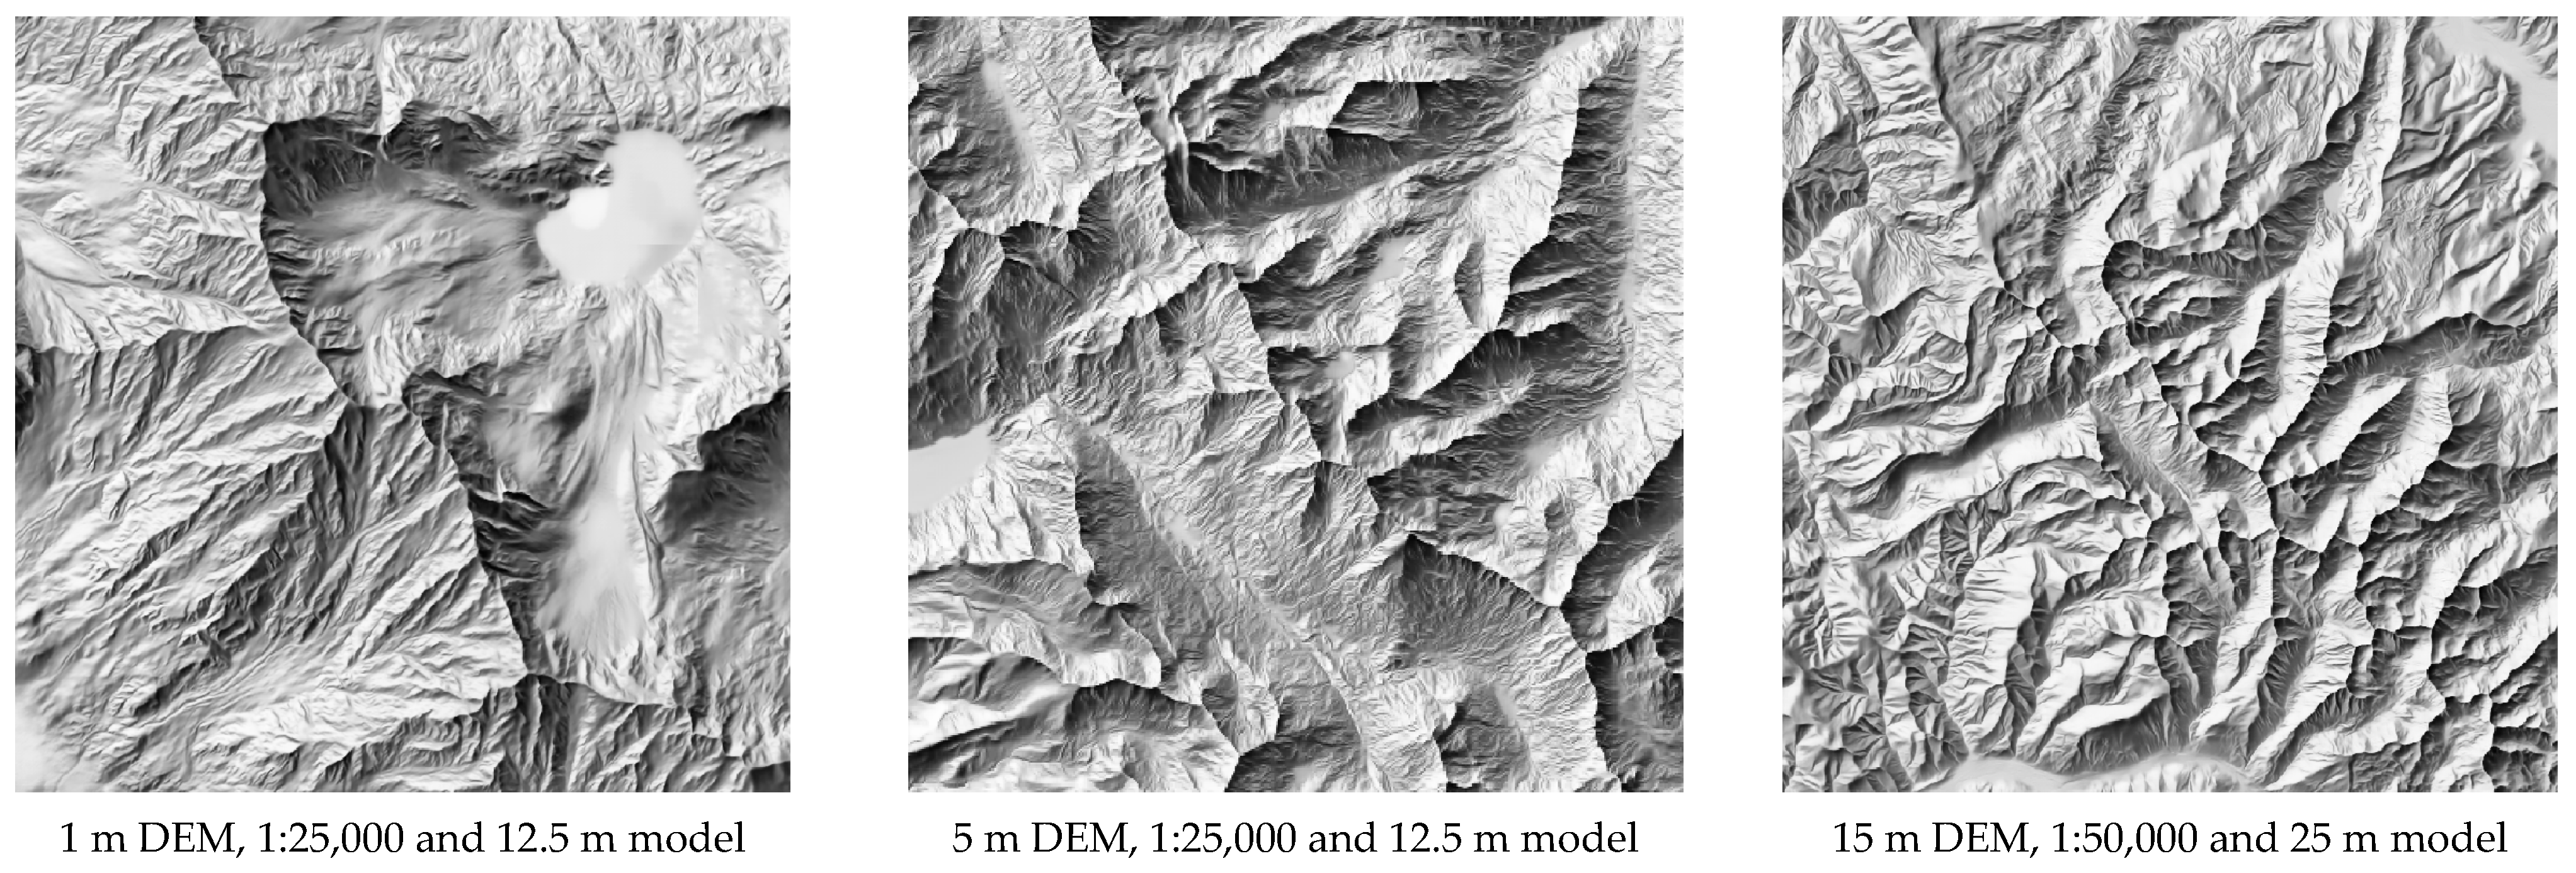
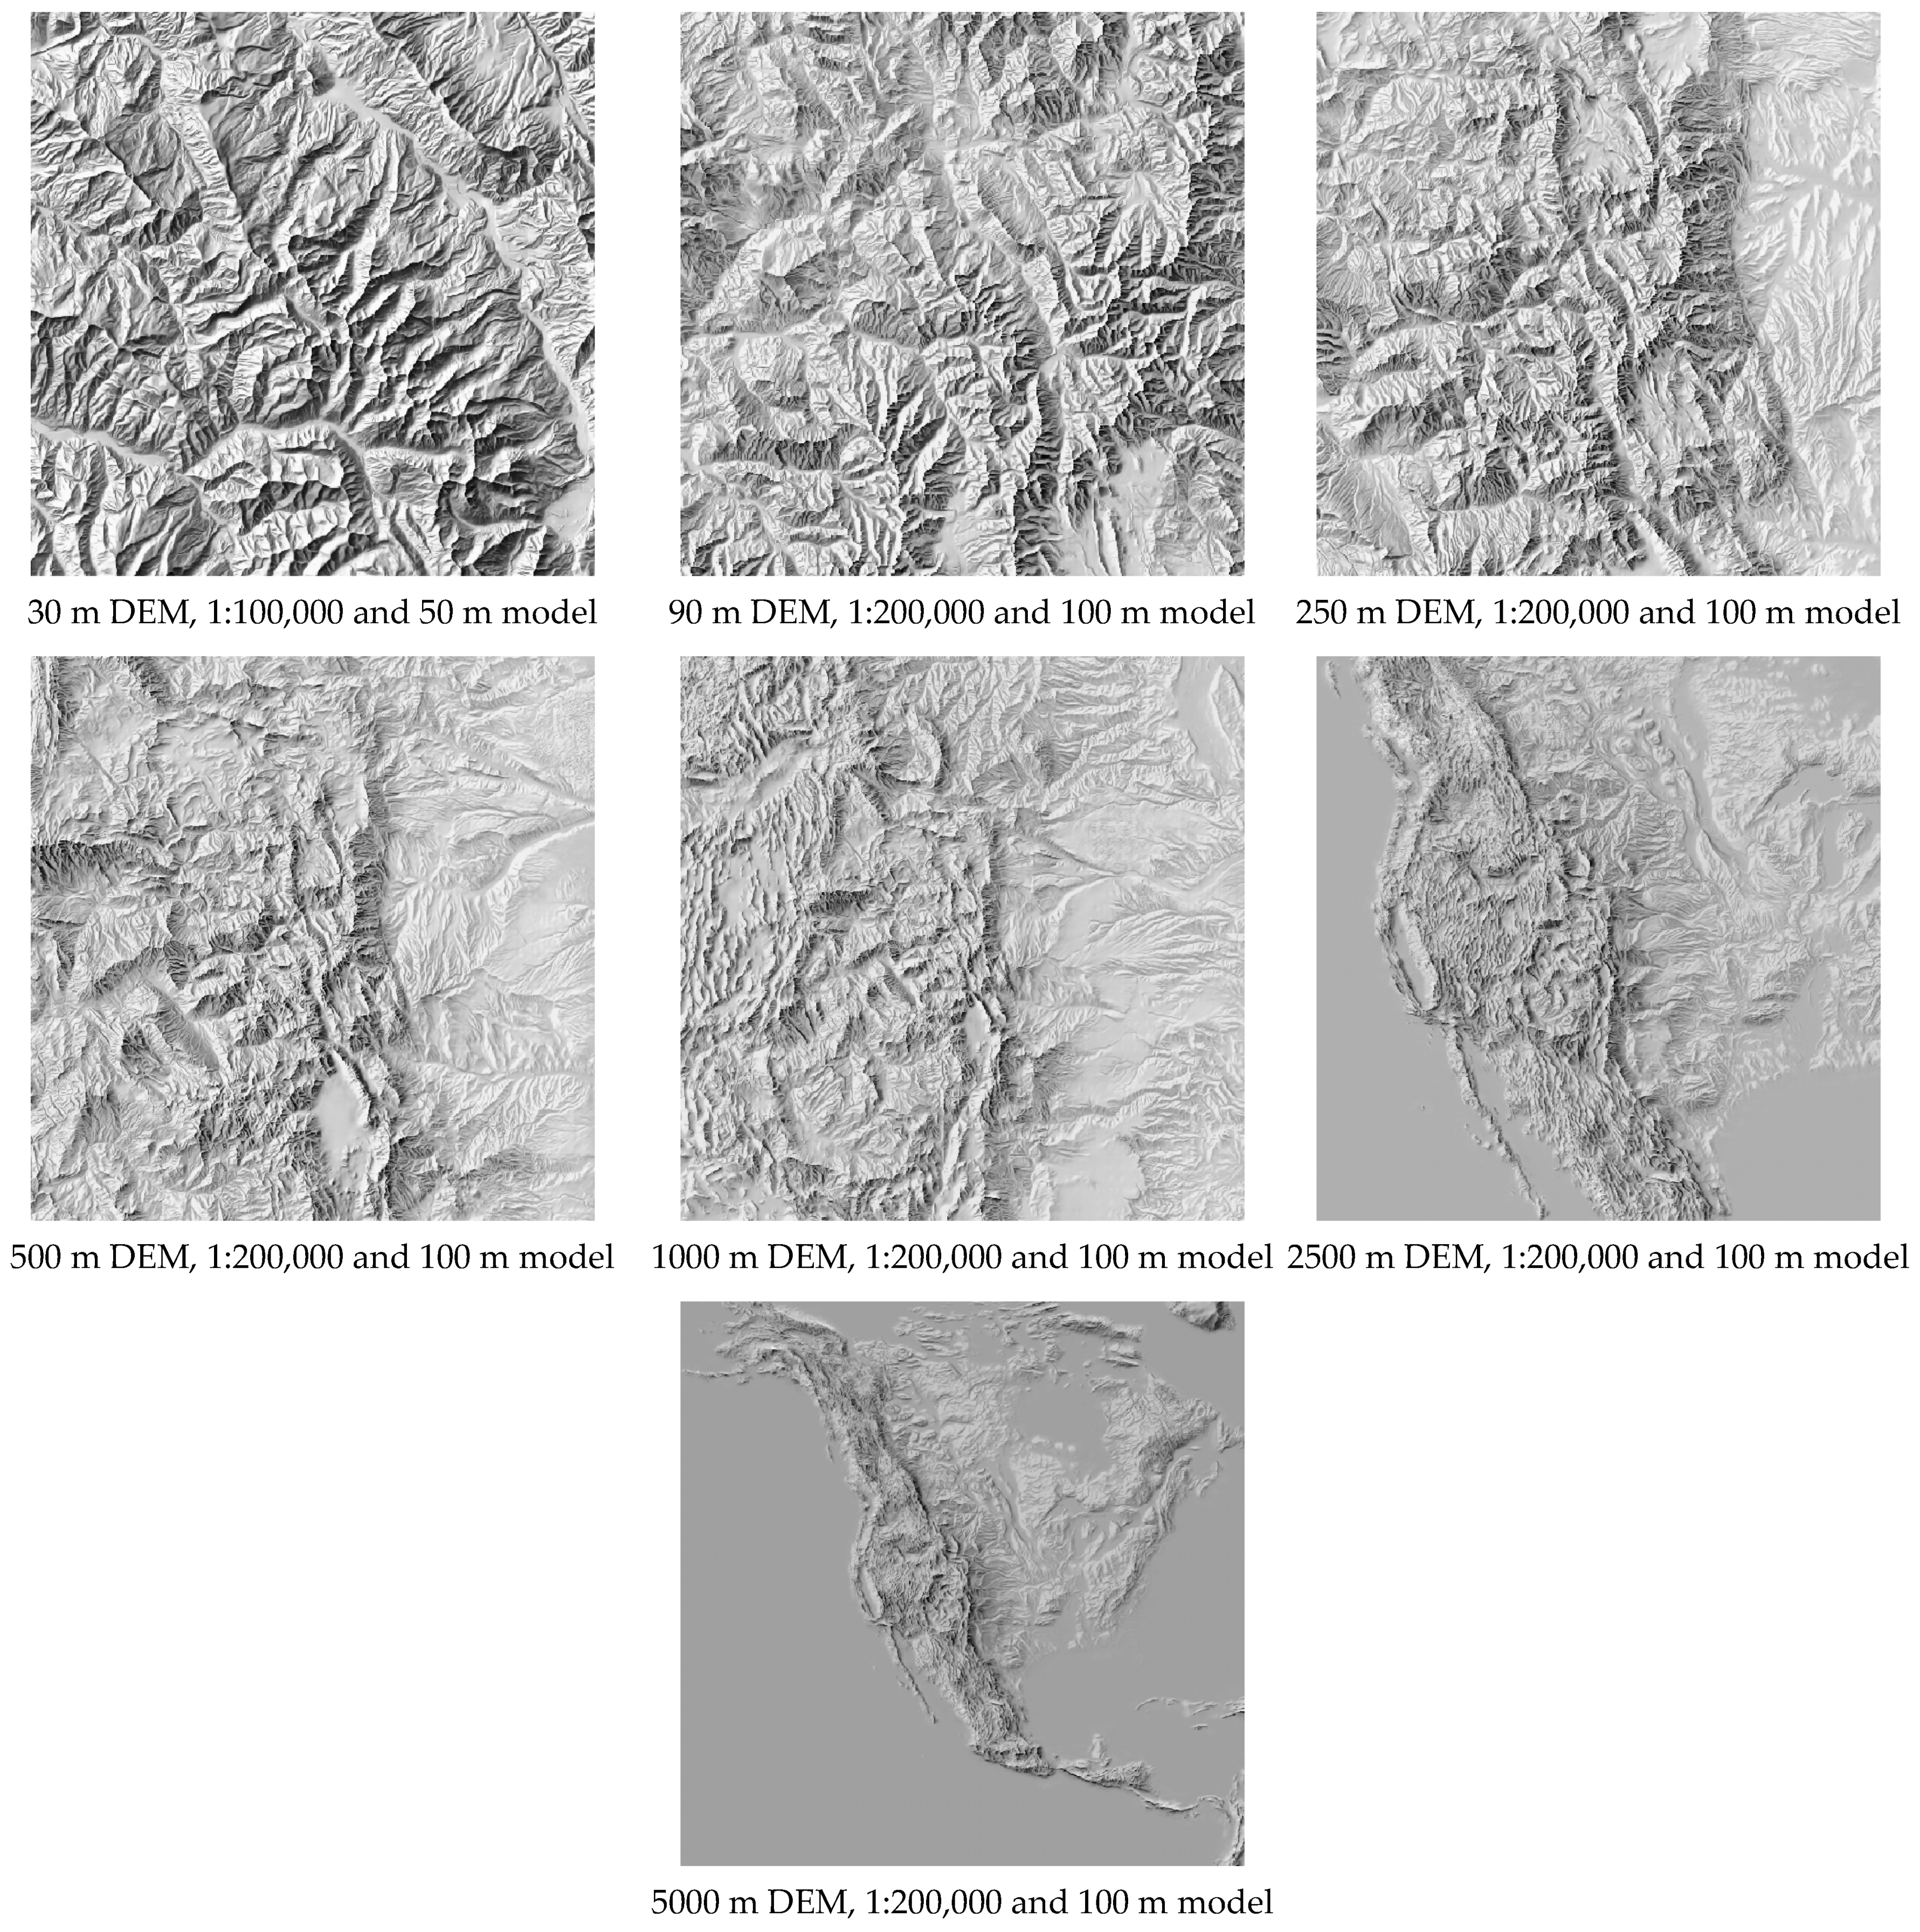
Below are the neural shadings produced by the models that we tested on the two areas in the USA, i.e., outside the training area, where the multi-resolution DEMs [20] are available. The resolution range (Figure 13 and Figure 14) is different from the one we used for training. However, we generated predictions for resolutions finer than 12.5 m by applying the model trained with 1:25,000 and 12.5 m, 15 m with 1:50,000 and 25 m, 30 m with 1:100,000 and 50 m, and all the following resolutions from 90 m and coarser with 1:200,000 and 100 m; all models were trained with 80% of the points.
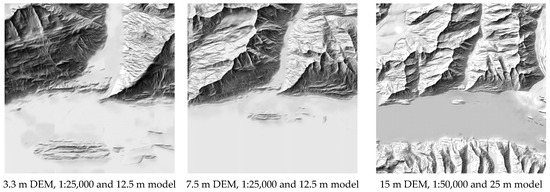
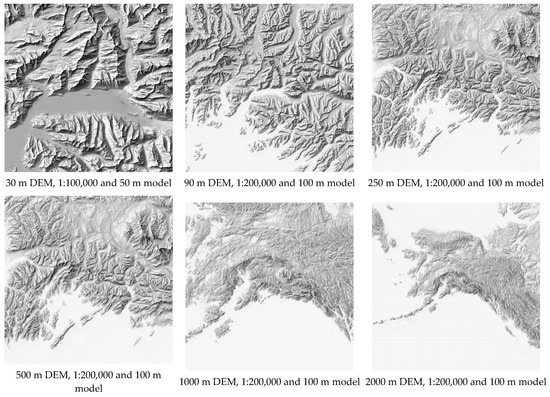
Figure 13.
Neural shadings of multi-resolution DEMs for Valdez area, Alaska, USA, using the models trained at 1:25,000 and 12.5 m, 1:50,000 and 25 m, 1:100,000 and 50 m, and 1:200,000 and 100 m, all trained with 80% of the training points.
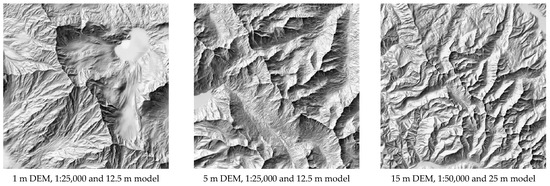
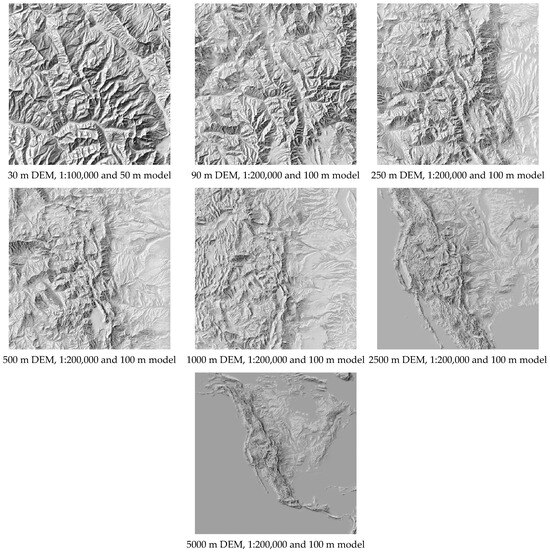
Figure 14.
Neural shadings of multi-resolution DEMs for the Gore Range, Colorado, USA, using the models trained at 1:25,000 and 12.5 m, 1:50,000 and 25 m, 1:100,000 and 50 m, and 1:200,000 and 100 m, all trained with 80% of the training points.
These testing results demonstrate that it should be possible to employ the models not only on different areas but also on resolutions different from those the models were trained on. To compare neural shadings against the ground truth data, we also tested the Churfirsten and Säntis area multi-resolution DEMs available at resolutions 30–2000 m (Table 9).

Table 9.
Neural shadings of multi-resolution DEMs for the Churfirsten and Säntis area (Switzerland) of 30 m, 60 m, 120 m, 250 m, and 500 m using the models trained at 1:50,000 and 25 m, 1:100,000 and 50 m, and 1:200,000 and 100 m and manual relief shadings by swisstopo for the same areas outlined in green.
Here, there are two resolutions outside the range we trained the models with—30 m (between 25 m and 50 m) and 60 m (between 50 m and 100 m). Therefore, in the first two rows, there are two neural shadings displayed, each generated with the models of lower and higher resolutions, i.e., for 30 m DEM Model 1 at 1:50,000 and 25 m and Model 2 at 1:100,000 and 50 m. The rest of the resolutions—120 m, 250 m, and 500 m—are all coarser than 100 m, so we employed to each of them only one model trained at 1:200,000 and 100 m. The resulting images show that the higher resolution models (Model 1 in the first two rows) deliver a level of detail and contrast closer to the one in ground truth data (swisstopo manual relief shadings marked green). For this reason, we recommend going for a model with a higher resolution if the input resolution lies between the values 12.5 m, 25 m, 50 m, and 100 m. The eight models (80% and 100% training points) are publicly available to download from Zenodo (http://doi.org/10.5281/zenodo.15507982, accessed on 1 September 2024).
Based on the last tests presented in Table 9, here are the guidelines derived from the analysis from the previous chapters (Figure 15). Some of these guidelines relate to the quality of input data and some to the training itself.
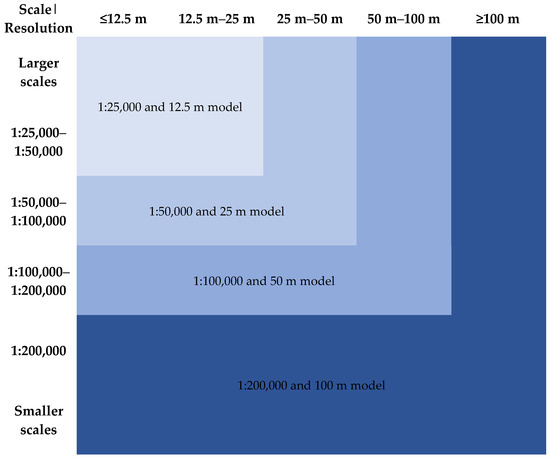
Figure 15.
Guidelines on using the trained models for different scales and resolutions.
- The corresponding four models: for the exact same scales and resolutions;
- Model 1:25,000 and 12.5 m: for scales < 1:25,000–1:50,000 and/or resolutions < 25 m;
- Model 1:50,000 and 25 m: for scales 1:50,000–1:100,000 and/or resolutions < 50 m;
- Model 1:100,000 and 50 m: for scales 1:100,000–1:200,000 and/or resolutions < 100 m;
- Model 1:200,000 and 100 m: for scales > 1:200,000 and/or resolutions > 100 m
For resolutions higher than 12.5 m and lower than 100 m, we recommend creating neural shadings with the models 1:25,000 and 12.5 m and 1:200,000 and 100 m, respectively. For resolutions and scales between those listed, we recommend employing the next higher resolution and/or larger scale model.
4. Discussion
It is a known fact that every training with neural networks results in slightly different predictions. Variation in the predicted results depends on the weight initialisation prior to training. Thus, the more training, the more chances there are to obtain better results. This research did not set a goal to demonstrate the best possible training results, but rather to find out if there are patterns with regard to the input resolution and the output scale of relief shading generated using machine learning.
Improving input data would lead to better models and predictions, e.g., greying out lakes on manual relief shadings would result in no white patches on predictions.
It would also be possible to increase the amount of input data by employing finer or coarser resolutions. One could achieve this by changing the training window (base and padding) size and keeping them consistent across all the scales. When there is a wide range of resolutions to test, multi-resolution elevation models may come into use.
This research employed the DEMs and their associated values. There might be merit in analysis with derivatives such as slope and aspect that better reflect the orientation of the terrain instead of its absolute heights. Therefore, further development of the online interactive tool, i.e., adding more functionality like aspect and slope maps, would probably reveal patterns that could help train neural networks beyond what we have already accomplished in this research.
5. Conclusions
This research presents qualitative and quantitative assessments of the quality of neural shadings. It demonstrates that the predictions made by neural networks deliver consistent results in terms of tonal distribution. The neural shadings accentuate the main relief structural features such as ridgelines, valleys, and slopes equally well across different scales. The tonal values are generally hard to match exactly, since there are other factors involved like tools and techniques used to create manual relief shadings, scanning artefacts, and scanning resolution. However, the main advantage of neural shadings is that on one hand, they employ the advantageous manual style, and on the other hand, they are geometrically correct, unlike many manual ones.
We carried out the assessments by providing tailored analysis tools (e.g., difference maps, histograms, heat maps), including a novel way to visually analyse predictions in the form of a large confusion matrix for discretised continuous values (0–255) and their implementation in the form of an online tool. In addition, there are recommendations on the appropriate selection of parameters (resolution and scale).
As stated before, although they are not an absolute measure but rather a relative one in terms of their subjectivity, manual relief shadings guide us when choosing a resolution for the input data (DEM). This study confirms the correlation between input resolution and output scale described by Tobler’s rule and gives recommendations on the appropriate selection of these two parameters to train the neural shadings model. Therefore, it allows for the generation of an arbitrary scale relief shading using neural networks and, at the same time, ensures the clarity and readability of relief forms for that specific scale.
Future research directions may include training other, newly created neural networks and introducing more training data like relief shadings at scales smaller than 1:200,000 and DEMs with resolutions coarser than 100 m, which could be of use for small-scale reliefs, e.g., for continents and world maps.
Author Contributions
Conceptualisation, Marianna Farmakis-Serebryakova, Magnus Heitzler and Lorenz Hurni; Data curation, Marianna Farmakis-Serebryakova and Magnus Heitzler; Formal analysis, Marianna Farmakis-Serebryakova and Magnus Heitzler; Investigation, Marianna Farmakis-Serebryakova and Magnus Heitzler; Methodology, Marianna Farmakis-Serebryakova, Magnus Heitzler and Lorenz Hurni; Resources, Marianna Farmakis-Serebryakova, Magnus Heitzler and Lorenz Hurni; Software, Marianna Farmakis-Serebryakova and Magnus Heitzler; Supervision, Marianna Farmakis-Serebryakova, Magnus Heitzler and Lorenz Hurni; Validation, Marianna Farmakis-Serebryakova and Magnus Heitzler; Visualisation, Marianna Farmakis-Serebryakova; Writing—original draft, Marianna Farmakis-Serebryakova; Writing—review and editing, Marianna Farmakis-Serebryakova, Magnus Heitzler and Lorenz Hurni. All authors have read and agreed to the published version of the manuscript.
Funding
This research received no external funding.
Data Availability Statement
The trained models presented in the study and the Python code for generating neural shadings with the help of these models as well as the environment are openly available on Zenodo. [http://doi.org/10.5281/zenodo.15507982] (accessed on 1 September 2024).
Acknowledgments
The authors would like to thank Patrick Kennelly, the editors, and anonymous reviewers for their valuable feedback and suggestions.
Conflicts of Interest
The authors declare no conflicts of interest.
Correction Statement
This article has been republished with a minor correction to the Data Availability Statement. This change does not affect the scientific content of the article.
References
- Imhof, E. Cartographic Relief Presentation; Walter de Gruyter: Berlin, Germany, 1982. [Google Scholar]
- Zakšek, K.; Oštir, K.; Kokalj, Ž. Sky-view factor as a relief visualization technique. Remote Sens. 2011, 3, 398–415. [Google Scholar] [CrossRef]
- Jenny, B. An Interactive Approach to Analytical Relief Shading. Cartographica 2001, 38, 67–75. [Google Scholar] [CrossRef]
- Kennelly, P.J. Decoupling slope and aspect vectors to generalize relief shading. Cartogr. J. 2022, 59, 136–149. [Google Scholar] [CrossRef]
- Kennelly, P.J.; Patterson, T.; Jenny, B.; Huffman, D.P.; Marston, B.E.; Bell, S.; Tait, A.M. Elevation models for reproducible evaluation of terrain representation. Cartogr. Geogr. Inf. Sci. 2021, 48, 63–77. [Google Scholar] [CrossRef]
- Weibel, R. Models and experiments for adaptive computer-assisted terrain generalization. Cartogr. Geogr. Inf. Syst. 1992, 19, 133–153. [Google Scholar] [CrossRef]
- Brassel, K. A model for automatic hill-shading. Am. Cartogr. 1974, 1, 15–27. [Google Scholar] [CrossRef]
- Marston, B.E.; Jenny, B. Improving the representation of major landforms in analytical relief shading. Int. J. Geogr. Inf. Sci. 2015, 29, 1144–1165. [Google Scholar] [CrossRef]
- Leonowicz, A.M.; Jenny, B.; Hurni, L. Automatic generation of hypsometric layers for small-scale maps. Comput. Geosci. 2009, 35, 2074–2083. [Google Scholar] [CrossRef]
- Leonowicz, A.M.; Jenny, B.; Hurni, L. Automated reduction of visual complexity in small-scale relief shading. Cartogr. Int. J. Geogr. Inf. Geovis. 2010, 45, 64–74. [Google Scholar] [CrossRef]
- Leonowicz, A.M.; Jenny, B.; Hurni, L. Terrain sculptor: Generalizing terrain models for relief shading. Cartogr. Perspect. 2010, 67, 51–60. [Google Scholar] [CrossRef]
- Geisthövel, R.; Hurni, L. Automated Swiss-style relief shading and rock hachuring. Cartogr. J. 2018, 55, 341–361. [Google Scholar] [CrossRef]
- Jenny, B. Terrain generalization with line integral convolution. Cartogr. Geogr. Inf. Sci. 2021, 48, 78–92. [Google Scholar] [CrossRef]
- Jenny, B.; Heitzler, M.; Singh, D.; Farmakis-Serebryakova, M.; Liu, J.C.; Hurni, L. Cartographic relief shading with neural networks. IEEE Trans. Vis. Comput. Graph. 2020, 27, 1225–1235. [Google Scholar] [CrossRef] [PubMed]
- Eduard. Available online: https://eduard.earth/ (accessed on 23 July 2024).
- swissALTI3D. Available online: https://www.swisstopo.admin.ch/en/geodata/height/alti3d.html (accessed on 23 July 2024).
- Tobler, W. Measuring spatial resolution. In Proceedings of the Land Resources Information Systems Conference, Beijing, China, 25–28 May 1987; Volume 1, pp. 12–16. [Google Scholar]
- Farmakis-Serebryakova, M.; Heitzler, M.; Hurni, L. Terrain Segmentation Using a U-Net for Improved Relief Shading. ISPRS Int. J. Geo-Inf. 2022, 11, 395. [Google Scholar] [CrossRef]
- Jenny, B.; Patterson, T. Aerial perspective for shaded relief. Cartogr. Geogr. Inf. Sci. 2021, 48, 21–28. [Google Scholar] [CrossRef]
- Sample Elevation Models for Evaluating Terrain Representation. Available online: https://shadedrelief.com/SampleElevationModels/#multi-res-DEMs (accessed on 16 February 2024).
Disclaimer/Publisher’s Note: The statements, opinions and data contained in all publications are solely those of the individual author(s) and contributor(s) and not of MDPI and/or the editor(s). MDPI and/or the editor(s) disclaim responsibility for any injury to people or property resulting from any ideas, methods, instructions or products referred to in the content. |
© 2024 by the authors. Published by MDPI on behalf of the International Society for Photogrammetry and Remote Sensing. Licensee MDPI, Basel, Switzerland. This article is an open access article distributed under the terms and conditions of the Creative Commons Attribution (CC BY) license (https://creativecommons.org/licenses/by/4.0/).

