Abstract
This study explores a methodology for assessing territorial innovation potential using OpenStreetMap (OSM) data and geoinformation technologies. Traditional assessment methods often rely on aggregated statistical data, which provide a generalized view but overlook the spatial heterogeneity within regions. To address this limitation, the proposed methodology utilizes open, up-to-date OSM data to identify key infrastructure elements, such as universities, research institutions, and data centers, which drive regional innovation. The methodology includes data extraction, harmonization, and spatial analysis using tools like QGIS and kernel density estimation. Results from the PoliRuralPlus project pilot regions highlight significant differences in innovation potential between urban centers and rural areas, emphasizing the importance of detailed spatial data in policy making and regional development planning. The study concludes that OSM-based assessments provide spatially detailed targeted, flexible, and replicable insights into regional innovation potential compared to traditional methods. However, the limitations of crowdsourced data, such as variability in quality and completeness, are acknowledged. Future developments aim to integrate OSM with official statistical data and other data resources to support more efficient and fair resource allocation and strategic investments in regional innovation ecosystems.
1. Introduction
The innovation potential of a territory encompasses the ability of a region to foster innovation and technological progress (see the definition of the term innovation potential of a territory in the Section 2). This potential is essential for sustainable economic growth, strengthening competitiveness, and improving the quality of life (creating jobs, improving access to advanced technologies, promoting environmental sustainability, or fostering social well-being) in the territory. In recent decades, there has been growing interest in assessing innovation potential, particularly in relation to territorial development, as individual regions have increasingly profiled themselves as key actors in the global innovation system. A region’s capacity to innovate is influenced by a number of factors, including the level of human capital, research infrastructure, and supporting policies.
Traditional methods for evaluating innovation potential often fail to accurately capture its spatial distribution. These methods typically rely on aggregated statistical data, which combine various factors such as human resources, educational institutions, R&D infrastructure, and supportive policies (a detailed description of these existing methods can be found in the Section 2). The problem with these methods, however, is that they usually provide a single, highly generalized value for the whole territory. This leads to a bias, as the spatial distribution of factors affecting innovation potential is not homogeneous. For example, the degree of availability of research centers, technology parks, or skilled labor can vary significantly not only between regions but also within a territory. Such aggregated data are unable to capture these subtle spatial differences, making it difficult to accurately assess and compare the innovation potential of individual regions.
The proposed solution to this problem is to assess the innovation potential of a territory based on the available infrastructure that supports the diffusion of innovation [1]. Here, spatial (geographical) data play a key role, allowing for a more detailed analysis of the territory in terms of the location of relevant infrastructure elements. For example, data from the OpenStreetMap (OSM) project represent an ideal source of information due to their availability, licensing, timeliness, and localization of the required infrastructure elements. Using this data, key infrastructures such as research facilities, technology parks, universities, or communication networks can be more accurately identified, enabling a better understanding of the spatial distribution of innovation potential.
A major advantage for spatial data processing, including OSM, is the use of geoinformation technologies (GITs), which can efficiently process and visualize large amounts of spatial data. Thematic maps generated from this data allow for easy interpretation and provide a clearer picture of the distribution of factors influencing innovation potential. In addition, GIT offers the possibility of combining different data layers to create a comprehensive and detailed picture of innovation potential in a specific region. This allows not only for better analysis but also for more accurate regional development planning and more efficient resource allocation.
The aim of this paper is to present and discuss the first version of a methodology for assessing the innovation potential of a territory using data from OpenStreetMap and geoinformation technologies. This methodology offers several major advantages over traditional approaches. First, it allows for a detailed analysis of the spatial distribution of factors, leading to a more accurate assessment of the innovation potential of individual regions. Second, the use of open and relatively recent data makes the methodology easily replicable and applicable to different territories, which increases its versatility. Finally, geoinformation technologies provide tools for the effective visualization of results, simplifying interpretation for different users, including policymakers, regional planners, and investors.
This new methodology holds significant promise for improving the assessment of innovation potential and supporting the innovative development of regions. It enables the identification of key areas with high potential for innovation, facilitating more effective targeting of development and investment activities, which is crucial for the competitiveness of regions in the global market.
This article is structured as follows: The Materials section introduces the concept of innovation potential, reviews existing assessment methods, and outlines OpenStreetMap (OSM) as the primary source of spatial infrastructure data. The Methods section explains the assessment process, including data collection, harmonization, and analysis using open-source QGIS software. The Results section presents findings from the application of this methodology in the PoliRuralPlus pilot regions. The Discussion section evaluates the methodology’s benefits, limitations, and potential improvements, such as integrating additional data sources or optimizing the model. Finally, the Conclusions section summarizes key insights, emphasizes the advantages of OSM and geoinformation technologies for assessing innovation potential, and proposes directions for future research.
2. Materials
This section introduces related works explaining the term “innovation potential of the territory”, existing methods for assessing it, and the input data used in this study.
2.1. Definition of Innovation Potential
The term “innovation potential of a territory” refers to the capacity of a geographical region to generate and introduce new ideas, technologies, and processes that enhance economic performance and competitiveness. Previous studies [1,2,3] in this area have provided several useful definitions of the term innovation potential. According to [1], regional innovation potential can be defined as “the ability of a region, under given circumstances, to use its own internal resources efficiently, to respond flexibly to external development stimuli, to create and develop activities with higher added value, and thus to acquire new, hierarchically higher qualities”. Similarly, [2] describes innovation potential as the ability to develop and advance competitive sectors further. In another study, [3] interprets innovation potential as a characteristic of the existing innovation environment where innovations are created, developed, and implemented. The above three definitions describe the innovation potential of an area as the ability or characteristic of a region to effectively create, develop, and implement innovations to increase competitiveness and value added.
The concept of innovation potential is understood in varying ways depending on the perspective of the analysis. Different definitions emphasize distinct factors, such as human resources, infrastructure, or external influences, which are described in detail in subsequent sections.
2.2. Existing Assessment Methods
The assessment of the innovation potential of a territory can be viewed from four different perspectives:
- The perspective of perception and understanding of innovation potential, including its components (cognitive–semantic perspective);
- The perspective of data sources (data perspective);
- The perspective of the calculation of the resulting evaluation (mathematical–statistical perspective);
- Perspective on the technologies used for the evaluation (technology perspective).
Ad 1. The definitions of the term “innovation potential of the territory” provided in the previous section of the text suggest that the innovation potential of a territory is expressed using various factors (characteristics of the territory, indicators) that have an impact on the diffusion and adoption of innovations in the region. Therefore, data-driven methods for assessing innovation potential are based on the analysis of mainly spatial data, which can be used to describe and model individual factors or groups of factors. Different authors work with different, intersecting groups of factors that describe the innovation potential of a territory:
- Higher education, lifelong learning, medium/high-tech manufacturing employment, high-tech services employment, public R&D expenditure, business R&D expenditure, and high-tech patent applications at the European Patent Office (EPO) [4];
- Indicators and groups of indicators, such as basic and demographic data, education structure, economic activity, employment and unemployment, economic performance, investments, economic agents, high-tech and medium-high-tech industries, research and development—inputs, research and development—outputs, industrial zones, entrepreneurship support programs, venture capital; and regional innovation strategies [1];
- R&D employees in firms, the total workforce in firms, employees in public research facilities, geographic profile, geographic location, natural resources, total population, settlement characteristics, and (high-tech) start-ups [5];
- Economic policy and debt, education, environment, financial sector, health, infrastructure, poverty, private sector and trade, public sector, social protection and labor, technological readiness, and market size [6];
- R&D investment, number of patents, number of research articles, and emissions tracking [7].
The representation and characteristics of each factor depend on the authors’ professional background as well as the target group (focus) of the research results. The above list shows that individual authors range from a strongly economic perspective, for example [1], to geographic–sociological studies, for example [4].
Ad 2. In terms of input data, we need to mention the different sources of input and also their nature. The situation is considerably easier for national-level assessments than for international ones (cross-border studies). At the national level, official data provided by the local statistical office are usually available. These data are guaranteed, homogeneous, and, in developed societies, regularly updated. The same conditions are also important for input to international studies assessing the innovation potential of territories. Therefore, it is necessary to carefully compare and possibly harmonize the data [8] from the different national providers to see if they are identical in terms of data acquisition methodology, including physical units, meaning, or mathematical operations. For international studies, data from international organizations such as the UN, World Economic Forum, or World Bank can be used [5]. In Europe and the European Union, data from Eurostat are mostly used, published for NUTS (Nomenclature des Unites Territoriales Statistiques, Nomenclature of Units for Territorial Statistics) statistical units in levels 0 (countries), 2 (cohesion regions), or 3 (details in European Commission (EC) REGULATION (EC) No 1059/2003 OF THE EUROPEAN PARLIAMENT AND OF THE COUNCIL of 26 May 2003 on the establishment of a common classification of territorial units for statistics (NUTS): NUTS-Nomenclature of territorial units for statistics; European Commission. (2016). Commission Regulation (EU) 2016/2066 of 21 November 2016 Amending the Annexes to Regulation (EC) No 1059/2003 of the European Parliament and of the Council on the Establishment of a Common Classification of Territorial Units for Statistics (NUTS).
In general, aggregated statistical data reported for the whole territorial unit dominate the assessment of innovation potential (for example, Regional National Summary Innovation Index [4] or Open Innovation Index [6]). Aggregate statistical data reported for whole territorial units present several significant risks compared to more detailed geographical and spatial data. The aggregation of data into larger territorial units leads to a loss of information on the spatial variability of the observed phenomena, which may cause misinterpretations and distortions of the actual situation. In addition, aggregation results are affected by the way the boundaries of the territorial units are defined, a well-known Modifiable Areal Unit Problem (MAUP; [9]), which can alter the results of analyses even with the same input data. Aggregation tends to mitigate outliers, and the degree of this effect may vary depending on the method used and the nature of the data. Aggregation masks heterogeneity of the area because high and low values are averaged, leading to misleading conclusions about the uniformity of the observed phenomenon [10]. Aggregated data also limit the possibilities of spatial analyses and reduce statistical power, as important relationships and differences evident at the level of individuals or smaller spatial units may be overlooked in aggregation. Further, there is a risk of ecological error [11], where conclusions drawn from aggregated data are incorrectly applied to individuals or smaller units, and limited flexibility, because aggregated data do not allow users to perform their aggregations or disaggregations. For these reasons, it is essential to be aware of the limitations of aggregated data when working with them and to favor detailed geographic data that better reflect spatial relationships and variability in many analytical tasks.
Ad 3. In order to link information coming from different inputs, different ratios (indices) are used to assess the innovation potential of territories—for example, the Global Innovation Index [12], the European Innovation Scoreboard [13], the Open Innovation Index [6], Revealed Regional Summary Innovation Index, Regional National Summary Innovation Index [4], and Regional European Summary Innovation Index. Many studies, such as [1] or [6], construct indices based on a weighted average of the input data values. Different techniques are used to estimate the weights of each input criteria, starting from the simplest ones, such as the ranking method (the indices reported by [4]) or the scoring method, to more sophisticated methods (Fuller’s, Saaty’s; see [1]), to complex processes (the Lasso regression technique; see [6]).
Ad 4. The above research on the innovation potential of territories does not explicitly mention the technologies used. From the text and possibly from the published figures, it can be inferred that most often Microsoft Excel spreadsheets are used. As geographically localized data enter into the assessment of the innovation potential of a territory, geographic information systems (GIS) are a suitable tool for this activity. GIS can harmonize data from different sources, analyze the data, and also effectively visualize the results of the analyses in the form of different types of thematic maps (cartograms, diagrammatic maps, etc.). Studies dealing with the use of GIS for the assessment of innovation potential have been published, for example, by [14,15,16].
Due to the mentioned shortcomings of aggregated statistical data, the data-driven attractiveness assessment from the perspective of the innovation potential of the territory is carried out using data that represent the infrastructure in the studied territory. In order to conduct research across national borders, the global dataset OpenStreetMap was chosen. Similar studies can be encountered in publications such as [17,18,19].
2.3. OpenStreetMap
OpenStreetMap (OSM) (https://www.openstreetmap.org/) [20] is the main source of input data for the data-driven assessment of the attractiveness of the territory in terms of innovation potential, which is the topic of this article. The reason for using OSM is that it is a spatial dataset that is freely available, contains features of interest for attractiveness assessment research (a more detailed description of these is provided later in the paper), and also covers the entire area of interest.
OSM is an open-source project aimed at creating and providing freely available geographic data. The project was founded in 2004 by Steve Coast in the UK with the aim of creating a free and open map that can be used by individuals, organizations, and commercial entities without licensing restrictions. In 2006, the OpenStreetMap Foundation (https://osmfoundation.org/) was established to support the growth and development of the project. An important milestone in the history of OSM was the transition to the Open Database License (https://opendatacommons.org/licenses/odbl/, accessed on 15 January 2025), which ensured the protection of the rights of contributors and users of the data. In 2018, the number of registered users exceeded 5 million, and three years later, the project reached 100 million change sets, demonstrating its global popularity and dynamic development.
The OSM data model is based on three basic types of geographic objects (nodes, ways, and relations). Nodes represent individual points defined by geographic coordinates, which can symbolize, for example, trees, lamps, or intersections. Paths (ways) are connections of two or more nodes that create lines such as roads, rivers, or closed polygons representing buildings or lakes. Relations allow describing more complex structures and relationships between objects, such as public transport routes or administrative boundaries. All objects are described using a key-value tag system that provides a high degree of flexibility in describing geographical entities. Each tag contains a key that defines the category of the feature (e.g., “highway” for roads) and a value that specifies the properties of that category (e.g., “residential” for a street in a residential area). The system allows arbitrary combinations of tags and supports the addition of further details using prefixes, infixes, or suffixes, for example “name:en” for the English name of a street.
OSM data are provided in XML (Extensible Markup Language) or PBF (Protocolbuffer Binary Format) formats, allowing easy downloading and further processing. OSM stores geographic coordinates in the WGS 84 system (World Geodetic System 1984).
The main advantage of OSM is its openness and accessibility. The data can be used for free, including in commercial applications, making it an attractive alternative to closed commercial systems. Thanks to continuous updates by a community of volunteers, the data are often more up-to-date than some other sources. However, disadvantages can include varying data quality depending on local community activity, lack of systematic data checking, and dependence on contributors who may enter subjective or inaccurate information. Working with the data also requires technical knowledge, which can be a barrier for less experienced users.
The reasons for using OSM for data-driven assessment of territorial innovation potential are as follows:
- Accessibility: OSM provides open access to highly detailed spatial data;
- Timeliness: OSM is a live data source that is continuously updated by the community;
- Flexibility: OSM data can create different types of land use analyses.
3. Methods
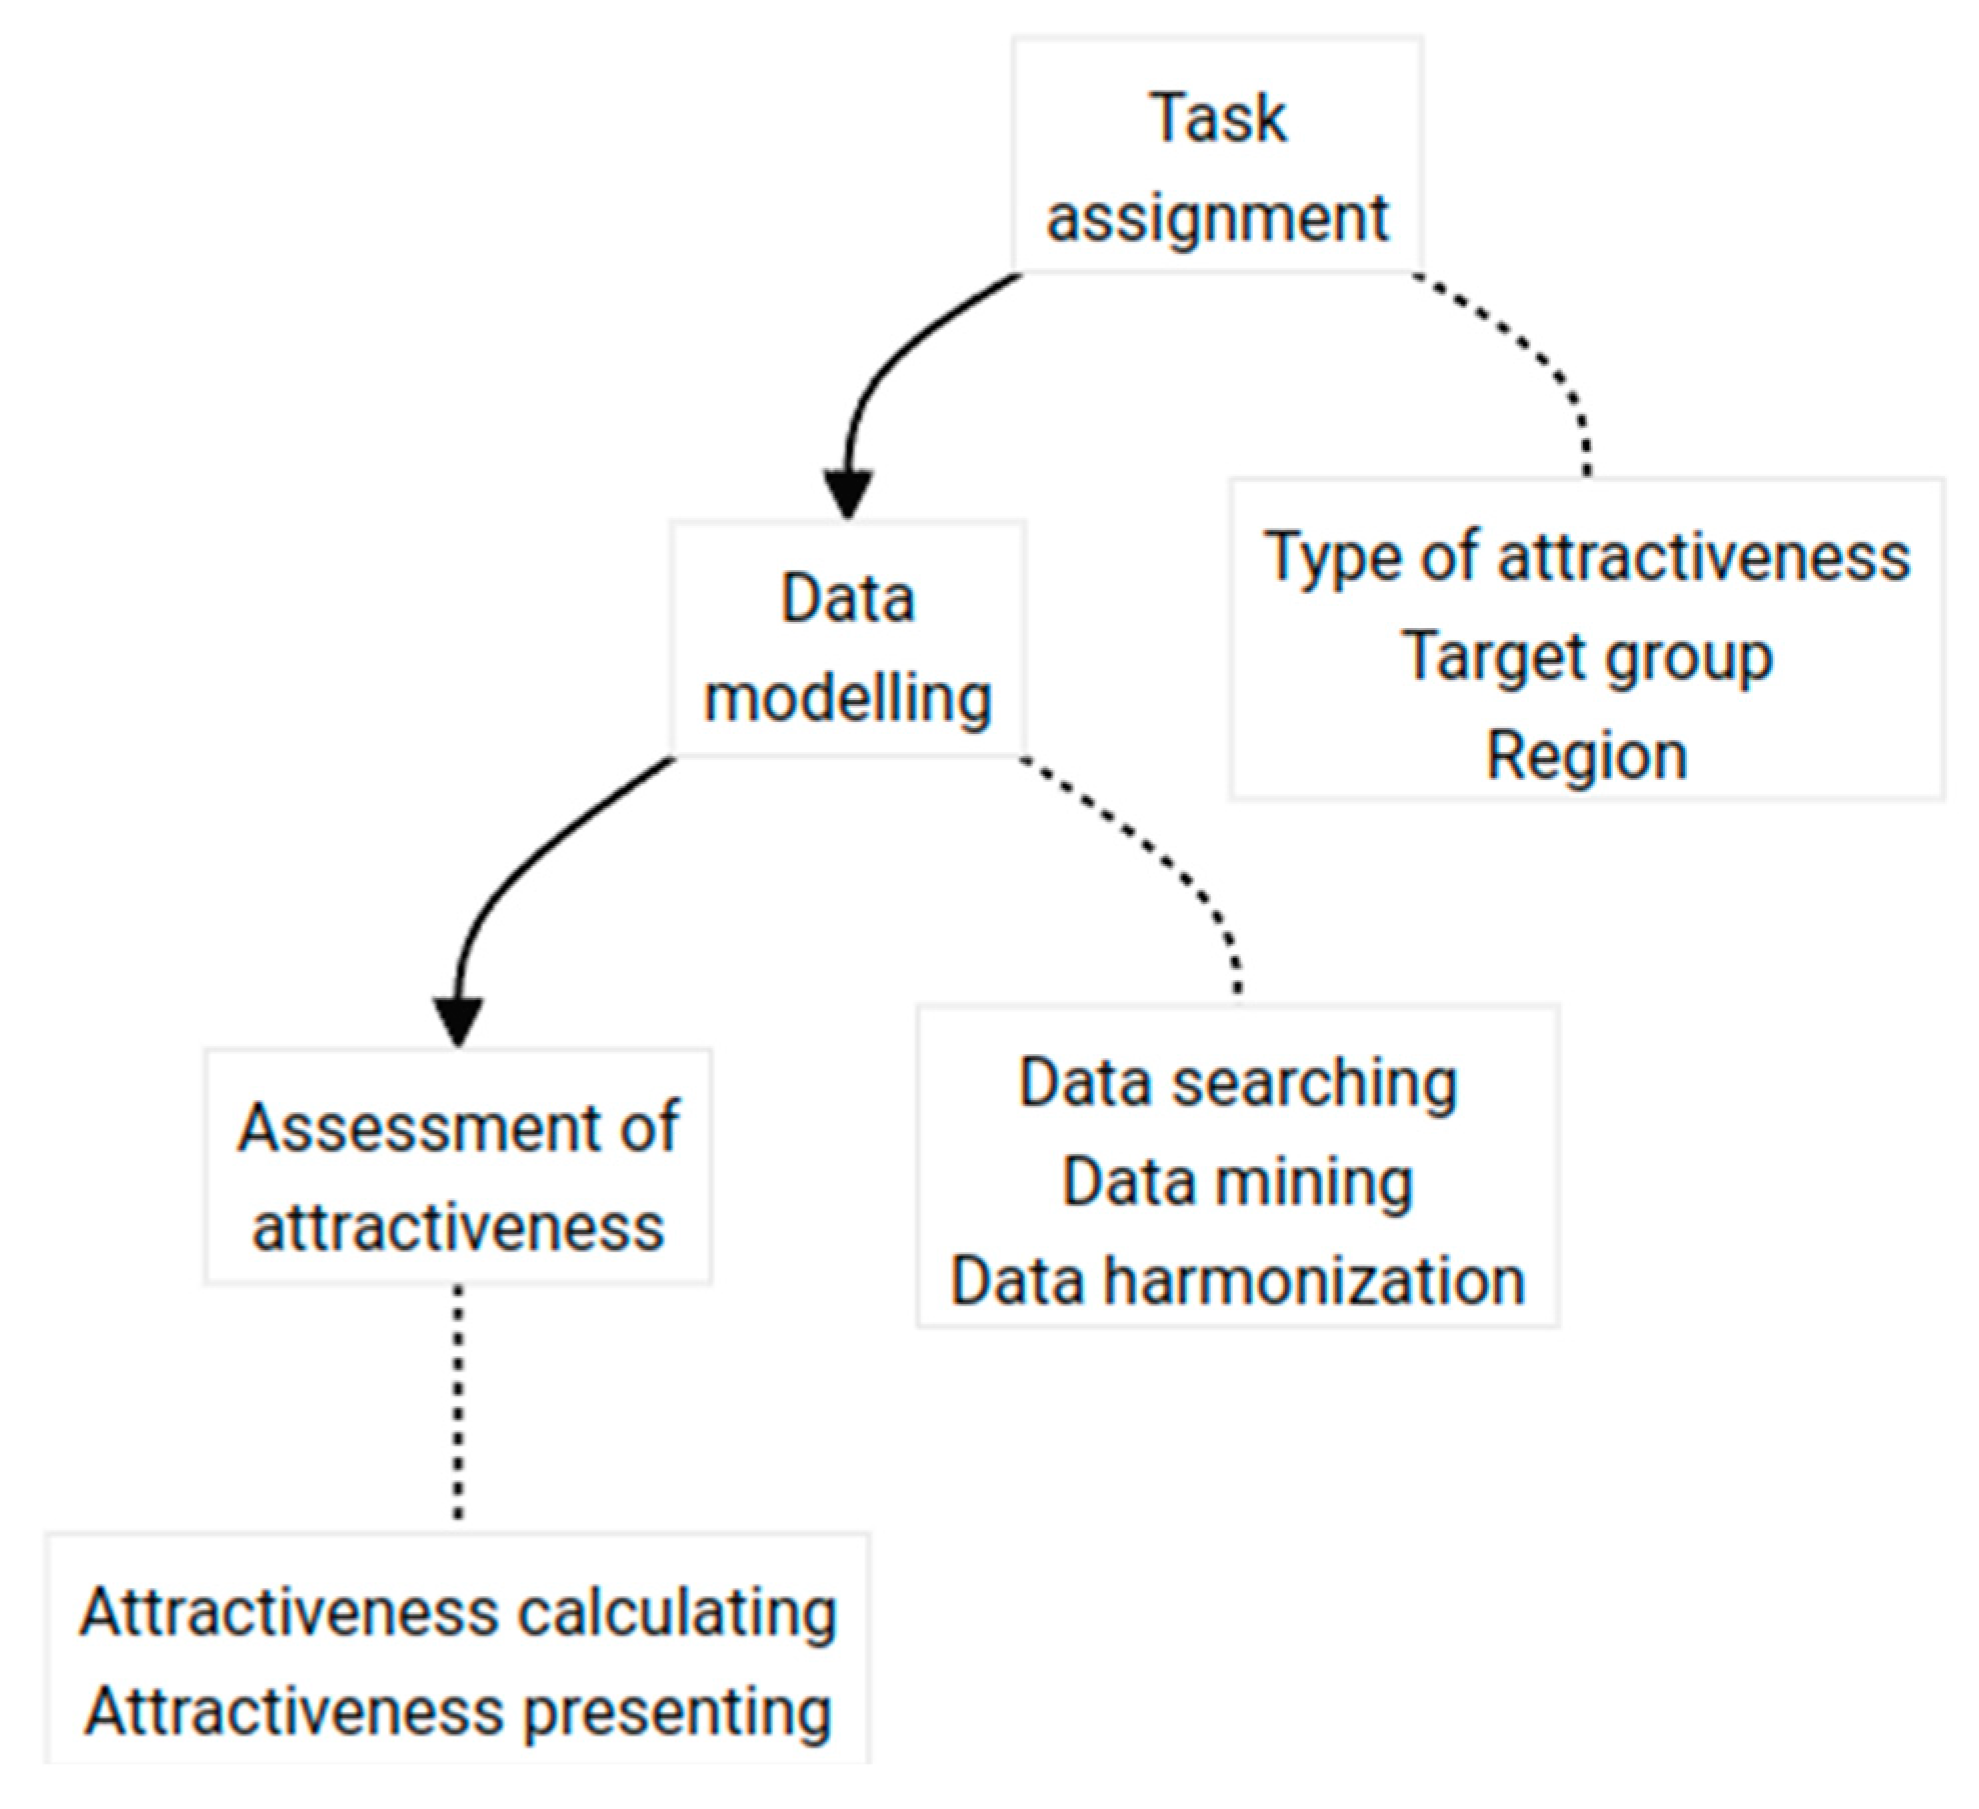
The research methodology (Figure 1) published in this paper follows the general methodology for data-driven assessment of the attractiveness of areas published in [21] and [22].
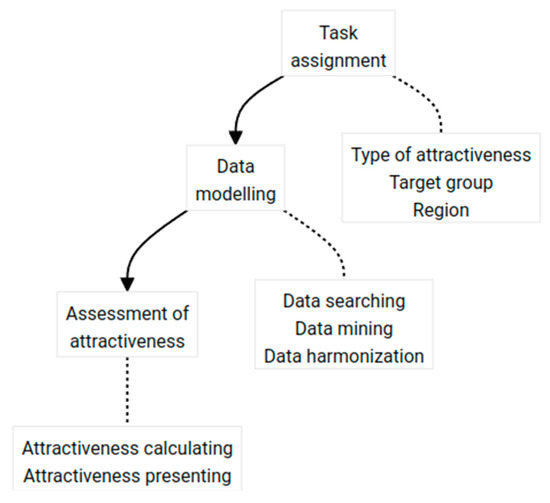
Figure 1.
The scheme of research methodology.
In the Task assignment section, the task of data-driven attractiveness assessment is specified. The specification refers to the type of attractiveness (for example, in the study presented in the Results section, it is the attractiveness associated with the innovation potential of the territory), the target group, and the territory on which the attractiveness will be evaluated. All three of these pieces of information are interlinked and determine the next steps in the attractiveness assessment, namely, the choice of input data, data processing methods, or presentation of results, including cartographic visualization [22].
From the perspective of using OSM as a base of input data for attractiveness assessment, the Data modeling section is important, as it deals with the collection and processing of data suitable for site assessment. The following operations are required in processing OSM data:
- Data searching;
- Data mining;
- Data harmonization.
Ad 1. The data searching phase seems to be completely unnecessary because the data source (OSM) is explicitly provided. In most research using data-driven area attractiveness assessment, it is necessary to select specific types of objects with which a particular type of attractiveness can be modeled. For example, for attractiveness related to the innovation potential of a territory, the object type “amenity:university” makes sense, while the object type “natural:stone” will not be considered in the evaluation (and also in the downloading and processing of the input data). This phase of the attractiveness assessment is closely related to the Task assignment step and is carried out through a search of the related literature and communication with stakeholders.
Ad 2. The data are extracted from OSM using the overpass-turbo web service (https://overpass-turbo.eu). Since in the study described below, 158 data object types for nine different territories need to be retrieved, this task is automated using a Bash script (Bourne-Again SHell). The result is data in CSV (Comma-separated value) format, which enters the next step of the Data modeling section.
Ad 3. The data harmonization is based on the universal framework for spatial data described in [8]. Downloaded data must first be checked, and if errors exist, they must be added or corrected. This operation is mainly done manually using regular expressions and bulk changes.
The next step is the transformation of the coordinate systems. The coordinates of the original data are in latitude/longitude form, whereas for the use of the Kernel density function, which is used to calculate the resulting attractiveness of the area in the study described below, data in a planar coordinate system is more appropriate. Therefore, we convert the input data to the WGS84/Pseudo-Mercator coordinate system (EPSG 3857) using a GIS (in our research, we prefer the open-source software QGIS 3.34).
The third phase of data harmonization consists of linking the OSM data with information that provides the importance (weight) of each feature type to evaluate the attractiveness as well as the impact of the feature type on its surroundings. For example, the “amenity:university” object type has the highest possible weight in terms of assessing the innovation potential of an area and operates within a distance of 50 km (see the study presented in the Results section). In order to link the two types of information, a Bash script was created.
The last part of the diagram (Figure 1) is the Assessment of attractiveness. This part consists of two steps: (1) computing a data-driven attractiveness assessment (various methods for attractiveness computations are provided in the Materials section or the publications [21] and [22]; the method suitable for OSM data is described in the Results section); (2) presentation of the results of data-driven attractiveness assessment, most often in the form of maps (see Figure 2, Figure 3, Figure 4 and Figure 5 and the publication [22] for more details). The operations of the Assessment of attractiveness part are most often implemented using R software 4.4.2 or some specific GIS.
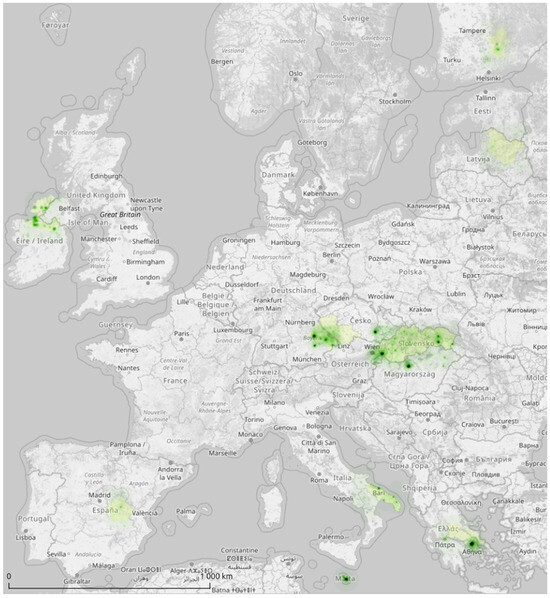
Figure 2.
Overview map of areas of interest.
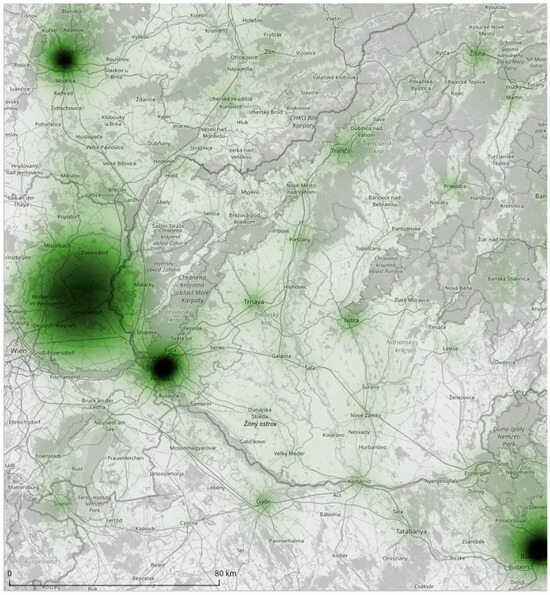
Figure 3.
Map cutout showing the western part of the pilot area in Slovakia.
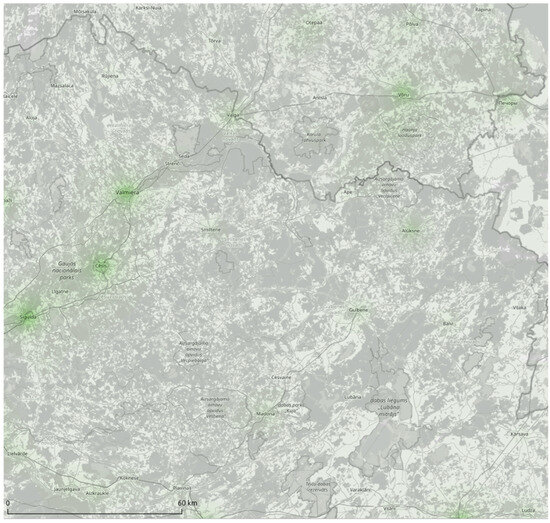
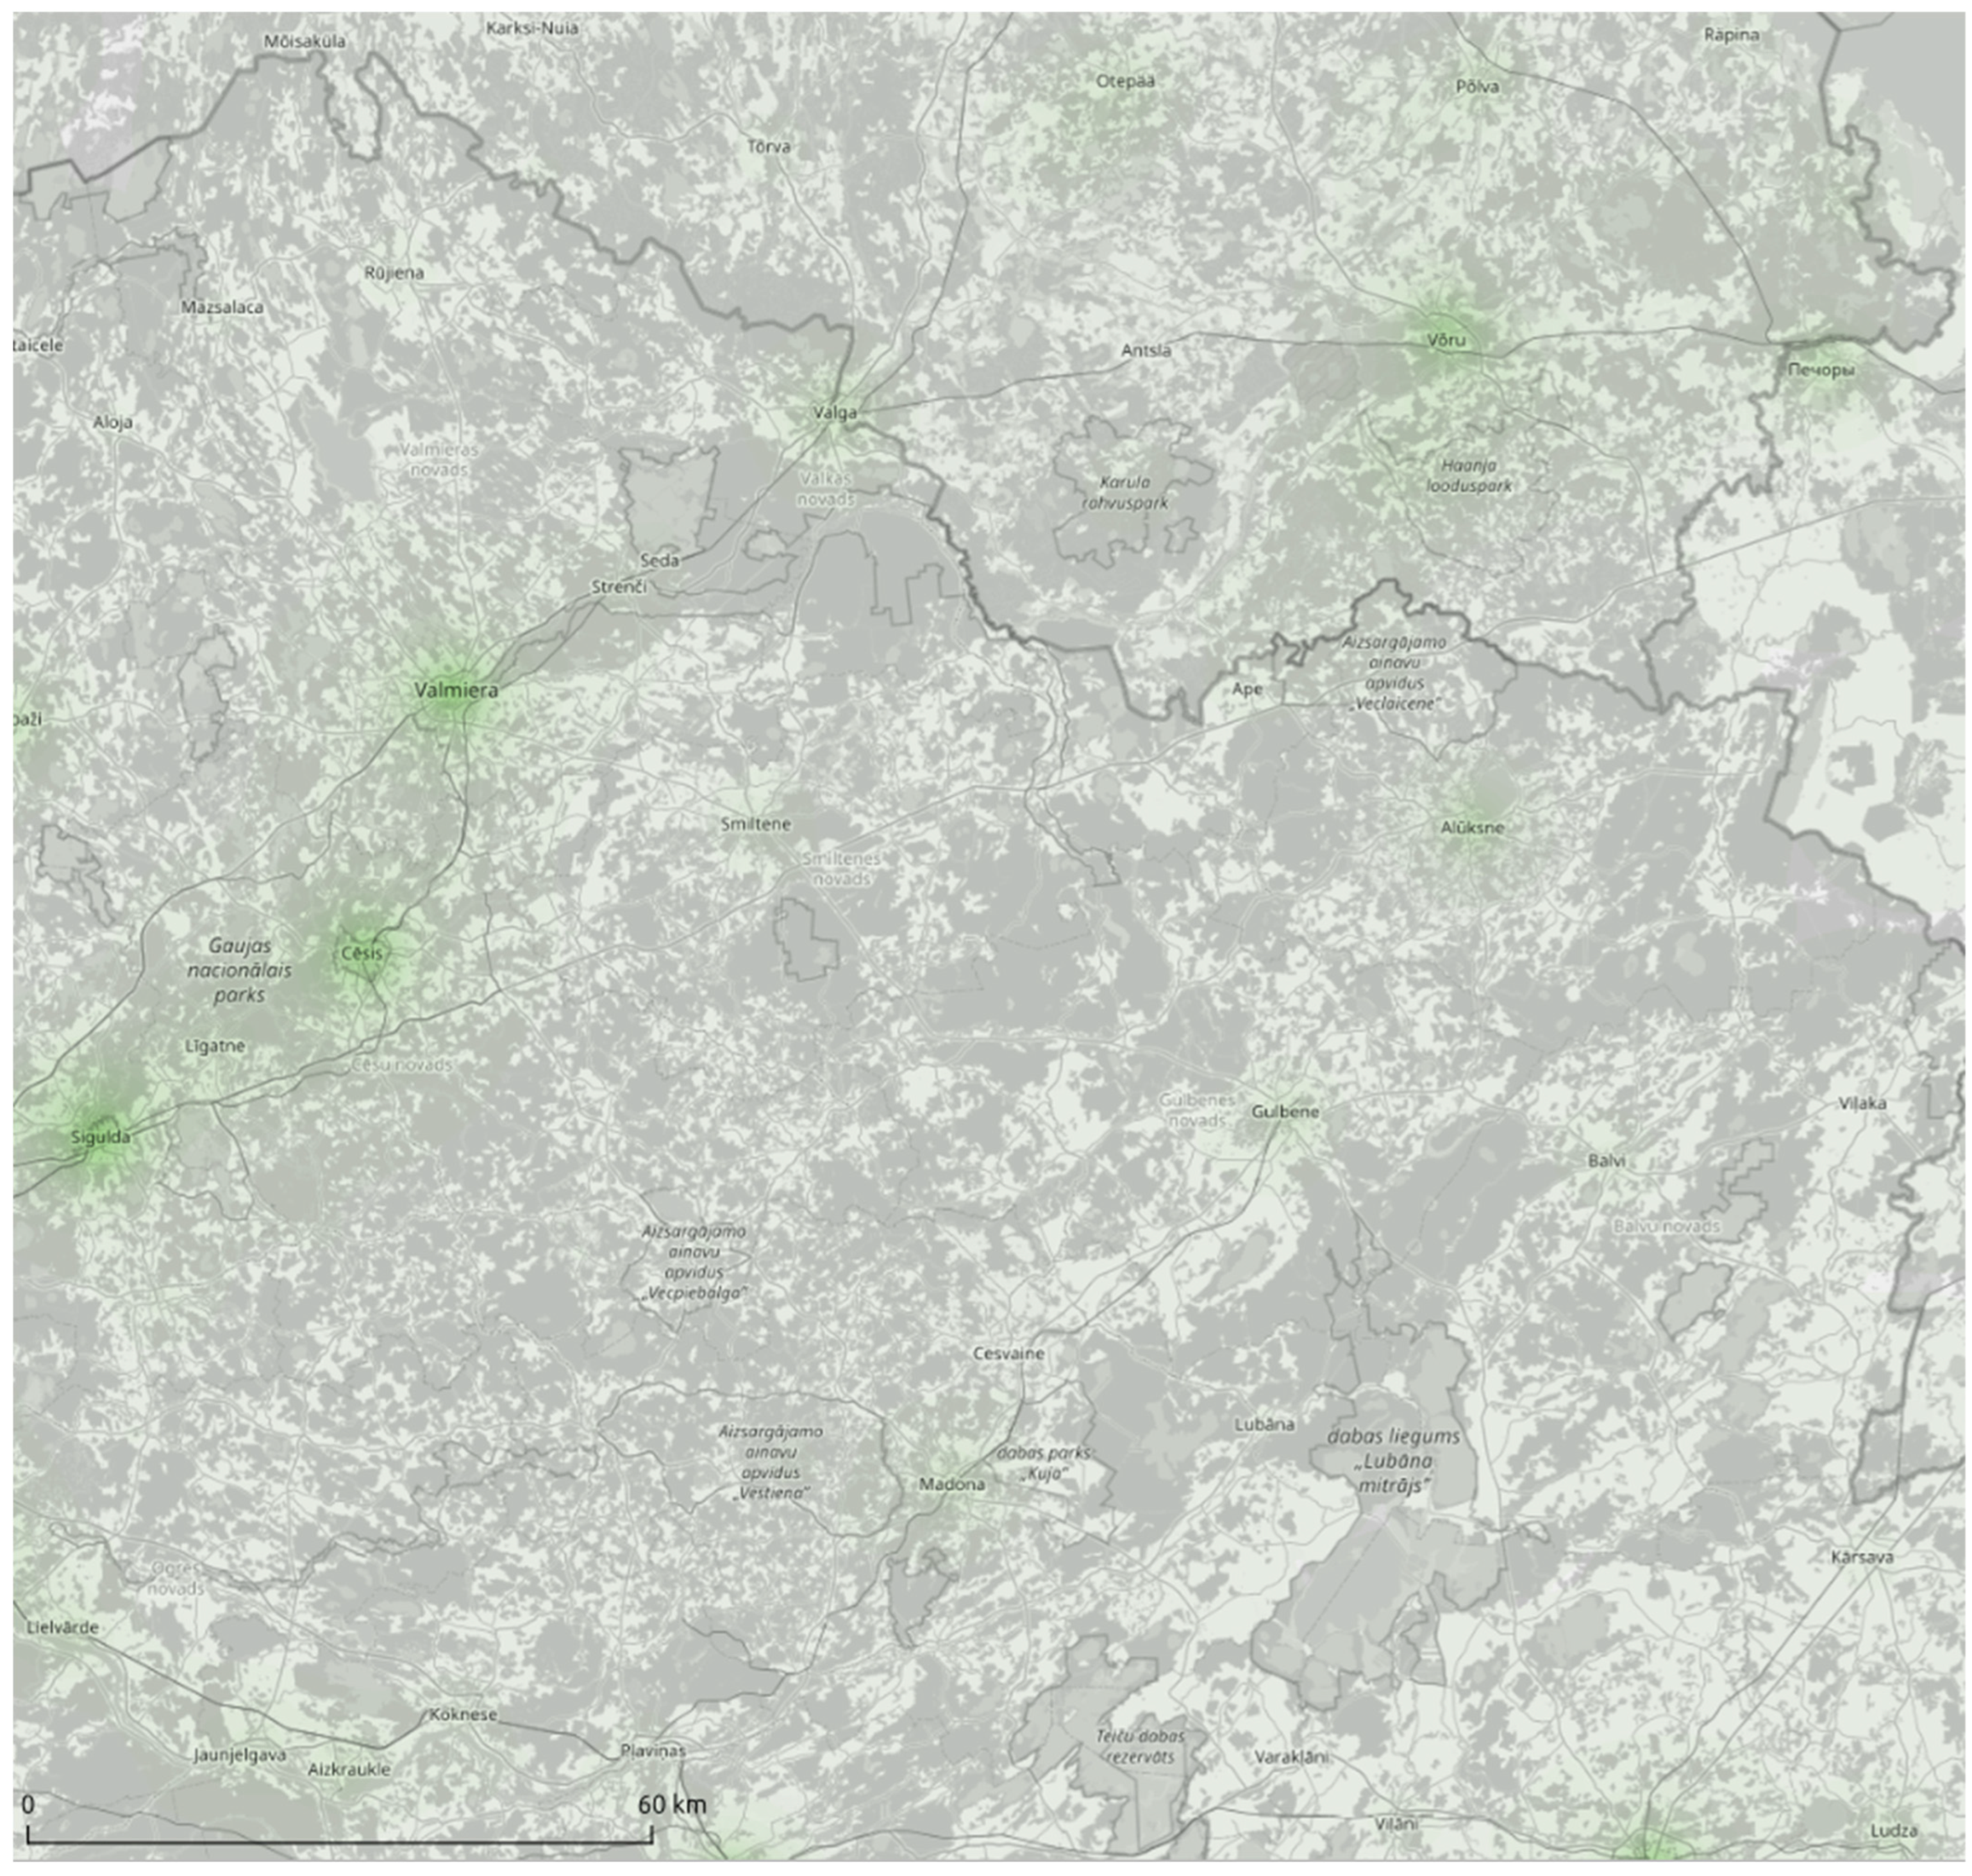
Figure 4.
Map cutout showing the pilot areas in Latvia.
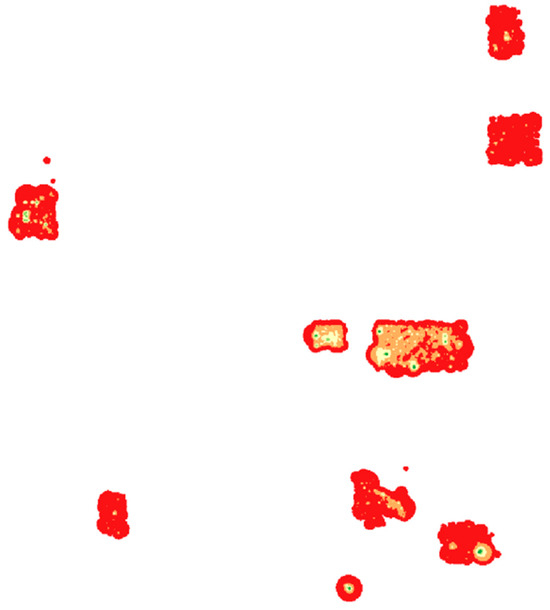
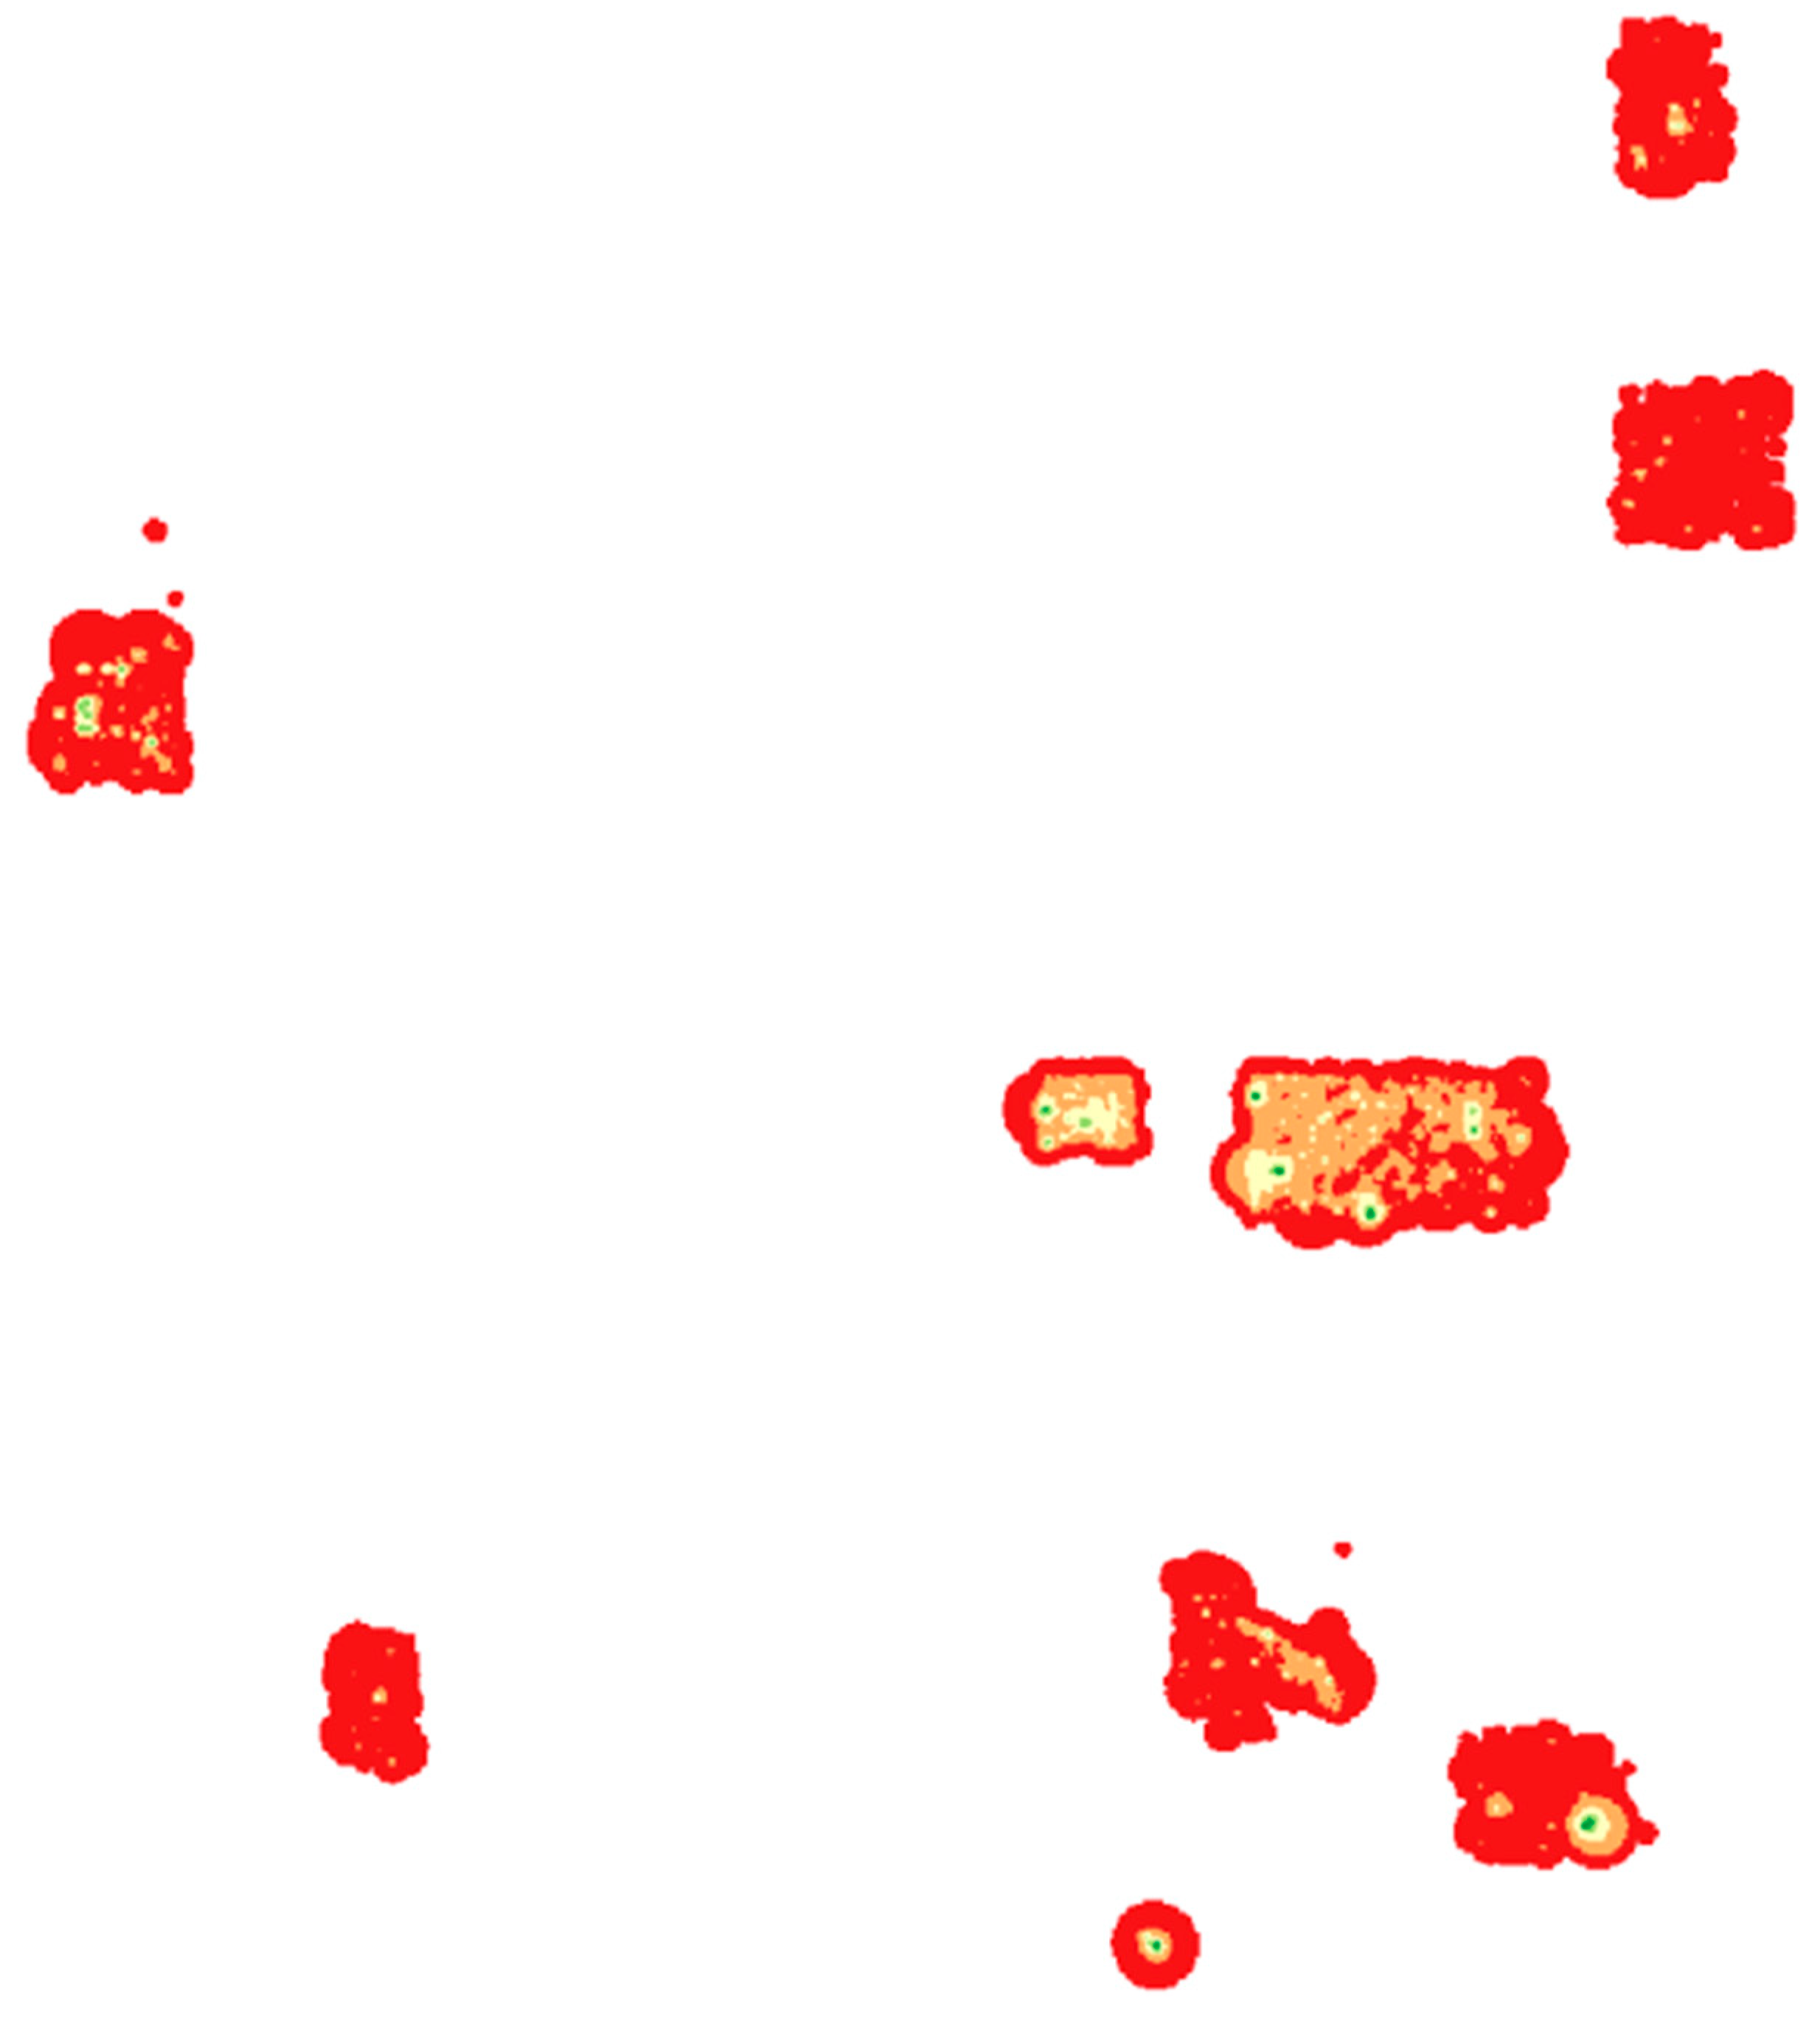
Figure 5.
Raster styled with Jenks breaks (colors explained in Table 2).
4. Results
The findings presented in this paper show a comparison of assessments of the innovation potential of the nine pilot areas of the PoliRuralPlus project (https://www.poliruralplus.eu/). This project builds on the success of its predecessor (PoliRural project (https://polirural.eu/)) and focuses on connecting rural and urban areas through advanced digital tools, such as AI (Artificial Intelligence), GIS, IoT (Internet of Things), and data analytics. The project aims to overcome policy barriers, reduce inequalities, and improve management and governance to support integrated rural and urban development strategies. The project includes nine pilot initiatives that test a pan-European approach to planning and forecasting development. Key objectives of the PoliRuralPlus project include fostering cooperation, developing business opportunities, promoting a green and circular economy, and revitalizing rural areas through connectivity and innovation ecosystems. PoliRuralPlus also contributes to the implementation of the Green Deal for Europe and uses European research infrastructures to improve collaboration and data-driven innovation.
In assessing innovation potential in the pilot regions of the project, we have drawn on the methodology (Figure 1) presented in the Methods section and the definition of the term innovation potential published in the Materials section.
In a first-step data-driven assessment of innovation potential of pilot regions of the PoliRural project, three main pieces of input information of this assessment task were established:
- Type of attractiveness: as mentioned above, the attractiveness of the territory in terms of innovation potential will be assessed.
- The target group: the target group of the PoliRuralPlus project and also the users of the attractiveness assessment consists mainly of experts in regional rural development, politics, public administration, and also commercial entities interested in business in the assessed areas.
- Regions: the PoliRuralPlus pilot areas include County Monaghan (Ireland), Slovakia, Central Greece, Apulia (Italy), Mallusjoki (Finland), Czech–Bavarian border region, Federation for the Development of Sierra and Mancha Conquense (Spain), Vizdeme Planning Region (Latvia), and Malta and the Gozo islands (https://www.poliruralplus.eu/pilots/rural-pilots/, accessed on 15 January 2025). In terms of administrative boundaries, the boundaries of the relevant NUTS3 regions have been used (yellow areas in Figure 2). NUTS3 regions represent the most appropriate uniform spatial units in the area of interest in terms of scale.
In line with the description of OSM in the Materials section, OSM data were used as the main and only input data source for the attractiveness assessment. In the current version, only point data (nodes) are processed. These data can also be used to model linear features that undeniably influence the attractiveness of the area. For example, the existence of motorways or high-speed roads (linear element) is not of great importance for the attractiveness of an area in terms of innovation potential, but rather the presence of a motorway exit (point element). The same is true for the railway—railway station pair.
The basic principles of the data modeling phase were described in the previous section of the paper. The choice of the appropriate key and value pairs from OSM is crucial for data selection and data harmonization. For the purposes of the described research, 158 relevant pairs describing the innovation potential (Link to shared table with OSM key-value pairs and weight and surroundings values—https://bit.ly/OSM_for_innovation_potential-attractiveness, accessed on 15 January 2025. Table is open to comments and the author welcome any notes and comments) were selected in the first phase. The relevant pairs were selected on the basis of discussion with stakeholders and research of existing publications (Section 2.1 and Section 2.2). To these pairs, information about the importance of a particular type of object for the attractiveness evaluation (weight column with values 1–10, where the number 10 means the maximum importance in terms of the evaluated attractiveness) and also about its influence on the surroundings (surroundings column, which contains the radius of the circular surroundings stated in meters) was added. Table 1 shows the types of objects that are of decisive importance for the evaluation of the attractiveness in terms of innovation potential (weights 9 and 10).

Table 1.
The most important OSM key-values pairs for the data-driven assessment of territorial innovation potential.
The weight and surroundings values were chosen based on a literature search (see Section 2), expert judgement, discussion with key stakeholders, and a simple questionnaire sent to representatives of each pilot. These values will be optimized in the future to ensure that the resulting model is as close to reality as possible.
The attractiveness calculation is performed in QGIS using the Heatmap function (kernel density estimation; [23]). Kernel density estimation was chosen for this study due to its simplicity, flexibility, and established use in geospatial analysis. It provides a smooth and continuous density surface, effectively visualizing the spatial distribution of innovation-related elements such as infrastructure. Additionally, kernel density estimation is computationally efficient and adaptable to diverse data types, including point and line datasets, making it a practical choice for analyzing large-scale data like OpenStreetMap. The input for this function is a layer with point geometry. This layer contains nodes from the OSM that were selected based on key and value values. Two attributes, weight and surroundings, were added to this layer, from which the advanced function parameters weight and radius were obtained.
The output of the attractiveness assessment for the PoliRuralPlus pilot areas is a map (Figure 2) that compares the attractiveness in each pilot region. From a cartographic point of view, this is a so-called heatmap (density raster). The dark-green color on the map shows areas with high attractiveness (the maximum attractiveness has a value of 7906 relative points; the lowest attractiveness is 0). On the other hand, areas where the underlying map is hardly covered by the heatmap layer are the least attractive in terms of the evaluated topic.
Very high attractiveness (according to Table 2) in the surveyed areas is mainly shown by the capital cities, such as Athens (Greece), Bratislava (Slovakia), Budapest (Hungary), or Valletta (Malta), or local metropolises, such as Brno (Czechia) or Regensburg (Germany); see the example in the Slovakia pilot area (Figure 3). Slovakia, except for the capital Bratislava, shows low attractiveness in comparison with urban areas in neighboring countries (Austria, Czechia, and Hungary). In the large settlements, we can find infrastructure (universities, research organizations, transport infrastructure) that strongly influences the innovation potential of the whole area.
Table 2.
Summary of the classified raster.
By contrast, rural areas in Spain, Finland, and Latvia are less attractive in terms of innovation potential (value 0–147 in Table 2). This fact is illustrated in the pilot regions in Latvia (Figure 4) and in the overview of all pilot areas (Figure 5).
Interpretation of the attractiveness assessment results can be done by classifying the grid using natural breaks (Jenks breaks). Figure 5 shows the grid divided into five categories—red indicates areas with very low innovation potential, while dark green indicates areas with high attractiveness in terms of innovation potential. Figure 5 clearly shows the different nature of the pilot regions, ranging from purely rural areas (Spain, Latvia) to areas with one or more local centers (Ireland, Finland, or Greece) to areas that are covered by infrastructure important for the diffusion of innovation (the eastern part of the pilot area in Italy, the Bavarian part of the cross-border pilot area between the Czech Republic and Germany or western Slovakia). Table 2 provides an overview of the grid so classified (boundaries of the individual intervals and percentage of intervals in the resulting grid).
According to Table 2, more than 95% of the areas with very low or low innovation potential are represented, which is very worrying information from the point of view of the sustainability and development of rural areas, including the demographic situation.
Table 3 also provides other comparisons of attractiveness in terms of innovation potential. It shows the average and maximum value of the raster in each of the examined territories (these are relative, dimensionless numbers). From the data in Table 3, it is clearly possible to detect rural regions (pilot territories in Finland, Spain, and Latvia) that have low average values. Similarly, the table shows territories with one or more local metropolitan areas. Such areas have a high maximum attractiveness value (pilot areas in Slovakia or Greece).
Table 3.
Comparison of raster values for pilot regions.
The advantage of the proposed solution, besides the availability of internationally comparable current data, is mainly the detection of different attractiveness values within individual administrative regions. If we were to use statistical data, the administrative regions would be homogeneous in terms of attractiveness, which means that the user would encounter highly distorted information that would contradict reality. It is arguable that a higher level of detail could be obtained by using administrative units of a smaller scale (e.g., municipalities). In this case, however, it is important to note that obtaining relevant statistical data would be very difficult and more or less impossible on an international scale.
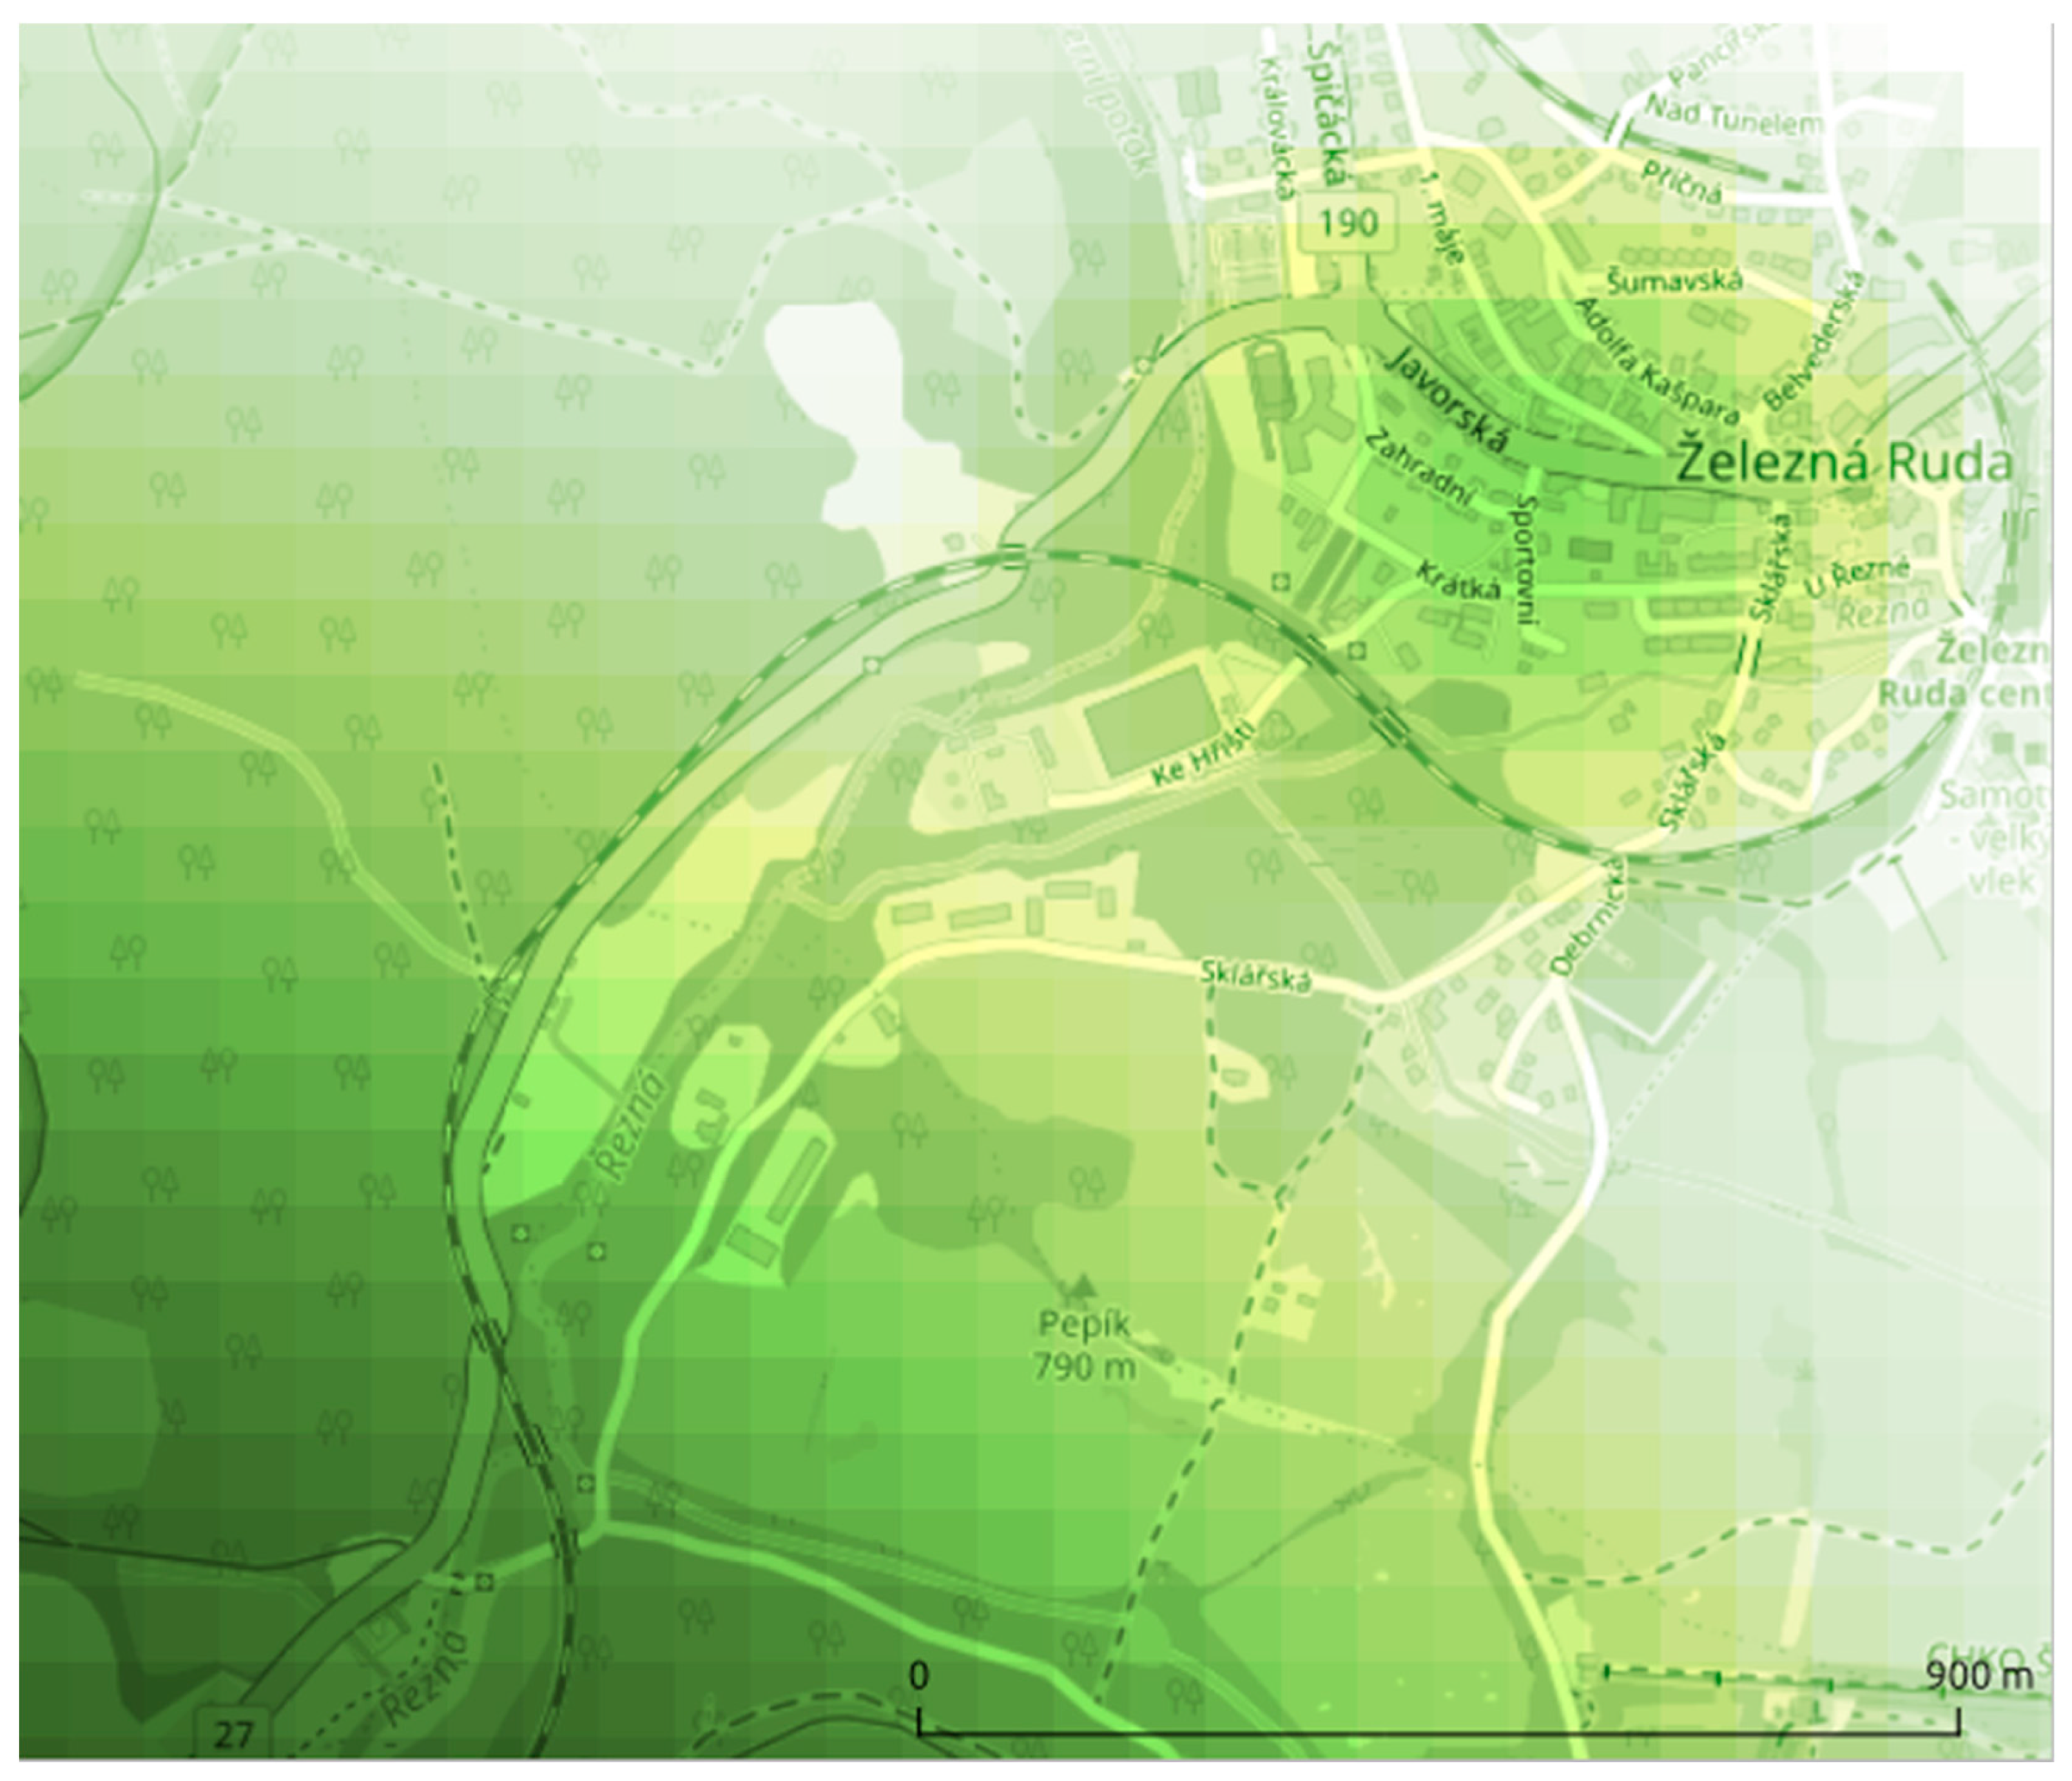
The results of a data-driven attractiveness assessment are not only useful for comparing the attractiveness of different regions. Since the proposed procedure eliminates the bias resulting from the use of statistical data and administrative region boundaries, the proposed procedure is important for regional and micro-level spatial planning (Figure 6). Since the pixel size can be set to a relatively small size in the order of tens and thousands of meters in the Heatmap function, local maxima and minima of attractiveness can be revealed. These locations can then serve as inspiration for further development or, in the case of minima, as locations with a high preference for investment, public support, and further development.
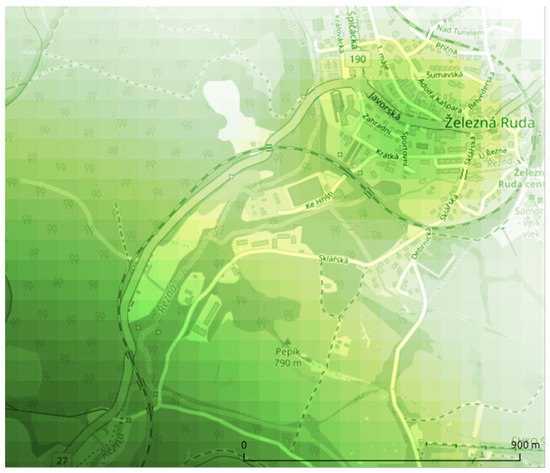
Figure 6.
Detailed view showing a part of the pilot area on the border of Czechia and Germany.
5. Discussion
The project of data-driven attractiveness assessment in terms of innovation potential is constantly evolving, and the choices of individual elements, weights, and surroundings are not definitive and will be optimized, with an emphasis on user requirements and evaluation of model reliability based on local surveys. The key objective is to offer a modern and flexible approach to assessing the attractiveness of an area that reflects the current needs and capabilities of data sources.
One of the biggest advantages of the proposed solution is the elimination of biases that often arise when using traditional methods based on administrative boundaries and statistical data (Figure 7). These solutions often fail to account for spatial heterogeneity, which is crucial for attractiveness assessment. By using data from OpenStreetMap, more detailed and locally relevant information can be taken into consideration in the research of innovation potential. A relevant statistical comparison between the traditional approach and the infrastructure assessment approach is currently not possible. This is due to the completely different nature of the two ways of identifying innovation potential. Traditional approaches work with aggregated data, meaning that there is a huge bias. For example, the territories of the pilot regions of Finland and Latvia are very similar. In both cases, the landscape is natural, with very sparse settlements. The difference is that, in Finland, there are a few dominant settlements with very strong innovation potential. In the case of statistical data (specifically, the Regional Innovation Scoreboard 2023), Finland’s potential is significantly higher than the value for Latvia. However, it is important to note that the high value in the case of Finland only applies to a few settlements within the pilot region. The infrastructure assessment presented in this paper yields much more objective results. The Finnish pilot area has a higher innovation potential than the Latvian pilot area, but the differences are not as pronounced, and, moreover, the data visualization concentrates the innovation potential in the settlements. The comparison between the two approaches is more reliable if the assessed area is homogeneous in terms of rural or urban character. Examples are the pilot areas in Malta or Spain.
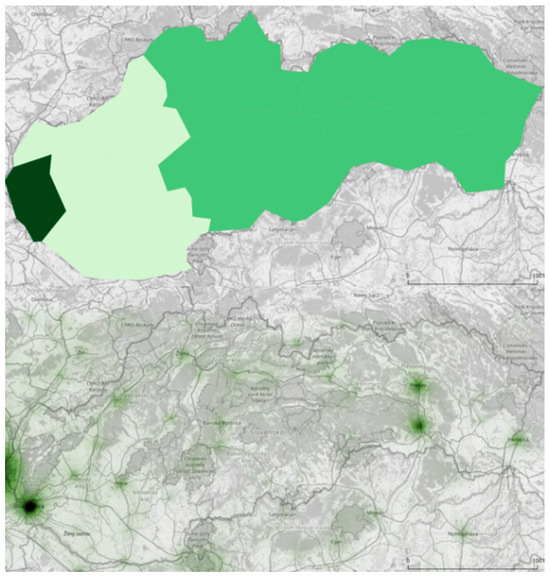
Figure 7.
Slovakia pilot area: the comparison innovation potential assessment for statistical data (Regional Innovation Scoreboard; top map) and data from OpenStreetMap (lower map). Dark-green colours indicate high potential for innovation, while light-green indicates low potential for innovation.
Another advantage is the wide availability of up-to-date data, which adapts quickly to changes in the area, such as new buildings, infrastructure, or changes in transport accessibility. Due to its flexibility, the procedure can be applied to different spatial evaluation metrics, for example, tourist attraction, economic potential, or quality of life. The approach is also suitable for different target groups, be they citizens, investors, or public authorities. Moreover, it can be used at different territorial levels, from local to macro-regional, including cross-border studies, making it an ideal tool for the European context.
Despite the advantages, the use of OSM data has its risks and limitations [24,25,26]. One of the main challenges is the heterogeneity of the data, which can vary between regions, depending on the activity of the local community. In some areas, data may be very detailed, while in others, key infrastructure or information may be missing. The solution to this situation is clear: use high-quality commercial data or state-guaranteed datasets. However, the existence of such data is limited, and creating and maintaining it is costly. Another problem of OSM is missing or inaccurate metadata, for example, the absence of information on the date of the last update or the accuracy of a particular feature. The legal constraints associated with the ODbL license can complicate some applications, particularly in the commercial sector. OSM may also not be accurate enough for specific applications such as detailed infrastructure planning or technical maps. In addition, its thematic focus is limited, requiring combination with other data sources.
The future of the data-driven attractiveness assessment project lies in a balanced combination of data from different sources. In addition to OSM, Points of Interest data, data from surveys or experiments, citizen science data, statistical data, and official data from government registers should be used, which can fill in missing information and increase overall accuracy. The key challenge will be to find an appropriate balance among these data types to minimize the risk of bias in the results.
Exploring alternative methods represents an important direction for future research. Geographically Weighted Regression (GWR) has the potential to reveal spatially varying relationships between innovation potential and socio-economic factors, while Local Indicators of Spatial Association (LISA) could enable statistical significance testing of spatial clusters. Integrating these approaches in future studies could provide a deeper and more nuanced understanding of spatial patterns and relationships, complementing the findings derived from Kernel density estimation.
The selection of object types (pairs “key:value”) and their parameterization (weight and surroundings neighborhood) are not final and will be further optimized in the next steps of the research. Similarly, the possibility of modeling the influence propagation of object types using irregular or even dynamic structures will be subject to further research. Another important area of development is predictive modeling to estimate the impacts of future changes on the attractiveness of an area. Examples include assessing the impact of the construction of a new highway, industrial park, or cultural center on a particular type of regional attractiveness. These predictions will be particularly useful at the micro level, where they can help to optimize planning and decision making. Combining spatial data with advanced analytical methods, including the use of AI, could bring even greater benefits in the future and increase the usability of the project in a wide range of applications.
6. Conclusions
This paper introduced a new methodology for assessing the innovation potential of an area using open spatial data from OpenStreetMap and geoinformation technologies. Unlike traditional methods that rely on aggregated statistical data and administrative boundaries as a basic spatial unit, the proposed approach allows for a more detailed and accurate analysis by using spatially specific infrastructure data.
The main advantages of the presented approach include:
- Detailed spatial analysis: Because of dealing with infrastructure important from the perspective of innovation potential, the proposed methodology allows identifying key locations with high innovation potential (such as universities, research centers) and detecting heterogeneity within regions, which is difficult with traditional methods using aggregated statistical data.
- International replicability: The open nature of OSM data makes the methodology easily applicable to different territories, including cross-border regions, as demonstrated in the PoliRuralPlus pilot areas. Of course, it is necessary to be aware of the limits and risks that arise from the use of OSM.
- Flexibility and timeliness of data: Continuous updating of OSM data allows for rapid response to changes in infrastructure, increasing the relevance of results. There are possibilities for modeling historical and future development, including the creation of alternative scenarios for the development of the area.
The results showed significant differences in innovation potential between urban and rural areas. While capital cities and local metropolises show high attractiveness due to their dense network of universities and research institutions, rural regions in some countries remain less attractive, presenting an opportunity for targeted investments and development strategies. The region of eastern Bavaria, which is both rural and has a high potential for innovation, is special. This is due to the support of the local government, for example, in the construction of university and college campuses in small towns or the existence of a good network of rail and road communications.
Despite the advantages, the limitations of using OSM data need to be taken into account, including their heterogeneity and the lack of information in less active regions. The limitations resulting from the use of OpenStreetMap are described in the paper and should be kept in mind, especially when interpreting the results of the evaluation. However, at the level of the individual pilot areas, the limits of OSM have a minimal impact on the attractiveness assessment, as these are (with the exception of the cross-border area Czech Republic/Bavaria) small homogeneous areas, where we can assume a similar quality of OSM data. A problem may arise when evaluating across pilot regions. But, as mentioned, this methodology is mainly focused on smaller local areas, where it is not possible to describe internal differences using statistical data.
Future developments will aim to integrate OSM with official data sources, commercial datasets, VGI (Volunteered geographic information), and statistical data to improve the accuracy and reliability of results. Next steps include optimization of the weighting parameters, comparison with existing studies and verification field research, expansion of the assessed area, extension of the model to include predictive analyses, and development of a web application to allow interactive presentation of the results.
The proposed methodology represents an important step towards a more effective assessment of the innovation potential of regions and can serve as a basis for policy making and strategic planning at different levels.
Funding
This research was funded by the PoliRuralPlus project funded by the European Union’s Horizon Europe research and innovation programme under grant agreement No 101136910.
Data Availability Statement
The raw data supporting the conclusions of this article will be made available by the authors on request.
Conflicts of Interest
The author declare no conflicts of interest.
References
- Rogers, E.M.; Adhikarya, R. Diffusion of Innovations: An Up-To-Date Review and Commentary. Ann. Int. Commun. Assoc. 1979, 3, 67–81. [Google Scholar] [CrossRef]
- Pokorný, O. Analýza Inovačního Potenciálu Krajů České Republiky; Sociologické Nakladatelství: Praha, Czech Republic, 2008. [Google Scholar]
- Kudinska, M. Latvia’s Innovation Potential as a Factor of the Development of its Economy. New Socio-Econ. Chall. Dev. Eur. 2010, 2010, 179–185. [Google Scholar]
- Žižlavský, O. Factors of an Innovation Potential Development Are Known, but Not Always Mastered. Econ. Manag. 2011, 16, 1–7. [Google Scholar]
- Zabala-Iturriagagoitia, J.M.; Voigt, P.; Gutiérrez-Gracia, A.; Jiménez-Sáez, F. Regional Innovation Systems: How to Assess Performance. Reg. Stud. 2007, 41, 661–672. [Google Scholar] [CrossRef]
- Brenner, T.; Broekel, T. Methodological Issues in Measuring Innovation Performance of Spatial Units. Ind. Innov. 2011, 18, 7–37. [Google Scholar] [CrossRef]
- Kuhlman, C.; Ramamurthy, K.N.; Sattigeri, P.; Lozano, A.C.; Cao, L.; Reddy, C.; Mojsilovic, A.; Varshney, K.R. How to foster innovation: A data-driven approach to measuring economic competitiveness. IBM J. Res. Dev. 2017, 61, 11:1–11:12. [Google Scholar] [CrossRef]
- Zheng, K.; Hu, F.; Yang, Y. Data-Driven Evaluation and Recommendations for Regional Synergy Innovation Capability. Sustainability 2023, 15, 11143. [Google Scholar] [CrossRef]
- Janečka, K.; Čerba, O.; Jedlička, K.; Ježek, J. Towards Interoperability of Spatial Planning Data: 5-Steps Harmonization Framework. In Proceedings of the 13th International Multidisciplinary Scientific GeoConference SGEM, Varna, Bulgaria, 16–22 June 2013. [Google Scholar]
- Fotheringham, A.S.; Wong, D.W.S. The Modifiable Areal Unit Problem in Multivariate Statistical Analysis. Environ. Plan. A Econ. Space 1991, 23, 1025–1044. [Google Scholar] [CrossRef]
- Turner, M.G.; O’Neill, R.V. Exploring Aggregation in Space and Time. In Linking Species & Ecosystems; Clive, G.J., Lawton, J.H., Eds.; Springer: Boston, MA, USA, 1995; pp. 194–208. [Google Scholar] [CrossRef]
- Gardner, R.H.; Cale, W.G.; O’Neill, R.V. Robust Analysis of Aggregation Error. Ecology 1982, 63, 1771–1779. [Google Scholar] [CrossRef]
- World Intellectual Property Organization. Global Innovation Index 2023: Innovation in the Face of Uncertainty, 1st ed.; World Intellectual Property Organization: Geneva, Switzerland, 2023. [Google Scholar]
- Bielińska-Dusza, E.; Hamerska, M. Methodology for Calculating the European Innovation Scoreboard—Proposition for Modification. Sustainability 2021, 13, 2199. [Google Scholar] [CrossRef]
- Dhakal, S.P.; Mahmood, M.N.; Wiewora, A.; Brown, K.; Keast, R. The Innovation Potential of Living-Labs to Strengthen Small and Medium Enterprises in Regional Australia. Australas. J. Reg. Stud. 2013, 19, 456–474. [Google Scholar]
- Zemtsov, S.; Baburin, V. Innovation Potential of Regions in Northern Eurasia. In Proceedings of the 53rd Congress of the European Regional Science Association: ‘Regional Integration: Europe, the Mediterranean and the World Economy’, Palermo, Italy, 27–31 August 2013; European Regional Science Association (ERSA): Louvain-la-Neuve, Belgium, 2013. [Google Scholar]
- Wehn, U.; Evers, J. The social innovation potential of ICT-enabled citizen observatories to increase eParticipation in local flood risk management. Technol. Soc. 2015, 42, 187–198. [Google Scholar] [CrossRef]
- Shiau, S.J.H.; Huang, C.-Y.; Yang, C.-L.; Juang, J.-N. A Derivation of Factors Influencing the Innovation Diffusion of the OpenStreetMap in STEM Education. Sustainability 2018, 10, 3447. [Google Scholar] [CrossRef]
- Notelaers, L.; Verstraete, J.; Vansteenwegen, P.; Tampère, C.M.J. A travel demand modeling framework based on OpenStreetMap. Discov. Civ. Eng. 2024, 1, 26. [Google Scholar] [CrossRef]
- Wang, Z.; Zheng, J.; Han, C.; Lu, B.; Yu, D.; Yang, J.; Han, L. Exploring the Potential of OpenStreetMap Data in Regional Economic Development Evaluation Modeling. Remote Sens. 2024, 16, 239. [Google Scholar] [CrossRef]
- Bennett, J. OpenStreetMap: Be Your Own Cartographer, 1st ed.; Packt Publishing: Birmingham, UK, 2010. [Google Scholar]
- Čerba, O.; Velten, S. Rural Attractiveness Index and Its Visualization as Tools to Support Local and Regional Decision-Making. Agris on-line Pap. Econ. Inform. 2024, 16, 33–43. [Google Scholar] [CrossRef]
- Čerba, O.; Jedlička, K. Cartographic Visualisation of the Territorial Attractiveness. Abstr. ICA 2024, 7, 1–2. [Google Scholar] [CrossRef]
- Okabe, A.; Satoh, T.; Sugihara, K. A kernel density estimation method for networks, its computational method and a GIS-based tool. Int. J. Geogr. Inf. Sci. 2009, 23, 7–32. [Google Scholar] [CrossRef]
- Grinberger, A.Y.; Minghini, M.; Juhász, L.; Yeboah, G.; Mooney, P. OSM Science—The Academic Study of the OpenStreetMap Project, Data, Contributors, Community, and Applications. ISPRS Int. J. Geo-Inf. 2022, 11, 230. [Google Scholar] [CrossRef]
- Biljecki, F.; Chow, Y.S.; Lee, K. Quality of crowdsourced geospatial building information: A global assessment of OpenStreetMap attributes. Build. Environ. 2023, 237, 110295. [Google Scholar] [CrossRef]


Disclaimer/Publisher’s Note: The statements, opinions and data contained in all publications are solely those of the individual author(s) and contributor(s) and not of MDPI and/or the editor(s). MDPI and/or the editor(s) disclaim responsibility for any injury to people or property resulting from any ideas, methods, instructions or products referred to in the content. |
© 2025 by the author. Published by MDPI on behalf of the International Society for Photogrammetry and Remote Sensing. Licensee MDPI, Basel, Switzerland. This article is an open access article distributed under the terms and conditions of the Creative Commons Attribution (CC BY) license (https://creativecommons.org/licenses/by/4.0/).