


The Influence of the Relationship Between Landmark Symbol Types, Annotations, and Colors on Search Performance in Mobile Maps Based on Eye Tracking

Abstract
1. Introduction
1.1. The Influence of Map Landmark Symbols Types on Search Performance
1.2. The Influence of Map Vision on Search Performance
1.3. The Influence of Gender on Search Performance
1.4. Eye Movement Research in Cartography
2. Methods and Experiments
2.1. Experiment Design
2.2. Participants
2.3. Experimental Equipment
2.4. Experimental Materials
2.4.1. Acquisition of Landmark Symbol Materials
2.4.2. Experimental Map Design
2.4.3. Experimental Procedure
3. Results
3.1. Symbol Validity
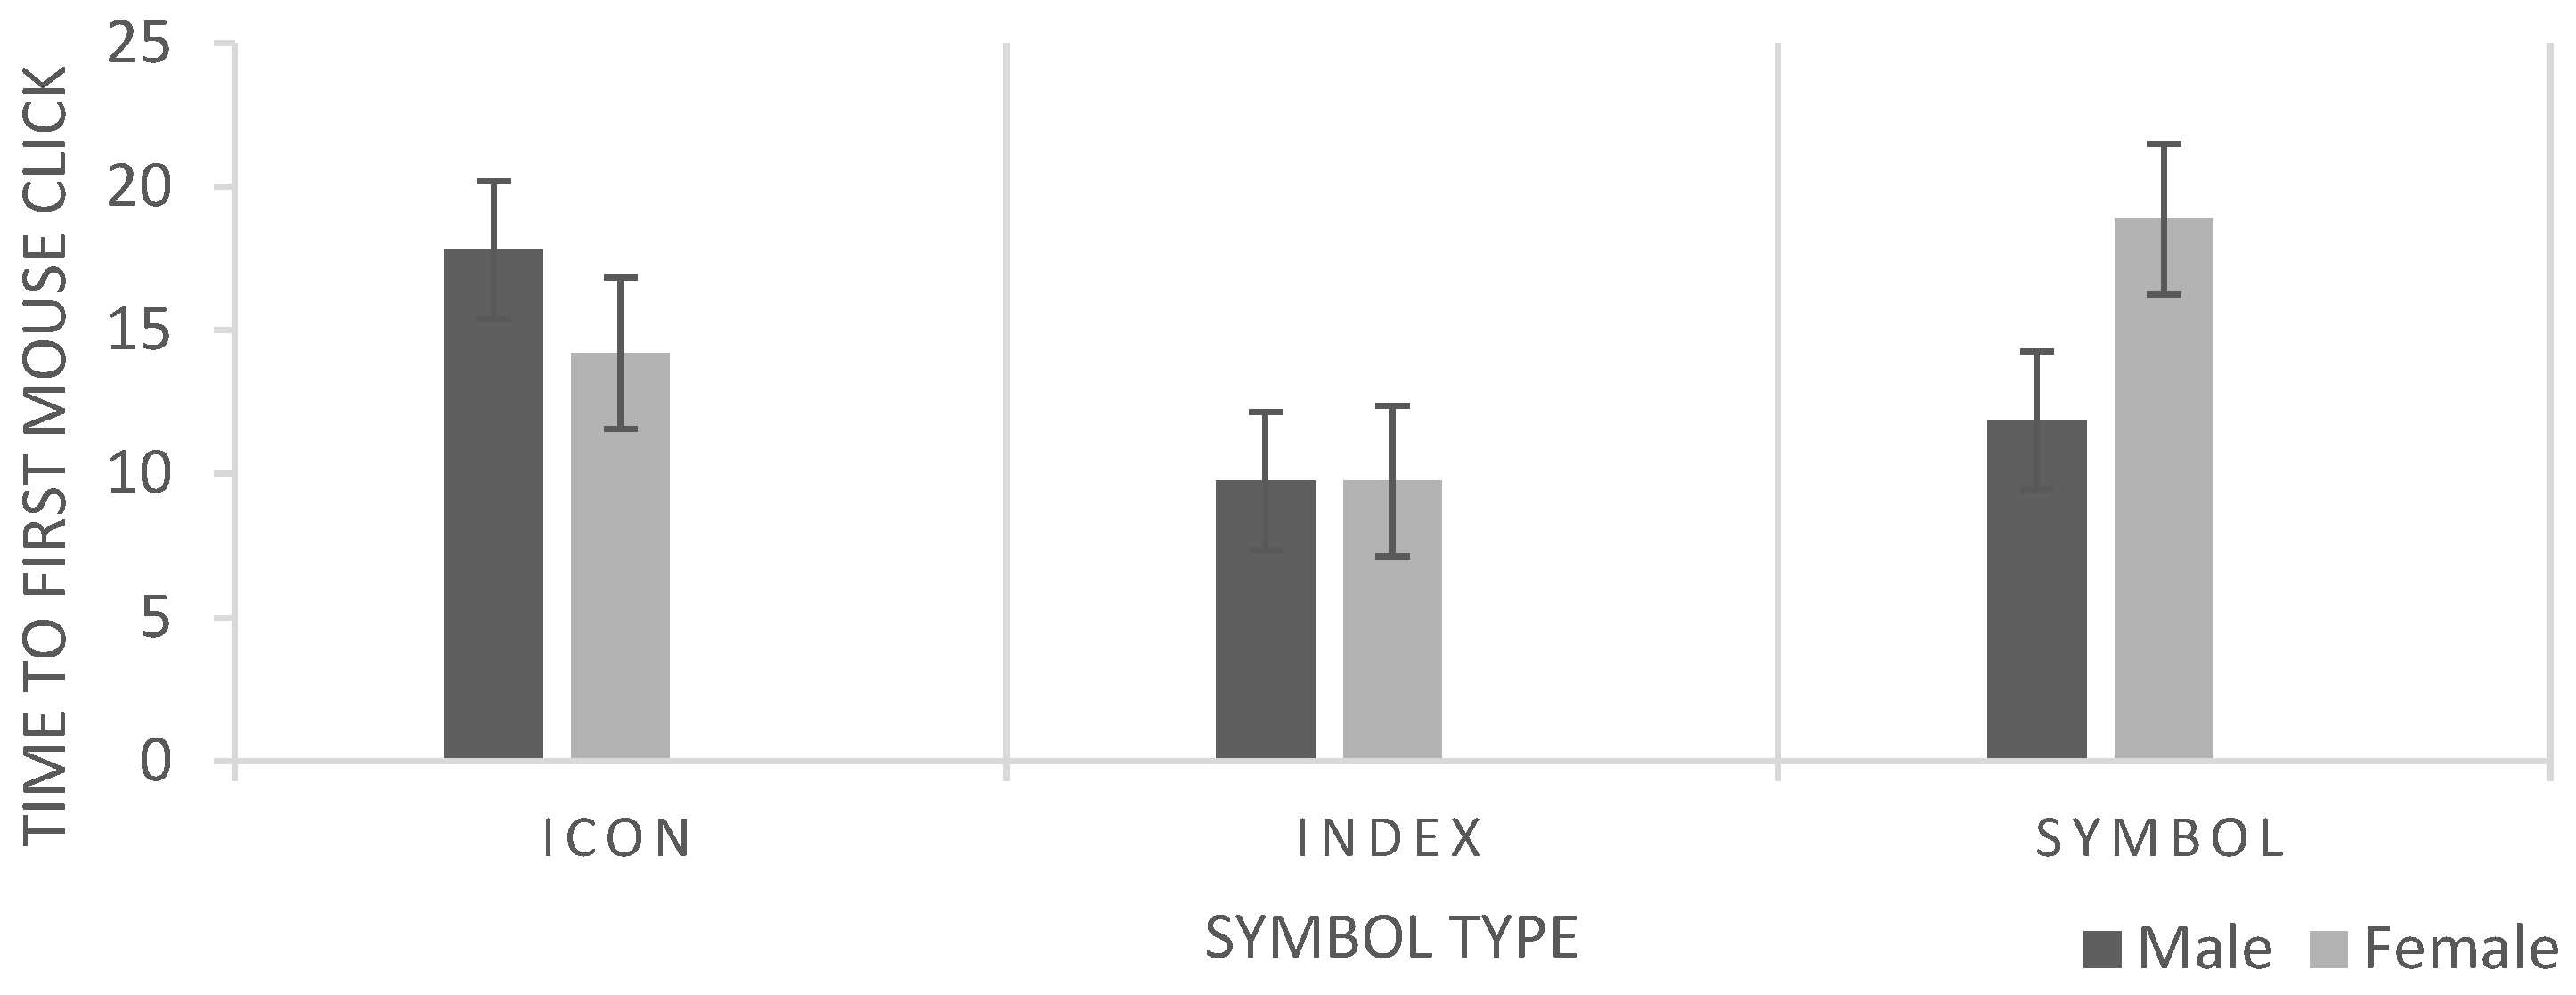
3.2. Searching Efficiency
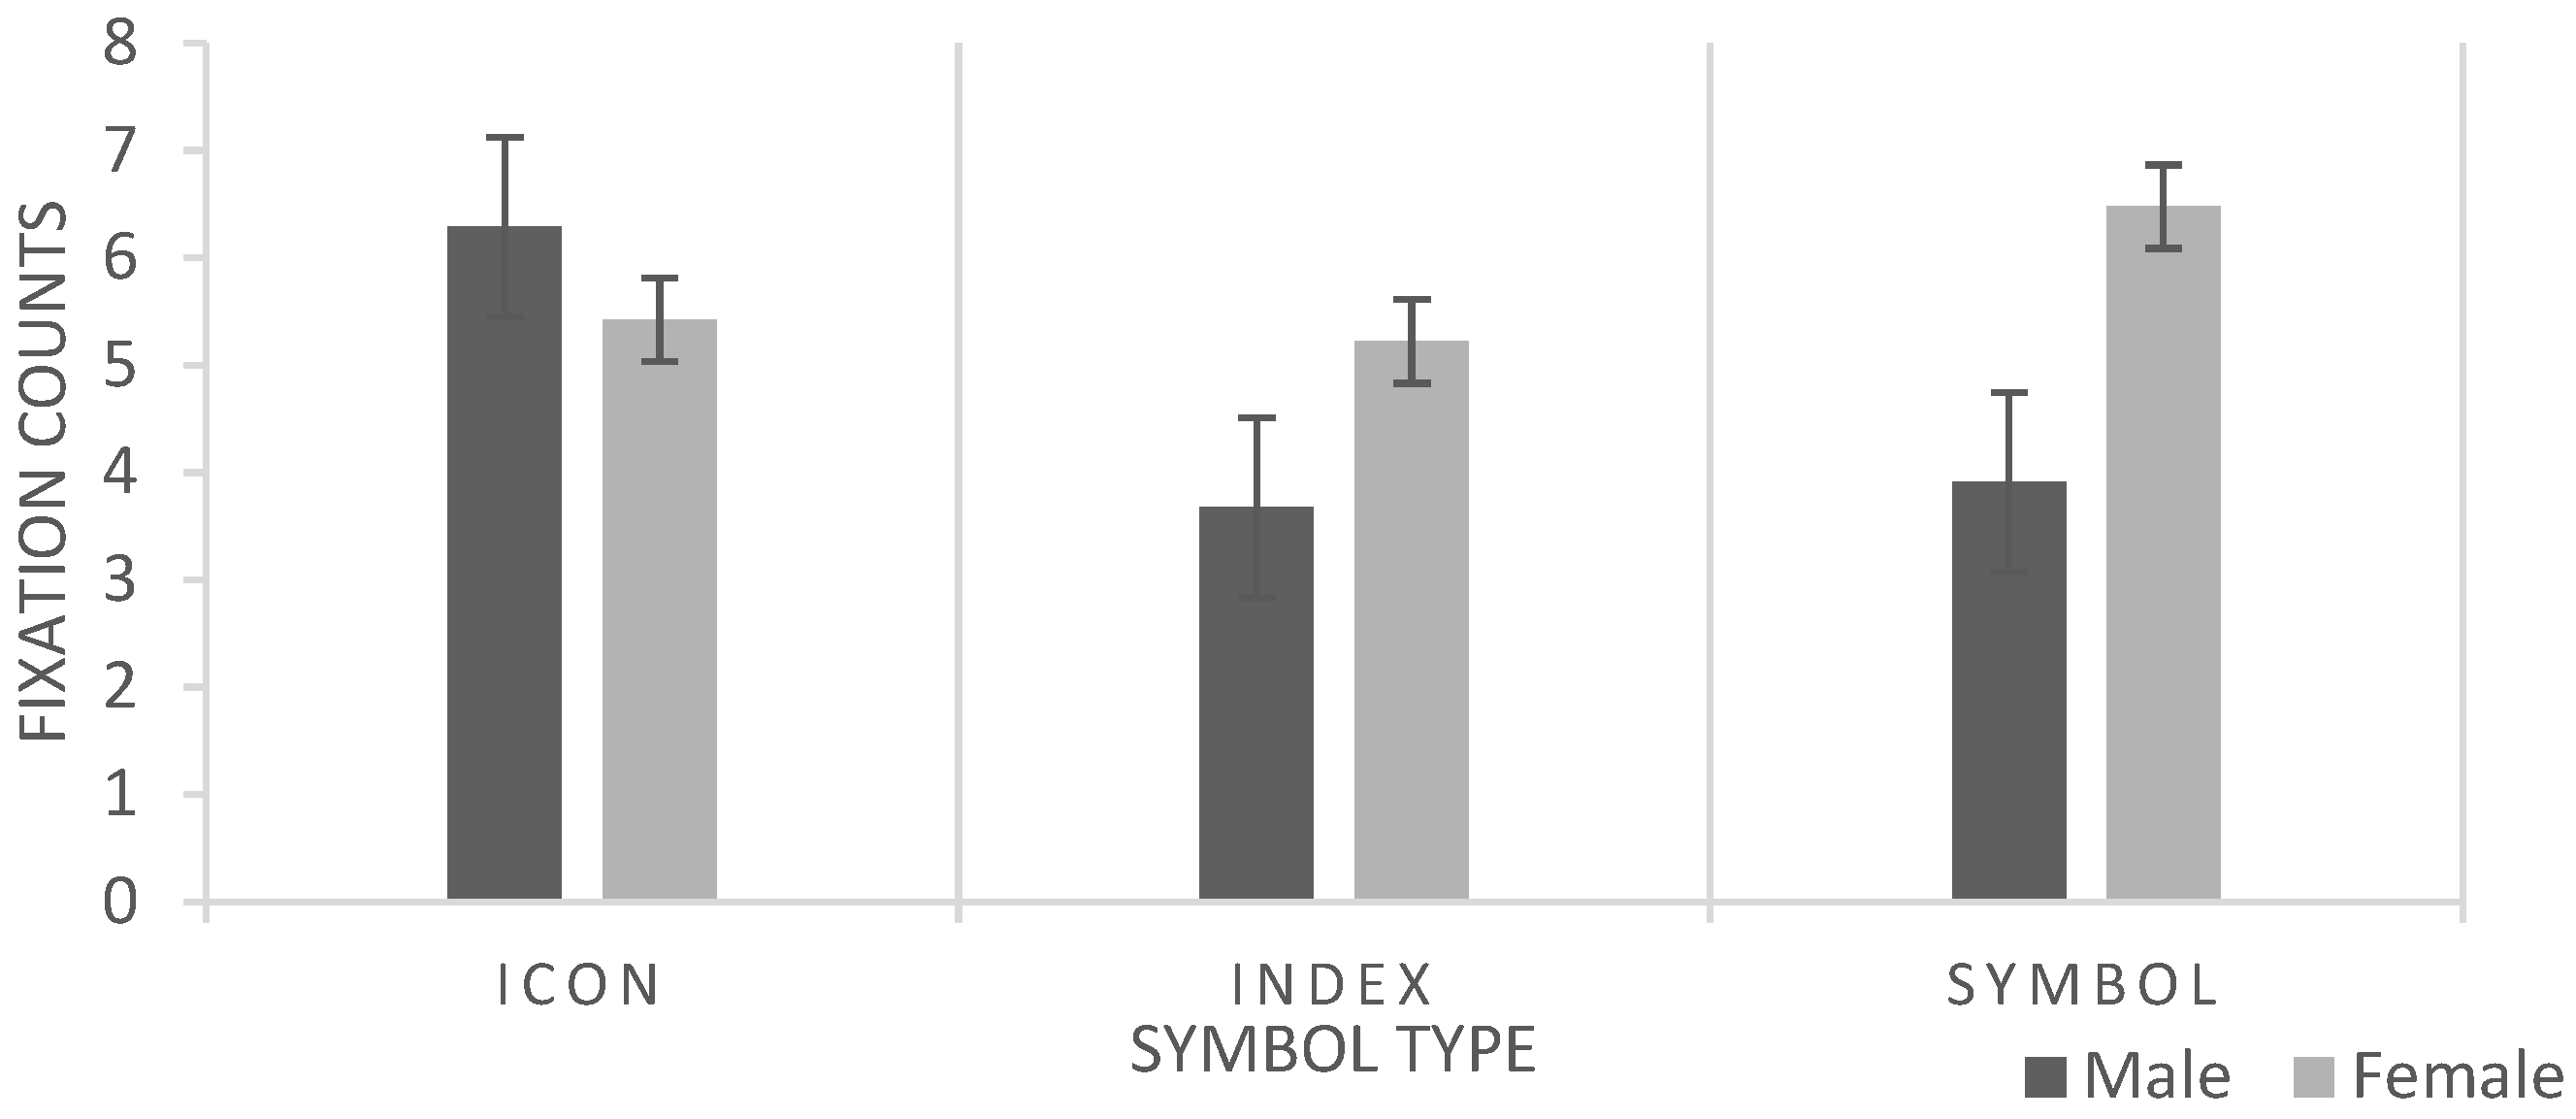
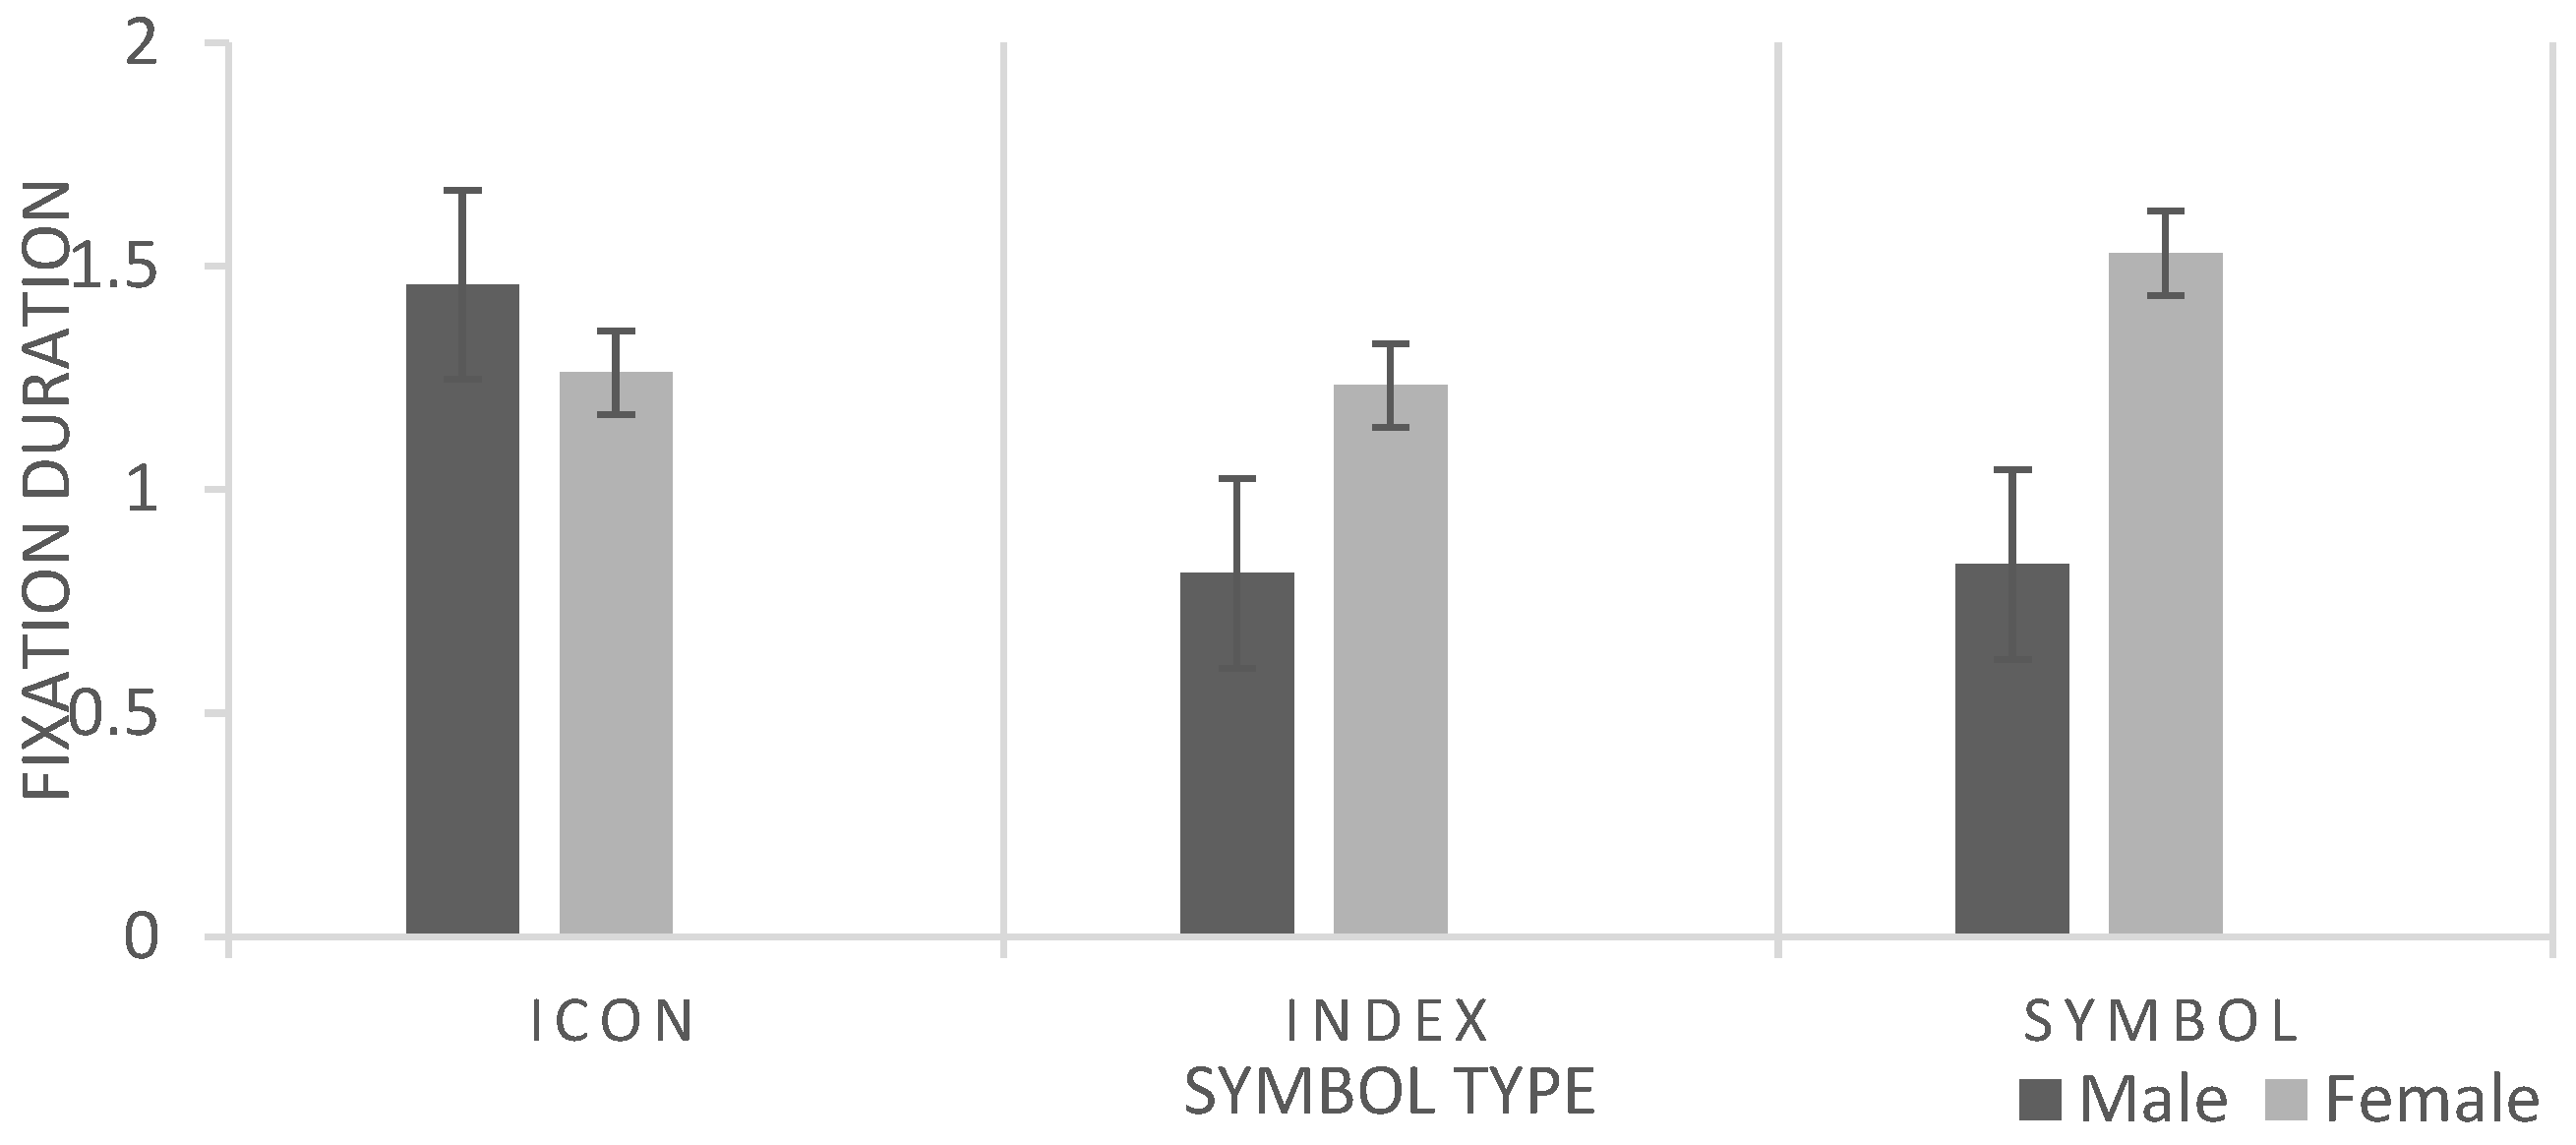
3.3. Interaction Effect Between Landmark Types and Gender
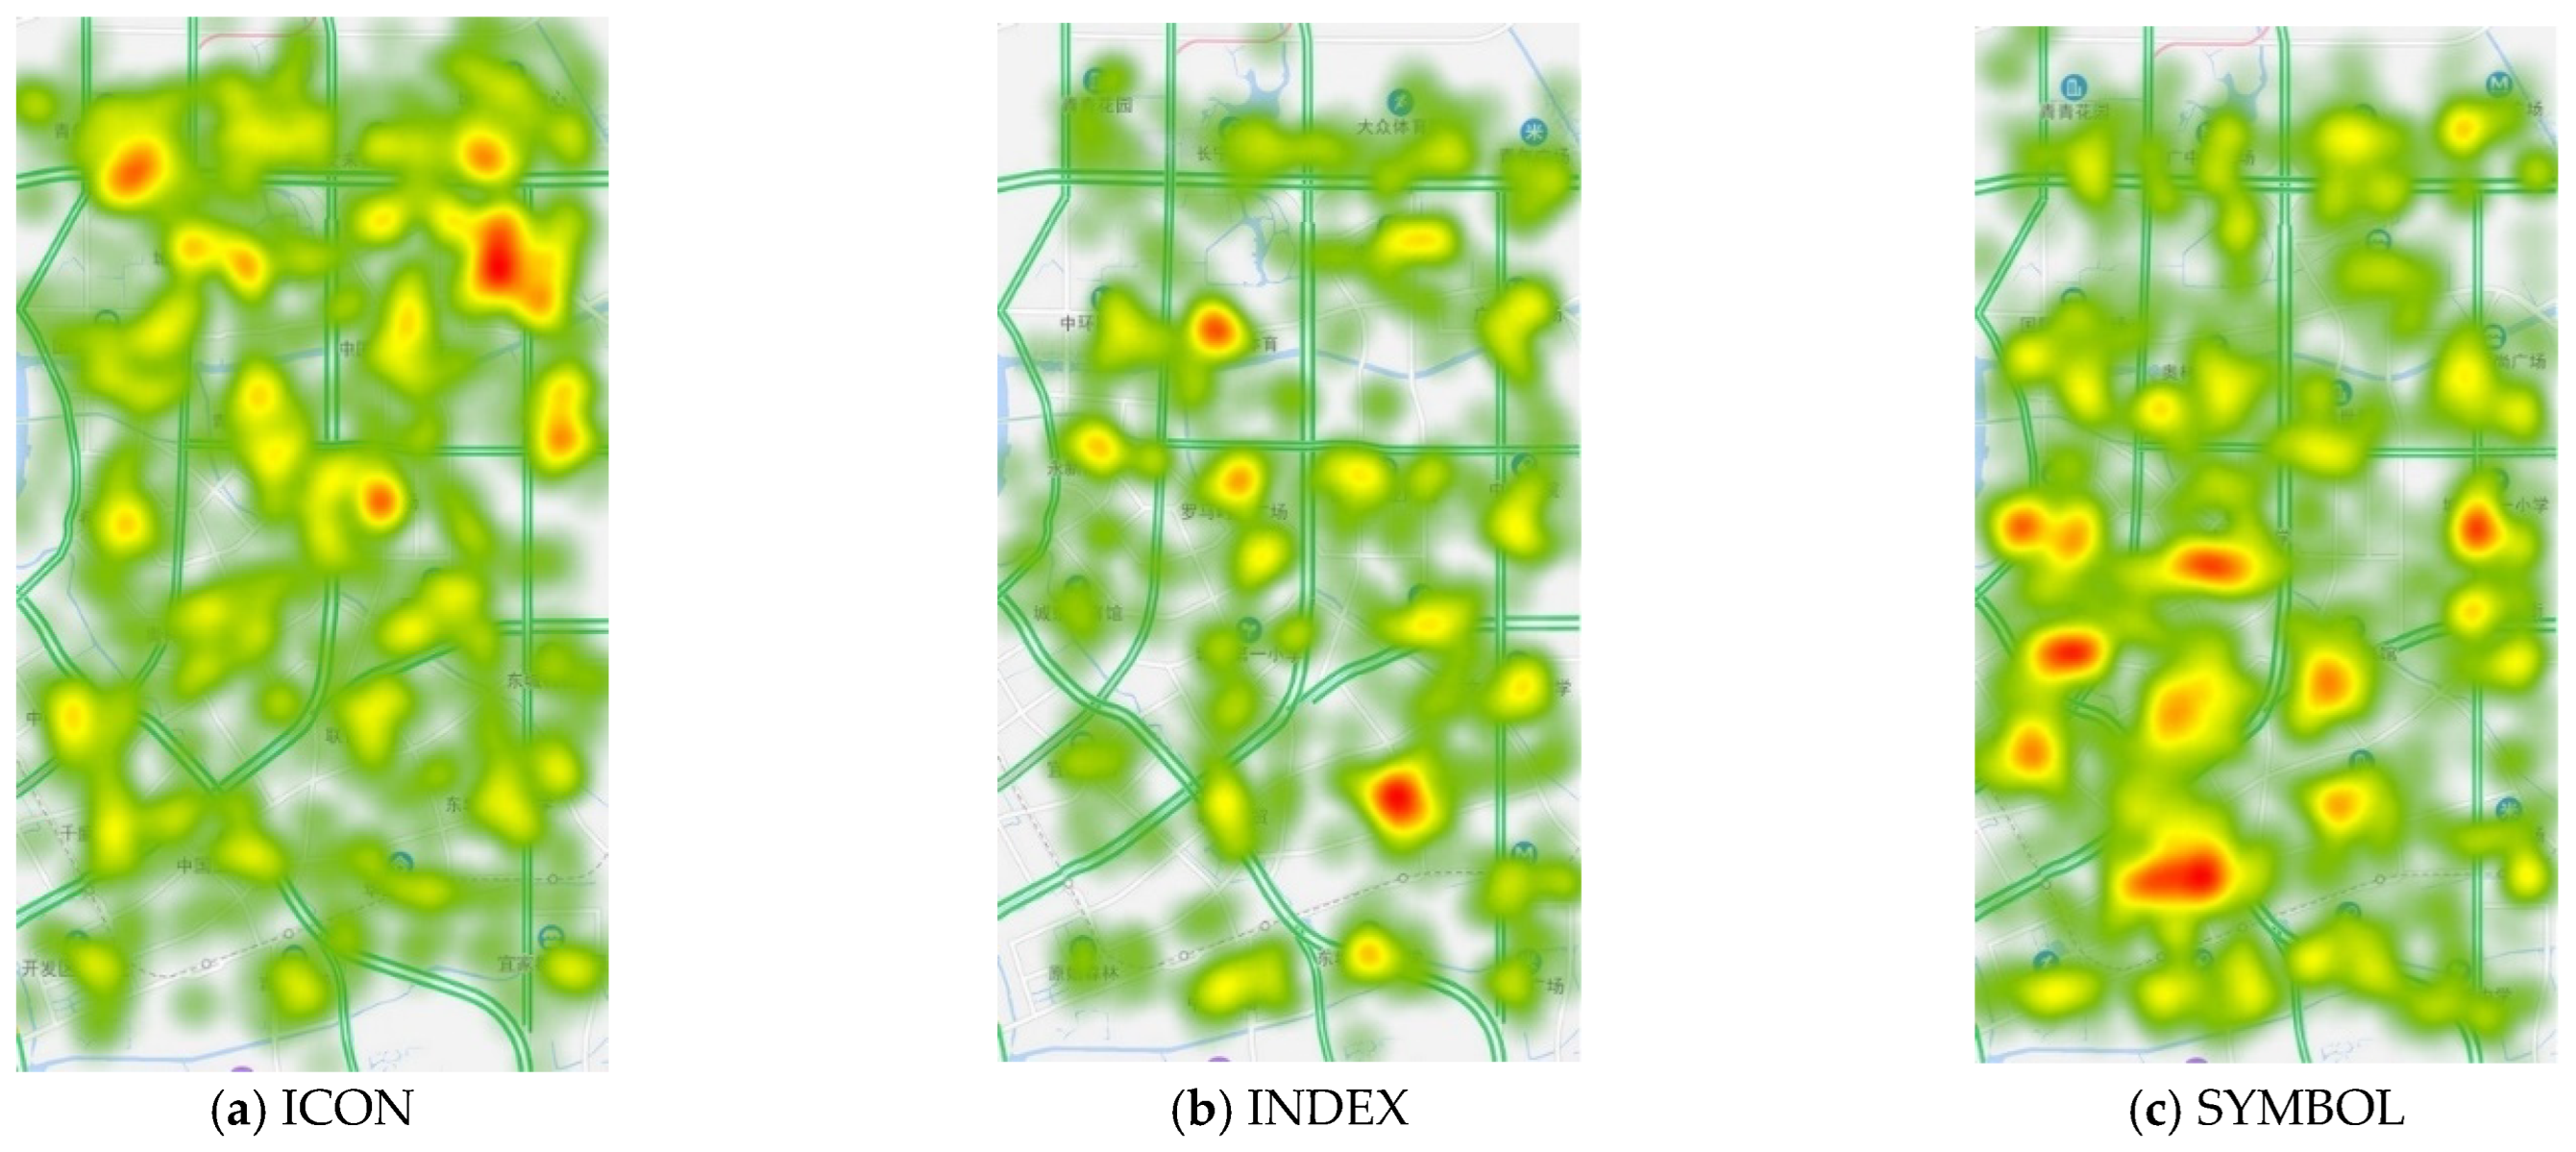
3.4. Eye Movement Heat Map
4. Discussion
4.1. Landmark Symbol Type Effect on Searching Performance
4.2. Color Consistency of Symbol and Notation
4.3. Interaction Effect Between Landmark Symbol Type and Gender
4.4. Future Work
5. Conclusions
- Among the three kinds of symbols, INDEX has the highest search accuracy and efficiency. This symbol emphasizes the function and important features of the target and consumes the least cognitive resources in the search, and can be used for target recognition without deep information processing.
- Eye movement indicators show that the reading of SYMBOL requires less visual attention. This kind of semantically agreed characters and letter symbols have small information capacity and low identification load, which can effectively reduce the attention resources in the early stage of processing. The above differences in symbol searching performance were only shown at a relatively late stage of processing, i.e., at the stage of decision-making about the symbols. The INDEX took less attentional resource allocation both in breadth and depth than the other two symbol types.
- The experimental results of search efficiency show that the difference in cognitive styles between men and women leads to the difference in the search results of the three symbols. The searching performance of male subjects for SYMBOL were significantly better than that of female subjects; the searching performance of male subjects for INDEX were significantly better than that of ICON. The searching performance of female subjects for INDEX was significantly higher than that of SYMBOL.
Author Contributions
Funding
Data Availability Statement
Conflicts of Interest
References
- Nelson, E.S. How Maps Work: Representation, Visualization, and Design. Cartogr. Perspect. 1996, 24, 27–30. [Google Scholar] [CrossRef]
- Kray, C.; Elting, C.; Laakso, K.; Coors, V. Presenting route instructions on mobile devices. In Proceedings of the 8th International Conference on Intelligent User Interfaces, Miami, FL, USA, 12–15 January 2003; pp. 117–124. [Google Scholar]
- Li, X.; Wu, X.; Yin, Z.; Shen, J. The Influence of Spatial Familiarity on the Landmark Salience Sensibility in Pedestrian Navigation Environment. Int. Arch. Photogramm. Remote. Sens. Spat. Inf. Sci. 2017, 42, 83–89. [Google Scholar] [CrossRef]
- Vaez, S.; Burke, M.; Yu, R. Visitors’ wayfinding strategies and navigational aids in unfamiliar urban environment. Tour. Geogr. 2020, 22, 832–847. [Google Scholar] [CrossRef]
- Hilton, C.; Johnson, A.; Slattery, T.J.; Miellet, S.; Wiener, J.M. The impact of cognitive aging on route learning rate and the acquisition of landmark knowledge. Cognition 2021, 207, 104524. [Google Scholar] [CrossRef] [PubMed]
- Nurmi, P.; Salovaara, A.; Bhattacharya, S.; Pulkkinen, T.; Kahl, G. Influence of landmark-based navigation instructions on user attention in indoor smart spaces. In Proceedings of the 16th International Conference on Intelligent User Interfaces, Palo Alto, CA, USA, 13–16 February 2011; pp. 33–42. [Google Scholar]
- Hampe, M.; Elias, B. Integrating Topographic Information and Landmarks for Mobile Navigation. na; Leibniz University Hannover: Hanover, Germany, 2004. [Google Scholar]
- Lynch, K. The City Image and its Elements; Routledge: Oxfordshire, UK, 2015; pp. 620–630. [Google Scholar]
- Uttl, B.; Graf, P. Object orientation information in semantic and episodic memory. Can. J. Exp. Psychol. Rev. Can. De. Psychol. Expérimentale 1996, 50, 87. [Google Scholar] [CrossRef]
- Sorrows, M.E.; Hirtle, S.C. The nature of landmarks for real and electronic spaces. In Proceedings of the Spatial Information Theory. Cognitive and Computational Foundations of Geographic Information Science: International Conference COSIT’99, Stade, Germany, 25–29 August 1999; Springer: Berlin/Heidelberg, Germany; pp. 37–50. [Google Scholar]
- Presson, C.C.; Montello, D.R. Points of reference in spatial cognition: Stalking the elusive landmark. Brit. J. Dev. Psychol. 1988, 6, 378–381. [Google Scholar] [CrossRef]
- Elias, B.; Paelke, V. User-centered design of landmark visualizations. In Map-Based Mobile Services: Design, Interaction and Usability; Springer: Berlin/Heidelberg, Germany, 2008; pp. 33–56. [Google Scholar]
- Konstantinou, E.N.; Skopeliti, A.; Nakos, B. Poi symbol design in web cartography—A comparative study. ISPRS Int. J. Geo-Inf. 2023, 12, 254. [Google Scholar] [CrossRef]
- Gong, X.; Lan, T.; Ti, P. Metric and color modifications for the automated construction of map symbols. ISPRS Int. J. Geo-Inf. 2023, 12, 331. [Google Scholar] [CrossRef]
- Chen, C.H.; Li, X. Spatial Knowledge Acquisition with Mobile Maps: Effects of Map Size on Users’ Wayfinding Performance with Interactive Interfaces. Int. J. Geo-Inf. 2020, 9, 614. [Google Scholar] [CrossRef]
- Askarizad, R.; He, J.; Khotbehsara, E.M. The Legibility Efficacy of Historical Neighborhoods in Creating a Cognitive Map for Citizens. Sustainability 2022, 14, 9010. [Google Scholar] [CrossRef]
- Caduff, D.; Timpf, S. A framework for assessing the salience of landmarks for wayfinding tasks. Cogn. Process 2006, 7, 23. [Google Scholar] [CrossRef]
- O’Neill, M.J. Effects of signage and floor plan configuration on wayfinding accuracy. Env. Behav. 1991, 23, 553–574. [Google Scholar] [CrossRef]
- Sholts, S.B.; Flores, L.; Walker, P.L.; Wärmländer, S.K. Comparison of coordinate measurement precision of different landmark types on human crania using a 3D laser scanner and a 3D digitiser: Implications for applications of digital morphometrics. Int. J. Osteoarchaeol. 2011, 21, 535–543. [Google Scholar] [CrossRef]
- Michon, P.; Denis, M. In When and why are visual landmarks used in giving directions? In Proceedings of the Spatial Information Theory: Foundations of Geographic Information Science International Conference, COSIT 2001, Morro Bay, CA, USA, 19–23 September 2001; Springer: Berlin/Heidelberg, Germany; pp. 292–305. [Google Scholar]
- Golledge, R.G. Place recognition and wayfinding: Making sense of space. Geoforum 1992, 23, 199–214. [Google Scholar] [CrossRef]
- Ross, T.; May, A.; Thompson, S. In The use of landmarks in pedestrian navigation instructions and the effects of context. In Proceedings of the Mobile Human-Computer Interaction-MobileHCI 2004: 6th International Symposium, MobileHCI, Glasgow, UK, 13–16 September 2004; Springer: Berlin/Heidelberg, Germany; pp. 300–304. [Google Scholar]
- Krukar, J.; Anacta, V.J.; Schwering, A. The effect of orientation instructions on the recall and reuse of route and survey elements in wayfinding descriptions. J. Environ. Psychol. 2020, 68, 101407. [Google Scholar] [CrossRef]
- Klettner, S. Affective communication of map symbols: A semantic differential analysis. ISPRS Int. J. Geo-Inf. 2020, 9, 289. [Google Scholar] [CrossRef]
- Keates, J.S. Understanding Maps; Routledge: Oxfordshire, UK, 2014. [Google Scholar]
- MacEachren, A.M.; Roth, R.E.; O’Brien, J.; Li, B.; Swingley, D.; Gahegan, M. Visual semiotics & uncertainty visualization: An empirical study. IEEE Trans. Vis. Comput. Graph. 2012, 18, 2496–2505. [Google Scholar]
- Noth, W. Handbook of Semiotics; Indiana University Press: Bloomington, IN, USA, 1990. [Google Scholar]
- Peirce, C.S. Peirce on Signs: Writings on Semiotic; UNC Press Books: Chapel Hill, NC, USA, 1991. [Google Scholar]
- Meng, L. Some theoretical concerns along with the development of cartographic technologies. J. Zhengzhou Inst. Surv. Mapp. 2006, 23, 89–96. [Google Scholar]
- Lakoff, G.; Johnson, M. Metaphors We Live By; University of Chicago press: Chicago, IL, USA, 2008. [Google Scholar]
- Haitao, W.; Chong, Z.; Jinchun, Q. Design and implementation of map annotation automatic configuration module based on arcengine. J. Geospat. Inf. 2019, 17, 56–59. [Google Scholar]
- Qiao, Z.; Yan, H. Discussion on Map Labeling and Map Annotation. Geomat. Spat. Inf. Technol. 2011, 1, 205–207. [Google Scholar]
- Ren, Z.-B.; Chen, Y.-F.; Sun, Q.-Z. The Contents and Methods for Usability Evaluation of Electronic Map. J. Hydrogr. Surv. Charting 2007, 27, 44–47+51. [Google Scholar]
- Bertin, J. Semiology of Graphics: Diagrams, Networks, Maps; Esri Press: Redlands, CA, USA, 2010. [Google Scholar]
- Williams, L.G. The effects of target specification on objects fixated during visual search. Acta Psychol. 1967, 27, 355–360. [Google Scholar] [CrossRef] [PubMed]
- Von Wright, J.M. Selection in visual immediate memory. Q. J. Exp. Psychol. 1968, 20, 62–68. [Google Scholar] [CrossRef] [PubMed]
- Treisman, A.M.; Gelade, G. A feature-integration theory of attention. Cogn. Psychol. 1980, 12, 97–136. [Google Scholar] [CrossRef]
- Garlandini, S.; Fabrikant, S.I. Evaluating the effectiveness and efficiency of visual variables for geographic information visualization. In Proceedings of the 9th International Conference, COSIT 2009, Aber Wrach, France, 21–25 September 2009. [Google Scholar]
- Phillips, R.J.; Noyes, L. A comparison of colour and visual texture as codes for use as area symbols on thematic maps. Ergonomics 1980, 23, 1117–1128. [Google Scholar] [CrossRef]
- Wilson, D.L.; Kuperman, G.G.; Perez, W.A. Color symbol discrimination. In Proceedings of the 1988 Engineering Management Conference, ‘Engineering Leadership in the 90’s’, Dayton, OH, USA, 24–26 October 1988; IEEE: New York, NY, USA; pp. 217–218. [Google Scholar]
- Wang, J.; Lin, L.; Gao, H.; Zhang, L. Differences in college students’ spatial symbol cognition of tourism map: Based on experimental data from an eye-movement tracking system. Tour. Trib. 2016, 31, 97–105. [Google Scholar]
- Halpern, D.F. Sex Differences in Cognitive Abilities; Psychology Press: Hove, UK, 2013. [Google Scholar]
- Eals, M.; Silverman, I. The hunter-gatherer theory of spatial sex differences: Proximate factors mediating the female advantage in recall of object arrays. Ethol. Sociobiol. 1994, 15, 95–105. [Google Scholar] [CrossRef]
- Williams, C.L.; Barnett, A.M.; Meck, W.H. Organizational effects of early gonadal secretions on sexual differentiation in spatial memory. Behav. Neurosci. 1990, 104, 84. [Google Scholar] [CrossRef]
- Lawton, C.A. Gender differences in way-finding strategies: Relationship to spatial ability and spatial anxiety. Sex Roles 1994, 30, 765–779. [Google Scholar] [CrossRef]
- Fang, H.; Zhou, L. The effect of gender, wayfinding strategy and navigational support on wayfinding behaviour. Acta Psychol. Sin. 2012, 44, 1058–1065. [Google Scholar] [CrossRef]
- Yan, Y.; Long, Y.; Shen, Q.; Wang, J. Spatial Cognition Analysis of Electronic Map Concerns with Sex Difference. Geogr. Geo-Inf. Sci. 2011, 4, 48–51. [Google Scholar]
- Galotti, K.M. Cognitive Psychology in and Out of the Laboratory; Sage Publications: Thousand Oaks, CA, USA, 2017. [Google Scholar]
- Hwang, Y. The moderating effects of gender on e-commerce systems adoption factors: An empirical investigation. Comput. Hum. Behav. 2010, 26, 1753–1760. [Google Scholar] [CrossRef]
- Peng, X.; Ma, S.H.; Li, X.M. A study on the cognitive styles and gender difference of normal university students in China. J. Health Psychol. 2006, 14, 299–301. [Google Scholar]
- Kimura, D. Sex and Cognition; MIT Press: Cambridge, MA, USA, 2000. [Google Scholar]
- Hyde, J.S. Sex and cognition: Gender and cognitive functions. Curr. Opin. Neurobiol. 2016, 38, 53–56. [Google Scholar] [CrossRef] [PubMed]
- Nicholson, K.G.; Kimura, D. Sex differences for speech and manual skill. Percept. Mot. Ski. 1996, 82, 3–13. [Google Scholar] [CrossRef] [PubMed]
- Kiefer, P.; Giannopoulos, I.; Raubal, M.; Duchowski, A. Eye tracking for spatial research: Cognition, computation, challenges. Spat. Cogn. Comput. 2017, 17, 1–19. [Google Scholar] [CrossRef]
- Dong, W.; Liao, H.; Zhan, Z.; Liu, B.; Wang, S.; Yang, T. New research progress of eye tracking-based map cognition in cartography since 2008. Acta Geogr. Sin 2019, 74, 599–614. [Google Scholar]
- Andrienko, N.; Andrienko, G.; Voss, H.; Bernardo, F.; Hipolito, J.; Kretchmer, U. Testing the usability of interactive maps in CommonGIS. Cart. Geogr. Inf. Sci. 2002, 29, 325–342. [Google Scholar] [CrossRef]
- Ooms, K.; Maeyer, P.D.; Fack, V.; Assche, E.V.; Witlox, F. Investigating the effectiveness of an efficient label placement method using eye movement data. Cartogr. J. 2012, 49, 234–246. [Google Scholar] [CrossRef]
- Popelka, S.; Brychtova, A. Eye-tracking study on different perception of 2D and 3D terrain visualisation. Cartogr. J. 2013, 50, 240–246. [Google Scholar] [CrossRef]
- Lin, Y.; Deng, Y.; Lai, X.; Zhou, G. Research on the Effectiveness of Point Symbols in Different Tourist Web-Map Style. Geomat. Spat. Inf. Technol. 2015, 2, 58–62. [Google Scholar]
- Brychtova, A.; Coltekin, A. An empirical user study for measuring the influence of colour distance and font size in map reading using eye tracking. Cartogr. J. 2016, 53, 202–212. [Google Scholar] [CrossRef]
- Tian, C.; Song, M.; Wang, W.; Tian, J.; Guo, D. Review of Research on Evaluating the Human—Computer Interaction Efficiency of Digital Interfaces Based on Eye—Tracking Technology. J. Electron. Opt. Control. 2024, 3, 31. [Google Scholar]
- Peng, N.; Xue, C. Experimental study on characteristics of icon searching based on feature inference. J. Southeast Univ. 2017, 04, 703–709. [Google Scholar]
- Clarke, A.D.; Tatler, B.W. Deriving an appropriate baseline for describing fixation behaviour. Vis. Res. 2014, 102, 41–51. [Google Scholar] [CrossRef]
- AL-Ayash, A.; Kane, R.T.; Smith, D.; Green-Armytage, P. The influence of color on student emotion, heart rate, and performance in learning environments. Color Res. Appl. 2016, 41, 196–205. [Google Scholar] [CrossRef]
- Xia, T.; Song, L.; Wang, T.T.; Tan, L.; Mo, L. Exploring the effect of red and blue on cognitive task performances. Front. Psychol. 2016, 7, 784. [Google Scholar] [CrossRef] [PubMed]
- Urdan, T.C. Statistics in Plain English; Taylor & Francis: Oxfordshire, UK, 2022. [Google Scholar]
- Guattari, C.; De Blasiis, M.R.; Calvi, A. The effectiveness of variable message signs information: A driving simulation study. Procedia Soc. Behav. Sci. 2012, 53, 692–702. [Google Scholar] [CrossRef]
- Ferrand, L. Why naming takes longer than reading? The special case of Arabic numbers. Acta Psychol. 1999, 100, 253–266. [Google Scholar] [CrossRef]
- Paivio, A. Imagery and Verbal Processes; Psychology Press: Hove, UK, 2013. [Google Scholar]
- Anderson, J.R.; Bower, G.H. A propositional theory of recognition memory. Mem. Cogn. 1974, 2, 406–412. [Google Scholar] [CrossRef]
- Nelson, D.L.; Reed, V.S.; McEvoy, C.L. Learning to order pictures and words: A model of sensory and semantic encoding. J. Exp. Psychol. Hum. Learn. Mem. 1977, 3, 485. [Google Scholar] [CrossRef]
- Potter, M.C.; Faulconer, B.A. Time to understand pictures and words. Nature 1975, 253, 437–438. [Google Scholar] [CrossRef]
- Proffitt, D.R.; Wade, M.M. Creating effective variable message signs: Human factors issues. In Virginia Transportation Research Council; University of Virginia: Charlottesville, VA, USA, 1998. [Google Scholar]
- Roca, J.; Insa, B.; Tejero, P. Legibility of text and pictograms in variable message signs: Can single-word messages outperform pictograms? Hum. Factors 2018, 60, 384–396. [Google Scholar] [CrossRef]
- Ware, C. Information Visualization: Perception for Design, 3rd ed.; Morgan Kaufmann: Burlington, MA, USA, 2013. [Google Scholar]
- Healey, C.G.; Enns, J.T. Attention and visual memory in visualization and computer graphics. IEEE Trans. Vis. Comput. Graph. 2012, 18, 1170–1188. [Google Scholar] [CrossRef]
- Montello, D.R. Landmarks are exaggerated. Spat. Cogn. Comput. 2017, 17, 227–235. [Google Scholar] [CrossRef]
- Norman Donald, A. The Design of Everyday Things; Basic Books: New York, NY, USA, 2013. [Google Scholar]
- Ward, M.O.; Grinstein, G.; Keim, D. Interactive Data Visualization: Foundations, Techniques, and Applications; CRC Press: Boca Raton, FL, USA, 2020. [Google Scholar]
- Meilinger, T.; Knauff, M. Ask for directions or use a map: A field experiment on spatial orientation and wayfinding in an urban environment. J. Spat. Sci. 2008, 53, 13–24. [Google Scholar] [CrossRef]
- Schloss, K.B.; Palmer, S.E. Aesthetic response to color combinations: Preference, harmony, and similarity. Atten. Percept. Psychophys. 2011, 73, 551–571. [Google Scholar] [CrossRef]
- Dübel, S. Effects of display size and resolution on mobile map legibility. Cartogr. Geogr. Inf. Sci. 2017, 44, 263–275. [Google Scholar]
- Fang, H.; Song, Z.; Yang, L.; Ma, Y.; Qin, Q. Spatial cognitive elements of VR mobile city navigation map. Geomat. Inf. Sci. Wuhan Univ. 2019, 44, 1124–1130. [Google Scholar]
- Popovic, D.; Hosek, A.; Boli, E.; Popovic, M.; Savic, V.; Popovic, J. Structural Differences in Some Psychological Characteristics between Young Men and Women. Open Access Libr. J. 2016, 3, 1–9. [Google Scholar] [CrossRef]
- Paswan, A. Gender, Design and Marketing. J. Consum. Mark. 2012, 29, 456–457. [Google Scholar] [CrossRef]
- Fischer, S.; Itoh, M.; Inagaki, T. Prior schemata transfer as an account for assessing the intuitive use of new technology. Appl. Erg. 2015, 46, 8–20. [Google Scholar] [CrossRef] [PubMed]
- Horbiński, T.; Cybulski, P.; Medyńska-Gulij, B. Web map effectiveness in the responsive context of the graphical user interface. ISPRS Int. J. Geo-Inf. 2021, 10, 134. [Google Scholar] [CrossRef]
- Fairbairn, D.; Hepburn, J. Eye-tracking in map use, map user and map usability research: What are we looking for? Int. J. Cartogr. 2023, 9, 231–254. [Google Scholar] [CrossRef]


| Indicators | Definition | Function |
|---|---|---|
| The correctness | The correctness of searching task | Indicate the validity of the symbol. |
| Time to first mouse click | The time from the presentation of the stimulus material to the first mouse click in AOI | Indicate the efficiency of the symbol. |
| The first fixation time | The duration of the first fixation point in AOI | Expressing the subject’s attention. The shorter the duration of the first time, the more focused the attention span. |
| The fixation duration | Total fixation time in AOI | Indicates cognitive difficulty. The longer the total duration, the more difficult it is to recognize. |
| The fixation count | Total number of fixation points in AOI | Represents the subject’s information processing. |
| Landmark Symbol Type | Characteristics | Symbols as Searching Targets in the Experiment | Icon Explanation |
|---|---|---|---|
| ICON | Similar in appearance to the geographic object |  | Catering, Subway, Government, Mansion |
| INDEX | Function related to the geographic object and important component related to it |  | Catering, Subway, Government, Shopping mall |
| SYMBOL | Semantic socially agreed literal and alphabetic symbols representing geographic objects |  | Catering, Subway, Mansion, Bank |
| Level | M | SD | F | p | |
|---|---|---|---|---|---|
| Landmark symbol type | ICON | 0.776 | 0.249 | 7.800 | 0.001 * |
| INDEX | 0.850 | 0.206 | |||
| SYMBOL | 0.690 | 0.253 | |||
| Gender | male | 0.792 | 0.244 | 0.477 | 0.495 |
| female | 0.748 | 0.249 | |||
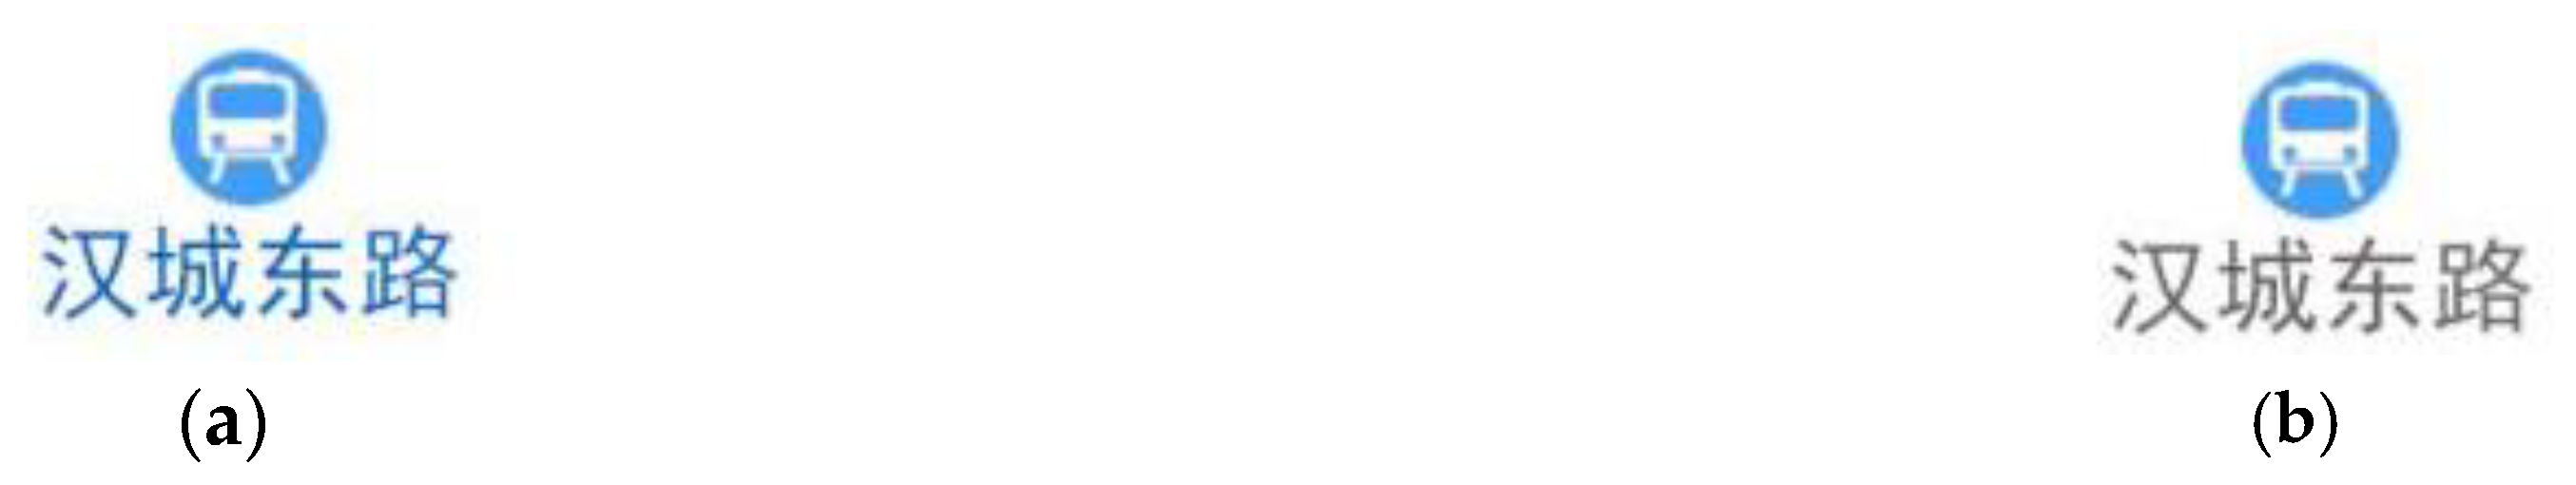
| Consistency of symbol and text notation color | consistent | 0.768 | 0.215 | 0.042 | 0.839 |
| inconsistent | 0.776 | 0.259 | |||
| Type * Gender | 0.894 | 0.414 |
| Level | M (s) | SD | F | p | |
|---|---|---|---|---|---|
| Landmark symbol type | ICON | 16.136 | 7.642 | 9.335 | 0.001 * |
| INDEX | 9.756 | 3.721 | |||
| SYMBOL | 15.088 | 9.754 | |||
| Gender | male | 13.132 | 6.334 | 0.773 | 0.385 |
| female | 14.276 | 7.172 | |||
| Consistency of symbol and text notation color | consistent | 13.292 | 7.235 | 0.500 | 0.484 |
| inconsistent | 14.048 | 6.782 | |||
| Type * Gender | 5.654 | 0.009 * |
| (I) Landmark Symbol Type | (J) Landmark Symbol Type | Mean Difference (I–J) | Standard Error (SE) | p |
|---|---|---|---|---|
| ICON | INDEX | 6.198 | 1.280 | 0.000 * |
| SYMBOL | 0.577 | 1.914 | 0.765 | |
| INDEX | SYMBOL | −5.622 | 1.495 | 0.001 * |
| Landmark Symbol Type | Dependent Variables | |||||
|---|---|---|---|---|---|---|
| First Fixation Time | Fixation Duration | Fixation Counts | ||||
| M (s) | SD | M (s) | SD | M | SD | |
| ICON | 0.212 | 0.131 | 1.365 | 0.717 | 5.879 | 2.157 |
| INDEX | 0.185 | 0.090 | 1.013 | 0.670 | 4.411 | 2.152 |
| SYMBOL | 0.158 | 0.074 | 1.163 | 0.906 | 5.130 | 2.742 |
| Independent Variables | Dependent Variables | |||||
|---|---|---|---|---|---|---|
| First Fixation Time | Fixation Duration | Fixation Counts | ||||
| F | p | F | p | F | p | |
| (I) Landmark symbol type | 4.218 | 0.019* | 5.771 | 0.005 * | 4.390 | 0.016 * |
| (J) Gender | 0.029 | 0.865 | 2.273 | 0.140 | 6.274 | 0.017 * |
| (K) Color consistency | 0.233 | 0.632 | 0.345 | 0.560 | 0.924 | 0.343 |
| (I * J) | 3.098 | 0.052 | 10.778 | 0.000 * | 6.748 | 0.002 * |
| Dependent Variables | (I) Landmark Symbol type | (J) Landmark Symbol Type | Mean Difference (I–J) | Standard Error (SE) | p |
|---|---|---|---|---|---|
| First fixation time | ICON | INDEX | 0.030 | 0.019 | 0.133 |
| SYMBOL | 0.057 * | 0.021 | 0.011 * | ||
| INDEX | SYMBOL | 0.027 | 0.018 | 0.141 | |
| Fixation duration | ICON | INDEX | 0.342 | 0.114 | 0.005 * |
| SYMBOL | 0.178 | 0.111 | 0.116 | ||
| INDEX | SYMBOL | −0.163 | 0.072 | 0.029* | |
| Fixation counts | ICON | INDEX | 1.430 | 0.500 | 0.007 * |
| SYMBOL | 0.657 | 0.557 | 0.245 | ||
| INDEX | SYMBOL | −0.773 | 0.375 | 0.047 * |
| Dependent Variables | Gender | (I) Landmark Symbol Type | (J) Landmark Symbol Type | Mean Difference (I–J) | Standard Error (SE) | p |
|---|---|---|---|---|---|---|
| Fixation duration | Female | ICON | INDEX | 0.025 | 0.155 | 0.998 |
| ICON | SYMBOL | −0.277 | 0.163 | 0.251 | ||
| INDEX | SYMBOL | −0.302 | 0.112 | 0.019 * | ||
| Male | ICON | INDEX | 0.659 | 0.169 | 0.001 * | |
| ICON | SYMBOL | 0.634 | 0.152 | 0.001 * | ||
| INDEX | SYMBOL | −0.025 | 0.093 | 0.992 | ||
| Fixation counts | Female | ICON | INDEX | 0.215 | 0.725 | 0.988 |
| ICON | SYMBOL | −1.071 | 0.807 | 0.474 | ||
| INDEX | SYMBOL | −1.285 | 0.543 | 0.069 | ||
| Male | ICON | INDEX | 2.646 | 0.690 | 0.001 * | |
| ICON | SYMBOL | 2.386 | 0.767 | 0.011 * | ||
| INDEX | SYMBOL | −0.261 | 0.517 | 0.944 |
| Dependent Variables | Landmark Symbol Type | Gender | Mean Difference (I–J) | Standard Error (SE) | p |
|---|---|---|---|---|---|
| Fixation duration | ICON | (I) Male | 0.202 | 0.258 | 0.382 |
| (J) Female | |||||
| INDEX | (I) Male | −0.432 | 0.241 | 0.053 | |
| (J) Female | |||||
| SYMBOL | (I) Male | −0.709 | 0.301 | 0.012 * | |
| (J) Female | |||||
| Fixation counts | ICON | (I) Male | 0.855 | 0.695 | 0.226 |
| (J) Female | |||||
| INDEX | (I) Male | −1.577 | 0.644 | 0.019 * | |
| (J) Female | |||||
| SYMBOL | (I) Male | −2.601 | 0.789 | 0.002 * | |
| (J) Female |
Disclaimer/Publisher’s Note: The statements, opinions and data contained in all publications are solely those of the individual author(s) and contributor(s) and not of MDPI and/or the editor(s). MDPI and/or the editor(s) disclaim responsibility for any injury to people or property resulting from any ideas, methods, instructions or products referred to in the content. |
© 2025 by the authors. Published by MDPI on behalf of the International Society for Photogrammetry and Remote Sensing. Licensee MDPI, Basel, Switzerland. This article is an open access article distributed under the terms and conditions of the Creative Commons Attribution (CC BY) license (https://creativecommons.org/licenses/by/4.0/).
Share and Cite
Fang, H.; Guo, H.; Song, Z.; Yang, N.; Wang, R.; Guo, F. The Influence of the Relationship Between Landmark Symbol Types, Annotations, and Colors on Search Performance in Mobile Maps Based on Eye Tracking. ISPRS Int. J. Geo-Inf. 2025, 14, 129. https://doi.org/10.3390/ijgi14030129
Fang H, Guo H, Song Z, Yang N, Wang R, Guo F. The Influence of the Relationship Between Landmark Symbol Types, Annotations, and Colors on Search Performance in Mobile Maps Based on Eye Tracking. ISPRS International Journal of Geo-Information. 2025; 14(3):129. https://doi.org/10.3390/ijgi14030129
Chicago/Turabian StyleFang, Hao, Hongyun Guo, Zhangtong Song, Nai Yang, Rui Wang, and Fen Guo. 2025. "The Influence of the Relationship Between Landmark Symbol Types, Annotations, and Colors on Search Performance in Mobile Maps Based on Eye Tracking" ISPRS International Journal of Geo-Information 14, no. 3: 129. https://doi.org/10.3390/ijgi14030129
APA StyleFang, H., Guo, H., Song, Z., Yang, N., Wang, R., & Guo, F. (2025). The Influence of the Relationship Between Landmark Symbol Types, Annotations, and Colors on Search Performance in Mobile Maps Based on Eye Tracking. ISPRS International Journal of Geo-Information, 14(3), 129. https://doi.org/10.3390/ijgi14030129