
Spatio-Temporal Analysis of the Redundancies of Construction Land in the Beijing-Tianjin-Hebei Region (2000–2020)

Abstract
1. Introduction
2. Data and Methods
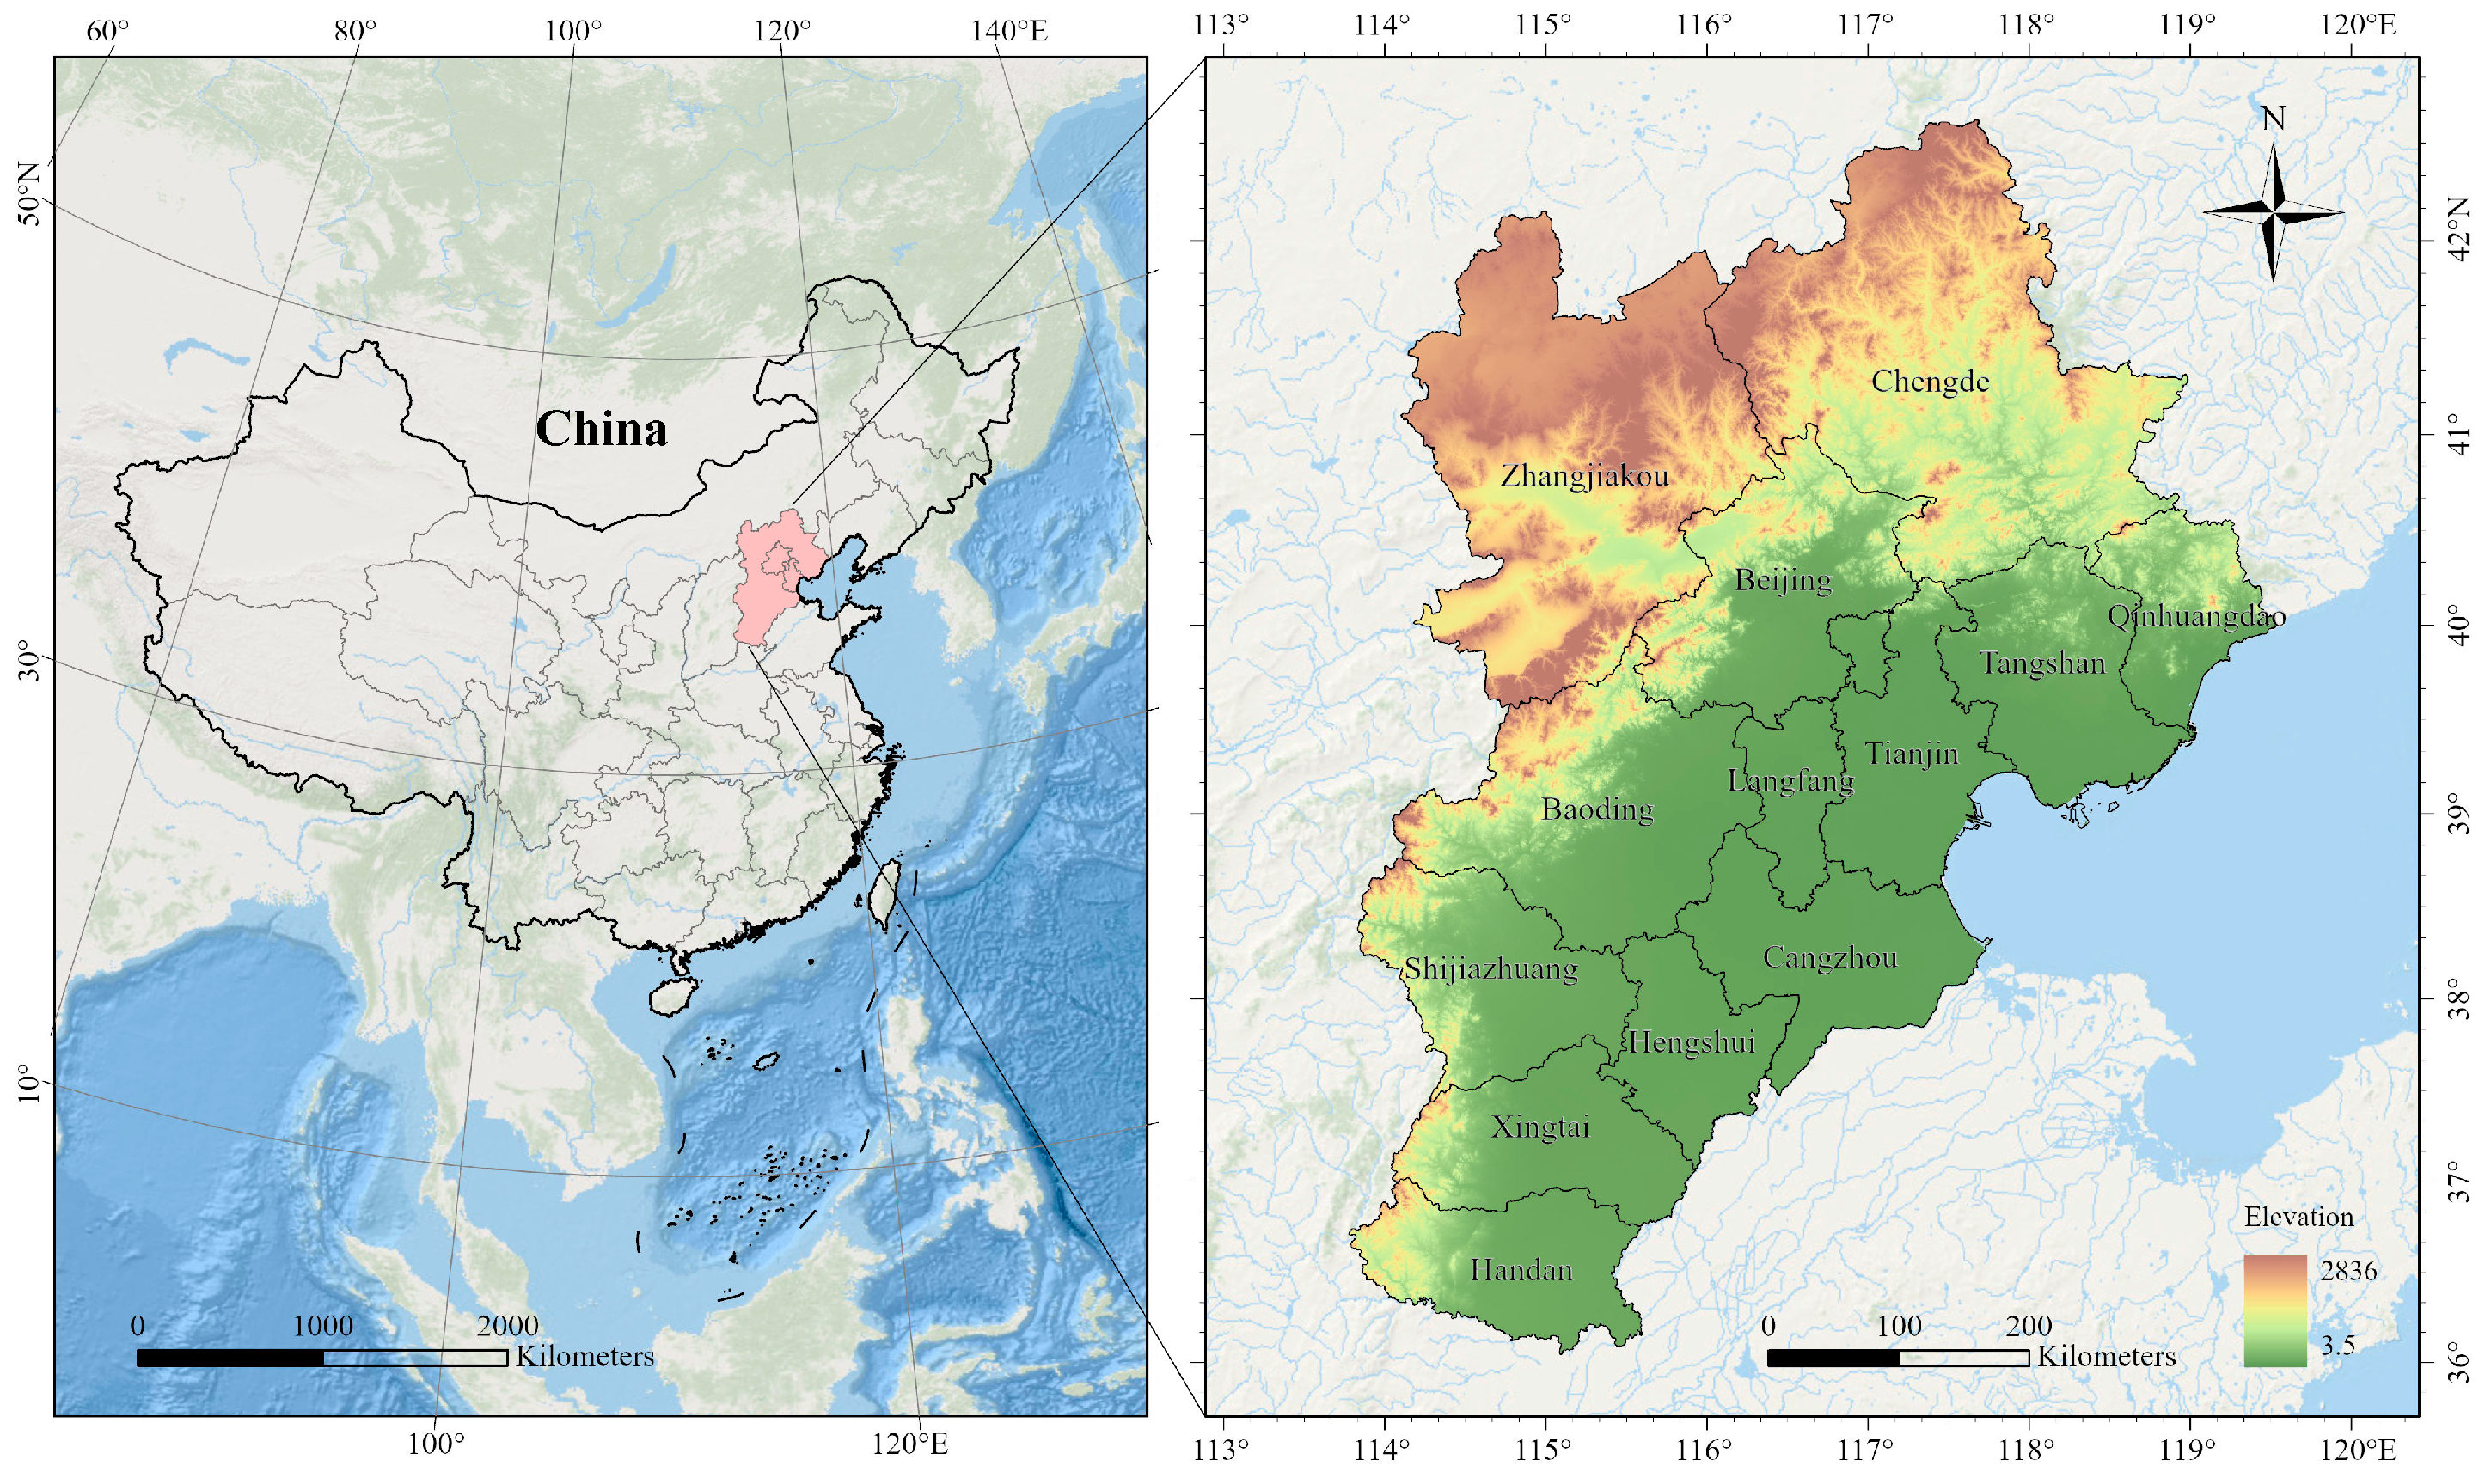
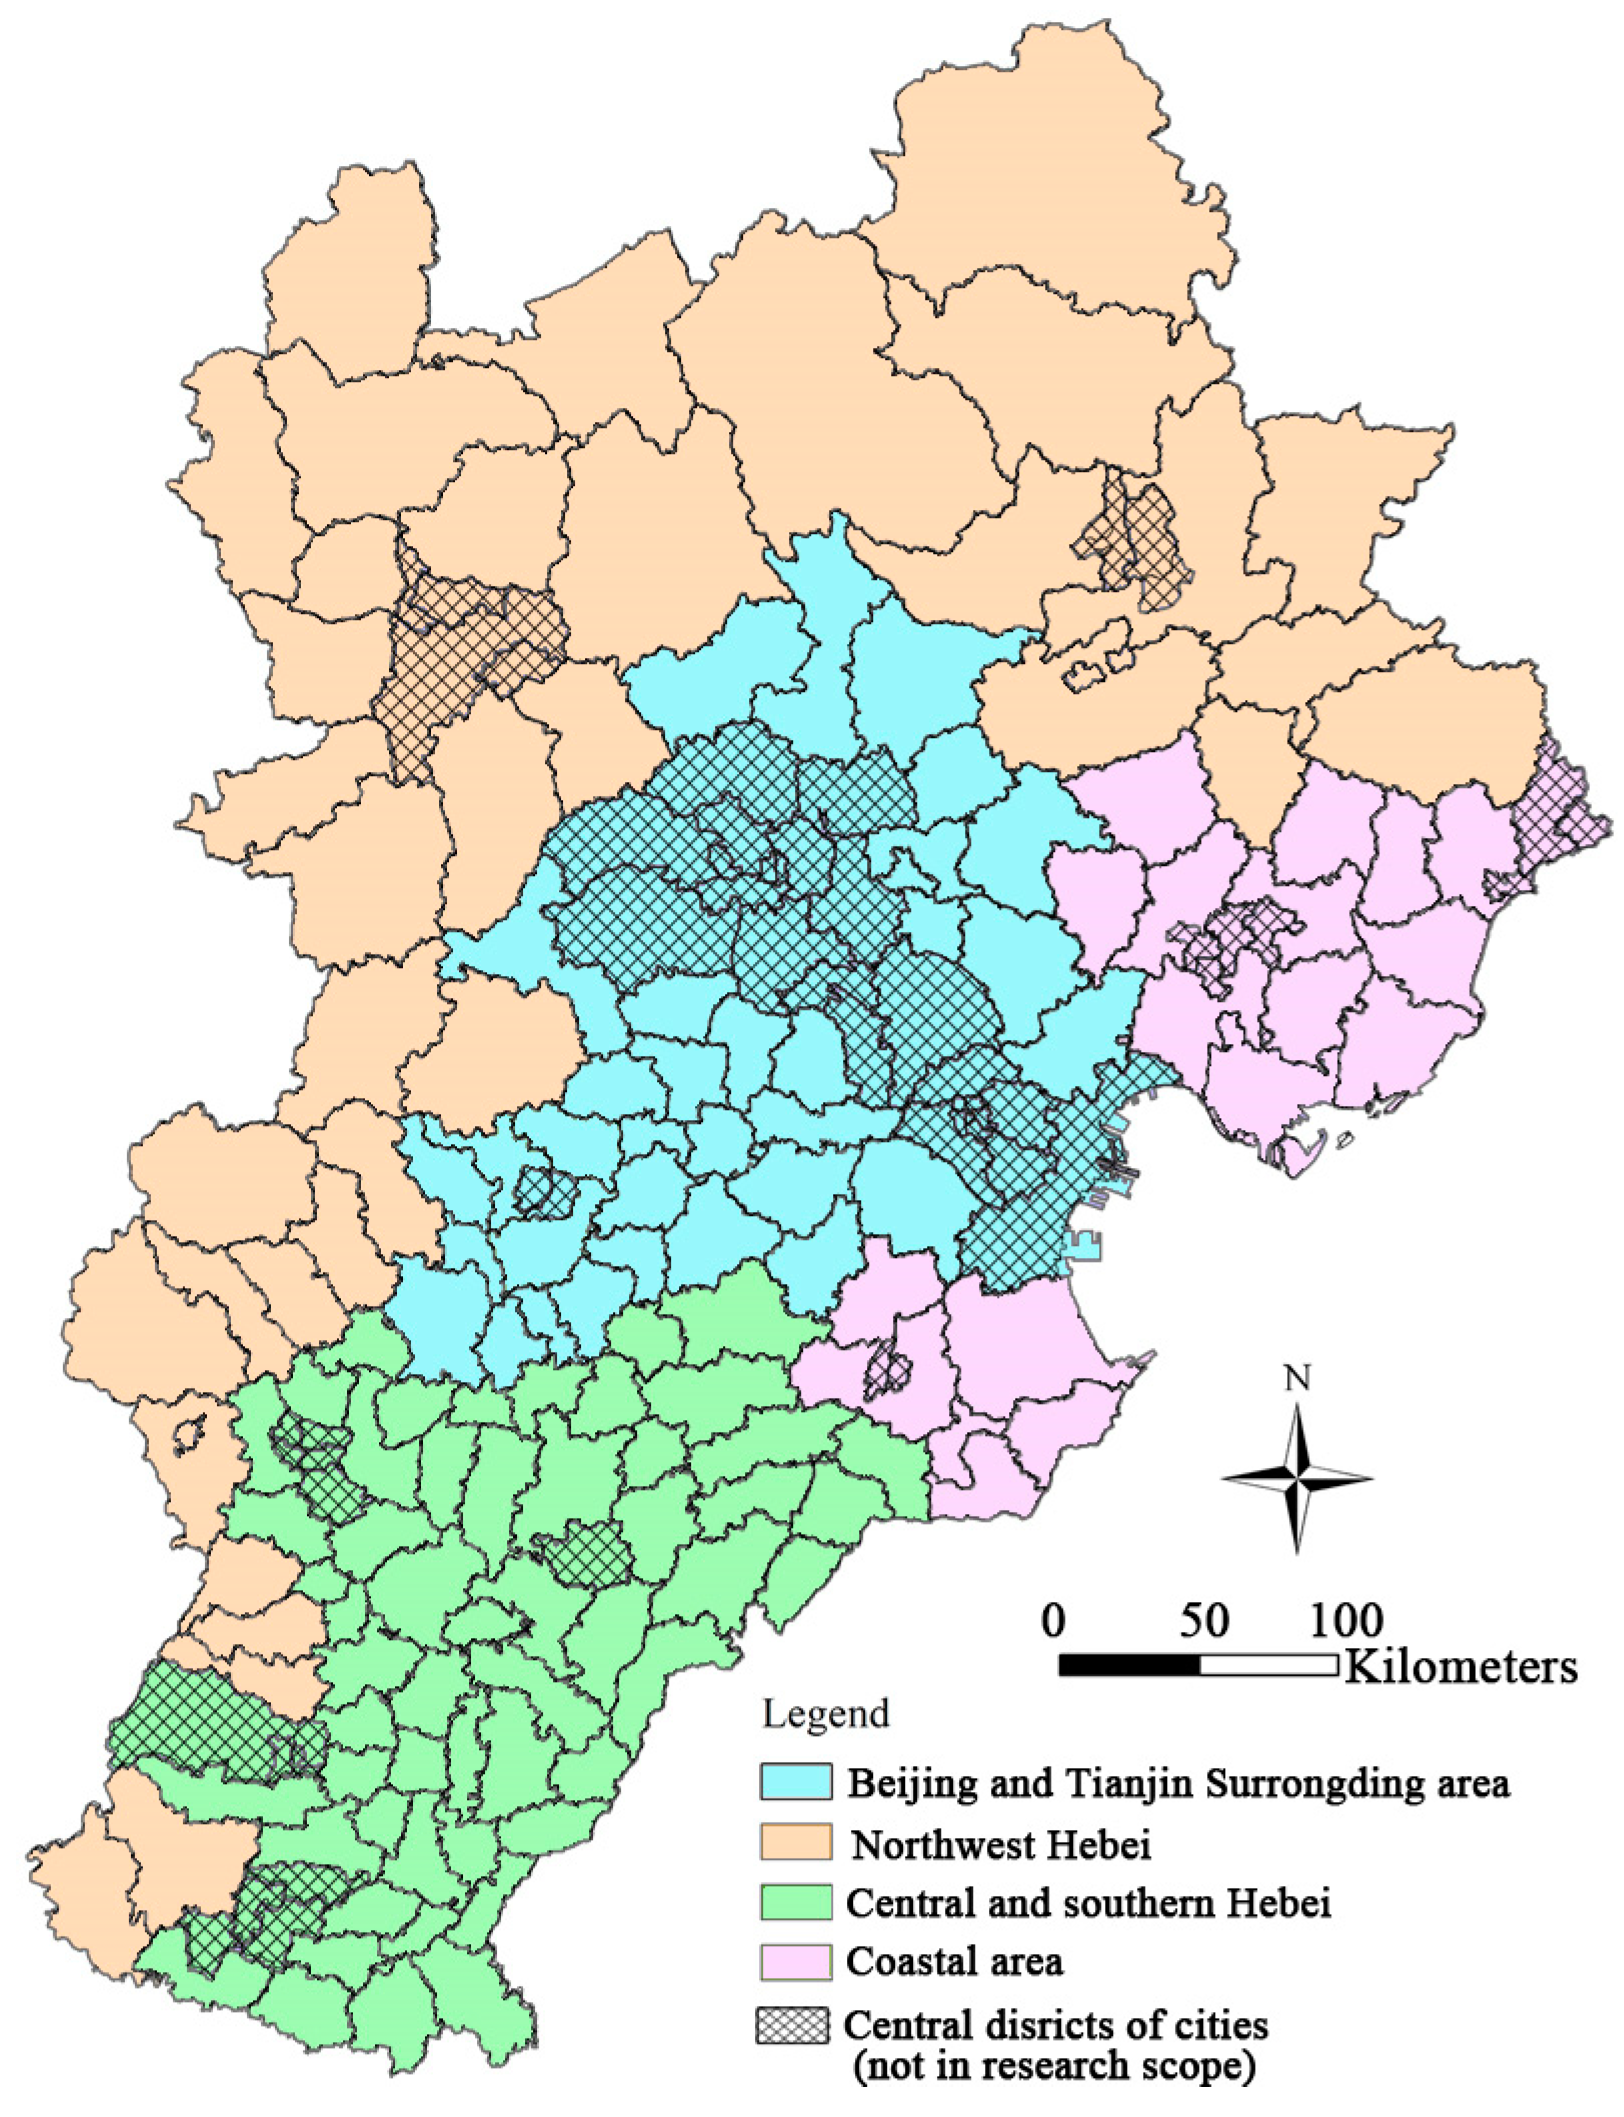
2.1. Study Area
2.2. Research Methods
2.2.1. SBM-DEA Model
2.2.2. Spatial Markov Model
2.2.3. Indicators
2.3. Data Sources
3. Results
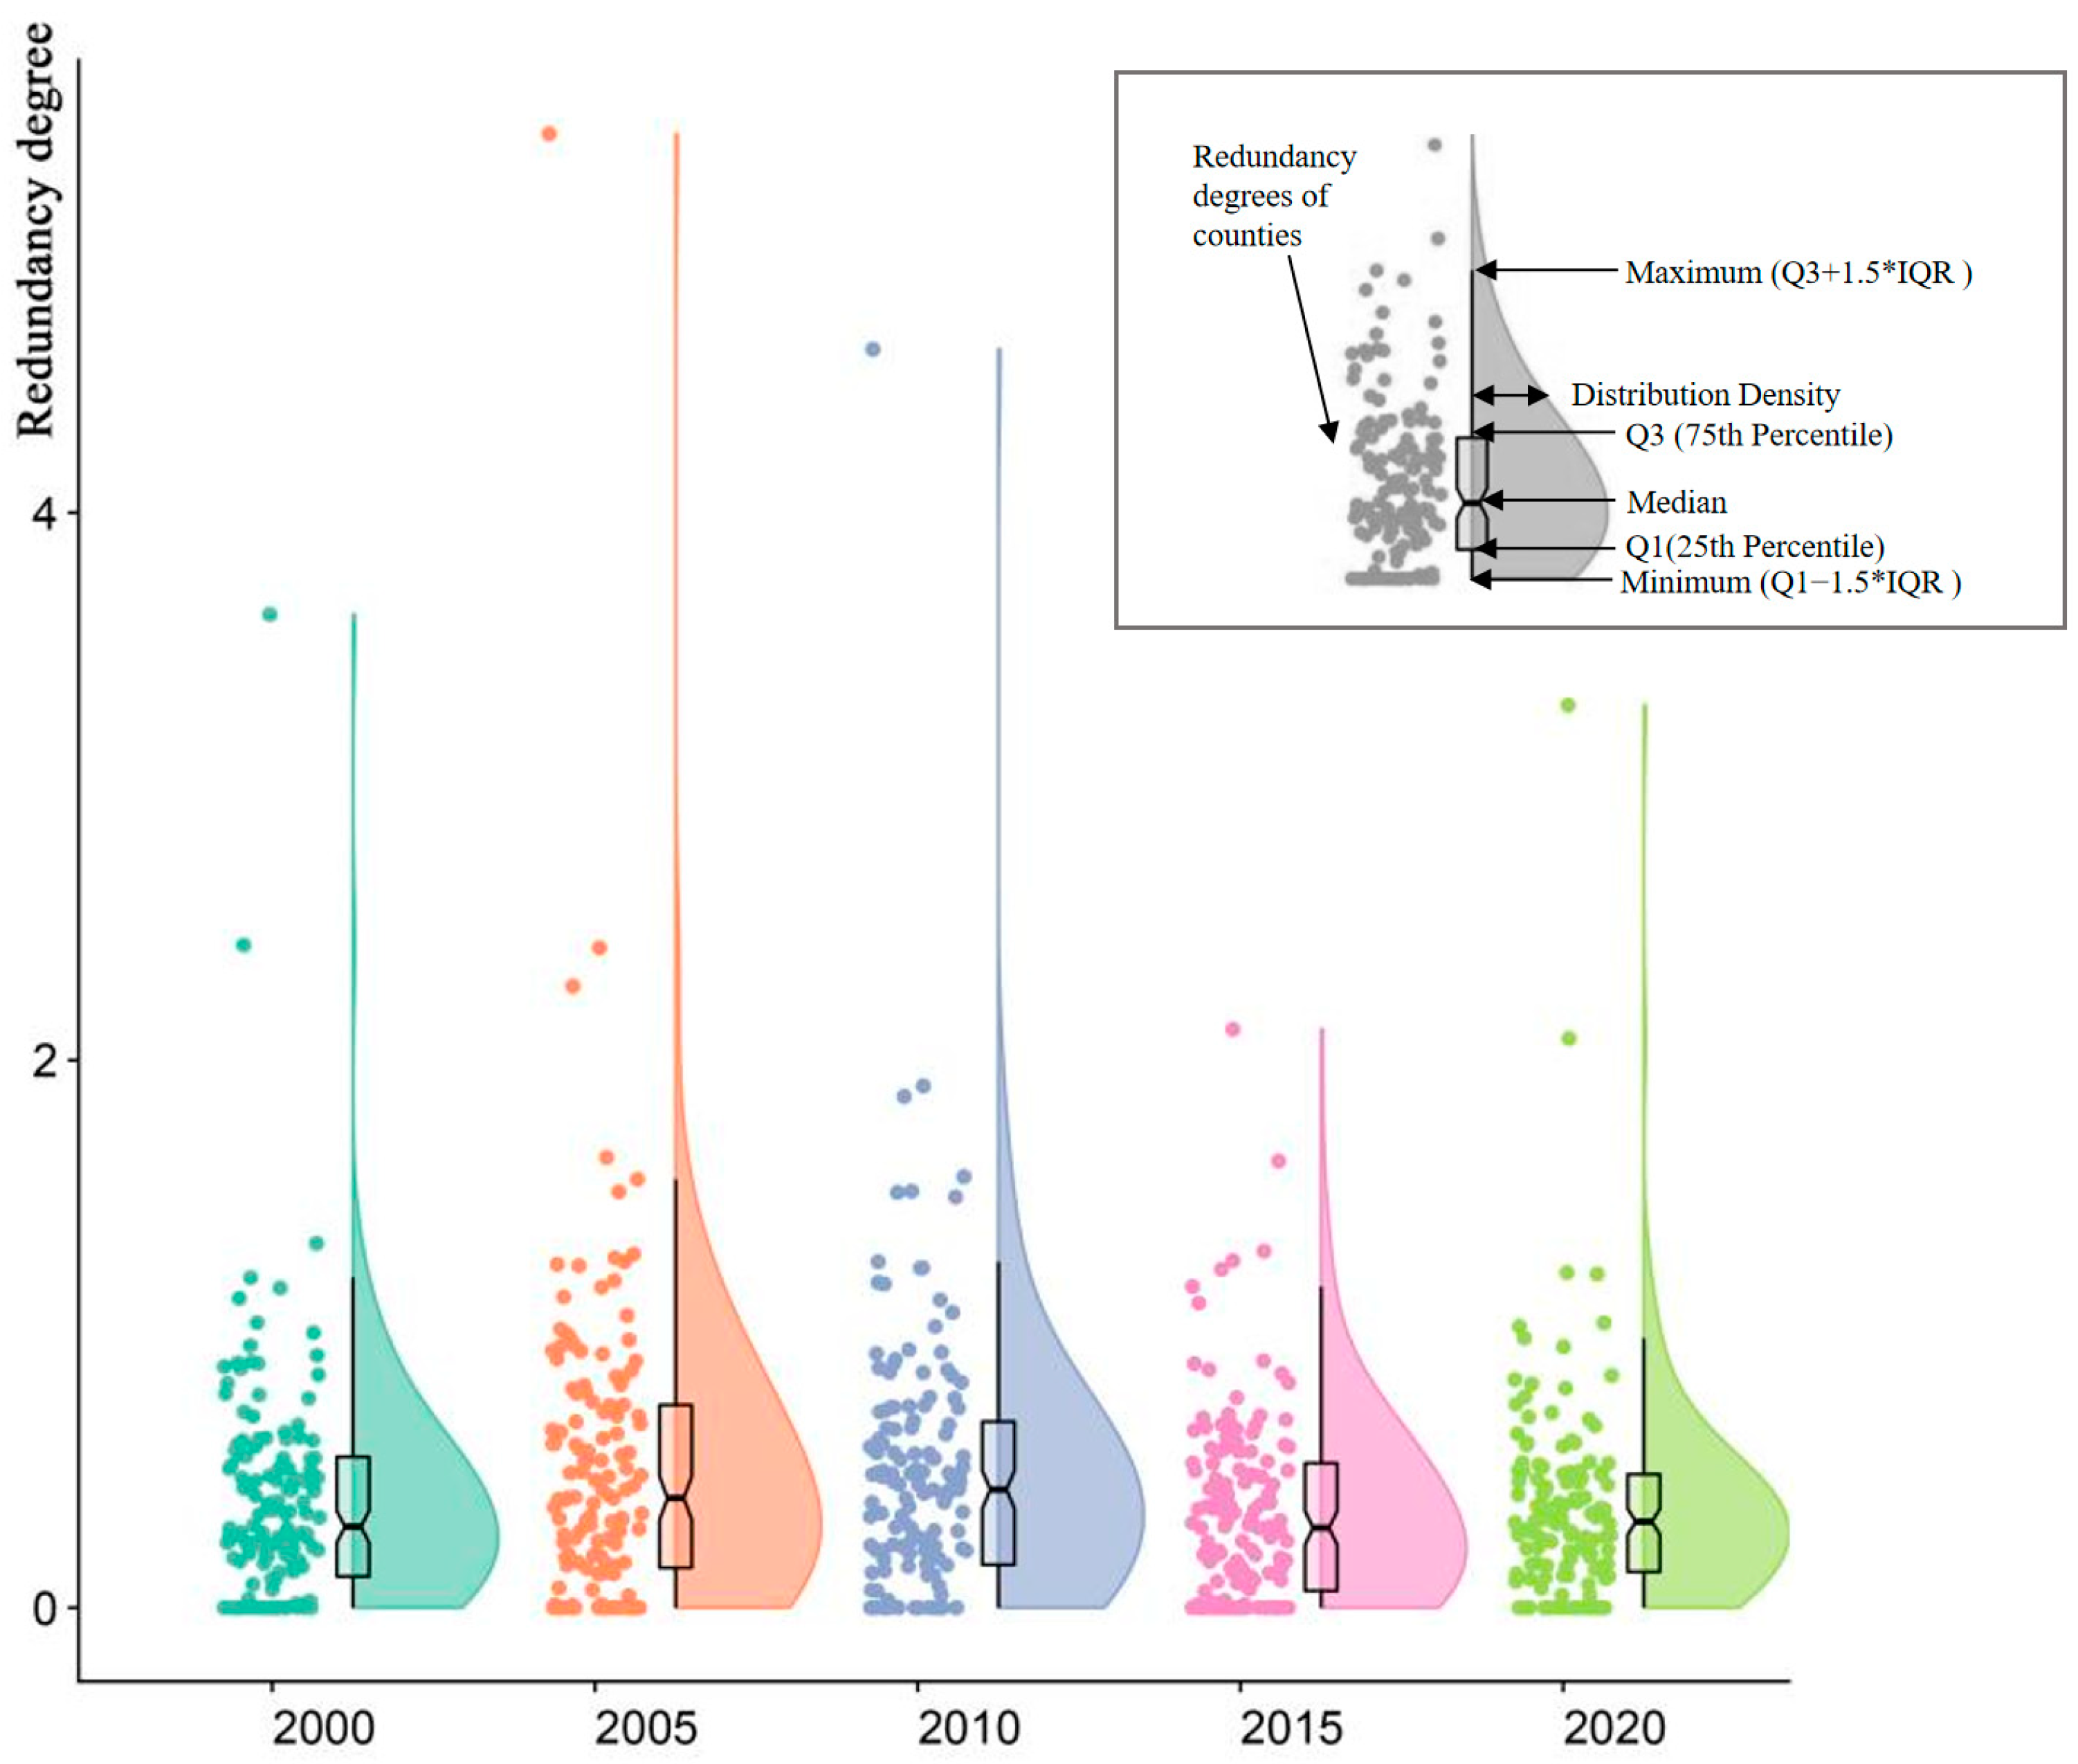
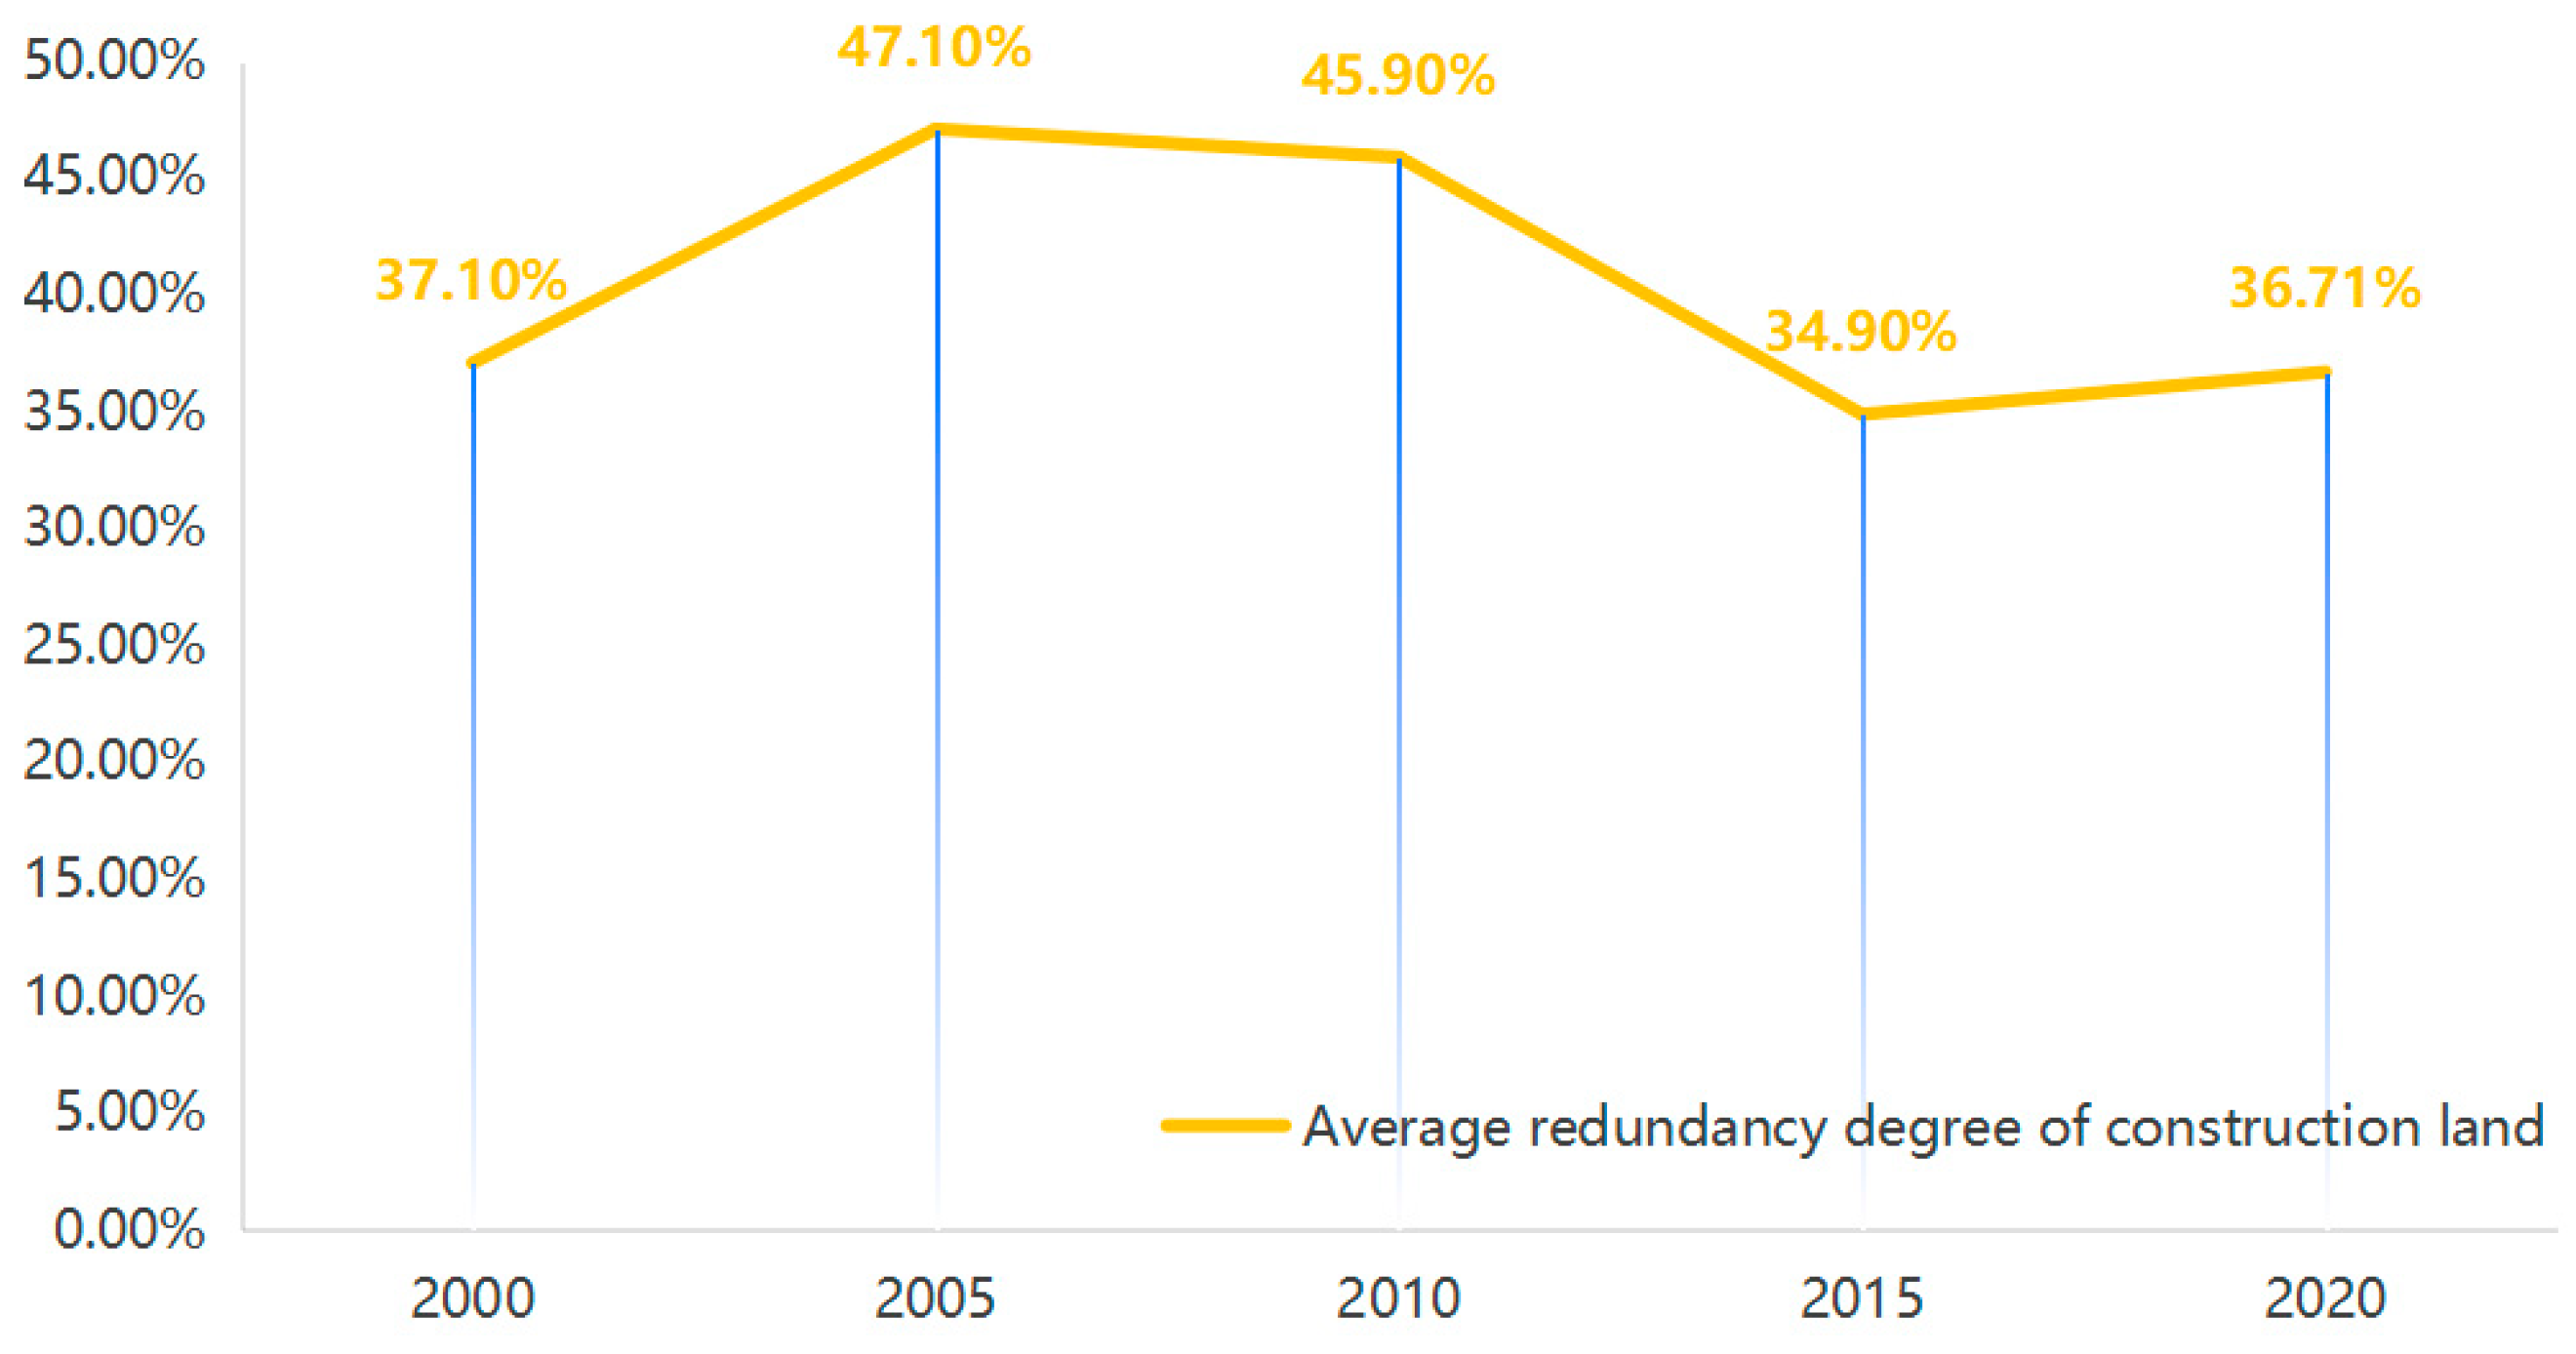
3.1. The Redundancies of the Counties from 2000 to 2020
3.2. The Spatial Evolution of the Redundancies
3.3. The Influencing Factors of the Redundancies of the Counties
4. Discussion
- (1)
- Northwest Hebei
- (2)
- Beijing-Tianjin Surrounding Area
- (3)
- Central and Southern Hebei
- (4)
- Coastal Area
5. Conclusions
- (1)
- Construction land redundancy remains relatively high at the county level in the BTH region, accompanied by issues of extensive land use. Notably, the characteristics of types of redundancy vary across subregions;
- (2)
- Spatial redundancy among county-level units exhibits a “club effect” and spatial lock-in, showing insufficient intra-county coordination to enhance construction land efficiency across counties;
- (3)
- The county’s endowment base and economic development level of the county have consistently played a pivotal role in determining the redundancy of construction land. After 2015, additional factors, location, and public facilities have had impacts on construction land redundancy;
- (4)
- In order to enhance land use efficiency, the supply–demand relationships should be optimized by establishing robust supporting mechanisms and setting different land use strategies across subregions.
Author Contributions
Funding
Data Availability Statement
Conflicts of Interest
References
- Xiao, J.; Dai, J.; Chen, L.; Song, Y. The Identification of Land Use Conflicts and Policy Implications for Donghai County Based on the “Production–Living–Ecological” Functions. Land 2024, 13, 2013. [Google Scholar] [CrossRef]
- Chen, Y.Q.; Zhang, F.Y.; Lin, J.Y. Projecting Future Land Use Evolution and Its Effect on Spatiotemporal Patterns of Habitat Quality in China. Appl. Sci. 2025, 15, 1042. [Google Scholar] [CrossRef]
- Zhang, L.; Wang, S.L.; Liu, Z.B.; Sun, Y.K.; Zhao, X. Does urbanization intensify land finance? Evidence from the county-to-district policy in China. Appl. Econ. 2023, 55, 2189–2206. [Google Scholar] [CrossRef]
- Li, Y.L.; Hu, X.B.; Wei, H.K. Three-Dimensional Government Competition:A Case of Local Land Transfers. CASS J. Political Sci. 2018, 1, 47–58. [Google Scholar]
- Chen, Z.; Li, M.; Zhang, Y.Y. Research on the Impact of New Urbanization Construction on the Scarcity of Urban Construction Land. Urban Probl. 2023, 339, 94–103. [Google Scholar]
- Zhang, Y.Y.; Chen, L.G. Competition development, land supply monopolists and urban land use growth. J. Shanghai Univ. Financ. Econ. 2016, 18, 55–66. [Google Scholar]
- Ren, Y.J.; Yang, J.X.; Zhang, Z.; Zhao, Z.B.; Wang, J.R.; Wang, Y.G.; Gong, J. Urbanization of County in China: Differentiation and Influencing Factors of Spatial Matching Relationships between Urban Population and Urban Land. China Land Sci. 2023, 37, 92–103. [Google Scholar]
- Qiu, B.X.; Ye, M.Y.; Ning, K. Twelve Inflection Points Focusing on the Second Half of Urbanization in China. Urban Dev. Stud. 2021, 28, 1–7. [Google Scholar]
- Wang, K.; Lin, C.H.; Wu, C.Y. Trends and Planning Choices After China’s Urbanization Rate Reaching Above 60%. City Plan. Rev. 2020, 44, 9–17. [Google Scholar]
- Xie, Y.Q.; Zhang, T.; Zeng, P. Research on Subdivision Method of Main Functional Area in Provincial Territorial Planning. City Plan. Rev. 2021, 45, 9–15. [Google Scholar]
- Wang, B.; Lyu, P.L.; Feng, S.Y.; Jian, H. The Theoretical Analysis and Improvement Framework Design of Government Failure in Construction Land Allocation in China. China Land Sci. 2018, 32, 20–28. [Google Scholar]
- Cao, Y.; Zhang, X.L.; Zhang, X.K.; Li, H. The Incremental Construction Land Differentiated Management Framework: The Perspective of Land Quota Trading in China. Land Use Policy 2020, 96, 104675. [Google Scholar] [CrossRef]
- Liu, Y.S.; Fang, F.; Li, Y.H. Key Issues of Land Use in China and Implications for Policy Making. Land Use Policy 2014, 40, 6–12. [Google Scholar] [CrossRef]
- Li, Y.G. Does Land Resource Misallocation Hinder High-quality Economic Development? Empirical Study Based on 35 Large and Medium Cities in China. Nanjing J. Soc. Sci. 2019, 10, 35–42. [Google Scholar]
- Zhang, Y.J.; Deng, W.T.; Zhao, L.Z. Evaluation of Urban Construction Land Use Efficiency and Optimization Strategy of Land Allocation: Based on the Empirical Study on 2165 Municipal Districts, County-level Cities, and Counties in China. City Plan. Rev. 2024, 48, 83–90. [Google Scholar]
- Bao, X.Z.; Liu, C.; Zhang, J.B. Comprehensive Appraise to the Efficiency of Urban Land Use. Urban Probl. 2009, 165, 46–50. [Google Scholar]
- Chen, W.; Wu, Q. Economic Efficiency of Urban Construction Land and Its Influential Factors in Yangtze River Delta. Econ. Geogr. 2014, 34, 142–149. [Google Scholar]
- Liu, C.M.; Li, H.; He, Q.N. The Spatial Difference and Optimizing Countermeasures of Land Use Efficiency in Hunan Province. Econ. Geogr. 2010, 30, 1890–1896. [Google Scholar]
- Yang, Y.; Lang, Y.J. Impacts of Urbanization on Land Use Efficiency and Its Regional Difference in Inland Area of China Regarding the Opening Reform. China Land Sci. 2011, 25, 19–26. [Google Scholar] [CrossRef]
- Liang, L.T.; Yong, Y.J.; Yuan, C.G. Measurement of Urban Land Green Use Efficiency and Its Spatial Differentiation Characteristics; An Empirical Study based on 284 Cities. China Land Sci. 2019, 33, 80–87. [Google Scholar]
- Guo, S.H. Urban Land Use Structure and Land Use Efficiency in Hercynian Urban Agglomeration. Econ. Geogr. 2017, 37, 170–175. [Google Scholar]
- Wu, C.; Wei, Y.D.; Huang, X.; Chen, B. Economic transition, spatial development and urban land use efficiency in the Yangtze River Delta, China. Habitat Int. 2017, 63, 67–78. [Google Scholar] [CrossRef]
- Chen, X.D.; Zhao, R.F.; Shi, P.J.; Zhang, L.H.; Yue, X.X.; Han, Z.Y.; Wang, J.F.; Dou, H.M. Land Use Optimization Embedding in Ecological Suitability in the Embryonic Urban Agglomeration. Land 2023, 12, 1164. [Google Scholar] [CrossRef]
- Zhang, F.G.; Hao, J.M.; Jiang, G.H.; Ding, Z.Y.; Li, X.B.; Li, T. Spatial-temporal Variance of Urban Land Use Intensity. China Land Sci. 2005, 19, 23–29. [Google Scholar]
- Zhao, D.D.; Jin, S.T.; Bao, B.F.; Zhang, L.G. Analysis of Spatial-temporal Evolution and Influencing Factors of Green Land Use efficiency in Central China based on Geographic Dector. J. Geo-Inf. Sci. 2020, 22, 2358–2370. [Google Scholar]
- Xu, H.M.; Hu, S.G.; Li, X. Spatial-Temporal Evolution and Influencing Factors of Environmental Efficiency of Construction Land in China. J. Appl. Sci. 2019, 37, 73–86. [Google Scholar]
- Hu, Y.G.; Liao, C.G.; Zhao, X.M.; Wang, D.Q. Utilization Efficiency of Urban Construction Land and Relevant InfluencingFactors of Hubei Province under the Background of “Two-oriented” Society: An Empirical Analysis Based on Four-stage DEA. Areal Res. Dev. 2016, 35, 119–122. [Google Scholar]
- Chen, Y.; Chen, Z.G.; Zhou, Y.; Huang, X.J. Built Land Use Efficiency and Optimal Allocation in Jiangsu Province. Econ. Geogr. 2017, 37, 171–176. [Google Scholar]
- Zhang, L.X.; Song, Y.; Zhu, D.L.; Huang, A. Spatial Temporal Pattern Evolution and Influencing Factors of Urban Construction Land Use Efficiency in Yangtze River Economic Belt. Areal Res. Dev. 2020, 39, 154–159. [Google Scholar]
- Ding, Y.; Guo, Q.X.; Du, Y.; Wang, H.B.; Chen, S.Y. The Utilization Efficiency and the Driving Factors of Urban Construction Land in the Resource-based Cities from the Perspective of Ecological Civilization: A Case Study of Shanxi Province, China. Res. Agric. Mod. 2019, 40, 583–590. [Google Scholar]
- Xia, J.; Tian, L.; Jiang, Z.; Zhou, L. Deviations and Mechanisms in the Allocation of Construction Land Quotas from the Perspective of National Governance. China Land Sci. 2021, 35, 20–30. [Google Scholar]
- Zou, B. The Transformation from Greenfield-Based Planning to Redevelopment Planning: Theoretical Analysis and Practical Strategies. Urban Plan. Forum 2015, 5, 12–19. [Google Scholar]
- Zhang, J.X.; Zhao, D.; Chen, H. Termination of the Growth Supremacism and Transformation of China’s Urban Planning. City Plan. Rev. 2013, 37, 45–50. [Google Scholar]
- Chen, H.; Wang, X.P.; Guo, Z.J. The Transition of China’s Urban Planning: Thoughts on Increment Planning, Inventory Planning and Reduction Planning. Mod. Urban Res. 2015, 9, 44–48. [Google Scholar]
- Li, J.; Liu, Y.; Yang, Y.; Liu, J. Spatial-temporal characteristics and driving factors of urban construction land in Beijing-Tianjin-Hebei region during 1985–2015. Geogr. Res. 2018, 37, 37–52. [Google Scholar]
- Lv, W.; Xie, Y.; Zeng, P. Assessing and Predicting Spatiotemporal Alterations in Land-Use Carbon Emission and Its Implications to Carbon-Neutrality Target: A Case Study of Beijing-Tianjin-Hebei Region. Land 2024, 13, 2066. [Google Scholar] [CrossRef]
- Gao, W.; Wei, J.F.; Li, Q. Spatio-temporal Evolution and Influencing Factors of Construction Land Use Efficiency in Beijing-Tianjin-Hebei Region under Carbon Emission. Geogr. Geo-Inf. Sci. 2022, 38, 88–95. [Google Scholar]
- Zhou, X.; Cao, F.Y. Research on the Efficiency of Urban Construction Land under Carbon Emission Constrains-Analysis of the Beijing-Tianjin-Hebei Urban Agglomeration Based on the Three-stage Super Efficiency SBM-DEA Model, Price. In Theory & Practice; JSTOR: New York, NY, USA, 2023; pp. 180–184. [Google Scholar]
- Zhang, D.H.; Zhou, C.S.; He, B.J. Spatial and Temporal Heterogeneity of Urban Land Area and PM2.5 Concentration in China. Urban Clim. 2022, 45, 101268. [Google Scholar] [CrossRef]
- Li, W.; Cui, Y.; Qin, Y.; Qin, H.; Dong, J. Construction Land Allocation in Beijing-Tianjin-Hebei and Yangtze River Delta Urban Agglomerations. Acta Geogr. Sin. 2024, 79, 2567–2584. [Google Scholar] [CrossRef]
- Ministry of Land and Resources, National Development and Reform Commission. Beijing-Tianjin-Hebei Synergistic Development Land Use Master Plan (2015–2020); Ministry of Land and Resources, National Development and Reform Commission: Beijing, China, 2015. [Google Scholar]
- Charnes, A.; Cooper, W.W.; Rhodes, E. Measuring the efficiency of decision making units. Eur. J. Oper. Res. 1978, 2, 429–444. [Google Scholar] [CrossRef]
- Tone, K. A slacks-based measure of efficiency in data envelopment analysis. Eur. J. Oper. Res. 2001, 130, 498–509. [Google Scholar] [CrossRef]
- Sherman, T.; Engdahl, N.B.; Porta, G.; Bolster, D. A review of spatial Markov models for predicting pre-asymptotic and anomalous transport in porous and fractured media. J. Contam. Hydrol. 2021, 236, 103734. [Google Scholar] [CrossRef] [PubMed]
- Le Borgne, T.; Dentz, M.; Carrera, J. Lagrangian Statistical Model for Transport in Highly Heterogeneous Velocity Fields. Phys. Rev. Lett. 2008, 101, 090601. [Google Scholar] [CrossRef]
- Yue, L.; Xue, D. Study on the Impact of New-type Urbanization on Urban Land Use Efficiency in China. Inq. Into Econ. Issues 2020, 9, 110–120. [Google Scholar]
- Nie, L.; Guo, Z.X.; Liu, X.L. Impact of Land-use Structure and Prices on Urban Land-use Efficiency. Urban Probl. 2019, 7, 30–36. [Google Scholar]
- Wang, J.; Peng, S.G.; Wang, P.; Wu, Q. Newly-added Urban Construction Land Expansion in China: An Analysis Based on Strategic Interaction. China Land Sci. 2019, 33, 39–47. [Google Scholar]
- Wang, Y.; Ding, S.B.; Lu, Y.L. Regional Differences in Construction Land Use Efficiency and the Spatial Allocation: Based on Chinese Provincial Panel Data from 2003 to 2008. Areal Res. Dev. 2012, 31, 132–138. [Google Scholar]


| Dimension | Indicators | Calculation |
|---|---|---|
| Location | Distance from regional centers (SC) | Calculation of the natural logarithm of the minimum distance from Beijing and Tianjin |
| Distance from the prefecture-level city to which it belongs (SD) | Calculation of the natural logarithm of the distance from the prefecture-level city to which it belongs | |
| Endowment base | Whether it is in mountainous area (ST) | 0: Plain; 1: Mountainous area |
| Population Size (POP) | Population size of county units, normalized | |
| Economic development | Economic development of the prefecture-level city to which it belongs | GDP per capita of the prefecture-level city to which it belongs, normalized |
| Economic development of the county (EC) | GDP per capita of the county, normalized | |
| location quotient of the secondary industry (ESE) | ESE = (Output value of the secondary industry of the county/GDP of the county)/(Output value of the secondary industry of the region/GDP of the region) | |
| location quotient of the tertiary industry (ETE) | ETE = (Output value of the tertiary industry of the county/GDP of the county)/(Output value of the tertiary industry of the region/GDP of the region) | |
| Public facilities | Educational service | Teacher–student ratio, normalized |
| Medical care service | Number of beds in health institutions per 10,000 population, normalized |
| Spatial Type | Type | 1 | 2 | 3 | 4 | n |
|---|---|---|---|---|---|---|
| Global | 1 | 69.01% | 21.83% | 6.34% | 2.82% | 142 |
| 2 | 19.70% | 50.76% | 22.73% | 6.82% | 132 | |
| 3 | 7.46% | 23.88% | 45.52% | 23.13% | 134 | |
| 4 | 3.29% | 5.26% | 25.66% | 65.79% | 152 | |
| Neighborhood (k = 1) | 1 | 46.15% | 23.08% | 15.38% | 15.38% | 13 |
| 2 | 0.00% | 100.00% | 0.00% | 0.00% | 3 | |
| 3 | 0.00% | 33.33% | 33.33% | 33.33% | 3 | |
| 4 | 0.00% | 50.00% | 0.00% | 50.00% | 2 | |
| Neighborhood (k = 2) | 1 | 72.31% | 21.54% | 4.62% | 1.54% | 65 |
| 2 | 25.93% | 42.59% | 24.07% | 7.41% | 54 | |
| 3 | 6.12% | 26.53% | 40.82% | 26.53% | 49 | |
| 4 | 6.06% | 9.09% | 33.33% | 51.52% | 33 | |
| Neighborhood (k = 3) | 1 | 66.67% | 25.49% | 5.88% | 1.96% | 51 |
| 2 | 12.73% | 50.91% | 27.27% | 9.09% | 55 | |
| 3 | 7.41% | 16.67% | 55.56% | 20.37% | 54 | |
| 4 | 3.08% | 4.62% | 24.62% | 67.69% | 65 | |
| Neighborhood (k = 4) | 1 | 84.62% | 7.69% | 7.69% | 0.00% | 13 |
| 2 | 25.00% | 65.00% | 10.00% | 0.00% | 20 | |
| 3 | 10.71% | 32.14% | 35.71% | 21.43% | 28 | |
| 4 | 1.92% | 1.92% | 23.08% | 73.08% | 52 |
| Influencing Factors | 2000 | 2005 | 2010 | 2015 | 2020 | ||||||
|---|---|---|---|---|---|---|---|---|---|---|---|
| Coefficient | VIF | Coefficient | VIF | Coefficient | VIF | Coefficient | VIF | Coefficient | VIF | ||
| Location | SC | −0.073 | 1.379 | 0.026 | 1.651 | 0.024 | 1.353 | 0.155 * | 1.489 | −0.231 ** | 1.737 |
| SD | −0.01 | 1.239 | 0.039 | 1.212 | 0.008 | 1.153 | 0.000 | 1.134 | 0.017 | 1.124 | |
| Endowment base | ST | 0.469 *** | 1.487 | 0.117 | 1.165 | 0.18 ** | 1.351 | 0.167 ** | 1.253 | 0.13 | 1.353 |
| POP | 0.282 *** | 1.339 | 0.236 *** | 1.489 | 0.448 *** | 1.323 | 0.404 *** | 1.161 | 0.052 | 1.38 | |
| Economic development | EM | −0.285 | 1.998 | −0.18 ** | 1.609 | −0.134 * | 1.905 | −0.078 | 2.115 | 0.14 | 2.251 |
| EC | −0.133 * | 2.337 | 0.068 | 2.085 | −0.195 ** | 2.631 | −0.249 ** | 2.398 | −0.287 *** | 2.297 | |
| ESE | −0.433 | 1.675 | −0.541 *** | 2.094 | −0.541 *** | 2.451 | −0.341 *** | 2.37 | −0.348 ** | 2.789 | |
| ETE | −0.289 | 1.995 | −0.171 * | 1.479 | −0.359 *** | 2.174 | −0.289 *** | 2.166 | −0.431 *** | 2.266 | |
| Public facilities | FE | 0.157 ** | 2.161 | 0.05 | 1.651 | 0.100 | 1.43 | 0.260 *** | 1.271 | 0.098 | 1.234 |
| FM | −0.14 | 1.615 | −0.153 | 1.212 | −0.182 ** | 1.481 | −0.062 | 1.35 | −0.114 | 1.389 | |
| Modified R2 | 0.491 | 0.306 | 0.473 | 0.356 | 0.152 | ||||||
| F-value | 14.3 | 7.083 | 13.2 | 8.638 | 3.475 | ||||||
Disclaimer/Publisher’s Note: The statements, opinions and data contained in all publications are solely those of the individual author(s) and contributor(s) and not of MDPI and/or the editor(s). MDPI and/or the editor(s) disclaim responsibility for any injury to people or property resulting from any ideas, methods, instructions or products referred to in the content. |
© 2025 by the authors. Published by MDPI on behalf of the International Society for Photogrammetry and Remote Sensing. Licensee MDPI, Basel, Switzerland. This article is an open access article distributed under the terms and conditions of the Creative Commons Attribution (CC BY) license (https://creativecommons.org/licenses/by/4.0/).
Share and Cite
Zhang, T.; Shen, R.; Xie, Y.; Gao, H.; Lv, W. Spatio-Temporal Analysis of the Redundancies of Construction Land in the Beijing-Tianjin-Hebei Region (2000–2020). ISPRS Int. J. Geo-Inf. 2025, 14, 173. https://doi.org/10.3390/ijgi14040173
Zhang T, Shen R, Xie Y, Gao H, Lv W. Spatio-Temporal Analysis of the Redundancies of Construction Land in the Beijing-Tianjin-Hebei Region (2000–2020). ISPRS International Journal of Geo-Information. 2025; 14(4):173. https://doi.org/10.3390/ijgi14040173
Chicago/Turabian StyleZhang, Ting, Rui Shen, Yongqing Xie, Haowen Gao, and Weitong Lv. 2025. "Spatio-Temporal Analysis of the Redundancies of Construction Land in the Beijing-Tianjin-Hebei Region (2000–2020)" ISPRS International Journal of Geo-Information 14, no. 4: 173. https://doi.org/10.3390/ijgi14040173
APA StyleZhang, T., Shen, R., Xie, Y., Gao, H., & Lv, W. (2025). Spatio-Temporal Analysis of the Redundancies of Construction Land in the Beijing-Tianjin-Hebei Region (2000–2020). ISPRS International Journal of Geo-Information, 14(4), 173. https://doi.org/10.3390/ijgi14040173