Article

Spatial Analysis of Urban Expansion and Energy Consumption Using Nighttime Light Data: A Comparative Study of Google Earth Engine and Traditional Methods for Improved Living Spaces

by
Thidapath Anucharn
1,
Phongsakorn Hongpradit
2,
Niti Iamchuen
2 and
Supattra Puttinaovarat
3,*
1
Information Technology, School of Information and Communication Technology, University of Phayao, Phayao 56000, Thailand
2
Geographic Information Science, School of Information and Communication Technology, University of Phayao, Phayao 56000, Thailand
3
Faculty of Science and Industrial Technology, Prince of Songkla University, Surat Thani Campus, Surat Thani 84000, Thailand
*
Author to whom correspondence should be addressed.
ISPRS Int. J. Geo-Inf. 2025, 14(4), 178; https://doi.org/10.3390/ijgi14040178
Submission received: 15 February 2025 / Revised: 14 April 2025 / Accepted: 16 April 2025 / Published: 18 April 2025
(This article belongs to the Special Issue Spatial Information for Improved Living Spaces)

Abstract

:
This study employs a dual methodological approach, integrating Google Earth Engine (GEE) and unsupervised classification (UNSUP) to analyze urban expansion patterns in Chiang Mai province using nighttime light imagery. The research utilizes Visible Infrared Imaging Radiometer Suite (VIIRS) satellite data from 2014 to 2023 to assess urban growth dynamics. The primary objectives are to (1) evaluate the performance of GEE and UNSUP in nighttime light data processing, (2) validate urban area classification accuracy using multiple assessment metrics, and (3) examine the relationship between nighttime light intensity and electricity consumption through Pearson’s correlation analysis, thereby establishing urban growth patterns. The methodological framework incorporates a dual-threshold classification mechanism in GEE and K-means clustering in traditional geospatial software. Accuracy assessment is conducted using 256 stratified random sampling points, complemented by land use and land cover (LULC) data for ground truth validation. The results indicate that GEE consistently outperforms UNSUP, achieving overall accuracy values between 0.80 and 0.82, compared to 0.73 and 0.76 for UNSUP. The Kappa coefficient for GEE ranges from 0.60 to 0.65, whereas UNSUP demonstrates lower agreement with ground truth data (0.44–0.52). Furthermore, both approaches reveal a significant correlation between electricity consumption and nighttime light intensity, with R2 = 0.9744 for GEE and R2 = 0.9759 for UNSUP, confirming the efficacy of nocturnal illumination data in urban expansion monitoring. The findings indicate that urban areas in Chiang Mai have expanded by approximately 70% over the study period. This research contributes to the field by demonstrating the effectiveness of integrated geospatial methodologies in urban development analysis. The findings offer urban planners and policymakers critical insights for sustainable urban growth management and decision-making.

1. Introduction

The global agenda has emphasized the importance of sustainable development, particularly through the adoption of the 17 Sustainable Development Goals (SDGs) by the United Nations in 2015. These goals aim to advance sustainability across economic, social, and environmental dimensions [1]. Of relevance are SDG 9 (Industry, Innovation, and Infrastructure) and SDG 13 (Climate Action), which present significant challenges for Thailand—an emerging economy and UN member state—in meeting these targets [2,3,4]. The analysis of nighttime satellite imagery has emerged as a powerful method for detecting spatial changes, offering substantial insights into urbanization trends, economic development, and human settlement patterns [5,6,7,8]. This approach highlights the effectiveness of nighttime light data in monitoring urban expansion, with prior analyses indicating a 70% increase in urban areas within Chiang Mai Province during the study period. This research makes a meaningful contribution to the field by demonstrating the value of integrated geospatial methodologies in analyzing urban development. It provides essential information that supports urban planners and policymakers in managing and monitoring urban growth in a sustainable manner. In this study, nighttime light data refer to satellite-derived imagery capturing artificial illumination on the Earth’s surface, commonly used as a proxy for urbanization and economic activity. This term is used consistently throughout the manuscript. Similarly, classification methods refer to algorithms applied to categorize land surface features based on their radiometric or spectral characteristics. A more detailed explanation of the selected methods is provided in the Methodology section.
Chiang Mai, renowned for its historical and cultural significance, serves as the primary business and tourism hub of northern Thailand [9,10]. As part of Thailand’s smart city development initiative, Chiang Mai has been designated a pilot smart city, with the Northern Region Development Strategy identifying it as a special development zone [11,12]. Over the past decade, the city has experienced notable urban expansion alongside significant growth in the tourism sector. The findings from this study are valuable for researchers, urban planners, and policymakers in assessing spatial transformations, strengthening data-driven policy decisions, and supporting sustainable urban development that aligns with local contexts and the Sustainable Development Goals (SDGs) [13,14,15]. Furthermore, the methodologies and insights derived from this research can be applied to similar contexts, particularly in developing countries, thereby advancing sustainable development at local, regional, and global levels.
The advent of Google Earth Engine (GEE) has marked a new era in geospatial data processing, offering a cloud-based platform capable of rapidly analyzing large-scale satellite datasets [16]. This technological advancement has enabled its widespread application across various sectors, particularly in urban research and environmental monitoring. The adoption of GEE has greatly simplified complex geospatial analyses, establishing it as an essential tool for studying urbanization dynamics and environmental change. Given Chiang Mai’s rapid urban transformation over the past decade, sophisticated analytical tools are necessary. This study utilizes GEE’s capabilities to perform a comprehensive analysis of nighttime light data. The innovative core of this research lies in its comparative methodology, which evaluates the processing performance of GEE in relation to traditional geoinformatics software for nighttime light analysis. Specifically, the dual-threshold classification method within GEE was selected due to its flexibility and ability to differentiate urban, rural/suburban, and non-urban areas based on varying light intensities. Unlike more rigid single-threshold methods or automated clustering techniques, the dual-threshold approach allows for greater control and adaptability, which is especially valuable in large-scale temporal analyses where urban boundaries evolve gradually. This method also aligns with expert-based interpretations of urban development patterns and has demonstrated improved classification accuracy in previous studies. The use of GEE further enhances computational efficiency and scalability, making it a suitable platform for long-term and region-wide monitoring.
This study specifically employs K-means clustering in traditional geospatial software due to its computational simplicity, scalability, and effectiveness in handling large datasets with minimal assumptions about data distribution. Meanwhile, the dual-threshold classification approach in GEE was chosen for its adaptability in segmenting urban and non-urban areas based on pixel intensity values, offering an efficient balance between accuracy and speed. The selected methods provide a practical and effective framework suitable for the scope and scale of this study.
This comparative analysis is crucial for several reasons. It examines the correlation between nighttime light data and electricity consumption patterns, offers a detailed understanding of the strengths and limitations of both GEE and traditional geospatial approaches in detecting urban expansion, and assesses the overall efficiency of each method. The integrated approach adopted in this study enhances the analytical rigor of geographic data processing and provides valuable insights for researchers, urban planners, and policymakers in selecting suitable tools for spatial analysis. This research deepens our understanding of urban dynamics in Chiang Mai Province, shedding light on trends in urban expansion and patterns of energy consumption. These findings are essential for developing sustainable urban planning strategies and effective energy management policies, with practical implications that extend beyond academia to influence future urban growth and resource management in Chiang Mai and comparable urban regions.
The main objectives of this study are as follows:
  • To compare the performance of Google Earth Engine and traditional geospatial software in analyzing nighttime light data for urban development.
  • To assess the classification accuracy of urban areas using metrics such as overall accuracy and Kappa coefficient, producer’s accuracy, and user’s accuracy.
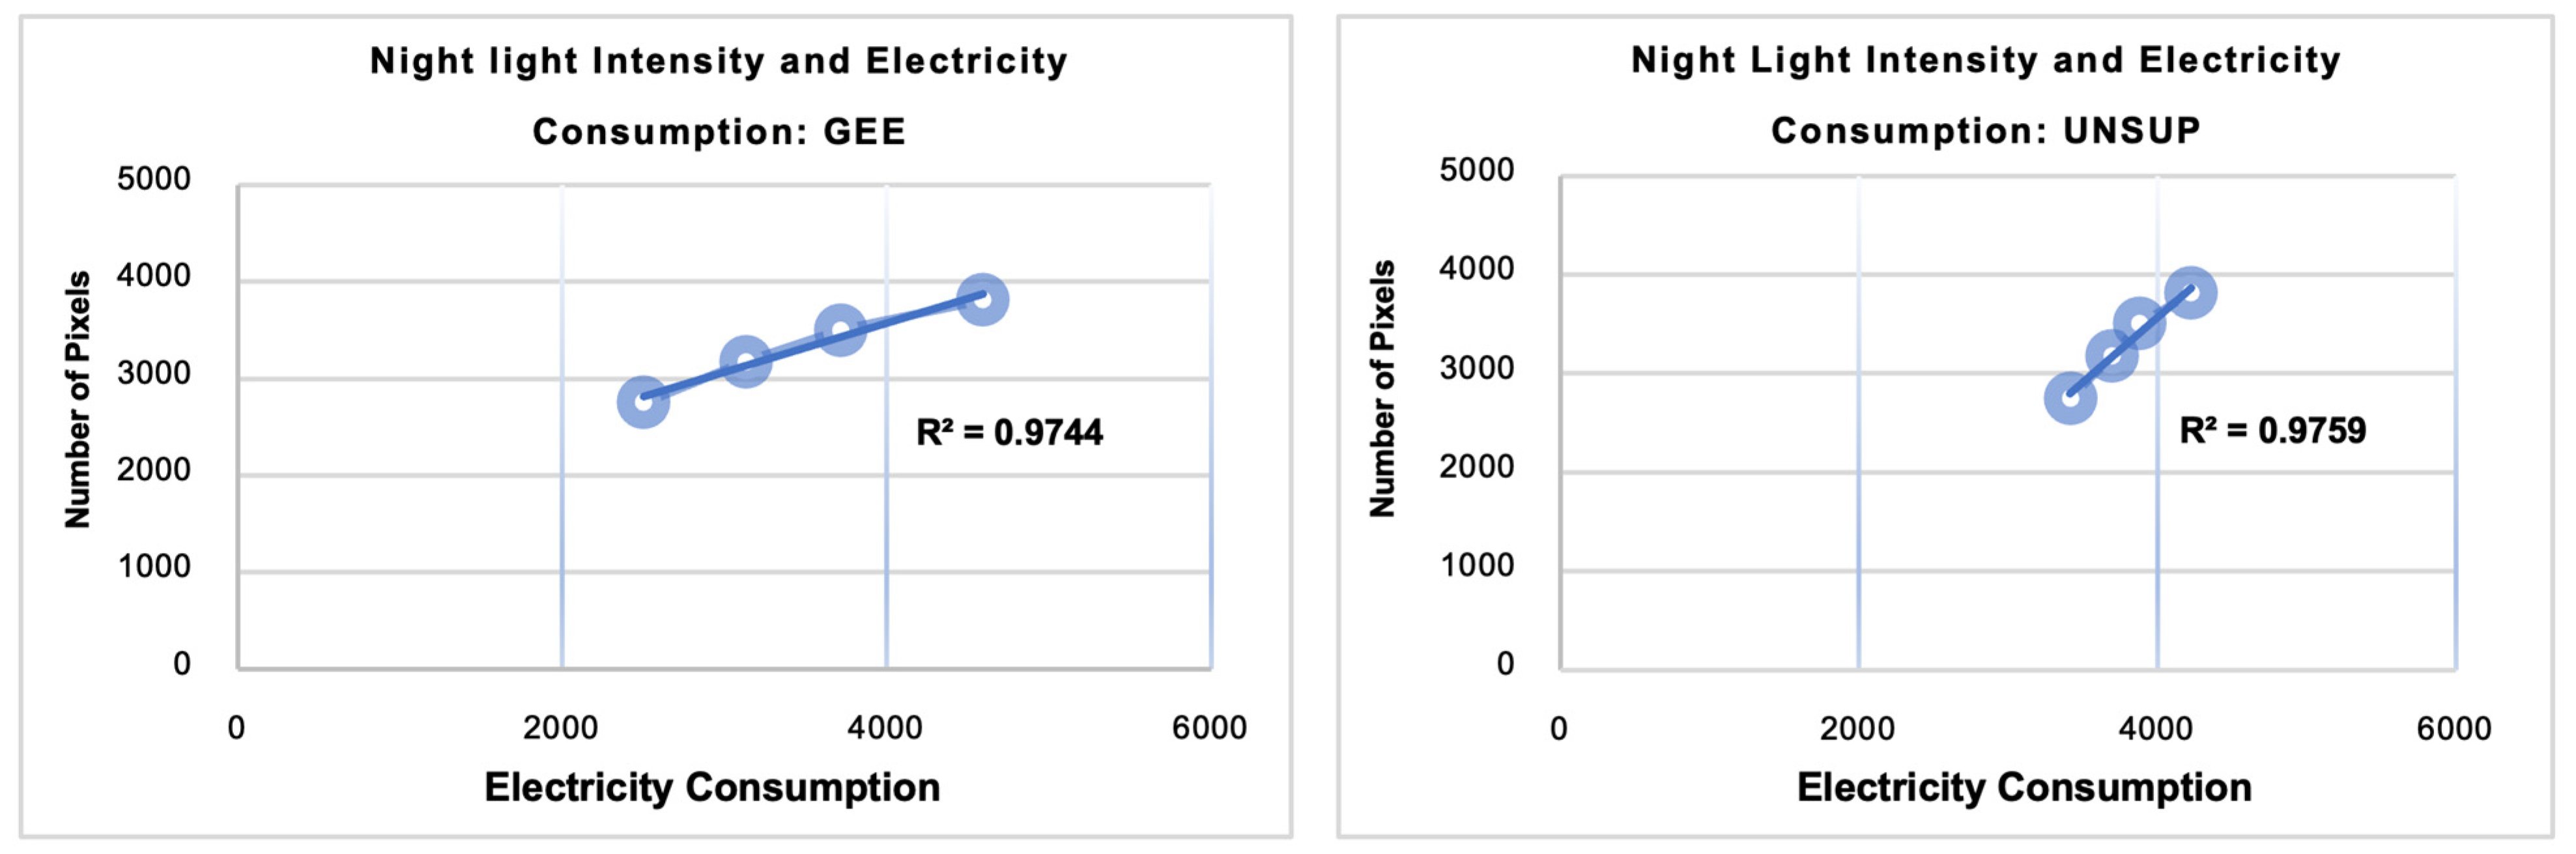
  • To examine the relationship between nighttime light intensity and electricity consumption using Pearson’s correlation to identify urban growth patterns.

2. Literature Review and Related Theory

Nighttime light (NTL) remote sensing has advanced significantly in recent decades, offering a unique perspective on human activities and urban development. Satellite-derived NTL data have been widely used to analyze socio-economic indicators, map urban areas, and assess environmental implications. The Google Earth Engine (GEE) has emerged as a powerful cloud-based geospatial analytics platform. With its multi-petabyte satellite imagery archive and global-scale processing capabilities, the GEE enables researchers to efficiently analyze large and complex datasets. Meanwhile, unsupervised classification (UNSUP) methods still rely on traditional geospatial processing techniques. Among these, K-means and ISODATA remain widely used, each with distinct advantages and limitations depending on the dataset and analytical objectives. This literature review explores key advancements in these three domains—NTL remote sensing, cloud-based geospatial analysis using GEE, and traditional unsupervised classification methods—as they relate to urban growth analysis.

2.1. Advances and Applications of NTL Remote Sensing

NTL remote sensing has become a prominent method for analyzing urban growth and human behavioral patterns. This emerging technology offers diverse perspectives on the spatial and temporal dynamics of urbanization, economic development, and human activity [6,17]. The use of NTL data has increased significantly in recent years due to their ability to provide a comprehensive view of human presence and activity on a global scale. One of the primary advantages of NTL remote sensing is its capacity to capture both the extent and intensity of urban areas. This information has been used to monitor urban expansion, estimate population density, and evaluate economic growth across multiple spatial scales [18,19,20,21]. For example, several studies have demonstrated that NTL data can accurately delineate urban built-up areas, offering valuable insights into the spatial characteristics of metropolitan development [22]. Additionally, NTL has been applied in a wide range of fields, including conflict and disaster assessment, COVID-19 [23], economic growth [24], fisheries monitoring, greenhouse gas and energy consumption analysis, as well as light pollution and its associated health impacts [25]. The broad applicability of NTL highlights its importance in understanding and addressing complex environmental and social challenges in today’s rapidly changing world.
Recent advancements in satellite imagery have significantly enhanced the effectiveness of NTL remote sensing. The Visible Infrared Imaging Radiometer Suite (VIIRS), deployed on several satellite platforms, offers superior spatial and spectral resolution compared to earlier systems. One notable example is NASA’s Black Marble product suite, which incorporates atmospheric corrections and angular adjustments to improve the accuracy and consistency of NTL data [26]. Despite these advancements, NTL remote sensing continues to face certain limitations. These include challenges related to sensor performance in detecting low-light emissions and persistent issues with data processing techniques. Nevertheless, ongoing research and technological innovation are actively addressing these challenges, further strengthening the reliability and applicability of NTL data for various scientific and policy-related applications.

2.2. Google Earth Engine: A Cloud-Based Platform for Large-Scale Geospatial Analysis

Google’s cloud-based GEE platform has transformed large-scale geospatial analysis [16,27]. GEE empowers complex geospatial analysis tools and supports massive datasets. It provides petabytes of analysis-ready satellite imagery and a vast collection of free remote-sensing geospatial information, including half a century’s worth of archived imagery [28,29]. GEE excels at simplifying complex geospatial analyses while maintaining scalability. The platform automatically performs advanced data processing operations, including projection, scaling, and compositing, based on user inputs. This capability allows users to focus on analysis rather than technical preparation, saving time and reducing the need for specialized expertise in large-scale geospatial investigations.
GEE is widely used in environmental monitoring, urban planning, agriculture, forestry, and disaster response [30]. It has been applied to studies on urban ecological quality, urban sprawl, and land use changes. Its capabilities have supported investigations into global environmental issues such as deforestation, drought, and climate change. NTL data are utilized within GEE as proxies for urbanization, environmental conditions, and socio-economic factors worldwide [31]. The platform provides easy access to NTL datasets, including the Defense Meteorological Satellite Program (DMSP) Operational Line-Scan System (OLS) and the more recent VIIRS data [32]. This accessibility allows researchers to perform temporal assessments spanning several years or even decades—an essential capability for analyzing urbanization, economic development, and patterns of human activity over time. The use of GEE-based NTL analysis has expanded significantly. A comprehensive review of 73 relevant publications from 359 Google Scholar results revealed that NTL-GEE research now addresses a wide range of topics related to urbanization, the environment, and socio-economic development globally. Since 2014, the number of such studies has steadily increased, peaking in 2021 [31].
GEE’s cloud-based infrastructure allows researchers to analyze large datasets without the need for high-performance local computing. This has created exciting new opportunities for scholars worldwide, particularly in regions with limited computational resources. The integrated development environment supports both JavaScript 2024 and Python APIs 3.9, enabling users to build complex geospatial operations in familiar programming languages. GEE also incorporates robust machine learning technologies for processing Earth observation data. Its user-friendly APIs allow users to define and apply machine learning models for a variety of common tasks, including regression, classification (both supervised and unsupervised), image segmentation, and accuracy assessment. This powerful combination of advanced analytical tools and access to large-scale datasets has opened new frontiers for research and applications in geospatial science [33].

2.3. Traditional Geospatial Software: Comparing K-Means and ISODATA Classification Methods

Both supervised and unsupervised classification methods are utilized by traditional geospatial tools such as ArcGIS 10.8, QGIS 3.28, and ENVI 5.6 to analyze remote sensing data. Supervised classification is generally more effective in regional-scale studies, as selecting training data for larger areas can be both time-consuming and costly. Unsupervised classification algorithms, on the other hand, categorize pixel values without the need for training data [34,35]. Among these, K-means and ISODATA are fundamental techniques. Both are iterative in nature; however, ISODATA incorporates mechanisms for cluster splitting and merging, offering greater flexibility [36]. Clustering pixels based on similar spectral properties provides valuable analytical insights. The choice between supervised and unsupervised classification depends on the research objectives, the size of the study area, and the availability of training data. In cases where ground truth data are limited or datasets are large, unsupervised algorithms such as K-means and ISODATA offer practical and efficient solutions.
The simplicity and effectiveness of the K-means algorithm have contributed to its widespread use. It groups data points based on their proximity to centroids and iteratively refines these groupings until convergence is achieved. One of the key advantages of K-means is its ease of implementation and computational efficiency. However, the algorithm has notable limitations: most significantly, the need to predefine the number of clusters, which can be challenging when dealing with complex or heterogeneous landscapes [37]. In contrast, the ISODATA method offers a more flexible and adaptive solution.
The ISODATA methodology, by contrast, offers a more flexible approach. It is particularly effective for complex datasets, as it can dynamically adjust the number of clusters during the classification process. ISODATA builds upon the K-means algorithm by incorporating additional steps for splitting and merging clusters based on predefined criteria. However, choosing between K-means and ISODATA often depends on the specific application and characteristics of the dataset. For example, in a study involving fire point data in the Sumatra region, K-means produced a slightly higher Silhouette Coefficient than ISODATA [38]. Each algorithm has its own advantages and limitations. K-means is well-suited for large datasets due to its speed and lower computational demands. In contrast, when the optimal number of clusters is unknown, ISODATA tends to yield more accurate results, albeit at the cost of increased processing complexity and resource requirements.
Recent studies have highlighted the value of integrating geospatial techniques with spatial modeling to enhance urban growth analysis. For example, Abdelkawy et al. employed remote sensing and GIS-based modeling to monitor and predict urban expansion directions in Zagazig City, Egypt [39]. Their study incorporated spatial factors, such as transportation networks, waterways, and land use patterns, and utilized Ordinary Least Squares (OLS) regression to assess their influence on urban growth. This approach aligns closely with the present study’s emphasis on urban expansion patterns and underscores the significance of combining classification methods with spatial factor analysis to improve urban planning strategies. Integrating such techniques could further refine the accuracy and policy relevance of urban mapping efforts.

3. Methodology

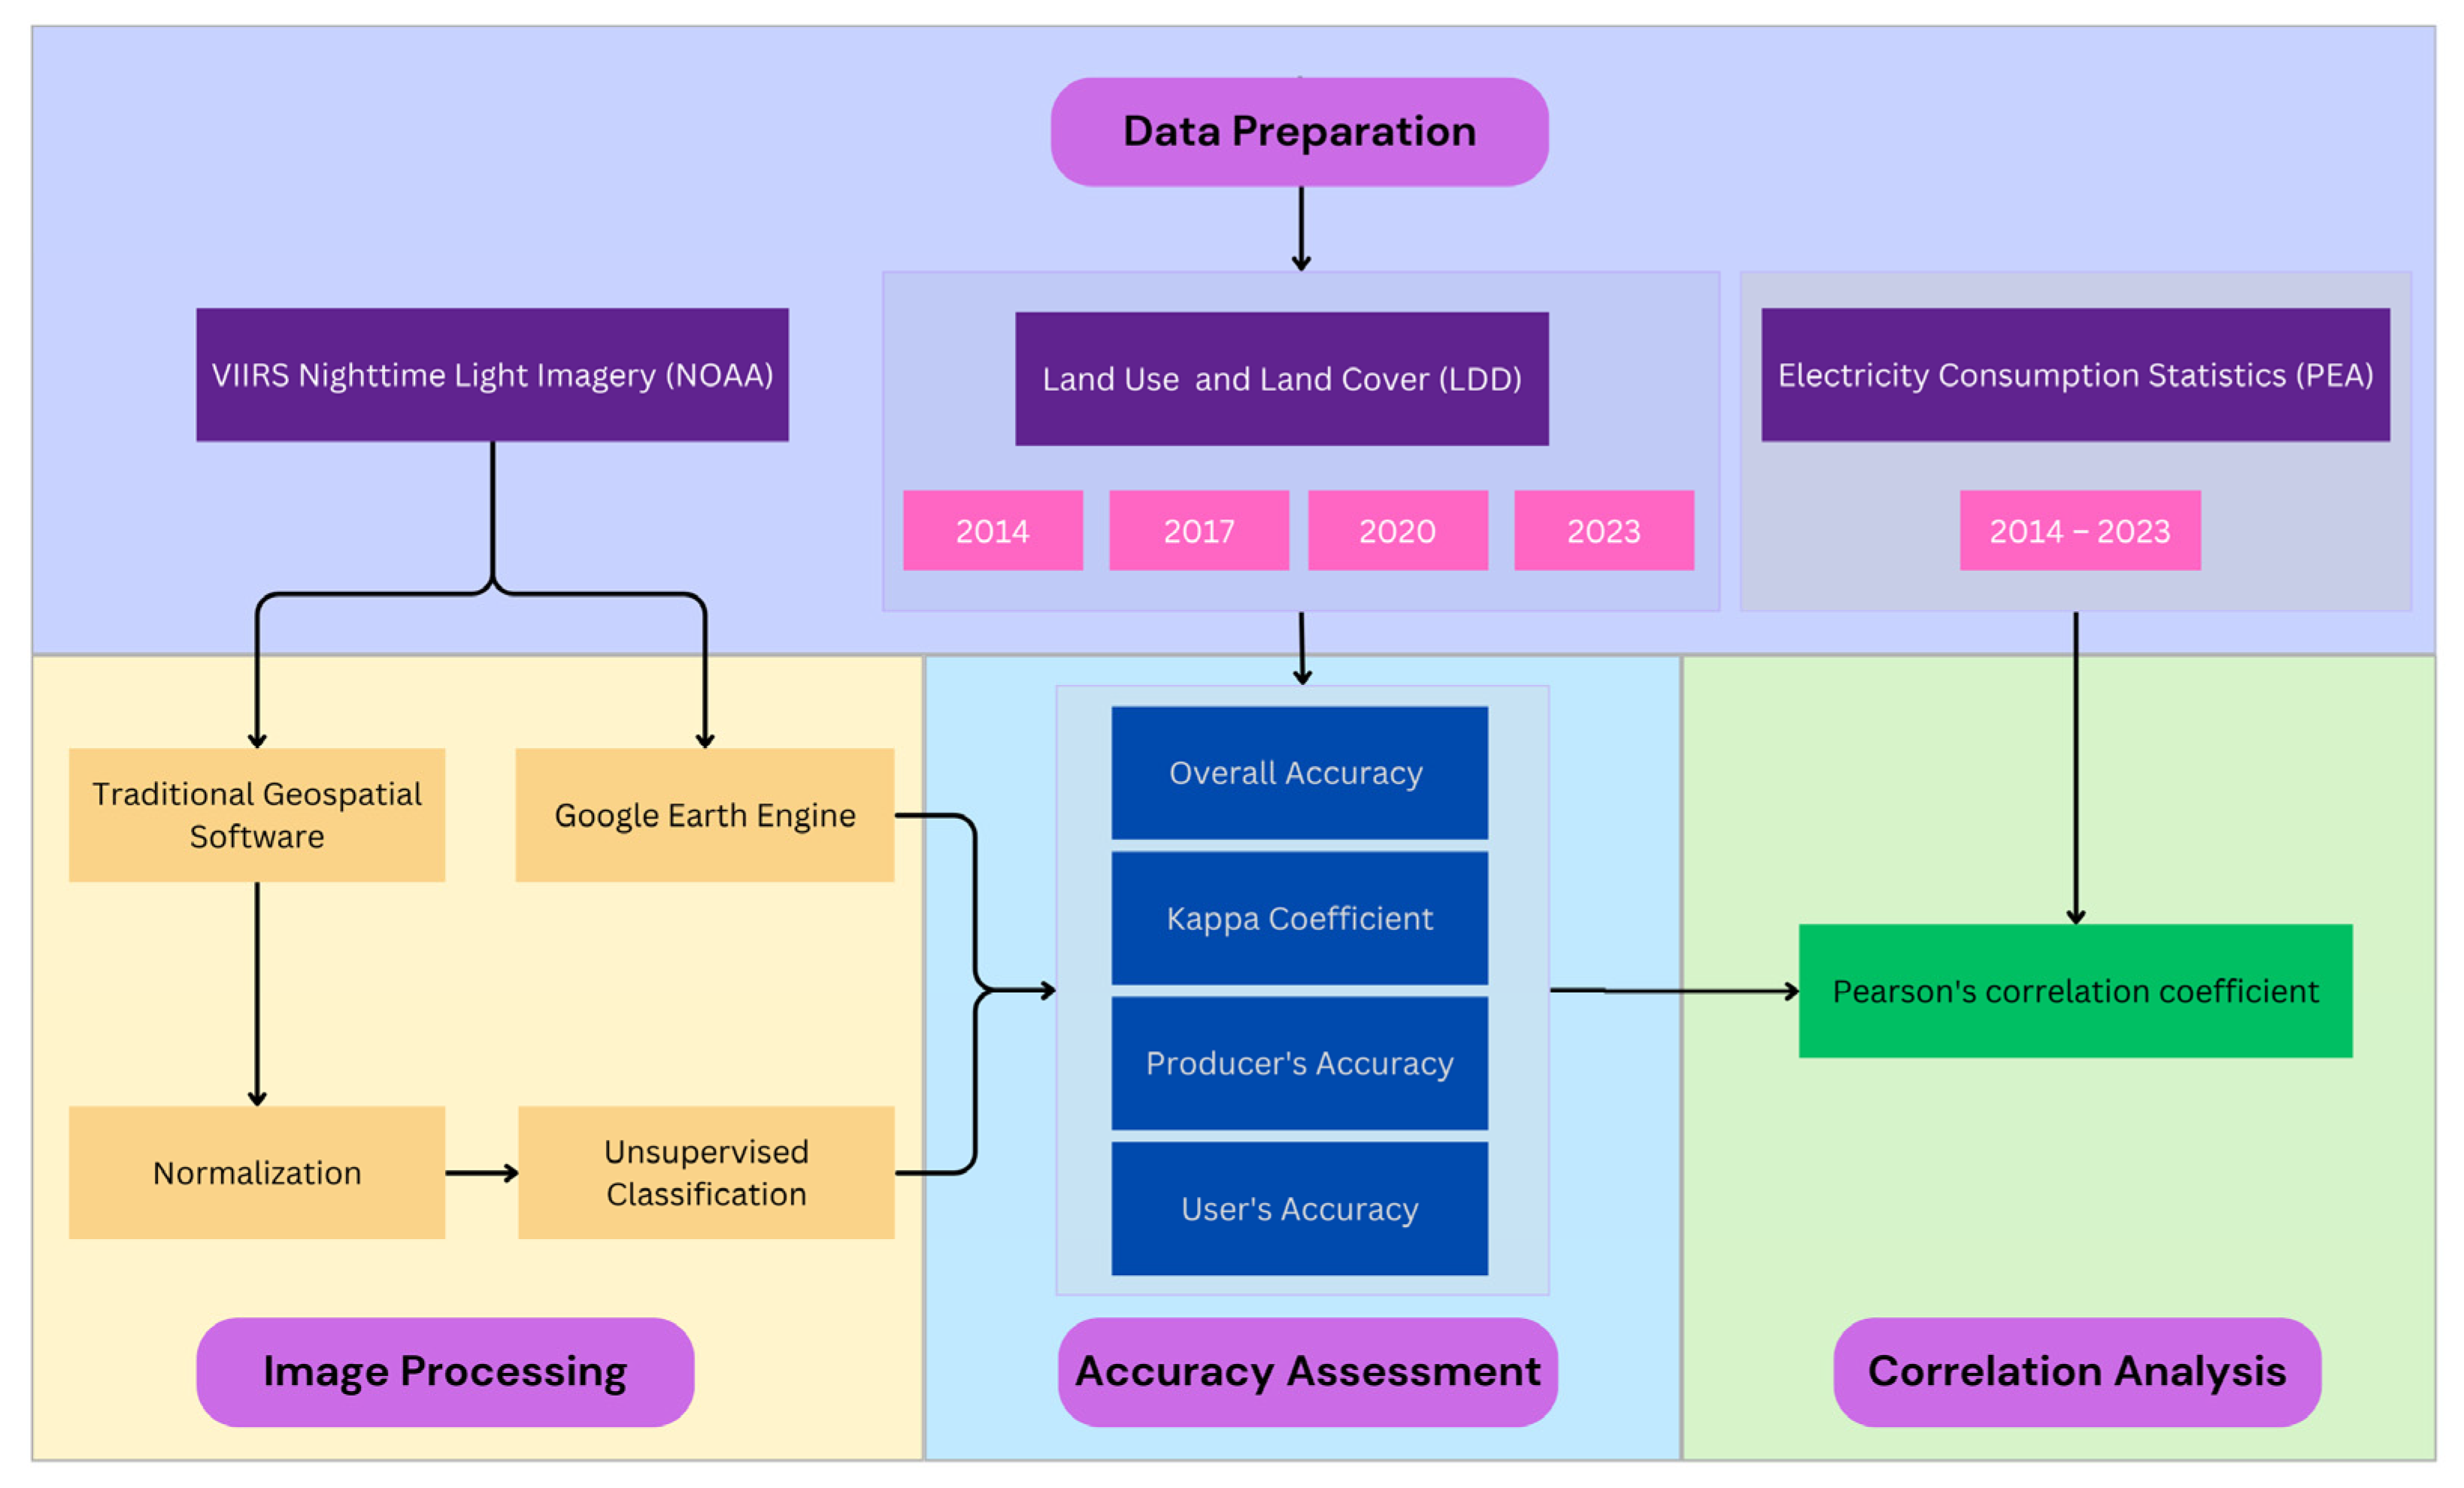
3.1. Research Framework
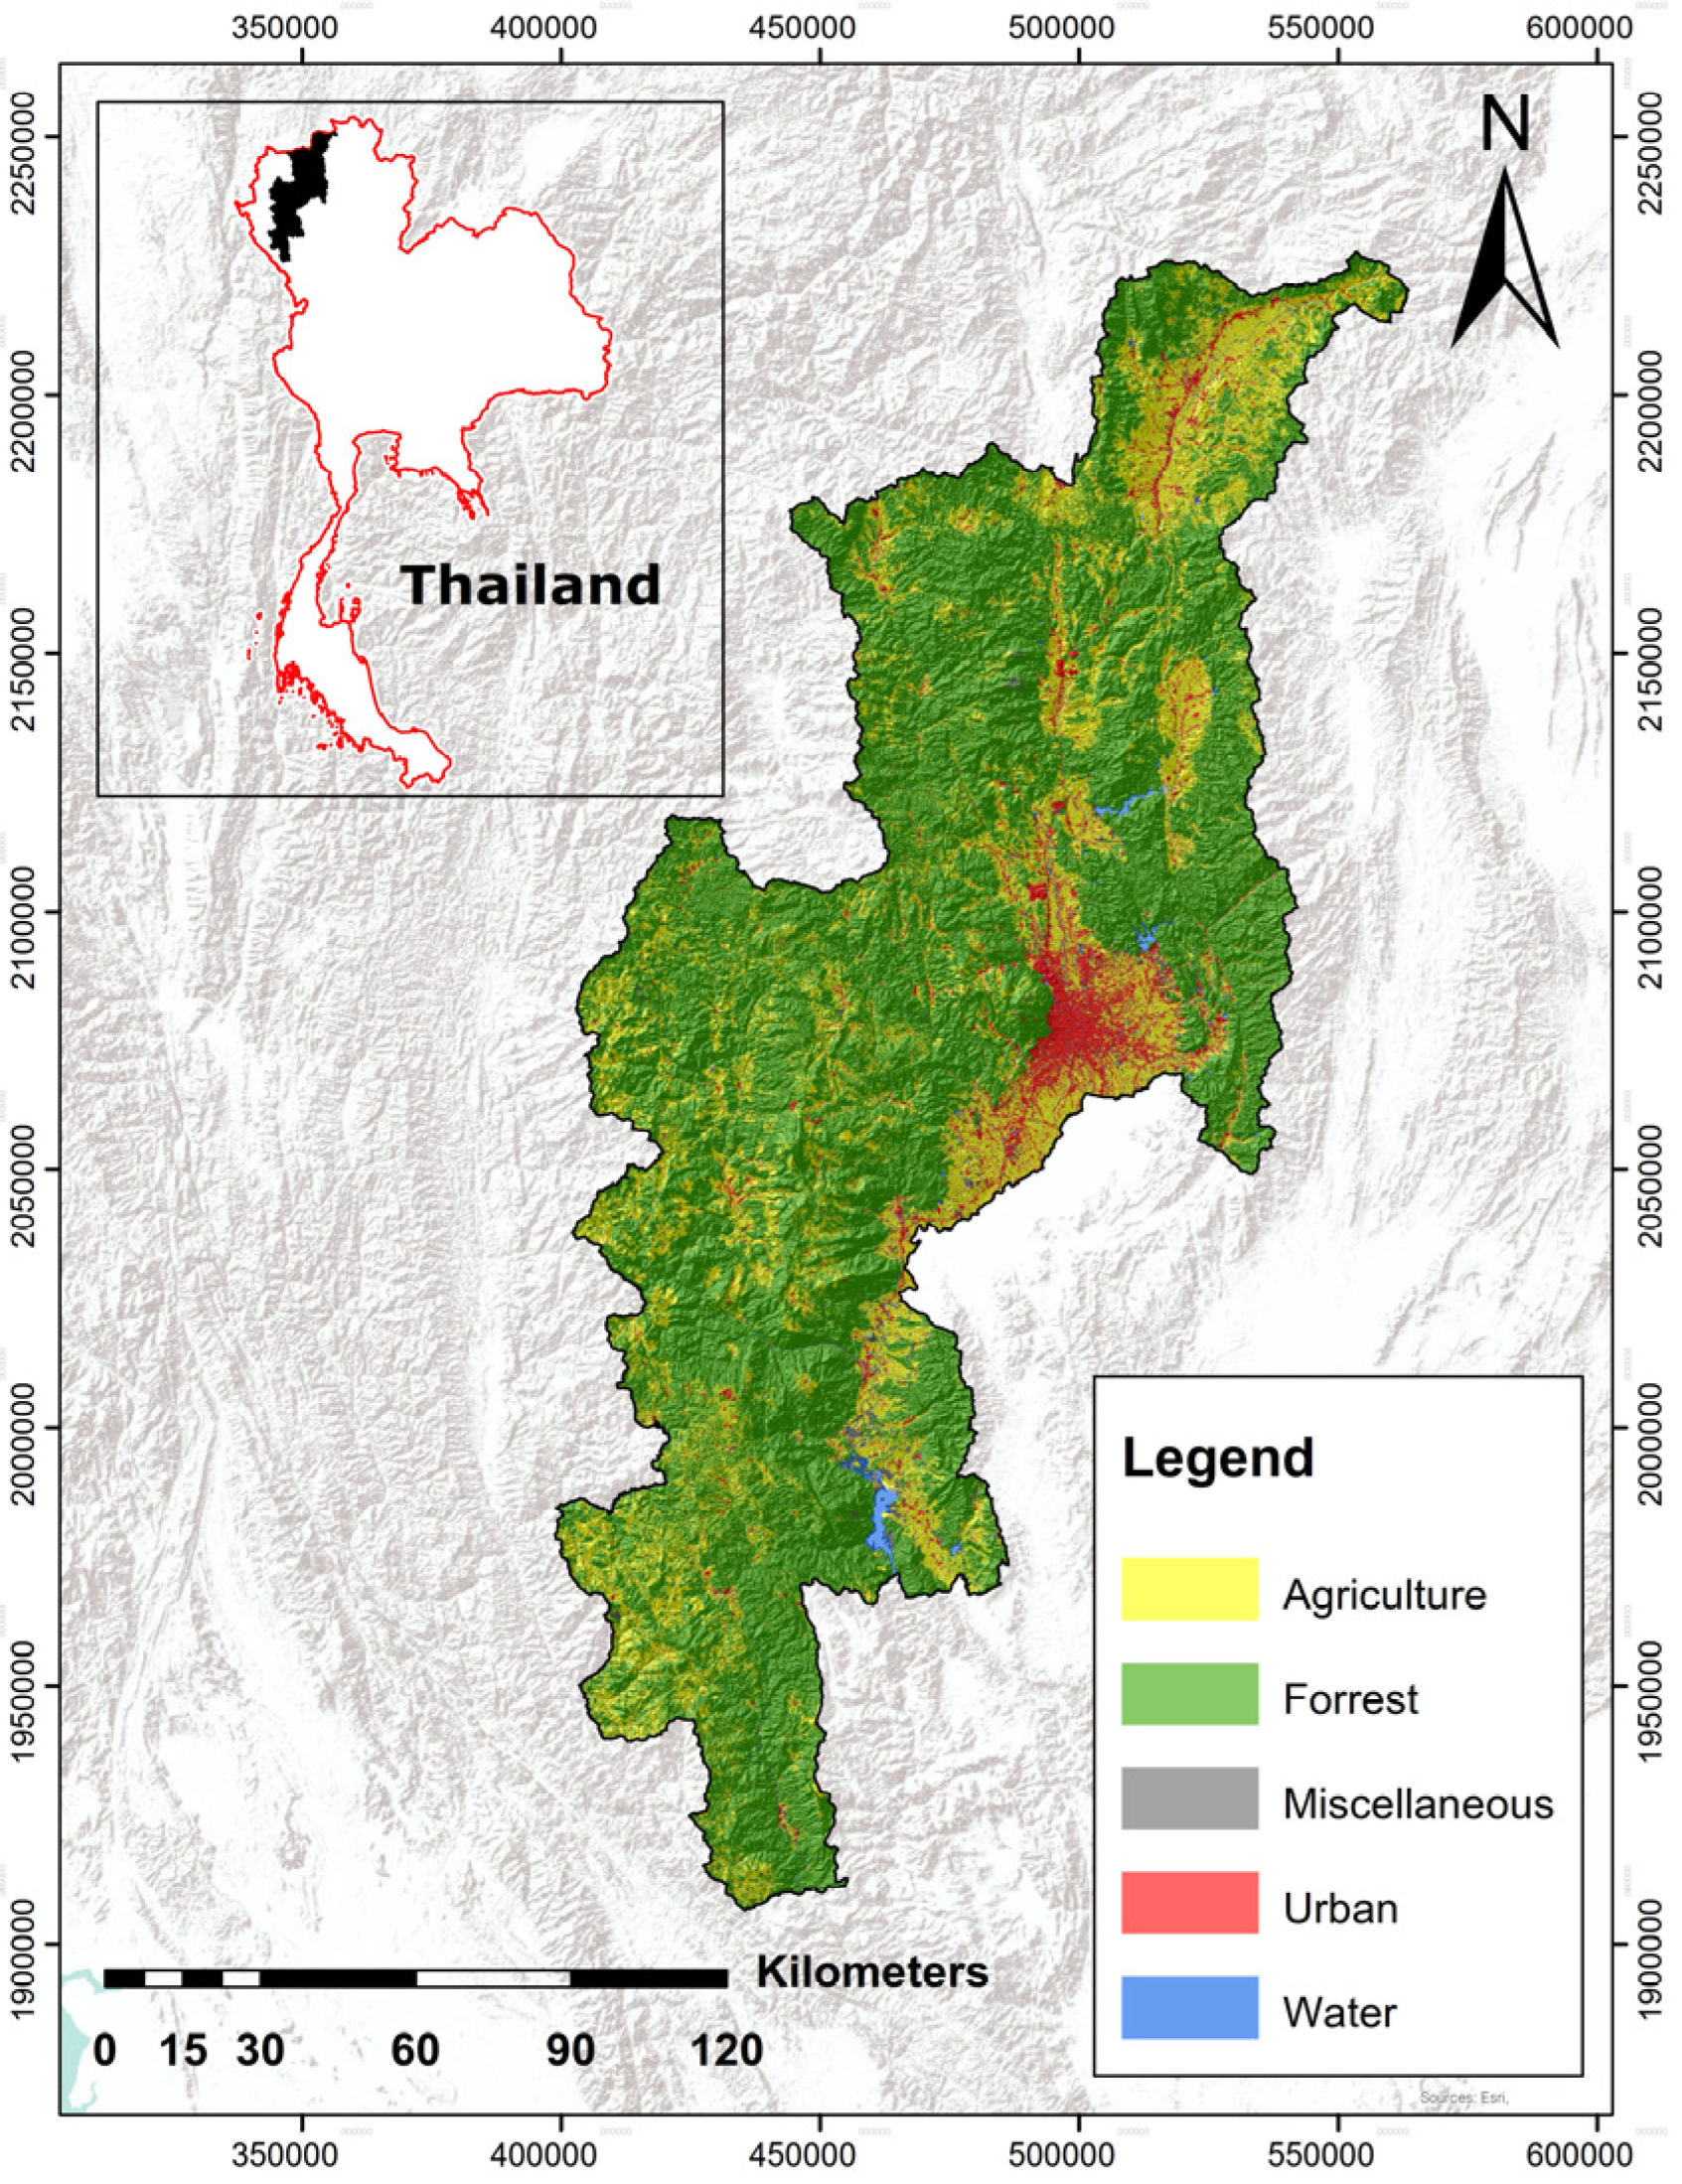
This methodology establishes a comprehensive framework that effectively integrates advanced geospatial technologies with diverse data sources to achieve this study’s objectives. The analytical foundation is built upon VIIRS nighttime light imagery from NOAA, which is processed through two distinct yet complementary pathways. In the first pathway, the imagery is processed using traditional geospatial software, involving normalization followed by unsupervised classification. Simultaneously, GEE serves as a cloud-based platform for processing the same imagery, thereby enhancing computational efficiency essential for large-scale spatial analysis. The methodological framework also incorporates temporal Land Use and Land Cover (LULC) data obtained from the Land Development Department (LDD) at four strategic time points—2014, 2017, 2020, and 2023—to enable a comprehensive analysis of urban development over time. In addition, electricity consumption statistics from the Provincial Electricity Authority (PEA), spanning the years 2014–2023, contribute valuable insights into temporal patterns and trends in energy usage. A rigorous accuracy assessment protocol is implemented to ensure analytical robustness, employing four key metrics: overall accuracy to evaluate general classification performance, the Kappa coefficient to measure agreement between classification and reference data, producer’s accuracy to assess the reliability of map production, and user’s accuracy to gauge the reliability from an end-user perspective. The methodology culminates with the application of Pearson’s correlation coefficient to quantify the relationship between electricity consumption patterns and nighttime light intensity. This statistical analysis validates the effectiveness of nighttime light data as a reliable proxy for assessing both urban development and energy consumption trends, thereby reinforcing this study’s analytical foundation and conclusions. Figure 1 provides a visual summary of the research framework.

3.2. Study Area

Chiang Mai Province is in northern Thailand and consists of 25 districts. It covers a total area of approximately 22,190 square kilometers (Figure 2). The province is also home to Doi Inthanon, the highest mountain in Thailand, known for its diverse topography. The central region, particularly along the Ping River and its tributaries, is characterized by extensive flatlands that are suitable for urban development and agriculture, while the landscape primarily consists of rugged mountainous areas interspersed with valleys. The most significant development in Chiang Mai’s urban and economic growth over the past decade has been in the city district and its adjacent areas, which include the Hang Dong, San Sai, and Saraphi districts. Land use patterns have undergone a significant transformation because of this accelerated urbanization, which is evident in the conversion of agricultural lands into urban areas. In addition to altering the physical landscape, this urban expansion has resulted in heightened energy demands and infrastructure development in the region.

3.3. Data Preparation and Temporal Selection

Nighttime light imagery, land use/land cover (LULC) data, and power consumption data are used to assess urban growth patterns in Chiang Mai, Thailand. The integration of these diverse datasets enables a comprehensive examination of urban growth dynamics over a decade-long period from 2014 to 2023.
Prior to classification, all datasets underwent essential pre-processing steps to ensure data quality and consistency. For nighttime light imagery, pixels with abnormally high brightness values potentially caused by sensor errors or temporary light sources (e.g., gas flares) were masked out. A denoising filter was applied using the median filtering technique to reduce random noise while preserving key spatial features. Land use/land cover (LULC) data were harmonized to ensure consistency across years and reclassified into urban and non-urban categories. Power consumption data were cleaned by removing incomplete records and handling missing values using linear interpolation based on adjacent time periods. Unit standardization was also applied to ensure comparability across different consumer categories. Additionally, all electricity data were normalized using z-score transformation to reduce the influence of scale differences and facilitate correlation analysis. All spatial datasets were resampled to a uniform resolution and aligned using the same coordinate reference system for accurate overlay and analysis.

3.3.1. Nighttime Light Imagery Analysis

Over a decade-long period from 2014 to 2023, this study employed monthly average radiance (avg_rad) composite images from the Visible Infrared Imaging Radiometer Suite (VIIRS) Day/Night Band (DNB) to analyze urban development patterns [5,40]. The analysis framework focuses on December observations across four strategically selected time points—2014, 2017, 2020, and 2023—spaced at three-year intervals. December was intentionally selected due to its favorable observation conditions, which include distinct nighttime light intensity, peak tourism activity, and minimal atmospheric interference resulting from the absence of the forest burning season. VIIRS DNB data, which reports average radiance values in nanoWatts/sr/cm2, are provided by [41]. The radiance values range from −1.5 to 193,565. This systematic temporal selection enhances data consistency and comparability by minimizing seasonal variability and atmospheric disturbances. The high radiometric calibration and spatial resolution of the VIIRS DNB imagery enable a detailed and reliable examination of urban development patterns throughout the study period.

3.3.2. Land Use/Land Cover (LULC) Data Analysis

LULC data from the Land Development Department [42] are analyzed at two classification levels to validate urban development patterns identified through nighttime light imagery. At Level 1, the analysis applies a binary classification (urban/non-urban) using LULC data across four temporal points: 2014, 2017, 2020, and 2023. Level 2 provides a more detailed classification by distinguishing between urban and suburban/rural areas, specifically for the most recent years—2020 and 2023. These classified datasets serve as essential inputs for the accuracy assessment phase, which employs four key metrics: producer’s accuracy, overall accuracy, the Kappa coefficient, and user’s accuracy.

3.3.3. Electricity Consumption Data Analysis

This study utilizes data from the Provincial Electricity Authority (PEA) to examine electricity consumption patterns from 2014 to 2023, supporting the analysis of urban development trends [43]. Electricity consumption data are categorized into three primary sectors: residential, commercial, and industrial. The residential sector is further divided into two consumption levels—households consuming less than 150 kWh per month and those consuming more than 150 kWh per month (Table 1). This classification allows for a detailed analysis of domestic energy consumption patterns within urban areas. The commercial sector data also include specific categories, such as agricultural activities, street lighting, and non-profit organizations, in addition to small, medium, and large enterprises.
This comprehensive sectoral classification enables the analysis of relationships between nighttime light intensity and electricity consumption patterns through Pearson’s correlation analysis, offering valuable insights into urban development dynamics throughout the study period. The temporal framework aligns with the VIIRS nighttime light dataset, ensuring consistency in the comparative analysis conducted over the decade. This systematic approach to data categorization and analysis facilitates a thorough evaluation of the correlation between energy consumption and urban development patterns, while also accounting for variations across different socio-economic sectors.

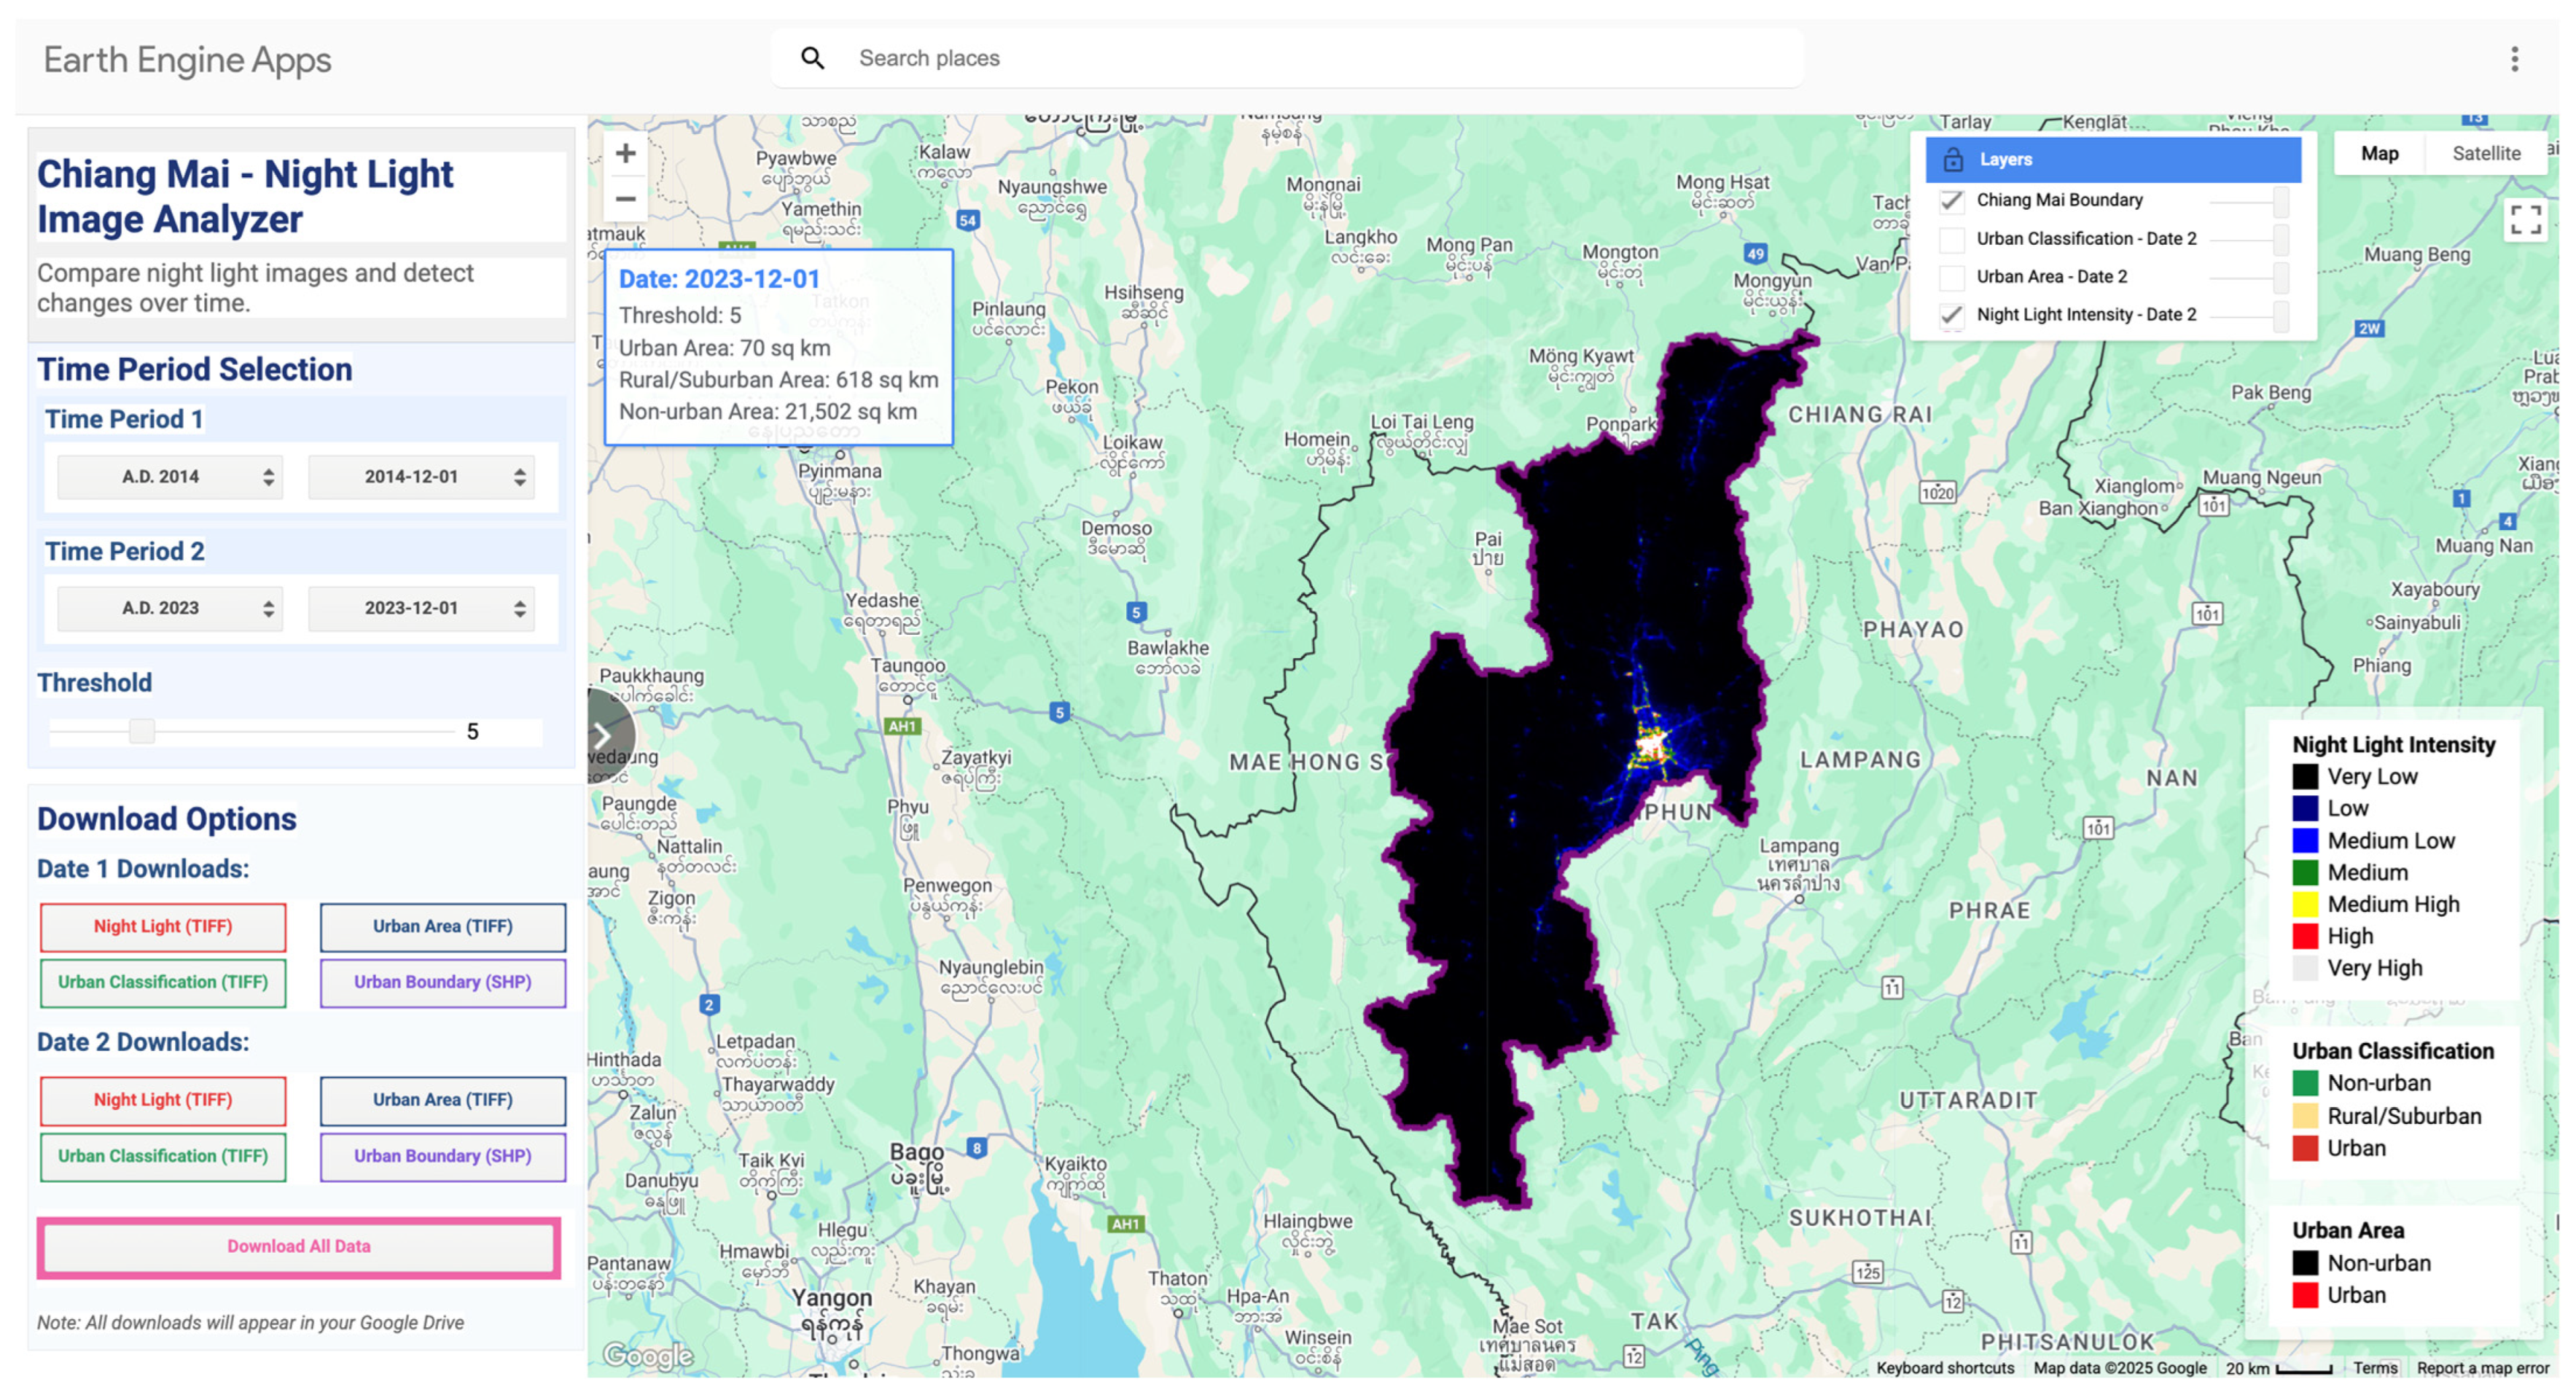
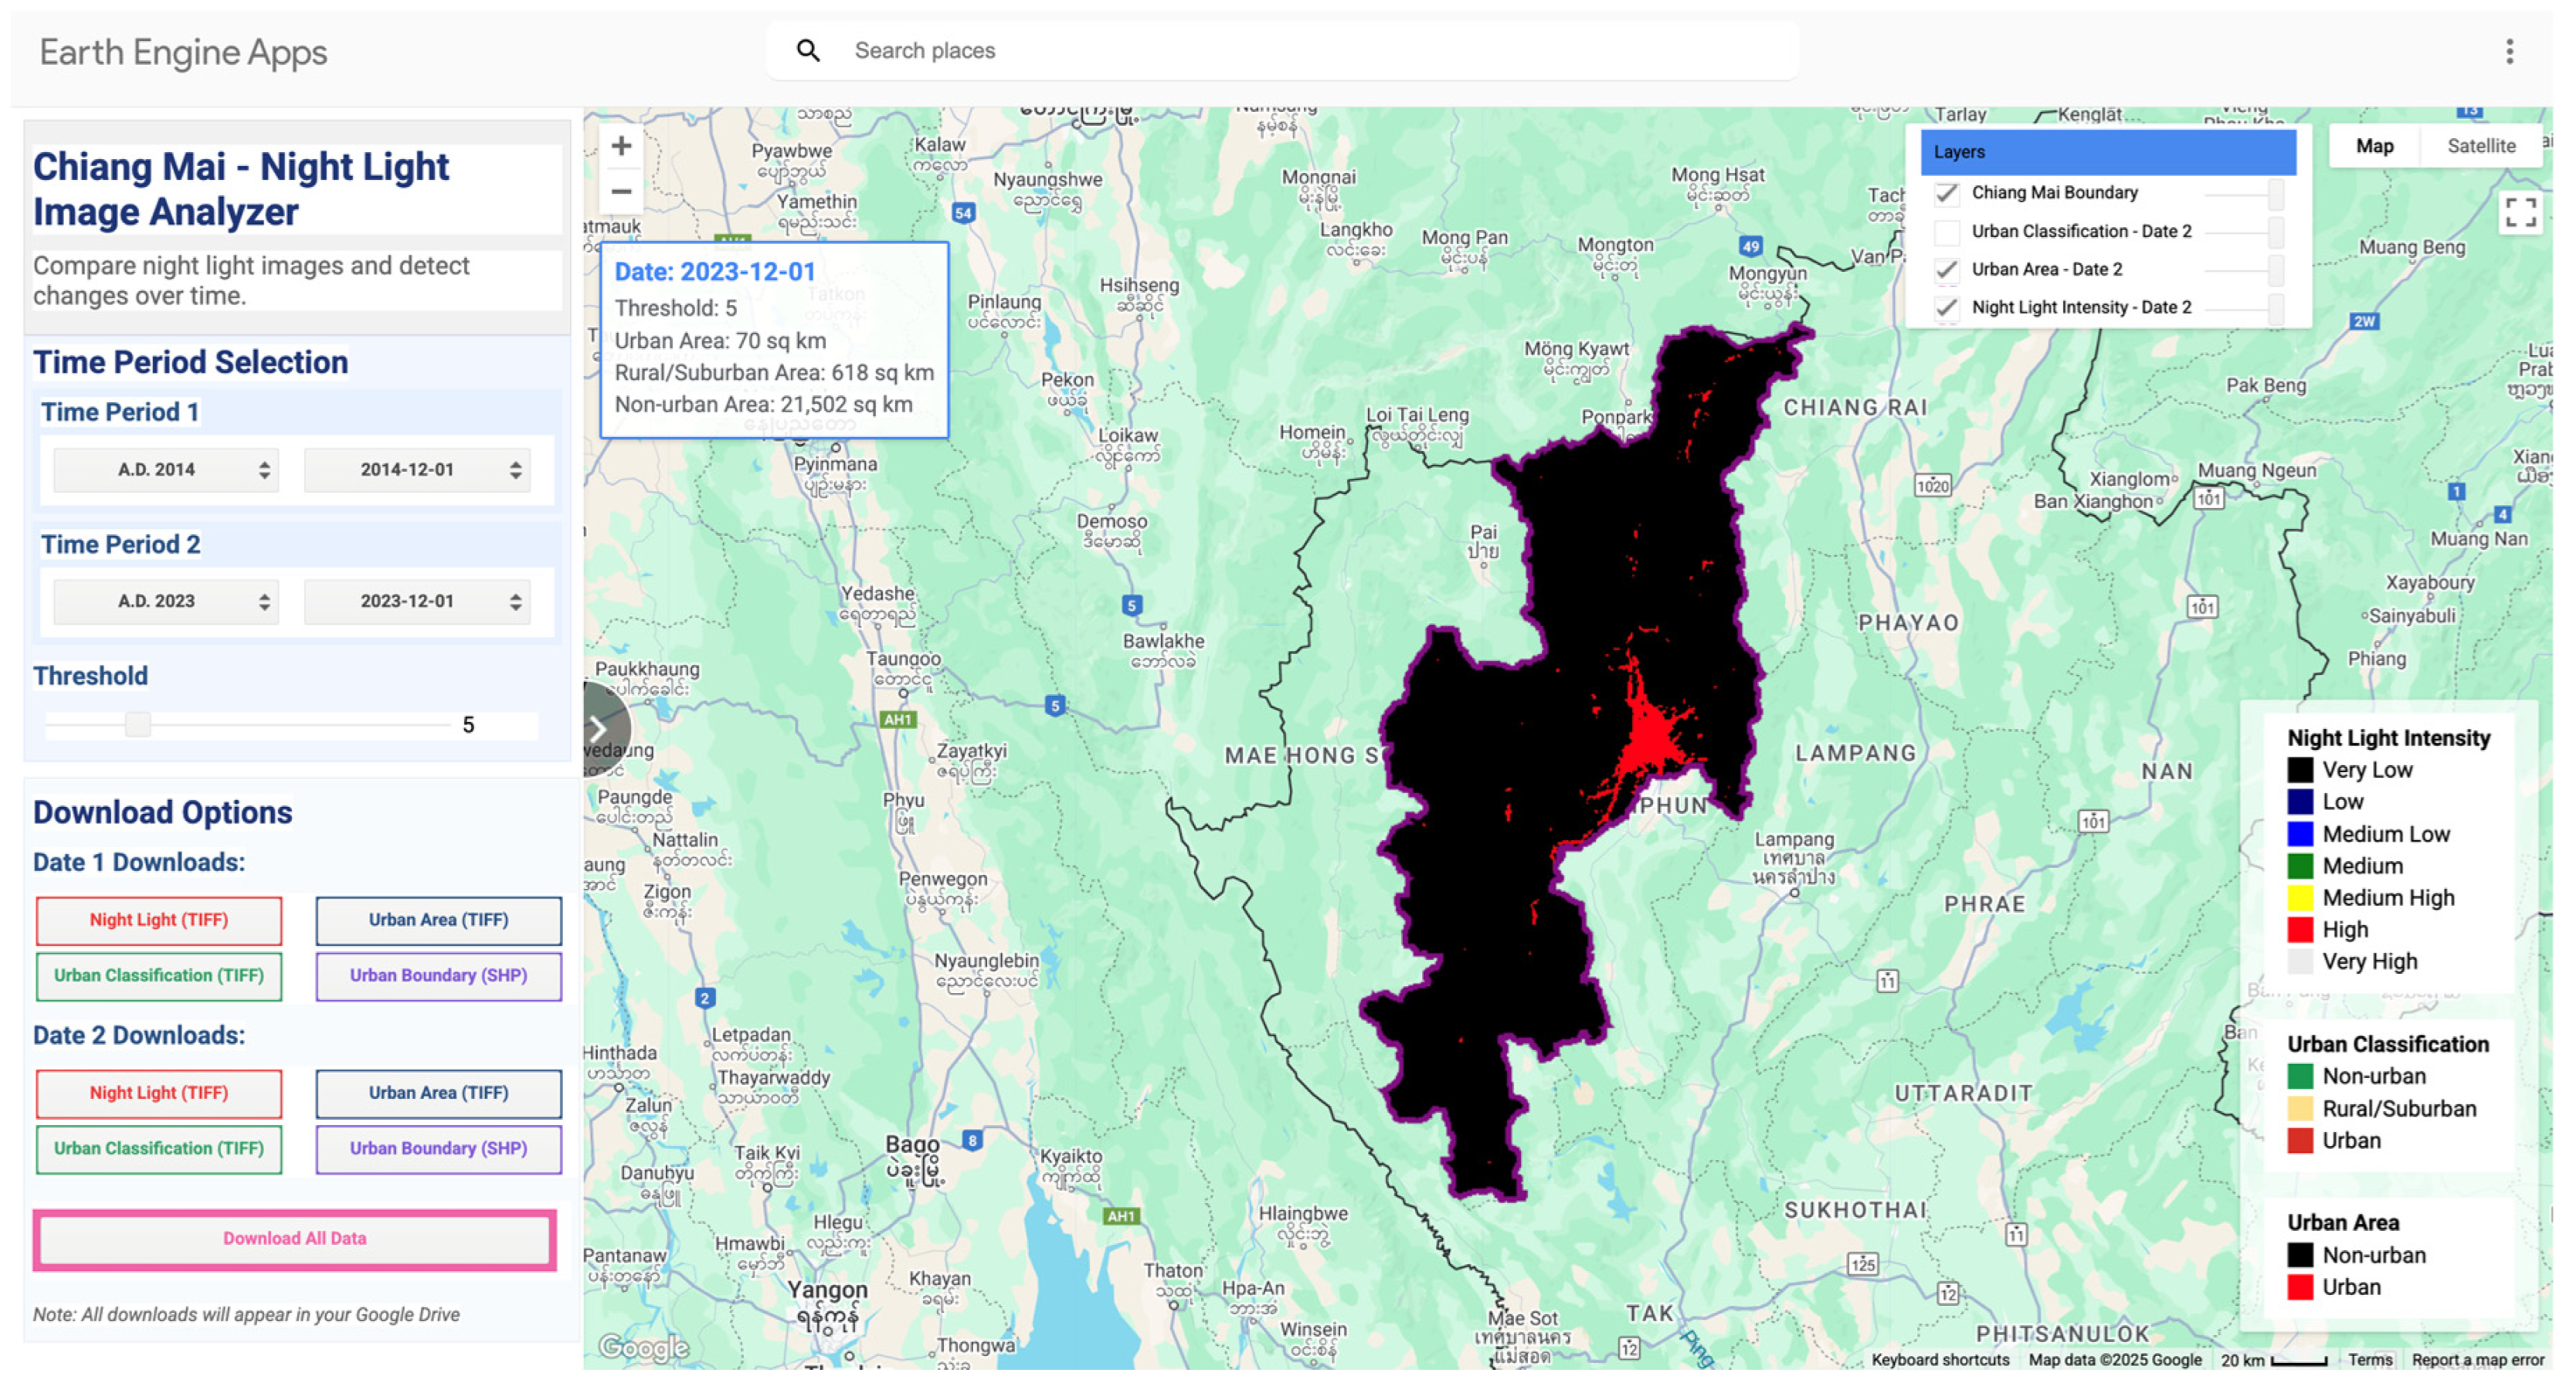
3.4. Image Processing: Urban Classification and Visualization

This study employs a dual-processing approach to classify nighttime light data, utilizing two distinct analytical pathways: the GEE platform and traditional geospatial software. In the traditional software pathway, the process begins with normalization followed by UNSUP. In contrast, GEE offers cloud-based processing capabilities, enabling efficient handling of large datasets. The results from both processing approaches support a comprehensive analysis of nighttime light patterns and are subsequently evaluated using multiple accuracy validation metrics.

GEE-Based Threshold Classification

This research introduces an approach for analyzing urban growth trends in Chiang Mai Province using VIIRS DNB nighttime light data, which has a spatial resolution of 463.83 m [5].
The study area is defined based on the FAO GAUL database, incorporating a 5000 m buffer zone to ensure comprehensive coverage of surrounding areas. The analysis leverages Google Earth Engine’s cloud-based processing capabilities, enabling automated data retrieval and processing from 2014 to the present using Earth Engine’s Date objects and List sequence operations.
For urban area analysis, the image processing framework employs two distinct classification techniques. The first method uses a binary classification algorithm to distinguish between urban and non-urban areas based on a single threshold. Areas with light intensity values below the threshold are classified as non-urban and visualized in black, while those exceeding the threshold are identified as urban and displayed in red. The second method implements a more detailed three-tier classification scheme based on measured light intensity thresholds. In this approach, areas are categorized into three classes: non-urban, rural/suburban, and urban. Non-urban areas have light intensity values below the initial threshold (t1); rural or suburban areas fall between the initial threshold (t1) and a higher threshold (t2); urban areas exceed the higher threshold (t2). These categories are color-coded in green, yellow, and red, respectively, providing a more comprehensive visualization of the urban landscape.
The interactive display system enables temporal comparison between two time periods using a split-screen interface and a slider for adjusting threshold values. This tool enhances analytical capabilities by allowing users to fine-tune classification parameters based on local conditions. A color-coded mapping technique is employed to facilitate the interpretation of urban growth trends. The framework ensures spatial accuracy using the EPSG:4326/WGS84 coordinate reference system at a native resolution of 463.83 m while generating standardized outputs in both raster and vector formats. Throughout the processing workflow, the proposed method preserves essential spatial and radiometric integrity, ensuring analytical accuracy and cross-platform compatibility [16].

3.5. K-Means Classification Analysis

Traditional geospatial processing systems use data normalization and unsupervised classification to analyze nighttime light data. They then begin with radiometric normalization using linear scaling transformation:
Normalized = (X − Xmin))/((Xmax − Xmin))
where X represents the original light intensity value, and Xmin and Xmax represent the minimum and maximum values in the dataset, respectively. By standardizing values to a 0–1 range, this normalizing criterion minimizes atmospheric and seasonal influences and guarantees consistent analysis throughout several temporal periods.
The normalized data are processed using unsupervised K-means classification, which initially segments the dataset into ten distinct classes based on patterns in light intensity. These classes are then consolidated into a two-category system: urban and non-urban, with higher light intensity values corresponding to urban areas. This two-step classification approach ensures that variations in light intensity are thoroughly captured before the final binary classification is applied.

3.6. Accuracy Assessment

The accuracy assessment methodology employs stratified random sampling with sample size calculation based on the following equation:
N = Z 2 ( p ) ( q ) E 2
where p represents expected accuracy (80%), q is its complement (20%), E is the acceptable error (±5%), and Z is 1.96 for a 95% confidence level [44]. Ensuring a comprehensive data assessment, the sampling points are strategically distributed across strata in a manner that is proportional to the map area coverage.
The validation technique employs multiple criteria to comprehensively assess the accuracy of urban area classification. The framework incorporates four key accuracy measures: overall accuracy, the Kappa coefficient, the producer’s accuracy, and the user’s accuracy. The interpretation of the Kappa coefficient follows the criteria established by Congalton and Green [45], which account for agreement expected by chance [36]: values above 0.80 indicate strong agreement, values between 0.40 and 0.80 indicate moderate agreement, and values below 0.40 reflect low agreement.
The validation process consists of two complementary components. The first component applies stratified random sampling, with its statistical reliability enhanced through Binomial Probability Theory [46]. The second component utilizes a two-level hierarchical classification system provided by the Land Development Department [41]. Level 1 establishes a basic urban/non-urban classification based on land use data from 2013, 2017, 2020, and 2023. Level 2 provides more detailed categorization, incorporating specific land use codes—U1 for urban built-up areas, and U2 to U7 for rural and suburban zones—using data from 2017, 2020, and 2023. This dual validation approach ensures a comprehensive evaluation of urban development patterns by integrating multiple accuracy metrics with temporally aligned land use validation data. As a result, it offers robust verification of the urban classification derived from nighttime light imagery.

3.7. Correlation Analysis

Pearson’s correlation coefficient is used to evaluate nighttime light intensity and electricity use. The equation for correlation coefficient (r) is as follows:
r = ( x i x ¯ ) ( y i y ¯ ) ( x i x ¯ ) 2   ( y i y ¯ ) 2
where x represents nighttime light intensity values, y represents electricity consumption values, and x ¯ and y ¯ are their respective means.
This statistical measure quantifies both the strength and direction of relationships on a scale from −1 to +1: values approaching +1 indicate a strong positive correlation (variables increase together), values near −1 represent a strong negative correlation (one variable increases as the other decreases), and values close to 0 suggest weak or no correlation between variables.

4. Results

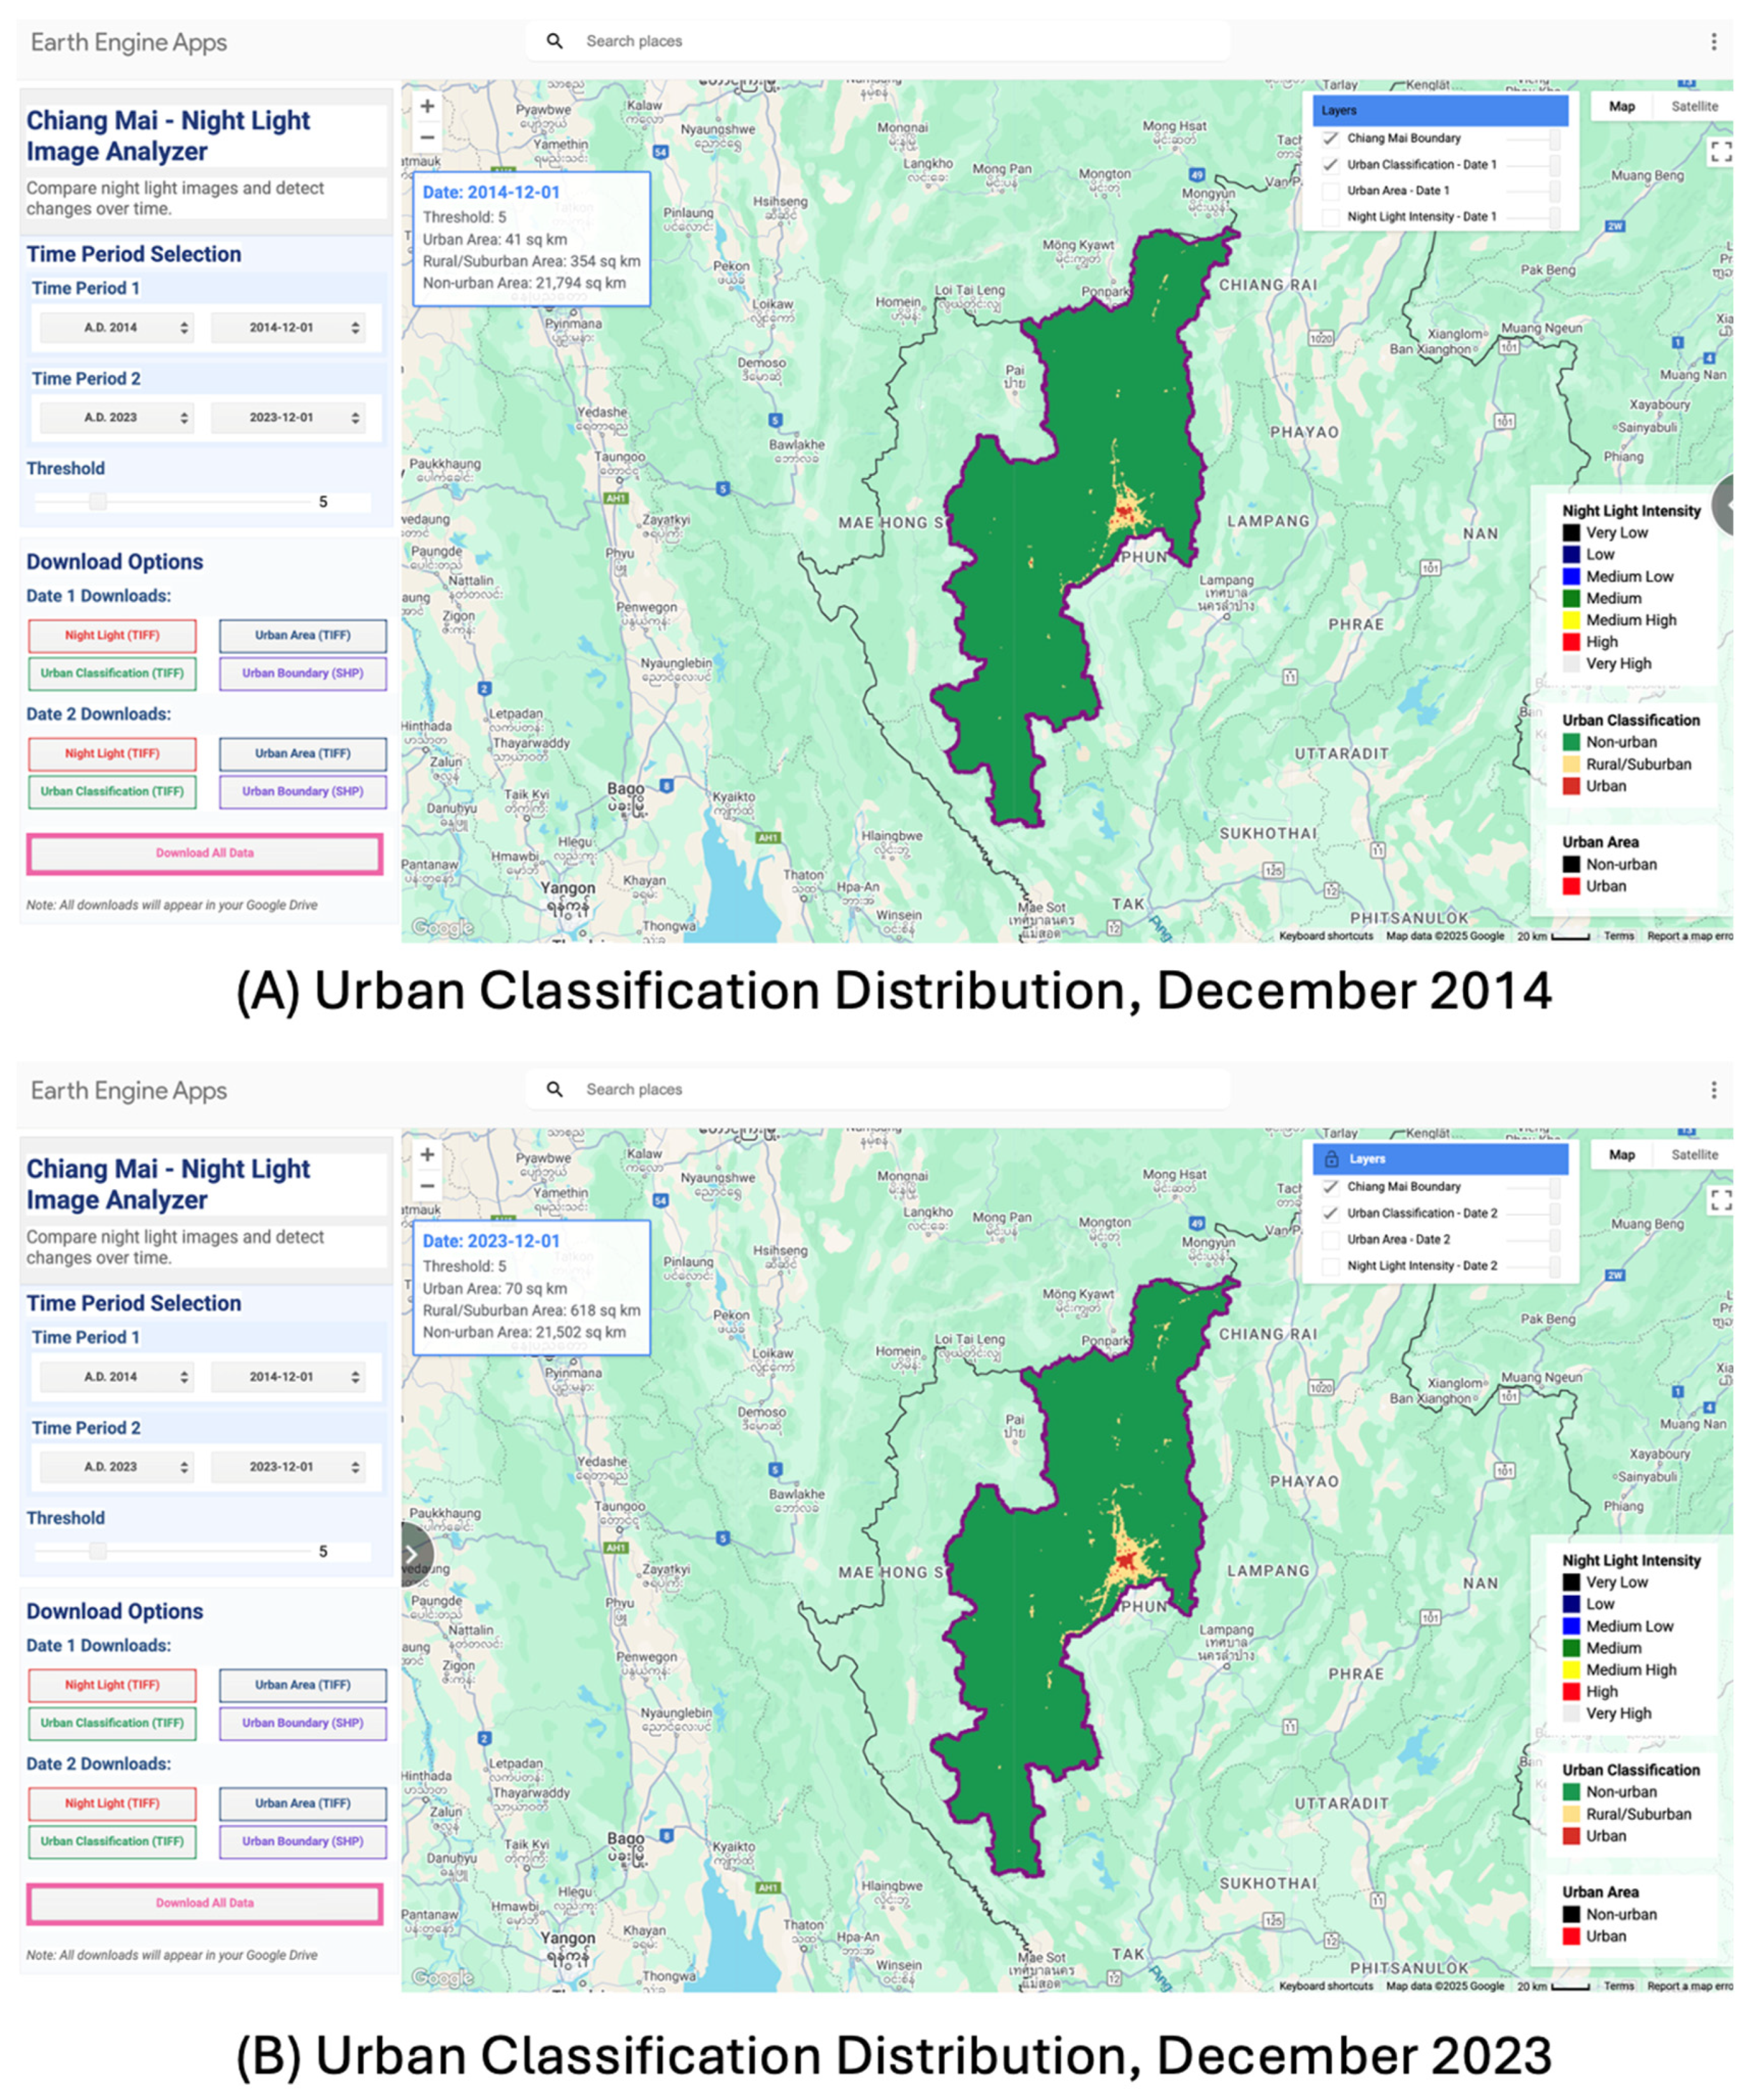
4.1. Temporal Analysis of Urban Development

A temporal analysis of urbanization in Chiang Mai Province from 2014 to 2023 using VIIRS imagery reveals significant trends in urban growth and transformation. This comprehensive study demonstrates how urban development patterns have shifted markedly over the past decade, utilizing two distinct classification techniques—GEE and UNSUP. Figure 3 effectively illustrates the spatial and temporal dynamics of urban expansion, highlighting how the integration of multiple methodologies contributes to a more holistic understanding of urbanization in Chiang Mai.
The Chiang Mai—Nighttime Light Image Analyzer platform features an advanced image processing framework that implements a dual-threshold method for urban area classification using the GEE approach. This method employs two key thresholds, T1 and T2. T1, a user-adjustable parameter, serves as the primary criterion for distinguishing between urban and non-urban areas, with a default value set at 5. To further differentiate between urban and rural/suburban regions, T2 is consistently defined as a fixed multiple of T1—specifically, five times its value. This dual-threshold approach enables a more accurate classification of urban landscapes by capturing the transitional gradient from rural to urban areas. By allowing users to adjust T1 while maintaining a fixed proportional relationship between T1 and T2, the GEE-based framework remains flexible and adaptable to varying levels of light intensity across different images or time periods. Such adaptability ensures consistent relative distinctions among urban, suburban, and rural areas, making this approach particularly effective for long-term analysis of urban development patterns.
Using the GEE method, the analysis of VIIRS nighttime light imagery (Figure 4) reveals substantial urban expansion in Chiang Mai Province. The delineation of urban areas (Figure 5) and the light intensity patterns (Figure 4) both indicate a noticeable increase in urban coverage by December 2023. The nighttime light intensity map, ranging from extremely low to very high values, clearly illustrates varying degrees of light emissions, with the highest concentrations observed in the central part of the province. In December 2014 (Figure 6A), urban classification results show approximately 41 square kilometers of urban core areas—defined by high-intensity light emissions (displayed in red); 354 square kilometers are classified as rural/suburban (in yellow); the remaining 21,794 square kilometers are designated as non-urban (in green). As shown in Figure 6B, urban areas expanded to 70 square kilometers, rural/suburban areas increased to 618 square kilometers, and non-urban areas decreased to 21,502 square kilometers.
Significant urbanization is particularly evident in the central region of the province—where light intensity values are highest—as well as along major transportation corridors and in areas that were previously classified as rural. This transformation reflects a 70% increase in urban areas over the study period. The transition shown in Figure 6A,B effectively illustrates the scale of urban transformation that occurred in Chiang Mai Province over the past decade, as further supported by the detailed light intensity distribution in Figure 4 and the urban delineation in Figure 5.
The UNSUP learning approach utilizes k-means clustering, a machine learning algorithm that categorizes similar observations into clusters for the classification of urban regions without predetermined criteria. This method facilitates pattern recognition in data necessitating user involvement; however, it may lack the customized control provided by the GEE approach. In the present research, the GEE technique outperforms the alternative strategy due to its capacity to incorporate expert knowledge via user-defined criteria and maintain temporal consistency. The dual-threshold technique, particularly effective in delineating the intricate urban growth patterns of Chiang Mai, facilitates a more precise distinction between urban suburban/rural and non-urban areas.
Table 2 provides a statistical comparison of urban area classification in Chiang Mai province with GEE and UNSUP techniques from 2014 to 2023, emphasizing trends at three-year intervals (2014, 2017, 2020, and 2023). The spatial analysis indicates substantial congruence between the two classification systems, with metropolitan areas (depicted in red) exhibiting similar distribution patterns in both methodologies. The province’s core houses the primary urban center, where significant transportation routes in a north-south orientation facilitate development. Temporal variations indicate ongoing urban growth, especially in regions adjacent to the initial urban nucleus. Previously fragmented metropolitan areas have progressively consolidated into increasingly cohesive urban areas, especially throughout the 2020–2023 decade.

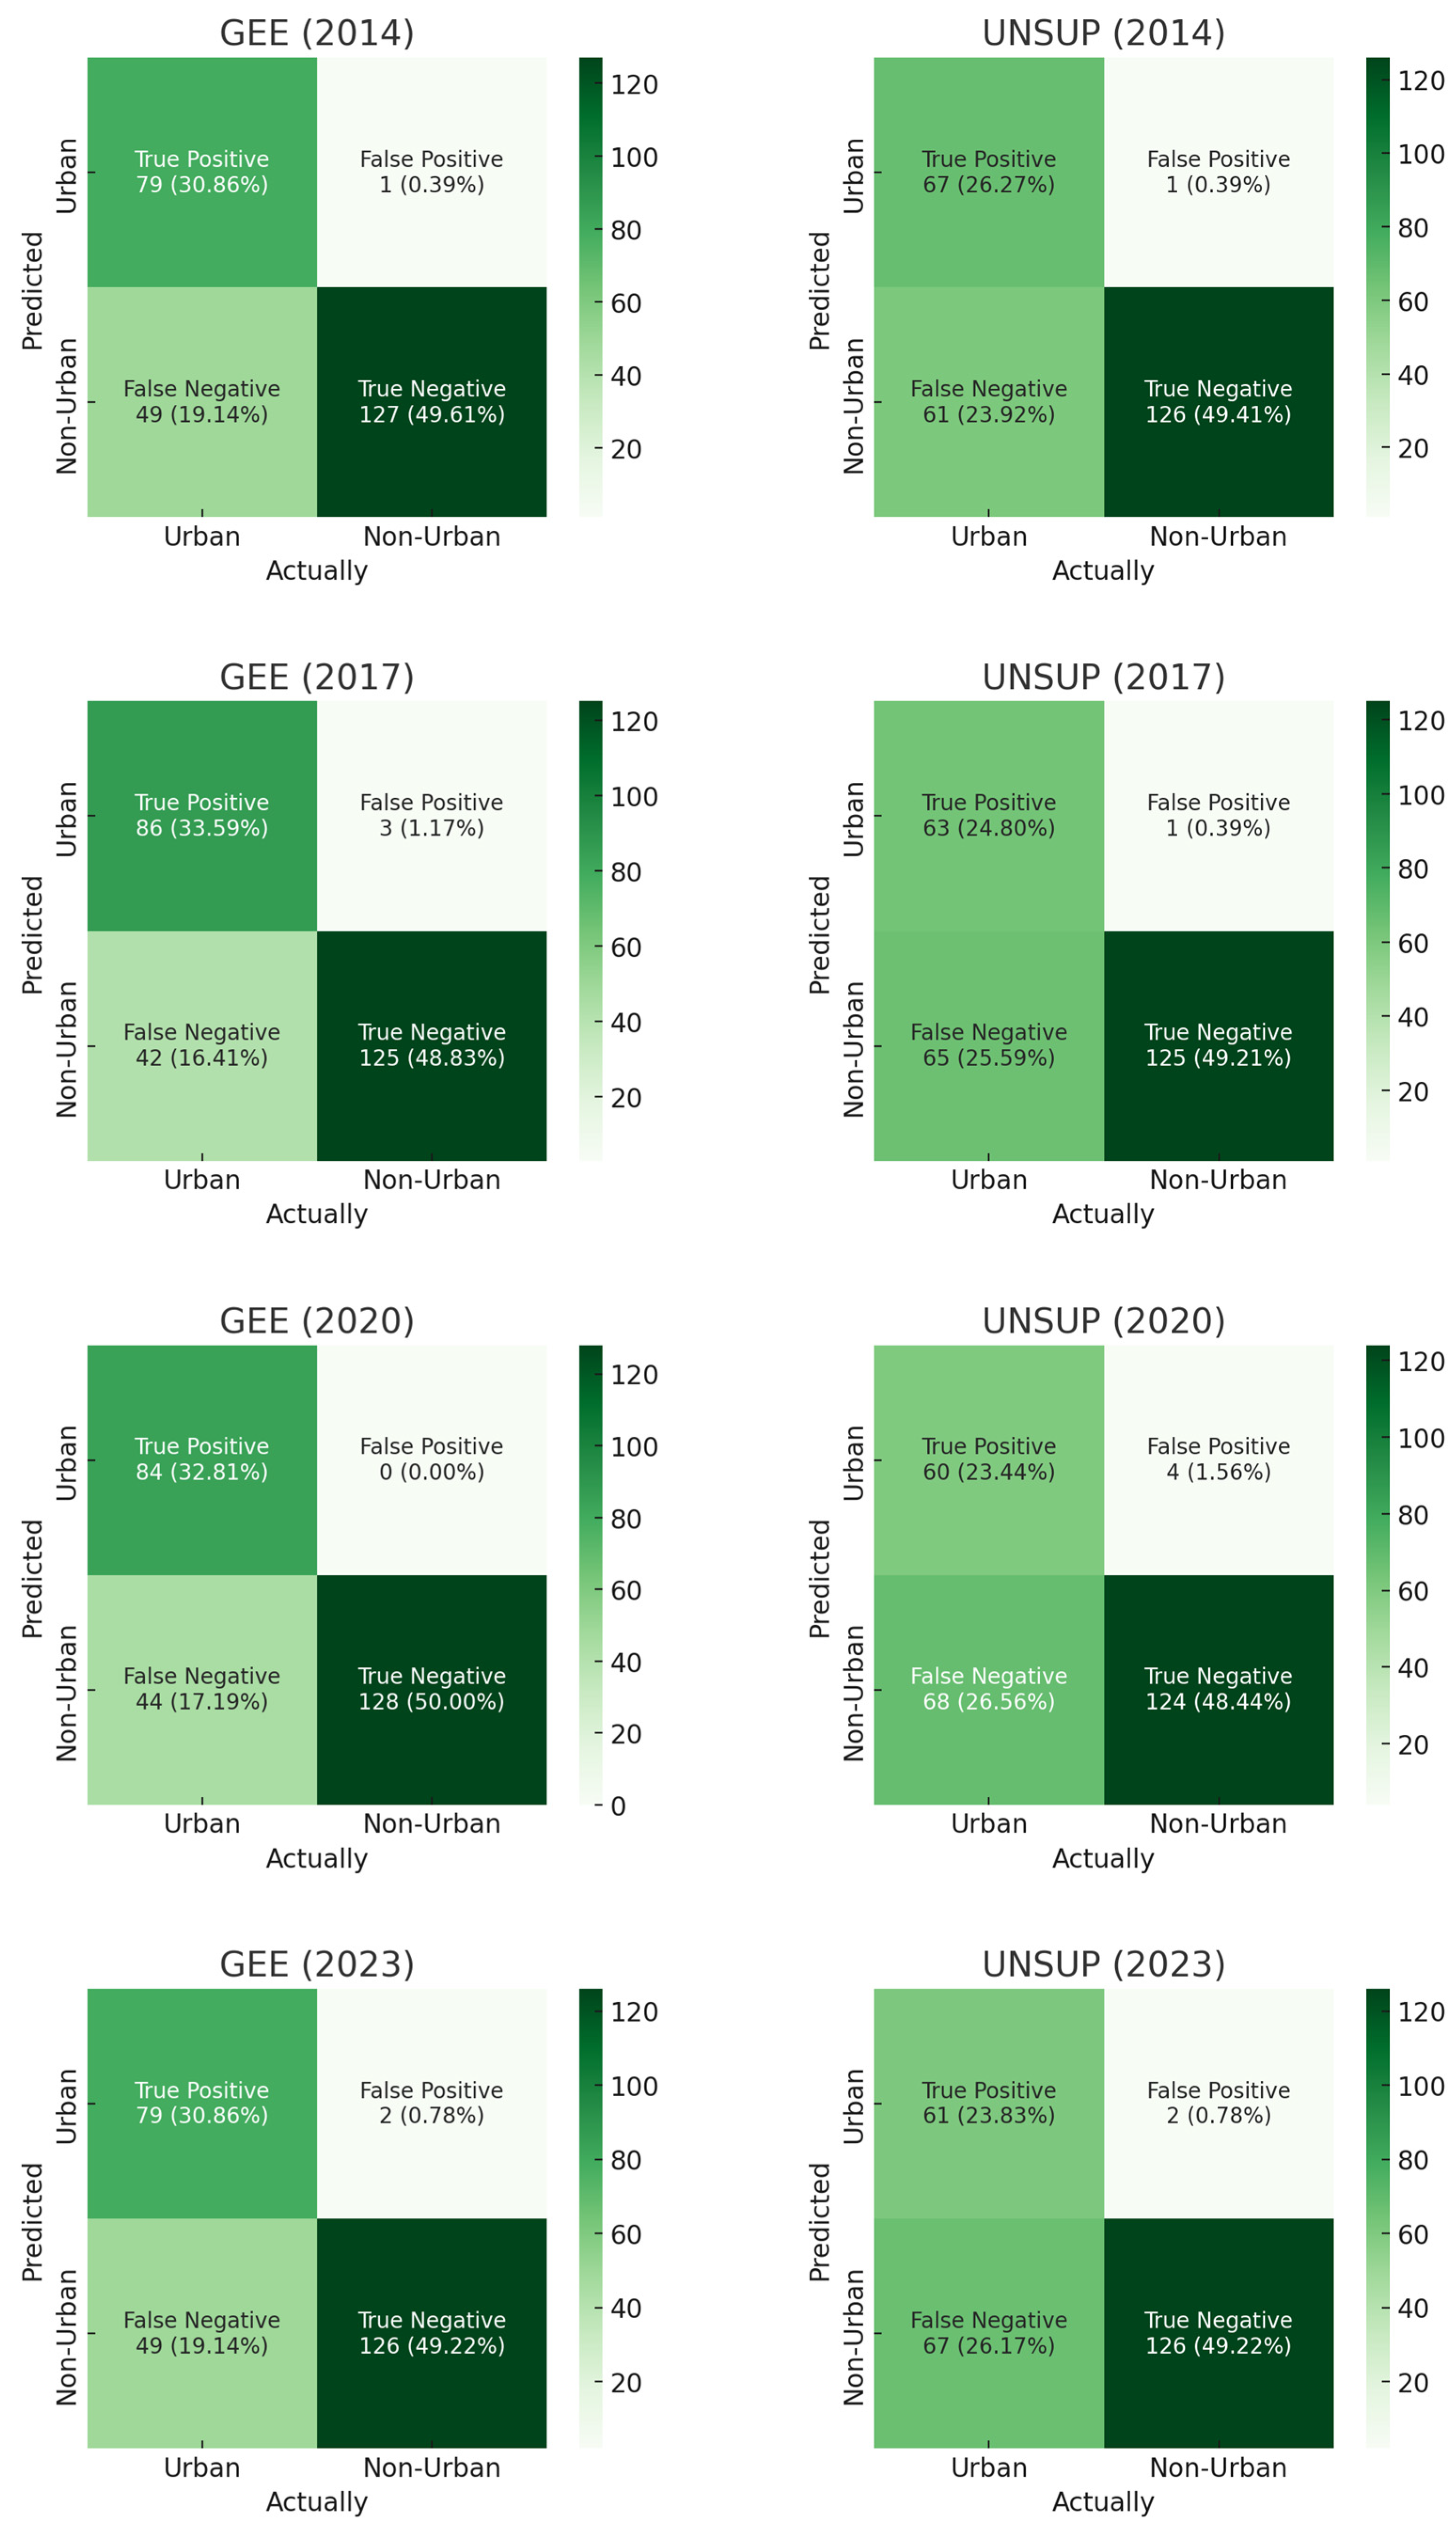
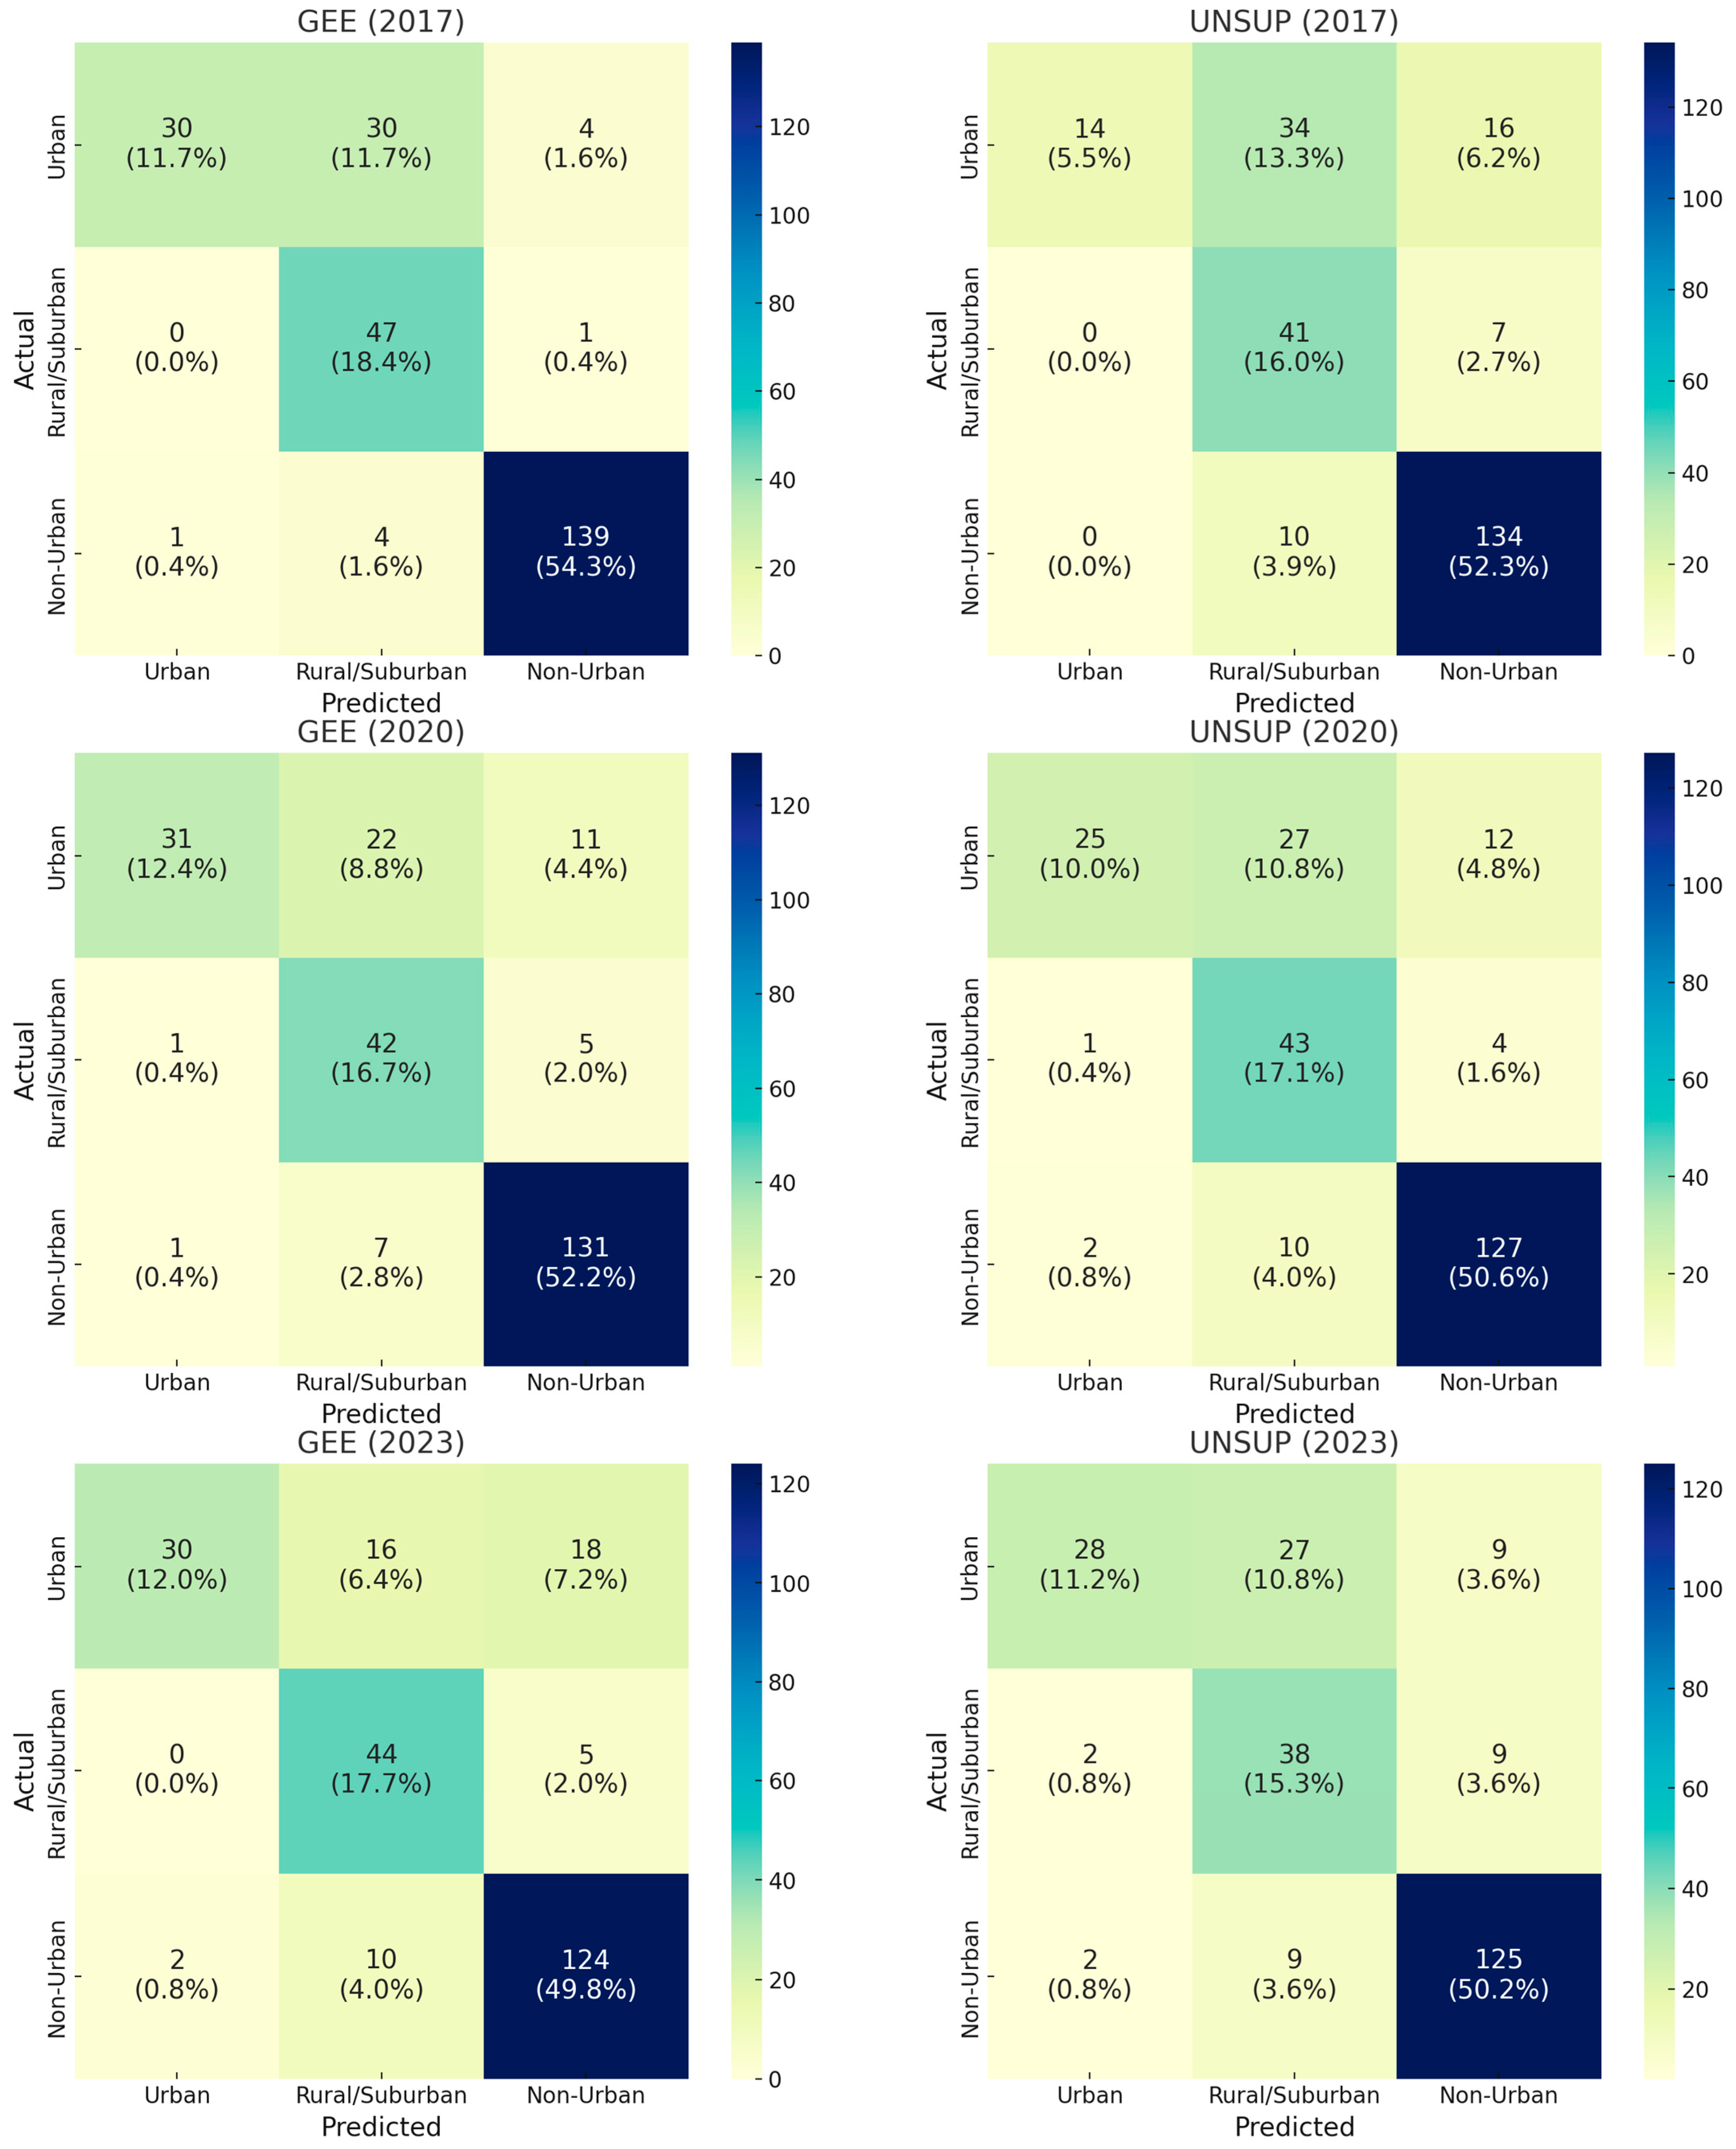
4.2. Accuracy Assessment of Urban Area Classification Methods

The accuracy assessment of urban area classification techniques is a critical indicator of the efficacy of GEE and UNSUP during the 2014–2023 research period. The research demonstrates that the GEE threshold-based technique consistently outperforms the UNSUP approach, as evidenced by 256 stratified random sampling points.
The GEE approach maintained a greater overall accuracy throughout the study period, ranging from 0.80 to 0.83, for the Level 1 classification (urban/non-urban) displayed in Table 3, whereas UNSUP displayed a dropping accuracy, ranging from 0.76 to 0.72. This difference is further shown by the Kappa coefficient values, which show that GEE achieves values between 0.60 and 0.66, which are substantially higher than UNSUP’s range of from 0.44 to 0.51. This discrepancy suggests that the GEE approach performs better in terms of classification.
According to the Producer’s Accuracy criterion, both methods exhibit outstanding effectiveness in urban area detection, with GEE consistently maintaining values over 0.97 and reaching as high as 1.00 in 2020. In contrast to UNSUP’s decreasing trend from 0.67 to 0.65, GEE showed noticeably superior performance in non-urban region classification, keeping accuracy around 0.72–0.75.
Table 4 demonstrates that, with a reduced overall accuracy due to the higher categorization complexity, both approaches detected the Level 2 classification—which includes the rural/suburban classification. The UNSUP method exhibited a decline in accuracy from 0.67 to 0.60, while the GEE method maintained a relatively consistent performance with an overall accuracy of 0.67–0.69. Producer’s Accuracy values for GEE and UNSUP ranged from 0.38 to 0.47 and from 0.10 to 0.46, respectively, indicating that the most difficult aspect of both methodologies was the precise classification of rural/suburban areas.
A notable strength of the GEE method is its consistent performance over time, particularly in urban area detection, where it achieved Producer’s Accuracy values increasing from 0.76 to 0.85 in Level 2 classification. This trend indicates that the method’s capacity to adjust to changing urban patterns through its dual-threshold approach may have improved as the study period progressed, as evidenced by its increased ability to differentiate urban areas.
The temporal analysis reveals that, while both methods maintained high accuracy in identifying non-urban areas (User’s Accuracy above 0.96), the GEE method demonstrated superior performance in urban area classification, particularly in recent years. This superiority is evidenced by the higher Kappa coefficients and more stable overall accuracy values, indicating better agreement between classification results and ground truth data.
Figure 7 illustrates the detailed confusion matrices for both GEE and UNSUP classification methods across the four key years of the study 2014, 2017, 2020, and 2023. These matrices provide a visual summary of the classification outcomes by depicting the number and percentage of correctly and incorrectly classified urban and non-urban areas.
The GEE method consistently demonstrates a higher number of true positives (urban areas correctly identified) and true negatives (non-urban areas correctly identified), along with lower false negatives and false positives compared to the UNSUP method. For instance, in 2020 and 2023, the GEE model recorded a notably higher number of urban classifications that matched the reference data, whereas the UNSUP method exhibited larger counts of misclassified urban areas—reflected by elevated false negatives.
This consistent pattern across the confusion matrices reinforces the quantitative findings reported in Table 3 and Table 4, confirming that the GEE dual-threshold approach offers superior performance in both binary (Level 1) and multi-class (Level 2) classification tasks. The stronger classification accuracy of GEE is particularly apparent in its ability to reduce misclassification between urban and rural/suburban transition zones—a challenge frequently observed in automated clustering methods like UNSUP.
Furthermore, the confusion matrices visually support the statistical validity of the classification outcomes, in alignment with McNemar’s test results, which indicate statistically significant differences between the two methods for all years analyzed. This underscores the robustness and reliability of the GEE approach in monitoring temporal urban changes through satellite-based nighttime light data.
To further support the comparative evaluation of classification performance between the GEE and UNSUP methods, McNemar’s test was conducted using matched classification results derived from stratified random sampling and confusion matrices across the years 2014, 2017, 2020, and 2023. This non-parametric test is designed to assess whether the differences in classification outcomes between two related classifiers are statistically significant.
The test specifically examines two key parameters:
  • b—instances where GEE correctly classified the urban/non-urban label while UNSUP misclassified it;
  • c—instances where UNSUP correctly classified but GEE misclassified.
As shown in Table 5, the number of b cases substantially exceeded c in all years, with c equal to zero throughout this study. This reflects the fact that GEE consistently produced more accurate classifications than UNSUP.
The results reveal p-values well below the 0.05 significance threshold for every year, confirming that the performance differences between the two methods are statistically significant and not due to random chance. This statistical validation aligns with the accuracy metrics, Kappa coefficients, and confusion matrix visualizations (Figure 7), further reinforcing the superiority and reliability of the GEE dual-threshold approach in urban area classification.
To further validate the performance differences between the GEE and UNSUP classification techniques at a more detailed level, a Level 2 classification scheme was applied to distinguish among urban, rural/suburban, and non-urban areas. The confusion matrices generated from this classification are presented in Figure 8, which illustrates the classification results for the years 2017, 2020, and 2023.
As seen in Figure 8, the GEE method consistently outperformed the UNSUP approach in correctly classifying urban areas across all three years. The GEE demonstrated higher true positive rates and fewer misclassifications, particularly in the urban class, where it showed better distinction from rural/suburban transitions. In contrast, the UNSUP method displayed a tendency to confuse urban areas with adjacent rural/suburban regions, leading to higher false negatives and reduced overall accuracy.
To statistically assess the differences between the two classification methods, McNemar’s test was employed using binary recoding of the Level 2 urban classification results (urban vs. non-urban). The outcomes of these tests are summarized in Table 6. The test results indicated a statistically significant difference in performance between GEE and UNSUP in 2017 (p = 3.05 × 10⁻⁵) and 2020 (p = 0.03125), affirming that GEE produced superior classification results in these years. However, for 2023, the p-value was 0.5, indicating no statistically significant difference between the two methods during that year.
This trend suggests that while GEE maintained relatively consistent performance across the study period, the accuracy gap between the two methods may have narrowed in more recent years. The decrease in significance in 2023 may be attributed to increasing classification challenges in newly developed urban fringe areas, where spectral characteristics overlap more substantially with suburban landscapes.

4.3. Correlation Between Nighttime Light Intensity and Electricity Consumption

Using strong coefficients of determination (R2), the correlation analysis between nighttime light intensity and electricity consumption reveals a strong positive relationship for both the GEE and UNSUP classification systems. The GEE approach demonstrates a robust correlation with R2 = 0.9744, while the UNSUP method yields a slightly lower, yet still high, correlation of R2 = 0.9659. Scatter plots over the study period clearly illustrate a linear relationship between electricity consumption and the number of brightened pixels. With data points closely aligned along the regression line, both methods consistently show a strong positive correlation between urban development—indicated by nighttime light intensity—and energy consumption patterns.
The correlation analysis (Figure 9) for the GEE method shows that measurement points are more evenly distributed along the regression line, indicating a steadier and more predictable relationship between light intensity and electricity consumption. This trend aligns with the dual-threshold approach used in GEE, which provides a more precise delineation of urban areas. The linear relationship spans from 2500 to 3800 pixels, corresponding to electricity consumption values ranging from 2000 to 5000 units, suggesting a continuous scaling behavior.
Although the UNSUP method yields a slightly higher R2 value, its scatter plot shows greater dispersion, particularly at the upper end of the distribution. This scattering may indicate that the automated clustering process is more sensitive to fluctuations in light intensity, leading to less stable results in certain cases.
Overall, these high correlation coefficients support the reliability of using nighttime light intensity as a proxy for urban growth and energy consumption. The strong linear relationships observed in both methods underscore the validity of satellite-derived nighttime light data for monitoring and assessing urban development trends—particularly in rapidly expanding metropolitan regions.

5. Discussion

A comparison between the GEE and UNSUP techniques highlights the contrast between expert-guided and fully automated classification algorithms in delineating metropolitan areas. The GEE method’s dual-threshold classification system demonstrates superior performance, achieving accuracy scores between 0.80 and 0.82—surpassing those of fully automated urban analysis approaches. According to Biłozor et al. [47], complex spatial patterns necessitate the use of expert systems in geographic analysis and decision-making. This is reflected in the GEE dual-threshold system, which benefits from structured expert input and consistently outperforms the UNSUP method. The GEE system achieves higher Kappa coefficient values (0.60–0.65) compared to the automated UNSUP approach (0.44–0.52), indicating more reliable urban classification outcomes. Methodological challenges in urban studies become particularly evident when addressing rural–suburban transitional zones. These areas, as described by Biłozor et al. [48], represent “lumpy rural–urban continuums” that resist simple urban–rural classification, often rendering binary classification methods ineffective. Hutchings et al. [49] emphasize that such transitional zones require analysis using satellite imagery in combination with socioeconomic indicators and expert-driven interpretation. Incorporating these elements into the classification framework enhances the identification and monitoring of transitional areas, which is especially important in rapidly urbanizing regions where conventional classification techniques frequently fall short. Furthermore, to improve the classification accuracy of peri-urban zones, future studies could integrate supplementary spatial datasets such as road networks, socio-economic indicators, and topographical information. These additional layers would provide a richer contextual understanding of spatial dynamics and enable better delineation of rural–urban transition areas, especially in rapidly developing regions where binary classifications often fail to capture complexity.
Alternative unsupervised classification methods, such as ISODATA and fuzzy clustering, also offer valuable potential for urban mapping. ISODATA provides flexible cluster formation through iterative merging and splitting, which can adapt to heterogeneous urban landscapes. Fuzzy classification, on the other hand, allows for gradual membership between classes, making it especially useful for capturing the rural-urban continuum. However, both methods require more intensive parameter tuning and computational resources, which can be challenging for large-scale, multi-temporal studies. In contrast, K-means offers simplicity and speed, while dual-thresholding in GEE provides an expert-guided balance of automation and accuracy. The current study prioritizes practical implementation and generalizability, hence the selection of K-means and dual-threshold techniques. Future research may benefit from comparing these methods in more detail, especially in transitional zones with ambiguous land cover characteristics.
Multiple studies have identified a significant association between nighttime light intensity and electricity consumption. Zhu et al. [50] reported a strong correlation between nighttime light data and energy usage, particularly in developing countries, although regional variability can influence the strength of this relationship. According to an IMF study [51], nighttime light data exhibit a clear linear relationship with electricity consumption across both extensive and intensive scales, making them a reliable proxy for tracking urban growth trends. In a case study conducted in Lagos, Gilbert and Shi [7] emphasized the need for integrated methodologies that incorporate multiple data sources for comprehensive urban research. While nighttime light data effectively capture urban expansion, their study concluded that a full understanding of urban growth dynamics also requires additional information—such as population density, land use changes, and climate conditions—to provide a more nuanced and accurate assessment.
Future studies on urban development using nighttime light imagery present several promising avenues for exploration. One potential direction involves investigating seasonal variations [52,53,54], which could uncover temporal patterns in urban activity and energy consumption that are often overlooked in annual assessments. In regions with distinct seasonal characteristics, such analyses may reveal key cyclical patterns in urban dynamics. Another critical area for advancement lies in the application of adaptive thresholding algorithms to improve urban area delineation. These algorithms could dynamically adjust to varying lighting conditions and urban morphologies, enhancing the classification of urban, suburban, and rural zones. Such advancements would be particularly beneficial in complex metropolitan environments or areas experiencing rapid development. Integrating socio-economic indicators into the analytical framework would further enhance understanding of urban growth and economic dynamics. This integration could reveal patterns of inequality, identify urban growth hotspots, and clarify factors influencing expansion. Additionally, the relationship between nighttime light intensity and urban morphology could be expanded to include variables such as population density, land use changes, and infrastructure development, providing deeper insights into the urbanization process [55]. This study examines the consistent use of nighttime light data from December across all years to ensure temporal comparability. However, it is acknowledged that relying on a single month may introduce seasonal biases due to factors such as festival lighting, atmospheric clarity, or seasonal economic activities. These factors can influence light intensity independently of actual urban growth. Incorporating multi-month or seasonal composites in future studies could mitigate such effects and enhance the robustness and reliability of classification results.
Machine learning offers significant potential for improving classification accuracy in complex urban environments. One of the major challenges of current classification approaches lies in accurately identifying and characterizing suburban transition zones. This limitation could be addressed by advanced algorithms capable of capturing the subtle gradients between urban and rural areas, thereby enabling more precise delineation of transitional regions. Real-time monitoring tools available through Google Earth Engine present valuable opportunities for the continuous assessment of urban growth. These tools could allow stakeholders to track and respond to urban trends in real-time, thereby enhancing the responsiveness and effectiveness of urban planning and policy-making processes. By incorporating multiple data sources, such systems could dynamically update information related to urban expansion, energy consumption, and environmental impacts. Sustainable urban planning would further benefit from forecasting capabilities that predict future urban expansion and associated carbon emissions. This could be achieved through the development of integrated models that combine urban growth projections with climate change scenarios, ultimately supporting more informed decision-making in urban development and environmental management [56].
Although the differences in overall accuracy between the GEE and UNSUP methods were not substantial in some individual years, the GEE method exhibited more consistent performance across multiple metrics, including the Kappa coefficient and producer’s accuracy, particularly for non-urban classifications. This consistency supports its relative robustness and reliability for large-scale urban monitoring.
The findings of this study have several practical implications for urban planning and policy. First, the identification of urban growth patterns using nighttime light data can assist in refining land-use zoning policies in rapidly expanding areas, helping planners anticipate and manage urban sprawl. Second, the demonstrated correlation between light intensity and electricity usage provides a potential framework for integrating energy consumption forecasting into infrastructure and utility planning. Finally, the application of GEE-based classification methods supports the development of real-time monitoring systems for urban management, enabling authorities to make data-driven decisions and respond proactively to dynamic urban changes.

6. Conclusions

This study demonstrates the effectiveness of different methodological approaches in analyzing urban expansion patterns in Chiang Mai province using nighttime light imagery. The comparative analysis of GEE and UNSUP provides significant insights that align with the research objectives. The GEE approach, utilizing a dual-threshold classification methodology, yields more consistent and reliable results in delineating urban areas. Notably, GEE maintains an accuracy level of from 0.80 to 0.82, ensuring stability over time and supporting long-term urban growth monitoring.
The validation of urban area classification accuracy highlights a strong performance for both methodologies, with the GEE consistently outperforming the UNSUP. The Kappa coefficient values for the GEE range between 0.60 and 0.65, compared to between 0.44 and 0.52 for the UNSUP, indicating a stronger agreement with ground truth data. Additionally, the Producer’s and User’s Accuracy metrics confirm the superior effectiveness of the GEE in distinguishing between urban and non-urban areas.
Furthermore, both methodologies exhibit a high correlation between nighttime light intensity and electricity consumption (R2 = 0.9744 for GEE and R2 = 0.9759 for UNSUP). This strong relationship suggests that nighttime light data can serve as a reliable proxy for predicting urban expansion and energy consumption, offering a robust foundation for urban growth monitoring.
Limitations and Future Recommendations
Despite this study’s contributions, certain limitations necessitate further investigation:
  • Classification Challenges in Rural/Suburban Areas
While both methodologies perform well in urban and non-urban classifications, their accuracy decreases when identifying transitional zones between urban and rural areas. Future studies should explore hybrid classification techniques or incorporate ancillary geospatial datasets to improve accuracy in these regions.
2.
Integration of Socioeconomic Factors
Although this study establishes a strong correlation between electricity consumption and nighttime light intensity, incorporating socioeconomic data would provide deeper insights into urban development trends. Future research should integrate population density, economic indicators, and land use change dynamics to enhance the explanatory power of the model.
3.
Seasonal Variations in Nighttime Light Intensity
While this study effectively captures major urban expansion patterns, variations in seasonal nighttime light intensity could improve the temporal resolution of the analysis. Investigating seasonal fluctuations would provide a more comprehensive understanding of urban growth dynamics and temporal drivers.

Author Contributions

Conceptualization, Thidapath Anucharn; methodology, Thidapath Anucharn, Phongsakorn Hongpradit, Niti Iamchuen, and Supattra Puttinaovarat; software, Thidapath Anucharn, Phongsakorn Hongpradit, and Niti Iamchuen; validation, Thidapath Anucharn and Niti Iamchuen; formal analysis, Thidapath Anucharn and Niti Iamchuen; writing—original draft preparation, Thidapath Anucharn, Supattra Puttinaovarat, and Niti Iamchuen; writing—review and editing, Thidapath Anucharn, Phongsakorn Hongpradit, Niti Iamchuen, and Supattra Puttinaovarat; visualization, Thidapath Anucharn, Phongsakorn Hongpradit, Niti Iamchuen, and Supattra Puttinaovarat. All authors have read and agreed to the published version of the manuscript.

Funding

This research received no external funding.

Data Availability Statement

Data are available on request to the authors.

Acknowledgments

The authors express their gratitude to Google Inc., and Land Development Department for providing the remotely sensed data utilized in this study.

Conflicts of Interest

The authors declare no conflicts of interest.

References

  1. United Nations. Transforming Our World: The 2030 Agenda for Sustainable Development; United Nations: New York, NY, USA, 2015; Available online: https://sdgs.un.org/2030agenda (accessed on 12 July 2024).
  2. Pradhan, P.; Costa, L.; Rybski, D.; Lucht, W.; Kropp, J.P. A Systematic Study of Sustainable Development Goal (SDG) Interactions. Earth’s Future 2017, 5, 1169–1179. [Google Scholar] [CrossRef]
  3. United Nations Economic and Social Commission for Asia and the Pacific. SDG 9: Industry, Innovation and Infrastructure; UNESCAP: Bangkok, Thailand, 2023; Available online: https://repository.unescap.org/handle/20.500.12870/5532 (accessed on 12 July 2024).
  4. United Nations Department of Economic and Social Affairs. Thailand—Voluntary National Review 2021; United Nations: New York, NY, USA, 2024; Available online: https://sustainabledevelopment.un.org/memberstates/thailand (accessed on 21 July 2024).
  5. Elvidge, C.D.; Baugh, K.; Zhizhin, M.; Hsu, F.C.; Ghosh, T. VIIRS Night-Time Lights. Int. J. Remote Sens. 2017, 38, 5860–5879. [Google Scholar] [CrossRef]
  6. Zheng, Q.; Seto, K.C.; Zhou, Y.; You, S.; Weng, Q. Nighttime Light Remote Sensing for Urban Applications: Progress, Challenges, and Prospects. ISPRS J. Photogramm. Remote Sens. 2023, 202, 125–141. [Google Scholar] [CrossRef]
  7. Gilbert, K.M.; Shi, Y. Nighttime Lights and Urban Expansion: Illuminating the Correlation between Built-Up Areas of Lagos City and Changes in Climate Parameters. Buildings 2023, 13, 2999. [Google Scholar] [CrossRef]
  8. Puggioni, F. Bridging Global Policy-Making and Local Intensive Developments in the Urban Voids of a Megacity: Insights from Bangkok. J. Archit. Plan. Res. Stud. 2024, 21, 345–360. [Google Scholar] [CrossRef]
  9. Chiang Mai Provincial Office. Information; Chiang Mai Provincial Office: Chiang Mai, Thailand, 2009. Available online: https://www.chiangmai.go.th/english/index.php/welcome/information (accessed on 6 July 2024).
  10. Thailand Convention & Exhibition Bureau. Regional Office; Thailand Convention & Exhibition Bureau: Bangkok, Thailand, 2022; Available online: https://www.businesseventsthailand.com/en/support-solution/regional-office/northernregionoffice (accessed on 2 July 2024).
  11. Digital Economy Promotion Agency. General Prawit Presided over The First Meeting of The Smart City Development Committee for The Year 2022; Digital Economy Promotion Agency: Bangkok, Thailand, 2022; Available online: https://www.depa.or.th/en/article-view/20221109_01 (accessed on 6 July 2024).
  12. Chiang Mai Provincial Office. Chiang Mai Smart City Strategy Plan; Chiang Mai Provincial Office: Chiang Mai, Thailand, 2019. Available online: https://www.chiangmai.go.th/managing/public/D2/2D11Sep2019090618.pdf (accessed on 6 July 2024).
  13. Irfan, M. Leveraging GIS for Analyzing Urban Spatial Interactions: A Case Study of City-Region Dynamics. Res. Gate 2024, 10, 1–10. [Google Scholar] [CrossRef]
  14. Nasr, T.; Ghalehteimouri, K.J.; Khedmatzadeh, A.; Mousavi, M.N.; Rajabi, A. Predicting Urban Green Infrastructures of Ecosystem Services in Tehran Metropolitan Area Sprawl with Landsat Satellite Time Series Data. J. Archit. Plan. Res. Stud. 2025, 22, 268554. [Google Scholar] [CrossRef]
  15. Bibri, S.E. Data-Driven Smart Sustainable Cities of the Future: An Evidence Synthesis Approach to a Comprehensive State-of-the-Art Literature Review. Sustain. Futures 2021, 3, 100047. [Google Scholar] [CrossRef]
  16. Gorelick, N.; Hancher, M.; Dixon, M.; Ilyushchenko, S.; Thau, D.; Moore, R. Google Earth Engine: Planetary-Scale Environmental Data Analysis for Everyone. Remote Sens. Environ. 2017, 202, 18–27. [Google Scholar] [CrossRef]
  17. Liu, S.; Wang, C.; Chen, Z.; Li, Q.; Wu, Q.; Li, Y.; Wu, J.; Yu, B. Enhancing Nighttime Light Remote Sensing: Introducing the Nighttime Light Background Value (NLBV) for Urban Applications. Int. J. Appl. Earth Obs. Geoinf. 2024, 126, 103626. [Google Scholar] [CrossRef]
  18. Mellander, C.; Lobo, J.; Stolarick, K.; Matheson, Z. Night-Time Light Data: A Good Proxy Measure for Economic Activity? PLoS ONE 2015, 10, e0139779. [Google Scholar] [CrossRef]
  19. McAvoy, G.; Vadrevu, K.P. Nighttime Lights and Population Variations in Cities of South/Southeast Asia: Distance-Decay Effect and Implications. Remote Sens. 2024, 16, 4458. [Google Scholar] [CrossRef]
  20. Rafael, C.; Diego, A.M.; Juan, F.V. Measuring the Size and Growth of Cities Using Nighttime Light. J. Urban Econ. 2021, 125, 103254. [Google Scholar] [CrossRef]
  21. Bagan, H.; Yamagata, Y. Analysis of Urban Growth and Estimating Population Density Using Satellite Images of Nighttime Lights and Land-Use and Population Data. GISci. Remote Sens. 2015, 52, 765–780. [Google Scholar] [CrossRef]
  22. Yang, Y.; Ma, M.; Zhu, X.; Ge, W. Research on Spatial Characteristics of Metropolis Development Using Nighttime Light Data: NTL Based Spatial Characteristics of Beijing. PLoS ONE 2020, 15, e0242663. [Google Scholar] [CrossRef] [PubMed]
  23. Gang, X.; Tianyu, X.; Xi, L.; Xinlian, L.; Limin, J. Lockdown Induced Night-Time Light Dynamics during the COVID-19 Epidemic in Global Megacities. Int. J. Appl. Earth Obs. Geoinf. 2021, 102, 102421. [Google Scholar] [CrossRef]
  24. Du, X.; Shen, L.; Wong, S.W.; Meng, C.; Yang, Z. Night-Time Light Data Based Decoupling Relationship Analysis between Economic Growth and Carbon Emission in 289 Chinese Cities. Sustain. Cities Soc. 2021, 73, 103119. [Google Scholar] [CrossRef]
  25. Zhao, M.; Zhou, Y.; Li, X.; Cao, W.; He, C.; Yu, B.; Li, X.; Elvidge, C.D.; Cheng, W.; Zhou, C. Applications of Satellite Remote Sensing of Nighttime Light Observations: Advances, Challenges, and Perspectives. Remote Sens. 2019, 11, 1971. [Google Scholar] [CrossRef]
  26. NASA. Nighttime Lights; NASA EarthDATA: Washington, DC, USA, 2025. Available online: https://www.earthdata.nasa.gov/topics/human-dimensions/nighttime-lights (accessed on 21 July 2024).
  27. Kumar, L.; Mutanga, O. Google Earth Engine Applications Since Inception: Usage, Trends, and Potential. Remote Sens. 2018, 10, 1509. [Google Scholar] [CrossRef]
  28. Agapiou, A. Remote Sensing Heritage in a Petabyte-Scale: Satellite Data and Heritage Earth Engine© Applications. Int. J. Digit. Earth 2016, 10, 85–102. [Google Scholar] [CrossRef]
  29. Google Developers. Earth Engine Data Catalog; Google Developers: Mountain View, CA, USA, 2025; Available online: https://developers.google.com/earth-engine/datasets (accessed on 16 July 2024).
  30. Mutanga, O.; Kumar, L. Google Earth Engine Applications. Remote Sens. 2019, 11, 591. [Google Scholar] [CrossRef]
  31. Mncube, Z.; Xulu, S. Progress of Nighttime Light Applications within the Google Earth Engine Cloud Platform. Geocarto Int. 2022, 38, 1–22. [Google Scholar] [CrossRef]
  32. Jeswani, R.; Kulshrestha, A.; Gupta, P.K.; Srivastav, S. Evaluation of the Consistency of DMSP-OLS and SNPP-VIIRS Night-Time Light Datasets. J. Geomatics 2019, 13, 98–105. [Google Scholar]
  33. Atiyeh, A.; Narges, S.; Narges, K.; John, J.C.; Hamid, R.P. An Integrated GEE and Machine Learning Framework for Detecting Ecological Stability under Land Use/Land Cover Changes. Glob. Ecol. Conserv. 2024, 53, e03010. [Google Scholar] [CrossRef]
  34. Campbell, J.B.; Wynne, R.H. Introduction to Remote Sensing, 5th ed.; Taylor & Francis: London, UK, 2011. [Google Scholar]
  35. Lillesand, T.M.; Kiefer, R.W.; Chipman, J.W. Remote Sensing and Image Interpretation, 6th ed.; Wiley: Hoboken, NJ, USA, 2008. [Google Scholar]
  36. Jensen, J.R. Introductory Digital Image Processing: A Remote Sensing Perspective, 4th ed.; Pearson: Boston, MA, USA, 2015. [Google Scholar]
  37. Ball, G.H.; Hall, D.J. A Clustering Technique for Summarizing Multivariate Data. Behav. Sci. 1965, 12, 153–155. [Google Scholar] [CrossRef]
  38. Sirat, E.F.; Setiawan, B.D.; Ramdani, F. Comparative Analysis of K-Means and ISODATA Algorithms for Clustering of Fire Point Data in Sumatra Region. In Proceedings of the 2018 4th International Symposium on Geoinformatics (ISyG), Kuala Lumpur, Malaysia, 22–23 October 2018; pp. 1–6. [Google Scholar]
  39. Taiema, F.S.; Ramadan, M.S. Monitoring Urban Growth Directions Using Geomatics Techniques, a Case Study Zagazig City–Egypt. Egypt. J. Remote Sens. Space Sci. 2021, 24, 1083–1092. [Google Scholar] [CrossRef]
  40. Chen, X.; Wang, Z.; Zhang, F.; Sun, G.; Chen, Q. A global annual simulated VIIRS nighttime light dataset from 1992 to 2023. Scientific Data, 11. Nature 2024, 11, 1380. [Google Scholar] [CrossRef]
  41. Earth Observation Group. VIIRS Nighttime Day/Night Band Composites; Version 1; NOAA: Boulder, CO, USA, 2024; Available online: https://developers.google.com/earth-engine/datasets/catalog/NOAA_VIIRS_DNB_MONTHLY_V1_VCMCFG (accessed on 16 July 2024).
  42. Land Development Department. Soil Online: Soil and Land Use Information Service; Land Development Department: Bangkok, Thailand, 2024. Available online: https://dinonline.ldd.go.th/ (accessed on 21 July 2024).
  43. Provincial Electricity Authority. Annual Report on Electricity Usage Statistics; Provincial Electricity Authority: Bangkok, Thailand, 2024. Available online: https://www.nso.go.th/nsoweb/downloadFile/stat_impt/Ai/file_xls_th (accessed on 2 July 2024).
  44. Congalton, R.G.; Green, K. Assessing the Accuracy of Remotely Sensed Data: Principles and Practices, 3rd ed.; CRC Press: Boca Raton, FL, USA, 2019. [Google Scholar]
  45. Congalton, R.G.; Green, K. Assessing the Accuracy of Remotely Sensed Data: Principles and Practices; Lewis Publishers: Boca Raton, FL, USA, 1999. [Google Scholar]
  46. Stehman, S.V. Selecting and Interpreting Measures of Thematic Classification Accuracy. Remote Sens. Environ. 1997, 62, 77–89. [Google Scholar] [CrossRef]
  47. Prasad, R.; Sinha, A.K. Role of Expert System in Natural Resources Management; Geospatial World: Hyderabad, India, 2014; Available online: https://geospatialworld.net/article/role-of-expert-system-in-natural-resources-management/ (accessed on 3 December 2024).
  48. Biłozor, A.; Czyża, S.; Bajerowski, T. Identification and Location of a Transitional Zone between an Urban and a Rural Area Using Fuzzy Set Theory, CLC, and HRL Data. Sustainability 2019, 11, 7014. [Google Scholar] [CrossRef]
  49. Hutchings, P.; Willcock, S.; Lynch, K.; Bundhoo, D.; Brewer, T.; Cooper, S.; Keech, D.; Mekala, S.; Mishra, P.P.; Parker, A.; et al. Understanding Rural–Urban Transitions in the Global South through Peri-Urban Turbulence. Nat. Sustain. 2022, 5, 924–930. [Google Scholar] [CrossRef]
  50. Zhu, Y.; Xu, D.; Ali, S.H.; Ma, R.; Cheng, J. Can Nighttime Light Data Be Used to Estimate Electric Power Consumption? New Evidence from Causal-Effect Inference. Energies 2019, 12, 3154. [Google Scholar] [CrossRef]
  51. Yao, J. Electricity Consumption and Temperature: Evidence from Satellite Data. Int. Monet. Fund 2021, 2021, 1–38. [Google Scholar] [CrossRef]
  52. Levin, N. The Impact of Seasonal Changes on Observed Nighttime Brightness from 2014 to 2015 Monthly VIIRS DNB Composites. Remote Sens. Environ. 2017, 193, 150–164. [Google Scholar] [CrossRef]
  53. Bharti, N.; Tatem, A. Fluctuations in Anthropogenic Nighttime Lights from Satellite Imagery for Five Cities in Niger and Nigeria. Sci. Data 2018, 5, 256. [Google Scholar] [CrossRef] [PubMed]
  54. Liu, M.; Liu, X.; Zhang, B.; Li, Y.; Luo, T.; Liu, Q. Analysis of the Evolution of Urban Nighttime Light Environment Based on Time Series. Sustain. Cities Soc. 2022, 78, 103660. [Google Scholar] [CrossRef]
  55. Wu, B.; Huang, H.; Wang, Y.; Shi, S.; Wu, J.; Yu, B. Global Spatial Patterns between Nighttime Light Intensity and Urban Building Morphology. Int. J. Appl. Earth Obs. Geoinf. 2023, 124, 103495. [Google Scholar] [CrossRef]
  56. Kii, M.; Matsumoto, K.; Sugita, S. Future Scenarios of Urban Nighttime Lights: A Method for Global Cities and Its Application to Urban Expansion and Carbon Emission Estimation. Remote Sens. 2024, 16, 1018. [Google Scholar] [CrossRef]
Figure 1. Methodology framework for analyzing urban development using nighttime light data.
Ijgi 14 00178 g001
Figure 2. Study area in Chiang Mai, Thailand.
Ijgi 14 00178 g002
Figure 3. Comparison of urban area classification between GEE and UNSUP techniques.
Ijgi 14 00178 g003
Figure 4. Nighttime light intensity map of Chiang Mai province; December 2023.
Ijgi 14 00178 g004
Figure 5. Urban area delineation; December 2023.
Ijgi 14 00178 g005
Figure 6. Urban area classification in Chiang Mai province.
Ijgi 14 00178 g006
Figure 7. Confusion matrices of urban/non-urban classification results from GEE and UNSUP methods for the years 2014, 2017, 2020, and 2023 (Level 1 classification).
Ijgi 14 00178 g007
Figure 8. Confusion matrices of urban, rural/suburban, and non-urban classification results using GEE and UNSUP methods for the years 2017, 2020, and 2023 (Level 2 classification).
Ijgi 14 00178 g008
Figure 9. Nighttime light intensity and electricity usage correlation utilizing GEE and UNSUP techniques.
Ijgi 14 00178 g009
Table 1. Annual electricity consumption by sector in Chiang Mai Province (kWh), 2014–2023.
Category2014201720202023
Residential (less than 150 kWh per month)238,864,320239,521,266269,068,999225,400,548
Residential (more than 150 kWh per month)754,948,956917,712,3611,264,496,1141,561,746,937
Small Business Activities471,201,360555,381,551587,471,680632,866,146
Medium Business Activities506,500,824580,486,634594,121,471613,873,563
Large Business Activities496,128,505560,309,252553,219,478536,272,604
Miscellaneous Activities218,773,212250,816,651171,936,294183,683,592
Non-profit Organizations11,611,04013,885,98312,070,31612,942,110
Agricultural Activities16,524,10612,539,97319,047,95610,030,322
Street Lighting36,818,20744,744,90937,335,82533,056,341
Total Electricity Produced and Consumed (kWh)2,751,370,5303,175,398,5803,508,768,1333,809,872,163
Table 2. Comparison of urban area classification results between GEE and UNSUP techniques.
YearGEE Area (Sq km)UNSUP Area (Sq km)
UrbanRuralNon-UrbanUrbanRuralNon-Urban
20144135421,7954251521,633
20175343321,7046055521,575
20206549221,6336575921,366
20237061821,5028090221,208
Table 3. GEE and UNSUP urban area classification accuracy assessment (Level 1).
Year2014201720202023
MethodGEEUNSUPGEEUNSUPGEEUNSUPGEEUNSUP
Overall Accuracy0.800.760.820.740.830.720.800.73
Kappa Coefficient0.610.510.650.480.660.440.600.46
Producer’s Accuracy
Urban0.990.990.970.981.000.940.980.97
Non-Urban0.720.670.750.660.740.650.720.65
User’s Accuracy
Urban0.620.520.670.490.660.470.620.48
Non-Urban0.990.990.980.991.000.970.980.98
Table 4. Accuracy assessment of urban area classification using GEE (Level 2).
Year201720202023
MethodGEEUNSUPGEEUNSUPGEEUNSUP
Overall Accuracy0.690.670.670.660.670.60
Kappa Coefficient0.470.430.430.400.420.32
Producer’s Accuracy
Urban0.760.820.790.860.850.51
Rural/suburban0.380.460.390.360.470.10
Non-Urban0.750.730.700.710.670.72
User’s Accuracy
Urban0.470.220.480.390.470.44
Rural/suburban0.300.480.230.280.270.05
Non-Urban0.990.980.980.980.980.96
Table 5. McNemar’s test results comparing GEE and UNSUP classification accuracy (2014–2023).
Yearb (GEE Correct, UNSUP
Incorrect)
c (GEE Incorrect, UNSUP
Correct)
χ2p-ValueSignificance
20141200.00.00049Significant (p < 0.05)
20172300.02.38 × 10−7Significant (p < 0.05)
20202400.01.19 × 10−7Significant (p < 0.05)
20231800.07.63 × 10−6Significant (p < 0.05)
Table 6. McNemar’s test results for Level 2 urban classification (2017–2023).
Yearb (GEE Correct, UNSUP
Incorrect)
c (GEE Incorrect, UNSUP
Correct)
χ2p-ValueSignificance
20171600.03.05 × 10−5Significant (p < 0.05)
2020600.00.03125Significant (p < 0.05)
2023200.00.5Not Significant
Disclaimer/Publisher’s Note: The statements, opinions and data contained in all publications are solely those of the individual author(s) and contributor(s) and not of MDPI and/or the editor(s). MDPI and/or the editor(s) disclaim responsibility for any injury to people or property resulting from any ideas, methods, instructions or products referred to in the content.

