Article

Simulating Co-Evolution and Knowledge Transfer in Logistic Clusters Using a Multi-Agent-Based Approach

by
Aitor Salas-Peña
* and
Juan Carlos García-Palomares
Transport, Infrastructure and Territory Research Group (tGIS), Geography Department, Complutense University of Madrid (UCM), Profesor Aranguren S/N, 28040 Madrid, Spain
*
Author to whom correspondence should be addressed.
ISPRS Int. J. Geo-Inf. 2025, 14(4), 179; https://doi.org/10.3390/ijgi14040179
Submission received: 18 February 2025 / Revised: 16 April 2025 / Accepted: 17 April 2025 / Published: 20 April 2025
(This article belongs to the Topic Spatial Decision Support Systems for Urban Sustainability)

Abstract

:
Some complex social networks are driven by adaptive and co-evolutionary patterns. However, these can be difficult to detect and analyse since the links between actors are circumstantial and often not revealed. This paper employs a Geographic Information Systems (GIS) integrated multi-agent-based approach to simulate co-evolution in a complex social network. A case study is proposed for the modelling of contractual relationships between road freight transport companies. The model employs empirical data from a survey of transport companies located in the Basque Country (Spain) and utilises the DBSCAN community detection algorithm to simulate the effect of cluster size in the network. Additionally, a local spatial association indicator is employed to identify potentially favourable environments. The model enables the evolution of the network, leading to more complex collaborative structures. By means of iterative simulations, the study demonstrates how collaborative networks self-organise by distributing activity and knowledge and evolving into complex polarised systems. Furthermore, the simulations with different minimum cluster sizes indicate that clusters benefit the agents that are part of them, although they are not a determining factor in the network participation of other non-clustered agents.

1. Introduction

The spread of knowledge and skills in complex systems hugely affects their capacity for self-organisation and adaptability to new scenarios. As interactions increase, these systems evolve towards greater complexity [1], fostering co-evolution in cooperative and competitive domains between agents in different roles [2]. In the case of road freight transport (RFT), interactions occur among companies in local or regional systems through the formation of transport outsourcing chains (TOC). The hierarchical operational structure of these outsourcing chains [3] results in a non-homogeneous information flow, which affects the decision-making capacity of the involved actors. The multiplication of interactions between agents in a local RFT system leads to collaboration networks in which learning and the transfer of knowledge can play a key role in their evolution.
To date, research related to communicative interaction in transport systems has primarily focused on supply chains and the provision of logistics services, seen from the perspective of production companies [4,5,6,7] or based on literature reviews [8,9,10]. Other pioneering works have simulated dynamic graphs by defining transport agents to understand how logistics systems work [11]. However, as far as we know, the phenomenon of the transfer of knowledge between contractually bound transport agents has received contributions only from other activity sectors [12,13,14] or reviews [15]. Furthermore, the identification and analysis of co-evolutionary social networks operating in geographical systems is still in its early stages of development.
This paper presents a GIS-integrated multi-agent-based (GIS-ABM) approach to the study of a complex, co-evolving social network, whereby knowledge transfer between agents in a local collaborative environment is simulated [16]. Two main aspects justify the choice of this approach. On the one hand, the scarcity of data on the contractual relationships between RFT firms supports the use of agent-based models to simulate collaborative processes and information exchange by considering each firm as an individualised and geolocalised actor. Furthermore, the observed clustered patterns of the logistics sector [17,18] recommend the use of methodologies such as GIS-ABM, which give relevance to spatial distribution of agents from a disaggregated approach.
To investigate the spatial impact of agents’ collaborative strategies, we employ the Density-Based Spatial Clustering of Applications with Noise (DBSCAN) algorithm to detect communities, and Moran’s I local indicator of spatial association to identify potentially favourable environments for the transfer of knowledge. In addition, two centrality metrics are employed to ascertain an agent’s potential to be selected for a TOC. One metric is applied to each firm within the cluster, whereas the other gauges the cohesion of the cluster. We use as a case study a local RFT system of the Basque Country (Spain) to simulate its potential dynamics. Attending to its heterogeneity and specific context, a survey addressed to RFT professionals was conducted to study interactions and identify aggregated behaviours and patterns. The proposed method allows for the study of the complexity of these systems from a bottom-up approach, offering new possibilities to the analysis of spatial diffusion processes.
Accordingly, by repeating simulations in different scenarios of the model, the research will try to provide a response to the following research questions:
RQ1: Is a multi-agent-based approach an effective method for identifying and simulating co-evolution in social networks and their spatial dynamics?
RQ2: What is the role of learning and knowledge dissemination in the collaborative strategies of complex social networks?
RQ3: How do spatial clustering strategies affect co-evolutionary social networks?
RQ4: Does a relationship exist between the hierarchical nature of TOCs and the distribution of activity environments in a transport system?
This work aims to address these questions by providing a novel approach to the simulation of transport systems, since to date there is no evidence of other research where collaborative relationships between firms in local transport systems have been studied based on the characterisation of the skills and capabilities of each agent observed individually. Moreover, an original and novel methodological approach to the study of logistics clusters is provided by the joint analysis of dynamic graphs based on TOCs and spatial knowledge diffusion processes. This model attempts to contribute to the literature a theoretical approach according to which information exchange is the key factor in the spatial organisation of logistics clusters compared to other activities less dependent on knowledge transfer. Finally, the model proposed in this study can be used to predict situations of demand or supply congestion in the short term.
The paper primarily consists of a review of the specialist literature, both regarding TOCs and the transfer of knowledge between agents (Section 2). Section 3 outlines the methodological aspects of the research. Information is then provided on the case study in Section 4. The results of the research are set out in Section 5 and Section 6 and the most significant aspects of the research are discussed. The conclusions are set out in Section 7. Finally, all figures with maps in this article have been created using the ETRS 1989 UTM Zone 30N Projected Coordinate System.

2. Background

In recent years, the literature has presented numerous models for simulating the interaction between transport agents at different operational levels. To increase their accuracy, models are becoming more realistic by including a greater number and variety of agents [19] or by focusing more on the collaborative relationships between them [20]. In this section, we review various models of freight transportation, focusing on the types of agents modelled, and analyse the influence of knowledge transfer on the success of outsourcing.

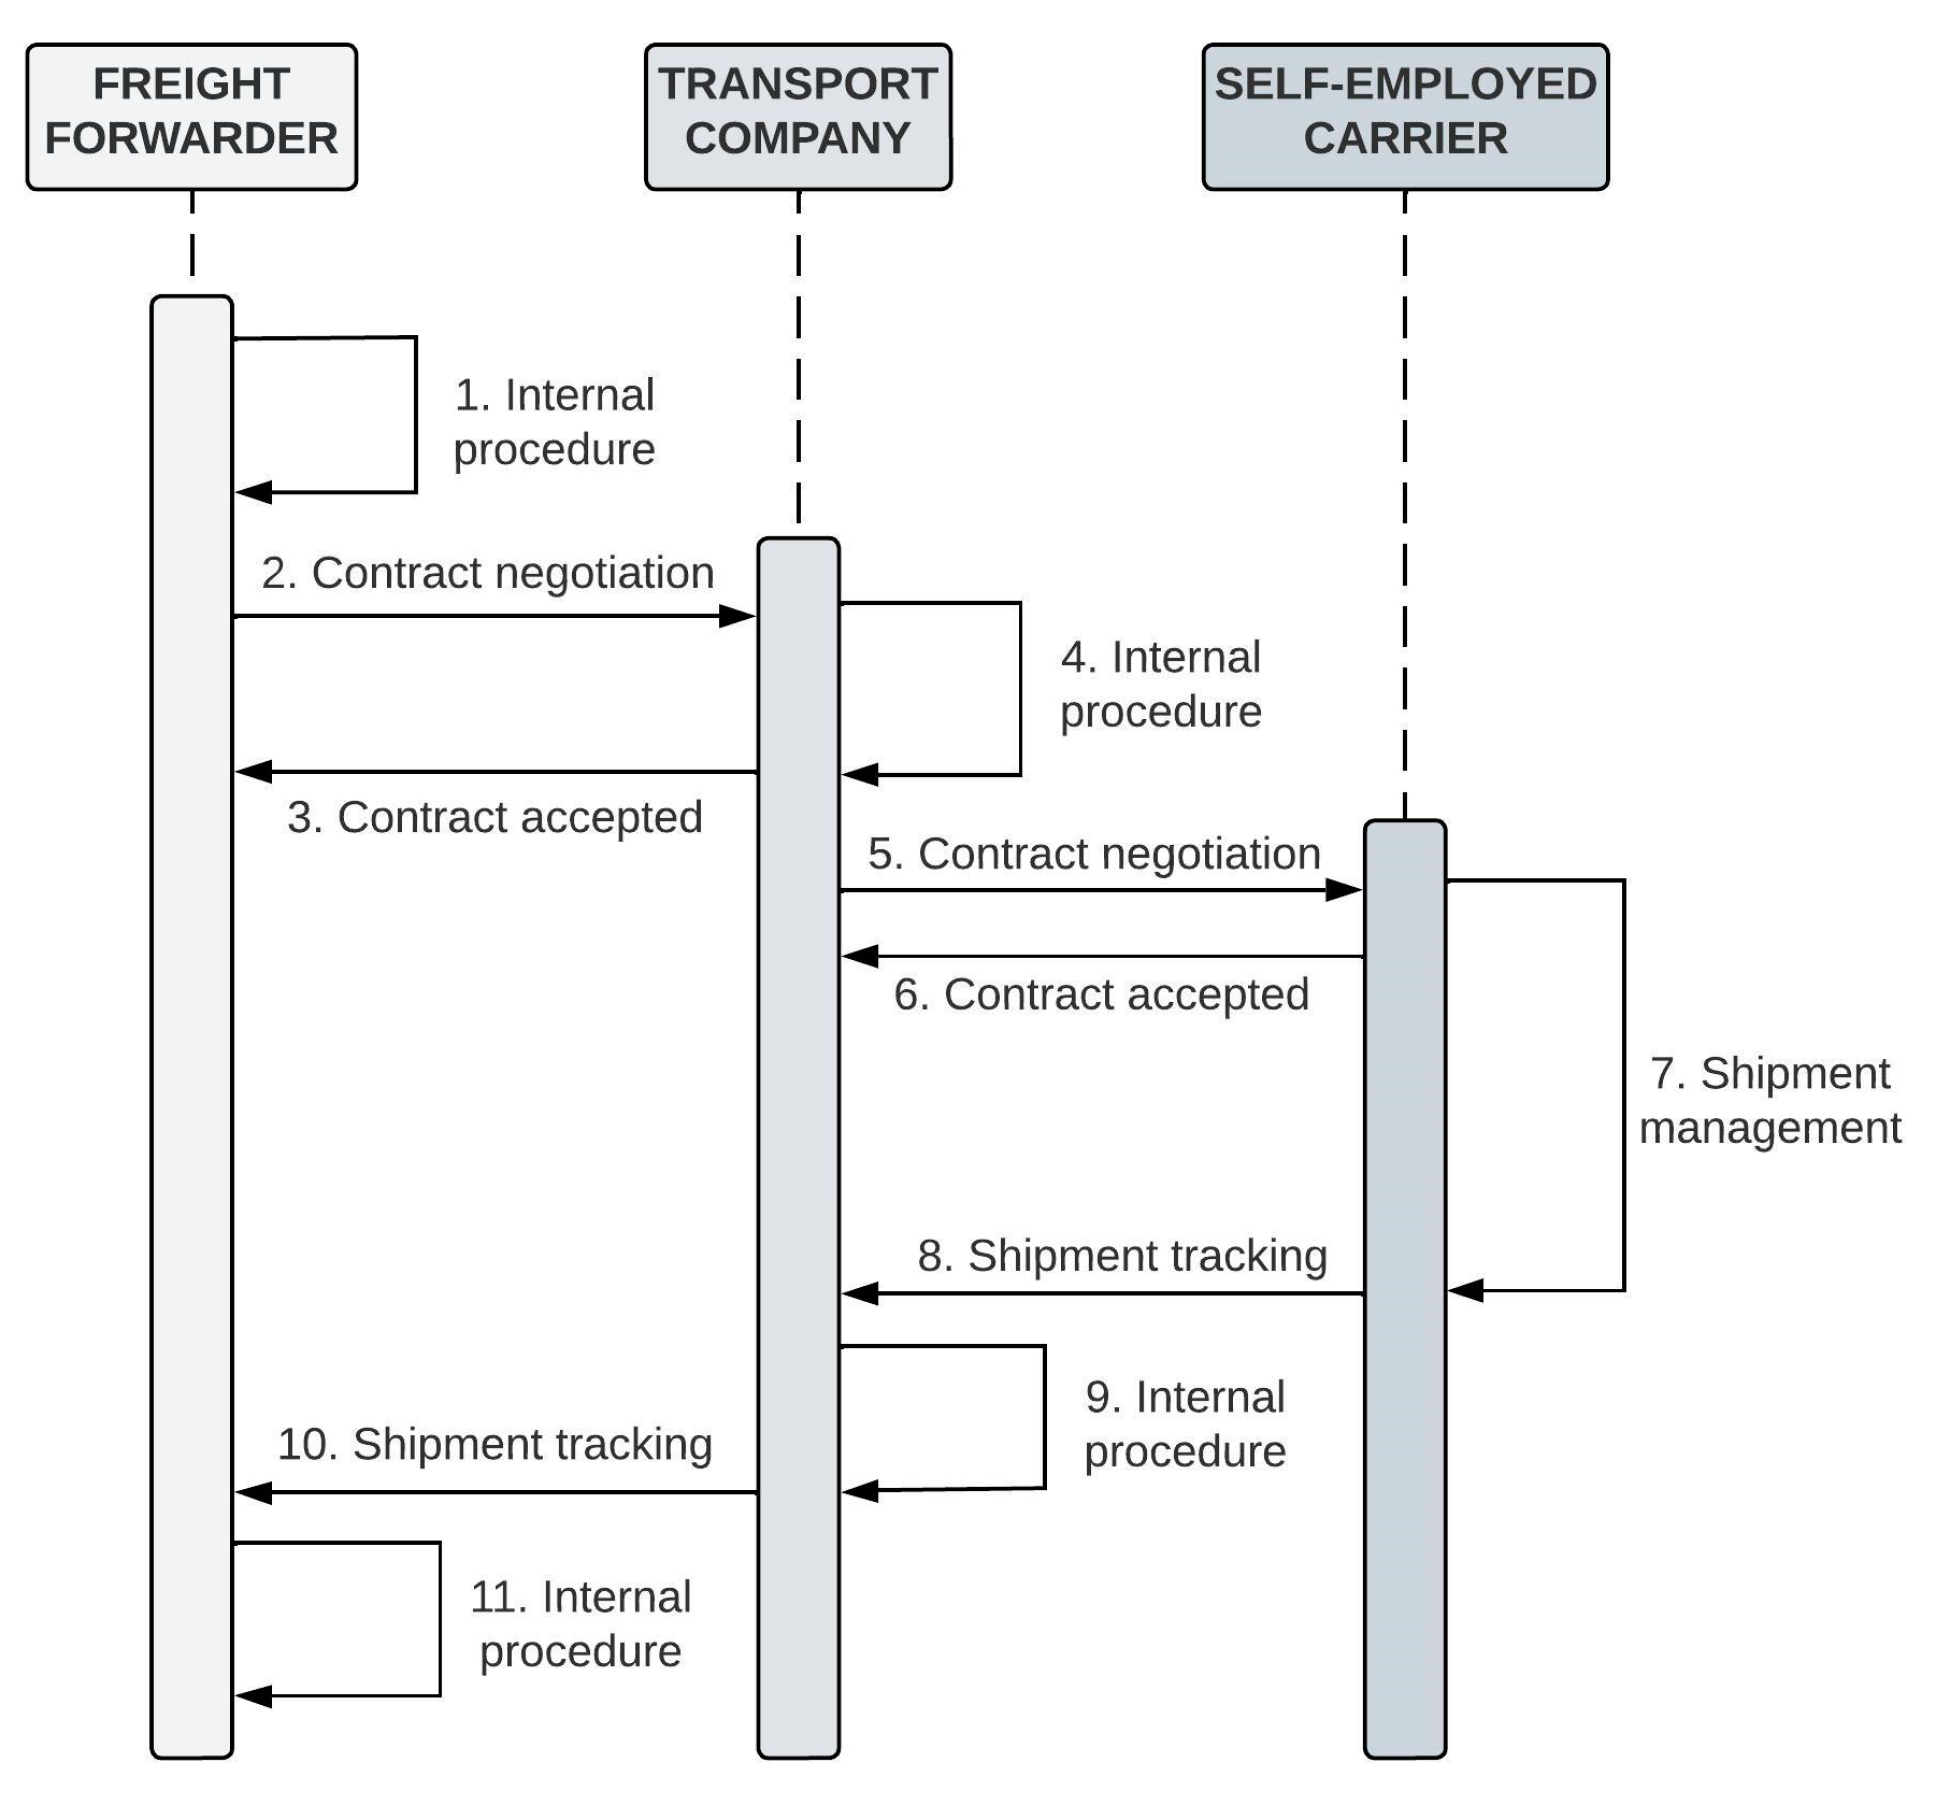
2.1. Simulating Transport Outsourcing

TOCs are formed when companies resort to external transport service providers (TSP) to make shipments. Outsourcing is a process for the transfer of certain functions from a company to a provider [21], which handles these on its own behalf under its entire responsibility [22] in exchange for remuneration or an agreed price. Jharkharia and Shankar [23] and Rinsler [22] allude to factors such as reducing costs, capacity of providers to vindicate their specialisation, and experience in areas in which their clients lack resources as some of the main reasons to outsource services. Accordingly, in certain cases, outsourcing is not only necessary but can also be highly beneficial [24]. Since the 1980s, transport services performed by third parties have gradually replaced own-account transport. In fact, the percentage of tonnes transported in the EU by means of outsourced transport services has risen from 71% of the total in 2016 to 76% in 2021 [25].
TOCs have different levels of complexity depending on the number, type, and role of the actors involved. All freight transport systems involve a certain number of actors who control their own management without any of them simultaneously controlling or being fully aware of the decision-making process of the others [26]. However, agents are also able to react to and learn from changes in their environment to make proactive decisions and to interact with other agents accordingly [27]. Understanding such interactions requires an understanding of the freedom of action of the agents involved in them from a decentralised approach [28].
From the TAPAS (Transportation And Production Agent-based Simulation) platform, Davidsson et al. [3] simulate decision-making and physical transportation involving actors such as the production planner (shipper), transport planner (carrier), and end customer, as well as intermediary agents such as the product buyer and transport buyer (freight forwarder), all coordinated by the transportation chain planner. Baindur and Viegas [29] propose a model that analyses freight forwarders’ decisions to subcontract their cargo either to RFT companies or integrated transport operators. The model distinguishes three levels of influence: contractual, physical, and normative. However, given the complexity of TOCs, more detailed models that differentiate between agents and roles in relation to their position in the chain are necessary. Thus, de Bok and Tavasszy [30] recall that in some cases a single entity, construed as a company, can carry out multiple roles in a transport operation. In the model developed by Schröder et al. [31] on the MATSim platform, in addition to the shipper, a freight forwarder and a carrier take part due to the outsourcing of logistical tasks. These parties make contractual decisions based on their knowledge and abilities to meet the agreed-upon task.
Using FREMIS (Freight Market Interactions Simulation), Cavalcante and Roorda [32] simulate interactions between shippers and carriers through transportation contracts based on price and level of service offered. The shipper evaluates the service received for future operations, while the carrier tries to make their operational decisions profitable by cutting costs. Matteis et al. [33] propose a model that examines the adaptation of TSP (3PL and carriers) to the preferences and needs of demand (shippers and recipients), and to the policies for regulating the transport of goods. Holguín-Veras and Sánchez-Díaz [34] design their urban transport model in which, unlike other proposals, the recipient is given a primary role, acknowledging their influence on the attainment of traffic improvement in aspects such as delivery frequency, schedules, destinations, and mode of transport. Démare et al. [11] designed a model implemented on the GAMA [35] platform, which includes agents such as the logistics operator, transport planner, and carrier in addition to the sender and receiver of the goods.
Furthermore, the territory, identified through its infrastructure and urban spaces, also functions as an additional agent by displaying certain behaviour based on a set of attributes, the values of which are altered as a result of interaction with other agents. Finally, Kubler et al. [20] simulate contracts between companies and last-mile TSPs using the activity- and agent-based travel demand model mobiTopp, taking into account aspects such as market shares, the level of demand from companies, and the transport capacity of carriers to analyze the interdependence between demand and suppliers. Despite the high quality of all the studies mentioned above, there are still some gaps in the literature regarding complex subcontracting structures and information exchange processes between suppliers and customers within transport operations.

2.2. Outsourcing and Knowledge Transfer

The transfer of information and knowledge is key to understanding the functioning of TOCs and to modelling the conduct of agents in different scenarios. Based on internal organisational learning, the exchange of knowledge between agents from different entities can develop [36]. According to Scott et al. [21], two fundamental areas exist to manage outsourcing relations in supply chains: the supervision of the development of the operation and the operating control. In this latter phase, where the interaction between agents is more intense, mutual trust is crucial to enable the exchange of information with a view to reducing costs, whereby the reticence of contractors to share strategic information with the TSP could render outsourcing ineffective [37]. Similarly, Tomkins [38] considers trust as a decisive factor in the quality and quantity of information transmitted in a contractual collaboration. Trust is gradually forged in different stages and evolves between shippers and the TSP by means of the stepping up of communicative efforts [7].
Cruijssen et al. [8] highlight the importance of the exchange of information within the framework of horizontal cooperation between transport companies. Regarding this exchange relating to an RFT operation, a series of communications exists between direct collaborators that is necessary to enable the coordination between all the agents involved and to successfully complete the operation. However, these communications are established between pairs of agents, responding to a vertical collaboration structure in which information flows in phases and the decision-making capacity decreases as we move down the TOC [39].
Regarding this vertical structure, Brekalo and Albers [7] refer to commercial alliances between shippers and TSP to underline the beneficial effect of these relations for the exchange of knowledge. However, according to Rinehart et al. [4], this situation cannot be extended to situations governed by the market where, due to the high degree of competition, collaborations may be sporadic and unstable or not continuous, implying scant information exchange as a result of a low level of trust between client and provider. Daugerthy et al. [6] view hierarchical structures as centralised organisations that limit the capacity for communication and the exchange of new ideas.
However, access to knowledge may also occur as a result of the transfer of information from active agents towards those that have not yet formed part of any TOC. Beyond digital communication exchange, the information diffusion process is conditioned by the location of the agents [40]. Thus, assuming that the face-to-face exchange of information between individuals is an inverse function of distance [41], environments that are favourable for the exchange of knowledge may emerge in certain areas and diffuse according to the first law of geography [42]. These environments thus show the potential for the forging of effective collaboration relations between agents.
In conclusion, knowledge transfer is a key element in understanding the functioning and development of logistics clusters. However, we have observed that there is a notable lack of relevant studies dealing with the communication channels between collaborating RFT firms, the flow of information and knowledge between them and their environment, and the relevance of these processes to the spatial organisation and evolution of logistics clusters. This study aims to partially fill these gaps in the literature.

3. Materials and Methods

3.1. Density-Based Spatial Clustering

The Density-Based Spatial Clustering of Applications with Noise (DBSCAN) [43] is based on a non-parametric approach to establishing clusters using high density areas with a probability density of p (x). Its functioning consists of detecting areas with a high concentration of points or agents according to two parameters: the Euclidean distance and the minimum number of agents per cluster. Depending on these, an agent may form part of one cluster or another, or not be part of any cluster and be considered ‘noise’. The ArcGIS Pro 3.3.0 software was used to calculate three types of clusters with a search distance of 0.5 km. This parameter is calculated first by averaging the maximum distance between firms in the same environment, and then by averaging all the environments analysed. It is considered that beyond this distance the probabilities of a positive interaction between agents decrease.
As the types of clusters vary according to the minimum number of agents per cluster (k), the values {3, 5, 7} are proposed for this parameter. Since at least three agents are needed to form a subcontracting chain, the first value is k = 3. On the other hand, in order to not bias the knowledge transfer analysis by favouring logistics parks over small concentrations of firms, a maximum value of k = 7 is set, since some environments do not exceed this number. The value k = 5 is set as an intermediate value between the two previous values.
Algorithms to detect communities have been used to research such phenomena as mobility in urban transport networks [44], the existence of spatial hierarchies in freight transport systems [17], and the organisation of air transport networks [45]. In this paper we use DBSCAN algorithm to analyse interactions, firstly by measuring the dependence of each agent with respect to the other agents in its cluster, through the relative frequency of contracting within the cluster, where 1 represents maximum dependence. Secondly, the contractual interaction of each agent with other clusters will be calculated using the expression COLout = 1 − G, where G is the Gini coefficient referring to the distribution of contracts of each agent among the operational clusters. Values close to 1 indicate greater collaboration with the other clusters. The internal dependence of each agent with respect to its cluster is given by the equation C O L i n = c i j / ( t c i + 1 ) , where c is the number of contracts of i in its cluster j and tc is the total number of contracts of i. Values close to 1 denote maximum internal dependence.

3.2. Simulation of TOCs Coupling ABM and GIS

TRANSOPE (available as Supplementary Material) is a multi-agent-based model that reproduces contractual relations and knowledge transfer between RFT agents that subsequently materialise in transport operations [46,47]. The model simulates the decision-making of companies in selecting their TSPs, and the latter’s decision to accept contracts (or not) based on their capabilities and interests. A co-evolutionary algorithm is employed to simulate the effect of agent learning and knowledge transfer. Accordingly, the RFT companies that operate in a specific territory form outsourcing chains in order to carry out a number n of transport operations in a period t of time. Three types of companies are considered: Freight Forwarders (FF), Transport Companies (TC), and Self-employed Carriers (CA). The TOCs are always formed following the hierarchical order FF → TC → CA, and hence, the participation of a company at any given time will depend on its level. In addition, the first two select their TSPs according to a series of competence and topological variables. The selection of TSPs is determined by the expression
S i j = ( T j + C j ) D j 2 ( δ i j C g j D g ( r j ) ) 2 + ξ j
where the value of the potential selection of the TSPj for client i ( S i j ) depends on providers’ attributes such as trust or professionality (T), competitivity (C), or availability of trucks (D), and ξ represents the accumulated knowledge of each agent, which is derived from direct experience and indirect insights via informal interactions [48]. The topological variable δ refers to the client–supplier Euclidean distance. Both geographical centrality (Cg) and Average grouping distance (Dg) are explained in the next section.
The simulation consisted of the assignment of transport operations over five days, generating outsourcing chains for three scenarios, which correspond to three levels of k described in the previous section. The shipments contracted refer to general freight with a full load, with a distance to cover of between 75 and 150 km between origin and destination, to which the return of the vehicle to base must be added. This is important to calculate the availability of the CA, since their daily limit is set at 600 km. For each of the three scenarios, the simulation was repeated 15 times, thus allowing the average values of each variable to be adjusted for their subsequent analysis.
The TRANSOPE model provided the basis to analyse a case study through the coupling of ABM (Agent-Based Models) and GIS (TransopeGIS), to which end it was necessary to specify and implement the relations between the processes of the agents and the spatial data [49]. In this sense, the first interaction of the agents with space is their spatial distribution in accordance with an associative pattern. From this fact, the main feature of the agents’ behaviour is their decision to cooperate with each other, which has an impact on the territory.
For this purpose, the Netlogo environment [50] includes a specific extension for integration with GIS data that allows both vector and raster data to be incorporated.

3.3. Centrality of Agents

The model is developed on an isotropic space in which the proximity between agents facilitates the exchange of information and knowledge. Prior to the formation of the collaboration network, two centrality metrics are calculated for each clusterised agent:
(i) Geographical centrality (Cg) is based on closeness centrality [51]. However, by means of the expression
C g i ( c l r   x ) = j d ( i , j ) n 1
where n is the number of agents in cluster x; the centrality for each agent is calculated by means of the Euclidean distance that separates it from the rest of the agents in its cluster and not by the number of connections between agents. Low values of Cg indicate greater centrality.
(ii) Average grouping distance (Dg) is a cohesion metric of a cluster. This provides a common value for all agents in the cluster, adapting the equation offered by Newman [52]
D g ( r e g   x ) = i > j d ( i , j ) n x ( n x 1 ) / 2
where the distances from one agent to the others, are divided between the number of possible pairs. The lower the Dg value, the greater the cohesion between the agents in cluster x.
These two centrality metrics, together with the distance to each potential customer, will be key for a TSP to be selected. Since it is beyond the scope of a cluster, the model does not calculate the centrality measurements for non-clusterised agents, which are thus, a priori, at a disadvantage in regard to interacting with other companies.

3.4. Simulating Spatial Difussion of Knowledge

The model includes a module to simulate learning and knowledge transfer between agents through two types of interactions: direct and indirect interactions.

3.4.1. Direct Interactions

As explained in Section 2.2, there is a flow of information between the actors involved in a transport operation, which leads to a transfer of knowledge. The transport contract contains a large amount of information about the service and the customer’s requirements [21], including the stowage of goods, timetables, loading/unloading procedures, or transport documents. According to the TRANSOPE survey [53], information exchange takes place during the subcontracting process (contract negotiation and acceptance) and during the transport process (transport tracking).
Figure 1 shows the interactions that enable the flow of information in a transport operation. In addition, the internal procedures of each agent give cohesion and added value to the information transmitted. The more an agent participates in TOCs, the more direct learning (DL) it generates according to the expression [47]
D L j = m = 1 n k t V T O C m j
where VTOC is the value generated by the TOC m in which agent j participates and kt is a constant that regulates the flow of knowledge between agents. Thus, DL is updated each time an agent participates in a TOC.

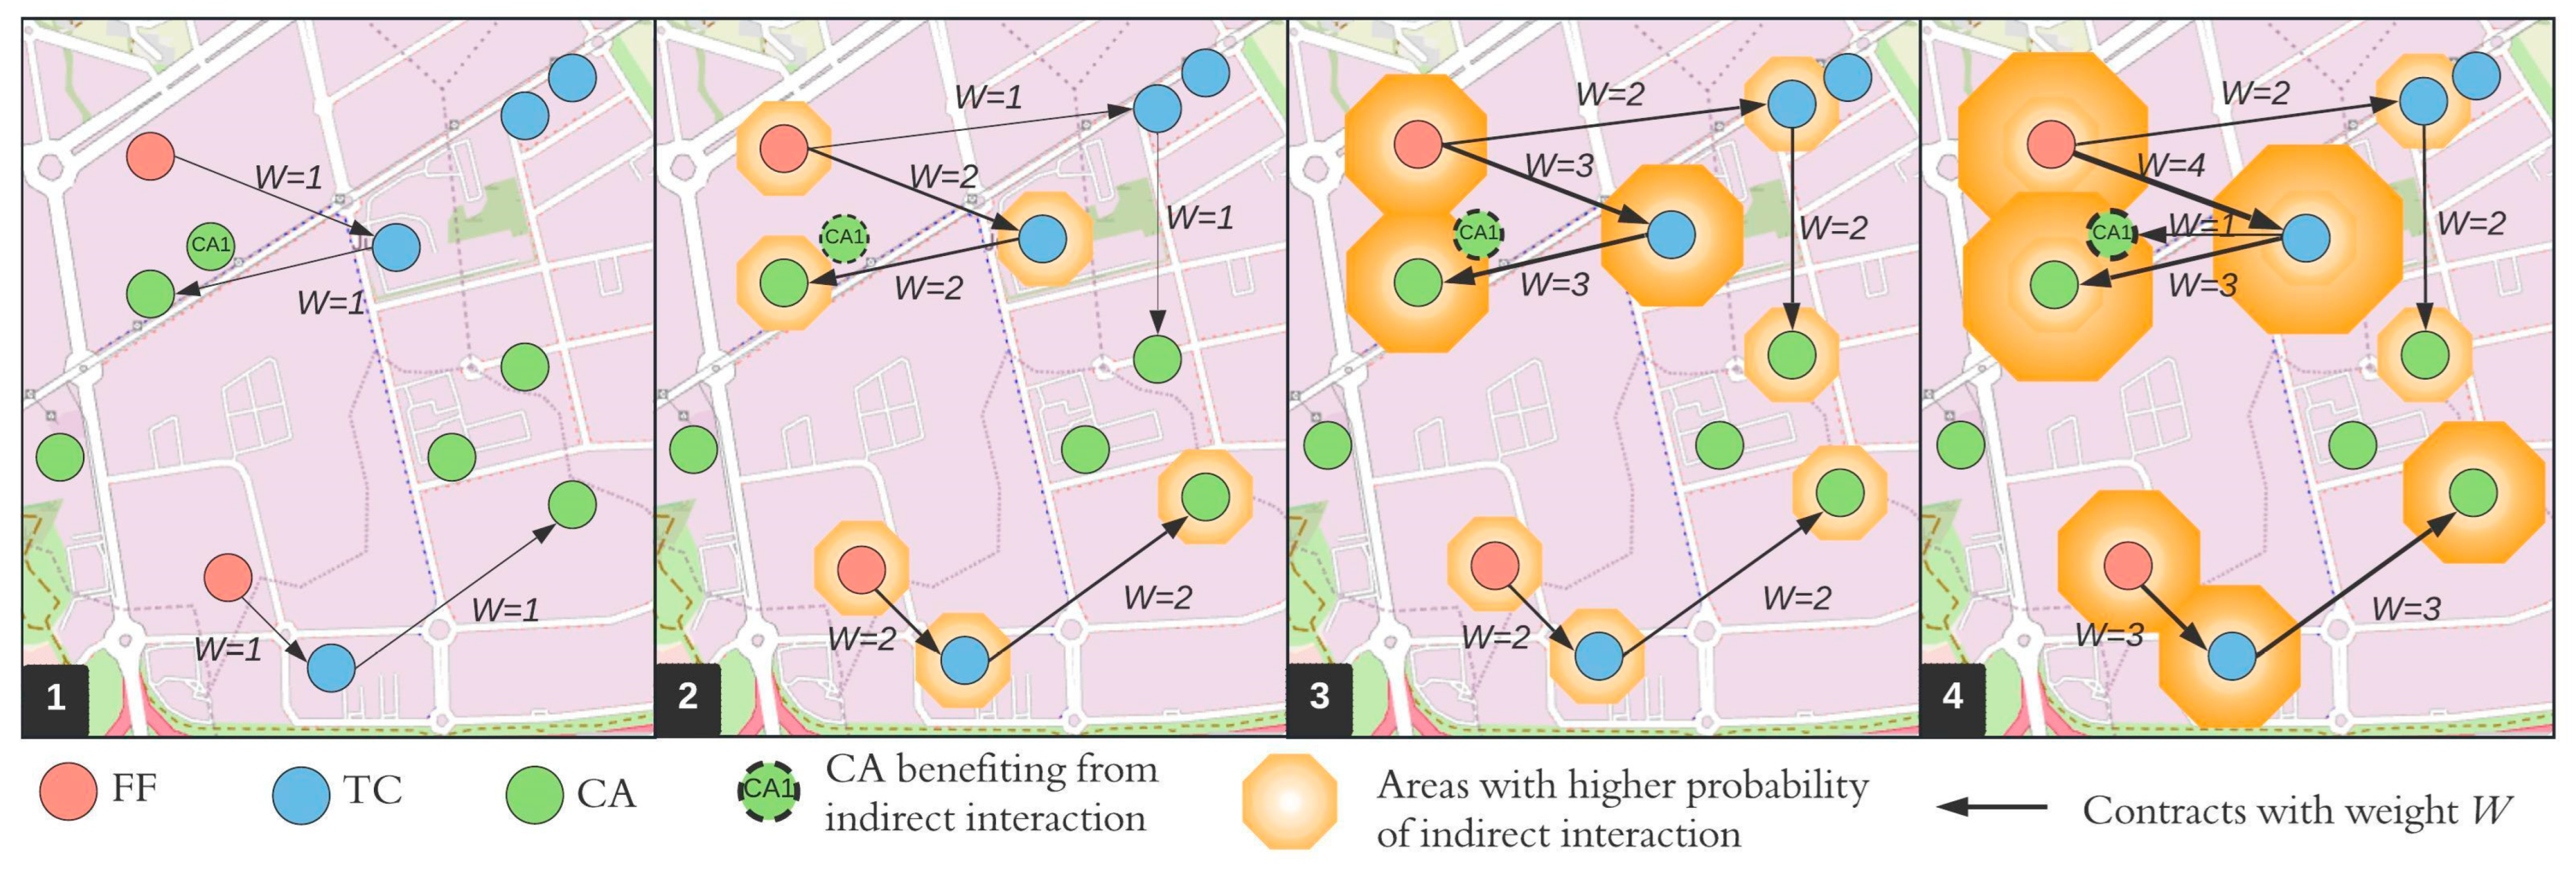
3.4.2. Indirect Interactions

According to Tobler’s law [42], closer agents are more likely to establish informal contacts than more distant agents, allowing them to transfer knowledge to their immediate environment [36]. In TRANSOPE [47], each spatial unit z with dimensions 150.28 × 150.28 m is assigned a value of indirect learning (IL) that refers to the probability of retaining part of the knowledge accumulated by active agents located within a radius r, according to the equation
I L z = k t j = 1 m c o n t r a c t s j r z n r z
where n is the number of agents in the radius r of parcel z, and contracts are the contracts of agent j. The IL is updated at the end of each day by distributing a portion of its IL among its neighbouring parcels (v) as a function of the constant kt,
I L z = I L z ( I L z k t ) + k t u = 1 w I L u n v u
Thus, agents who benefit from indirect interactions increase their likelihood of being hired as their knowledge of the operations increases (Figure 2).
In summary, both the agent’s participation in a TOC and its proximity to the knowledge transfer zone contribute to the accumulation of knowledge. In addition, the model assumes the following aspects [47]:
  • All agents can transmit and receive information;
  • Agents incorporate the received information as new knowledge;
  • The transmitted information is considered valuable;
  • The diffusion of information does not take into account physical barriers.

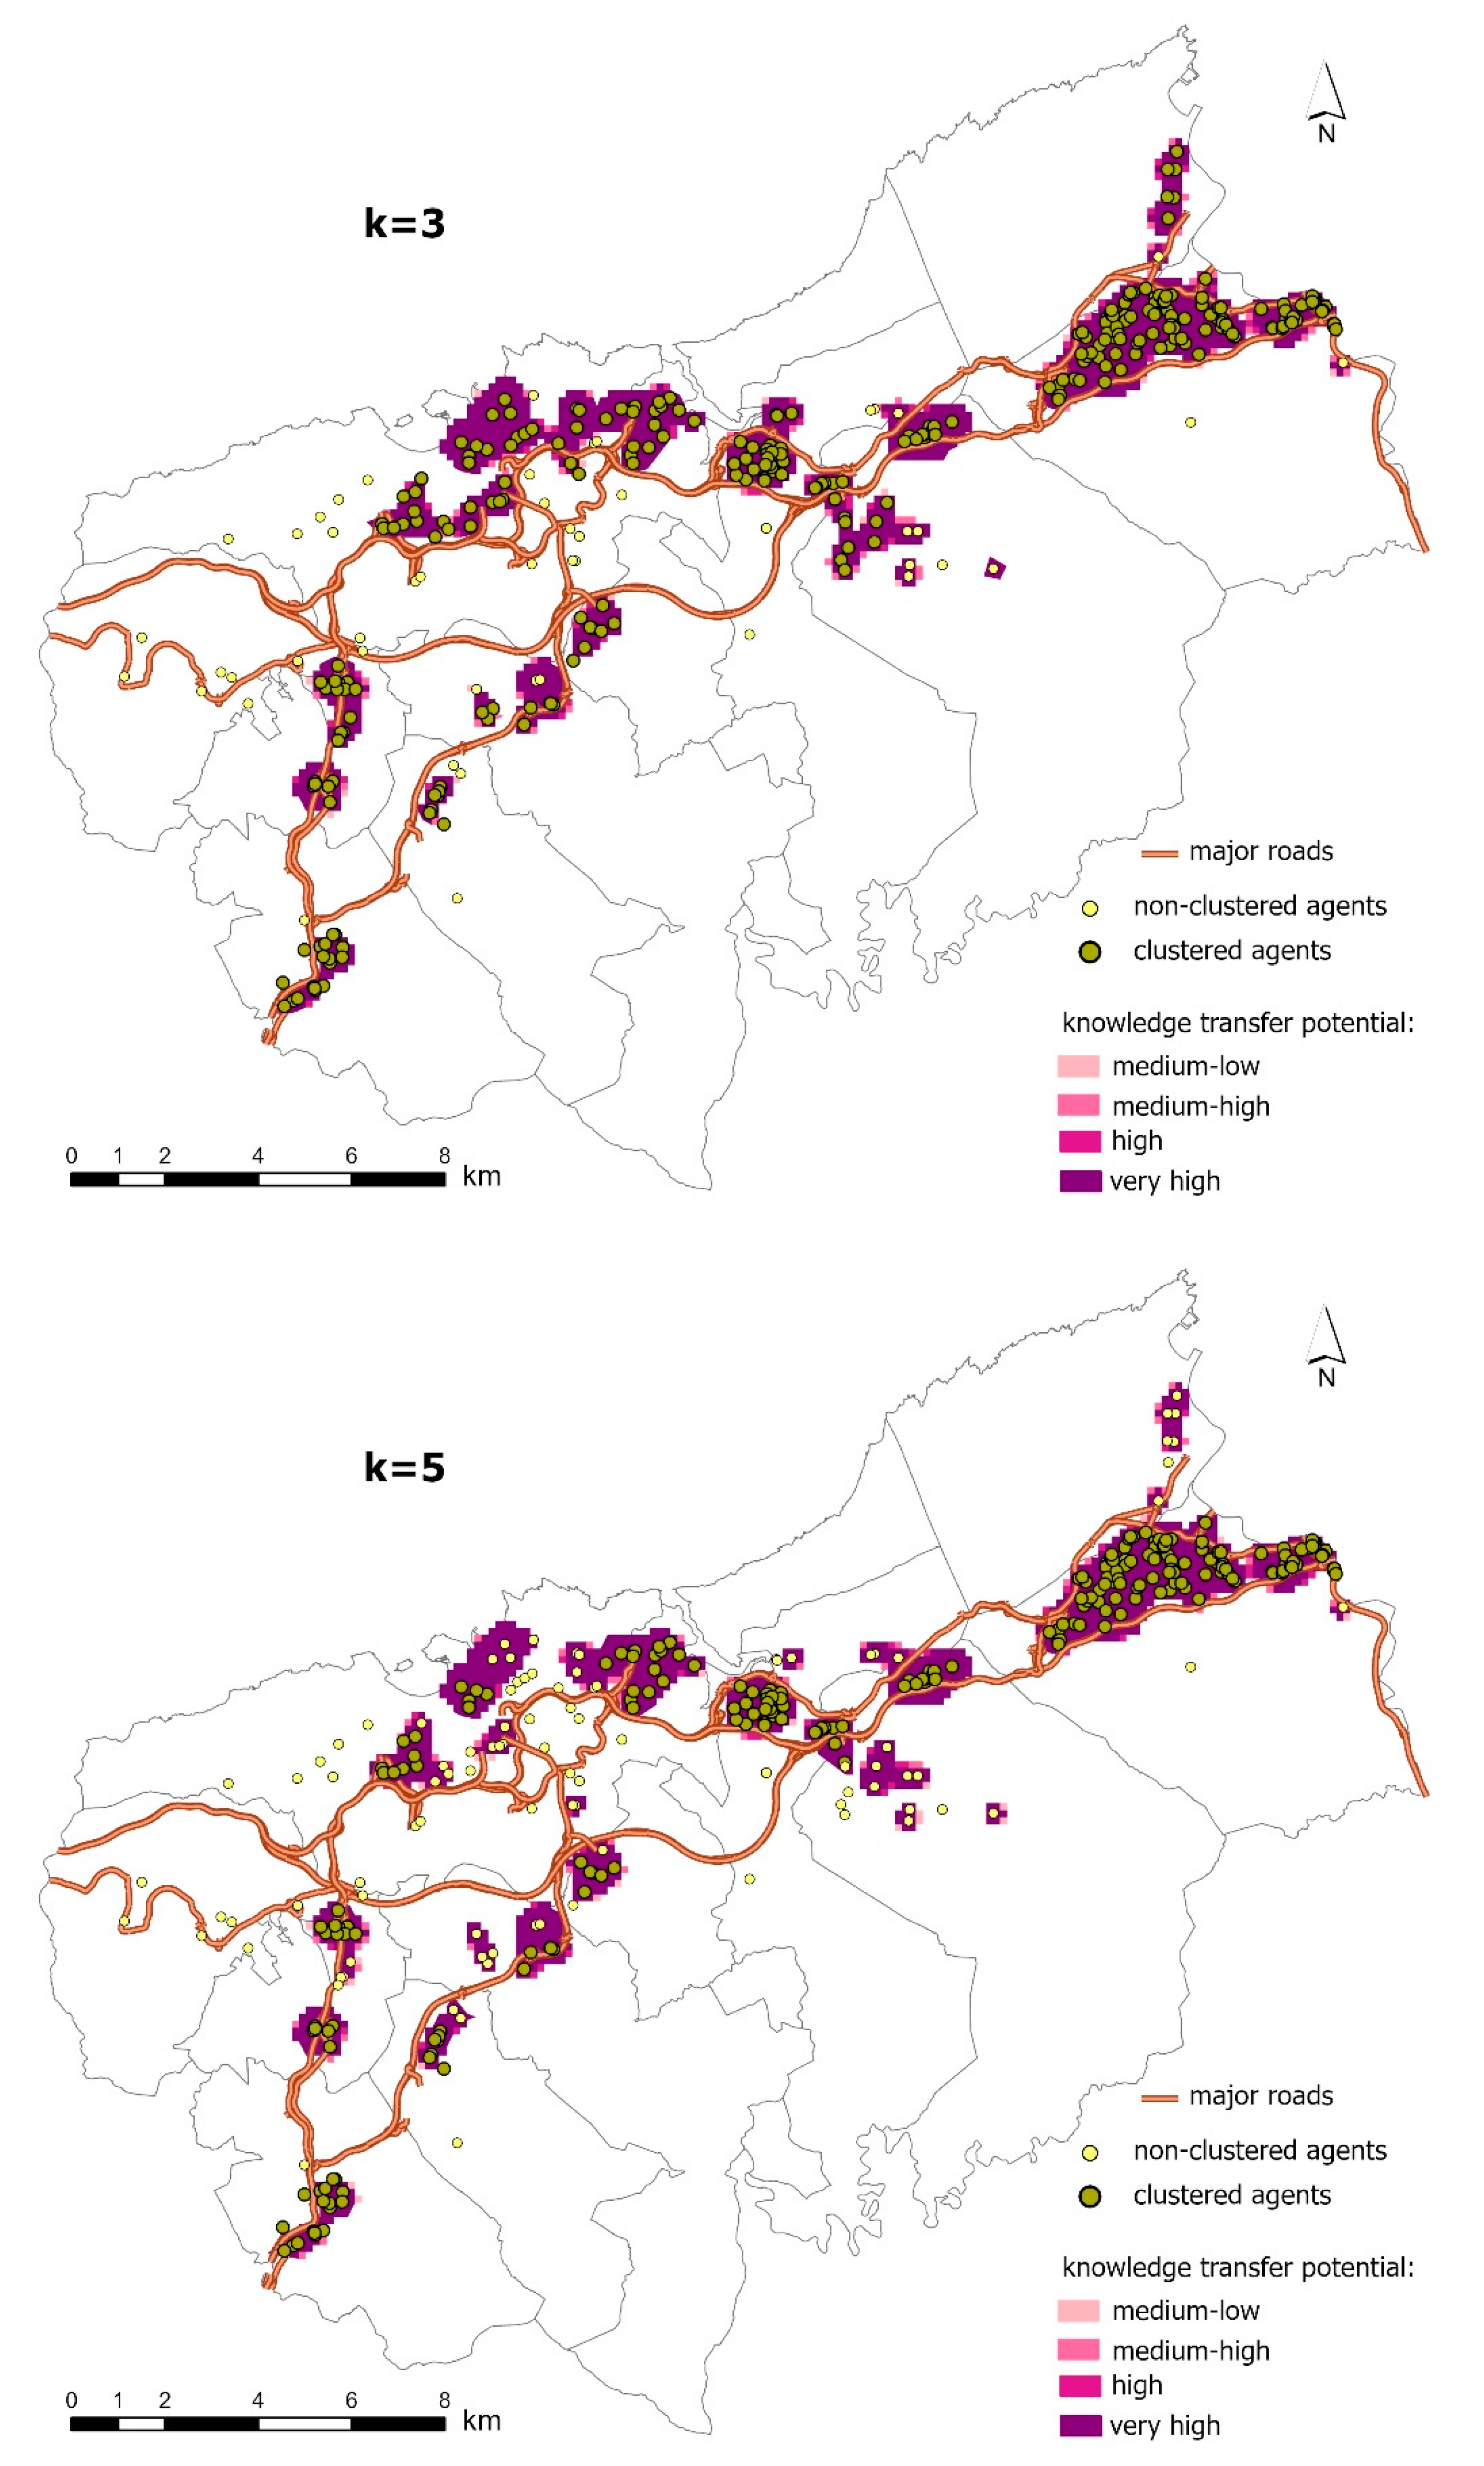
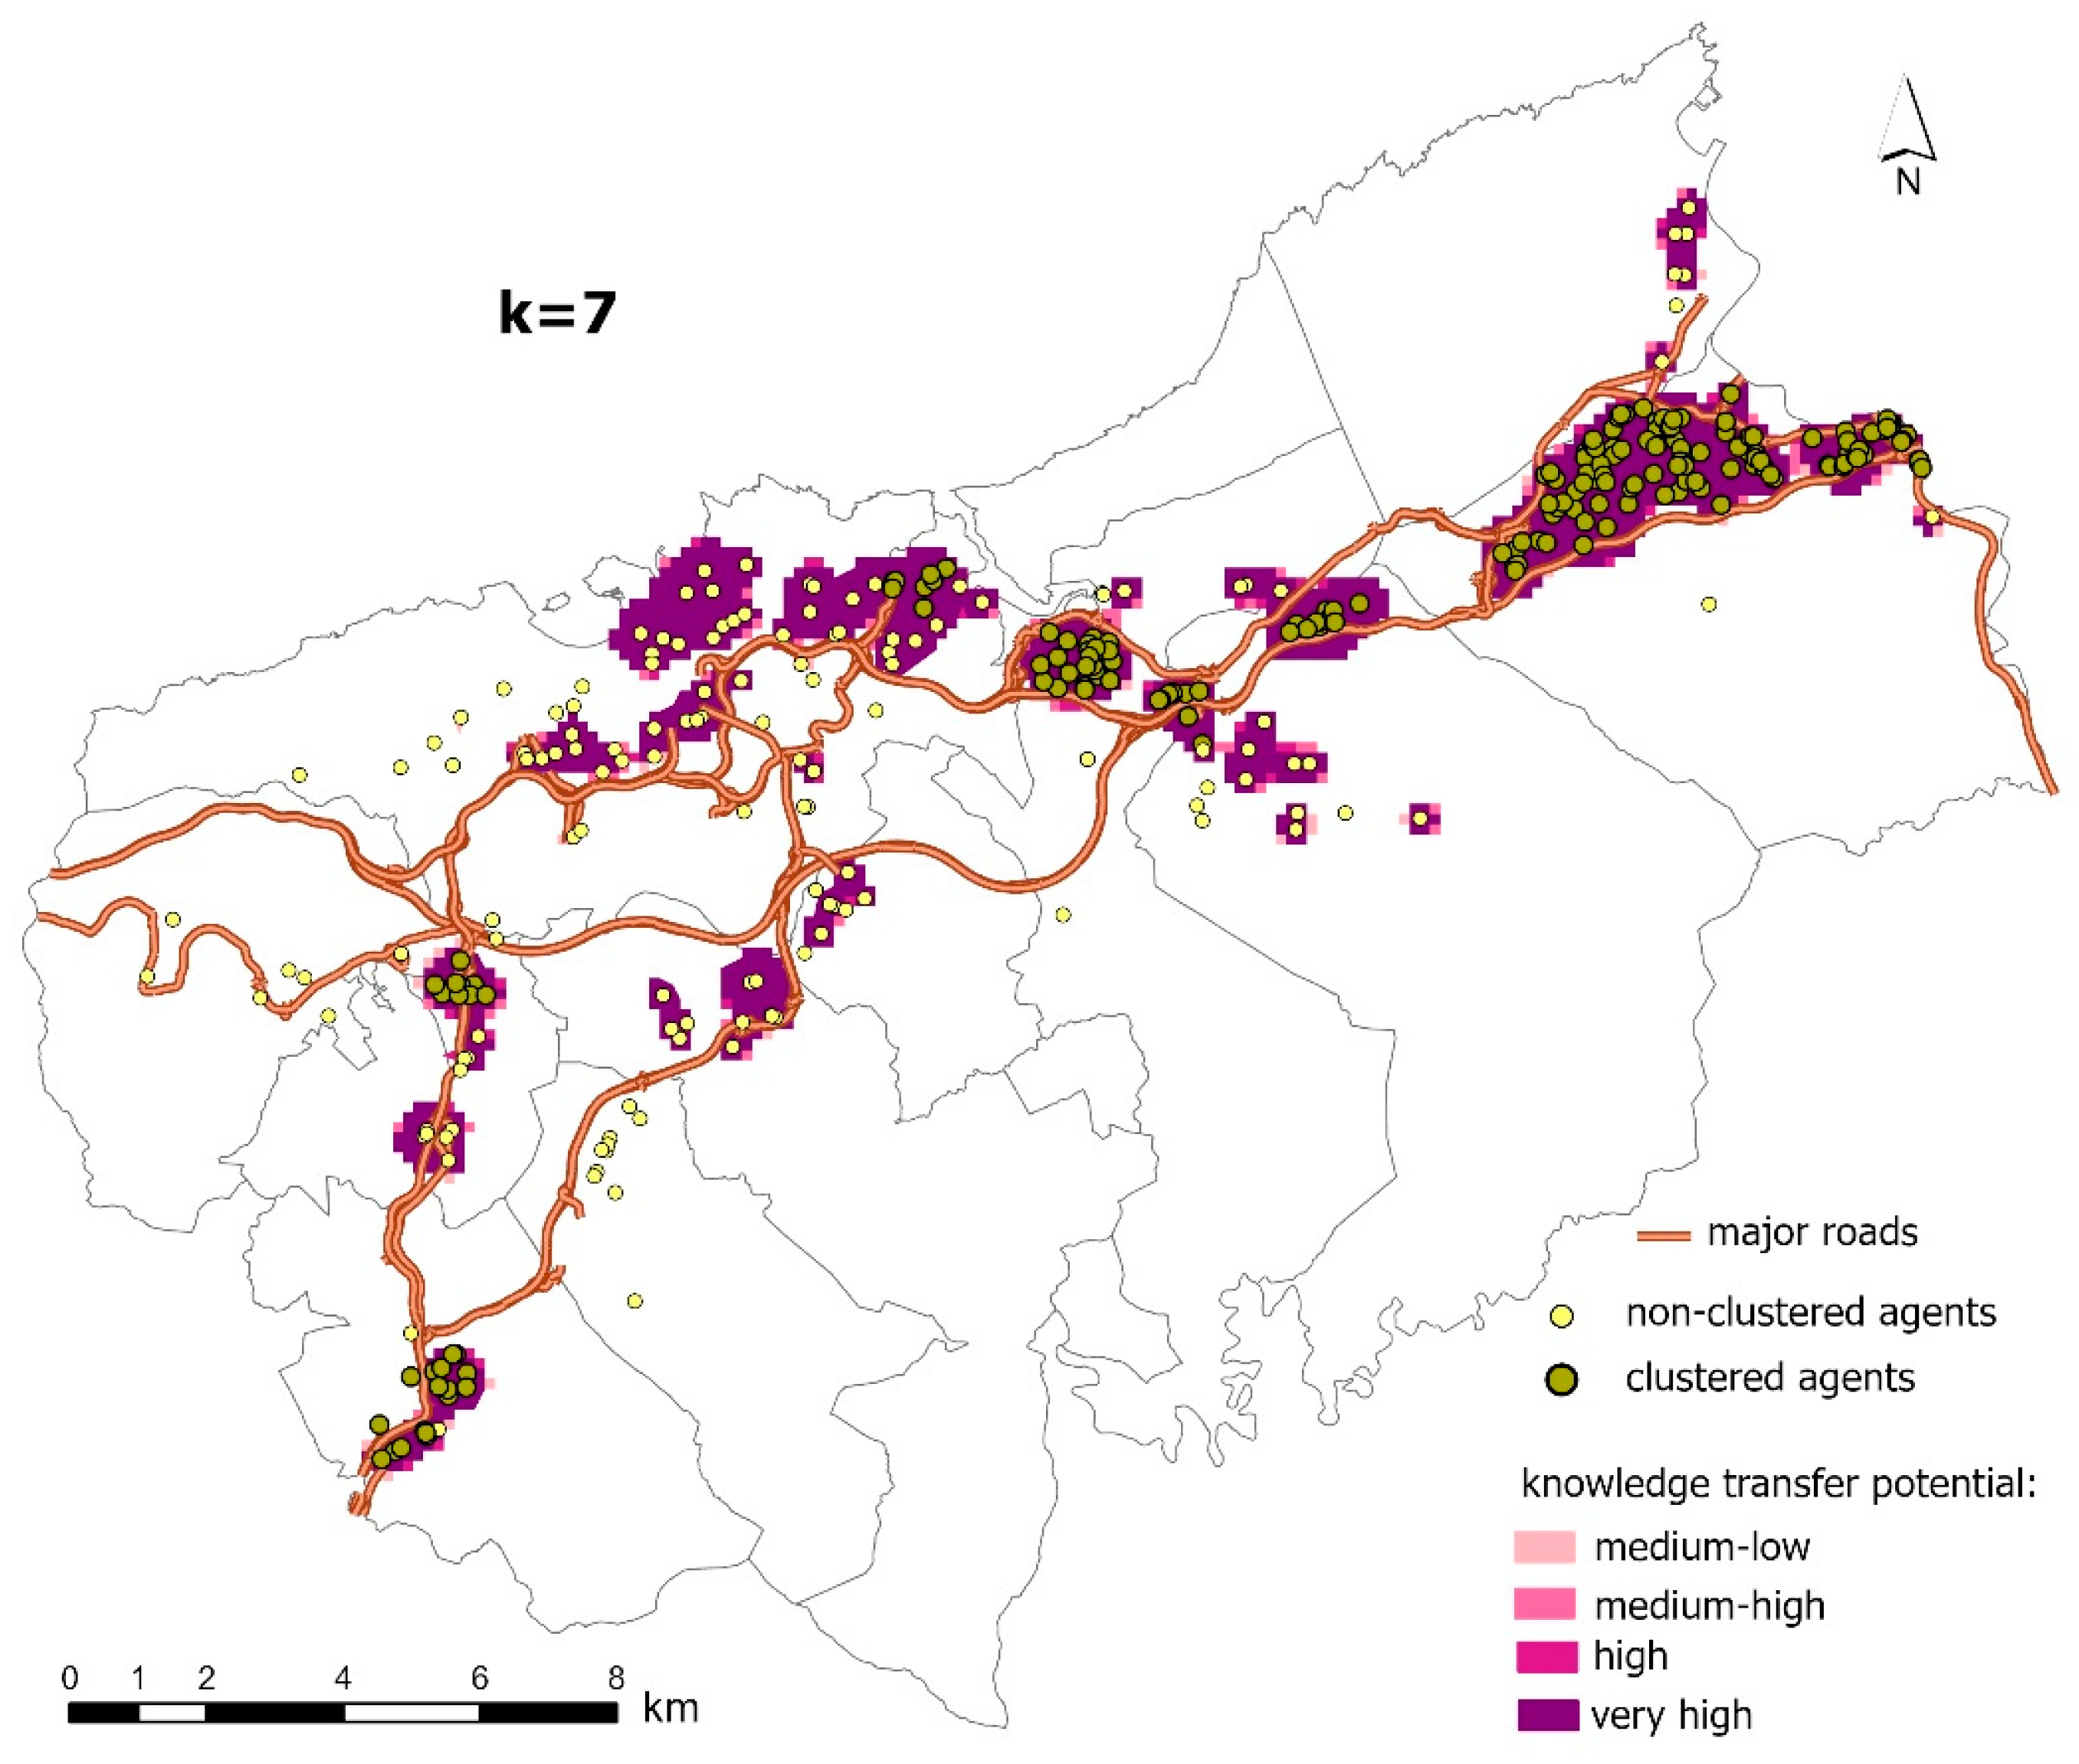
3.4.3. Identifying Environments with High Potential for Knowledge Generation

The knowledge acquired by the actors can be transferred to the territory, constituting dynamic areas with the potential to create effective collaborative relationships between RFT actors. In order to measure this we propose an expression similar to the LISA spatial association indicators [54], ξ i t = f ( ξ i t , ξ ρ i t ) where ξ i t is the volume of learning accumulated in spatial unit i and time t , and ξ ρ i t are the learning values of the neighbouring units of i. In each simulation, the value of ξ i updates at the end of each of the five days. At the end of each simulation, a potential knowledge transfer value is extracted for each patch, finally establishing an average value of the 15 repetitions.
Accordingly, to identify the environments where the greatest concentration of knowledge takes place, we will employ Moran’s I local indicator of spatial association (LISA), assigning a value to each spatial unit based on Moran’s I indicator according to the expression offered by Anselin [54]
I i = ( z i / m 2 ) j w i j z j
where m 2 equates to n 1 i = 1 n z i 2 [55]. Consequently, Ii returns the value of Moran’s I local indicator for the variable under analysis, where the arithmetic mean of all the observations is equal to the value of Ii. However, the value we seek to represent is the significance of each observation by means of the p-value. When it is necessary to examine multiple hypotheses simultaneously, Brunsdon and Comber [56] suggest using adjustment methods of the p-value to minimise the probability of considering spatial units as false cases in relation to the null hypothesis of non-spatial association. The method used is the False Discovery Rate (FDR) [57], which controls the cases considered to be false alarms in a reduced given proportion. The FDR method not only detects the existence of groupings or clusters but also highlights those other spaces with a marked potential for clusterisation [56]. Both Moran’s I local indicator and the FDR adjustment were calculated in R with the aid of the spdep package [55].

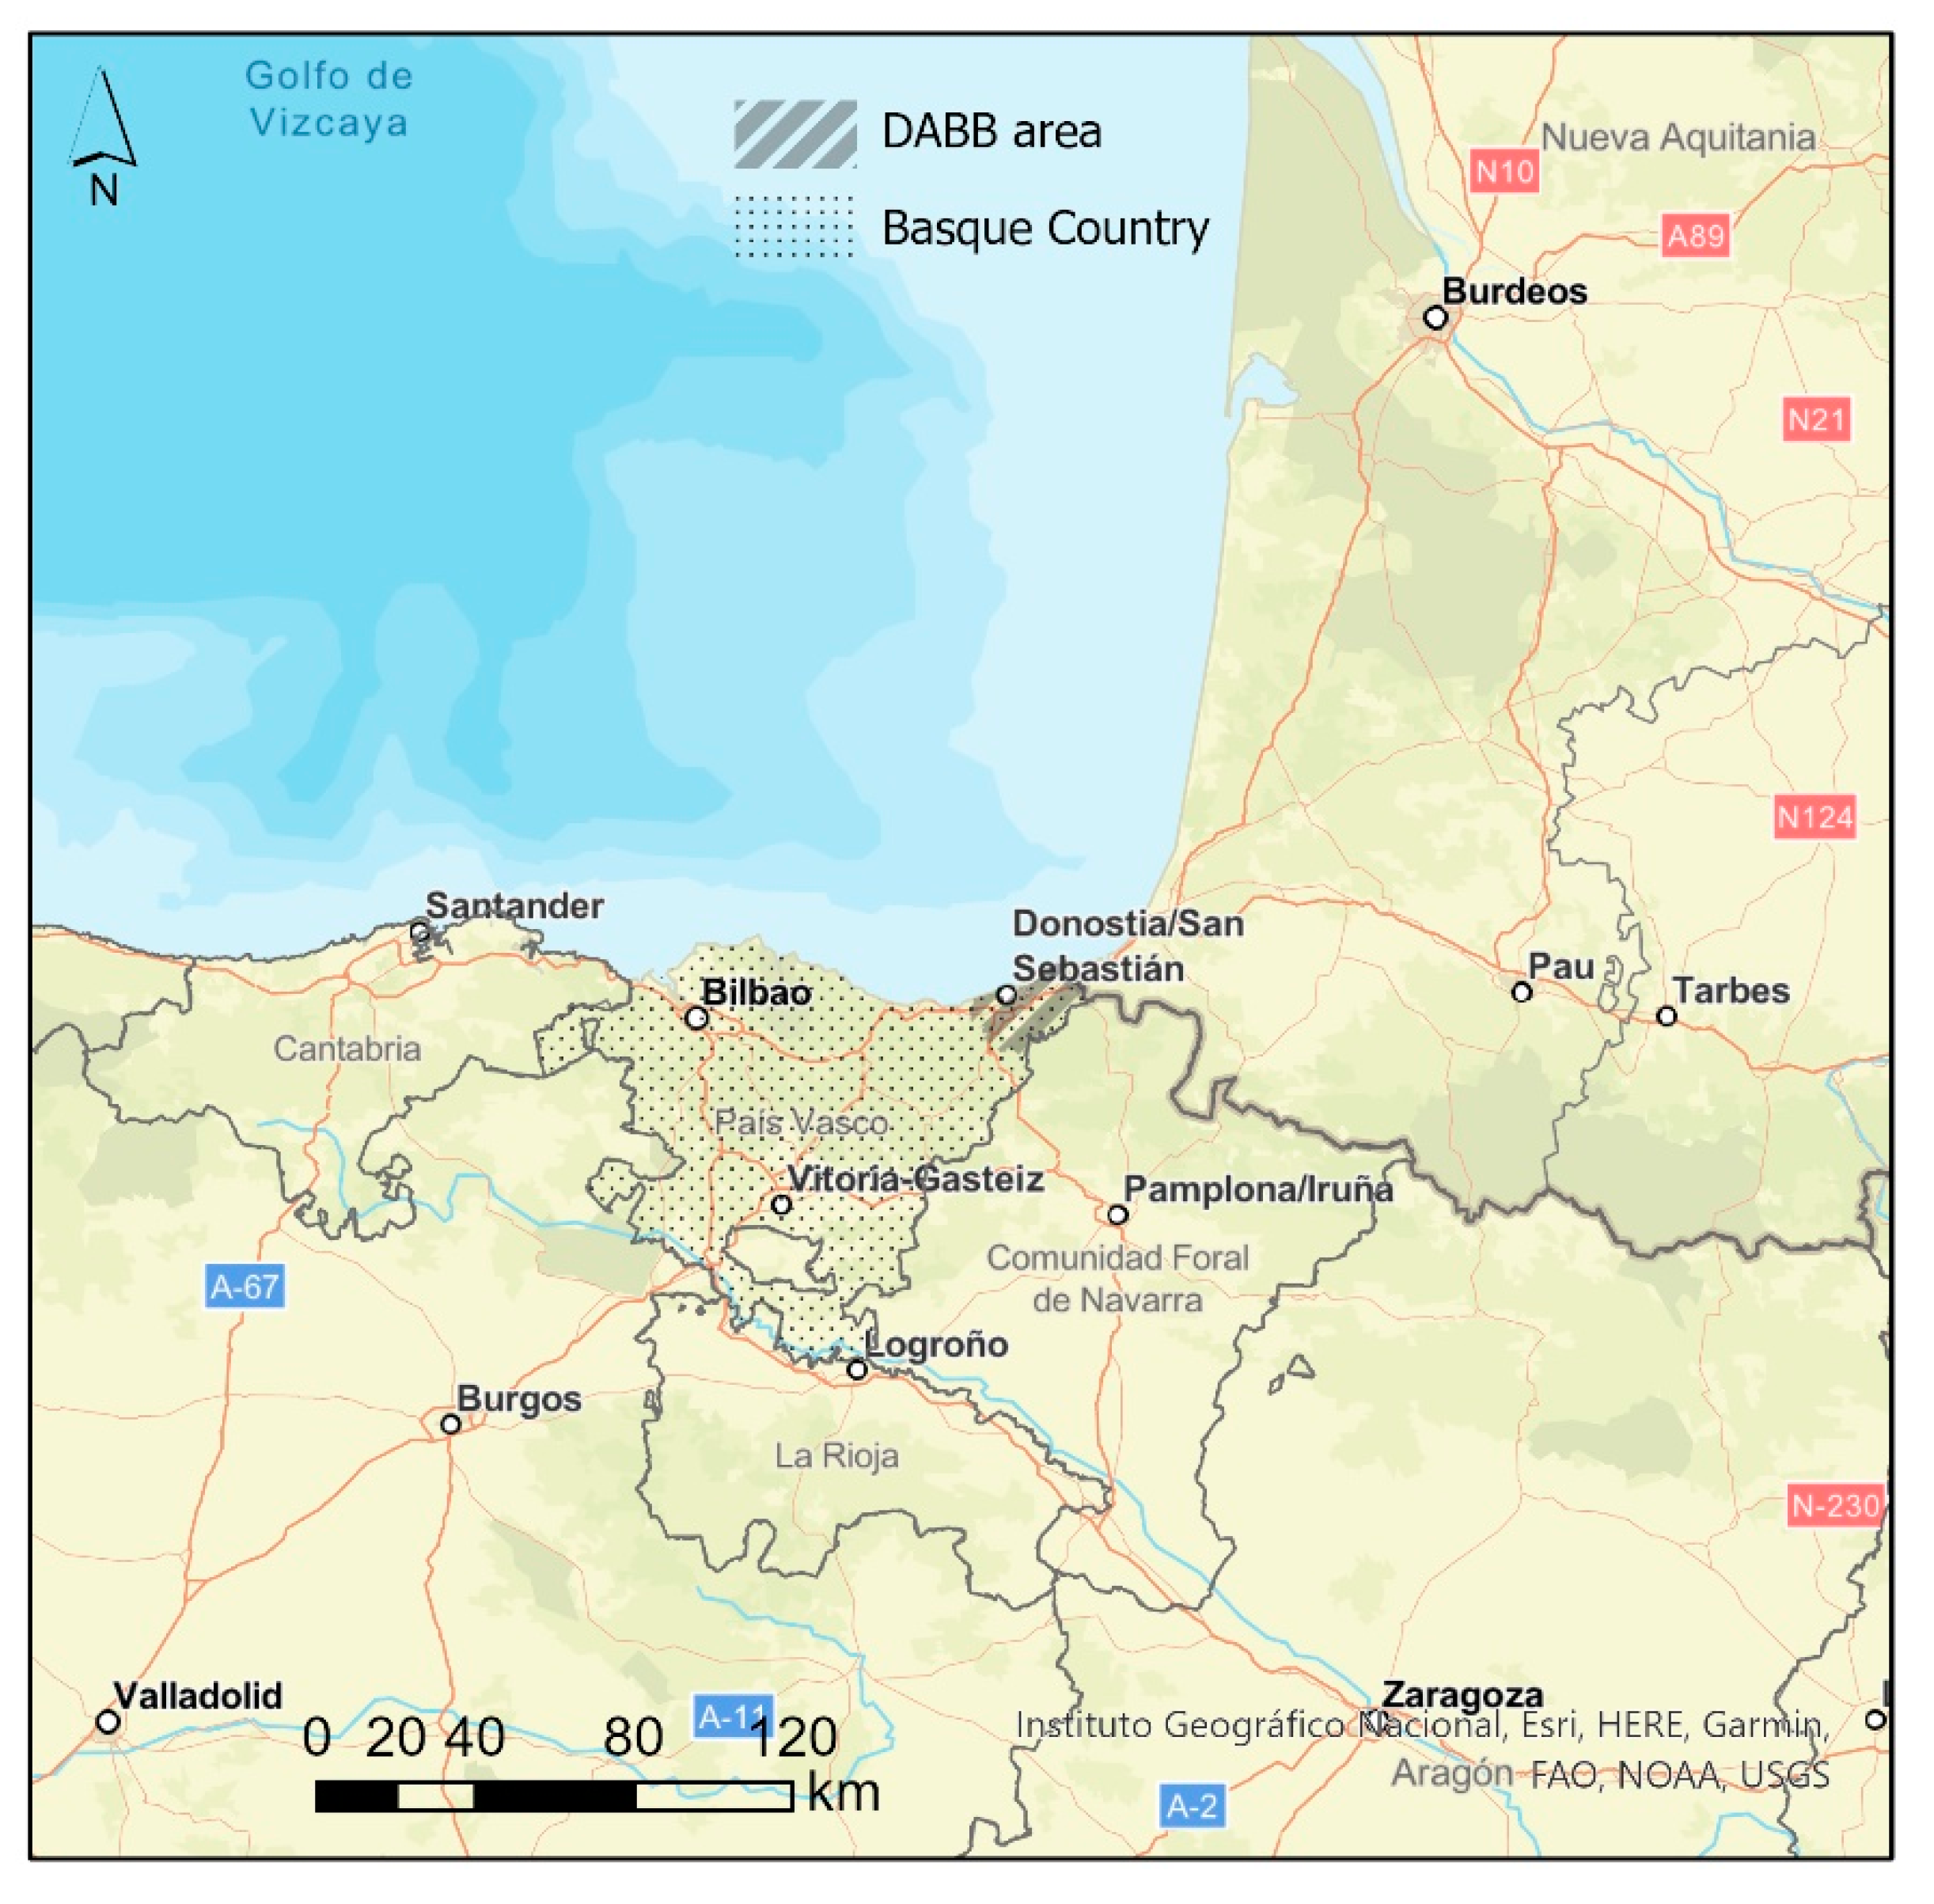
4. Case Study: The DABB Area

The Donostialdea-Bidasoa Beherea area (DABB) is in the far east of the Basque Country (Spain), bordering on France (Figure 3). It is made up of 13 municipalities, including Donostia-San Sebastián, which is the main urban reference. This area presents high levels of RFT companies, due to its border location, its strategic situation in the European Atlantic Arc and its proximity to two first-class logistics platforms in Bordeaux (France) and Zaragoza (Spain).
The model includes 338 of the 1129 companies in the DABB area (Figure 4), according to official data (Mobility and Public Transport Directorate, Gipuzkoa Provincial Council (Basque Country). https://www.gipuzkoa.eus/es/web/mugikortasuna (accessed on February 2020)). In the absence of a register of RFT companies specifying their role in transport chains, the convenience sampling method was used with the help of the Guitrans (Association of Carriers in Gipuzkoa) registers. Of these companies, 23 are Freight Forwarders (FF), 116 are Transport Companies (TC) and 199 are Self-employed Carriers (CA), all located in the DABB area. A survey aimed at RFT professionals in DABB (available as Supplementary Material) revealed sufficient evidence on interaction and collaboration processes between sector companies at an operating level, in other words, in the field of outsourcing aimed at covering transport needs [53].
The survey also asked RFT subcontracting companies to rate the importance of the competences used to select transport providers, as explained in Section 3.2. Table 1 shows in each row the value of the variables when the requirement for one of them is highest. Trust ranked higher than competitiveness and availability. These values are starting parameters, although a degree of randomisation is then introduced for each variable in order to differentiate agents [47].
In the model, each company is included with data relating to their real transport capacity. This capacity is quantified by means of the number of motor vehicles, both tractor trucks and trailers, that each company has (Spanish Ministry of Transport, Mobility and Urban Agenda. Register of companies and transport activities). Each agent thus starts with a determined transport capacity due to their own circumstances and the general availability of vehicles. Furthermore, with a view to recreating a competitive dynamic in the selection of TSP, the model introduces a certain randomness in the aptitude values of each agent.

5. Results

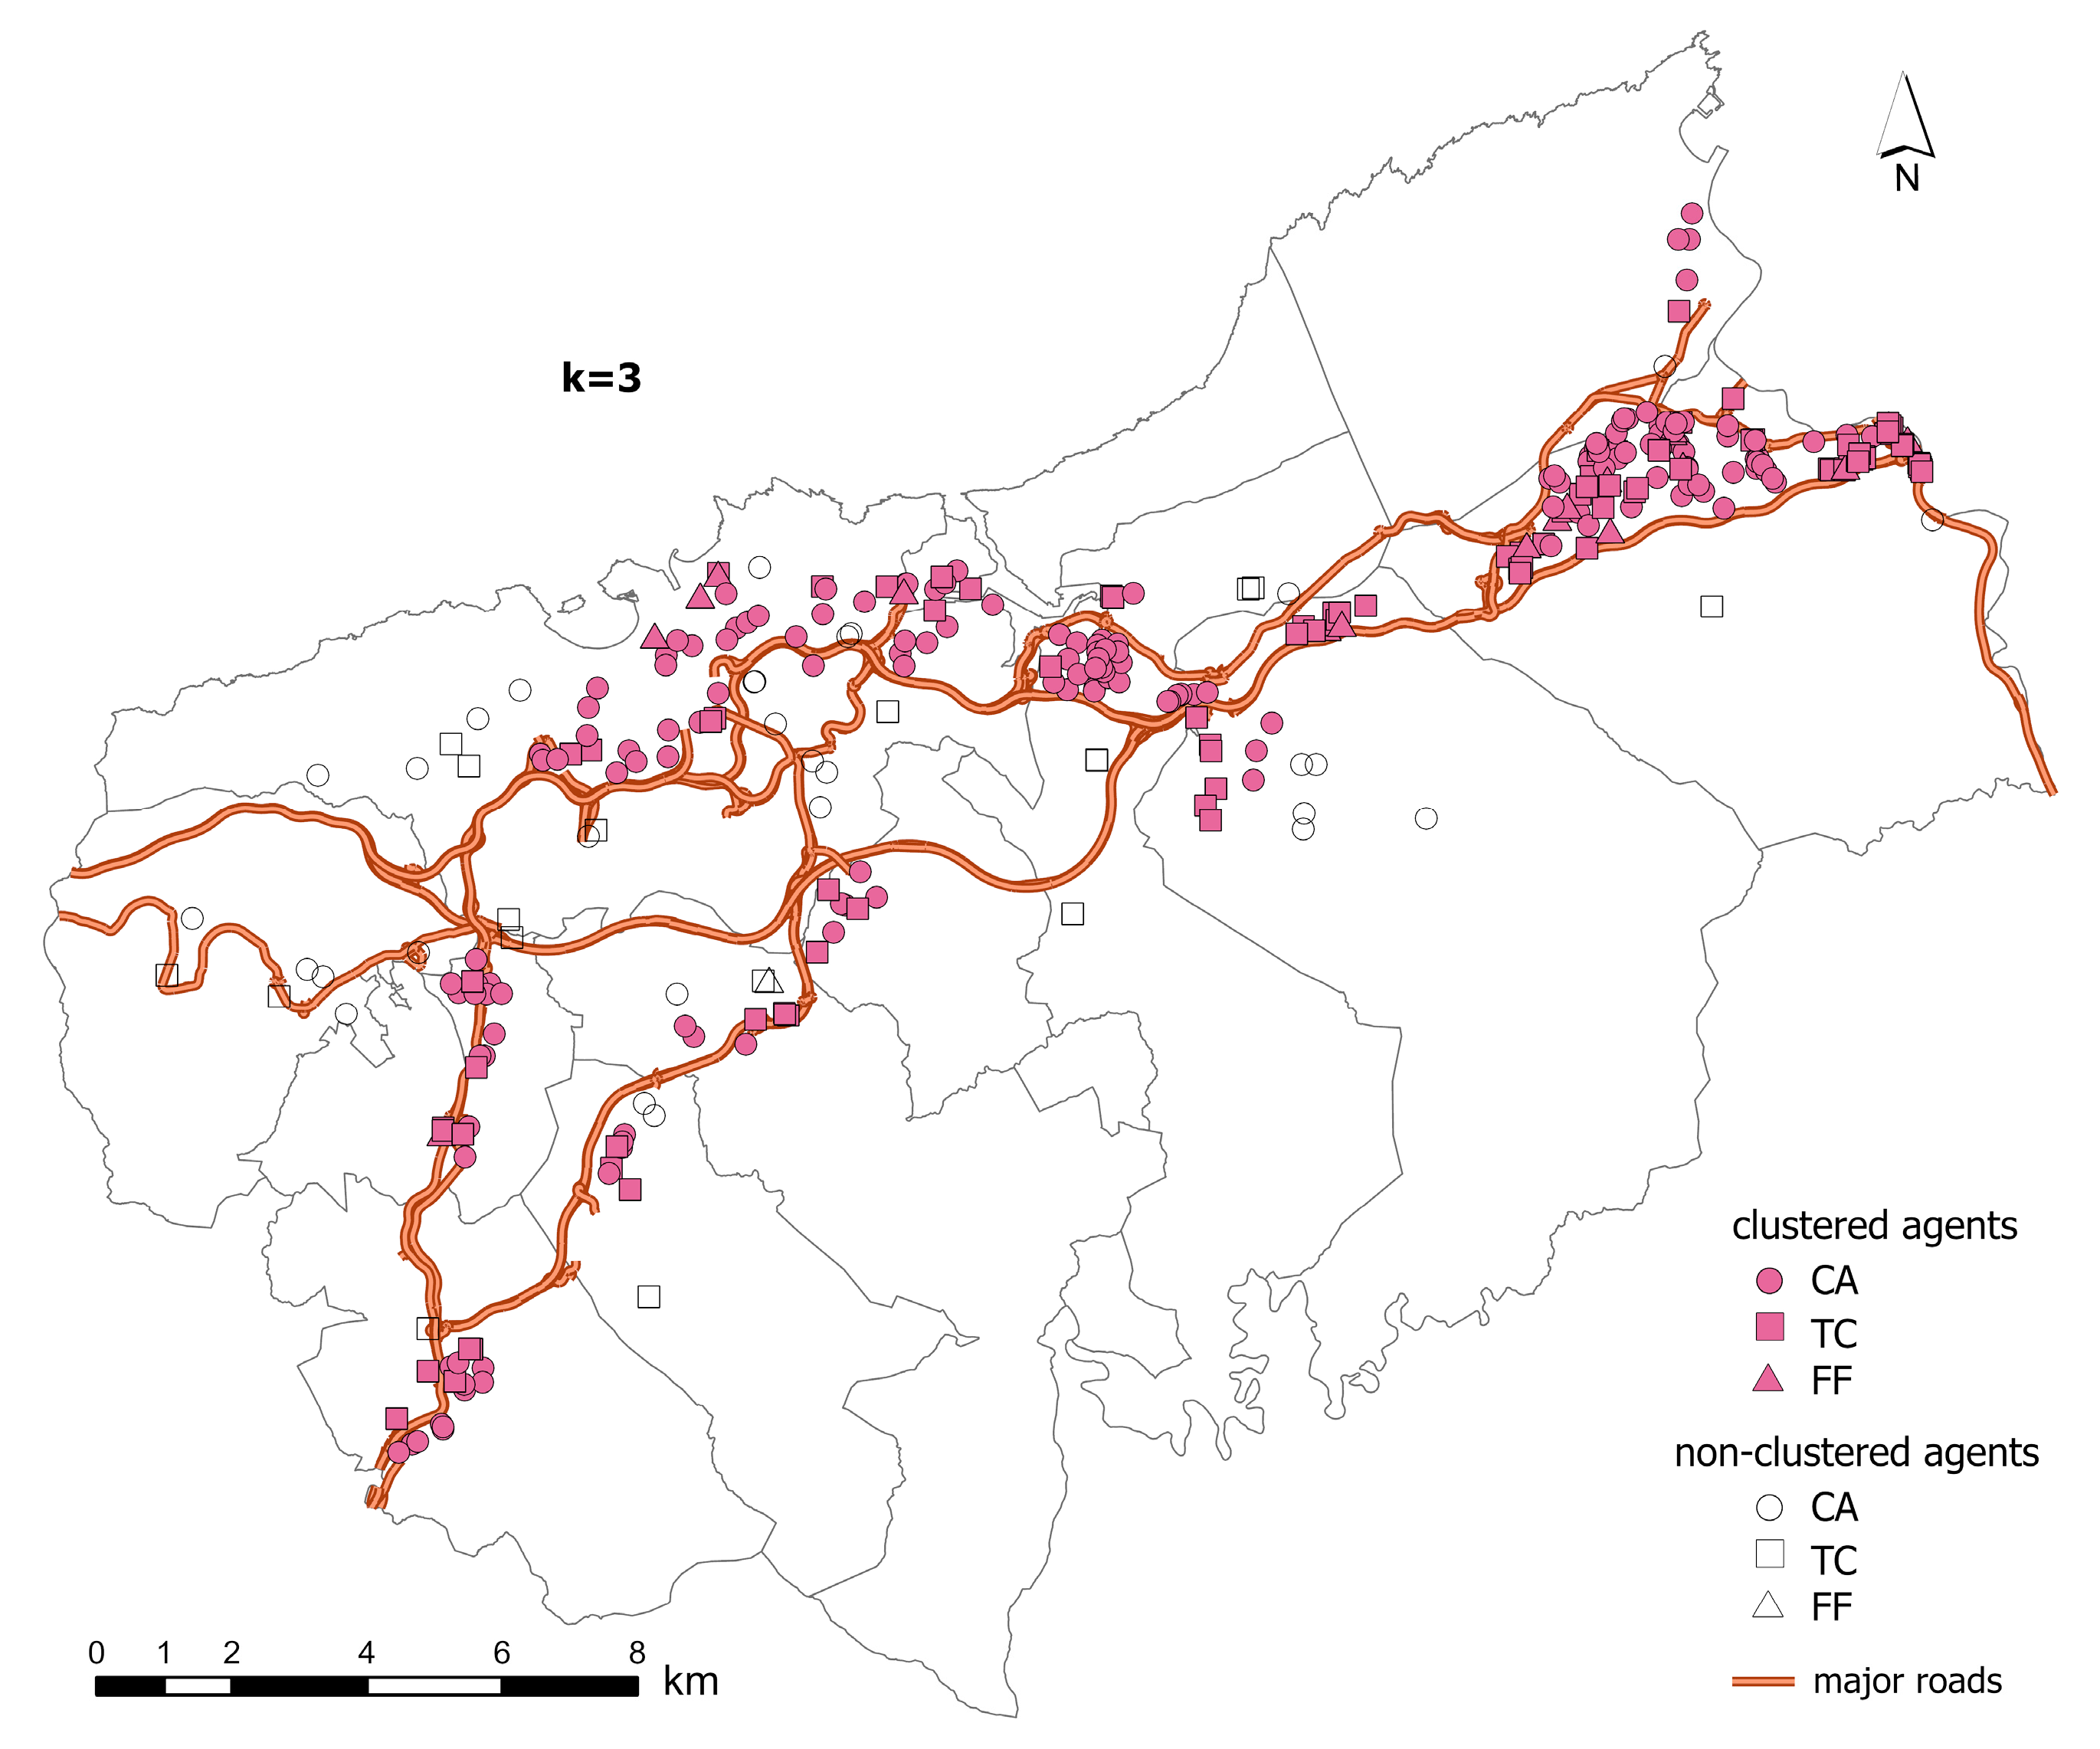
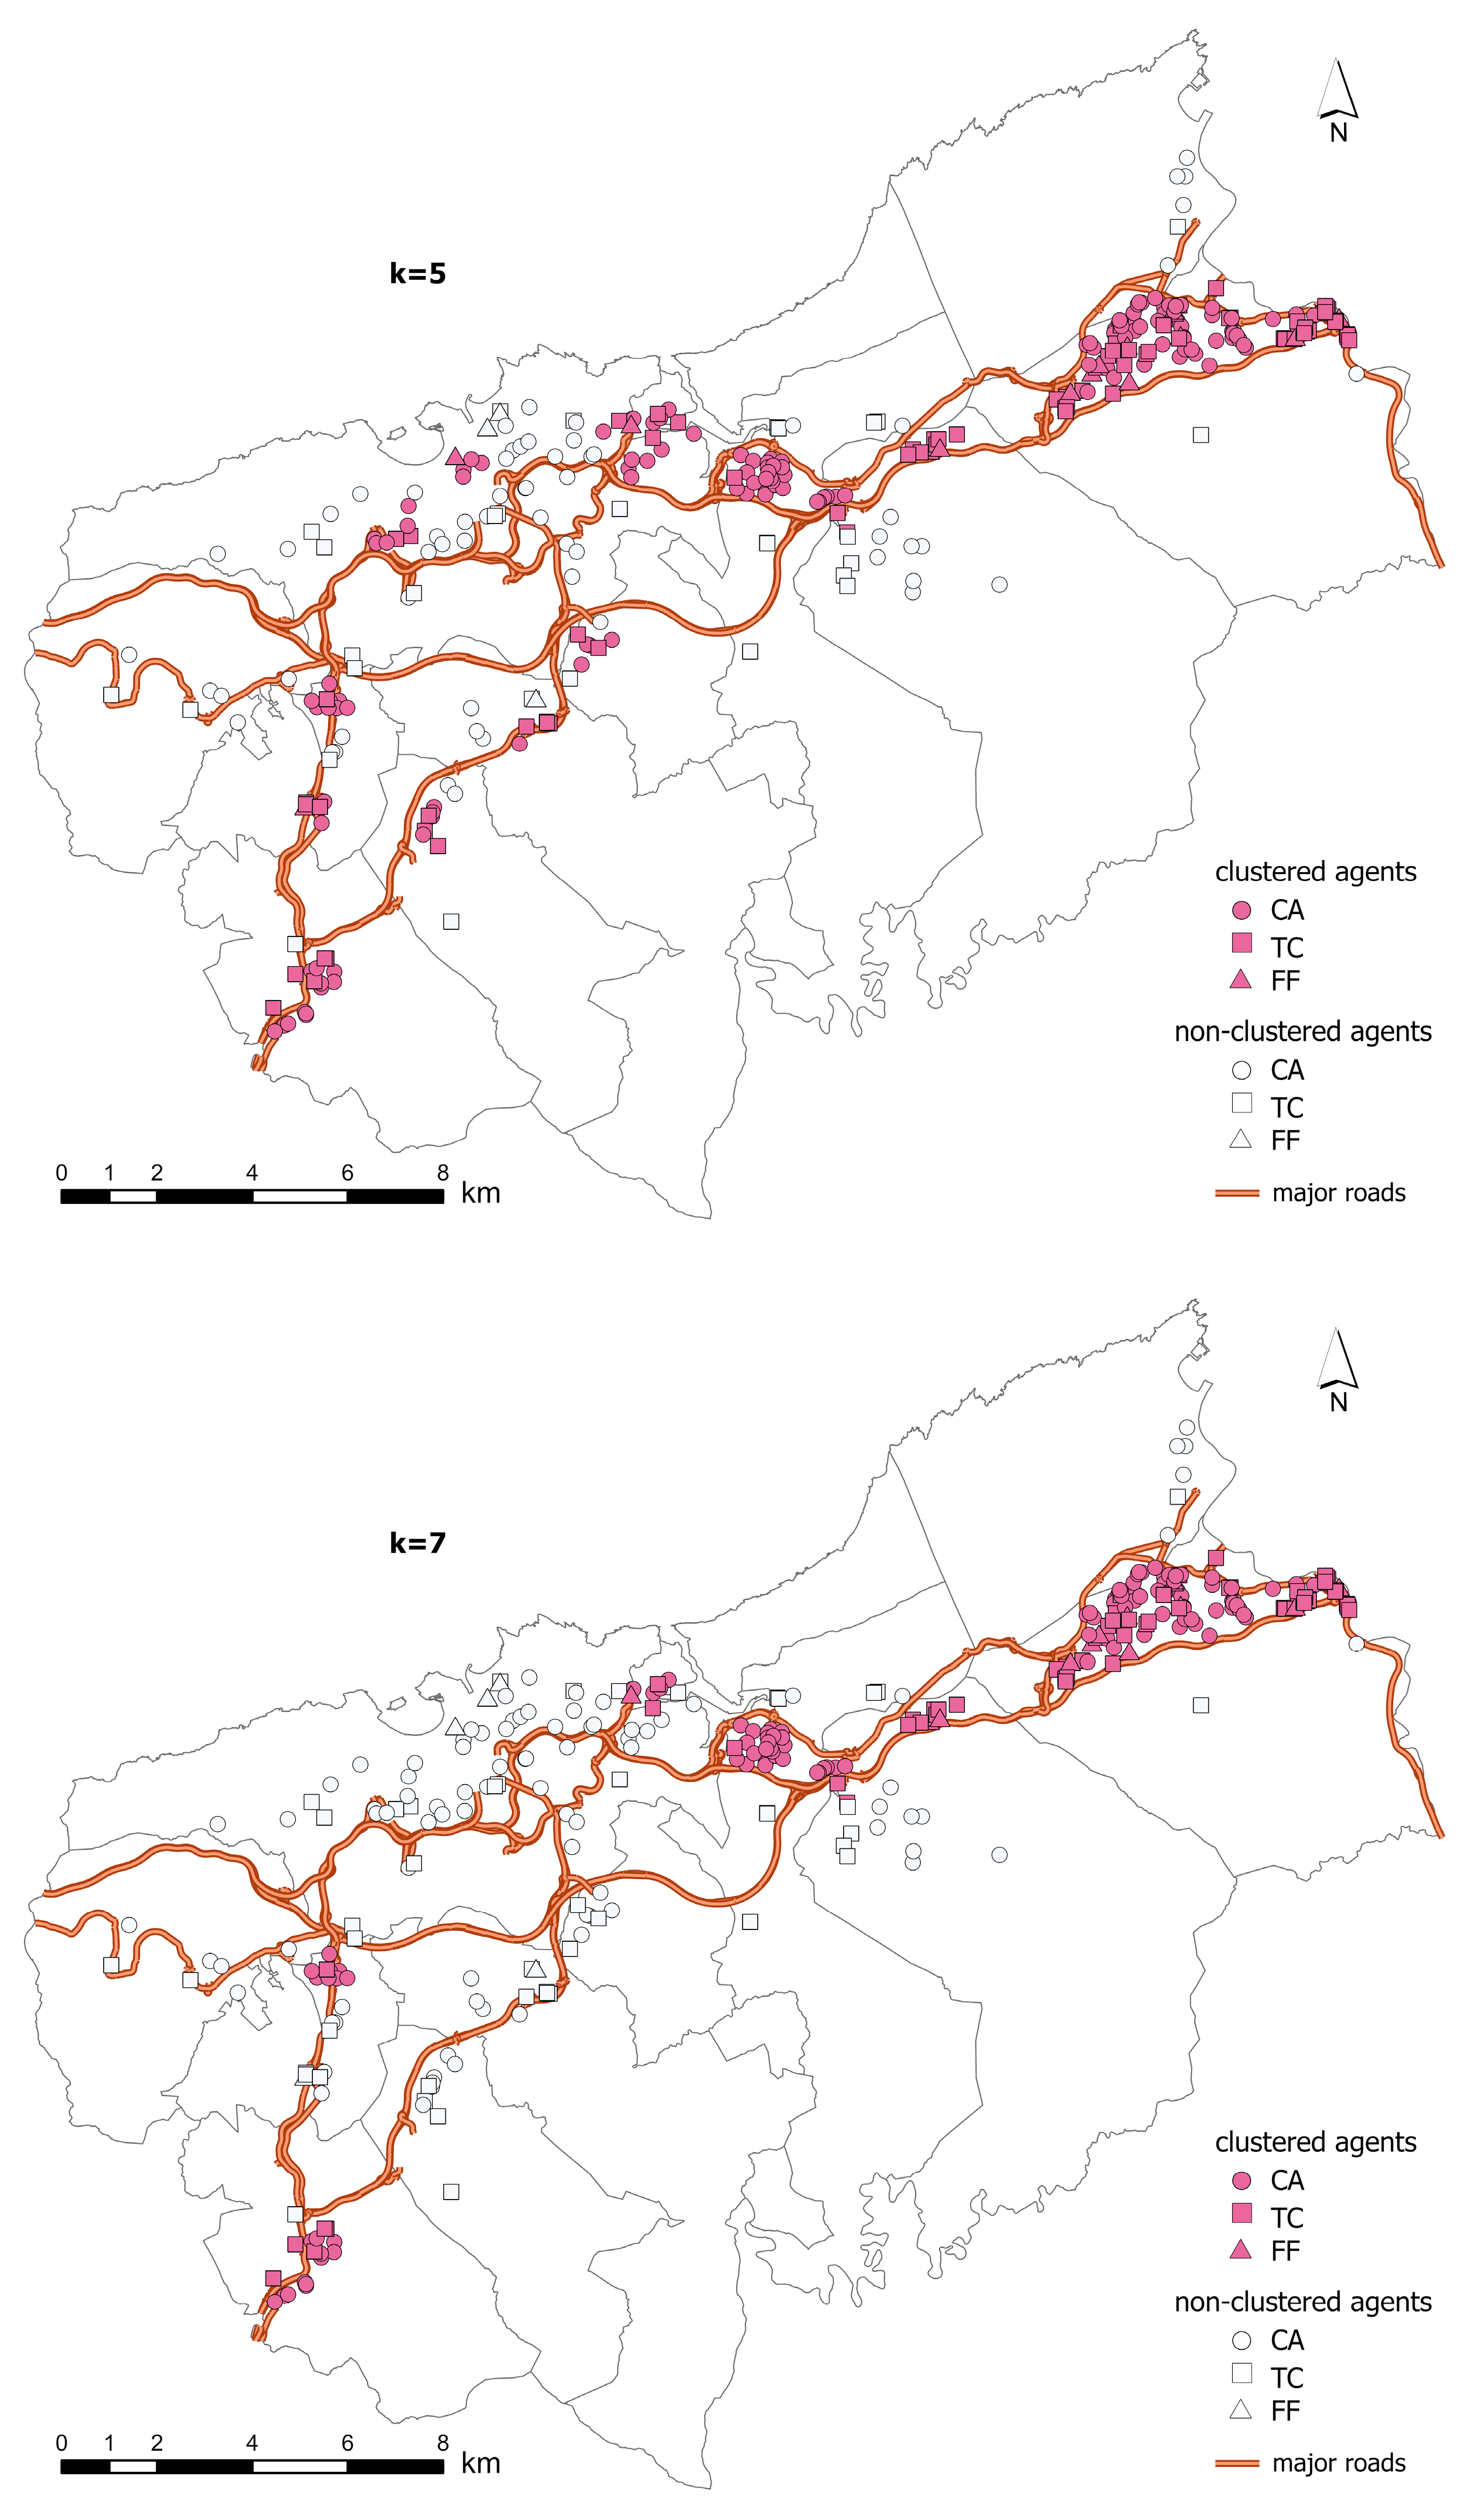
5.1. Spatial Clustering

Table 2 shows the details for each of the scenarios according to the three proposed cluster levels. The scenario with k = 3 shows a very high number of clusters (27), with an average of 12 firms per cluster, while in k = 7 the number of clusters is significantly reduced (10) and the average number of firms per cluster increases to 31. Nevertheless, the size of the largest cluster remains constant in all three scenarios, which suggests the existence of a stable core in the system. It is also significant that the number of non-clustered agents rises from 14% for k = 3 to 41% in k = 7. This shows a high territorial dispersion of activity in the area.
The spatial distribution of the clusters, located along the major roads, is shown in Figure 5. The high spatial dispersion visible for k = 3 contrasts with the strong concentration of large clusters for k = 7 mainly to the east of the DABB area, close to the border area of Irun.

5.2. TOC Simulation

The simulation consisted of the assignment of 2385 transport operations over five days, generating 4770 outsourcing operations in each scenario. The results for the three proposed scenarios are shown below.

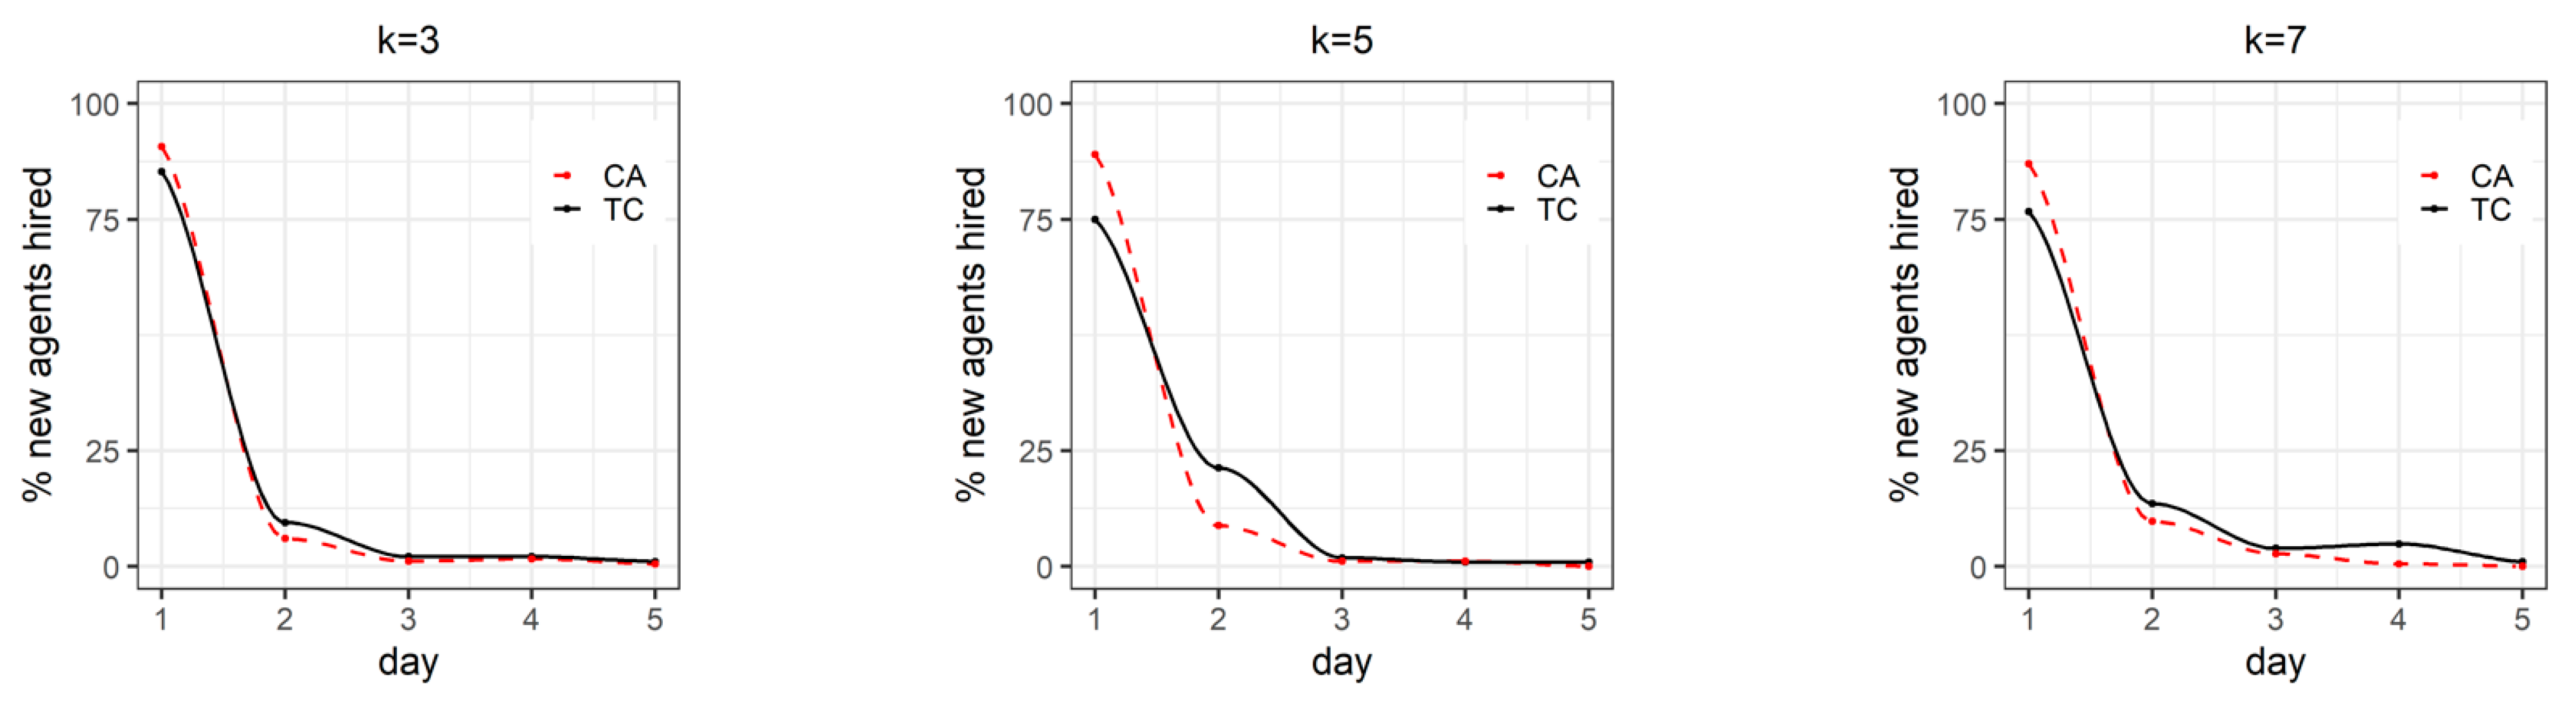
5.2.1. Temporal Distribution of Hiring

A collaboration system between RFT companies is a complex social network that learns and evolves in its search for increasingly more effective and productive solutions. Accordingly, an important aspect is the time distribution of the outsourcing (Figure 6). The conduct of the model reveals that most CA are contracted by the TC on the first day, and these will continue trusting in their providers during the rest of the outsourcing period. However, the incorporation of new TC in the collaboration network on the first day is less pronounced the larger the value of k. One possible explanation for this phenomenon lies in the greater potential for the transfer of information and knowledge of the largest clusters, which could give the TC that did not participate in the first day of operations new opportunities.
To analyse the relationships between the dynamic of outsourcing and the Euclidean distance separating the agents that formalise a contract, the Spearman correlation coefficient [58] was then applied, which offered positive relationship values between the variables in the three scenarios. However, this correlation decreases as the outsourcing process develops in all scenarios; from ρ = 0.65 for the first day to ρ = 0.42 for the last day. This would seem to indicate that the initial client preference to firstly select the closest TSP loses weight as the clusters gain internal robustness.
Figure 7 illustrates a clear trend towards an increase in the average distance between customers and TSPs, which becomes more pronounced as the end of each day approaches (vertical dotted lines). However, the most distant TSPs only manage four to six contracts per day (orange circles), while some of the closest TSPs accumulate more than twelve contracts by the end of the workday (purple circles), reinforcing the idea of clusters that are increasingly cohesive but also more dependent on external TSPs. Accordingly, the clusters function as demand for clients, even when providers are not in the same spatial grouping.

5.2.2. Evolving Towards Complexity

Network complexity is manifested by the growth of the network as it evolves and by the preferential attachment allowed by Equation (1). These are two defining features of scale-free networks [59]. In this context, Figure 8 illustrates the outcomes of two of the most significant centrality metrics for measuring the complexity of a network: degree centrality (Picture A) and betweenness centrality (Picture B). The pictures represent weighted networks, where the higher number of hubs is due to both the number of collaborations and to their diversity [60]. It is very significant to observe how the uneven distribution of outsourcing is clearly reflected in the spatial distribution of the activity, which is concentrated in the border zone to the east of the DABB area, which branches out inland, leaving several agents in the west inactive. It can also be observed how degree values correspond to high betweenness levels. The three scenarios illustrate the pivotal intermediation role played by TC in the eastern half of the area, which enables them to structure the transport activity throughout the territory.
Table 3 presents the results of adding closeness centrality (CC) to the degree centrality (DC) and betweenness centrality (BC) depicted above, obtained in R using Igraph [61] and fastnet [62]. The average of the normalised metrics of the 15 replicates calculated for each agent and scenario is shown. The values range from zero, indicating total equilibrium in centrality values, to one, when a single agent is fully central to the rest. The results reflect differences between the scenarios, with an increase in the concentration of transport activity as k is higher. However, the improvement is not homogeneous, since it is the agents integrated in a cluster that play a more central role in the network than those agents that do not benefit from the synergies of the business neighbourhood.
Furthermore, the global measures that indicate the variability of the centrality of agents in each scenario are degree centralisation (CD), closeness centralisation (CC), and intermediation centralisation (CB). Each of these values is the result of the centralisation of the network for each of the global centrality metrics and is obtained by applying the equation proposed by Freeman [63]. As a consequence, the global values exhibit a comparable dynamic to the local centrality measures, indicating an increase in the concentration of activity (CD) and in the influence of certain agents (CB) as the size of the clusters increases and the number of clustered agents decreases. Nevertheless, the clustering of agents is not identified as a factor influencing their participation in the network.

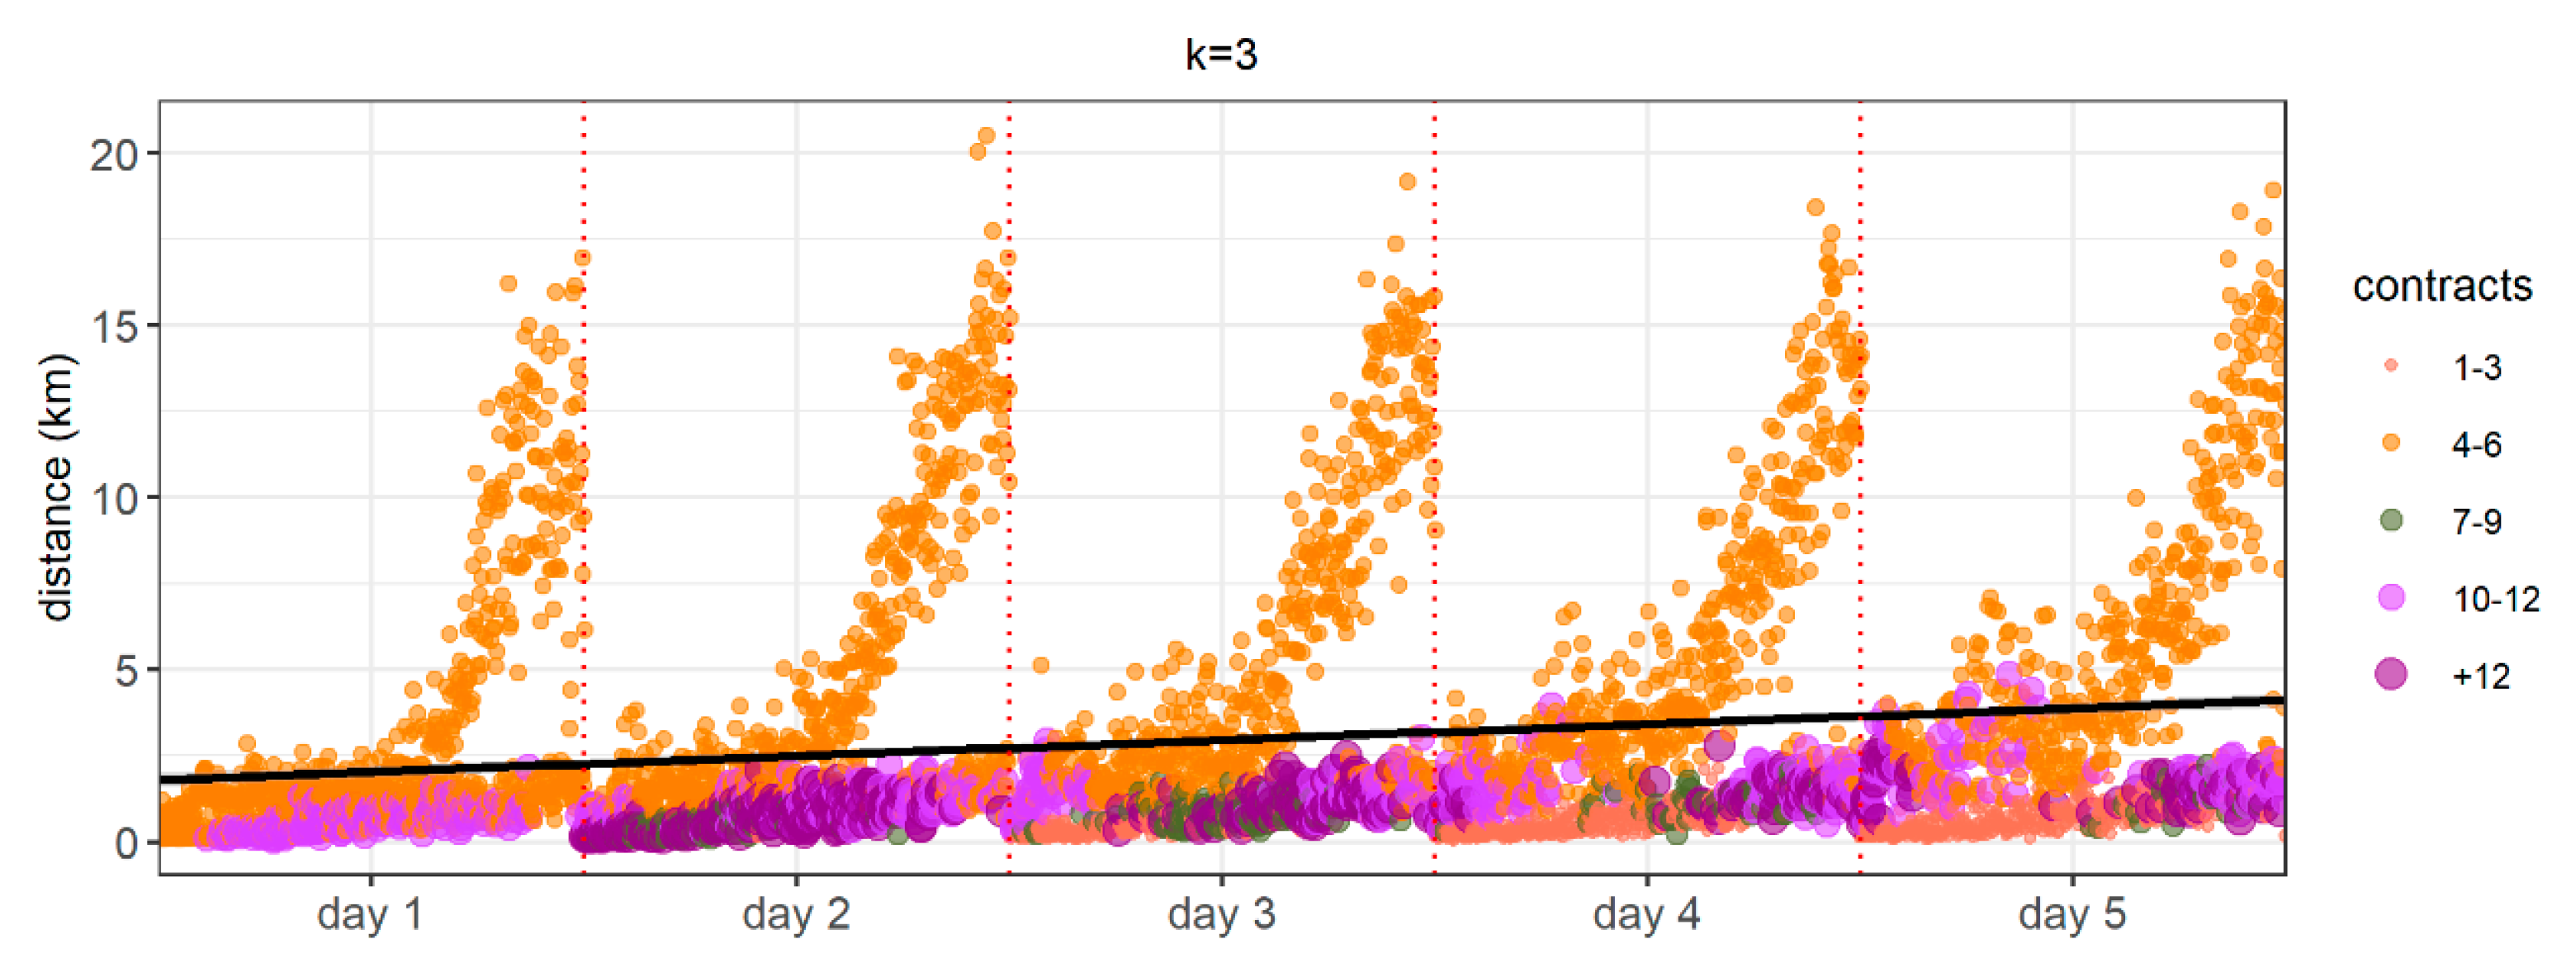
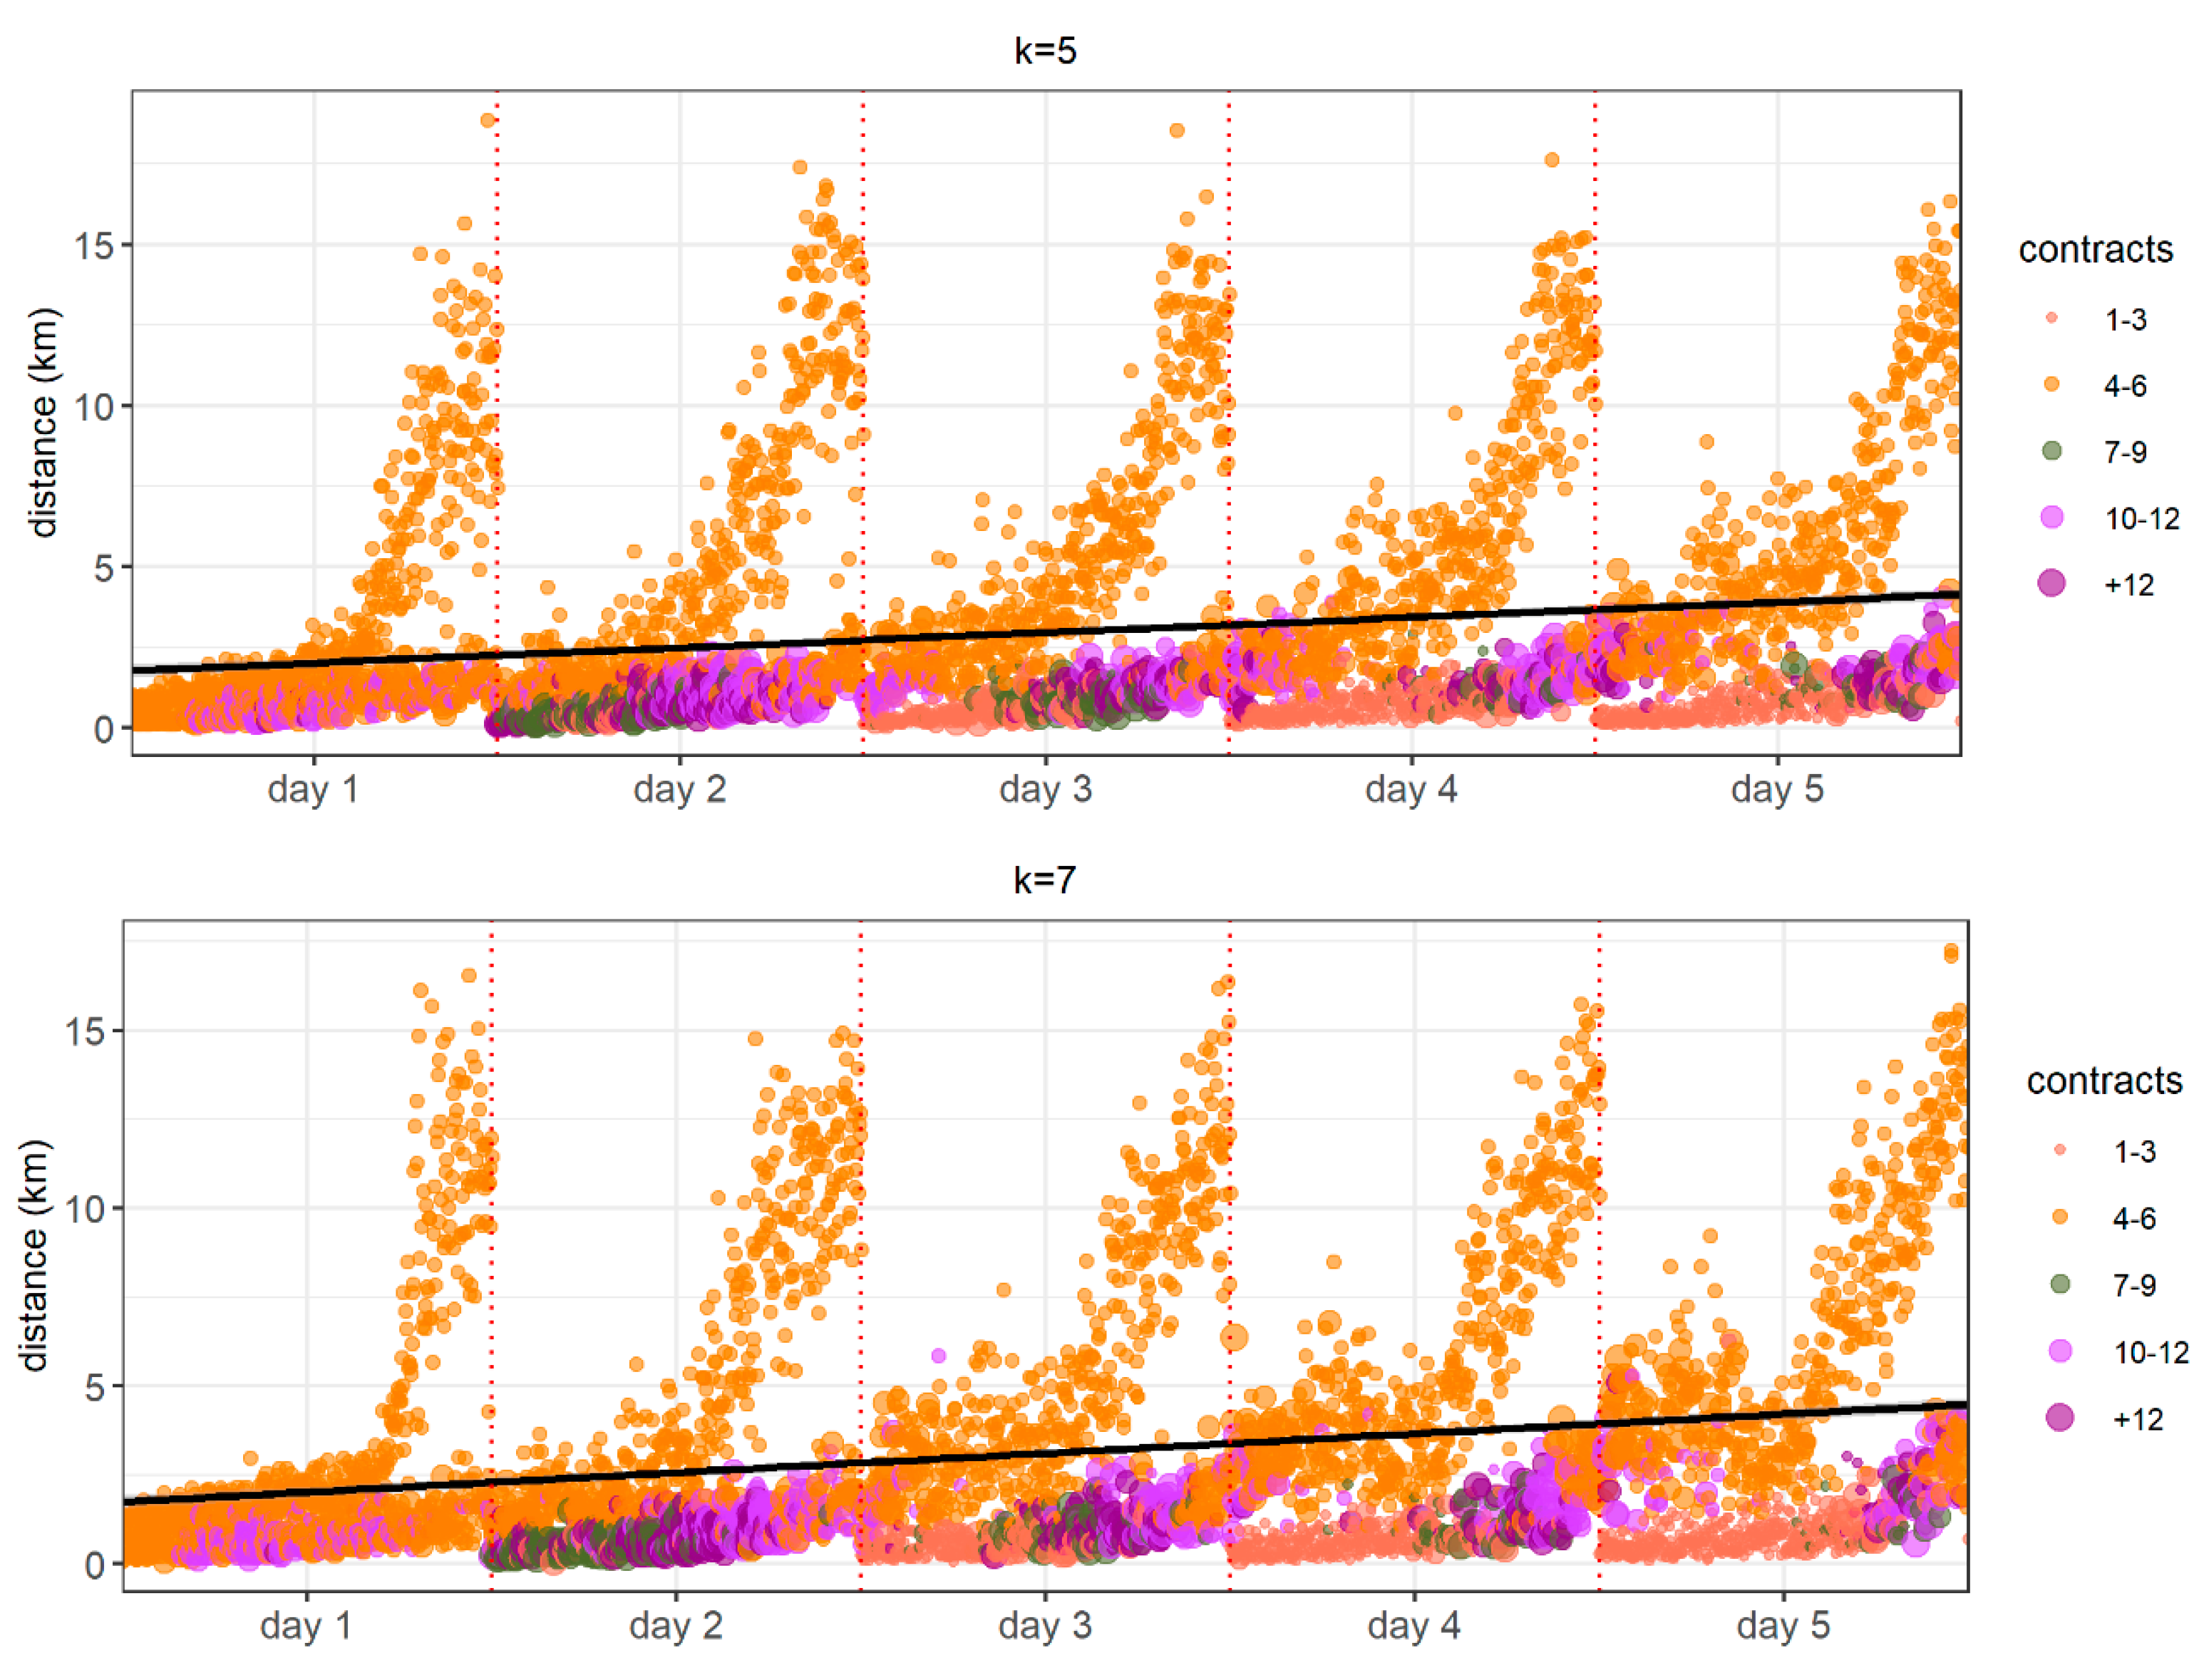
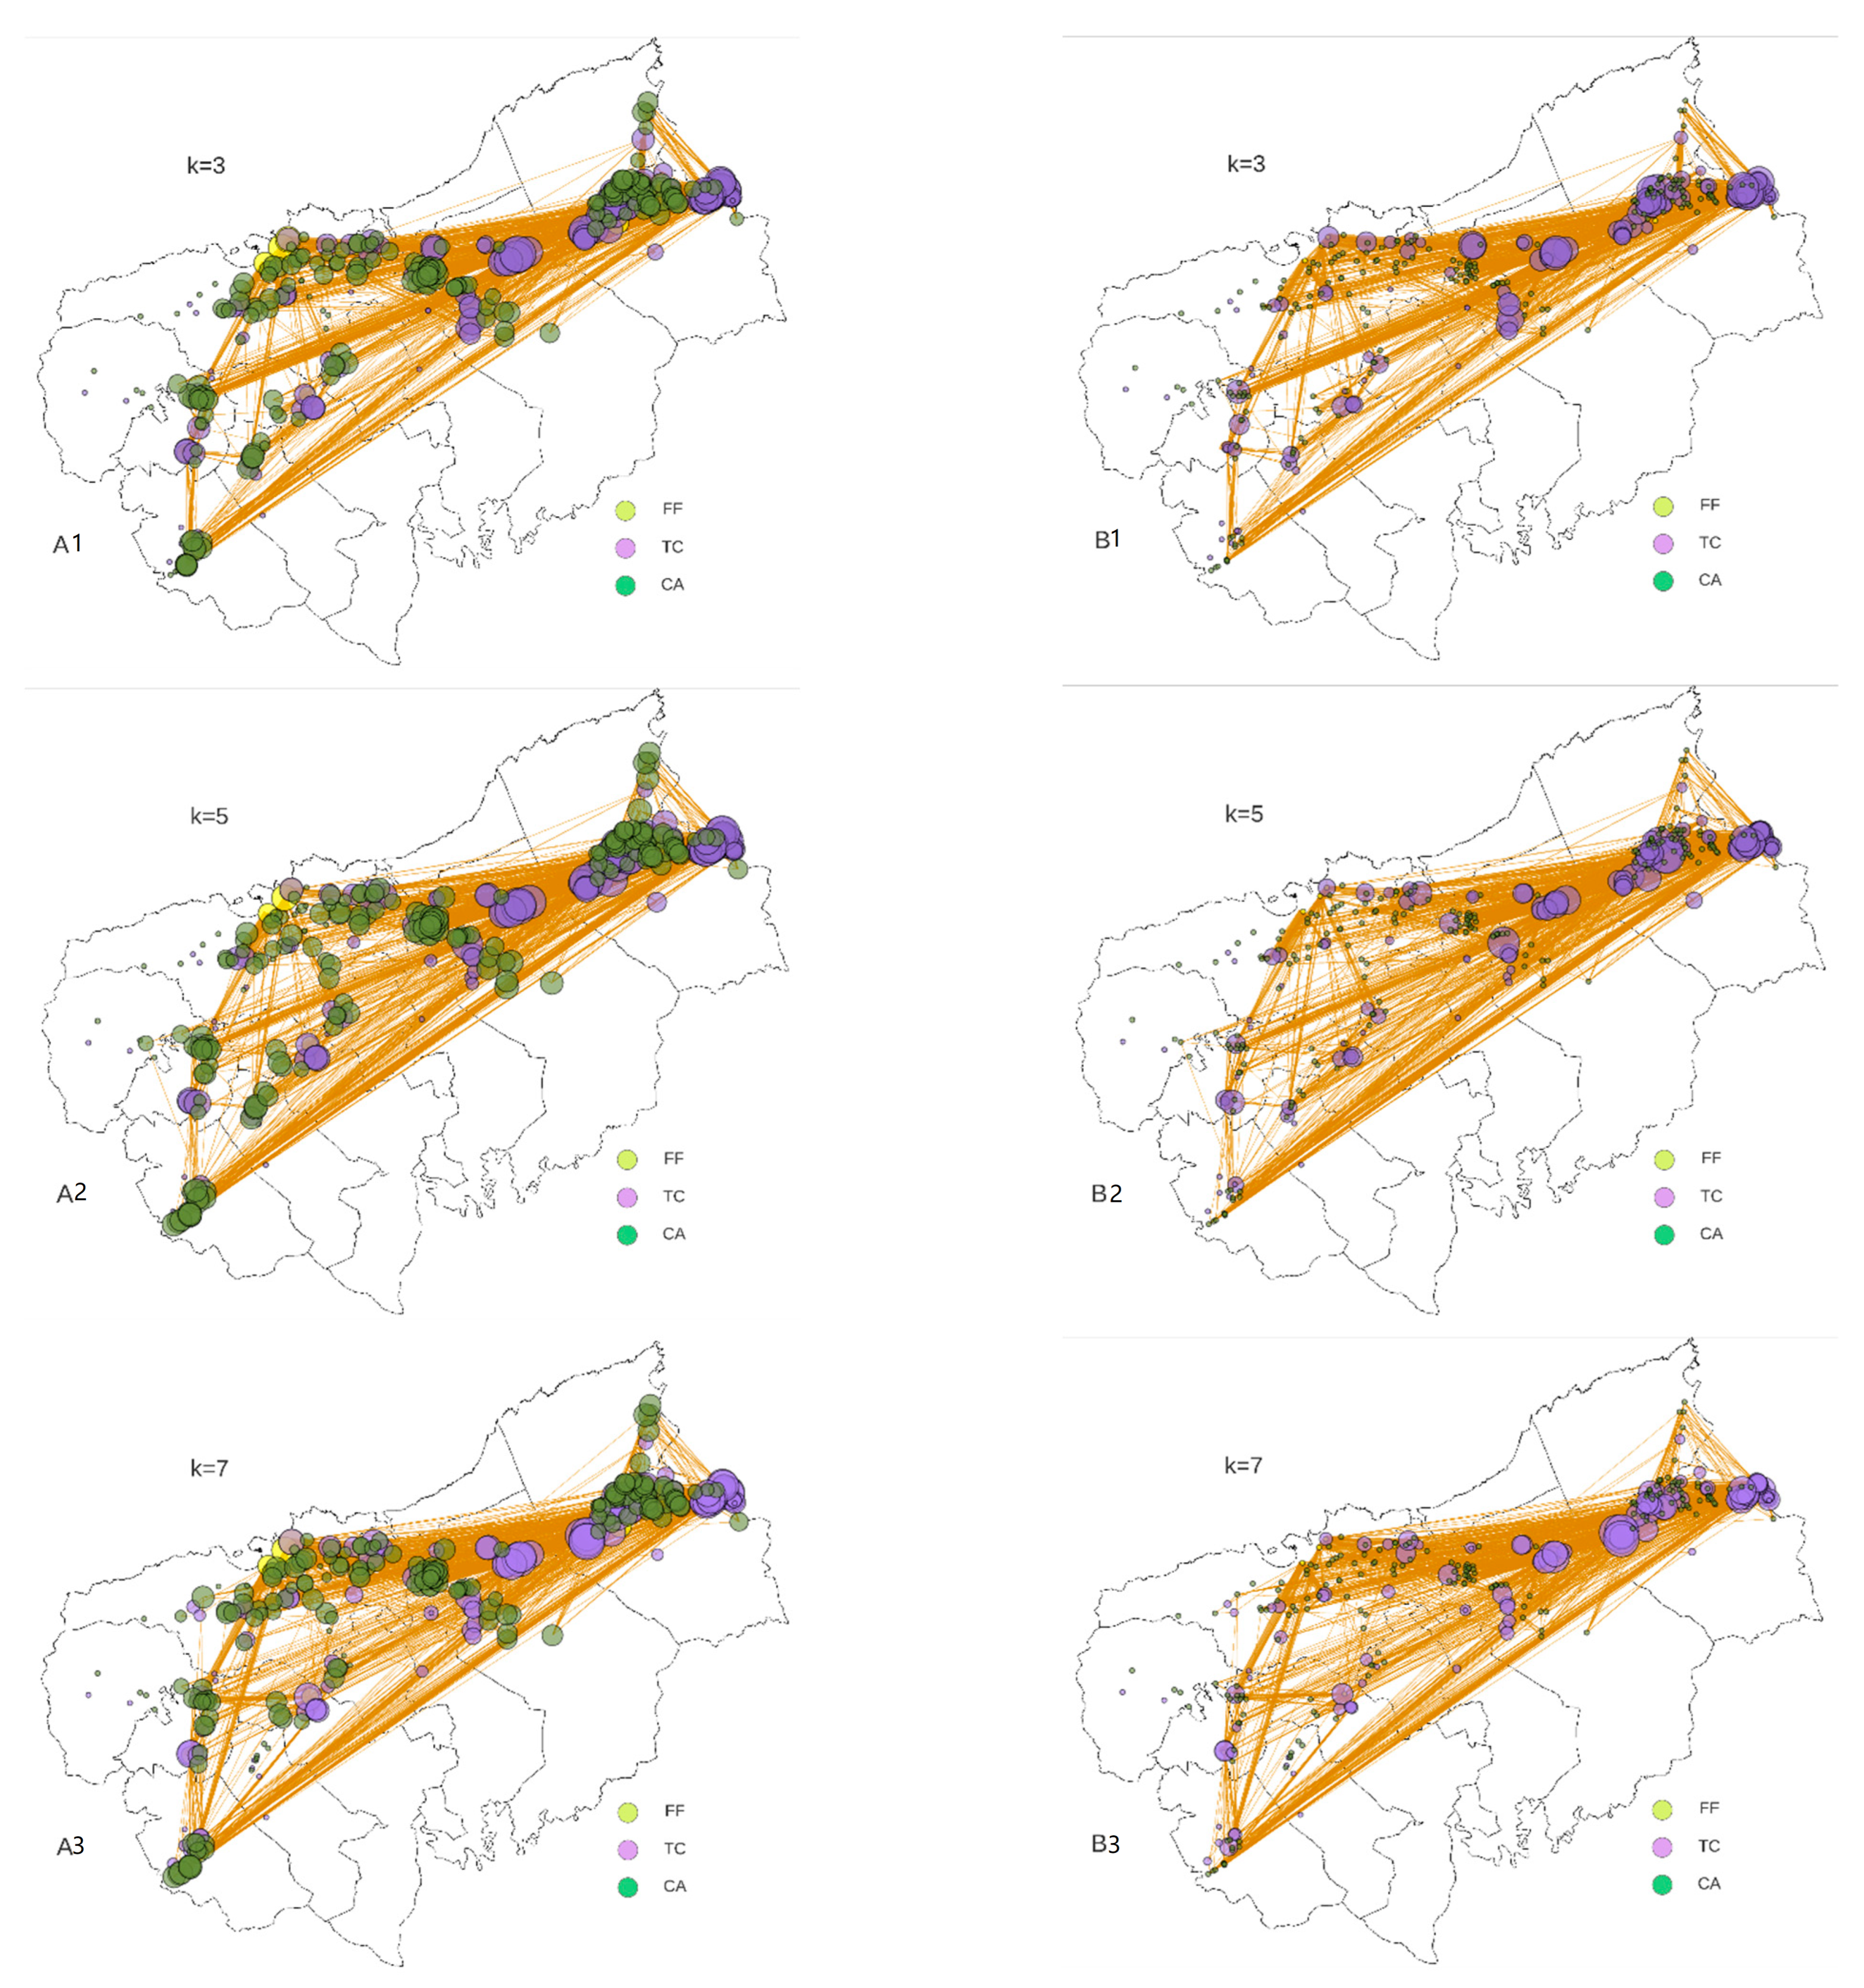
5.2.3. Interaction Within and Between Clusters

As previously stated in Section 3.1, we employ the COLout and COLin metrics to assess the degree of collaboration of agents both within and outside its cluster. In this context, Figure 9 shows this interaction, where the ordinate axis measures the dependency of each agent vis-à-vis the other agents in its cluster while the abscissa axis represents an indicator of the contractual interaction of each agent with other clusters. The group of TC agents is shown in two facets, as they play two roles in each TOC. On the one hand, TCtarget acts as the provider of an FF and, on the other hand, TCsource performs a contractor function of a CA to complete the transport operation.
The steepest regression lines signify the greatest dependence on the cluster and little interaction with other clusters of activity, while the gentler slopes indicate the trend of companies to collaborate between different clusters. It is interesting to observe how, in their role as the main connectors of the network, TCs show different conduct according to the role they play in the chain. Accordingly, TCs seem to be more attractive for external clients the larger the clusters they belong to, while in their status as clients, the outsourcing strategies in the three scenarios are very similar. The general trend of the model would seem to indicate that the larger the size of the cluster, the more this favours the forging of contractual ties between these clusters. Large cluster size also increases the heterogeneity of the clusters, whereby the external drive is supported, in turn, by a sound internal collaboration base.
As a result of the contractual collaboration between agents, and even among those that have not yet formed part of any TOC, their learning is boosted. In this process, however, knowledge is not distributed homogenously among all the clusters, mainly due to two factors that drive their diffusion. On the one hand, the presence of FF in a cluster is decisive for the other agents, who benefit from their need to regulate providers. On the other hand, a varied composition of agents in a cluster enables the formation of complete chains, thus helping ties of trust to be firmed up, along with the transfer of knowledge to other agents in the environment.
Figure 10 shows that belonging to a cluster offers greater possibilities to access knowledge. Thus, in general, non-clusterised agents show lower levels of learning than those that belong to a cluster, with the exception of the FF, since these, as explained above, always generate knowledge due to their obligatory participation in the TOC. The clusters with a varied composition of agents maintain stable learning levels. In these cases, the presence of FF in a cluster particularly boosts the TC, while the CA maintain very similar learning levels. For its part, the form of grouping agents under the DBSCAN algorithm does not seem to be decisive in the acquisition of higher levels of knowledge.

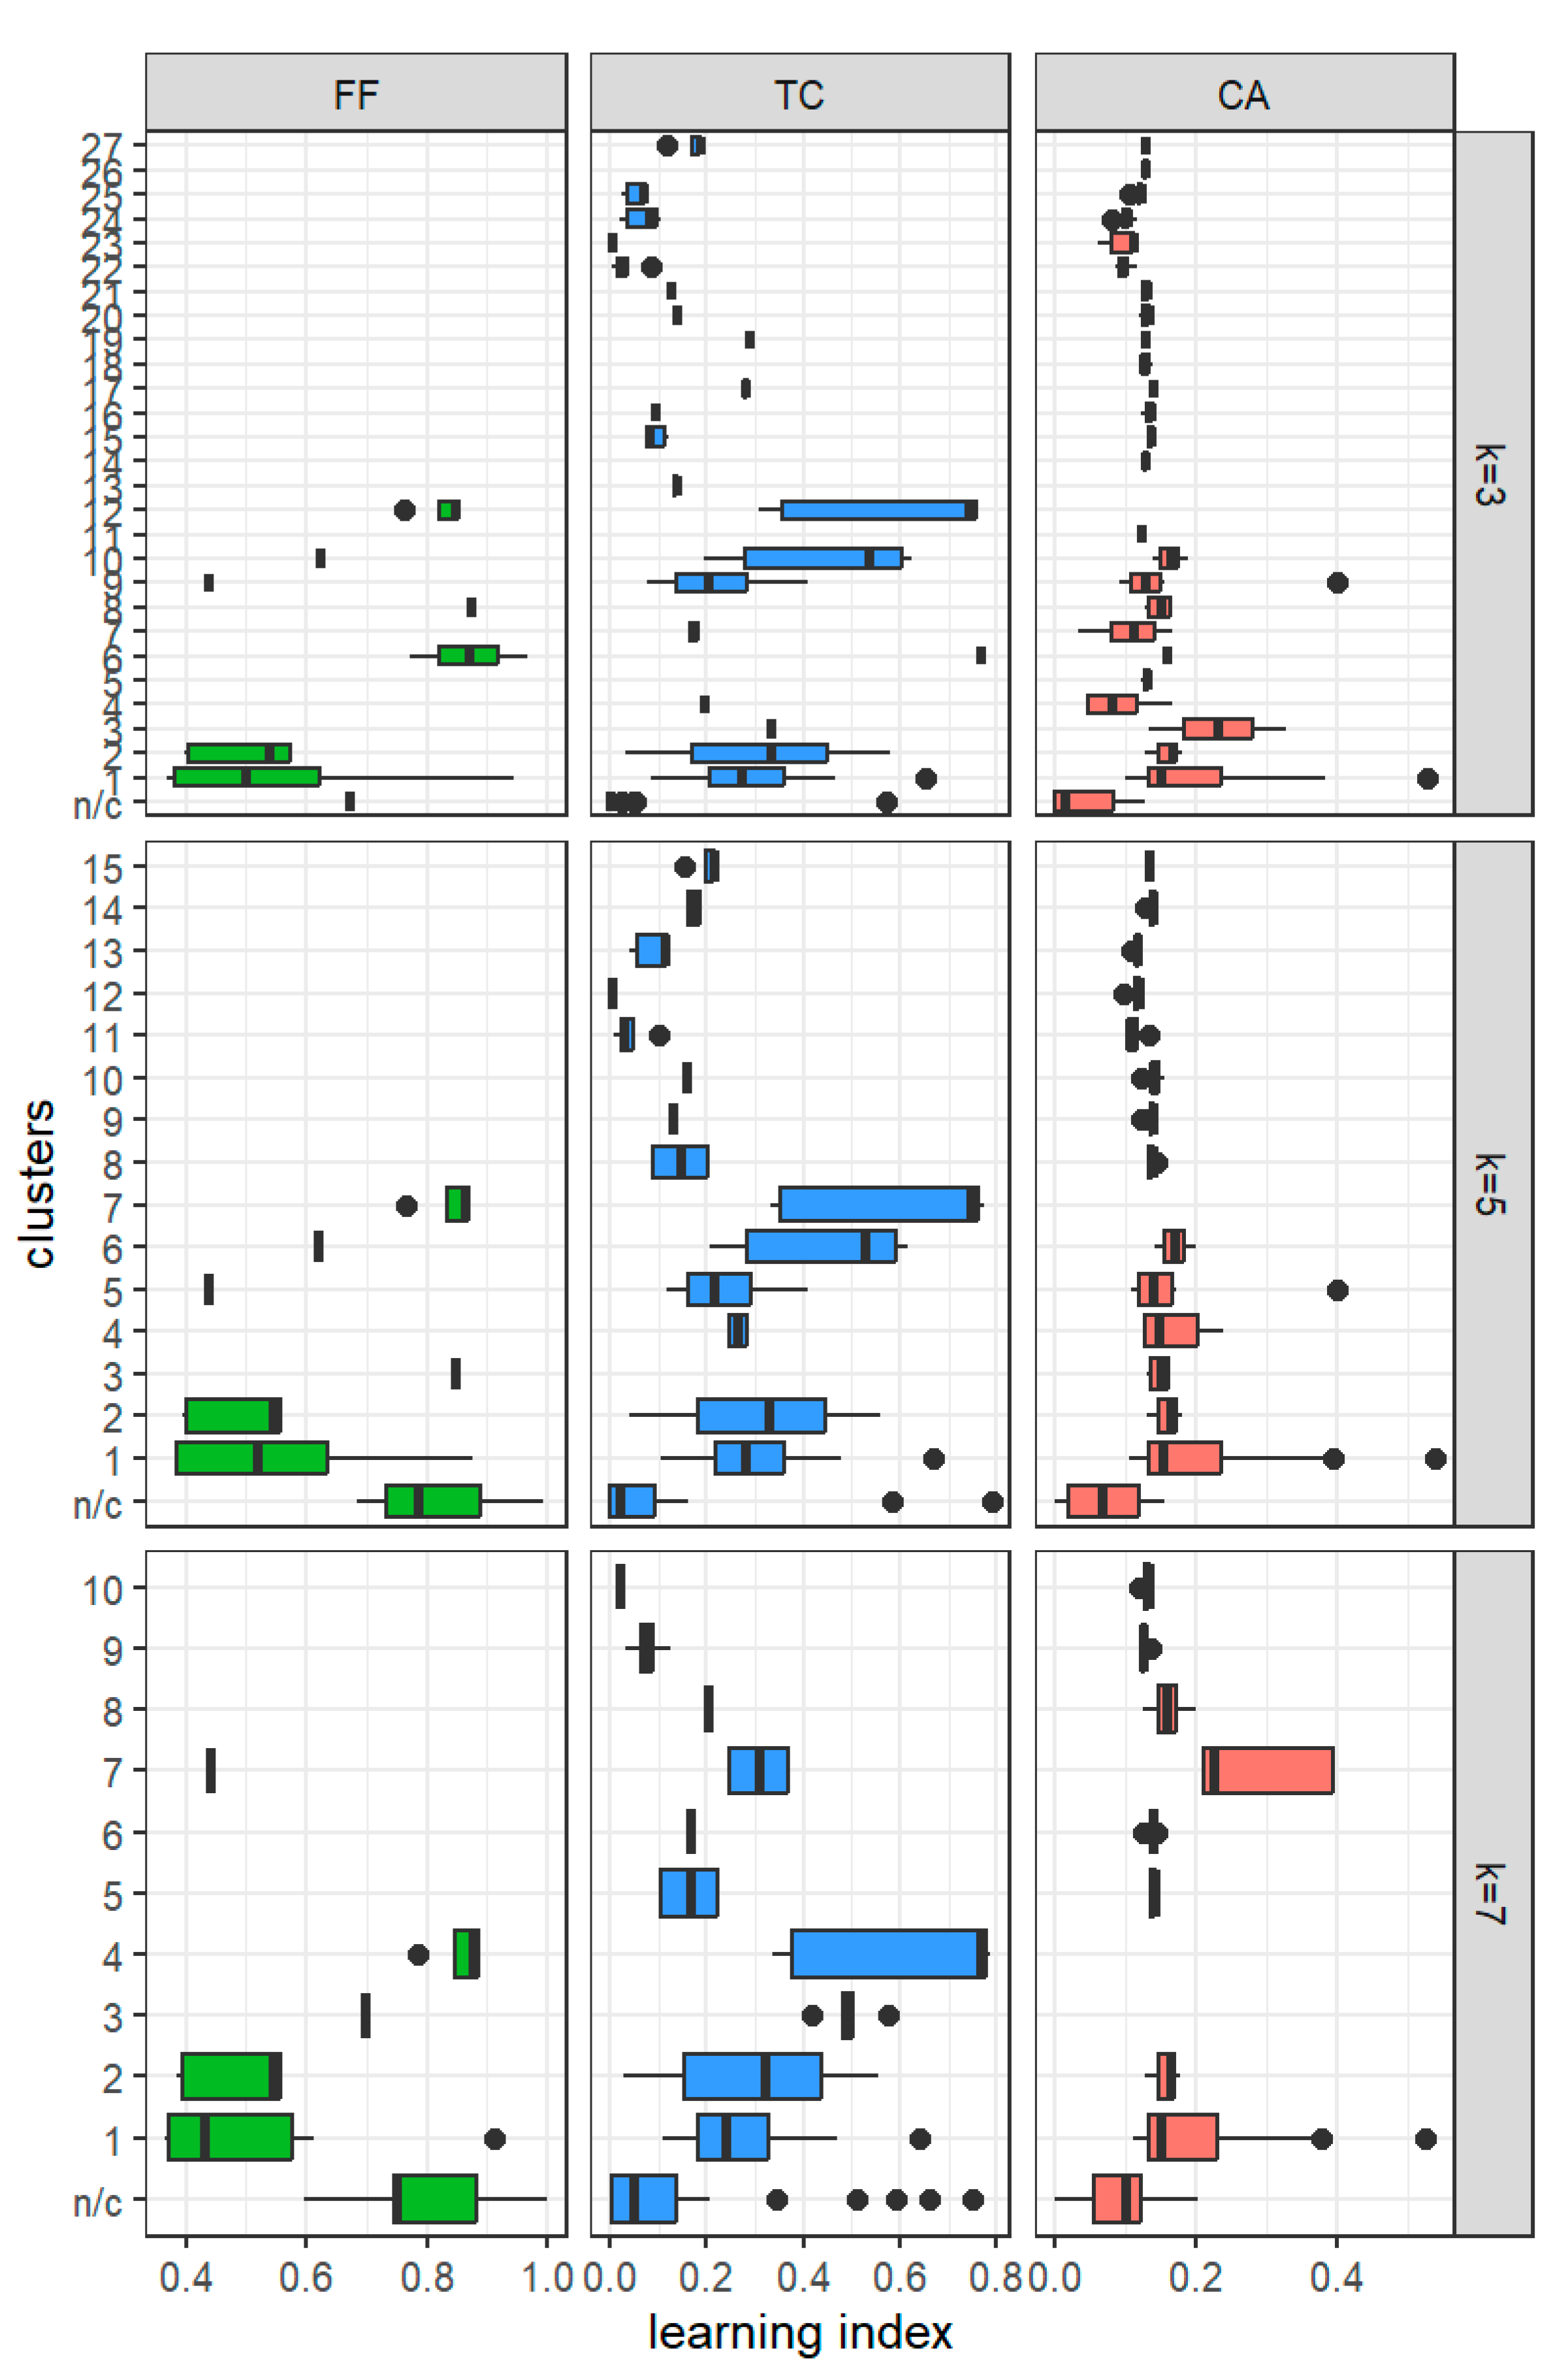
5.2.4. Knowledge Transfer

By means of the FDR method, we adjust the p-value of Moran’s I local indicator to highlight those areas where the transfer of knowledge has the greatest probability of prospering. Figure 11 depicts how the different simulations in the three scenarios represented show that almost all of the clusterised companies make up, together with their closest collaborators, activity environments and a significant concentration of knowledge. The most important of these environments is located to the east of the DABB area, in zones particularly enabled for the establishment of RFT companies and close to the border between Spain and France.
Despite this spatial asymmetry, a good number of the knowledge clusters that emerge for k = 3 maintain their integrity in the other scenarios, even in several environments where the companies cease to form part of a cluster. In spite of the loss of the benefits offered by belonging to a cluster (let us remember that the model does not calculate centrality measurements for non-clusterised agents), some of these non-clusterised companies maintain their activity and knowledge transfer at significant levels in k = 5 and k = 7. Meanwhile, a loss of their leading role in the network can also be observed in other less dense environments. This phenomenon reinforces the basic idea that spatial polarisation increases with the extension of the clusters, and places some less favourable companies and environments in a peripheral position as a secondary resource to outsourcing.

6. Discussion

This paper proposes a novel methodology for the simulation of co-evolution and knowledge transfer in logistic clusters, where collaboration between clusters is considered fundamental to the structuring of RFT systems. The success of clusters is due to two main forms of interrelationships. On the one hand, the vertical interrelationship in the clusters links companies that maintain commercial relations [64], where companies that transfer there seek to obtain benefits from economies of scale and agglomeration [65]. On the other hand, the horizontal interrelationship that arises between companies in the same production segment [64], which collaborate in their undertaking, seek to identify and harness opportunities that benefit their businesses [8]. These considerations are particularly evident in the scenario k = 7 (Table 4), where the organisational hierarchy of the TOC and the diversity of companies with different roles are features that define a good many of the clusters with the greatest potential for development compared with those that present a more homogenous composition.
As the transport systems become established and expand the concentration of their activity and knowledge, this becomes more obvious. This trait is characteristic of mature transport systems like the DABB area, where cooperation between municipalities is necessary since not all of them can develop concentrated areas of logistics activity to the same extent [66]. Accordingly, the investment by local authorities in specialised areas or logistics facilities can help stimulate regional development [67]. In the east of the DABB area, the Zaisa and Lanbarren clusters make up entities of this type, around which other communities of companies that complement them emerge (Figure 12). These lead clusters exercise a significant knock-on effect, which is more apparent when they are more specialised, due to the participation of agents with a high capacity to mobilise assets and to collaborate with other sector companies. This phenomenon is clear for k = 7, where the organisation of the transport system experiences a swing in its specific weight towards the east of the DABB area, even though several peripheral clusters to this hub continue to maintain high levels of participation.
However, the true driving force behind the collaboration network is the knowledge acquired by companies and its exchange among them. Although the trend for companies to concentrate in specialised environments leads to a greater number of them being left outside of the large, structured hubs of activity, generating greater polarisation and compromising their participation in the network, many of these non-clusterised companies form a surrounding network of collaborative environments where the generation of knowledge is still highly significant. Accordingly, this radial network is effective given that a good connection exists between core and peripheral entities [68]; this promotes greater specialisation, collaboration and complementarity, and facilitates the exchange of knowledge due to the larger size of the clusters.
Based on the results, RFT systems can be defined as complex collaboration environments where knowledge flows between agents at different levels, located in different transport activity environments, which can be classified according to their composition and dynamic and to their knowledge transfer potential. Thus, we identify the following types of environments:
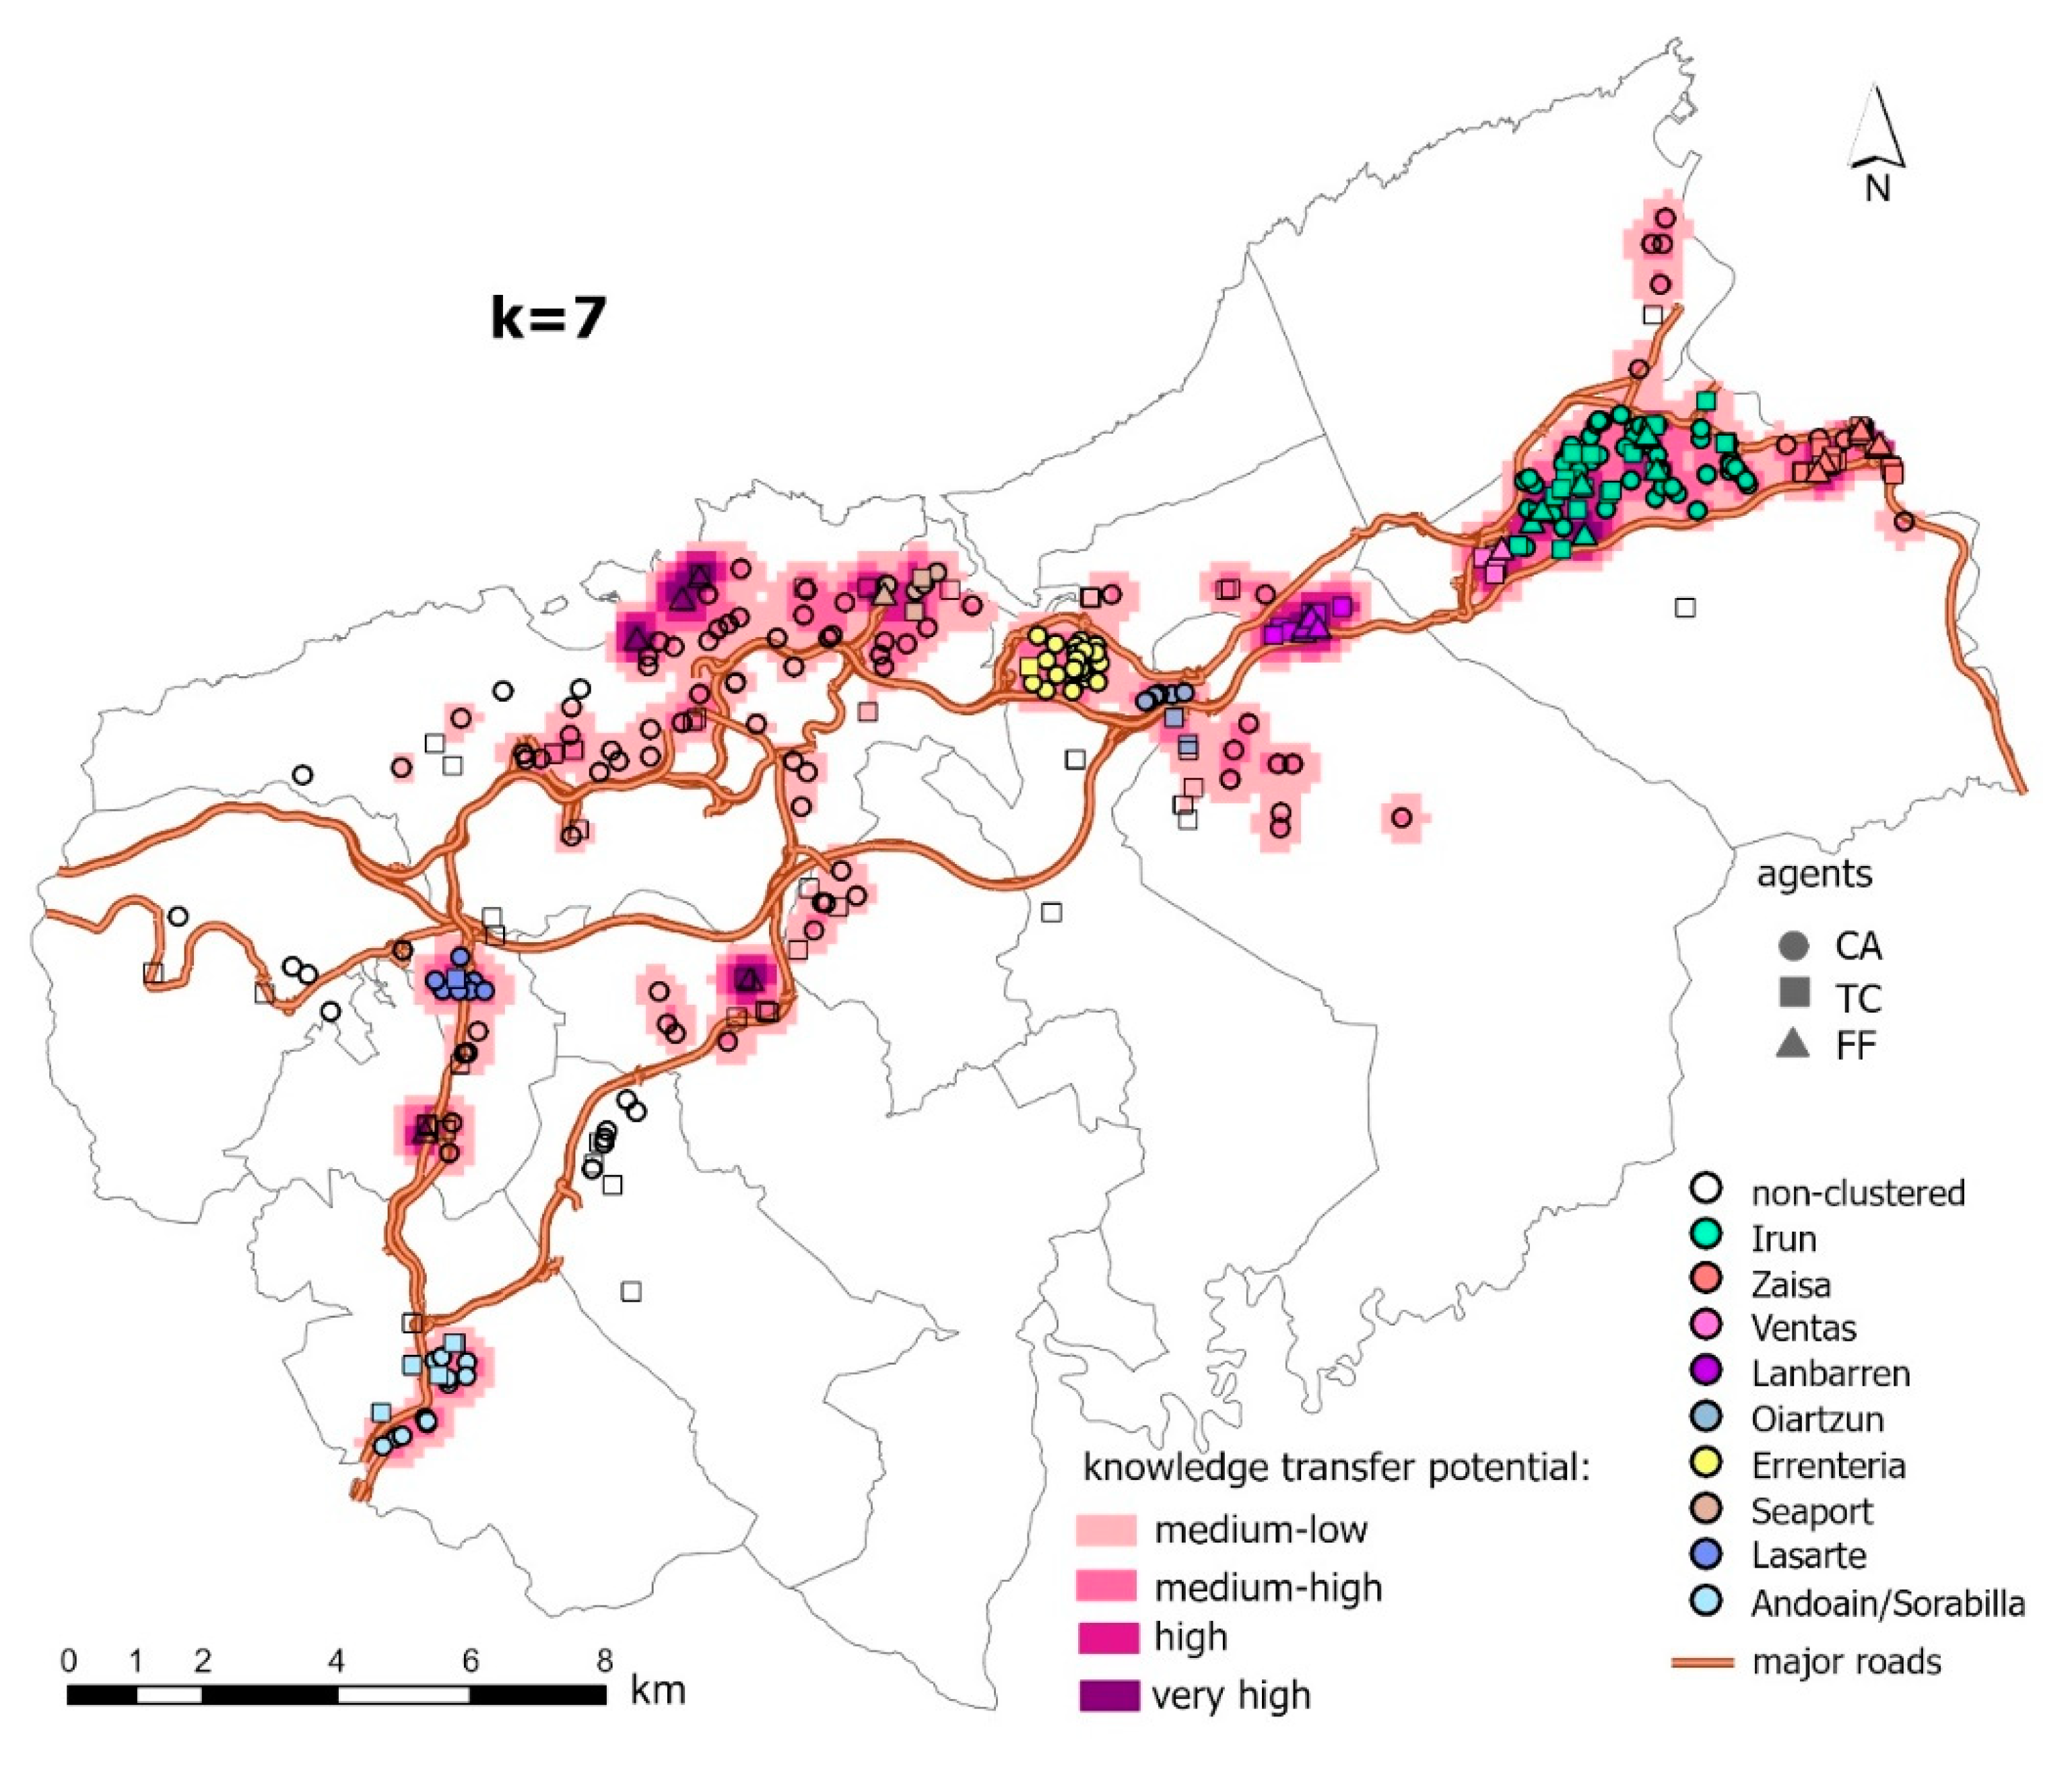
  • Logistics clusters. Due to their composition, these clusters constitute the heart of the polarised system, where both logistics and warehouse operators and transport companies dominate the transport activity, thanks to the leadership they exercise over the other environments. The clusters that fit into this classification are the environments of Zaisa and Lanbarren.
  • Mixed environments. We can find other environments very close to the logistics clusters where transport is not the dominant activity, although the presence of companies is significant. The transport environments of Ventas and the Port of Pasaia represent this kind of intermediate case.
  • Subordinate zones. These groupings are in urban areas in contact with other types of activity and constitute important sites of providers for the logistics clusters. Two zones that perfectly fit under this description are the environments of Irun and Errenteria.
  • Peripheral zones. These are small groups of agents that provide their services for the main areas of activity. Their composition, primarily based on the presence of CA, means they are highly dependent on central environments. Examples of this category include the environments of Andoain, Lasarte, and Sorabilla.
  • Isolated active environments. No defined groupings or clusters are located there. However, the capacity to generate and transfer knowledge is due to the presence of very active FF and TC agents that offer alternatives to the leadership of the logistics clusters.

7. Conclusions

The article employs a novel approach to simulate the transfer of knowledge within a local road freight transport system. A co-evolutionary network of collaboration between diverse agents in the DABB area (Basque Country, Spain) was studied using a multi-agent-based approach, taking the simulation of outsourcing chains as the structuring element—one of the keys defining operating characteristics of the RFT sector.
Regarding RQ1, this study has shown that ABMs are an appropriate methodology for modelling complexity. In this case, complexity is not only due to a network of collaboration between companies, but also to the spatial interaction between different transport activity environments, leading to a functional spatial polarisation. In their daily undertakings, the companies not only interact with each other, but spatial interaction also develops stemming from decision making. As a result of the knowledge acquired and the exchange of information, certain clusters show greater potential for development, while other environments remain as complementary clusters.
Furthermore, the DBSCAN algorithm allowed for the simulation of the effect of the increased size of the clusters in the distribution of activity and the areas with a potential concentration of knowledge acquisition (RQ2). Various indicators show a clear trend towards greater spatial concentration of activity among different groupings of companies as the size of the clusters grows, although these collaborations take place between the clusters with the greatest proximity. The knock-on effect of some hubs is very clear the greater their size, which causes other previously active environments to present more residual activity.
In response to RQ3, the co-existence of RFT companies responsible for different operating segments enables not just the emergence of dependency ties but also enhances the interdependence of activities between cluster members by pursuing shared objectives and exchanging information. However, agents with a greater number of connections have increased connectivity through their preferential ties, so this difference increases as the network expands [69]. Consequently, the hierarchical structure of outsourcing relations is the dominant feature of the functioning of local RFT systems, both within clusters and in the relations between different clusters, emphasising the spatial hierarchy as the clusters increase in size (RQ4).
The identification of guiding clusters that derive from the complementary participation of other lower-level environments in the system falls in line with other previously mentioned works [68]. Nonetheless, this paper provides a novel classification that considers the composition and functionality of each environment. As a novelty, the research focuses on learning and the transfer of knowledge between companies as driving elements of the development of activity environments in a local RFT system, the accumulation of which in preferential hubs is one of the main arguments that explains their growing spatial polarisation. The results can help public institutions to take decisions about the spatial organisation of transport activities, such as the location of new specialised environments or service areas for transport companies. In addition, transport companies can use the model as a management tool for future operations. In light of this, future research should study knowledge chains in more depth that are formed based on information-sharing in relation to transport operations.

Supplementary Materials

The TRANSOPE survey can be downloaded at: https://www.ucm.es/tgis/file/encuesta_transope. Addicionally, the theoretical TRANSOPE model can be reached at: https://www.comses.net/codebases/651dc240-34ff-44cd-8006-4a058b03d93a/releases/1.0.0/.

Author Contributions

Conceptualisation, Aitor Salas-Peña; methodology, Aitor Salas-Peña; software, Aitor Salas-Peña; validation, Aitor Salas-Peña and Juan Carlos García-Palomares; formal analysis, Aitor Salas-Peña; investigation, Aitor Salas-Peña; resources, Aitor Salas-Peña and Juan Carlos García-Palomares; data curation, Aitor Salas-Peña; writing—original draft preparation, Aitor Salas-Peña; writing—review & editing, Aitor Salas-Peña and Juan Carlos García-Palomares; supervision, Juan Carlos García-Palomares. All authors have read and agreed to the published version of the manuscript.

Funding

This research received no external funding.

Data Availability Statement

Derived data supporting the findings of this work are available from the corresponding author upon request.

Acknowledgments

We are grateful to the Guitrans Foundation for providing support and data. The Guitrans Foundation is engaged in the innovation and development of the road freight transport sector that includes more than 500 transport companies in the territory of Gipuzkoa, Basque Country (Spain).

Conflicts of Interest

The authors declare no conflicts of interest.

References

  1. Batty, M.; Crooks, A.T.; See, L.M.; Heppenstall, A.J. Perspectives on Agent-Based Models and Geographical Systems. In Agent-Based Models of Geographical Systems; Springer: Dordrecht, The Netherlands, 2012; pp. 1–15. [Google Scholar] [CrossRef]
  2. Popovici, E.; Bucci, A.; Wiegand, R.P.; De Jong, E.D. Coevolutionary Principles. In Handbook of Natural Computing; Springer: Berlin/Heidelberg, Germany, 2012; pp. 987–1033. [Google Scholar] [CrossRef]
  3. Davidsson, P.; Holmgren, J.; Persson, J.A.; Ramstedt, L. Multi Agent Based Simulation of Transport Chains. In Proceedings of the Seventh International Joint Conference on Autonomous Agents and Multi-Agent Systems, Estoril, Portugal, 12–16 May 2008; Available online: https://www.diva-portal.org/smash/get/diva2:836282/FULLTEXT01.pdf (accessed on 20 November 2024).
  4. Rinehart, L.M.; Eckert, J.A.; Handfield, R.B.; Page, T.J.; Atkin, T. An Assessment of Supplier—Customer Relationships. J. Bus. Logist. 2004, 25, 25–62. [Google Scholar] [CrossRef]
  5. Joong-Kun Cho, J.; Ozment, J.; Sink, H. Logistics Capability, Logistics Outsourcing and Firm Performance in an E-commerce Market. Int. J. Phys. Distrib. Logist. Manag. 2008, 38, 336–359. [Google Scholar] [CrossRef]
  6. Daugherty, P.J.; Chen, H.; Ferrin, B.G. Organizational Structure and Logistics Service Innovation. Int. J. Logist. Manag. 2011, 22, 26–51. [Google Scholar] [CrossRef]
  7. Brekalo, L.; Albers, S. Effective Logistics Alliance Design and Management. Int. J. Phys. Distrib. Logist. Manag. 2016, 46, 212–240. [Google Scholar] [CrossRef]
  8. Cruijssen, F.; Dullaert, W.; Fleuren, H. Horizontal Cooperation in Transport and Logistics: A Literature Review. Transp. J. 2007, 46, 22–39. [Google Scholar] [CrossRef]
  9. Daugherty, P.J. Review of Logistics and Supply Chain Relationship Literature and Suggested Research Agenda. Int. J. Phys. Distrib. Logist. Manag. 2011, 41, 16–31. [Google Scholar] [CrossRef]
  10. Akbari, M. Logistics Outsourcing: A Structured Literature Review. Benchmarking Int. J. 2018, 25, 1548–1580. [Google Scholar] [CrossRef]
  11. Démare, T.; Bertelle, C.; Dutot, A.; Lévêque, L. Modeling Logistic Systems with an Agent-Based Model and Dynamic Graphs. J. Transp. Geogr. 2017, 62, 51–65. [Google Scholar] [CrossRef]
  12. Coccia, M. Spatial Mobility of Knowledge Transfer and Absorptive Capacity: Analysis and Measurement of the Impact within the Geoeconomic Space. J. Technol. Transf. 2008, 33, 105–122. [Google Scholar] [CrossRef]
  13. Blumenberg, S.; Wagner, H.T.; Beimborn, D. Knowledge Transfer Processes in IT Outsourcing Relationships and Their Impact on Shared Knowledge and Outsourcing Performance. Int. J. Inf. Manag. 2009, 29, 342–352. [Google Scholar] [CrossRef]
  14. Giuliani, E. The Selective Nature of Knowledge Networks in Clusters: Evidence from the Wine Industry. J. Econ. Geogr. 2007, 7, 139–168. [Google Scholar] [CrossRef]
  15. Mitton, C.; Adair, C.E.; Mckenzie, E.; Patten, S.B.; Perry, B.W. Knowledge Transfer and Exchange: Review and Synthesis of the Literature. Milbank Q. 2007, 85, 729–768. [Google Scholar] [CrossRef] [PubMed]
  16. Salas-Peña, A.; García-Palomares, J.C. Simulation of Knowledge Transfer in Complex Networks by Coupling ABM and GIS: A Local Road Freight Transport System as a Case Study. Preprint 2024. [Google Scholar] [CrossRef]
  17. Beckers, J.; Vanhoof, M.; Verhetsel, A. Returning the Particular: Understanding Hierarchies in the Belgian Logistics System. J. Transp. Geogr. 2019, 76, 315–324. [Google Scholar] [CrossRef]
  18. Lu, J.; Luo, J.; Tian, L.; Tian, Y. Spatial Patterns and the Evolution of Logistics Service Node Facilities in Large Cities—A Case from Wuhan. ISPRS Int. J. Geoinf. 2024, 13, 82. [Google Scholar] [CrossRef]
  19. Démare, T.; Bertelle, C.; Dutot, A.; Fournier, D. Adaptive Behavior Modeling in Logistic Systems with Agents and Dynamic Graphs. ACM Trans. Auton. Adapt. Syst. 2019, 13, 1–25. [Google Scholar] [CrossRef]
  20. Kübler, J.; Barthelmes, L.; Görgülü, M.E.; Kagerbauer, M.; Vortisch, P. Modeling Relations Between Companies and CEP Service Providers in an Agent-Based Demand Model Using Open-Source Data. Procedia Comput. Sci. 2023, 220, 486–494. [Google Scholar] [CrossRef]
  21. Scott, C.; Lundgren, H.; Thompson, P. Guide to Outsourcing in Supply Chain Management. In Guide to Supply Chain Management; Springer: Cham, Switzerland, 2018; Volume Part F629, pp. 189–202. [Google Scholar] [CrossRef]
  22. Rinsler, S. Outsourcing: The Result of Global Supply Chains? Glob. Logist. 2010, 10, 164–177. [Google Scholar]
  23. Jharkharia, S.; Shankar, R. Selection of Logistics Service Provider: An Analytic Network Process (ANP) Approach. Omega 2007, 35, 274–289. [Google Scholar] [CrossRef]
  24. Barthélemy, J.; Adsit, D. The Seven Deadly Sins of Outsourcing. Acad. Manag. Exec. 2003, 17, 87–100. [Google Scholar] [CrossRef]
  25. Eurostat. Road Freight Transport Measurement (Road Go): Summary of Annual Road Freight Transport by Type of Operation and Type of Transport [road_go_ta_tott]; The statistical office of the European Union: Luxembourg.
  26. Roorda, M.J.; Cavalcante, R.; McCabe, S.; Kwan, H. A Conceptual Framework for Agent-Based Modelling of Logistics Services. Transp. Res. E Logist. Transp. Rev. 2010, 46, 18–31. [Google Scholar] [CrossRef]
  27. Wooldridge, M.; Jennings, N.R. Intelligent Agents: Theory and Practice. Knowl. Eng. Rev. 1995, 10, 115–152. [Google Scholar] [CrossRef]
  28. Ramstedt, L.; Woxenius, J. Modelling Approaches to Operational Decision-Making in Freight Transport Chains. In Proceedings of the 18th NOFOMA Conference, Oslo, Norway, 8–9 June 2006. [Google Scholar]
  29. Baindur, D.; Viegas, J.M. An Agent Based Model Concept for Assessing Modal Share in Inter-Regional Freight Transport Markets. J. Transp. Geogr. 2011, 19, 1093–1105. [Google Scholar] [CrossRef]
  30. de Bok, M.; Tavasszy, L. An Empirical Agent-Based Simulation System for Urban Goods Transport (MASS-GT). Procedia Comput. Sci. 2018, 130, 126–133. [Google Scholar] [CrossRef]
  31. Schröder. Schroeder_allii_2012. Computacional Framework of Multiagente Simulation Freight_transport_activities_submitted_trb(1). Schroeder, S.; Zilske, M.; Liedtke, G.; Nagel, K. Computational Framework for a Multi-Agent Simulation of Freight Transport Activities. In Proceedings of the Transportation Research Board 91st Annual Meeting, Washington DC, USA, 22–26 January 2012; Volume 1, p. 23. [Google Scholar]
  32. Cavalcante, R.A.; Roorda, M.J. Freight Market Interactions Simulation (FREMIS): An Agent- Based Modeling Framework. In Procedia Computer Science; Elsevier B.V.: Amsterdam, The Netherlands, 2013; Volume 19, pp. 867–873. [Google Scholar] [CrossRef]
  33. Matteis, T.; Liedtke, G.; Wisetjindawat, W. A Framework for Incorporating Market Interactions in an Agent Based Model for Freight Transport. Transp. Res. Procedia 2016, 12, 925–937. [Google Scholar] [CrossRef]
  34. Holguín-Veras, J.; Sánchez-Díaz, I. Freight Demand Management and the Potential of Receiver-Led Consolidation Programs. Transp. Res. Part A Policy Pract. 2016, 84, 109–130. [Google Scholar] [CrossRef]
  35. Taillandier, P.; Vo, D.-A.; Amouroux, E.; Drogoul, A. GAMA: A Simulation Platform That Integrates Geographical Information Data, Agent-Based Modeling and Multi-Scale Control; Springer: Berlin/Heidelberg, Germany, 2012; pp. 242–258. [Google Scholar] [CrossRef]
  36. Argote, L.; Miron-Spektor, E. Organizational Learning: From Experience to Knowledge. Organ. Sci. 2011, 22, 1123–1137. [Google Scholar] [CrossRef]
  37. Abdur Razzaque, M.; Chen Sheng, C. Outsourcing of Logistics Functions: A Literature Survey. Int. J. Phys. Distrib. Logist. Manag. 1998, 28, 89–107. [Google Scholar] [CrossRef]
  38. Tomkins, C. Interdependencies, Trust and Information in Relationships, Alliances and Networks. Account. Organ. Soc. 2001, 26, 161–191. [Google Scholar] [CrossRef]
  39. Salas, A.; Cases, B.; García Palomares, J.C. Value Chains of Road Freight Transport Operations: An Agent-Based Modelling Proposal. Procedia Comput. Sci. 2019, 151, 769–775. [Google Scholar] [CrossRef]
  40. Cowan, R. Network Models of Innovation and Knowledge Diffusion. In Clusters, Networks and Innovation; Oxford University Press: New York, NY, USA, 2005; pp. 29–53. [Google Scholar]
  41. Su, J.; Zhang, X.; Yang, J.; Qian, X. Modelling and Simulating Knowledge Diffusion in Knowledge Collaboration Organisations Using Improved Cellular Automata. J. Simul. 2019, 13, 181–194. [Google Scholar] [CrossRef]
  42. Tobler, W.R. A Computer Movie Simulating Urban Growth in the Detroit Region. Econ. Geogr. 1970, 46 (Suppl. 1), 234–240. [Google Scholar] [CrossRef]
  43. Ester, M.; Kriegel, H.-P.; Sander, J.; Xu, X. A Density-Based Algorithm for Discovering Clusters in Large Spatial Databases with Noise. In kdd; AAAI: Philadelphia, PA, USA, 1996; Volume 96, pp. 226–231. [Google Scholar]
  44. Huang, L.; Yang, Y.; Gao, H.; Zhao, X.; Du, Z. Comparing Community Detection Algorithms in Transport Networks via Points of Interest. IEEE Access 2018, 6, 29729–29738. [Google Scholar] [CrossRef]
  45. Yang, H.; Le, M. High-Order Community Detection in the Air Transport Industry: A Comparative Analysis among 10 Major International Airlines. Appl. Sci. 2021, 11, 9378. [Google Scholar] [CrossRef]
  46. Salas-Peña, A.; Cases, B. TRANSOPE: A Multi-Agent Model to Simulate Outsourcing Networks in Road Freight Transport; CoMSES Computational Model Library: Alexandria, VA, USA, 2022. [Google Scholar] [CrossRef]
  47. Salas-Peña, A.; Cases, B.; García-Palomares, J.C. Complexity in Road Freight Transport Outsourcing Networks. TRANSOPE: An Agent-Based Dynamic Model. Expert. Syst. Appl. 2024, 249, 123699. [Google Scholar] [CrossRef]
  48. Sheffi, Y.; Saenz, M.J.; Rivera, L.; Gligor, D. New Forms of Partnership: The Role of Logistics Clusters in Facilitating Horizontal Collaboration Mechanisms. Eur. Plan. Stud. 2019, 27, 905–931. [Google Scholar] [CrossRef]
  49. Brown, D.G.; Riolo, R.; Robinson, D.T.; North, M.; Rand, W. Spatial Process and Data Models: Toward Integration of Agent-Based Models and GIS. J. Geogr. Syst. 2005, 7, 25–47. [Google Scholar] [CrossRef]
  50. Wilensky, U.; NetLogo. Center for Connected Learning and Computer-Based Modeling: Northwestern University, Evanston, IL. Available online: https://ccl.northwestern.edu/netlogo/ (accessed on 1 February 2020).
  51. Bavelas, A. Communication Patterns in Task-Oriented Groups. J. Acoust. Soc. Am. 1950, 22, 725–730. [Google Scholar] [CrossRef]
  52. Newman, M.E.J. The Structure and Function of Complex Networks. SIAM Rev. 2003, 45, 167–256. [Google Scholar] [CrossRef]
  53. Salas-Peña, A. Encuesta TRANSOPE a Profesionales del Transporte de Mercancías por Carretera de Gipuzkoa; Fundación Guitrans Fundazioa: Donostia-San Sebastián, Spain, 2021. [Google Scholar]
  54. Anselin, L. Local Indicators of Spatial Association—LISA. Geogr. Anal. 1995, 27, 93–115. [Google Scholar] [CrossRef]
  55. Bivand, R.S.; Wong, D.W.S. Comparing Implementations of Global and Local Indicators of Spatial Association. Test 2018, 27, 716–748. [Google Scholar] [CrossRef]
  56. Brunsdon, C.; Comber, L. An Introduction to R for Spatial Analysis and Mapping; SAGE Publications Ltd.: New York, NY, USA, 2018. [Google Scholar]
  57. Benjamini, Y.; Hochberg, Y. Controlling the False Discovery Rate: A Practical and Powerful Approach to Multiple Testing. J. R. Stat. Soc. Ser. B Stat. Methodol. 1995, 57, 289–300. [Google Scholar] [CrossRef]
  58. Daniel, W.W. Applied Nonparametric Statistics; Houghton Mifflin: Boston, MA, USA, 1978. [Google Scholar]
  59. Albert, R.; Barabási, A.-L. Statistical Mechanics of Complex Networks. Rev. Mod. Phys. 2001, 74, 47. [Google Scholar] [CrossRef]
  60. Opsahl, T.; Agneessens, F.; Skvoretz, J. Node Centrality in Weighted Networks: Generalizing Degree and Shortest Paths. Soc. Netw. 2010, 32, 245–251. [Google Scholar] [CrossRef]
  61. Csardi, G.; Nepusz, T. The Igraph Software Package for Complex Network Research. Inter. J. Complex. Syst. 2006, 1695, 1–9. [Google Scholar]
  62. Dong, X.; Castro, L.; Shaikh, N. Fastnet: An r Package for Fast Simulation and Analysis of Large-Scale Social Networks. J. Stat. Softw. 2020, 96, 1–23. [Google Scholar] [CrossRef]
  63. Freeman, L.C. Centrality in Social Networks Conceptual Clarification. Soc. Netw. 1978, 1, 215–239. [Google Scholar] [CrossRef]
  64. Sheffi, Y. Logistics-Intensive Clusters: Global Competitiveness and Regional Growth. In International Series in Operations Research and Management Science; Springer: New York, NY, USA, 2013; Volume 181, pp. 463–500. [Google Scholar] [CrossRef]
  65. Chhetri, P.; Butcher, T.; Corbitt, B. Characterising Spatial Logistics Employment Clusters. Int. J. Phys. Distrib. Logist. Manag. 2014, 44, 221–241. [Google Scholar] [CrossRef]
  66. Van den Heuvel, F.P.; de Langen, P.W.; van Donselaar, K.H.; Fransoo, J.C. Spatial Concentration and Location Dynamics in Logistics: The Case of a Dutch Province. J. Transp. Geogr. 2013, 28, 39–48. [Google Scholar] [CrossRef]
  67. Rivera, L.; Sheffi, Y.; Knoppen, D. Logistics Clusters: The Impact of Further Agglomeration, Training and Firm Size on Collaboration and Value Added Services. Int. J. Prod. Econ. 2016, 179, 285–294. [Google Scholar] [CrossRef]
  68. Beckers, J.; Thomas, I.; Vanoutrive, T.; Verhetsel, A. Logistics Clusters, Including Inter-Firm Relations through Community Detection. EJTIR Issue 2018, 18, 178–195. [Google Scholar] [CrossRef]
  69. Barabási, A.-L.; Albert, R. Emergence of Scaling in Random Networks. Science 1999, 286, 509–512. [Google Scholar] [CrossRef] [PubMed]
Figure 1. Information flow in a TOC. Adapted from [39].
Ijgi 14 00179 g001
Figure 2. Functioning of the indirect interaction in TRANSOPE in a 4 ticks sequence. Carrier CA1 is not selected in the first three ticks due to its low selection value. At tick 4, CA1 gains indirect learning and is selected by a TC. Adapted from [47].
Ijgi 14 00179 g002
Figure 3. Location of the DABB area in the European Atlantic Arc.
Ijgi 14 00179 g003
Figure 4. Distribution of RFT agents in the DABB area, according to type.
Ijgi 14 00179 g004
Figure 5. Spatial distribution of clusters according to different values of k.
Ijgi 14 00179 g005aIjgi 14 00179 g005b
Figure 6. Evolution of activity over five days. TC values are expressed by the solid line and CA values by the dashed line.
Ijgi 14 00179 g006
Figure 7. Evolution of contracts according to distance d between clients and providers. The circles represent the average value of a contract at time t = t + 1. The colours and sizes of the circles indicate the range of the weight. For example, a green circle in the range 7–9 indicates that contracts at t and d have been repeated between seven and nine times. The regression line in black shows an increasing trend in distance.
Ijgi 14 00179 g007aIjgi 14 00179 g007b
Figure 8. Degree centrality (A1A3) and betweenness centrality (B1B3) of agents in the DABB area. The thickness of the arcs is indicative of their weight, while the size of the nodes is proportional to their absolute value for each metric.
Ijgi 14 00179 g008
Figure 9. Interaction between agents according to their cluster.
Ijgi 14 00179 g009
Figure 10. Distribution of learning recorded in each cluster, by scenario and type of agent.
Ijgi 14 00179 g010
Figure 11. Environments with a high knowledge transfer potential in different scenarios, calculated by means of the FDR adjustment of the p-value of Moran’s I local indicator.
Ijgi 14 00179 g011aIjgi 14 00179 g011b
Figure 12. Distribution of clusters for the scenario k = 7. The areas of knowledge transfer potential are calculated by means of the value of Moran’s I local indicator.
Ijgi 14 00179 g012
Table 1. Correlation between competences.
Competitiveness (C)Trust (T)Availability (D)
F (max C)10.820.79
F (max T)0.7810.80
F (max D)0.820.861
Table 2. Cluster characteristics for each of the classifications in the DABB area.
ClustersClusterised AgentsNon-Clusterised AgentsBiggest ClusterSmallest ClusterMeanMedian
k = 3272904890312.076.5
k = 5152449490521.139.5
k = 71019913984730.7710
Table 3. Local centrality measures for clustered and non-clustered agents, and global centralisation measures. In the local measures, betweenness centrality (*) is calculated only for TCs.
Local MeasuresGlobal Measures
Clustered AgentsNon-Clustered Agents
DCCCBC *DCCCBC *CDCCCB
k= 30.03550.26211.949 × 10−40.00920.10701.754× 10−50.04360.11616.463 × 10−4
k= 50.03790.27422.200 × 10−40.01800.18363.977× 10−50.04210.10906.594 × 10−4
k= 70.04100.28752.954 × 10−40.02190.21695.741 × 10−50.05360.15400.0012
Table 4. Average participation and learning values for each cluster and type of agent in scenario k = 7.
Number of AgentsContracts (μ)Learning Index (μ)
FFTCCAallFFTCCAallFFTCCAAll
non-clustered54588139104.1510.459.6813.330.790.110.090.12
Irun7205279103.5127.6213.8325.270.510.260.20.24
Zaisa527335103.2421.3413.9632.410.480.30.160.31
Ventas1607102.9346.08-55.560.690.49-0.53
Lanbarren47011104.6247.76-68.440.840.59-0.68
Oiartzun0279-20.613.9215.41-0.160.140.14
Errenteria012223-19.7313.8414.09-0.170.290.14
Puerto1258102.0742.9313.7532.080.440.30.160.31
Lasarte01910-37.5313.7116.09-0.20.130.16
Andoain04610-6.2713.6810.71-0.070.130.1
Sorabilla0178-1.5313.7912.26-0.010.140.12
Disclaimer/Publisher’s Note: The statements, opinions and data contained in all publications are solely those of the individual author(s) and contributor(s) and not of MDPI and/or the editor(s). MDPI and/or the editor(s) disclaim responsibility for any injury to people or property resulting from any ideas, methods, instructions or products referred to in the content.

