1. Introduction
Currently, more than 80 percent of the U.S. population resides in urban areas, a number that is expected to increase; these areas are often associated with environmental and social inequities, such as disproportionate levels of air and water pollution, loss of biodiversity, and increased rates of poverty [
1]. As a result, much of the cutting edge ecological research taking place today focuses on the urban environment—the places where most people live, work, and play, and where everyday decisions (regarding housing, transportation, consumption,
etc.) can have profound effects on the environment [
2].
Research regarding the urban environment [
3,
4,
5] has commonly centered on urban ecosystem analysis [
6,
7]; a methodology for establishing the environmental and economic benefits of trees within a specified area. Trees provide direct benefits in the form of reduced stormwater runoff, improved air and water quality, and increased carbon sequestration. In addition, trees provide indirect benefits, such as reducing local ambient air temperatures through evapotranspiration, which in turn reduces air-conditioning use and carbon emissions from energy production. As such, trees provide communities with many valuable services that can be measured in terms of quantifiable benefits [
8,
9,
10] and may include:
Saving Energy—trees provide building shade and help to mitigate the heat island effect, which in turn reduces air conditioning use, electricity costs, and air pollution from the generation of electricity;
Reducing Atmospheric Carbon Dioxide—trees absorb carbon dioxide thereby lowering the rate of global warming;
Improving Air Quality—trees absorb and filter air pollution;
Reducing Stormwater Runoff—trees reduce the infrastructure needed to manage stormwater, they filter surface water and reduce the need for landscape irrigation, and prevent erosion;
Aesthetics and Other Benefits—while more difficult to quantify, these include improved scenic values and improved human health and well-being.
Tree distributions in urban areas can be analyzed using a combination of spatial data in vector and raster formats and geographic information system (GIS) software. GIS is often applied an analytic framework for managing and integrating spatial data; performing spatial analyses; investigating or solving a spatial problem; or understanding a past, present, or future situation.
GIS-based urban ecosystem analysis can be used to provide a baseline of an area’s existing urban forest resources [
1,
11,
12], which can be used to help manage and preserve those resources, but can also be used to clarify the benefits of increasing the existing tree canopy coverage. The magnitude of these benefits is dependent upon the current urban forest structure—number of trees, their size, proximity and orientation (north, south, east, west) to buildings, and tree type (e.g., drought-resistant, emissions of volatile organic compounds,
etc.)—and any changes to that structure. As a result, the selection of potential locations and appropriate tree species are a critical component of any tree-planting program.
In the field of public health, the use of mapping was originally utilized to map patterns of disease for a determined geography to identify spatial locations of epidemics and sources of disease, such as in the John Snow cholera map of 1854. Research indicates that the earliest disease maps were found in Germany over 200 years ago [
13]. Over time, the use of GIS has emerged in the field of disease surveillance [
14], linking correlations to health, environment, and location [
13,
15], in addition to informing longitudinal studies [
14,
16]. Nykiforuk and Flaman [
17] have identified four major themes in health GIS: disease surveillance, risk analysis, health access and planning, and community health profiling. More recent uses of GIS in health have included the determination of causative relationships, as well as data integration and spatial visualization, and the predictive modeling of health [
13].
GIS analysis has the capacity to provide a visual and spatial analysis of the effects of a health policy, or to demonstrate the need for health policy and its impact on demographic population groups. The field of urban planning and health is among the first in policy analysis through GIS, for example through the design of health impact and health risk assessments, integrating GIS to determine how policy will affect populations in urban space [
18,
19]. GIS has also been an aid to understanding the relationship between health and the environment as a facilitator of a “continuous process of planning, monitoring, and evaluating health”, allowing for a quick identification of locations where there are health problems at a greater frequency [
15]. As a result, health policy benefits from the use of GIS through the analysis and visualization of data in geographic format.
In the urban landscape, population trends can be major factors in determining the level of tree canopy (as well as the lack of canopy) in specific urban regions. Median household income has consistently been shown to correlate positively with tree canopy (as well as requests for tree canopy) [
20,
21]. In terms of health disparities, demographic characteristics such as race, ethnicity and education have been seen to play a role in skin cancer risk, involving factors such as lower perceived risk as well as limited knowledge and education of skin cancer, which may result in delays in cancer screening and treatment [
22,
23]. Education on the dangers of ultraviolet (UV) radiation throughout populations can help to prevent and reduce the incidence of skin cancers. Across demographic characteristics, UV radiation has long term effects on health, including the risk of melanoma [
24], which includes skin cancer risks upon children resulting from outdoor sun exposure [
25]. Some researchers have also noted recent lack of emphasis on the benefits of ultraviolet-B (UVB) and Vitamin D in relation to reducing the risk of some cancers and bone diseases [
26,
27,
28]. Considering the health benefits of UV exposure, it is necessary to consider how to determine the point at which sun exposure is beneficial before it becomes potentially hazardous to health [
29]. One recommendation for Vitamin D exposure from the sun is to be exposed to the sun for about half the time it would take to begin to burn [
30] Additionally, the Centers for Disease Control (CDC) note that sun exposure is most hazardous from 10:00 AM to 3:00 PM (standard time) or 4:00 PM (daylight saving time), particularly in late spring and early summer in the United States [
31].
Tree canopy can provide a variety of public health benefits such as the absorption of toxic pollutants and particulate matter [
32], providing protection from UV radiation, stress reduction, [
33] as well as reducing temperatures and the effects of urban heat island [
34]. In 2009, the Centers for Disease Control and Prevention created a toolkit to guide schools and education partners in overall sun safety and skin cancer prevention strategies to determine partnerships in providing skin cancer prevention to children, determining resources in sun safety, as well as information on the planning and implementation of sun safe practices [
35]. Among these recommendations is the development of policy to reduce UV radiation exposure. This is where GIS analysis can aid in developing policies for childhood skin cancer prevention.
Previous research in tree cover has included the use of environmental limiting factor detection, spatial distribution, and measuring environmental factors [
36]. Methods have also included the assessment of tree canopy within urban regions through raster methods of urban land cover as well as sampling methods to estimate canopy cover through points and plots, with an increasing use of object based image analysis (OBIA) and aerial LiDAR (Light Detection and Ranging) [
37]. Studies of tree canopy and impervious surfaces have been conducted to analyze the distribution of these landscapes at a national scale through Landsat 7 imagery and photo interpretation [
38]. Impervious surfaces in developed urban areas have demonstrated negative impacts upon the environment such as increasing temperatures and emitting pollutants [
38,
39], while there are environmental and public health benefits of increased tree canopy in reducing pollutants and increasing well-being [
37,
40]. Quantifying urban tree canopy can inform administrators and policymakers in the planning, design, and utilization of policy and management goals [
41]. Addressing the benefits of tree canopy in the CDC sun safety policies is a next step in public health toward increasing the prevention of skin cancer.
At the school district level, studies have been conducted regarding CDC sun safety policies in discussing sun protective measures such as wearing sunscreen, protective clothing, and spending time outdoors in shaded areas [
22,
35], as well as determining safer times of the day for children to play outdoors [
42]. Much discussion exists regarding sun safety, yet there has been a lack of discussion on the role of tree canopy in public schools toward mitigating environmental public health concerns such as heat island effect as well as the reduction of UV radiation and airborne toxins on school grounds. Although sun safety policies have clearly included recommendations for children to seek the shade of trees for sun safety, there is little discussion on the current lack of availability of tree canopy cover on school grounds, affecting the practical application of sun safety recommendations for school districts. Additionally, though studies exist on the benefits of tree canopy in schools [
43], there have been no established policies or recommendations addressing the composition of tree canopy cover on public school grounds. From these observations, the following research questions are addressed:
What is the process for selecting, classifying, and developing spatial data to determine tree canopy coverage, pervious/impervious areas, and buildings on public school grounds?
How can the spatial analysis of this data be disseminated to inform the public?
What are the public health implications for the use of these data and for sun safety polices?
This paper reports on the School Shade Tree Canopy Study performed for the Los Angeles Unified School District (LAUSD) where data was acquired and analyzed regarding tree canopy cover, pervious/impervious areas, and buildings for 509 elementary schools to assess urban forestry management issues and environmental injustices within the communities of the district. For example, most of the LAUSD’s school sites lack a healthy urban forest, contain mostly impervious surfaces, lack shade, and up to 92% of the school grounds are susceptible to urban heat island effect due to paved surfaces.
2. Methods
In an effort to reforest school sites with limited resources, local community organizations and non-profits have implemented tree planting projects on LAUSD school sites, often without forethought for the best location, long-term maintenance, or appropriateness of the tree type. Approximately 9000 of these community-planted trees are providing benefits; however, most were not the “right tree, for the right place”. As new schools are built and existing schools are improved the LAUSD is eager to seize the opportunity to design and plant trees and landscapes that provide significant shade, reduce the urban heat island effect, minimize stormwater runoff, conserve water, and improve air quality.
The Council for Watershed Health (CWH), in partnership with the California Department of Forestry and Fire Protection Urban Forestry Program, and the LAUSD through its Sustainability Initiatives Program, developed four programs to inspire a new generation of stewards of the urban forest. These included:
LAUSD Approved Plant Profiles and Database
School Shade Tree Canopy Study
Urban Forestry/Greening Workshops and Meetings
Project Learning Tree Trainings
The following sections detail the processes utilized to conduct the School Shade Tree Canopy Study for the 534 LAUSD elementary school sites. At the end of the study, a total of 509 schools were mapped as 25 were undergoing construction or were no longer under the maintenance or control of LAUSD. Data and analytic techniques from the “Million trees Los Angeles canopy cover and benefit assessment” [
41] as well as newly available high resolution aerial imagery from the “Los Angeles Region Imagery Acquisition Consortium (LARIAC) Program” [
44] were used for this task. In addition, several remote sensing techniques previously developed by CWH for a statewide vegetation mapping program “Weed Watch” [
45] were also utilized. A report for each school site was developed and disseminated to summarize and rate existing tree canopy coverage along with unpaved areas. This report can also be used to identify potential locations for tree planting and other school greening efforts.
Analysis and reporting are at the parcel level and digitization were based on multiple (time-series) imagery data sets. Digitization was chosen over Normalized Difference Vegetation Index (NDVI) and LiDAR-based methods. This was especially influenced by the expectation that each individual school site would have a report with metrics of canopy cover, number of trees, and comparisons to the district overall. A fine-scale mapping of each site being assessed was a requirement as the audience for the resultant analysis would have “hyper-local” knowledge of their local school site.
2.1. Study Location
The LAUSD is the second largest school district in the United States and enrolls more than 640,000 students in Kindergarten through 12th grade at over 1124 schools. The geographic area of the LAUSD encompasses 720 square miles and includes the City of Los Angeles, as well as all or parts of 31 smaller municipalities plus several unincorporated sections of Southern California [
46]. Its spatial extent in decimal degrees is: Max Y: 34.382032, Min X: −118.689120, Max X: −118.100714, Min Y: 33.675849. For this study, 509 Elementary Schools were examined. (These schools included Kindergarten through 5th grade, enrolling approximately 275,000 students).
2.2. Data Selection
Previous canopy analyses of the City of Los Angeles [
41] used a remote sensing model to measure canopy cover as well as pervious and impervious surfaces. The analytic process was to ground-truth the automatic classification (NDVI) of the remotely sensed imagery with hand digitized information from the same imagery. In that study, it was discovered that shrubs were treated/counted as trees, and the accuracy for classifying existing tree canopy was (74.3%). For this study (School Shade Tree Canopy), this would be unacceptable specifically where accurate classification was needed. For example, existing tree canopy data sets were examined for use and included 2008 LARIAC data which utilized the NDVI method but used a flawed method of using winter imagery for the NDVI which resulted in a number of deciduous species being excluded and misclassification of some hillside brush as trees.
For this study, only the most current, publically available, high resolution imagery data sets, at the visible spectrum, across multiple aerial flight dates in multiple weather conditions, were used. There were 74 flight dates for the school sites starting on 22 January 2011 and ending on the 25 May 2011. It was anticipated that calibrating this many different data sets/dates for use in an NDVI analysis would take far longer than hand digitizing the 509 sites especially considering that some school sites had two different image acquisition dates.
LiDAR data was similarly examined for use in this study. This aerial data was also acquired during the same January–May 2011 time frame. The issue with this data was the need to classify a large number of tree species by their “signature” through a semi-automatic classification method which would also be time consuming. It was decided that neither the NDVI nor the LiDAR classification methods would provide an accurate assessment of tree canopy accessibility; only hand digitization of the school sites by means of visual analysis would achieve the desired result.
2.3. Data Classification
The application of the multi-dataset image analytic process for this study took the following form. Each school was digitized from the 2011 LARIAC imagery data (0.3048 meter/1.0 foot spatial resolution) obtained from the USGS. Additional reference data sets included the 2008 LARIAC imagery data (0.3048 meter/1.0 foot spatial resolution) along with additional oblique and street view imagery from Bing and Google maps. These additional oblique and street view images were used where possible to identify sapling trees that had been recently planted or in some cases revealed “as built” conditions on sites where construction was occurring during the 2011 flight dates.
The same images and methodology were used for identification of the pervious and impervious surface data sets. This identification was based on whether it appeared that students had access to the surface and any related canopy (this determination of students having access or not was made by looking for fence lines and other barriers on the school site). Buildings were mapped based on 2008 LARIAC data and compared to 2011 LARIAC to identify where modifications may exist (buildings removed or added).
The process also allowed for an identification of canopy type (evergreen or deciduous) taking into account imagery dates as well as a comparison of canopy containing no leaves at the time of the flights,
versus those that contained leaves at a later date. In several cases, where trees had clearly been recently trimmed, this process also allowed the comparison of 2008 imagery to the 2011 images to determine the approximate re-growth crown size. Nearby trees whose trunks were not on the school parcel, but provided shade to the school or were along the streets around the school, were digitized as being part of the school site.
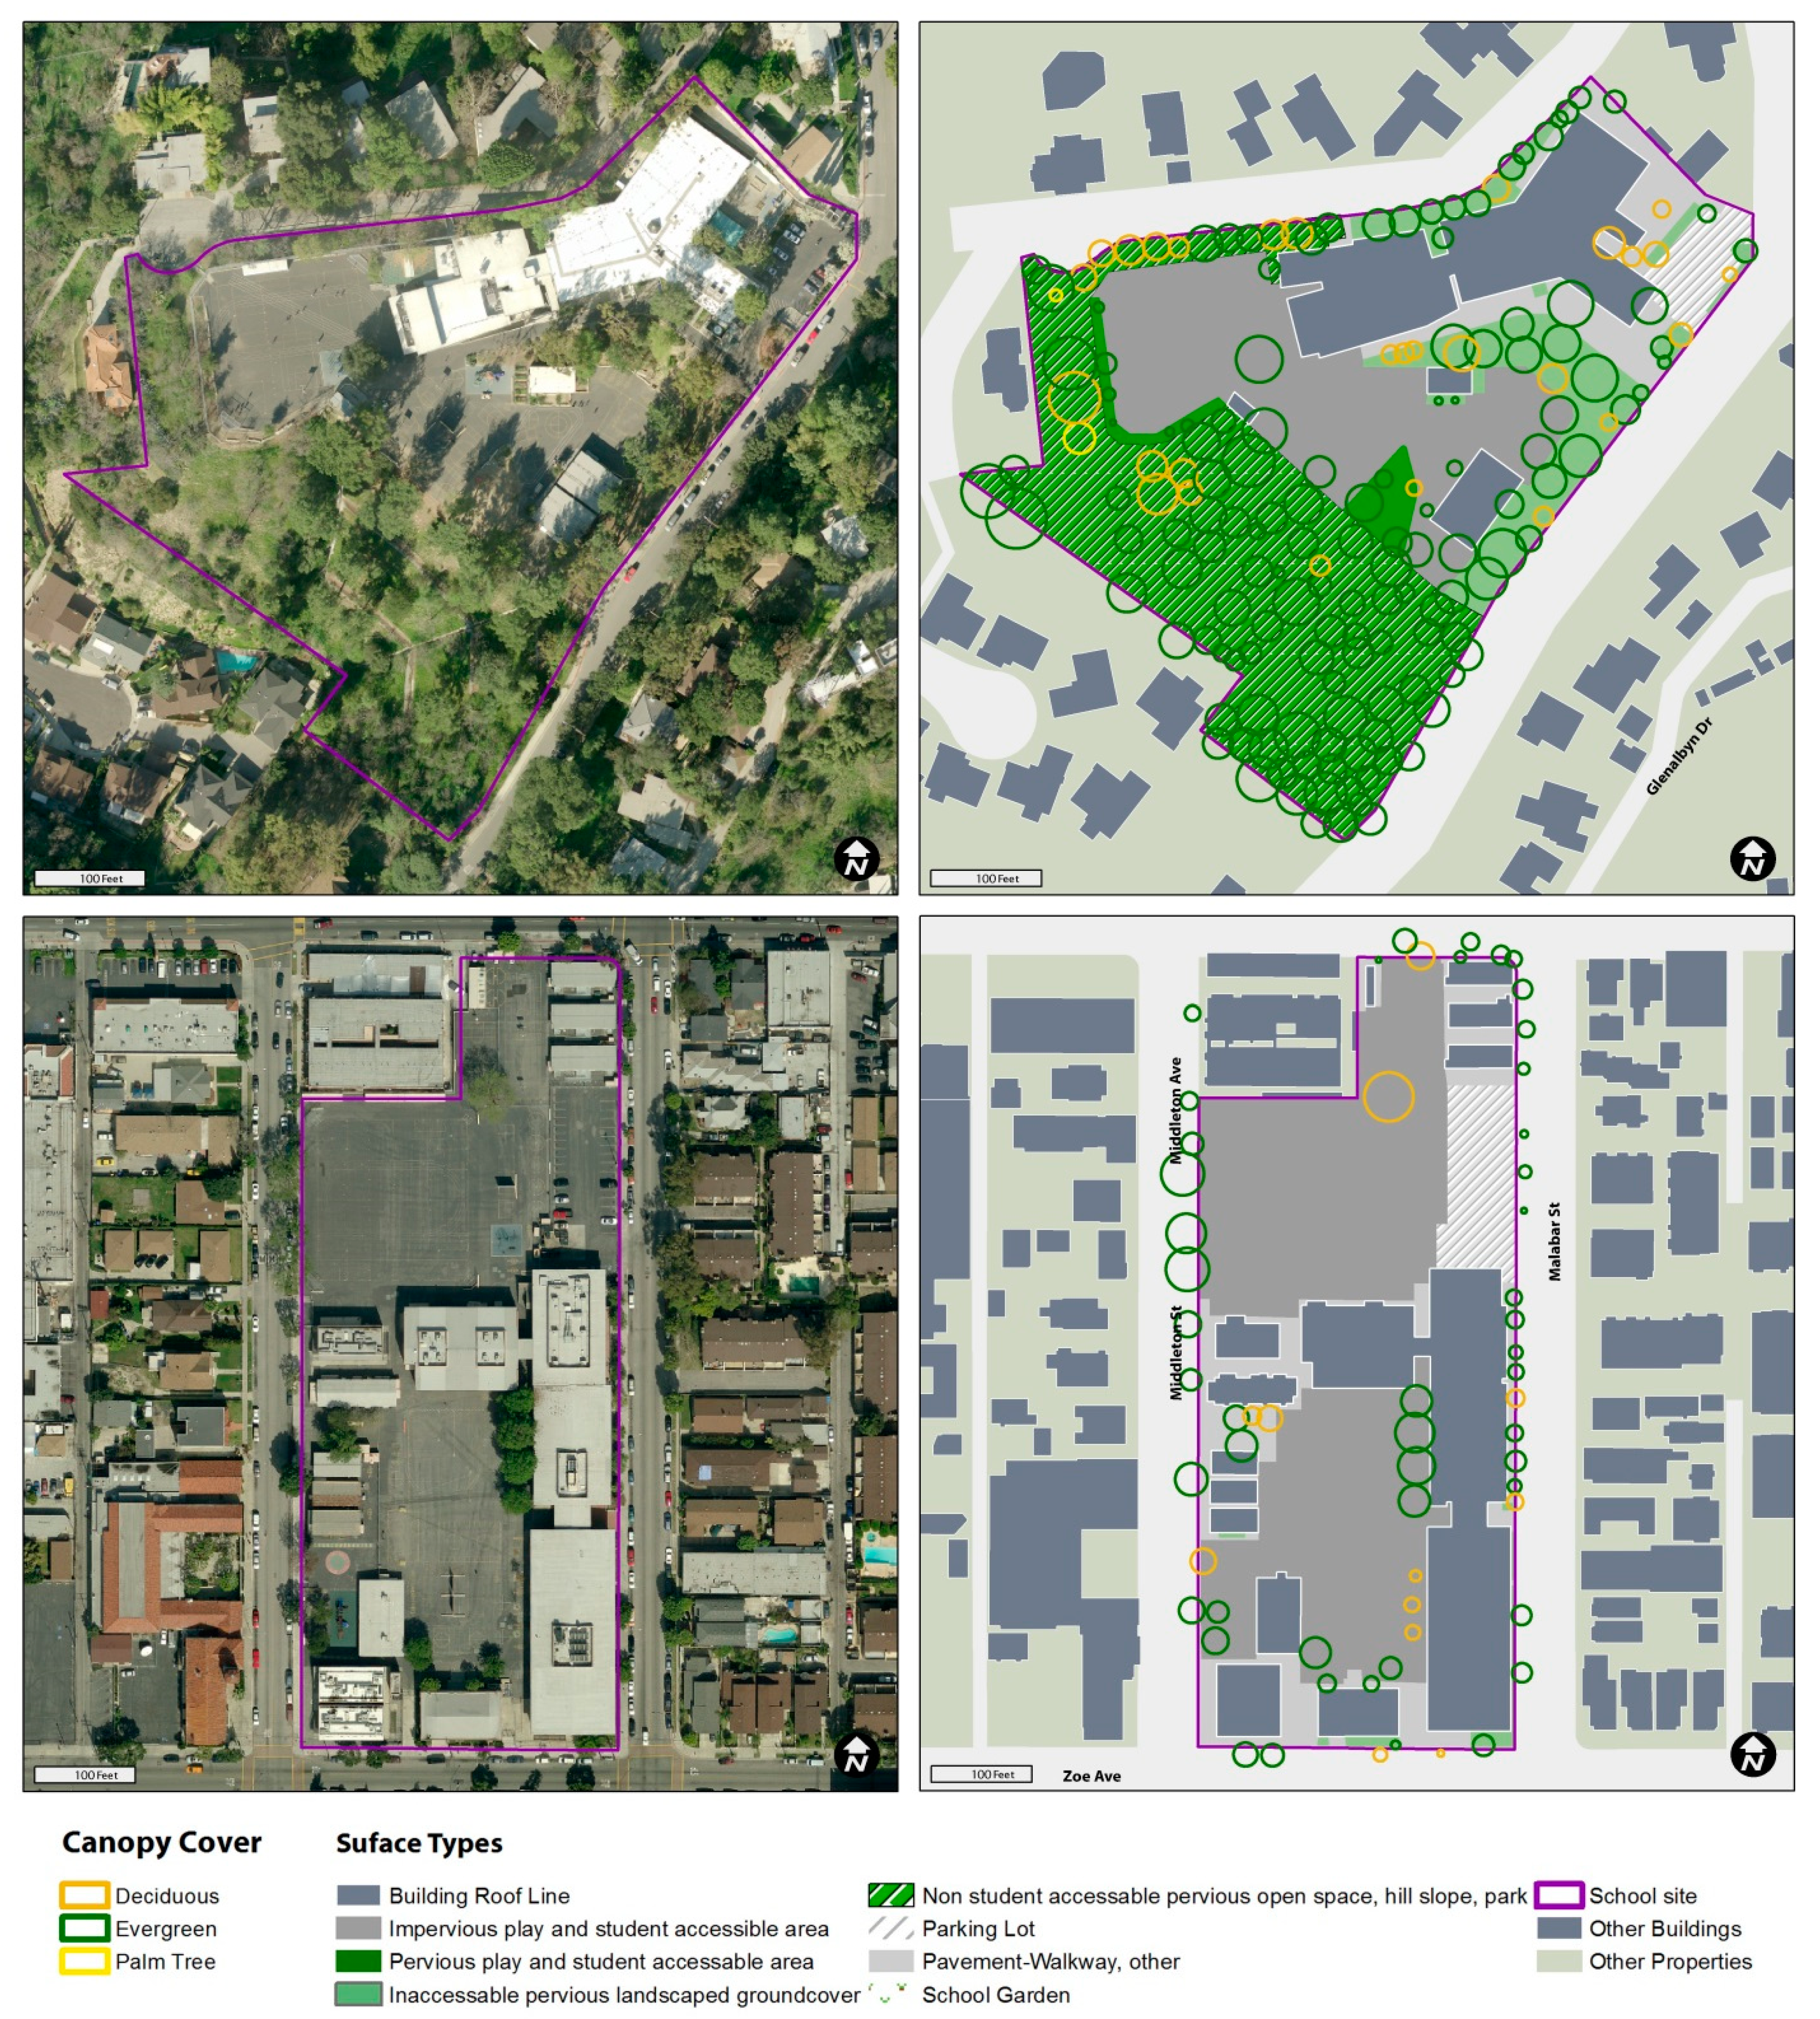
Figure 1 illustrates the classification based on the imagery.
Figure 1.
Top: Mt Washington Elementary showing hill slope. Bottom: Middleton Elementary in an urban neighborhood.
Figure 1.
Top: Mt Washington Elementary showing hill slope. Bottom: Middleton Elementary in an urban neighborhood.
2.4. Data Development Workflow
The data requirements for this study were to develop the required spatial data to determine tree canopy coverage, pervious/impervious areas, and buildings on 509 elementary school sites. Several remote sensing data collection techniques, previously developed by CWH for a statewide vegetation mapping program “Weed Watch” [
45], were utilized. In addition, the CWH GIS Analyst used an iterative and incremental approach to data development similar to well-known Scrum software development techniques. The GIS Analyst had six years of experience performing visual analysis of vegetation cover using the multiple imagery data set methodology.
In an effort to provide an initial understanding of the range of school site conditions, refine the techniques used for data development, and provide an estimation of time needed to digitize all school sites, a spatially random sample of (n = 10) schools was selected. This spatially random sample was generated using the ArcGIS “Create Random Points” tool with the point layer of the school sites as the constraining layer and the number of points to be randomly generated set to (n = 10).
The tree canopy for these spatially randomly selected school sites was digitized using two techniques: freehand drawing methods around the edge of the tree canopy as well as a crown circle representation with the circle representing the visual mean edge of the crown. The CWH GIS Analyst digitized the tree canopy using these techniques for the initial (n = 10) school sites (at this early stage it was decided that only one, experienced analyst, would digitize these critical data so as to minimize any subjective decision-making regarding the digitization process). The variation in tree canopy area calculated by these two methods (freehand versus crown circle) was found to be less than 5% (±) when comparing total tree canopy area at each school site. One advantage of using crown circles was in identifying recently planted trees on newly built school sites where the absence of tree canopy made digitizing using the freehand method difficult. The crown circle was far more effective and efficient in providing an indication of tree canopy presence.
The same technique was used for development of the surface cover analysis. Again, the ten spatially random school sites used for tree canopy mapping were used in the development of the surface types and uses. It became clear, that using the multiple imagery data set methodology, it was possible to discern which areas were pervious/impervious areas, as well as which were playground and or accessible to students during the outdoor playtime part of the day. The LAUSD School Design Guide was consulted for determining the types and uses that should be considered [
47]. The list of surface cover attributes was classified into the following categories:
Tree Canopy
Evergreen—in Southern California this is not limited to conifers but also includes Coast Live Oak and Eucalyptus trees.
Deciduous—trees that appeared in at least one dataset and analyzed to be in a dormant state.
Palm—trees that were identifiable but do not provide significant shade value.
Pervious/Impervious Surface Types (pervious surfaces were reported to the schools as “unpaved”)
Sub-Class Accessible to students during the school day—the LAUSD School Design Guide [
47] refers to this as; play areas, eating areas and outdoor instruction areas (this is a sub class of pervious and impervious and includes paved as well as turf and dirt surfaces.)
- ○
Accessible paved play area *
- ○
Accessible unpaved play area
- ○
School garden
Sub-Class Inaccessible for outdoor use during the school day.
- ○
Buildings—roof lines (includes permanent shade structures over eating areas)
- ○
Walkways and other pavement *
- ○
Parking lots
- ○
Inaccessible landscape (includes turf and planted shrub areas)
- ○
Hill slope/Opens pace
(* Tree wells were not mapped)
A second spatially random sample of (
n = 110) schools was selected. This accounted for more than 20% of all school sites and allowed the researchers to assess the potential for classifying all the sites using this data development process. A GIS Intern was hired and trained in the methodology to digitize the surface cover data. The resultant analysis of this data set indicated that 86% of the school sites contained impervious surface types. Though these findings were similar to the values published in the LA County Hydrology Manual [
48] where it was established that 82% of elementary school sites had impervious surfaces, the range of values was large and as a result, the researchers determined that the best course of action would be an assessment of all elementary schools.
The CWH GIS Analyst then collaborated with six, graduate-level, GIS students at the California State University, Fullerton, to digitize the remaining (n = 389) school sites. Eight hours of on-site and distance instruction was provided to the students to prepare and guide them in interpreting the imagery utilizing the digitization methods previously established and to understand the expected quality standards. Each student was assigned a spatially random group of school sites and was required to check-in their data in two-week intervals so that it could be checked by the CWH GIS Analyst to insure that it met the expected quality standards for digital accuracy and correct classification. After the first, two-week data submission, a group distance learning session was performed to review examples that fell outside the expected quality standards and to review specific problem issues.
Data was only entered into the project geodatabase once a final quality control session was performed by both the student and the CWH GIS Analyst. This included topology checks (e.g., overlaps or gaps), surface based queries for suspect classifications (e.g., hillsides or play areas with very small total area), and a final visual review of each school site where both tree canopy coverage and surface coverage were double-checked. Once this step was completed, the CWH GIS Analyst used the following techniques to generate the information for each school site and the district as a whole.
Each tree canopy crown circle was labeled with the school site name through a spatial join with the school site boundary layer. The crown circles were then dissolved by the school site name field to a single multi-part polygon representing the total tree canopy coverage. The tree canopy for the school site was then intersected with the school site boundary layer to determine the total tree canopy size and percent of canopy coverage for the school site.
In a similar manner, each school site surface coverage was spatially joined to the school site boundary layer. Each was then processed through a series of dissolve functions to produce the various tree canopy, pervious/impervious, and building layers outlined, and discussed, above.
One final set of intersects was performed between the tree canopy and the surface coverage layers that provides the last set of critical information to understanding the conditions at each school site and its relationship to the district as a whole. These include:
Trees per acre
The number of trees that have tree canopies that intersect each school site
The area and percentage of the school site that has tree canopy
The area and percentage of the play area that has tree canopy, both as a whole and by paved and unpaved categories
The area and percentage of the school site that is paved
The area and percentage of the play area that is paved or unpaved
2.5. Data Dissemination
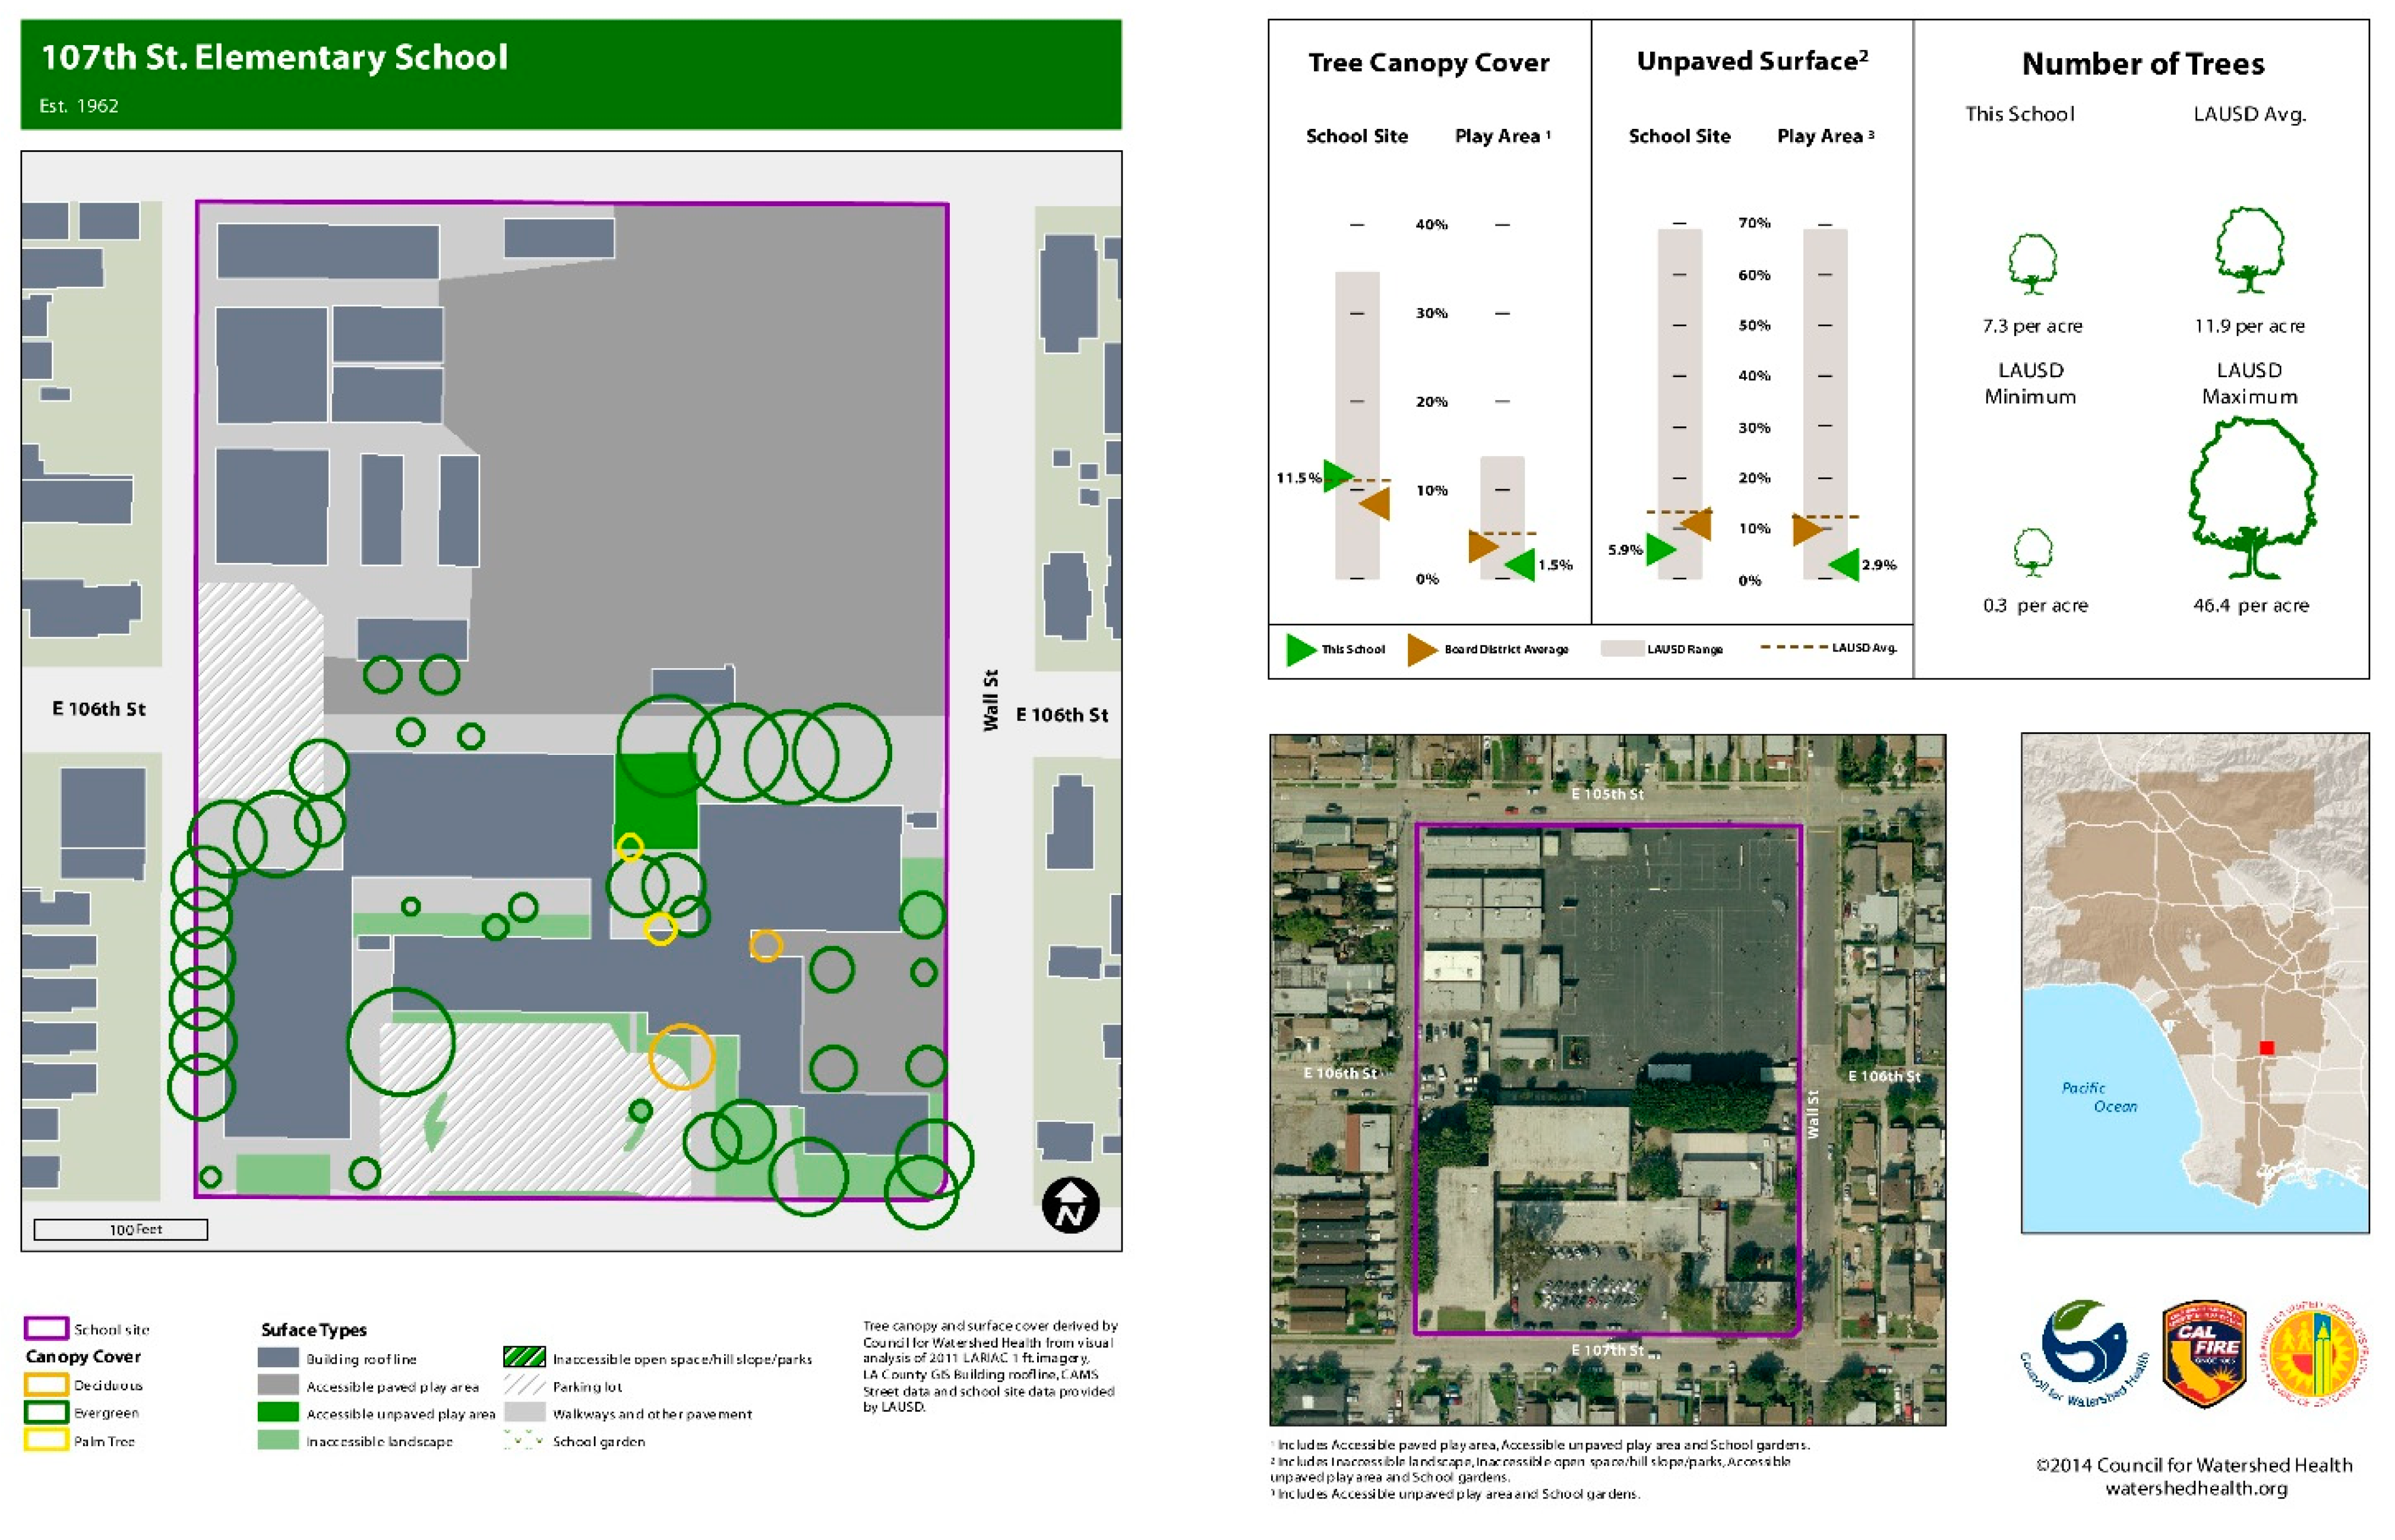
The resultant output from this workflow is a map based report (
Figure 2) depicting each school site with the categories from above. Though the report illustrates the current condition of the school site, it could also be used to identify the location(s) of where newly planted trees would benefit each site by providing shade and/or play area canopy cover.
Figure 2.
Example report for each school site.
Figure 2.
Example report for each school site.
4. Discussion
The purpose of this study was to acquire and analyze data regarding tree canopy cover, pervious/impervious areas, and buildings across the LAUSD. Mapping environmental conditions in this manner could also inform the ways in which public health policy can be designed and implemented. Using the same analytic output, a “profile of sun safety attributes” could be determined for each elementary school site. This derived “profile” could inform sun safety planning and implementation activities, contribute to the prevention of skin cancer incidence, and provide an “early warning” of current sun safety conditions.
Early warning systems are said to have three components: routine surveillance, disease modeling utilizing surveillance and environmental data, and forecasting disease risk through predictive modeling [
49]. In this instance, this involves the second of these components, where historical surveillance data is utilized in connection with current environmental data through remote sensing to determine the extent to which the risk of skin cancer is greater and provide an early warning of such conditions.
Table 3.
Correlations for Tree Canopy and SED Status of School Sites (N = 509).
Table 3.
Correlations for Tree Canopy and SED Status of School Sites (N = 509).
| Tree Canopy Cover School Site (Percent) | Tree Canopy Cover Play Area (Percent) | Unpaved Surface School Site (Percent) | Unpaved Surface Play Area (Percent) | Percent of Population Living in State Designated Disadvantaged Community Census Block Group | Percent of Population Living in an over 75th Percentile CES Census Tract |
|---|
| Tree Canopy Cover School Site (percent) | Pearson Correlation | 1 | 0.683 ** | −0.121 ** | 0.243 ** | −0.396 ** | −0.388 ** |
| Sig. (2-tailed) | | <0.001 | 0.006 | <0.001 | <0.001 | <0.001 |
| Tree Canopy Cover Play Area (percent) | Pearson Correlation | 0.683 ** | 1 | −0.06 | −0.044 | −0.279 ** | −0.309 ** |
| Sig. (2-tailed) | <0.001 | | 0.177 | 0.318 | <0.001 | <0.001 |
| Unpaved Surface School Site (percent) | Pearson Correlation | −0.121 ** | −0.06 | 1 | 0.658 ** | −0.104 * | −0.137 ** |
| Sig. (2-tailed) | 0.006 | 0.177 | | <0.001 | 0.019 | 0.002 |
| Unpaved Surface Play Area (percent) | Pearson Correlation | 0.243 ** | −0.044 | 0.658 ** | 1 | −0.266 ** | −0.260 ** |
| Sig. (2-tailed) | <0.001 | 0.318 | <0.001 | | <0.001 | <0.001 |
| Percent of Population Living in State Designated Disadvantaged Community Census Block Group | Pearson Correlation | −0.396 ** | −0.279 ** | −0.104 * | −0.266 ** | 1 | 0.730 ** |
| Sig. (2-tailed) | <0.001 | <0.001 | 0.019 | <0.001 | | <0.001 |
| Percent of Population Living in an over 75th Percentile CES Census Tract | Pearson Correlation | −0.388 ** | −0.309 ** | −0.137 ** | −0.260 ** | 0.730 ** | 1 |
| Sig. (2-tailed) | <0.001 | <0.001 | 0.002 | <0.001 | <0.001 | |
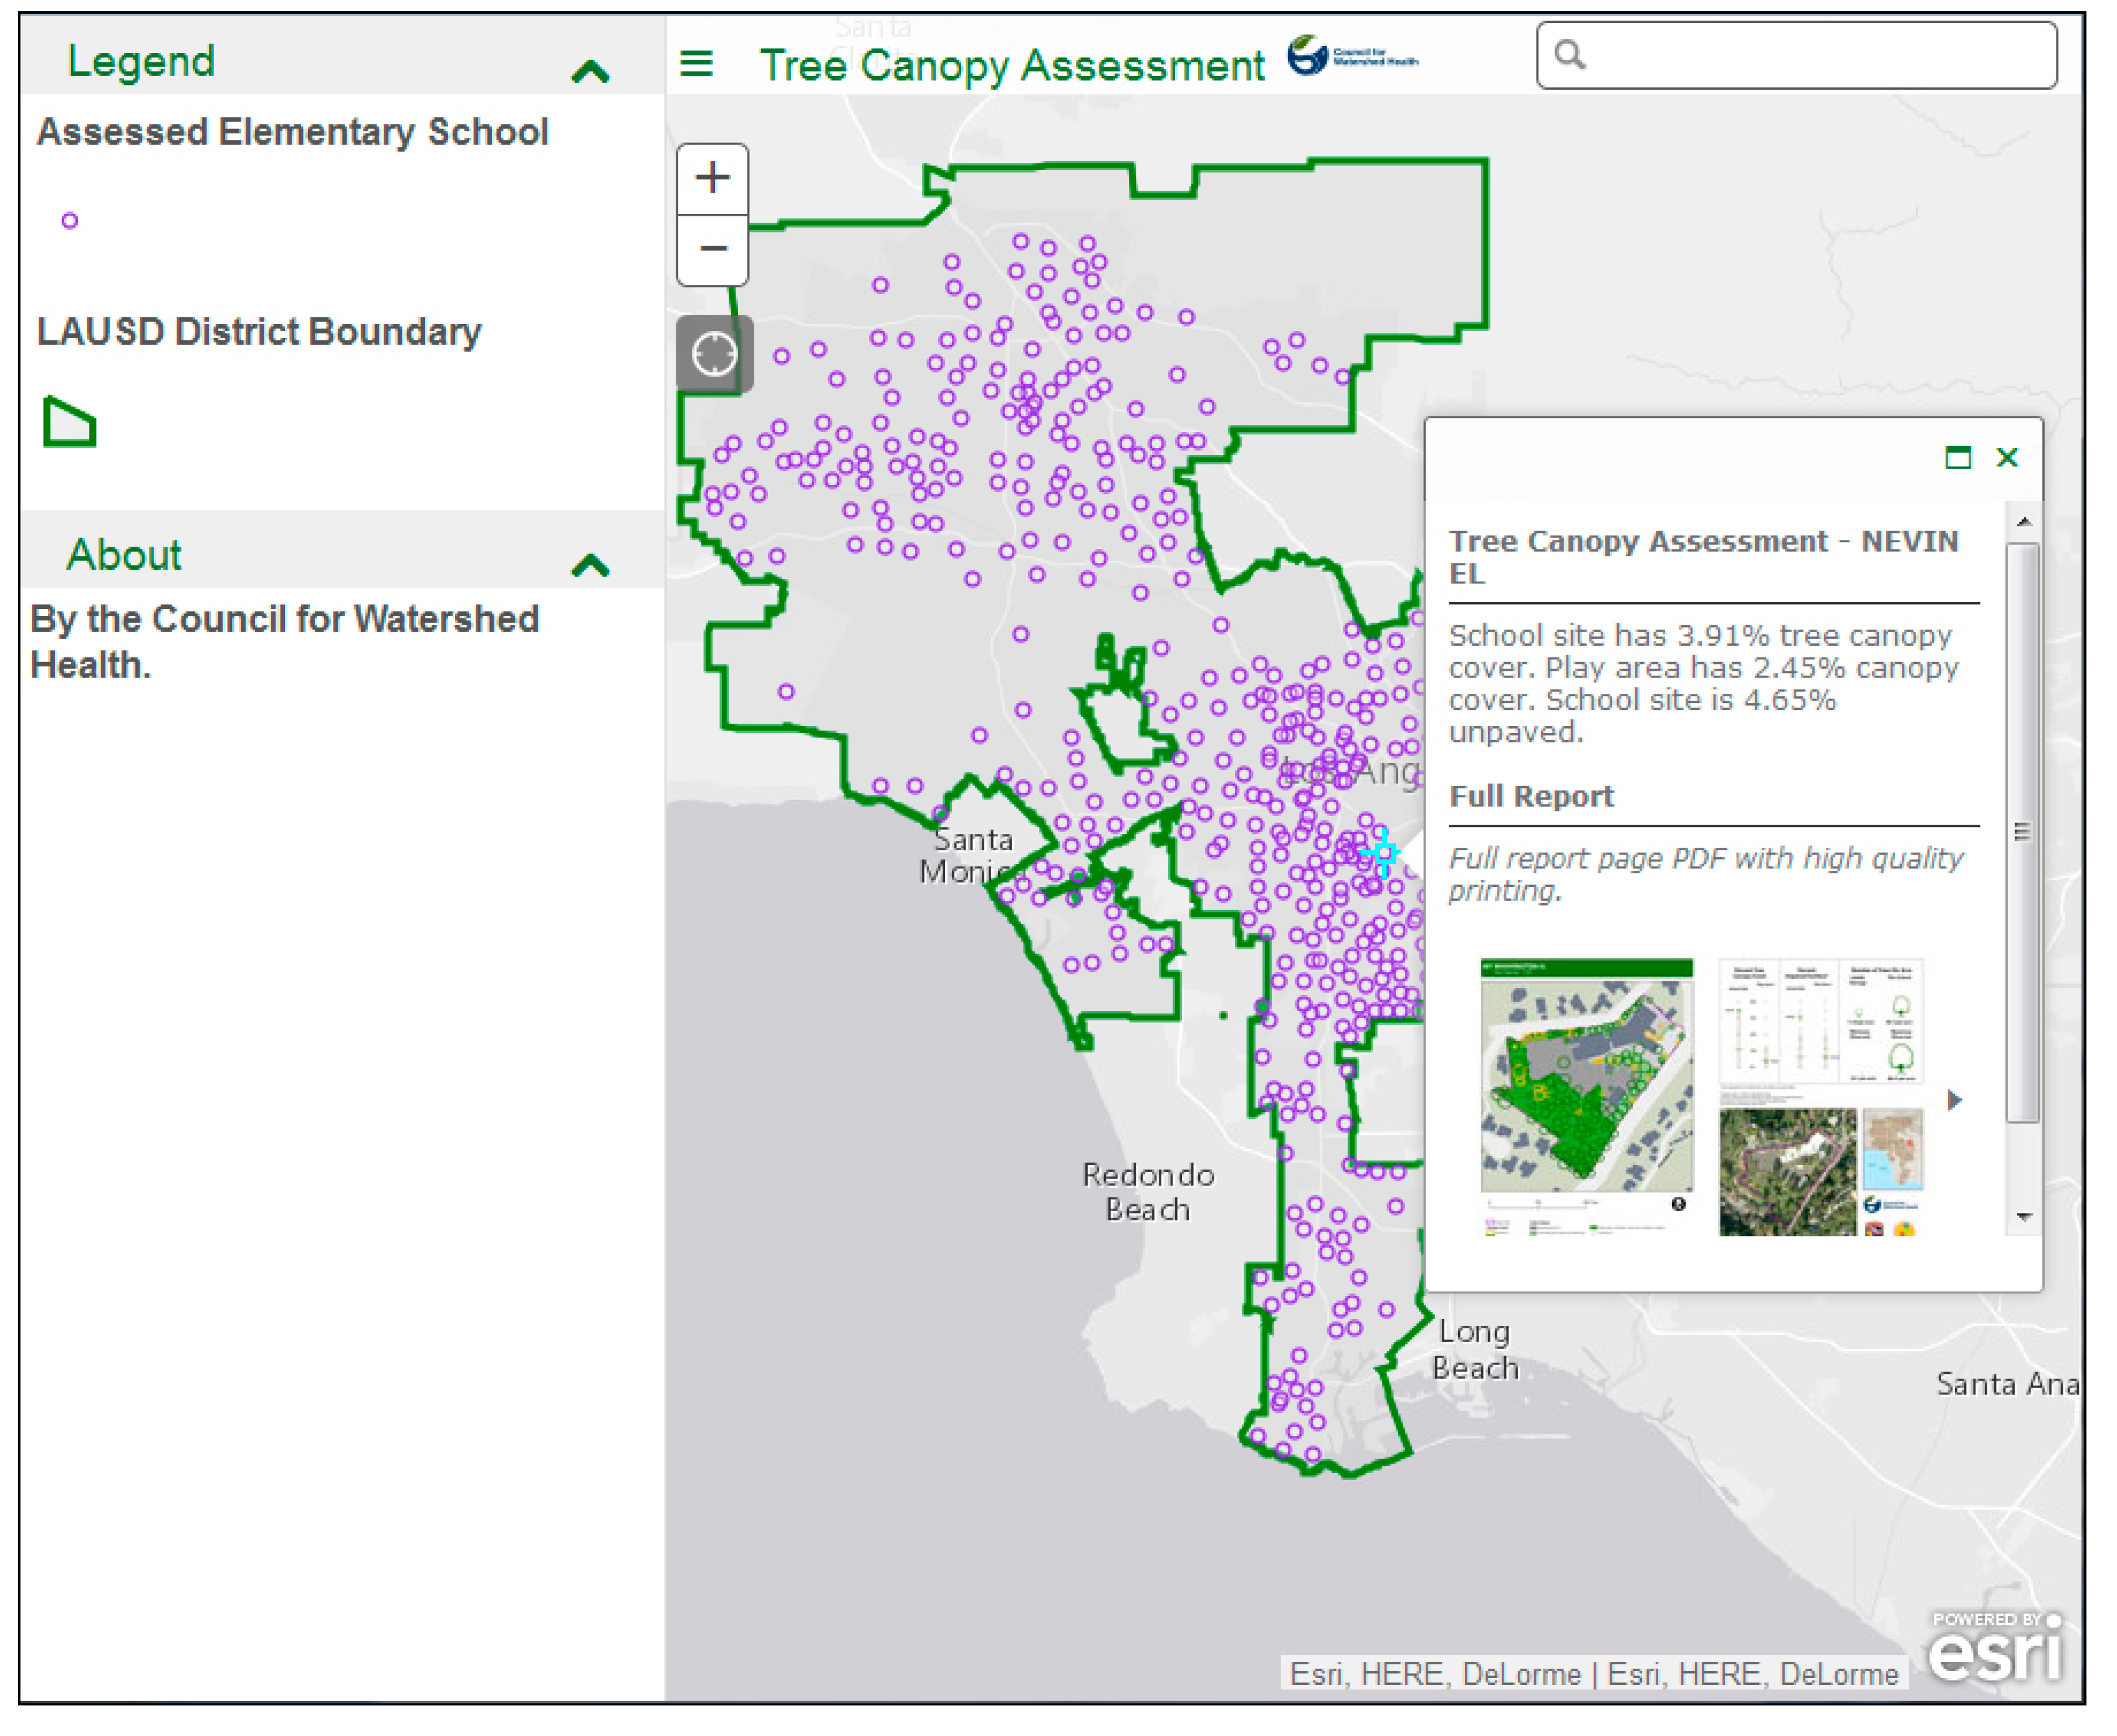
In addition to the school site reports, a website was developed that puts this information in a more accessible, narrative, public form (
Figure 4). The narrative paradigm (a theory that all meaningful communication is a form of storytelling, that is, a representation of a linked sequence of events) has been well developed in disciplines such as story-writing, film studies, and literary studies. Many geospatial phenomena—tornadoes following a storm front, boats leaving and entering ports, or changes in land use over time—also follow sequences, and their deviation from a known narrative becomes a mechanism by which the usual can be differentiated from the unusual [
50]. In this manner, the data from this study are represented as phenomenon regarding the area the related geospatial data represent.
In many urban neighborhoods without parks or other open spaces, schools may be the only practical locations or “safe havens” where children are able to spend time outdoors. To that end, additional research and analysis can help inform a robust prioritization methodology for multi-benefit tree canopy additions. The determination of what constitutes a sun safe school could be made through conversations with county public health officials and LAUSD school administrators. Implementation and enforcement of sun safety policies would be the role of school administration, teachers, parents, and students. If a district-wide implementation of sun safety policies were to take place, it would be useful to conduct another spatial analysis of tree canopy to determine whether tree canopy in LAUSD elementary school play areas played a role in reduced sun-related health issues.
As part of an environmental profile of sun safety attributes, future assessments of sun safety on LAUSD school sites would include an index providing an overall ranking of schools with the lowest/highest levels of sun safety. This could include an environmental assessment of the particular tree types located on the school site, ranked by their suitability for providing high levels of shade, as well as percentage of student accessibility to the shade provided by tree canopy on school sites. Additional indicators for prioritization of schools for additional tree canopy would also be included (e.g., access to parks and open space within the attendance area and the relative amount outdoor space available within the community based on land use or spatial analysis of the proportion of the lot size to the building size, amount of tree canopy in the community, etc.). Though these off-site factors might not inform a reasonable minimum expectation of the canopy available at the school site, they may inform a prioritization for limited funding to implement tree-planting programs.
The redesign of schools continues in the Los Angeles region, but not to address sun safety, rather they assess the ability of the schools to be adapted for stormwater capture and storm event runoff reduction as funded through the State of California Drought Response Outreach Program for Schools (DROPS) program [
51]. These redesigns do not include trees in the mix of modifications that are funded by the DROPS program. A similar example is that of the California Department of Forestry and Fire Protection where priorities for funding tree planting are based on both SED communities and likelihood of carbon sequestration [
52]. Again, benefits for sun safety and/or urban heat island reduction are not factors considered regarding funding unless they reduce greenhouse gases by providing shade for buildings even though these are important climate adaptation strategies. A clear sun safety policy suggesting tree canopy as mitigation for both UV and urban heat effects could begin to significantly change the school site. Likewise, a more integrated multi-benefit ecosystem approach for school redesign could produce a more complete and effective cost benefit analysis across public health and related environmental impacts.
Figure 4.
Website showing map layers, data, and report access.
Figure 4.
Website showing map layers, data, and report access.
Additional research into the fine scale benefit of trees for UV as well as heat reduction could include in-situ monitoring of local temperatures and UV on different parts of school sites with different tree shade/structural shade and no shade areas to assess the benefits for public health. In addition, technology advances are providing the ability to more rapidly capture imagery of tree canopy on school sites. As a result, school sites could be assessed for sun safety issues more quickly and more frequently.
5. Conclusions
With the goal of reforesting public school sites with limited resources, community organizations have worked to implement projects on school sites within the LAUSD. However, analysis as to the best location for planting, long-term maintenance, or appropriateness of the tree type was not fully considered. The LAUSD School Shade Tree Canopy Study was a response to this issue in which data was acquired and analyzed regarding tree canopy cover, pervious/impervious areas, and buildings for 509 elementary schools to assess urban forestry management issues and environmental injustices within communities, often with socioeconomic disadvantaged (SED) status. Moreover, this analysis has the potential to aid in decreasing the incidence of skin cancer and other adverse environmental health outcomes, particularly for students attending LAUSD schools. Additionally, the urban heat island effect could also be analyzed and its linkages to heat-related illnesses.
In the LAUSD School Shade Tree Canopy Study, only the most current, publically available, high resolution imagery data sets, were used. A total of 33,729 trees in the LAUSD were mapped. Findings indicated that ~20% of the schools have both (0.0%) tree canopy coverage play areas and 100% paved surfaces. The ratio of tree canopy coverage of the entire school site (11.0%) to that of the tree canopy play area (4.5%) is most striking with play areas having approximately 50% less tree canopy coverage than that of the entire school site tree canopy coverage. Additionally, although the mean percentage of tree canopy coverage on school sites was (11.0%), there is no benchmark for tree canopy coverage for school sites in the Los Angeles region.
While much discussion exists regarding sun safety policies on school sites with regard to specific measures to protect students from the harmful effects of UV radiation, emphasis on the benefits of school canopy on school sites is relatively lacking. Additionally, neither the established determination of a recommended percentage of tree canopy cover on school grounds, nor the prioritization of tree planting on school grounds in sun safety implementation has been documented. Further analysis of both neighborhood and city level data would be required to determine if schools are reflective of their local settings or are distinctive. Additional analysis would also need to be conducted to determine the best landscape and tree planting design to improve both impacts to the environment as well as public health outcomes.


