1.1. Research Background
The applications of three-dimensional (3D) road maps have garnered significant attention in recent times. These maps express the geometrical shapes and structures in street environments as 3D objects. So far, most road maps are two-dimensional maps, and are used for navigation and road management. Recent developments in measurement technology, such as mobile mapping systems (MMS), can be used for transforming these two-dimensional maps into three-dimensional maps. An MMS is equipped with cameras and LASER (Light Amplification by Stimulated Emission of Radiation) scanners, and can easily and efficiently acquire 3D data on the street. 3D road maps are expected to facilitate applications in many fields. These maps will not only enhance driver navigation and road management, but also serve as base maps in disaster prevention and infrastructure management. The development of 3D maps is also keenly discussed in the field of autonomous driving because accurate and information-rich maps are needed for recognition, decision and operation, in order to replace the functions of human drivers. It is therefore appropriate that road maps for autonomous driving must contain information on dynamic and real-time street states, such as traffic accidents and road constructions [
1]. Road maps expressing the street environment with 3D objects are important as base maps, and are being widely researched and discussed.
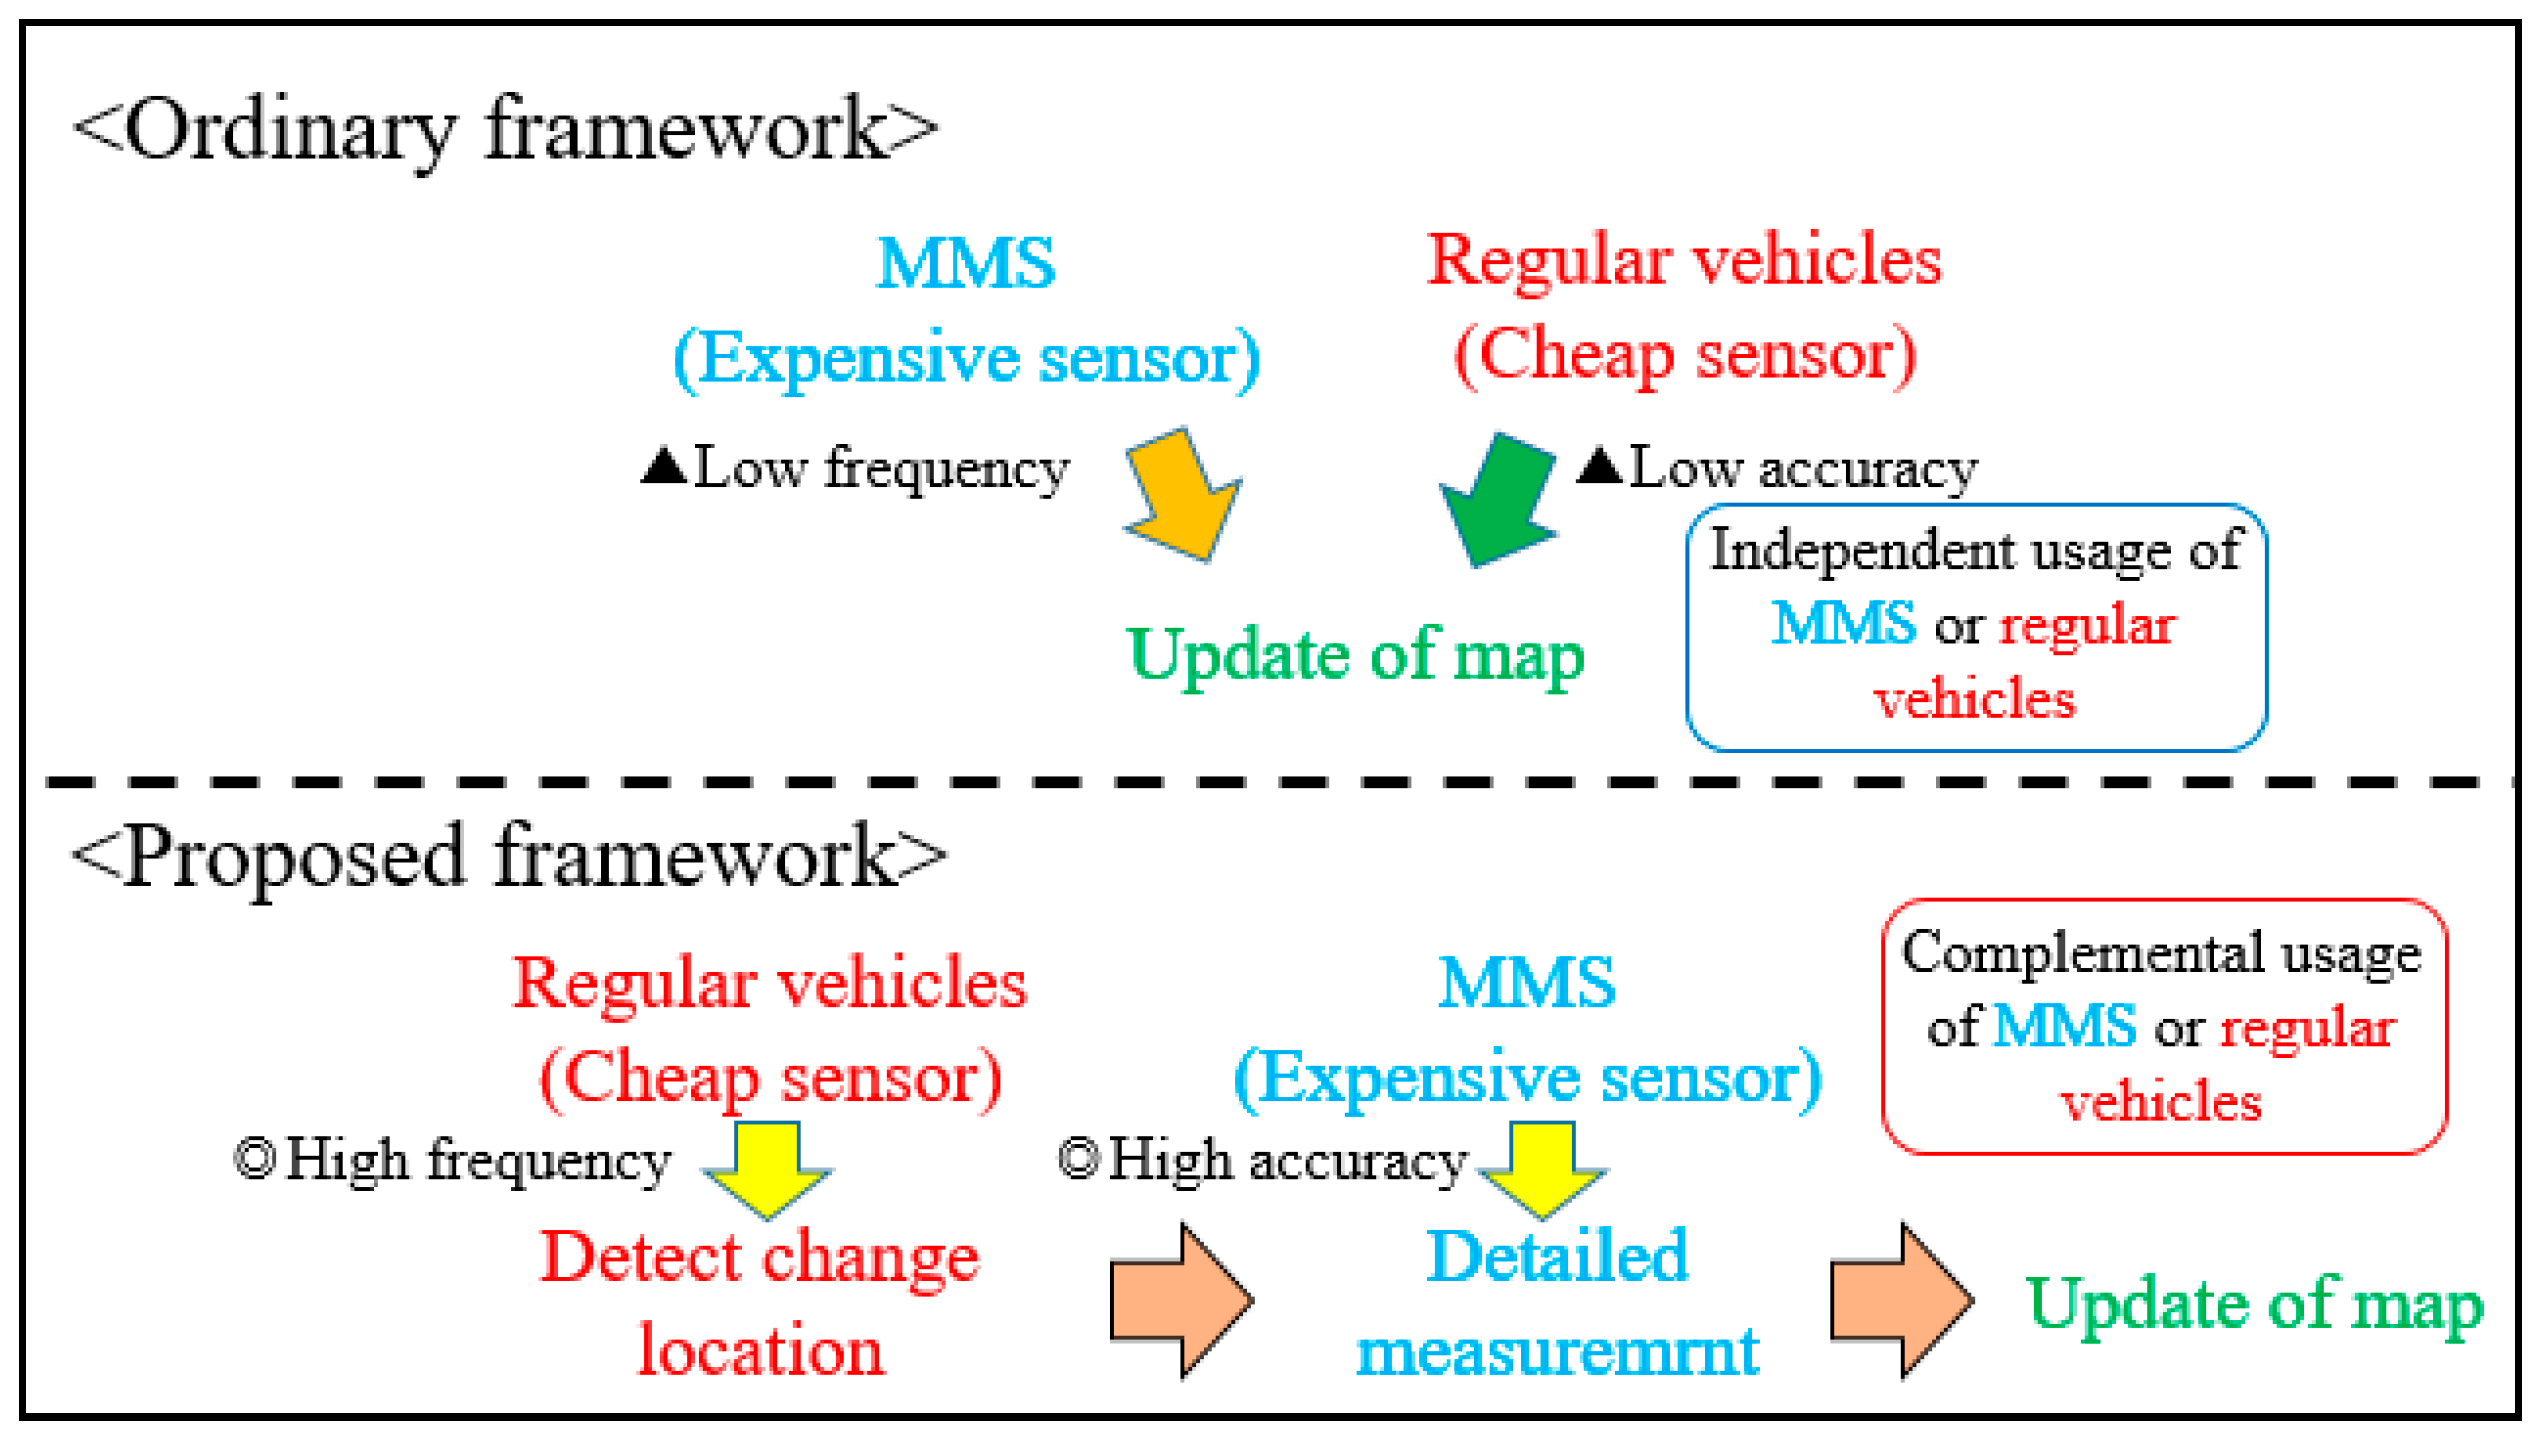
While MMS is generally considered an established means for constructing 3D road maps, people have now begun to discuss the maintenance of these maps. Map updating is important because 3D road maps contain much larger amounts of information than ordinary two-dimensional maps, and need to provide up-to-date information on the street environment for safety, especially in autonomous driving. The direct approach for keeping the map up to date is to build the road map repeatedly. In other words, the whole street area is measured by MMS and the map is rebuilt. This approach has the advantage of high accuracy, but is expensive, and obtaining point cloud data from MMS requires manual processes. Thus, the direct approach is prohibitive, and an alternative method is needed. A cost-saving alternative is to use the image or point cloud data from cheap sensors that regular vehicles are equipped with for supporting drivers and autonomous driving. It will be common in the near future for regular vehicles to have LASER scanners to scan the environment, when driver supporting systems or autonomous driving technology will be widespread. Thus, we would be able to easily obtain low cost point cloud data of the street environment if the data from regular vehicles is used. However, the data obtained from cheap sensors is not as accurate as that of MMS, and the updated map becomes a patchwork of data of varying accuracies.
As discussed above, a method to update three-dimensional maps that satisfactorily addresses both frequency and accuracy requirements has not yet been established, and a framework that combines the best of both these approaches is needed. We propose a two-step approach (
Figure 1). The changed locations are first detected using data from cheap sensors, and then detailed measurement is subsequently taken in those areas by using MMS. It will be possible to efficiently detect where changes in the road environment happen because data from regular vehicles can be frequently acquired, and the accuracy of the updated map would be consistent because MMS is used to acquire data for the map update. Thus, the proposed framework will contribute towards the sustainable updating of 3D road maps.
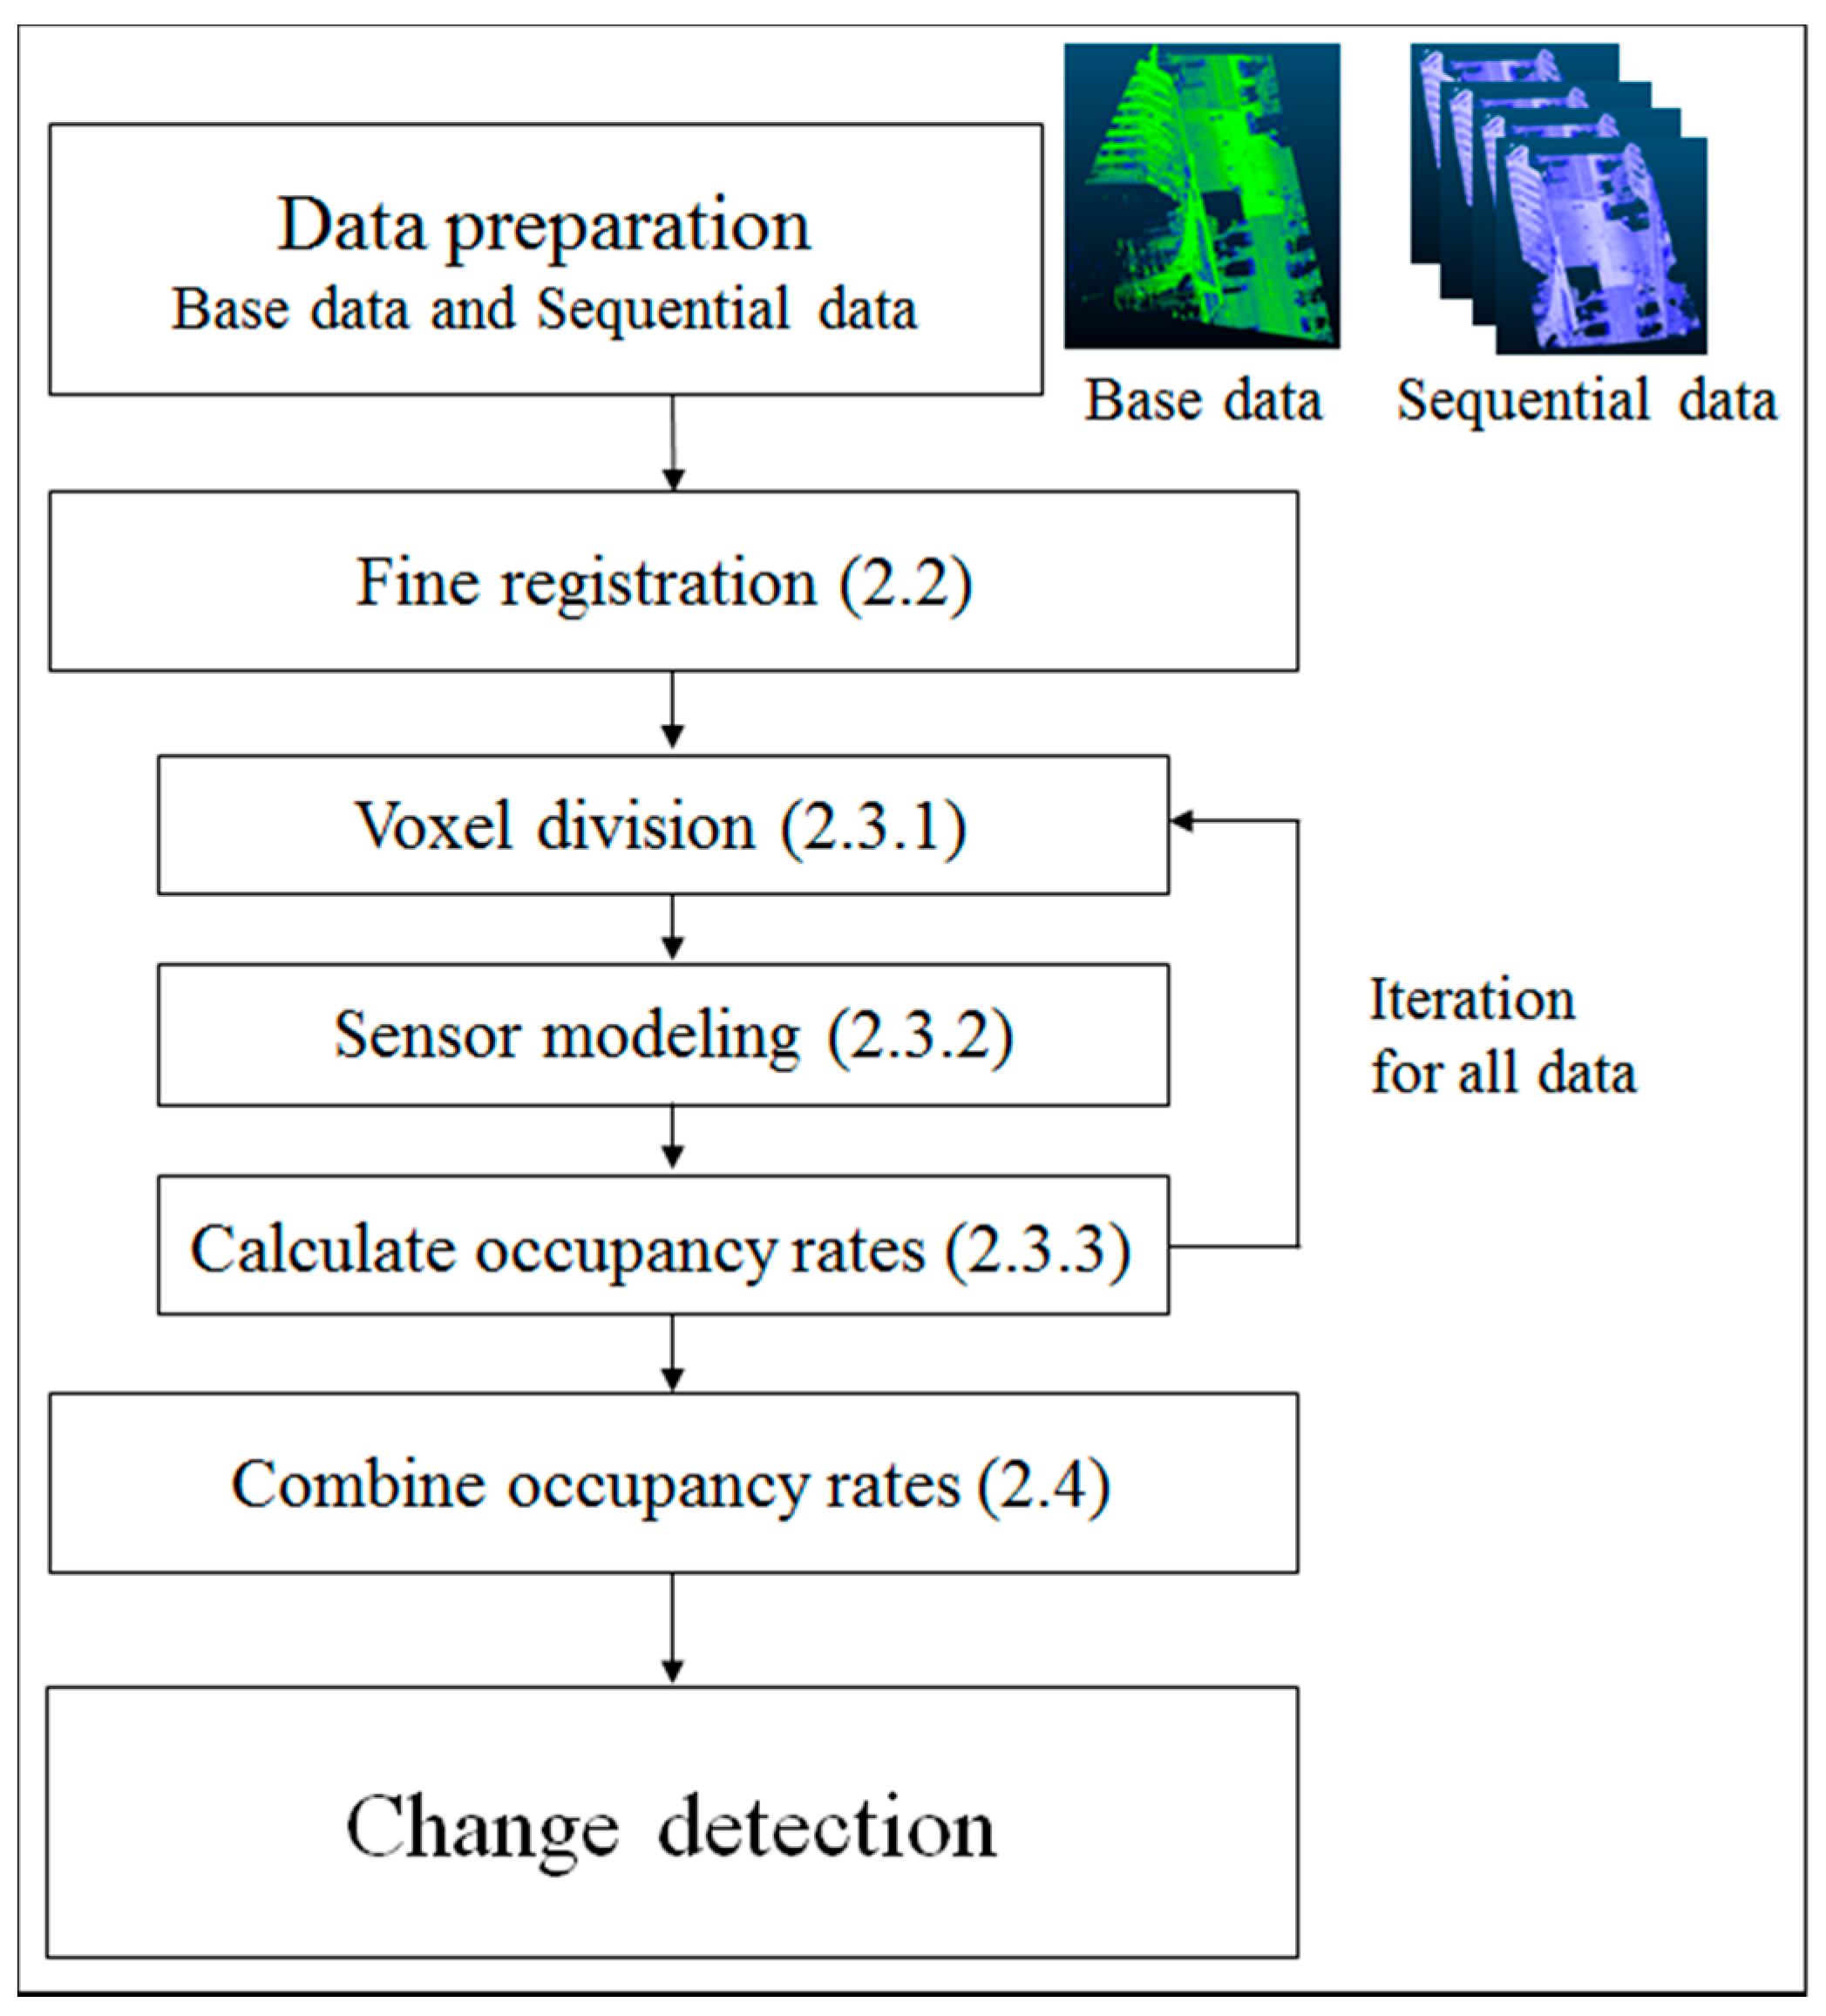
The research in this paper focuses on the first step, and visualizes the location of change in the street to enable us to quickly and easily understand where changes in the road environment occur. We deal with point cloud data in this paper because it is robust against climate and light conditions unlike image data. Moreover, point cloud data directly provides 3D information, while additional processing is required to obtain this information from image data. Nevertheless, there are several technical challenges that need to be addressed in order to achieve the proposed objective. Firstly, data from MMS and cheap sensors have different accuracies and point densities. The cheap sensors would also vary between themselves in terms of performance. Secondly, the measurement ranges of cheap sensors are likely to vary. Thirdly, the data would contain tentative changes, such as oncoming vehicles and pedestrians, which must be discriminated from real changes. We first align the low accuracy data with MMS data to adjust for position and rotation errors. We then apply the occupancy grid method [
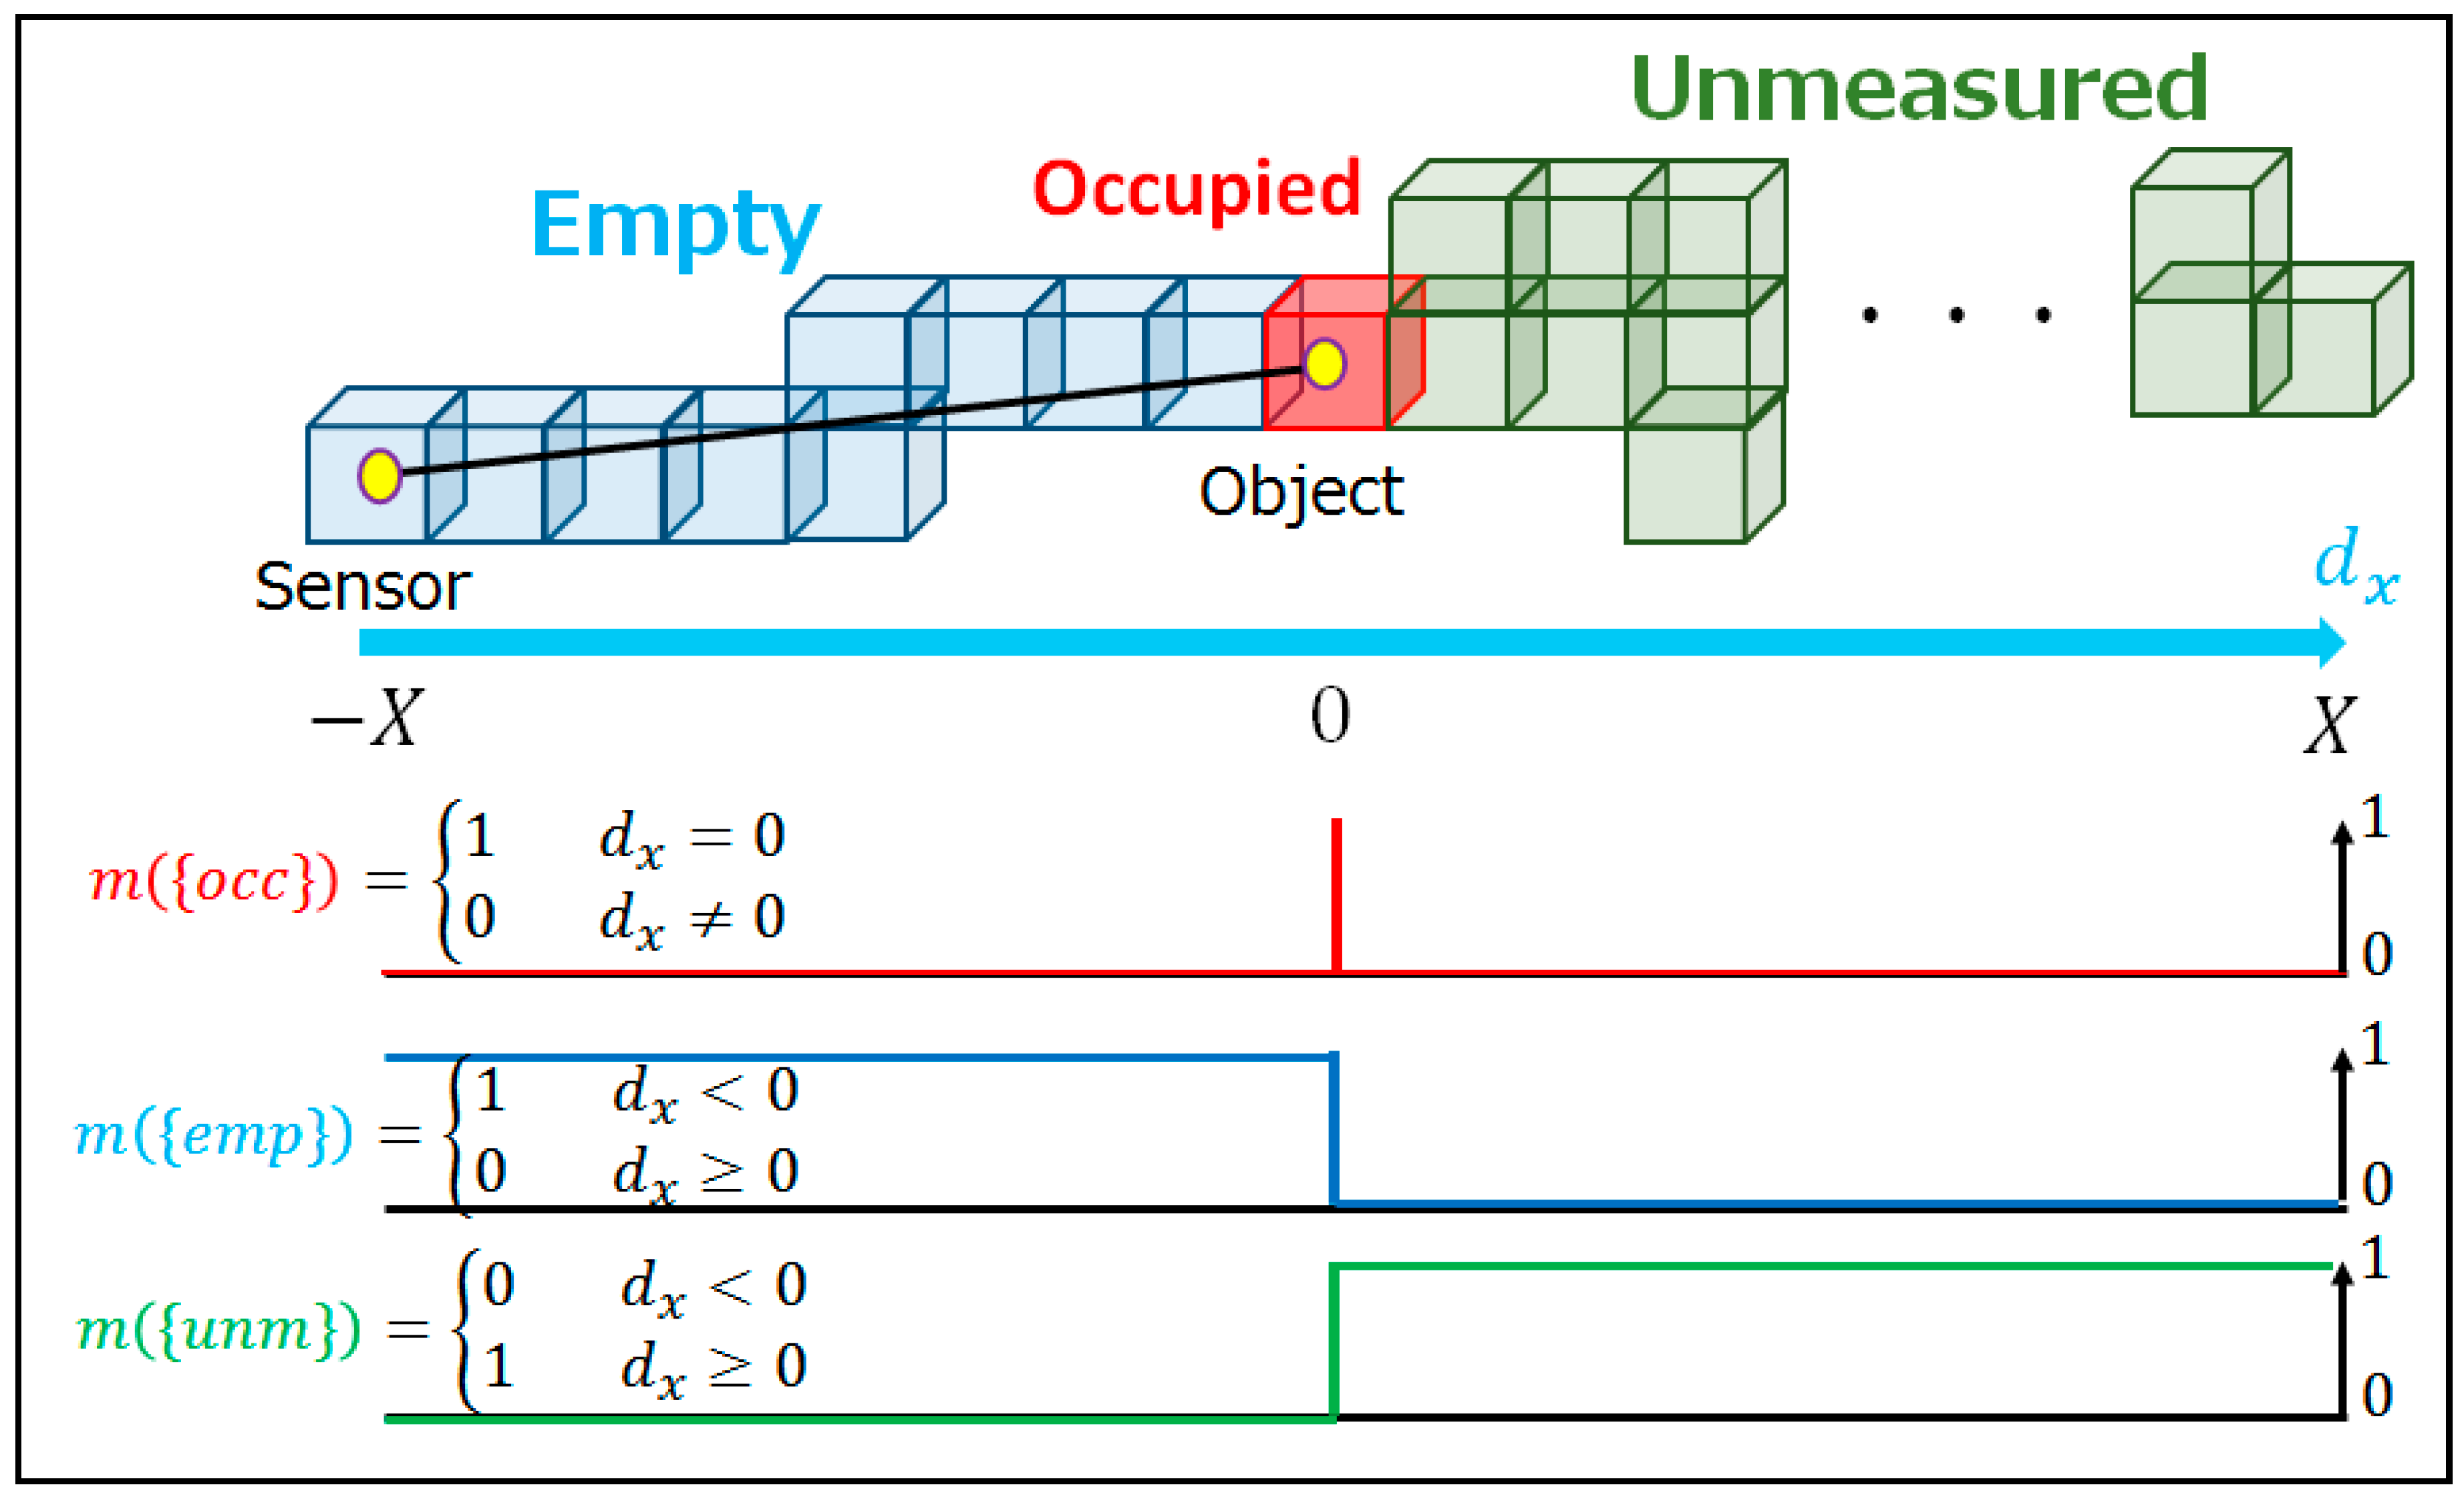
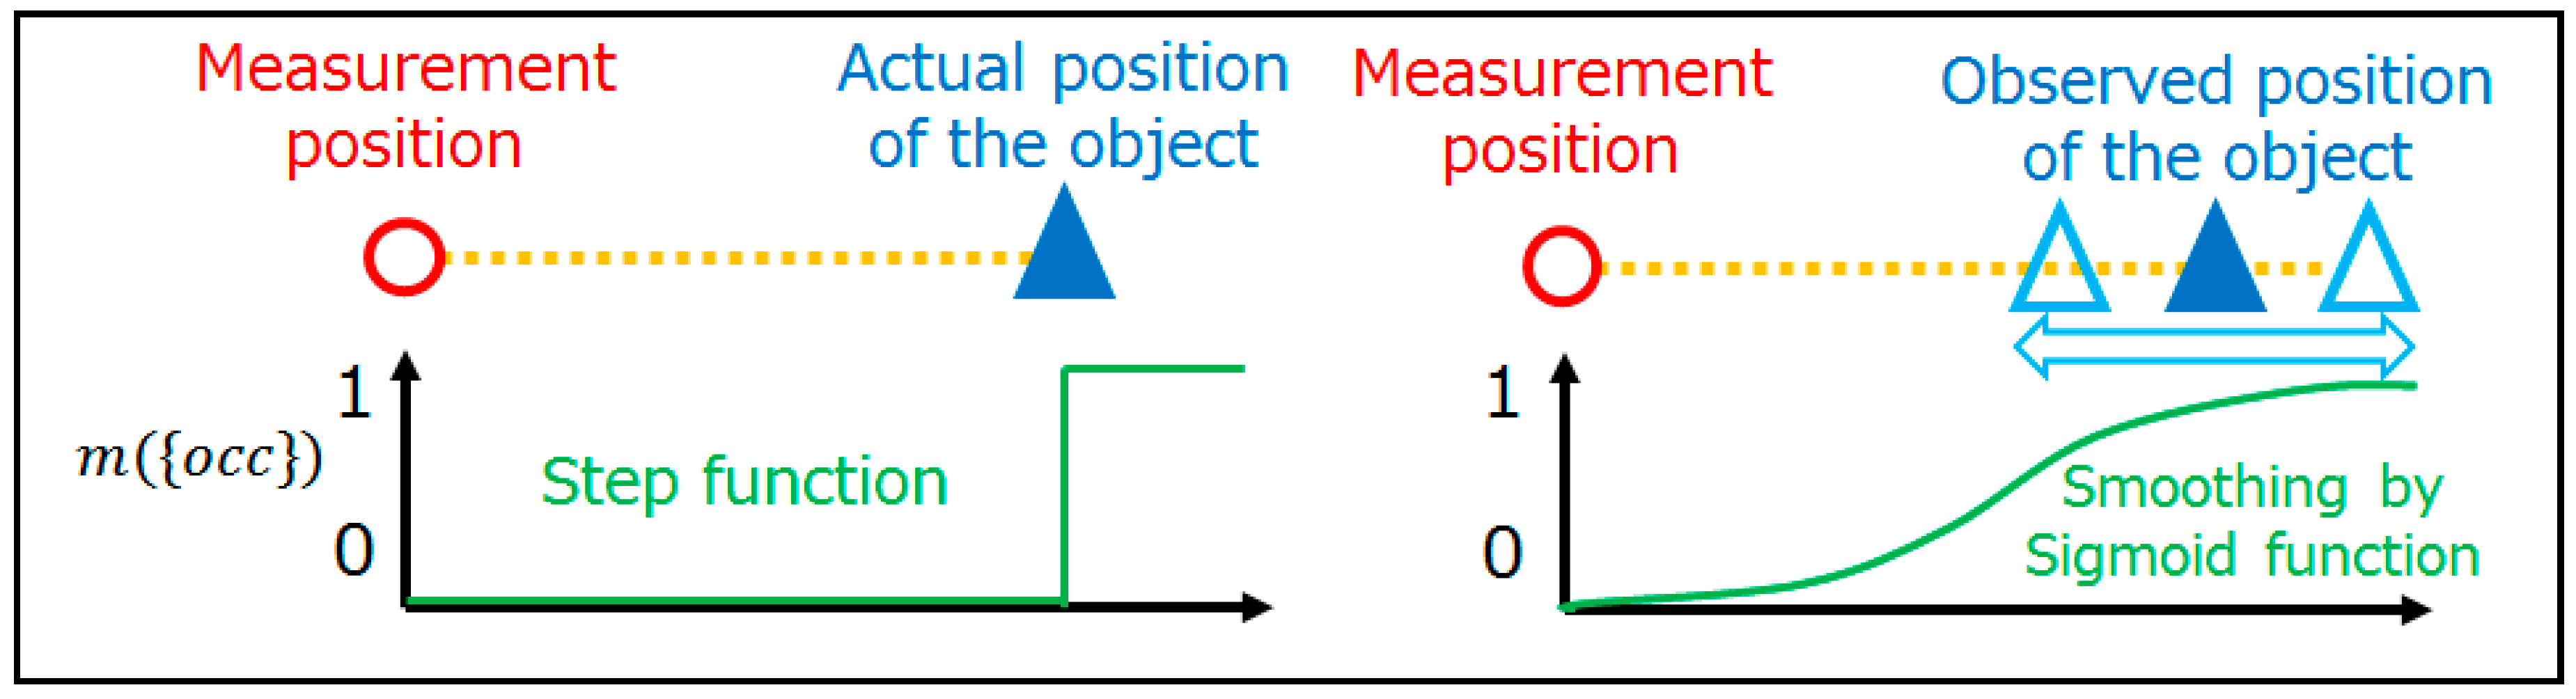
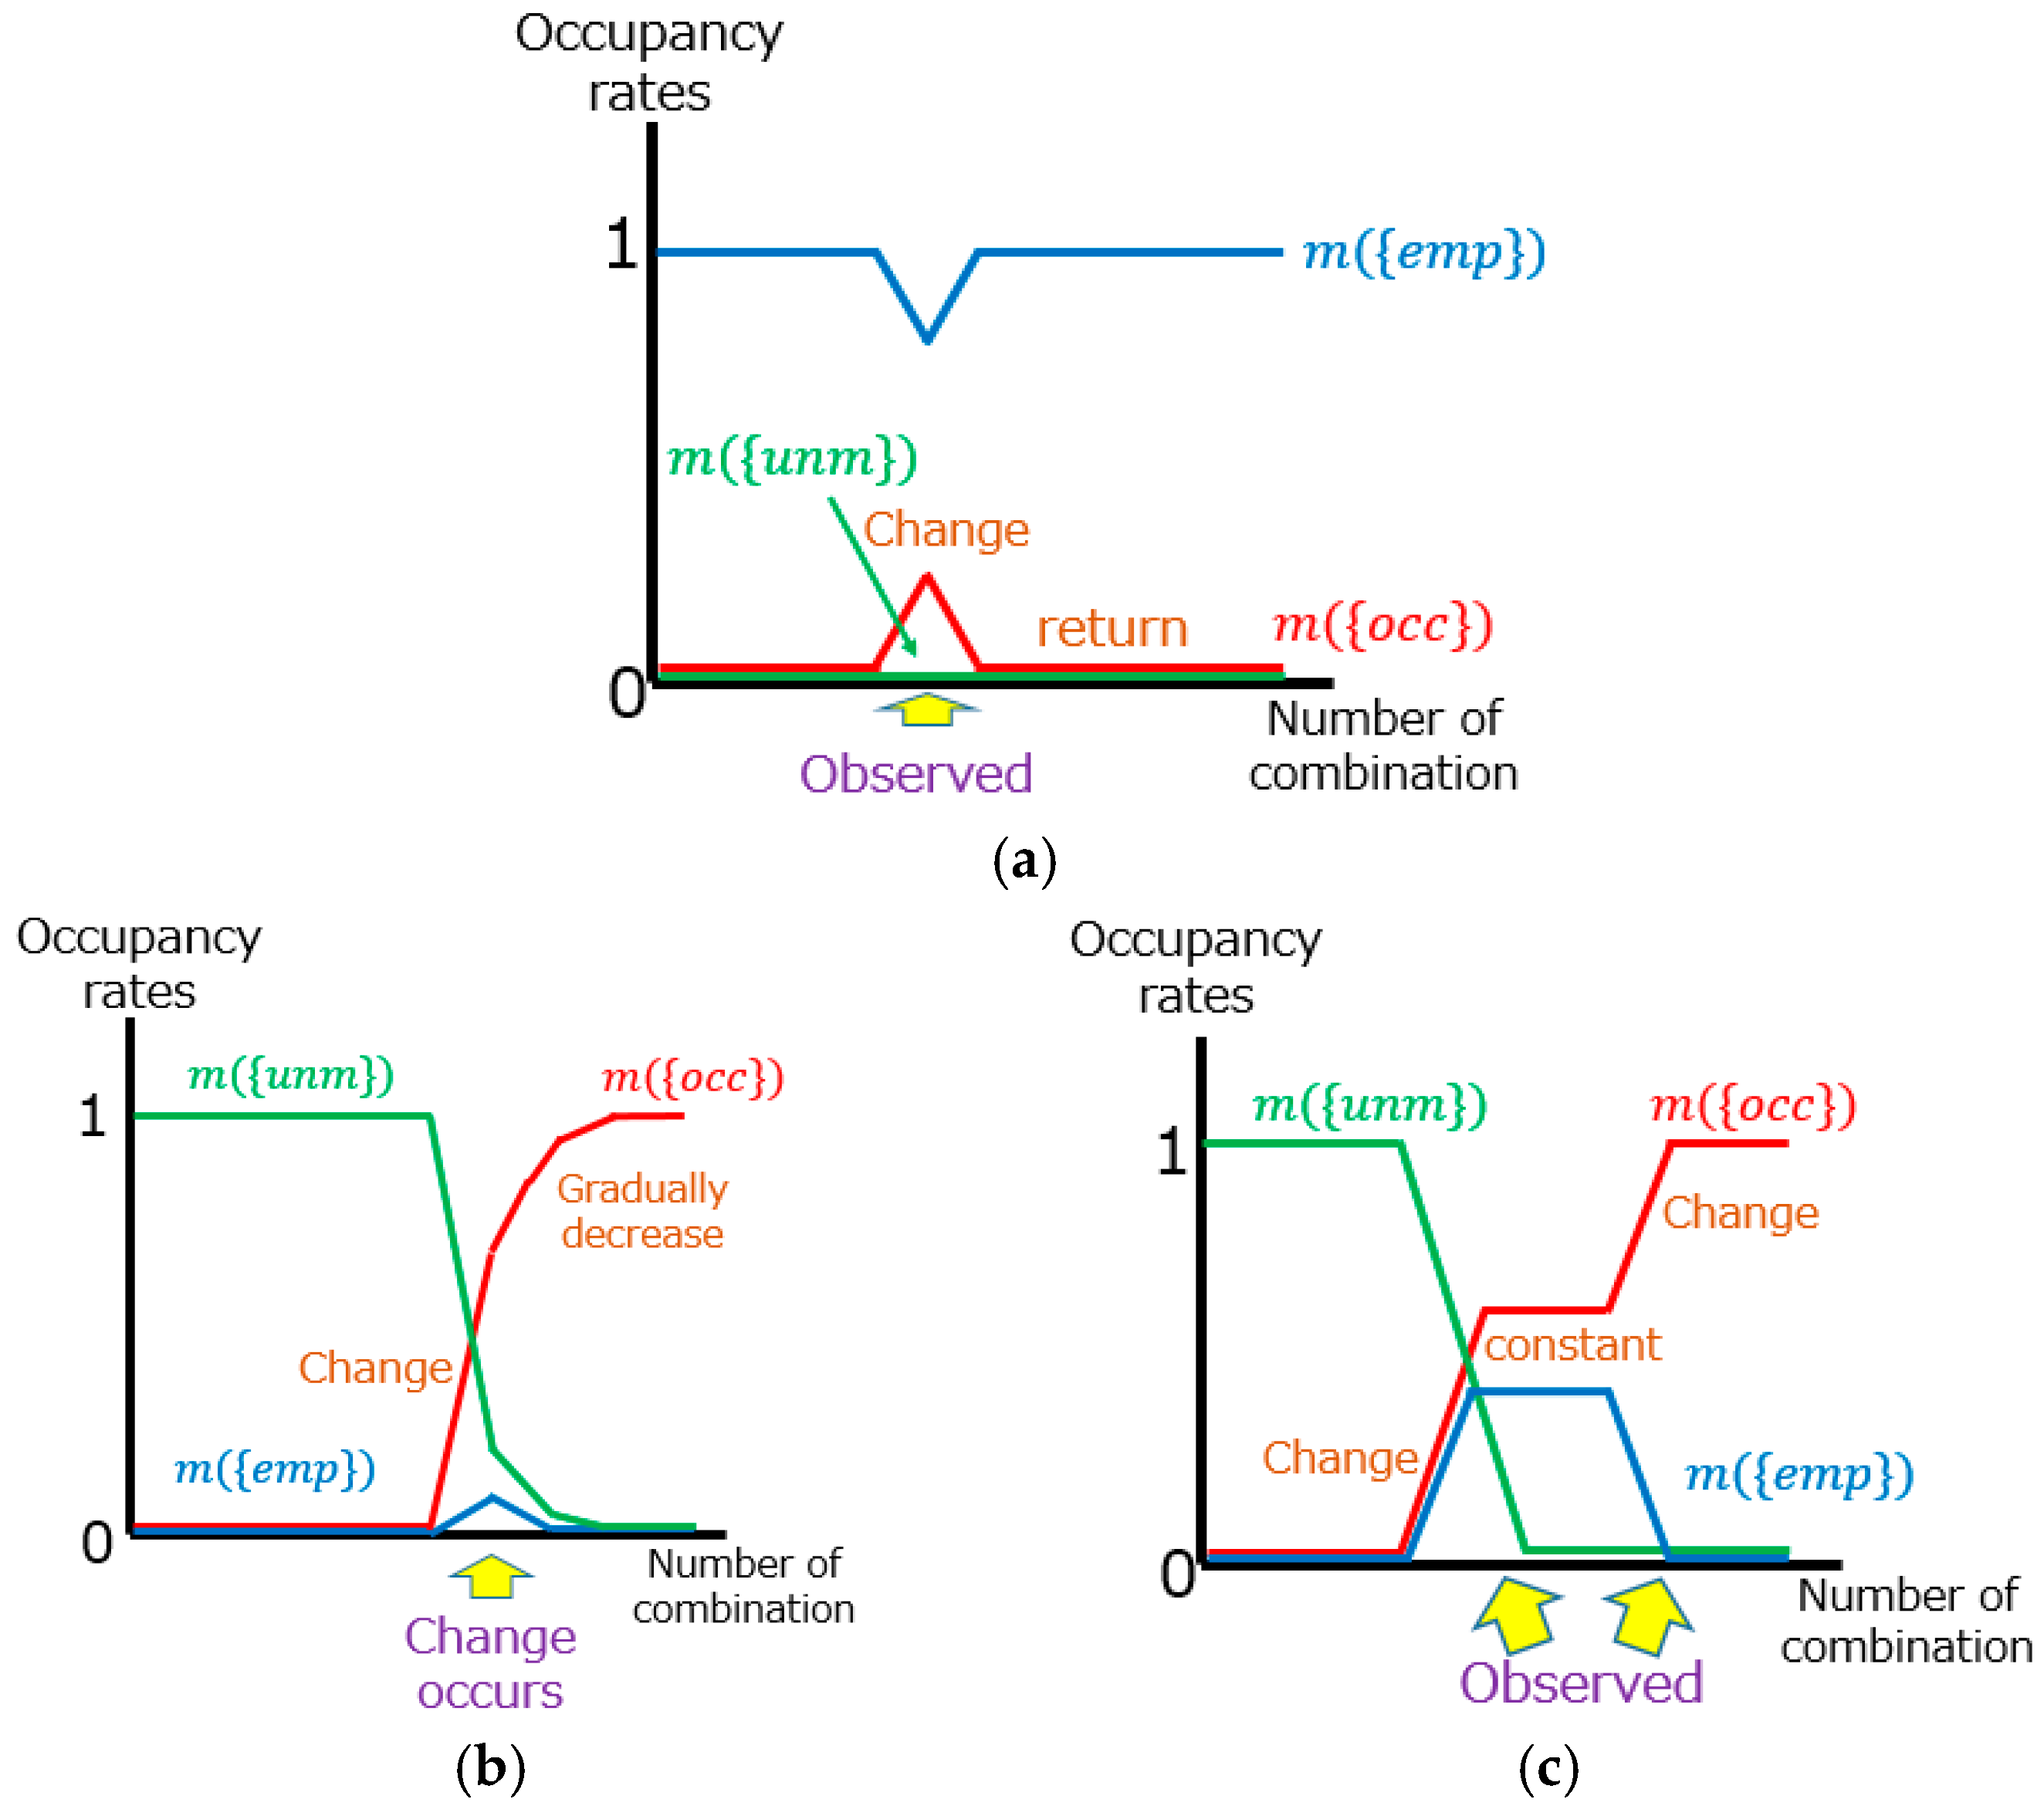
2] for change detection, because this method is robust to varying densities in the point cloud. In addition, we use Dempster–Shafer theory [
3,
4] to discriminate between occlusions and real changes in the occupancy grid method. Finally, only real changes are detected based on occupancy rate transitions.
1.2. Related Work
This section largely describes related work in two areas, registration and change detection. Many of the prior studies in these areas have been independently developed. Registration is the process of superimposing acquired data on the model data by applying rotation and translation transformations. Generally, the process of registration is divided into course registration and fine registration. Course registration provides initial values for the process of fine registration. Before course registration, the detection and description of feature points are carried out. Thus, the first half of this section describes previous research on the detection and description of feature points, course and fine registration. Following that, change detection methods are introduced for both image and point cloud-based data.
Detection of feature points is generally done as a preparation for registration. Feature points are defined as points expressing geometrical features of objects such as edges and peaks. There are a variety of ways of extracting feature points. Some methods have developed as applications of methods in image processing. For example, 3DSIFT [
5] is an application of SIFT (Scale Invariant Feature Transform) [
6] for point cloud data. Similarly, 3DHarris [
7] is also an application of an image processing method. Guo et al. [
8] provide a review of research that compares these detection methods.
After feature points in multiple point cloud data are detected, they are associated, and their description is carried out. Association methods are mainly divided into two categories. Methods of the first category describe the relationship between a point of interest and its neighbors, and those of the second category focus on relationships between pairs of interesting points [
9]. In the first category, the Spin Image method and its derivations are widely used [
10]. Some methods use normal vectors as descriptors of feature points, such as Point Feature Histogram (PFH) [
11], Fast Point Feature Histogram (FPFH) [
12], derivations of PFH on calculating cost, and Signature of Histogram of OrienTations (SHOT) [
13]. In the second category, the Point Pair Feature (PPF) method picks a pair of points, and uses the distance and the angle of the normal vector as feature values [
14]. The first category is known to be robust against noise, and the second is robust against occlusion. In addition to these, methods that use not only geometrical features but also color information have been developed, such as Color-SHOT [
15] and PFHRGB [
16]. Prior research has shown that using feature points reduces calculation costs, but does not always improve registration results [
17]. Moreover, it is reported that the performance of descriptors depends on the shape of the objects [
18].
Course registration methods can be classified into two types [
19]. Methods of the first type associate points based on feature values calculated at several points. In this category, the methods that extract features such as spin image or principal component analysis are used to detect overlapping parts between data of interest. Methods of the second type work with matching points. The greedy initial alignment method and the SAmple Consensus Initial Alignment (SAC-IA) method are used together with PFH and FPFH, respectively. Course registration provides initial values for fine registration. There has been much research on fine registration, but the Iterative Closest Point (ICP) algorithm is the most classic and well-known example [
20]. At about the same period when the ICP algorithm was developed, similar research using depth images was done [
21]. There are several research publications on the selection of point pairs in the ICP algorithm. In a previous study [
22], random sampling points are set as feature points, and similarly, in another method, the feature points are randomly selected in each registration [
23]. For these methods, the normal space sampling method is introduced to make them more efficient and robust to noise [
24].
Other than a few exceptions [
25], most of the change detection methods only use image or point cloud data. In this study, we only work with point cloud data. To detect changes between two point clouds, a basic method is to look for differences based on the distance between points. If the distances between pairs of points are larger than a threshold, then this area is considered to have changed. However, this approach is not robust against noise or differences in point density. The Hausdorff distance is known to be robust against data damages [
26].
The distance-based approach also has the disadvantage that it does not distinguish between occlusions and real changes because the distance between corresponding points tends to be larger in that area. Thus, some research has tried to distinguish real change from occlusion. Some research has used the occupancy method with Dempster–Shafer theory to deal with this problem, and have applied point cloud data from ALS (Airborne Laser Scanning) in two periods [
27,
28], and data from MMS [
29,
30]. The occupancy grid method was developed in robotics to build an environment map for an autonomous moving robot. The updating of the map is based on Bayes’ theory in many cases [
31]. On the other hand, the introduction of Dempster–Shafer theory allows us to consider occlusion explicitly. However, because frameworks using Bayes’ theory require lower calculation costs than those using Dempster–Shafer theory, the latter approach has not been used much, while its advantages have nevertheless been confirmed [
32,
33].
While previous studies using the occupancy grid method with Dempster–Shafer theory have had the advantage of being able to distinguish real changes from occlusions, another problem remains. They have been able to successfully reject occlusions, but the results contain tentative changes of oncoming vehicles and pedestrians. Due to this, they cannot be directly applied for updating the map. Methods for the detection of moving objects have been separately developed, mainly in the image processing fields [
34]. Recently, integrated methods for both images and point clouds have appeared [
35,
36], but the detection of changes and moving objects are yet to be integrated.
Based on the above summary of related work, the challenges are summarized as follows:
Distinguishing real changes from occlusions and tentative changes,
Detecting changes in point cloud data with varying accuracies and point densities,
Integrating registration and the above change detection, and visualizing the result.


