Abstract
Influential nodes are rare in social networks, but their influence can quickly spread to most nodes in the network. Identifying influential nodes allows us to better control epidemic outbreaks, accelerate information propagation, conduct successful e-commerce advertisements, and so on. Classic methods for ranking influential nodes have limitations because they ignore the impact of the topology of neighbor nodes on a node. To solve this problem, we propose a novel measure based on local centrality with a coefficient. The proposed algorithm considers both the topological connections among neighbors and the number of neighbor nodes. First, we compute the number of neighbor nodes to identify nodes in cluster centers and those that exhibit the “bridge” property. Then, we construct a decreasing function for the local clustering coefficient of nodes, called the coefficient of local centrality, which ranks nodes that have the same number of four-layer neighbors. We perform experiments to measure node influence on both real and computer-generated networks using six measures: Degree Centrality, Betweenness Centrality, Closeness Centrality, K-Shell, Semi-local Centrality and our measure. The results show that the rankings obtained by the proposed measure are most similar to those of the benchmark Susceptible-Infected-Recovered model, thus verifying that our measure more accurately reflects the influence of nodes than do the other measures. Further, among the six tested measures, our method distinguishes node influence most effectively.
1. Introduction
Social networks have created a new distributed information propagation architecture that greatly improves peoples’ ability to spread and obtain information [1]. In the social network propagation architecture, the spread of information is often affected by the influence of certain nodes. Research results show that these highly influential nodes are rare in social networks, but their influence can quickly spread to most nodes in the network. These vital nodes greatly influence the structure and function of networks. Identifying these influential nodes helps to better our understand complex networks; moreover, such identification can help in accurately predicting and controlling network evolution.
In recent years, various centrality measures to identify vital nodes have been proposed such as Degree Centrality (DC) [2], Betweenness Centrality (BC) [3], Closeness Centrality (CC) [4], K-Shell (KS) [5], and so on. Based on these basic measures, researchers have proposed many other influence-mining algorithms [5,6,7,8,9,10,11,12,13,14]. Degree centrality is a simple metric and has low computational complexity; however, its result is not sufficiently accurate because it considers only the local node information. Chen et al. [6] proposed a semi-local centrality (LC) measure that considers both the nearest and the next-nearest neighbors of a node. LC improves accuracy at the cost of low computational complexity. BC and CC compute the influence of nodes based on global structure, and they achieve higher accuracies; however, they are incapable of being applied in large-scale networks because they need to calculate the shortest paths between all pairs of nodes in the network, which is very time-consuming [3,4,8]. Kitsak et al. [5] noted that the most influential spreaders do not correspond to the nodes with the largest degree, but to those located at the core of the network, as identified by the K-Shell decomposition. However, the K-Shell method can divide nodes’ influences into only a few levels: its analysis is coarse, and therefore, it is usually employed only to identify the most influential nodes in the network. Liu et al. [9] discovered that not all real networks follow the rules that nodes in high shells are very influential. In some networks, nodes in high shells, even those in the innermost core, are not good spreaders: Lie et al. termed these a core-like group. Based on the above results, they proposed a more accurate K-Shell measure that identifies influential nodes by removing the edges between core-like nodes [10]; However, this method still does not consider the impact of topological connections among neighbor nodes.
Studies show that the diversity of topological connections among the neighbors has a significant effect on a node’s influence. Nodes with the same degree can have influences that are inversely proportional to the number of connected components of their neighbors [11,12,13,14,15]. In addition, the explosive growth of social networks adds importance to the efficiency of the influence measures. Therefore, in large-scale social networks, to identify vital nodes efficiently and accurately, it is necessary to consider both a node’s centrality and the topological connections among its neighbors. The local clustering coefficient is an important metric that reflects the density of interactions among neighbors [8,16]. Therefore, we propose a novel measure based on local centrality with a coefficient (CLC), in which the local clustering coefficient of a node is used to measure its influence in addition to its semi-local centrality. We performed experiments to measure node influence by using DC, BC, CC, KS, LC and CLC. The results show that the precision of CLC is the same as or better than the other five centrality metrics, yet involves little increase in time cost.
The rest of this paper is organized as follows. Section 2 introduces the novel proposed measure, CLC. In Section 3, we introduce eight datasets and the evaluation methodologies used to study which measures are most accurate. We also analyze the experimental results in this section. Section 4 concludes the paper and lists possible future work.
2. Local Centrality with a Coefficient to Measure Node Influence
We focus on unweighted, undirected, and simple networks in this paper. Let be a graph with vertices and edges. The influence of node is denoted by :
where is the semi-local centrality measure, is the local clustering coefficient of node v, and accounts for the effect of v’s clustering coefficient:
where is the set of the nearest neighbors of node v, and is the number of the nearest and next-nearest neighbors of node w. Usually, the local clustering coefficient () plays a negative role during spreading [13,14,15]; thus, denotes a decreasing function of :
We first demonstrate the efficiency of our method by investigating its computational complexity. Calculating requires traversing node w’s neighborhood within two steps, which costs , where is the average degree of the network. The computational complexity for calculating the local clustering coefficient of each node O(n). Therefore, the total computational complexity for our centrality measure is which is the same as the LC measure and has a much lower computational complexity than the BC or CC measure. Further, in Table 1, we show the CPU (Central Processing Unit, Core i5-6300 2.4 GHz) time for the six centrality measures on the five real networks described in Section 3.1: Email, Twitter, Facebook, Epinions and Blog. We can see that our measure requires slightly more time than LC but far less time than BC, CC and KS, especially on large-scale networks. Compared with LC, the execution time of CLC increases less than 0.5 s and its growth rate is less than 2% on all five real networks.

Table 1.
The CPU time (in seconds) of six measures on five real networks. 1
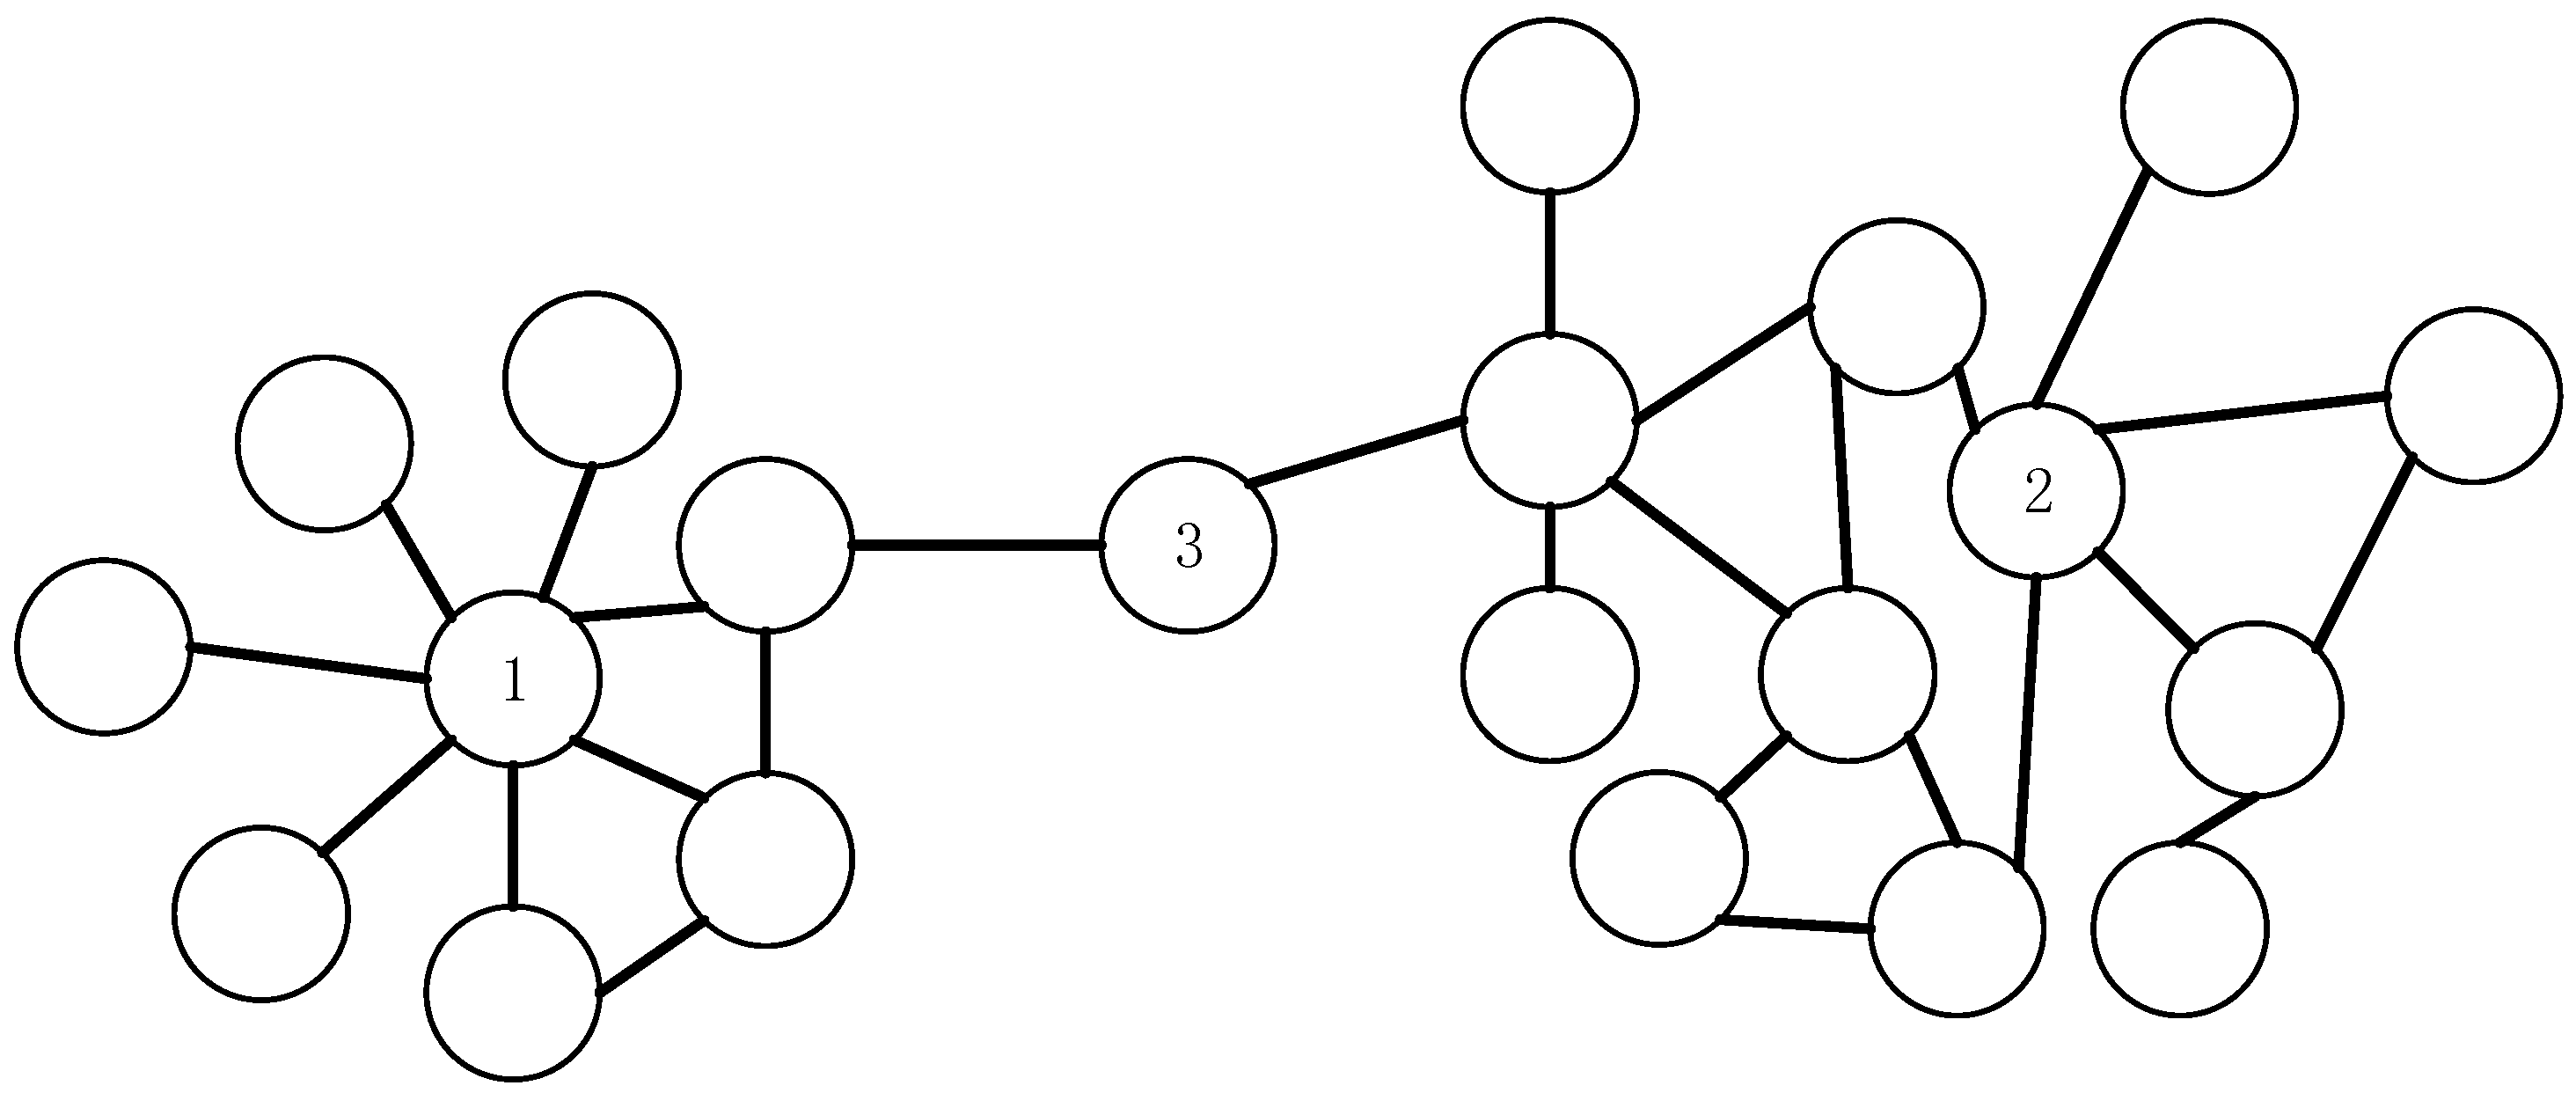
The CLC measure considers both the topological connections among neighbor nodes and the number of neighbor nodes. The vital nodes in networks are usually those that are located in the core of a node cluster or that function as a bridge between node clusters. To ensure low computational complexity, the local area of a node includes only its four-layer neighbors. For each node in the network, the greater the number of nodes in its local area, the more vital that node is. In this way, we can identify the nodes that are located in the core of node clusters and those low-degree nodes that function as a bridge between node clusters. As shown in Figure 1, node 2 is located at the core of a node cluster, and node 3 is a bridge node. Although the degrees of nodes 2 and 3 are smaller than the degree of node 1, the former have many four-layer neighbors. Therefore, we also consider them to be of high influence. To rank the nodes with the same number of four-layer neighbors, we compute the local node clustering coefficient and construct a decreasing function of it. The larger the local clustering coefficient of a node is, the more tightly its neighbor nodes are connected to each other rather than with other nodes, which confines the information spreading initiated from the node in a local region and weakens the influence of nodes. In summary, the method we propose can rank node influence more accurately than previous measures because it measures node influence by applying the product of the decreasing function of the local clustering coefficient and the number of four-layer neighbors.

Figure 1.
Example of network local structure.
3. Experimental Results
3.1. The Datasets Used in the Experiments
To evaluate the effectiveness and the efficiency of our proposed centrality measure, we apply it to both real and artificial networks. The real networks include Email [17], Twitter [18], Facebook [19], Epinions [20] and Blog [21], all of which are treated as undirected. The artificial networks include networks generated by the Erdos-Renyi (ER) random network model [8], the Watts-Strogatz (WS) network model [8] and the Barabási-Albert (BA) scale-free network model [8], and are all undirected and unweighted. The basic topological features of the eight networks are summarized in Table 2. n and m are the total numbers of nodes and links, respectively, and denote the average and the maximum degree, respectively, C is the clustering coefficient, and is the epidemic threshold. In homogenous networks such as ER and WS, , while in heterogeneous networks, [8,22].
Table 2.
The basic topological features of the eight tested networks.
3.2. Evaluation Methodologies
We obtained the ranked lists by applying the six measures on each network. In principle, the ranked list generated by an effective ranking method should be as consistent as possible with the ranked list generated by the real spreading process. To simulate a realistic spreading process and obtain the true spreading influence of nodes, we adopted the susceptible-infected-recovered (SIR) model [23]. The SIR model, which is usually considered as the benchmark for measuring the accuracy of other influence metrics, can effectively simulate an epidemic and the spread of information.
In the SIR model, a node has three states: (1) susceptible—a node is in the susceptible state before it is infected by its neighbors; (2) infected a node that was just infected is in this state and can infect its neighbors with a probability; and (3) refractory—a node that was in recovery and immune to the disease is in this state.
In the SIR model, all the nodes are initially in the susceptible state except for one node, v, which is in the infected state. At each time step, infected nodes infect their susceptible neighbors with probability β and enter the recovered state with a probability of 1, after which they become immunized and cannot be infected again. The spreading process ends when no infected node exists in the network. The spreading ability of the original node v, , is defined as the number of nodes that were infected by the end of the spreading process that originated from node v. When β is assigned a large value, the spreading process finishes too quickly to distinguish the node influence. Therefore, we assigned a small value to β, which was approximately the epidemic threshold . We set the number of simulations to be 5000. The spreading influence of a node is defined as the average spreading ability of node v over the entire range of β, . The value of β used for each network is listed in Table 3.
Table 3.
The propagation probability values of eight networks.
We can obtain a ranked list of nodes by a certain measure. To evaluate the correctness of that measure, we compared the list to the ranked list generated by . The higher the correlation between them is, the more accurate the metric is. We adopt Kendall’s tau () as a rank correlation coefficient [24]. Kendall’s tau () is defined as follows:
where and are two ranked lists that contain N elements, respectively. Any pair of ranks and are said to be concordant if the ranks for both elements agree: that is, if both and or if and ; otherwise, if and or if and , they are said to be discordant. If or , the pair is neither concordant nor discordant. and denote the amount of concordant and discordant pairs, respectively, and . A higher value indicates that the ranked list generated by the measure is more accurate, and = 1 indicates that the ranked list generated by the measure is exactly the same as the ranked list generated by the real spreading process.
3.3. Experimental Results and Analysis
3.3.1. Rank Influence of Nodes
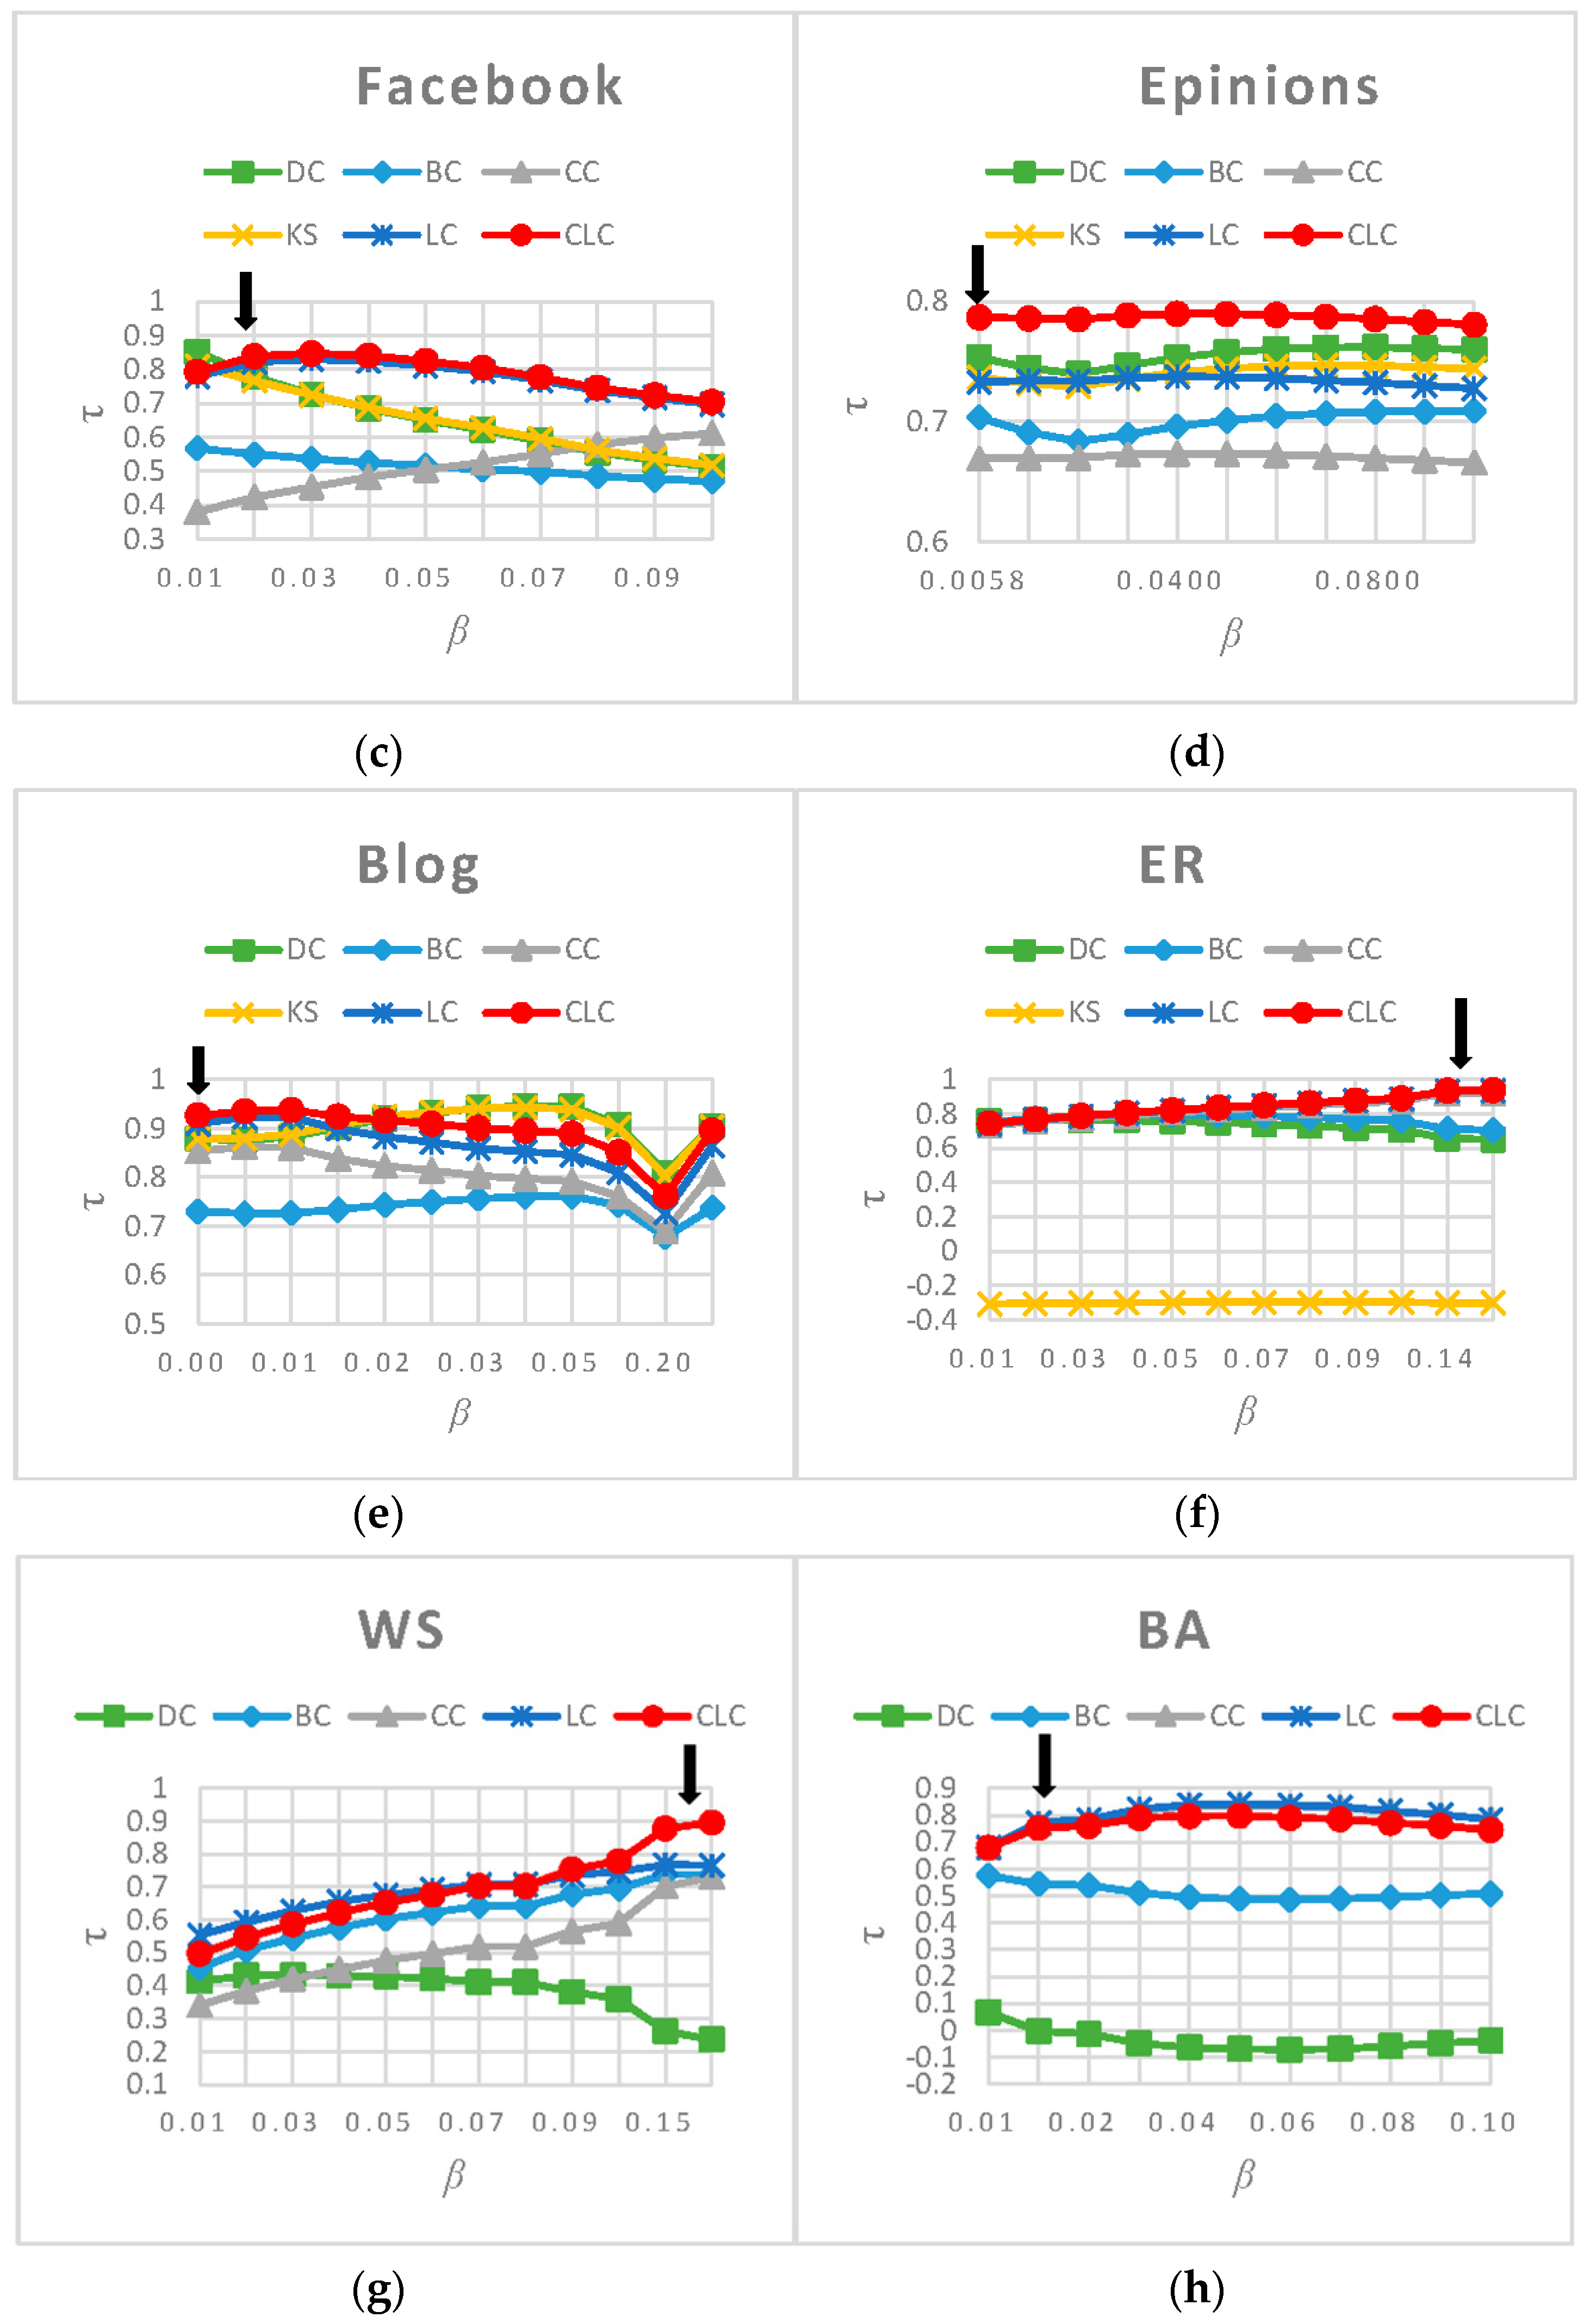
We evaluated the effectiveness and the efficiency of the CLC measure individually on each of the eight networks proposed in Section 3.1. For the first six networks, we measured the nodes’ influence using DC, BC, CC, KS, LC and CLC, respectively. Because KS does not apply to BA and WS networks, we tested and showed the performance of only the other five measures on those two networks. We computed the values for the six measures under different propagation probabilities . The results in Figure 2 show that our CLC metric achieves a better performance across a wide range of propagation probability values () for all eight networks, which indicates the robustness of the proposed measure. In particular, when is near the epidemic threshold , the value of the CLC metric is the largest in all the networks except for the Email network.
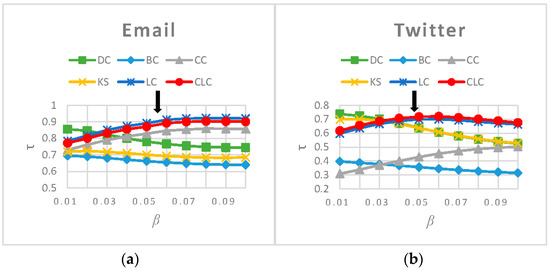
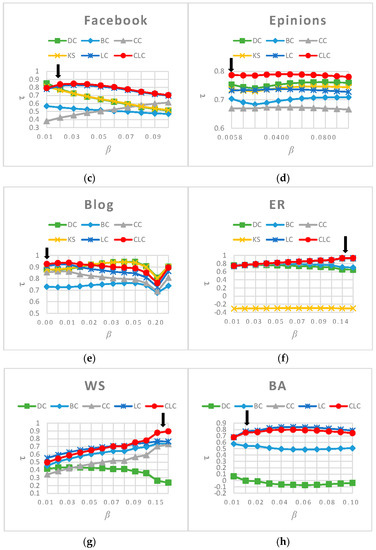
Figure 2.
The values resulting from comparing the ranked list generated by six measures and the ranked list generated by the SIR model on eight networks. The arrows indicate the epidemic threshol, (a) Email; (b) Twitter; (c) Facebook; (d) Epinions; (e) Blog; (f) ER; (g) WS; (h) BA.
The value for CLC is smaller than that of LC on the Email network because the community structure in the Email network is strongly self-similar; consequently, the topologies of the neighbor nodes are similar to each other [25], which reduces the discrimination ability of the CLC metric. In the BA network, the value for CLC is same as that of LC when is small and equal to . As the value increases, the CLC results in a slightly worse performance than the LC. We argue that this occurs because the local clustering coefficient of the BA network we constructed for this paper is 0.011214; in other words, it has no obvious clustering characteristics. Therefore, for most nodes, the slope of the function is larger and more sensitive to the clustering coefficient. Under the above condition, this means that nodes of the same degree whose neighborhood structures are similar will have different influences when calculated by CLC. Therefore, we can conclude that the accuracy of the CLC metric is slightly below that of LC in the BA network. In the Blog network, CLC is more efficient than LC across the entire range of , and it achieves the best performance when is close to the epidemic threshold . However, when is less than 0.015, both CLC and LC perform worse than DC and KS. This result occurs because the Blog network is heterogeneous, which means that large-degree nodes are apt to link to small-degree nodes and, therefore, the method that measures node influence by using the number of its neighbors is better than the one that measures influence through the four-layer neighbors. In the other five networks, CLC achieves the best performance. To reflect the overall spreading ability of all nodes, we calculate (the average value of across the entire range of ). The values resulting from analyzing the eight networks using the six measures are listed in Table 4. The CLC measure ranks second for Email ( is smaller than ), third for BA ( is smaller than and ), and third for Blog ( is smaller than and ), but in the other five networks, the CLC metric ranks first. Additionally, we can observe that none of the methods achieve optimal results on all the networks. Among the eight networks, CLC achieves the top ranking for six measures, and its average ranking is 1.625, which is better than the other five measures, and its performance is the most stable.
Table 4.
The values and ranks for six measures on eight networks.
3.3.2. Rank the Most Influential Nodes
In many practical applications, people are interested only in the most influential nodes in the network. The most influential nodes are those with the strongest average spreading ability , which is estimated by averaging a node’s spreading ability over the entire range of using the SIR model simulation. In this section, we investigate another measurement, , which considers only the Top-L most influential nodes, where L ranges from 20 to 500. The calculation of is exactly the same as the calculation of . The results from the five real networks analyzed by the six measures in Figure 3 show that CLC achieves the best value on almost the entire range of L in the Email, Twitter and Blog networks, and it is obviously better than LC. In the Facebook and Epinions networks, CLC performs slightly better than LC and achieves the best score. To reflect the accuracy of the rankings of the Top-L nodes for the six measures, we calculated (the average value of across the entire range of L). The values resulting from the analysis of the five real networks by the six measures are listed in Table 5, which shows that the achieved by CLC is larger than that achieved by the other five centrality measures on all five real networks. Compared with LC, the value of CLC increases by 9.50% on average. Generally, the CLC metric is better at ranking the most influential nodes in the networks than the other five metrics.
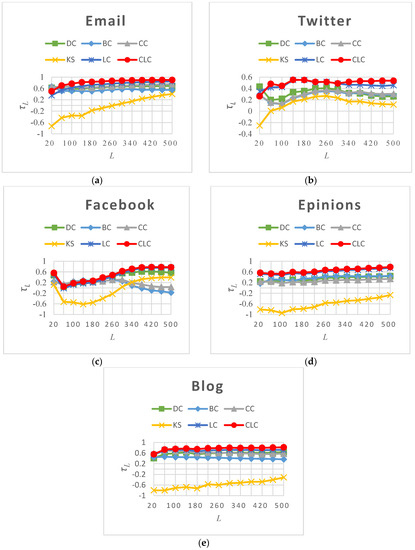
Figure 3.
The values for six measures on five real networks as L varies from 20 to 500. (a) Email; (b) Twitter; (c) Facebook; (d) Epinions; (e) Blog.
Table 5.
The values and ranks for six measures on five real networks.
3.3.3. Capability of Distinguishing Nodes’ Spreading Ability
To evaluate the performance of a node’s influence measure, we should consider not only its sorting accuracy and the ability to recognize influential nodes, but also its capability to distinguish the spreading ability of nodes. For example, K-Shell can effectively identify the most influential nodes in a network; however, because of its coarse-grained measure, it considers nodes with the same K-Shell value as having the same influence. Consequently, the values obtained by KS are smaller, as shown in Figure 3. To further measure the effectiveness of metrics, we defined the discriminability metric, D, to measure how well the node influence measures can distinguish a node’s spreading ability [26]:
where is the number of distinct elements in a list that contain the value for all nodes in the network obtained by a given measure, and N is the number of nodes in the network. The maximum value, , indicates that all the nodes in the network are assigned distinct values and can be identically distinguished, while the minimum value, , indicates that all the nodes are assigned the same value. Obviously, a larger D indicates a finer ranking of the nodes. The results of D for the five real networks are shown in Table 6. The CLC measure achieves the largest D values for all five networks. Hence, we can conclude that our method is fine-grained and more effectively distinguishes node influence than do the other five measures.
Table 6.
D values for six measures on five real networks.
4. Conclusions
In this paper, we propose a novel measure based on local centrality with a coefficient (CLC) to evaluate influential spreaders in social networks. Based on a semi-local central measure (LC), our method combines the topological connections among neighbors and the number of neighbor nodes. Moreover, it utilizes the local clustering coefficient of nodes to distinguish the influence of nodes with the same number of four-layer neighbors, which overcomes a limitation of other centrality measures, which ignore the impact of neighbors’ topology on a node. Compared with the LC metric, CLC adds only the calculation of the nodes’ local clustering coefficient; therefore, the computation time increases only slightly, neatly balancing computational complexity and precision. We applied our method to both artificial and real networks and adopted three metrics to verify its effectiveness. The experimental results show that the CLC measure is better than the other five methods tested, and it achieves the best results for ranking the influence of nodes, identifying the key spreaders and discriminating the influence of nodes. Furthermore, the method presented in this paper can easily be extended to directed networks. Because the scale of social networks continues to grow, designing efficient and effective methods to rank the spreading ability of nodes in complex networks will be a long-term challenge. Many real networks such as the World-Wide Web are fractal networks. Other types, such as actor collaboration and cellular networks, consist of self-repeating patterns under different-length scales [27]. The main feature of a fractal network is repulsion between hub nodes, which makes the hub nodes tend to not connect to other hub nodes [28]. In our measure, some hub nodes will have little contribution to the influence of their hub neighborhoods due to their large distance in fractal networks and the similarity between modules will reduce the accuracy of our measure. Therefore, how well our measure will perform on real-world fractal networks may be related to their fractal dimensions and the distance between self-similar modules and is an aspect that still needs further research. In addition, further investigation could analyze the trust relationships between nodes to determine their effects on node spreading ability.
Acknowledgments
This work was supported by the following grants: National Natural Science Foundation of China (No. 61572301), Natural Science Foundation of Shandong Province (No. ZR2013AQ008, No. ZR2013FM008, and No. ZR2016FP07), Shandong Provincial Key Laboratory of Software Engineering (No. 2013SE02), the Open Research Fund from Shandong provincial Key Laboratory of Computer Network (No. SDKLCN-2016-01) and a Project of Shandong Province Higher Educational Science and Technology Program (No. J15 LN24).
Author Contributions
Xiaohui Zhao conceived and designed the experiments; Xiaohui Zhao and Jinlong Wang performed the experiments; Xiaohui Zhao, Fang’ai Liu and Tianlai Li analyzed the data; and Xiaohui Zhao wrote the paper.
Conflicts of Interest
The authors declare no conflict of interest. The founding sponsors had no role in the design of the study; in the collection, analyses, or interpretation of data; in the writing of the manuscript, or in the decision to publish the results.
References
- Mislove, A.E. Online Social Networks: Measurement, Analysis, and Applications to Distributed Information Systems. Ph.D. Thesis, Rice University, Houston, TX, USA, 2009. [Google Scholar]
- Albert, R.; Jeong, H.; Barabasi, A.L. Error and attack tolerance of complex networks. Nature 2000, 406, 542. [Google Scholar] [CrossRef] [PubMed]
- Freeman, L.C. A set of measures of centrality based on betweenness. Sociometry 1977, 40, 35–41. [Google Scholar] [CrossRef]
- Krackhardt, D. Assessing the political landscape: Structure, cognition, and power in organizations. Adm. Sci. Q. 1990, 35, 342–369. [Google Scholar] [CrossRef]
- Kitsak, M.; Gallos, L.K.; Havlin, S.; Liljeros, F.; Muchnik, L.; Eugene Stanley, H.; Makse, H.A. Identification of influential spreaders in complex networks. Nat. Phys. 2010, 6, 888–893. [Google Scholar] [CrossRef]
- Ren, X.; Lü, L.; Ren, X. Review of ranking nodes in complex networks. Chin. J. 2014, 59, 1175–1188. [Google Scholar] [CrossRef]
- Chen, D.; Lü, L.; Shang, M.S.; Zhang, Y.C.; Zhou, T. Identifying influential nodes in complex networks. Phys. A Stat. Mech. Appl. 2012, 391, 1777–1787. [Google Scholar] [CrossRef]
- Wang, X.F.; Li, X.; Chen, G.R. The importance and similarity of nodes. In Network Science: An Introduction; Liu, Y., Ed.; Higher Education Press: Beijing, China, 2012; pp. 157–185. [Google Scholar]
- Liu, Y.; Tang, M.; Zhou, T.; Do, Y. Core-like groups result in invalidation of identifying super-spreader by k-shell decomposition. Sci. Rep. 2015, 5, 9602–9609. [Google Scholar] [CrossRef] [PubMed]
- Liu, Y.; Tang, M.; Zhou, T.; Do, Y. Improving the accuracy of the k-shell method by removing redundant links: From a perspective of spreading dynamics. Sci. Rep. 2015, 5, 13172–13182. [Google Scholar] [CrossRef] [PubMed]
- Ugander, J.; Backstrom, L.; Marlow, C.; Kleinberg, J. Structural diversity in social contagion. Proc. Natl. Acad. Sci. USA 2012, 109, 5962–5966. [Google Scholar] [CrossRef] [PubMed]
- Su, X.P.; Song, Y.R. Leveraging neighborhood “structural holes” to identifying key spreaders in social networks. Acta Phys. Sin. Chin. Ed. 2015, 64, 20101. [Google Scholar]
- Eguíluz, V.M.; Klemm, K. Epidemic threshold in structured scale-free networks. Phys. Rev. Lett. 2002, 89, 108701–108704. [Google Scholar] [CrossRef] [PubMed]
- Petermann, T.; de Los Rios, P. Role of clustering and gridlike ordering in epidemic spreading. Phys. Rev. E Stat. Nonlinear Soft Matter Phys. 2004, 69, 279–307. [Google Scholar] [CrossRef] [PubMed]
- Zhou, T.; Yan, G.; Wang, B.H. Maximal planar networks with large clustering coefficient and power-law degree distribution. Phys. Rev. E Stat. Nonlinear Soft Matter Phys. 2005, 71, 046141. [Google Scholar] [CrossRef] [PubMed]
- Watts, D.J.; Strogatz, S.H. Collective dynamics of small-world networks. Nature 1998, 393, 440–442. [Google Scholar] [CrossRef] [PubMed]
- Guimera, R.; Danon, L.; Diaz-Guilera, A.; Giralt, F.; Arenas, A. Self-similar community structure in a network of human interactions. Phys. Rev. E 2003, 68, 065103. [Google Scholar] [CrossRef] [PubMed]
- Mcauley, J.J.; Leskovec, J. Learning to discover social circles in ego networks. Adv. Neural Inf. Process. Syst. 2012, 25, 539–547. [Google Scholar]
- Traud, A.L.; Mucha, P.J.; Porter, M.A. Social structure of Facebook networks. Phys. A Stat. Mech. Appl. 2011, 391, 4165–4180. [Google Scholar] [CrossRef]
- Richardson, M.; Agrawal, R.; Domingos, P. Trust Management for the Semantic Web. Lect. Notes Comput. Sci. 2003, 2870, 351–368. [Google Scholar]
- Gregory, S. Finding overlapping communities using disjoint community detection algorithms. Complex Netw. 2009, 207, 47–61. [Google Scholar]
- Castellano, C.; Pastor-Satorras, R. Thresholds for epidemic spreading in networks. Phys. Rev. Lett. 2010, 105, 3305. [Google Scholar] [CrossRef] [PubMed]
- Dorogovtsev, S.N.; Goltsev, A.V.; Mendes, J.F.F. Critical phenomena in complex networks. Rev. Mod. Phys. 2007, 80, 1275–1335. [Google Scholar] [CrossRef]
- Kendall, M.G. A new measure of rank correlation. Biometrika 1938, 30, 81–93. [Google Scholar] [CrossRef]
- Liu, Y.; Tang, M.; Zhou, T.; Do, Y. Identify influential spreaders in complex networks, the role of neighborhood. Phys. A Stat. Mech. Appl. 2016, 452, 289–298. [Google Scholar] [CrossRef]
- Gao, S.; Ma, J.; Chen, Z.; Wang, G.; Xing, C.M. Ranking the spreading ability of nodes in complex networks based on local structure. Phys. A Stat. Mech. Appl. 2014, 403, 130–147. [Google Scholar] [CrossRef]
- Song, C.; Havlin, S.; Makse, H.A. Self-similarity of complex networks. Nature 2005, 433, 392–395. [Google Scholar] [CrossRef] [PubMed]
- Song, C.; Havlin, S.; Makse, H.A. Origins of fractality in the growth of complex networks. Nat. Phys. 2006, 2, 275–281. [Google Scholar] [CrossRef]


© 2017 by the authors. Licensee MDPI, Basel, Switzerland. This article is an open access article distributed under the terms and conditions of the Creative Commons Attribution (CC BY) license ( http://creativecommons.org/licenses/by/4.0/).