Abstract
Virtual geographic environments (VGEs) are extensively used to explore the relationship between humans and environments. Crowd simulation provides a method for VGEs to represent crowd behaviors that are observed in the real world. The social force model (SFM) can simulate interactions among individuals, but it has not sufficiently accounted for inter-group and intra-group behaviors which are important components of crowd dynamics. We present the social group force model (SGFM), based on an extended SFM, to simulate group behaviors in VGEs with focuses on the avoiding behaviors among different social groups and the coordinate behaviors among subgroups that belong to one social group. In our model, psychological repulsions between social groups make them avoid with the whole group and group members can stick together as much as possible; while social groups are separated into several subgroups, the rear subgroups try to catch up and keep the whole group cohesive. We compare the simulation results of the SGFM with the extended SFM and the phenomena in videos. Then we discuss the function of Virtual Reality (VR) in crowd simulation visualization. The results indicate that the SGFM can enhance social group behaviors in crowd dynamics.
1. Introduction
Virtual geographic environments (VGEs) [1,2,3,4] are commonly used to explore dynamic geographic phenomena and processes. It can be used from large scale such as a city environment to fine scale such as an indoor environment. Investigation of the interactions between humans and the environment by simulating crowd behaviors in virtual geographic environments (VGEs) is significant in building design, infrastructure planning and emergency evacuation in geographic information system (GIS) [5,6,7,8,9]. Recent progress of crowd simulation in VGEs [10,11,12,13,14] coupled with advancements in virtual reality technologies and devices have provided novel insights into GIS. The existing crowd simulation models often disregard interactions between and within pedestrian groups such as relatives, friends, and colleagues [15], although the rules of crowd dynamics, such as arching at exits [15,16], linear and V-like walking formations [15,17], and the influence of crowd density on pedestrian behaviors [18,19,20], are well known. Actually, groups occupy a high proportion in crowds in various types of locations, such as entertainment places or office areas [15,21,22,23,24,25]. Mehdi Moussaid observed that more than 70% pedestrians walk in groups along a commercial street [15]. Michael Schultz analyzed data on bridges, where participants had to use an underpass to gain access to an event, and discovered that only 14% of pedestrians are individuals [24]. These data corroborate the importance of social groups. Therefore, lots of scholars investigate social groups from different aspects. Some research people who have social relations and the same destinations [15,17,19,20,26,27,28,29,30,31,32,33,34]. Some study social interactions of pedestrians [17,27,30,35,36]. In general, we manually define pedestrians who have social relations, social interactions and the same destination belong to one social group. The social relations and social interactions among group members have great influence on crowd dynamics [10,15,37,38,39]. Many social activities and low walking velocity of crowd due to coordination among group members [40,41]. Strong aggregation and inefficient evacuation of social groups occur in emergency situations [42,43]. Therefore, realism in crowd simulation can be enhanced when aggregation and coordination are organized in social groups.
The current crowd models can be divided into macro-models and micro-models. Macro-models consider a crowd to be fluid, whereas micro-models focus on interactions among individuals [44], which can adequately reflect individual behaviors. The most popular microscopic models are the social force model (SFM) and cellular automata (CA) [45]. Among the approaches for simulating social groups’ behaviors by CA, leadership is added to investigate the behaviors of pedestrians along sidewalks, waiting and evacuations [46,47]. In addition, different social group structures are defined to study the influencing factors of evacuation efficiency [48]. Studies that employ an SFM to simulate the behaviors of social groups also add a leader-follower rule in emergency evacuations [43,49]. Decision-making mechanisms are introduced to simulate pedestrians’ responses to changing scenes [50,51,52]. Some scholars add attractions within social group members [53,54] and other interaction mechanisms [55]. In contrast to these two mainstream models, other models also incorporate reinforcement learning algorithms [56,57], space consciousness and cognitive theory [38,58] and optimal path selection strategy [59] to simulate the behaviors of social groups.
Although models based on CA are simple, easy to program, and convenient for engineering applications and have low computational complexity, they are too simple to model pedestrian behaviors and yield approximate simulation results [44]. By comparison, models based on SFM carefully consider the social interactions among pedestrians, which can model more common micro behaviors; their accuracy is relatively high by joining the autonomous learning mechanism. Regrettably, the existing group of models based on SFM cannot simulate some complicated inter- and intra-group behaviors, such as group avoidance and subgroup coordinate behaviors. Therefore, we present a social group force model (SGFM) to simulate these patterns based on an extended SFM.
This paper aims to implement group dynamics in SFM with focuses on the avoiding behaviors among different social groups and the coordinate behaviors among subgroups that belong to one social group. The remainder of this paper is organized as follows: Section 2 introduces mathematical models, including SFM, an extended social force model and SGFM presented by us. In Section 3, we introduce a case study; then we do multiple experiments to refine the SGFM; next, we compare the simulation results of the SGFM with the extended group model and the phenomena in videos; finally, we discuss the function of Virtual Reality (VR) in crowd simulation. Section 4 describes the conclusions and future work.
2. Methods
2.1. Social Force Model
The SFM was encouraged by observations of some interesting characteristics [16], which combines real physical forces and non-physical “forces” in the same equation. This model is named the social force model as the driving “force” and the social psychological “force” never physically occur. However, the model can simulate the phenomena of arching and clogging at exits. The SFM consists of three components: a self-propelling force and two repulsion forces with other pedestrians and walls, respectively. Equation [16] is expressed as follows:
2.2. An Extended Group Model Based on SFM
Mehdi Moussaid extended the SFM by increasing a force among pedestrians in the same group to simulate the organization of social groups and their impact on complex crowd dynamics [15]. The extended SFM can simulate group patterns of different densities. At a low density, group members tend to walk “side by side” to facilitate better communication; at a moderate density, people form a “V-like” or “U-like” composition to walk faster. This balance achieves between better communication and faster walking. The formula of the extended SFM [15] is expressed as
The SFM can simulate some important phenomena of escape panic, such as “clogging”, “faster is slower” and “mass behavior”. However, the SFM considers all pedestrians to be independent individuals without group behaviors. The extended SFM adds a perspective turning force and an attractive force among group members; thus, pedestrians in the same group can gather and form a spatial structure that is conducive to walking and communication.
2.3. SGFM Based on the Extended Group Model
2.3.1. Social Groups Avoidance
Avoiding is a type of psychological repulsion, which has limitations. When a pedestrian’s walking route is not blocked, even opposite groups will not cause psychological repulsion; if some groups walk in the same direction of his view and groups are faster than him, psychological repulsion does not occur; groups that are not visible will not cause psychological repulsion.
We introduce the group avoidance into the extended social force model [15] as an important component.
The psychological repulsion of group j to individual i is similar to the psychological repulsion among individuals. Therefore, we learn from the prototype repulsion of the individuals in SFM to construct the exponential function of groups’ repulsion and distance. The radius of group j is defined as the sum of the radius of the furthest member p and the distance between p and the center of mass c, (Figure 1). Thus, , is the radius of pedestrian i; is the distance between i and j, ; is the vertical direction of the walking direction of i; and is the angle between and . Then, d = represents the distance between i and j in . A diagram of the group avoiding process is shown in Figure 1.
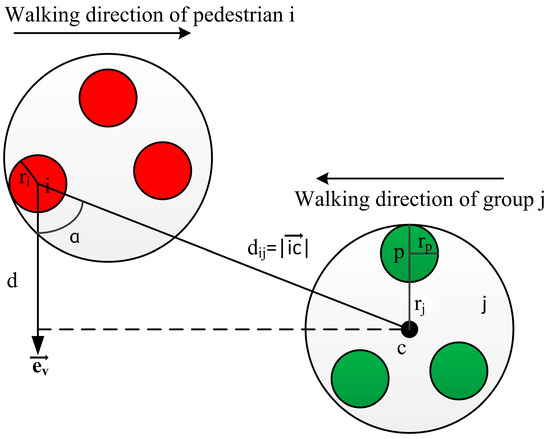
Figure 1.
Illustration of group holistic avoiding behavior. Pedestrian i and group j are walking in the opposite direction with the distance d in .
In our model, is composed of two parts. First, reflects the negative correlation between psychological repulsion and . Second, S indicates the positive correlation between the extent to which individuals’ walking routes are obscured and psychological repulsion. f is a piecewise continuous function such that S = 0 when , when , ; that is, when , i and j will not collide and a repulsive force will not be generated. When , group j blocks the walking route of pedestrian i. The smaller is d at this moment, the larger the psychological repulsion caused by j is. A and B are constant parameters.
2.3.2. Subgroups Coordination
Subgroups have following characteristics: (1) groups with more than 3 persons will break down into subgroups with 2–3 members; (2) subgroups strive to maintain the conformation of the front and back rows and maintain a symmetrical center; and (3) subgroups attempt to maintain a comfortable distance with each other, the rear subgroups take the initiative.
Figure 2 provides an example of a group with six members. We assume that this group is divided into two subgroups with three members in each group. The subgroups will form a certain spatial structure, such as “side by side” or “V-like” patterns. When these two subgroups are separated, the rear subgroup catches up and aligns with the front subgroup to maintain the space compactness of the whole group, because the front subgroup cannot immediately realize the situation and stop to wait. Therefore, we add the interaction force to this model:
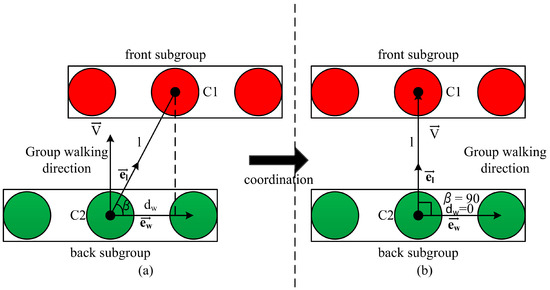
Figure 2.
Illustration of subgroup coordinate behavior. (a) The state before coordination. The rear subgroup adjusts its direction to align the front subgroup if and attempts to maintain an adequate distance. (b) The state after coordination is expressed as .
The interactions among subgroups are primarily composed of the subgroup attractive force and the force that maintains a desired distance among subgroups . promotes a center alignment between subgroups, and adjusts the distance between subgroups. By combining the effect of these two forces, the integrity of the entire group conformations can be ensured. The attraction between subgroups can be expressed as
where l is the distance between the centers of the subgroups, the walking direction of a group is the average direction of all members and is the unit vertical vector of the walking direction. is the angle between and ; thus, the distance between the masses of the subgroups in is , and M is a constant parameter. Equation (9) shows that the attraction among subgroups linearly increases with . When , ; when , is parallel to the walking direction, and .
The behavior of maintaining a desired distance can be divided into two situations. If the distance between subgroups is large, the force becomes attractive and rear subgroups will speed up to catch up with the front subgroups. However, if the distance is short, the force becomes repulsive to prevent subgroups from colliding. We propose the following expression:
indicates the unit vector of the rear subgroup center to the front subgroup center, is a constant coefficient and represents the optimal distance maintained between subgroups, and is also a constant parameter. When , , which indicates that the optimal distance between subgroups has been maintained, an adjustment is not needed and an attraction force or repulsive force does not exist at this moment. When , , the distance between subgroups is greater than K, an attractive force point exists from the rear subgroup to the front subgroup. When , , the distance is too small, and becomes a repulsive force. To ensure that abnormally fast catch-up does not occur when the distance is too large and strong exclusion when the distance is too small, we use the ln function to reflect the relationship between and .
3. Results and Discussion
First, we introduce a case study to observe social group behaviors to prepare for qualitative comparison with the simulation results of the SGFM; Then we do multiple experiments in different VGEs and discuss the selection of model parameters to refine the SGFM; Next, we compare the simulation results of the SGFM with the extended SFM and the phenomena of social groups in videos to prove the validity of the SGFM; Finally, we discuss the function of VR in crowd simulation visualization.
3.1. Case Study Backgroud
This paper chooses the road between the Institute of Remote Sensing and Digital Earth and the Aobei Tianxiang restaurant (the canteen of this office area) as the research data collection area (Figure 3). We took pedestrian activity videos with a Sony rx100 camera that had a maximum resolution of 20.9 million pixels for full HD videos (1080), which was sufficient for clearly recording the pedestrian activities. We chose 11:30–12:00 at noon and placed the camera on walking trail B, as shown in Figure 3, with the camera height above pedestrian heads. The advantages of this observation area and shooting time were twofold: (1) pedestrians primarily walked with companions, and (2) bidirectional social groups used walking trail A, which was conducive to observing group behaviors. In this article, we collected two consecutive days of crowd data between 11:30 a.m. and 12:30 p.m. in this area. The length of the roadway is about 26 m and the width is about 7 m. The length of the walking trail A is about 26 m and the width is about 2.5 m.
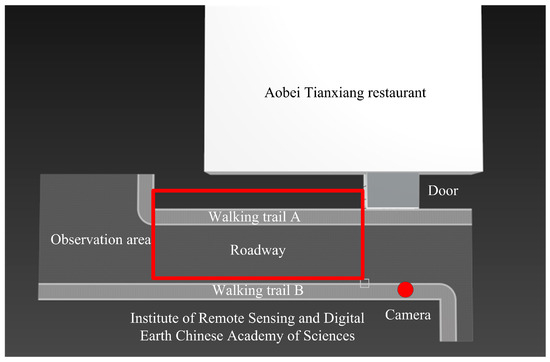
Figure 3.
Video data recording area. The red dot denotes the camera position, and the majority of the recorded crowd dynamics are represented by the red box.
We invited two volunteers to observe the videos and to identify social groups according to gestures, clothes, visual cues, etc. They could not discuss in the process of identification. A group was identified only when both volunteers affirmed. Then, we observed the spatial structures presented by groups. Groups with two members attempted to remain “side by side” perpendicular to the walking direction; a group with three members formed “side by side” and “V-like” conformations [15]; many 3-person groups exhibited a “Λ-like” shape with no other pedestrians and obstructions; most 4-person groups had a 2 + 2 structure, with the exception of “side by side” and “V-like” conformations; and 5-person groups exhibited 2 + 3 or 3 + 2 spatial structures. Large groups were divided into several subgroups with only two or three members.
In addition to group spatial structures, we focused on the avoiding methods observed among social groups and the interactions among subgroups. The avoiding behaviors among groups can be divided into two situations: catch-up avoidance and face-to-face avoidance. Catch-up avoidance occurred among social groups that had the same walking directions when the group in the rear caught up with the front group. Face-to-face avoidance occurred among groups that walk in opposite directions when one group blocked the other group’s route. This type of avoidance can also be divided into two types: (1) holistic avoidance, in which avoiding occurs with the whole group and no outside members passed through the inside of any group, (2) interspersed avoidance, in which group members were forced to separate and having outside members passed through the inside of any group. Our analysis of the video data revealed that social groups preferred holistic avoidance, and members neither passed through other groups nor allowed other pedestrians to cross within their groups.
Interactions within subgroups were also frequent and interesting. According to the data observations, groups with more than three members were divided into multiple rows of subgroups with 2 or 3 persons. The front subgroup cannot immediately know and slow down to wait until the rear subgroup was at a sufficient distance; the rear subgroup usually caught up with the front subgroup. However, when the distance between the subgroups was short, the rear subgroup would slow down to maintain a comfortable distance. The subgroups maintained a symmetrical center. Note that groups and subgroups would recover the conformations after avoidances if the environment was clear (no other pedestrians or obstacles).
According to the observation data, 63 pairs of groups exhibited significant evasion behavior: 52 pairs adopted holistic avoidance, 8 pairs employed interspersed avoidance, and the remaining 3 pairs applied catch-up avoidance. Figure 4 shows the number of three avoiding ways of each size group. An avoidance event between two different size groups will be recorded in both groups, but an avoidance event between two groups with the same size will be recorded just once. As shown in Figure 4, holistic avoidance is far more frequent than interspersed avoidance. An interesting phenomenon was observed: groups with fewer members would take the initiative to avoid groups with more members in holistic avoidance. The ratio that smaller groups took the initiative to avoid in this paper was 37:3.
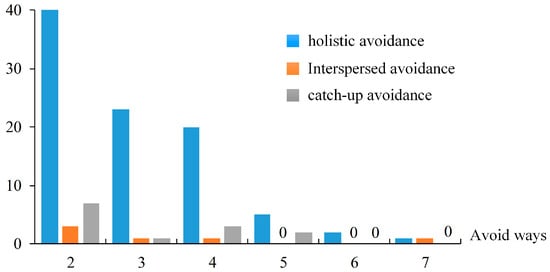
Figure 4.
Number of three avoiding ways of each size group.
3.2. 3D Modeling and Simulation Experiments in VGEs
Many methods exist for expressing people in crowd simulation (Figure 5). For example, models based on the SFM [15,16] simulate pedestrians as circles (Figure 5a), the origin denotes the center of mass and the circle indicates the space occupied by one pedestrian. Some studies [60] simulate people as ellipses (Figure 5b), the long axis represents the shoulder width of a person and the short axis is the walking direction. Other studies [61] use triangles and cylinders (Figure 5c) to represent pedestrians, which can not only express private space but also visualize the walking direction. These methods can easily simulate the trajectories of pedestrians and special behaviors when private spaces are intruded. However, these visualizations are not intuitive. With the development of 3D model technologies, people and buildings are meticulous. We believe that the use of human models for crowd simulation will be a future trend. The visualization effect far exceeds the abstract visualization methods. With three-dimensional character models, we can intuitively visualize body direction, height, gender and additional information. In this paper, we employ 3ds Max (https://www.autodesk.com/products/3ds-max/overview) to model the research area and pedestrians. This article will simulate group avoiding patterns of walking in the same direction and the opposite direction and subgroup coordinate behaviors at different distances.
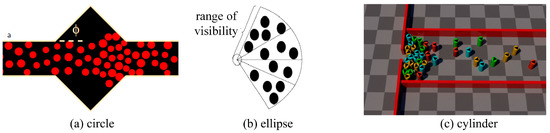
Figure 5.
Crowd visualization methods: (a) circles with different radii [16]. (b) Long axis of ellipse indicates pedestrians’ shoulder widths, and the short axis reveals the body direction [60]. (c) The heights of the cylinders indicate the heights of the pedestrians, and the triangles denote the walking direction [17].
3.2.1. Simulation of Group Avoiding Behaviors
Two factors need to be considered when simulating avoidance patterns between social groups: (1) when avoiding behaviors occur and (2) when the reasonableness of evasion is neither too negative nor too positive. In Figure 6, we simulate group avoiding behaviors in a corridor with different widths. As shown in Figure 6a, when Group 1 and Group 2 meet in the corridor with a width of 6 m, no avoiding behavior is observed. In Figure 6b, the width is reduced to 5 m, which cannot satisfy the requirement of two groups walking along the previous routes. Thus, they slightly adjusted the direction and avoid collision. In Figure 6c, the width is reduced to 3 m; both groups had significant adjustments while avoiding.
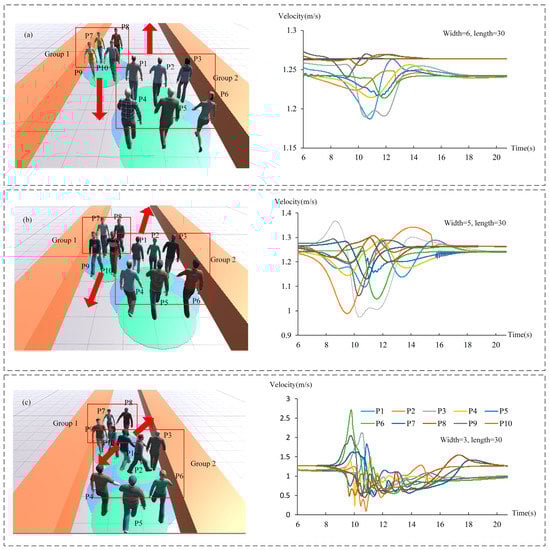
Figure 6.
Group avoidance patterns in a long corridor with different widths and corresponding speed curves; P1–P10 are pedestrians in the pictures. (a) groups will not evade while the corridor is spacious. (b) Groups will slightly adjust if the space is not adequate, and Group 1 takes the initiative to avoid. (c) Groups will make major adjustments if the corridor is narrow.
The simulation results indicate that even groups that walk in the opposite direction may avoid if two groups walk along the previous path and collide with each other at some time in the future (Figure 6b,c). Otherwise, groups will walk along the current route (Figure 6a). The speed change is the adjustment while avoiding. Figure 6a is stable, and Figure 6c is the most dramatic. When one group’s walking route is blocked by other groups or obstacles, the group needs to adjust its walking direction and speed to avoid an evasion. The more blockage there is, the more effort is needed to adjust. We believe that people tend to choose a simpler and more comfortable way to travel. The model proposed in this paper allows agents to evaluate whether avoiding behavior is needed and then make appropriate adjustments according to the circumstances.
Based on the observation data, we also identified a catch-up avoiding behavior between the groups that walk in the same direction. This behavior occurs when the rear group is faster than the front group. After a period of time, the rear group will overtake the front group. If the front group is faster than the rear group, avoidance will not occur as the rear group cannot catch up.
Figure 7 shows the simulation results of catch-up avoidance between two groups walking in the same direction in a corridor with dimensions of 3 × 30 m. In Figure 7b, Group 1 will never overtake Group 2 as Group 2 is faster than Group 1, catch-up avoiding behavior is thus not observed. If Group 1 is faster than Group 2 and Group 1 overtakes Group 2, Group 1 will take the lead in adjusting its structure to reduce the occupied space to avoid a collision (Figure 7c). As shown in Figure 7d, after overtaking, both groups enlarge the space that is occupied perpendicular to the walking direction, and members prefer to walk side by side. In the process of catch-up avoidance, we note that the front group cannot find the rear group in time due to a visual blind spot. The rear group usually actively avoids. After this process, group members will expand the group space and form a side-by-side conformation, which is more conducive for communication.
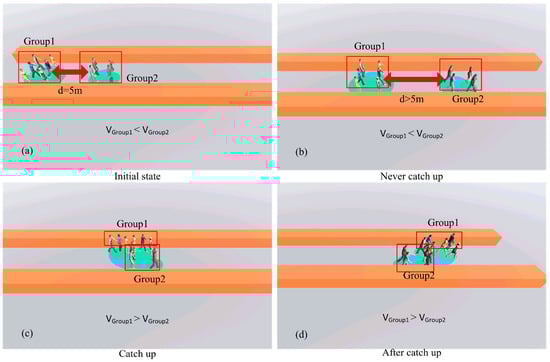
Figure 7.
Process of catch-up avoidance. (a) Initial state of two groups with 5 m spacing. (b) Group 1 will never catch up Group 2 if Group 2 is faster. (c) If Group 1 is faster than Group 2, Group 1 will take the initiative to adjust its structure to exceed Group 2. (d) After overtaking, both groups will restore the structure prior to an evasion.
In the process of avoiding, the intensity of avoiding behavior and the anticipation distance are two aspects of our concern. In our model, we use parameter A to control the intensity of group avoiding behavior and parameter B to adjust the anticipation distance. We set A from 100 to 3000 with step 100, B from 0.1 to 2 with step 0.1. Then we combine the different value of A, B and empirical compare the results with the video. Using this semiquantitative method, we determine the most appropriate values for these parameters. In this paper, we provide five typical experiments. As shown in Figure 8a to Figure 8c, we set A = 1500 and adjust B to control the anticipation distance and ensure that the avoiding behavior occurs at a reasonable time. When B = 0.4, the members of two groups collide with each other (Figure 8a); when B = 1.2, the avoiding behavior begins with a certain distance (Figure 8b); and when B = 2, the anticipation distance is larger (Figure 8c). As shown in Figure 8d to Figure 8f, we set B = 1.2 and adjust A to control the intensity of avoidance. In Figure 8d, the avoiding behavior is negative and eventually led to collision; in Figure 8e, both groups change structures for successful avoiding; in Figure 8f, the groups successfully avoid each other, and the horizontal distance is large. We know that the anticipation distance cannot be too long or too short and that the intensity of group avoidance cannot be too positive nor too negative, both should be within a reasonable range. We set the anticipation distance within 1.8–3 m [62]. Using multiple experiments, when A = 1500, B = 1.2, groups can start to avoid at a distance of approximately 2 m, and the exclusion among groups is relatively mild.
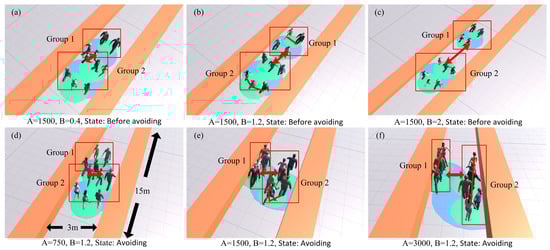
Figure 8.
Comparisons of groups that avoid space with different parameter B (a–c) and groups avoidance intensity with different parameter A (d–f).
The characteristics of avoiding behavior among groups in the same direction and the opposite direction can be approximately divided into the following key points: (1) for social groups, group avoidances only occur when other pedestrians or obstructions block their walking route; (2) group members prefer to avoid with the whole group instead of interspersing with other groups; (3) an anticipation distance occurs while avoiding. As the psychological repulsion of larger groups is large, smaller groups take the lead to avoid larger groups. But catch-up avoidance is not associated with group size; and (4) groups will adjust their conformations for more convenient walking and to reduce the demand of communication while avoiding; however, they will resume the previous structures after avoiding.
3.2.2. Simulation of Subgroup Coordinate Behaviors
From the observation data, we discover that large groups with more than three members will divide into several subgroups with two or three members. Some special behaviors among subgroups can ensure the compactness and symmetry of the whole group. Thus, we consider these behaviors in our model. In Formulas (9) and (10), we use parameter M to adjust the alignment force and parameter N to adjust the force of maintaining a certain distance between the subgroups.
Coordinate behaviors in the adjustment process comprise the balance of aligning and maintaining a distance between the front subgroups. Figure 9 shows the coordinate behaviors between two subgroups with three members. Figure 9a shows the initial state of simulation. We set the distance between subgroups in the walking direction and the direction perpendicular to to 5 m. Subgroup 2 will adjust its walking direction and speed to catch up with subgroup 1. After a few seconds of adjustment, the groups’ centroid connection is almost parallel to (Figure 9b) but the distance between subgroups in remains more than 2 m (Figure 9c). Then, subgroup 2 will continue to catch up with subgroup 1 until the distance is approximately 2 m (Figure 9d).
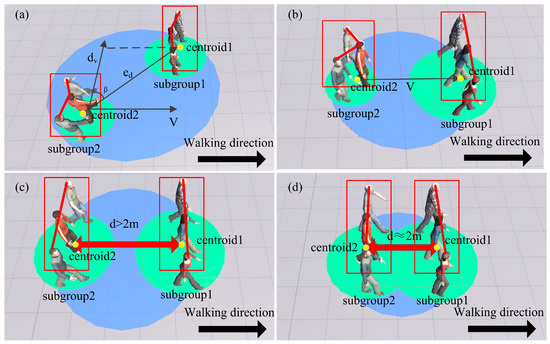
Figure 9.
Simulation results of subgroups coordinate process. (a) Initial state; the distance between subgroups in the walking direction and the direction perpendicular to are 5 m. (b) Subgroup 2 tries to align with subgroup1 and . (c) The distance between centroid1 and centroid 2 is more than 2 m, and subgroup 2 will speed up to catch up with subgroup 2. (d) The distance is approximately 2 m. Both subgroups will walk forward with a steady speed and distance.
Since M adjusts the subgroups’ alignment behavior and N adjusts the distance. We set M from 100 to 500 with step 50, N from 100 to 600 with step 50. Then we combine the different value of M, N and empirical compare the results with the video. Using this semi quantitative method, we determine the most appropriate values for these parameters. In Figure 10, we provide five typical combinations of M and N to observe the adjustment characteristics of velocity and distance in the coordinate process. The initial state of every experiment is Figure 9a. According to the three curves of M = 100, N = 350 and M = 300, N = 350 and M = 500, N = 350 in Figure 10a, we note that pedestrians’ walking speeds increase with M. Similarly, pedestrians’ velocities increase with N, as shown in the curves of M = 300, N = 100 and M = 300, N = 350 and M = 300, N = 600. After the adjustment, pedestrians will continue to walk with a steady speed of 1.3 m/s. The distance between subgroups will instantly be reduced to approximately 2 m, as shown in Figure 10b. A distinct oscillation phenomenon appears in M = 300, N = 100 and M = 500, N = 350. As M is significantly larger than N in these two curves, the force to align is significantly larger than the force to maintain a desired distance. When the rear subgroup accomplishes alignment, pedestrians’ speeds will be instantaneously reduced and the distance between the front subgroup and the rear subgroup is expanded. However, subgroups can maintain a distance of 2 m in all simulation results with different parameters. To ensure that the coordinate behaviors can be completed as soon as possible and are smooth without oscillation, M = 300 and N = 350 are the optimal choices.
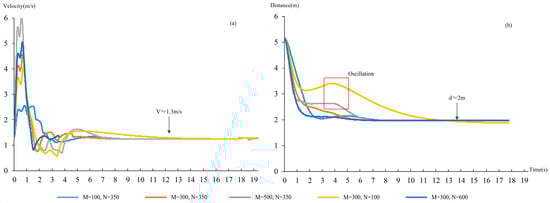
Figure 10.
Average velocity of pedestrians and distance of subgroups with different M and N. (a) Pedestrians in the rear subgroup adjust their velocities to catch up with the front subgroup and then maintain their speed at 1.3 m/s. (b) The time to reduce the distance between subgroups to 2 m.
Subgroups attempt to adjust their velocities and walking directions after being separated to walk as coherently as possible. In our model, the group members’ maximum walking speeds during adjustment increase with M and N, but the time required to adjust to the optimum distance between subgroups decreases with M and N. The coordinate behaviors in the adjustment process comprise the balance of aligning and maintaining a distance between the front subgroups. If the force to align is too large so that subgroups disregard the distance, distance oscillation occurs. If the force to maintain a desired distance is too large, the time to align increases. Our model chooses appropriate parameters to ensure that subgroups can address both behaviors.
3.3. Comparison between Models and Videos
We qualitatively compare the simulation results of the SGFM with the original group model in a complex environment (multiple groups). Figure 11a,c show the simulation results of the original model, whereas Figure 11b,d show the results of our model. Figure 11a,b display screenshots of the same moment in the avoidance process, and Figure 11c,d display the same state after avoiding. In Figure 11a, the directions of the members in the original model is chaotic. However, our model can ensure that pedestrians who belong to the same group have a relatively unified direction as shown in Figure 11b. In Figure 11c,d, we circle four groups to observe the status of the group members after the avoiding process. Group 1 is the group in Figure 11a,b. Group 1 are divided into two parts with a large distance and they are not willing to gather again. However, group 1 in Figure 11d not only gathers but also forms a stable spatial structure. Others groups have a similar phenomenon similar to group 1.
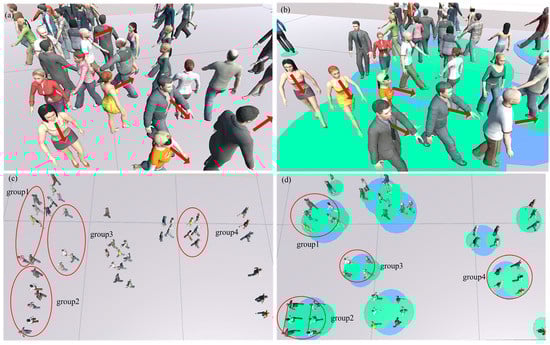
Figure 11.
Qualitative comparisons between the extended social force model (a,c) and the SGFM (b,d). (a,b) Pedestrians’ directions of the same social group. (c,d) Structures of groups after avoiding.
Then, we quantitatively compare the simulation results of the SGFM with the extended social force model in the scene above. Figure 12a show the change of average social group radius, which indicate the strength of group members to stick together, in simulation process. The average radius of the extended social force model (red curve) which trend towards increase implies group members tend to separate by others and cannot gather again. While in the SGFM (blue curve) the average radius fluctuate in a certain range, which indicate group members are slightly separated when avoiding others, and reunite again after avoiding. Figure 12b show the change of variance of walking direction difference between pedestrians and groups, which indicate the strength of group members to maintain the same walking direction. In the SGFM (blue curve) group members show more willingness to walk in the same direction and not affected by others than the extended social force model (red curve). The variance decrease with time because when finished avoiding others the group members tend to walk along the same desired direction. The curve in Figure 12 are smoothed and the shadow represent confidence interval.
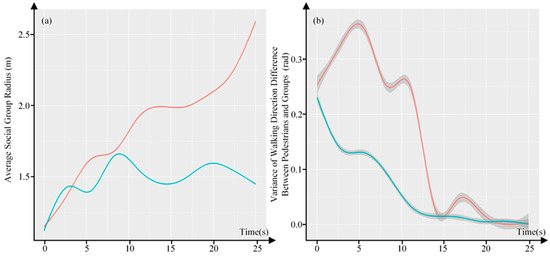
Figure 12.
Quantitative comparisons between the extended social force model (Red) and the social group force model (SGFM (Blue). (a) The change of average social group radius. (b) The change of variance of walking direction difference between pedestrians and groups.
We can conclude from the comparisons that (1) the original model cannot make group members stick together while avoiding; however, our model can adequately ensure that groups are clustered even in crowded scenery while avoiding; (2) when subgroups are separated, they are not willing to gather again in the original model; however, in SGFM they can not only reassemble but also form a reasonable structure according to group size and walking at a steady distance; and (3) group members tend to walk side by side, regardless of group size; however, in our model, large groups will divide into several subgroups and effectively balance communication and walking.
We compare the simulation results of the SGFM with real behaviors. Figure 13a,b display screenshots of the avoiding behavior in the video data. Two social groups are walking in the opposite direction. They adjust their structures from “side by side” to “V-like” to avoid collision with the whole social group. As shown in Figure 13c,d, the simulation results are consistent with real pedestrian behaviors. Figure 13e,f show screenshots of the coordinate behaviors of the subgroups in the video data. It is a social group with 5 members; one of the members breaks from the social group. Then, this pedestrian speeds up to catch up with the other 4 members and form a 3 + 2 structure. We simulate the process in a virtual scenario with the same width as the real scenario, as shown in Figure 13g,h. The results indicate that our model can adequately simulate the coordinate behaviors of a subgroup. After catching up with the other members, the backward pedestrian forms a subgroup with another member, and the remaining 3 members form a subgroup. The structure of these two subgroups in the simulation results is similar to the structure of the two subgroups in reality. The SGFM has the following advantages: (1) social groups can gather as much as possible while avoiding and can avoid as a whole without passing through other groups; and (2) groups with more than 3 members will divide into subgroups with 2 or 3 members, the SGFM can simulate the conformations of subgroups and how they coordinate when they are separated.
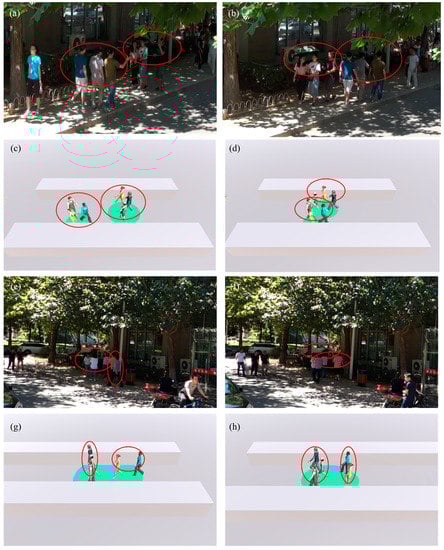
Figure 13.
Comparisons between real data and simulation results of the SGFM. (a,b) Avoidance in the real world. (c,d) Simulation results of avoiding behavior. (e,f) Coordinate behavior in real world. (g,h) Simulation results of coordinate behavior.
3.4. Virtual Reality for Crowd Simulation
Subsequently, we invite the participants to observe the characteristics of social groups in an immersive virtual environment with “Oculus Rift DK 2”, as shown in Figure 14c. We conducted a questionnaire survey of the visual effects of the three visualization methods: two-dimensional (the simulation scenes are two-dimensional and pedestrians are represented as two-dimensional graphics, such as circles and triangles) (Figure 14a), non-immersive three-dimensional (the simulation scenes and pedestrians are three-dimensional models, participants can observe the movement of pedestrians on a screen) (Figure 14b) and immersive three-dimensional (the simulation scene and pedestrians are also three-dimensional models, and participants are exposed to simulation scenes by wearing virtual reality devices) (Figure 14c). In both 3D visualization and immersive 3D visualization, the participants can observe the scene with free angle and position from first-person perspective to third-person perspective. We invited 51 people to participate the experiment and fill in the questionnaires. The participants are between 20 and 60 years old and the male-female ratio is balanced. The contents of the questionnaire include social groups walking preference, social group avoidance initiative, effects of three visualizations, and information obtained from the three visualizations, etc. Most participants believe that three-dimensional visualization is more intuitive and vivid than two-dimensional visualization. Immersive three dimensional visualization enables participants to experience the process of avoiding collisions with other pedestrians from first-person perspective. We ask participants to compare the behaviors of the extended social force model with the behaviors of the SGFM, which is quantitatively compared in Section 3.3. They determine that groups in the extended social force model do not have a close relationship in the process of avoiding and the will to gather is not strong if they are separated. However, the groups in SGFM attempt to stick together and their members walk with a relatively unified direction and stable spatial structures.
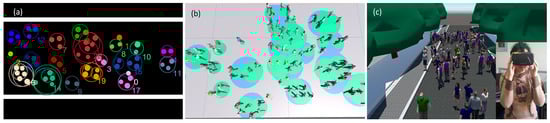
Figure 14.
Participants observe the characteristics of social groups with three visualization methods. (a) 2D visualization (the simulation scenes are two-dimensional and pedestrians are represented as two-dimensional graphics, such as circles and triangles). (b) 3D visualization (the simulation scenes and pedestrians are three-dimensional models, participants can observe the movement of pedestrians on a screen). (c) Immersive 3D visualization (the simulation scene and pedestrians are also three-dimensional models, and participants are exposed to simulation scenes by wearing virtual reality devices).
4. Conclusions
In this paper, we presented a novel model that is based on an extended social force model for simulating avoiding behaviors between social groups and coordinate behaviors among subgroups within the same social group. In face-to-face avoidance, groups will begin to avoid at an anticipation distance of approximately two meters, and smaller groups will usually be the first groups to avoid. However, in catch-up avoidance, the rear groups will take the initiative to avoid, which is not related to group size. Large groups will divide into several subgroups with only two or three members when they are forced to separate. This model can simulate aligning and maintaining a distance between the subgroups. Then, subgroups can gather again after making smooth adjustments.
We evaluate the model in different scenarios. The qualitative experimental results and a small amount of quantitative experimental results indicate that our model can adequately simulate group avoiding behaviors and subgroup coordinate behaviors. In our model, group avoiding behaviors will only occur when groups’ walking routes are blocked by other pedestrians or obstacles, and group members try to stick together as much as possible while avoiding instead of interspersing with other groups. Social groups can balance the demand of communication and independent walking according to the situation. In virtual geographic experiments, we can adjust environment attributes (scenarios and road width) and pedestrian attributes (group sizes and density) to simulate crowd behavior in different situations. In this article, we invite people to observe crowd dynamics in an immersive virtual environment by wearing a VR headset. Our model is generally considered to adequately simulate social group behaviors.
Due to the inability to exactly identify pedestrians’ locations, the simulation results cannot be compared with real data. The relationships between two social group members are not easily recognized, and we cannot reflect them in the SGFM. Although three-dimensional character models are used to visualize crowd behaviors, this paper does not apply the model to a practical application due to the restriction of article length. In the future, we will invite groups with different social relationships who carry GPS sensors to participate in experiments to improve our model. We are developing a virtual training system using virtual reality and augmented reality technologies, combined with real and virtual crowds to conduct emergency evacuation exercises in crowded public places, such as subways and gymnasiums. Besides, we will take trajectory extraction as an important step in our future work. This work will be completed in the near future, and we will continue to publish these research results.
Supplementary Materials
The following are available online at http://www.mdpi.com/2220-9964/7/2/79/s1.
Acknowledgments
This research has been supported by the National Natural Science Foundation of China (No. 41371387 and No. 41571393), National Key R&D Plan (No. 2017YFB0503602). We are grateful to the members of the VGE research group for their stirring discussions and the reviewers for their helpful comments on this manuscript. We respect the ethical conventions in collecting the video: We do not reveal the identity or any other private information. All the participants in virtual reality experiments provide informed consent. We store and circulate the data only for research purposes and have an approval from administration of the Institute of Remote Sensing and Digital Earth.
Author Contributions
Lin Huang proposed the model, performed analysis and wrote the paper. Jianhua Gong and Wenhang Li conceived the study. Tao Xu designed the experiments. Shen Shen, Dong Zhang and Jun Sun collected the data. Jianming Liang and Quanlong Feng processed and interpreted the data.
Conflicts of Interest
The authors declare no conflict of interest.
References
- Gong, J.H.; Lin, H.; Xiao, L.B.; Xie, C.J. Perspective on geo-visualization. J. Remote Sens. 1999, 3, 236–244. [Google Scholar]
- Lin, H.; Chen, M.; Lu, G. Virtual geographic environment: A workspace for computer-aided geographic experiments. Ann. Assoc. Am. Geogr. 2013, 103, 465–482. [Google Scholar] [CrossRef]
- Goodchild, M.F. Virtual geographic environments as collective constructions. Acta Geod. Cartogr. Sin. 2008, 31, 1–6. [Google Scholar]
- Konecny, M. Review: Cartography: Challenges and potential in the virtual geographic environments era. Geogr. Inf. Sci. 2011, 17, 135–146. [Google Scholar] [CrossRef]
- Zhan, B.; Monekosso, D.N.; Remagnino, P.; Velastin, S.A.; Xu, L.Q. Crowd analysis: A survey. Mach. Vis. Appl. 2008, 19, 345–357. [Google Scholar] [CrossRef]
- Daamen, W.; Hoogendoorn, S. Controlled experiments to derive walking behaviour. Eur. J. Transp. Infrastruct. Res. 2003, 3, 39–59. [Google Scholar]
- Sumpter, D.J. The principles of collective animal behaviour. Philos. Trans. R. Soc. Lond. 2006, 361, 5–22. [Google Scholar] [CrossRef] [PubMed]
- Li, W.; Gong, J.; Yu, P.; Shen, S. Modeling, simulation and analysis of group trampling risks during escalator transfers. Phys. A Stat. Mech. Appl. 2016, 444, 970–984. [Google Scholar] [CrossRef]
- Li, W.; Gong, J.; Yu, P.; Shen, S.; Li, R.; Duan, Q. Simulation and analysis of congestion risk during escalator transfers using a modified social force model. Phys. A Stat. Mech. Appl. 2015, 420, 28–40. [Google Scholar] [CrossRef]
- Mehdi, M.; Mubbasir, K.; Tyler, T.; Sumner, R.W.; Markus, G.; Dirk, H.; Christoph, H. Crowd behaviour during high-stress evacuations in an immersive virtual environment. J. R. Soc. Interface 2016, 13. [Google Scholar] [CrossRef]
- Ch’Ng, E. Crowd behaviour mining with virtual environments. Presence Teleoper. Virtual Environ. 2016, 24, 347–358. [Google Scholar] [CrossRef]
- Torrens, P.M. A computational sandbox with human automata for exploring perceived egress safety in urban damage scenarios. Int. J. Digit. Earth 2017, 1–28. [Google Scholar] [CrossRef]
- Li, W.; Li, Y.; Yu, P.; Gong, J.; Shen, S.; Huang, L.; Liang, J. Modeling, simulation and analysis of the evacuation process on stairs in a multi-floor classroom building of a primary school. Phys. A Stat. Mech. Appl. 2016, 469, 157–172. [Google Scholar] [CrossRef]
- Li, W.; Li, Y.; Yu, P.; Gong, J.; Shen, S. The trace model: A model for simulation of the tracing process during evacuations in complex route environments. Simul. Model. Pract. Theory 2016, 60, 108–121. [Google Scholar] [CrossRef]
- Mehdi, M.; Niriaska, P.; Simon, G.; Dirk, H.; Guy, T. The walking behaviour of pedestrian social groups and its impact on crowd dynamics. PLoS ONE 2010, 5, e10047. [Google Scholar]
- Helbing, D.; Farkas, I.; Vicsek, T. Simulating dynamical features of escape panic. Nature 2000, 407, 487. [Google Scholar] [CrossRef] [PubMed]
- Zanlungo, F.; Ikeda, T.; Kanda, T. Potential for the dynamics of pedestrians in a socially interacting group. Phys. Rev. E Stat. Nonlinear Soft Matter Phys. 2014, 89, 012811. [Google Scholar] [CrossRef] [PubMed]
- Brščić, D.; Zanlungo, F.; Kanda, T. Density and velocity patterns during one year of pedestrian tracking. Transp. Res. Procedia 2014, 2, 77–86. [Google Scholar] [CrossRef]
- Zanlungo, F.; Brščić, D.; Kanda, T. Spatial-size scaling of pedestrian groups under growing density conditions. Phys. Rev. E Stat. Nonlinear Soft Matter Phys. 2015, 91, 062810. [Google Scholar] [CrossRef] [PubMed]
- Zanlungo, F.; Yucel, Z.; Brscic, D.; Kanda, T.; Hagita, N. Intrinsic group behaviour: Dependence of pedestrian dyad dynamics on principal social and personal features. PLoS ONE 2017, 12, e0187253. [Google Scholar] [CrossRef] [PubMed]
- Aveni, A.F. The not-so-lonely crowd: Friendship groups in collective behavior. Sociometry 1977, 40, 96–99. [Google Scholar] [CrossRef]
- Coleman, J.S.; James, J. The equilibrium size distribution of freely-forming groups. Sociometry 1961, 24, 36–45. [Google Scholar] [CrossRef]
- James, J. The distribution of free-forming small group size. Am. Sociol. Rev. 1953, 18, 569. [Google Scholar] [CrossRef]
- Schultz, M.; Rößger, L.; Fricke, H.; Schlag, B. Group dynamic behavior and psychometric profiles as substantial driver for pedestrian dynamics. In Pedestrian and Evacuation Dynamics; Springer: Cham, Switzerland, 2012; pp. 1097–1111. [Google Scholar]
- Mcphail, C.; Wohlstein, R.T. Using film to analyze pedestrian behavior. Sociol. Methods Res. 1982, 10, 347–375. [Google Scholar] [CrossRef]
- Zeynep, Y.; Francesco, Z.; Tetsushi, I.; Takahiro, M.; Norihiro, H. Deciphering the crowd: Modeling and identification of pedestrian group motion. Sensors 2013, 13, 875–897. [Google Scholar]
- Xi, J.A.; Zou, X.L.; Chen, Z.; Huang, J.J. Multi-pattern of complex social pedestrian groups. Transp. Res. Procedia 2014, 2, 60–68. [Google Scholar] [CrossRef][Green Version]
- Zanlungo, F.; Kanda, T. A mesoscopic model for the effect of density on pedestrian group dynamics. EPL 2015, 111, 38007. [Google Scholar] [CrossRef]
- Zanlungo, F.; Yucel, Z.; Kanda, T. The effect of social roles on group behaviour. arXiv, 2017; arXiv:1702.03081. [Google Scholar]
- Rojas, F.A.; Yang, H.S.; Tarnogol, F.M. Safe navigation of pedestrians in social groups in a virtual urban environment. In Proceedings of the International Conference on Cyberworlds, Santander, Spain, 6–8 October 2014; pp. 31–38. [Google Scholar]
- Yan, X.; Cheriyadat, A.; Shah, S.K. Hierarchical group structures in multi-person tracking. In Proceedings of the International Conference on Pattern Recognition, Stockholm, Sweden, 24–28 August 2014; pp. 2221–2226. [Google Scholar]
- Rojas, F.A.; Yang, H.S. Minimizing collision among social groups in wide-open spaces. In Proceedings of the International Conference on Cyberworlds, Santander, Spain, 6–8 October 2014; pp. 77–84. [Google Scholar]
- Bode, N.W.; Holl, S.; Mehner, W.; Seyfried, A. Disentangling the impact of social groups on response times and movement dynamics in evacuations. PLoS ONE 2015, 10, e0121227. [Google Scholar] [CrossRef] [PubMed]
- Karamouzas, I.; Geraerts, R.; Stappen, A.F.V.D. Space-Time Group Motion Planning; Springer: Berlin/Heidelberg, Germany, 2013; pp. 227–243. [Google Scholar]
- Zanlungo, F.; Brščić, D.; Kanda, T. Pedestrian group behaviour analysis under different density conditions. Transp. Res. Procedia 2014, 2, 149–158. [Google Scholar] [CrossRef][Green Version]
- Giraldo, L.F.; Passino, K.M. Dynamic task performance, cohesion, and communications in human groups. IEEE Trans. Cybern. 2016, 46, 2207–2219. [Google Scholar] [CrossRef] [PubMed]
- Park, S.I. Modeling Social Group Interactions for Realistic Crowd Behaviors; Virginia Polytechnic Institute & State University: Blacksburg, VA, USA, 2013. [Google Scholar]
- Park, S.I.; Quek, F.; Cao, Y. Simulating and animating social dynamics: Embedding small pedestrian groups in crowds. Comput. Animat. Virtual Worlds 2013, 24, 155–164. [Google Scholar] [CrossRef]
- Zhang, Y.; Zhang, Y.; Zhang, Y.; Zhang, Y. Simulation of small social group behaviors in emergency evacuation. In Proceedings of the International Conference on Computer Animation and Social Agents, Geneva, Switzerland, 23–25 May 2016; pp. 71–77. [Google Scholar]
- Gorrini, A.; Crociani, L.; Feliciani, C.; Zhao, P.; Nishinari, K.; Bandini, S. Social groups and pedestrian crowds: Experiment on dyads in a counter flow scenario. In Proceedings of the 8th International Conference on Pedestrian Evacuation Dynamics, Hefei, China, 17–21 October 2016. [Google Scholar]
- Peay, M.Y.; Peay, E.R. The effects of density, group size, and crowding on behaviour in an unstructured situation. Br. J. Soc. Psychol. 2011, 22, 13–18. [Google Scholar] [CrossRef]
- Krüchten, C.V.; Schadschneider, A. Empirical study on social groups in pedestrian evacuation dynamics. Phys. A Stat. Mech. Appl. 2017, 475, 129–141. [Google Scholar] [CrossRef]
- Wang, J.; Nan, L.; Lei, Z. Small group behaviors and their impacts on pedestrian evacuation. In Proceedings of the 27th Chinese Control and Decision Conference, Qingdao, China, 23–25 May 2015; pp. 232–237. [Google Scholar]
- Yu, Y. Evacuation Simulation Using Celluar Automata Model with Forces Essentials. Ph.D. Thesis, University of Science and Technology of China, Hefei, China, 2008. [Google Scholar]
- Wąs, J.; Porzycki, J.; Lubaś, R.; Miller, J.; Bazior, G. Agent-based approach and cellular automata—A promising perspective in crowd dynamics modeling? Acta Phys. Pol. B Proc. Suppl. 2015, 9, 133. [Google Scholar] [CrossRef]
- Xi, H.; Son, Y.J. Two-level modeling framework for pedestrian route choice and walking behaviors. Simul. Model. Pract. Theory 2012, 22, 28–46. [Google Scholar] [CrossRef]
- Lu, L.; Chan, C.Y.; Wang, J.; Wang, W. A study of pedestrian group behaviors in crowd evacuation based on an extended floor field cellular automaton model. Transp. Res. Part C Emerg. Technol. 2017, 81, 317–329. [Google Scholar] [CrossRef]
- You, L.; Hu, J.; Gu, M.; Fan, W.; Zhang, H. The simulation and analysis of small group effect in crowd evacuation. Phys. Lett. A 2016, 380, 3340–3348. [Google Scholar] [CrossRef]
- Li, Y.; Liu, H.; Liu, G.P.; Li, L.; Moore, P.; Hu, B. A grouping method based on grid density and relationship for crowd evacuation simulation. Phys. A Stat. Mech. Appl. 2017, 473, 319–336. [Google Scholar] [CrossRef]
- Mahmod, S.M.; Alia, O.M.; Zainuddin, Z. Incorporating prediction factor into the investigation capability in the social force model: Application on avoiding grouped pedestrians. Appl. Math. Inf. Sci. 2013, 7, 323–331. [Google Scholar]
- Rinke, N.; Schiermeyer, C.; Pascucci, F.; Berkhahn, V.; Friedrich, B. A multi-layer social force approach to model interactions in shared spaces using collision prediction. Transp. Res. Procedia 2017, 25, 1249–1267. [Google Scholar] [CrossRef]
- Colombi, A.; Scianna, M. Modelling human perception processes in pedestrian dynamics: A hybrid approach. R. Soc. Open Sci. 2017, 4, 160561. [Google Scholar] [CrossRef] [PubMed]
- Xi, H.; Lee, S.; Son, Y.J. An Integrated Pedestrian Behavior Model Based on Extended Decision Field Theory and Social Force Model; Springer: London, UK, 2011; pp. 824–836. [Google Scholar]
- Farina, F.; Fontanelli, D.; Garulli, A.; Giannitrapani, A.; Prattichizzo, D. Walking ahead: The headed social force model. PLoS ONE 2017, 12, e0169734. [Google Scholar] [CrossRef] [PubMed]
- Wang, L.; Zheng, J.; Zhang, X.; Zhang, J.; Wang, Q.; Zhang, Q. Pedestrians’ behavior in emergency evacuation: Modeling and simulation. Chin. Phys. B 2016, 25, 685–694. [Google Scholar] [CrossRef]
- Martinez-Gil, F.; Lozano, M.; Fernández, F. Marl-ped: A multi-agent reinforcement learning based framework to simulate pedestrian groups. Simul. Model. Pract. Theory 2014, 47, 259–275. [Google Scholar] [CrossRef]
- Martinez-Gil, F.; Lozano, M.; Fernández, F. Strategies for simulating pedestrian navigation with multiple reinforcement learning agents. Auton. Agents Multi-Agent Syst. 2015, 29, 98–130. [Google Scholar] [CrossRef]
- Bezbradica, M.; Ruskin, H.J. Modelling Impact of Morphological Urban Structure and Cognitive Behaviour on Pedestrian Flows; Springer International Publishing: Basel, Switzerland, 2014; pp. 268–283. [Google Scholar]
- Elzie, T.; Frydenlund, E.; Collins, A.J.; Robinson, R.M. Panic that spreads sociobehavioral contagion in pedestrian evacuations. Transp. Res. Rec. J. Transp. Res. Board 2016, 2586, 1–8. [Google Scholar] [CrossRef]
- Wang, Z.; Chen, F.; Shi, Z. Agent-based realization of social force model and simulation of pedestrians in subway passageway. J. South China Univ. Technol. 2013, 41, 90–95. [Google Scholar]
- Godoy, J.E.; Karamouzas, I.; Guy, S.J.; Gini, M. Adaptive learning for multi-agent navigation. In Proceedings of the International Conference on Autonomous Agents and Multiagent Systems, Istanbul, Turkey, 4–8 May 2015; pp. 1577–1585. [Google Scholar]
- Wei, X. Experimental and Modeling Study on Pedestrian Movement Considering Group Behavior. Ph.D. Thesis, University of Science and Technology of China, Hefei, China, 2015. [Google Scholar]


© 2018 by the authors. Licensee MDPI, Basel, Switzerland. This article is an open access article distributed under the terms and conditions of the Creative Commons Attribution (CC BY) license (http://creativecommons.org/licenses/by/4.0/).