1. Introduction
Floods belong to the group of the most commonly occurring natural disasters in the world [
1], cause large amounts of damage [
2] and are a major cause of weather-related disruptions in the transport industry, which particularly refers to so-called flash floods [
3]. What is more, such phenomena are predicted to become even more frequent in years to come [
4]. Therefore, the safety and resilience of infrastructural networks to natural disasters have recently become a vital research objective [
5]. A flood on the roads may have numerous direct and indirect detrimental effects, which may include fatalities, vehicle and road infrastructure damages, including the resultant economic losses and traffic delays related, for example, to the necessity of taking a detour [
6,
7,
8,
9,
10,
11,
12]. Disturbances within the transport network can be divided into typical and non-typical [
13]. The former – caused by uneven distribution of transport demand in time and space – is of a cyclical nature within a specific time period. The latter, however, results from exceptional, temporary conditions and circumstances, including the effects of adverse events (e.g., failures of underground installations and devices, breakdowns within transport systems, etc.), construction and engineering works conducted within the highway network or in its immediate vicinity, and public events which may require an alternate traffic organisation to be implemented whenever the carriageway is occupied by masses of people gathering in one spot [
14]. Other causes of non-typical disruptions include various types of road incidents (e.g., accidents and collisions, oil spills on the highway, etc.), unfavourable weather conditions (e.g., heavy snowfall, floods, rock and landslides, etc.), temporary deteriorations of the road surface, and even terrorist attacks. Such disturbances lead to unpredicted or non-recurring congestion [
14,
15]. The probability and the scope of such congestion differs depending on the type of network and its vulnerability to disruption and are strictly tied to the effectiveness of risk management policies in the area, appropriate planning of roadworks, and the efficiency with which obstacles are removed in order to restore free-flowing vehicle traffic [
6]. Network disruptions related to natural disasters and human activity have an immense impact on the functioning of the road network. Transport agencies need well defined concepts and validated models and tools to test networks for their robustness and resilience to failure at different locations, as an integral part of network design and incident management planning, and indeed planning for emergencies [
16].
‘Mobility’ is a divergence from ‘stability’, understood as a normal state [
17]. In the geographical and sociological literature, mobility refers to multi-scale movement of people, goods, capital and information, and to local phenomena related to everyday trips and journeys within public spaces [
18,
19]. ‘Accessibility’ is the most fundamental concept applied in studies devoted to transport geography, and it is defined as the ‘ease of reaching opportunities for activities and services and can be used to assess the performance of a transportation and urban system’ ([
20] p. 242).
The subject literature contains an approach related to traffic speed modelling, which is based on regulations of the Traffic Code [
21] (in publications, results of this approach are often referred to as ‘theoretical accessibility’), information obtained by direct (and thus, somewhat subjective) observations made by a researcher who participates in the movement of traffic along a given road network [
22], data reflecting speeds allowable by the Traffic Code, the topography of the land and the number of residents in the vicinity of the researched roads [
23,
24], and statistics of travel times collected by global corporations such as Google [
25,
26]. Obviously, none of the aforementioned data can provide a truly realistic picture of the phenomenon of vehicle movement within the road network, which supports the opinion stated in the introductory section herein. Even when accurate, such models only present representations of speeds under undisturbed circumstances.
In the literature there are numerous studies focusing on the impact of the transport industry on climate change and the influence of flooding on the capacity of the transport network. The papers by [
1,
27,
28,
29,
30] analyse the issue of evacuation, while [
6,
7] analyse the impact of floods on accessibility and mobility (where the authors scrutinise changes in transport accessibility and network load, applying the scenario of a flood in the Mazovian Voivodeship in Eastern Poland). For the purpose of the research, the authors used methods of assessing accessibility, which relied on distance measurements, on isochronous and cumulative approaches, and on their own software tool for determining the scale and the spatial structure of changes in traffic density within the regional road network. In the aforementioned cases, however, the analyses focused exclusively on commuting to work. In the article compiled by [
31], the authors also researched changes in accessibility within the Warta Water Region for ultrashort and short trips, as generated in the VISUM software. The impact of flooding on traffic flows and network performance, considered in ‘functional’ terms (i.e., travel time, flows, accessibility), were also scrutinised by Pregnolato [
12], and yet the article only contained a review of the existing studies in the matter.
The existing literature about accessing the impact of flooding on transport disruptions do not take into account the complexity of interactions between the flood hazard and the transport system.
Typically, assumptions can include [
32,
33,
34]:
traffic volumes and speeds are assumed to correspond to regional (or even national) average statistics,
a road is assumed to be completely closed when its crown is covered by water, regardless of depth,
traffic on open roads continues to flow smoothly, perhaps at a slightly reduced maximum speed,
traffic volumes do not exceed the design capacity of a road,
traffic conditions do not change over the course of the day, or seasonally; and,
diversion routes, and changes (or not) to driver behaviour as a result of the flood, are often assumed without any clear rationale [
12].
Accessibility research is customarily based on speed models [
35,
36,
37,
38,
39,
40,
41], which take into account the characteristics of the network when no disturbances or disruptions have been reported. Thus, their application in scenarios related to the occurrence of non-typical phenomena does not fully reflect the changes that take place if such circumstances happen to exist. The appearance of non-typical phenomena involves the occurrence of external effects which are observed, for instance, in connection to mobility, and which considerably influence traffic speeds within the road network. With this in mind, the main purpose of this article was to develop a method to research accessibility in the event of a flood with the simultaneous application of a mobility-based approach. Thus, the authors assumed that changes in mobility (and the related traffic speed) were too important for the research into accessibility in non-typical conditions not to be taken into consideration.
2. Materials and Methods
2.1. The Research Area
Nine catchment areas in Poland were selected namely, the drainage basins of the Vistula, the Oder, the Dniester, the Danube, the Banovka, the Elbe, the Neman, the Pregolya, and the Prokhladnaya. Next, the basin areas were divided into water regions, which were defined as ‘sections of the catchment area distinguished by the hydrological criterion for the purposes of water management and/or located in the territory of the Republic of Poland as part of the international catchment area’ ([
42] Article 16, Item 33). The Warta Water Region was selected for further, more detailed research. It is one of the five water regions within the catchment area of the Oder, with the Warta being its main tributary. The Warta is the third longest river in Poland (808 km) and the rivers within its water region are characterised by a nival regime. As a result, high waters dominate in early spring, triggered by snowmelts and the release of water from frozen soil (snowmelt high waters), while any rises due to summer rainfall is of secondary importance (it appears irregularly, and yet it may occasionally cause higher water levels than those reported during early spring snowmelts). High water levels are most commonly noted between February and early May, and lower levels from June till September (although a summer bankfull flow may also occur in this period). Thaw floods are almost always observed across vast areas, whereas abrupt rainfall flooding is mainly reported on a local scale, as intense deluges rarely occur across the whole region.
Within the analysed territory, a ten-year flood area (the probability of occurrence p = 10%) covered the surface of 75,341 ha, a one-hundred-year flood area (1%) – 101,169 ha, and the areas at risk of flooding due to a complete destruction of stopbanks – 99,659 ha [
43]. This is the second largest water region within the catchment area of the Oder for high-risk territories and those located outside stopbanks (in the least favourable scenario) (
Table 1).
The total number of residents living in the flood hazard areas within the Warta Water Region amounted to 40,596 people, including 5341 residents within the areas with a particularly high flood hazard, with the areas in danger of flooding due to a total destruction of stopbanks being home to 35,255 people (
Table 2).
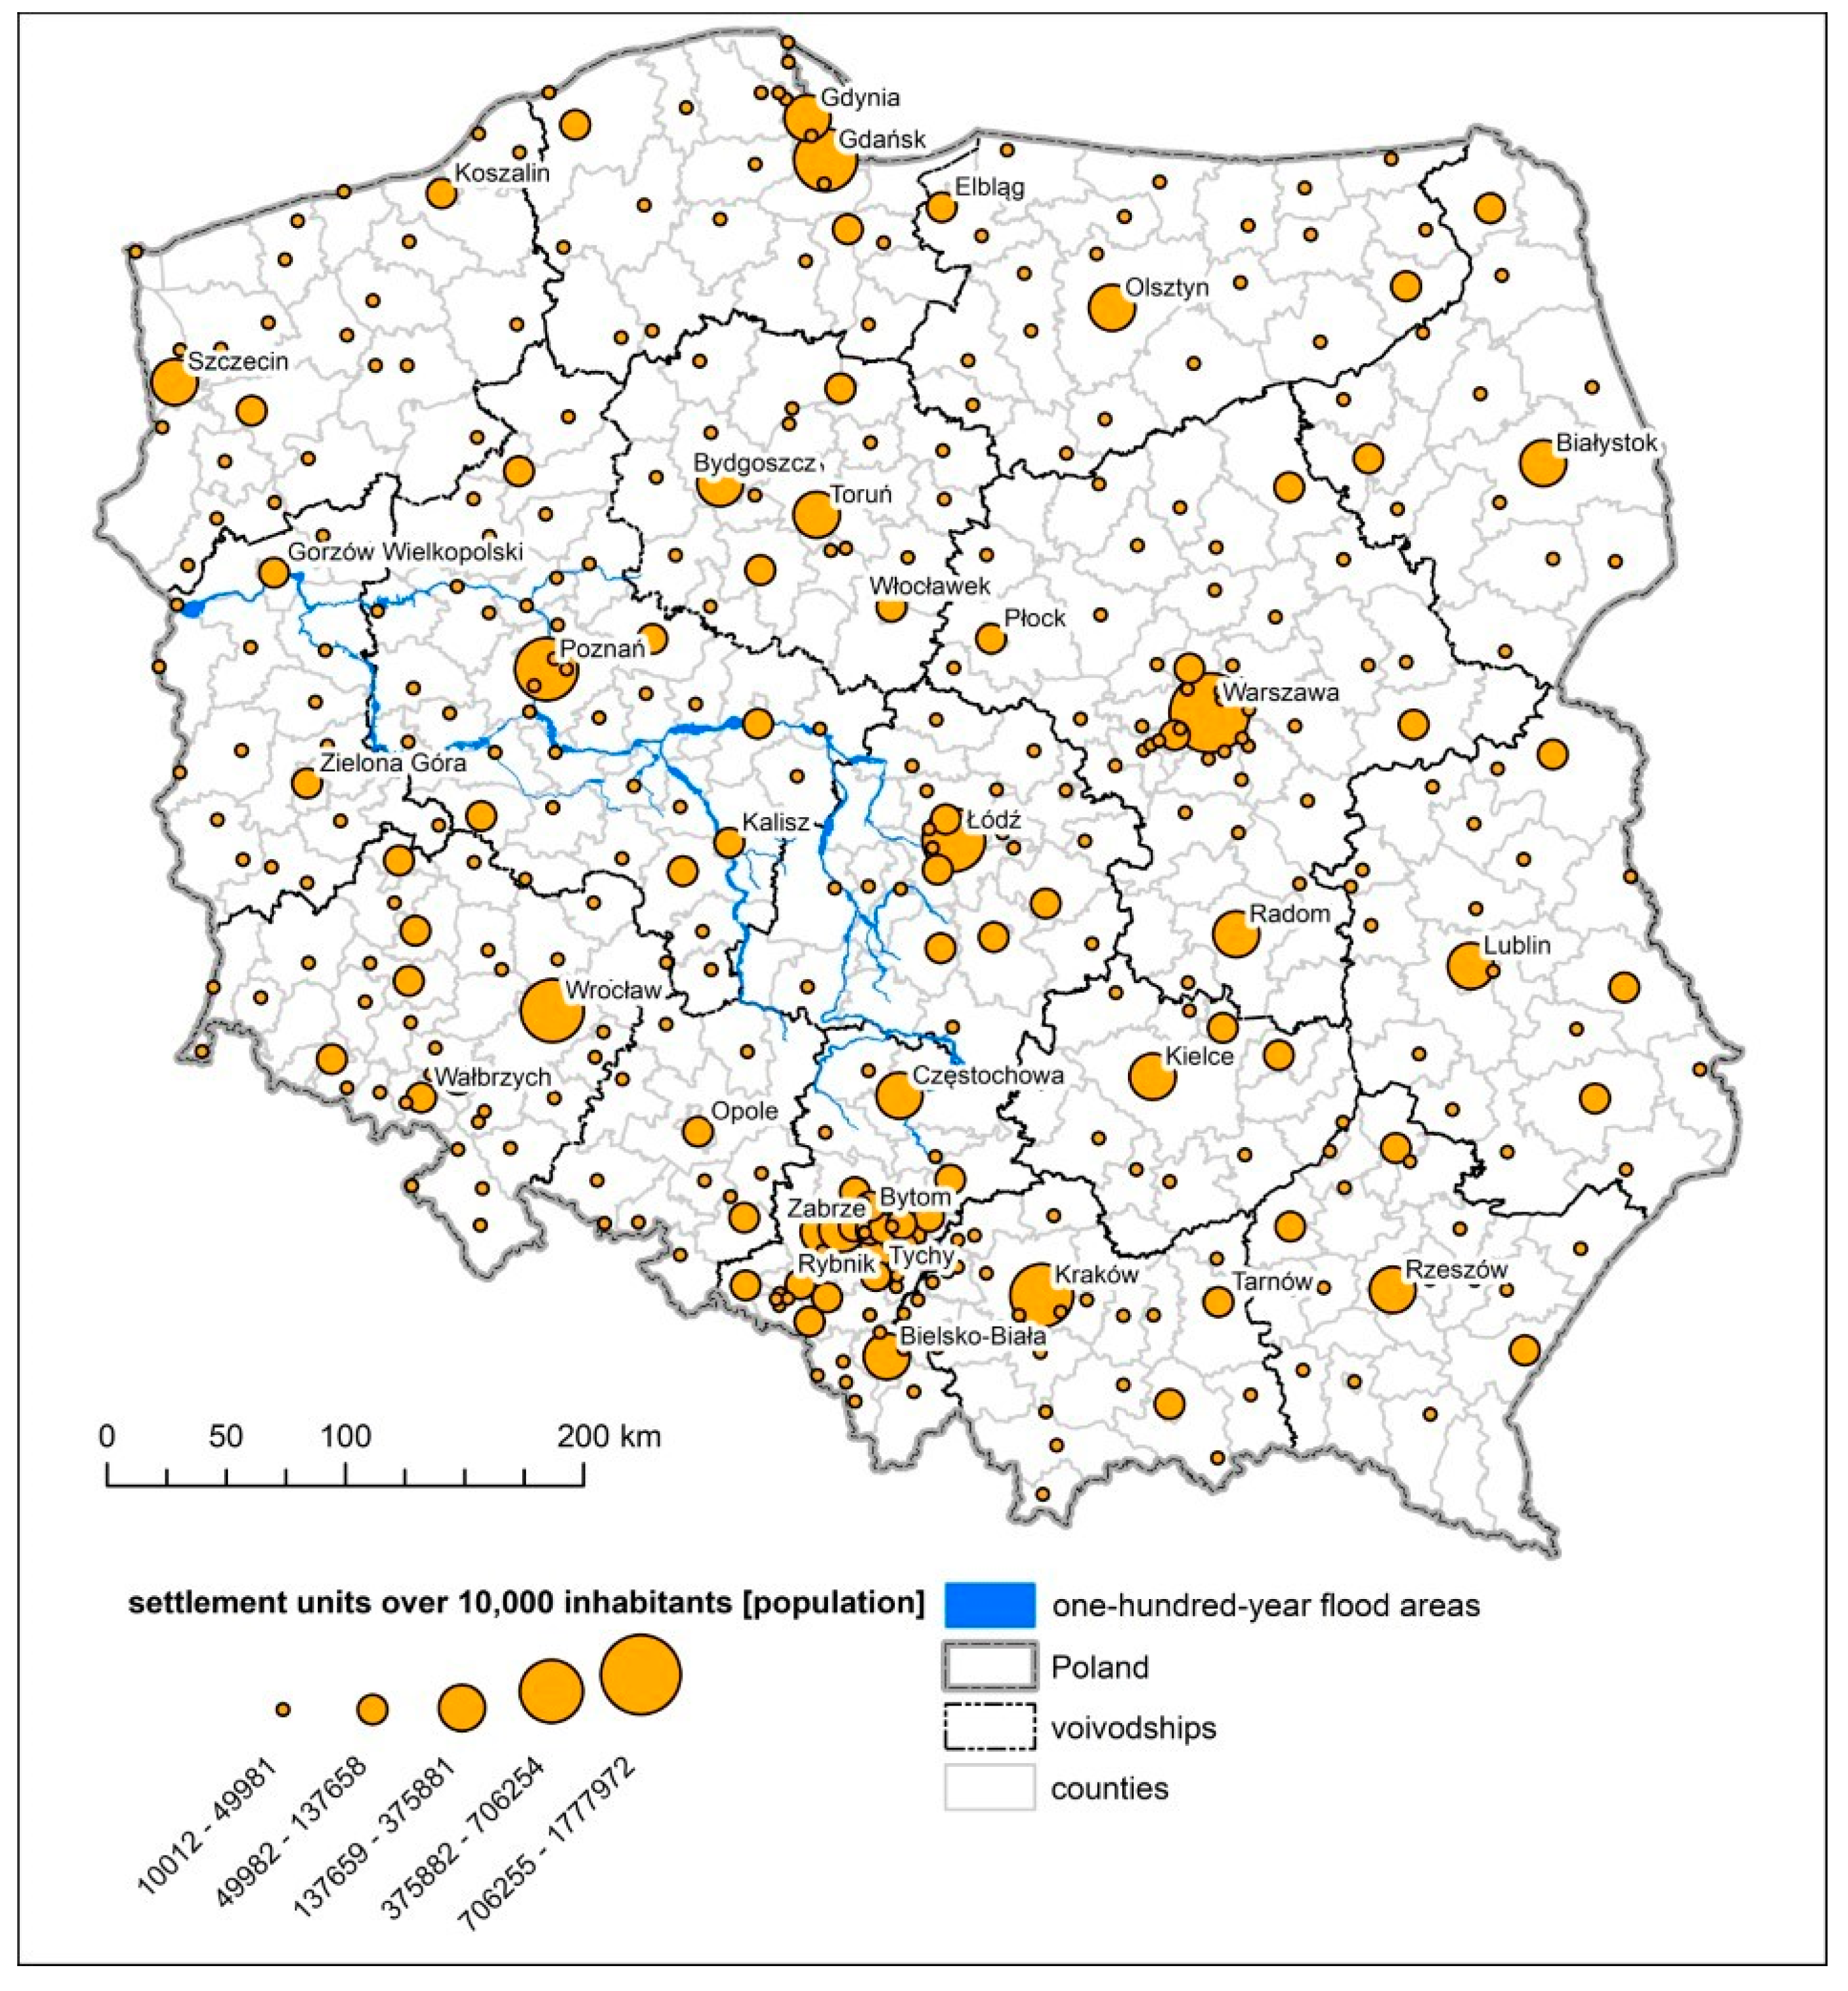
In terms of administrative organisation, the Warta Water Region lies within the territory of seven voivodeships (
Figure 1) (with 380 districts that are located wholly or partially within its borders). The largest cities and towns within the studied area included Łódź (690,422), Poznań (538,633), Częstochowa (224,376), Gorzów Wielkopolski (124,295), and Kalisz (101,625) [
44].
2.2. Source Materials
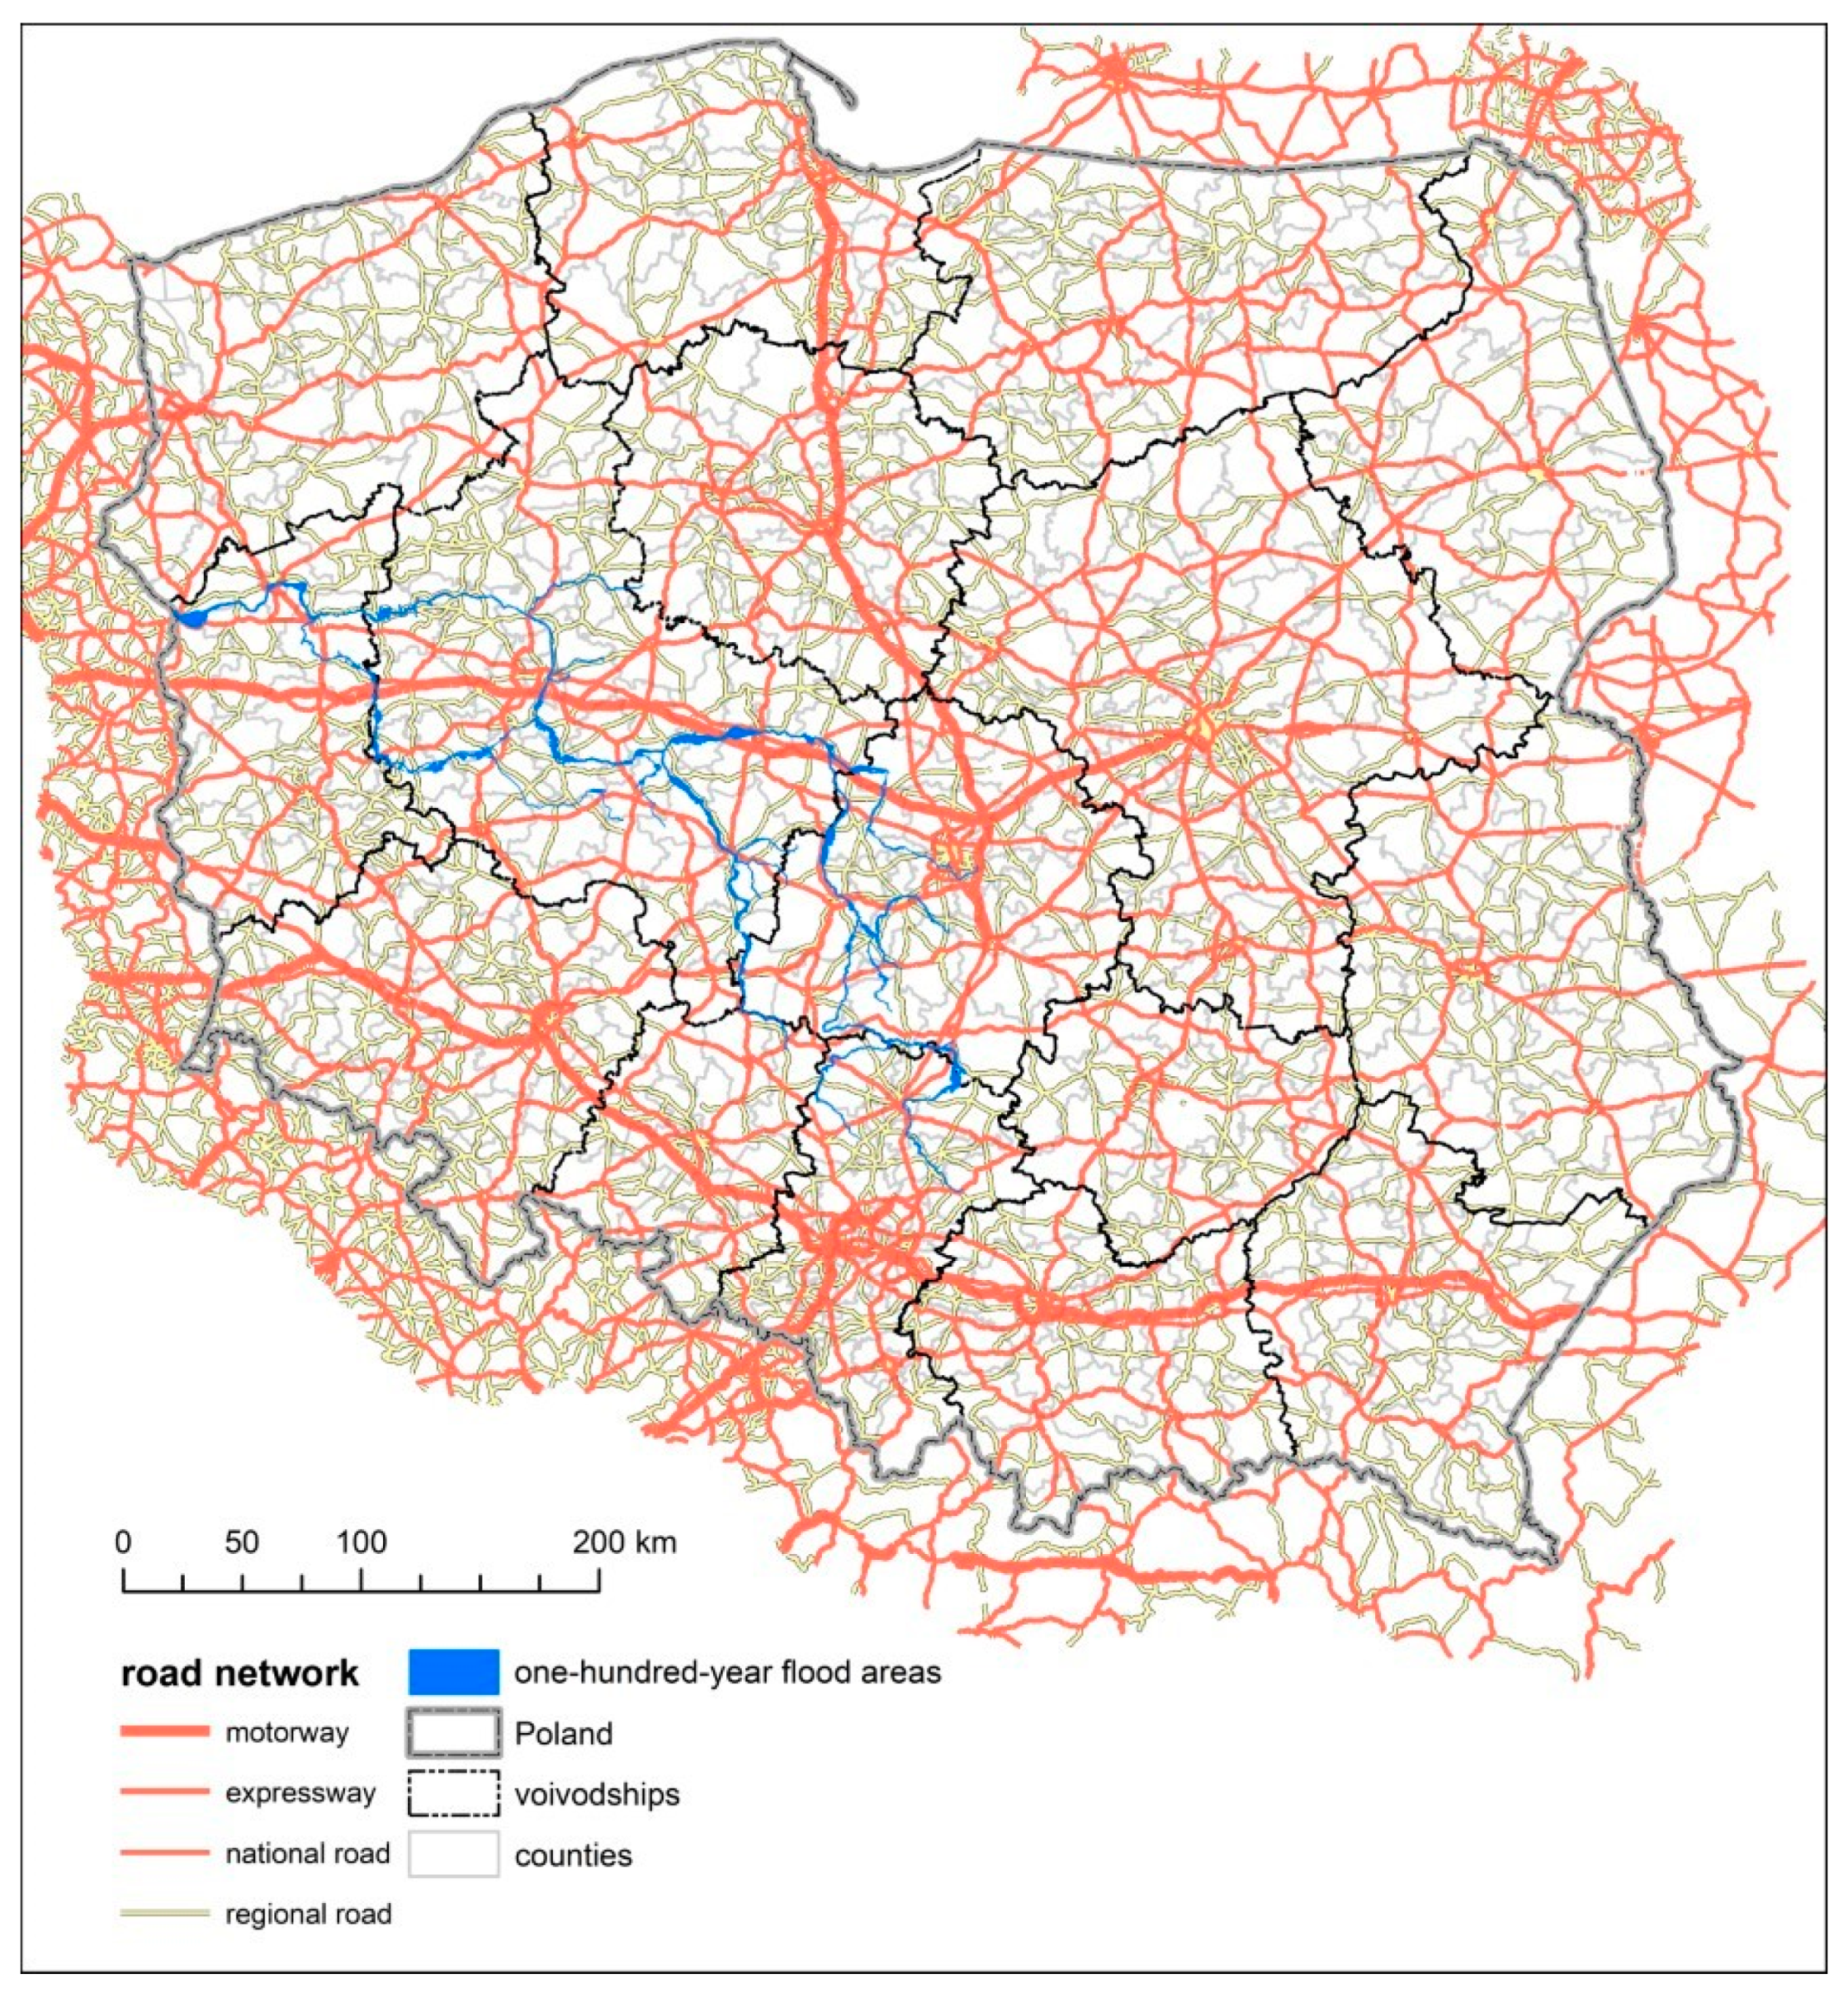
The most significant source materials used in the study were: the official data obtained from the head office of Land Surveying and Cartography, containing the numerical digital terrain model (NMPT), the updated data retrieved from the Central Statistical Office (GUS) (which included the number of residents in individual counties); the data from the National Traffic Model from the General Directorate for National Roads and Motorways (GDDKiA) (
Figure 2), and flood-risk maps created during the implementation of the directive on the assessment and management (by the National Water Management Authority) of flood risks in Poland [
45].
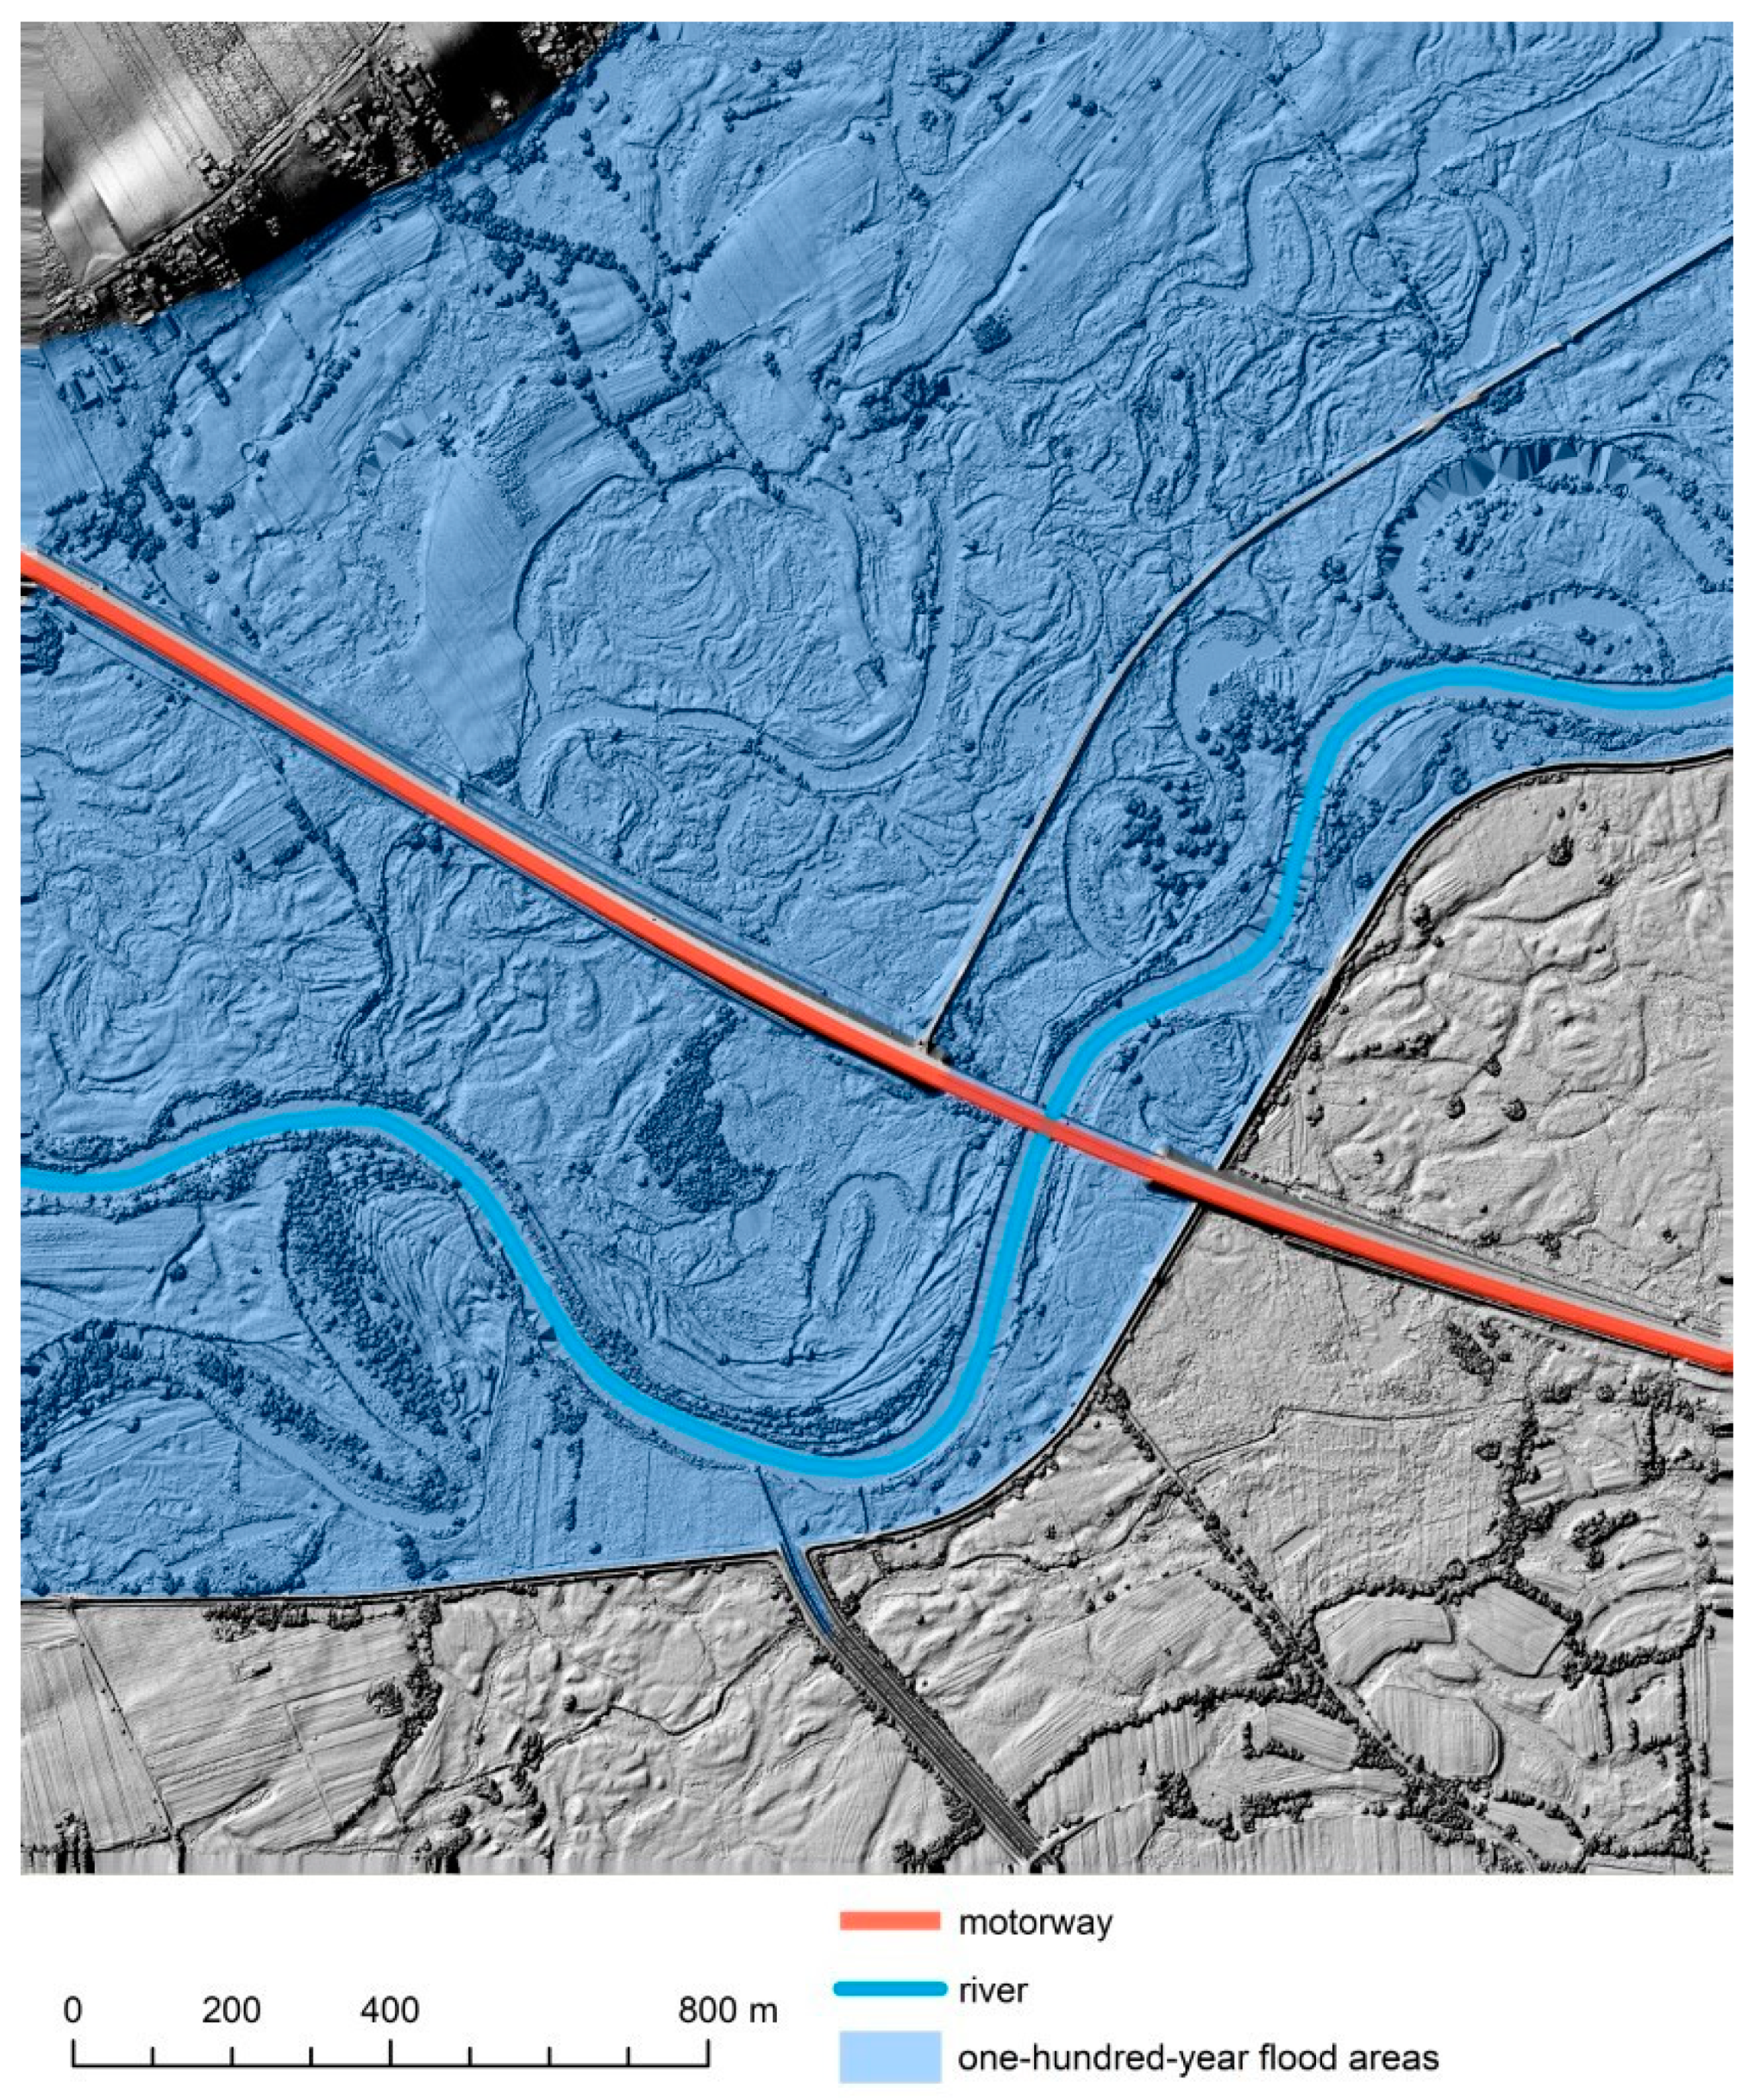
The DTM is a database containing geographic coordinates and elevation points (metres above sea level) of the topographical surface, identified by means of Light Detection and Ranging technology (LIDAR). It is a digital (point-based) representation of the area’s surface, including such protruding objects such as buildings, trees, bridges, viaducts and other elements of the infrastructure. The database also contains information on geographic coordinates and altitude of points positioned every 0.5 m (
Figure 3).
The data obtained from the Central Statistical Office provides information on the number of residents within individual units of the territorial division of Poland. With respect to our research, the data on the number of residents in each Polish county (as of 2018) were utilised.
The base for the national traffic model is a numerical model of the road network, which according to the official agency (GDDKiA) enables an accurate representation of the actual road structure and its real traffic conditions. It is a standard model, consisting of sections and points with assigned traffic parameters and geographic coordinates. The model of the network itself contains all national roads of strategic status (motorways, expressways and national roads) as well as regional roads (voivodeship-level status), complemented by the network of roads necessary to meet the requirements imposed for the construction of the National Traffic Model. Points within the network include: nodes which are road intersections, places where the size of the carriageway changes, and locations in which the surroundings of the road change (urban – extra urban). In total, the model of the network contained 49 types of road sections (
Table 3).
Each unit of the secondary level of Poland’s administrative division (county) was represented within the model as an internal transport region. Regions where there was an attraction combined with traffic generation outside Poland had their representation at border crossings. In total, the model contained 335 internal and 85 external transport regions. The National Traffic Model was created in two fundamental stages, i.e., the development of an international and national model. The former was based on the results of surveys conducted at border crossings and seven traffic matrices, four of which were developed for different motivations of trips taken by cars, and one each for light commercial vehicles, trucks and articulated lorries. The national model was based on surveys, data from the Central Statistical Office, and measurements conducted under the framework of the General Traffic Measurement (GPR). Models for the generation and spatial distribution of traffic were developed independently for passenger and cargo traffic. At a later stage of model calibration, calculations were made for all vehicle classes in total. The model for the generation of passenger car traffic contained four trip motivations (home-workplace, business, tourism, and others). These reasons were characterised on the basis of information from surveys and sets of explanatory variables (numbers of residents, registered companies, accommodation facilities, and passenger cars). The model for cargo traffic was developed on the basis of three trip classes (arranged by vehicle type, i.e., light commercial vehicles, trucks and articulated lorries), the data retrieved from the Central Statistical Office, and results of traffic surveys. As a consequence, the National Traffic Model consisted of fourteen matrices (
Table 4).
A gravity model was used in order to calculate the trip matrix for all classes (the number of trips between regions is a mathematical function of their potential and distances between them). In this model, the function of distance decay was calibrated for each class and based on surveys (and more precisely, on the equation of average results from surveys and average results from the model). The traffic model was also calibrated locally – traffic resilience was increased or decreased in selected network sections depending on the degree to which the model was adjusted to real-life measurements. In the analyses related to traffic distribution over the network, the costs were: travel time multiplied by ‘time value’, route length multiplied by ‘vehicle operating costs’ and motorway tolls, where the costs of ‘time value’ and ‘vehicle operating costs’ were applied separately for each trip motivation. Calibration of the spatial distribution of traffic was performed on the basis of cordon and screen measurements of traffic. Each of the 6848 road sections were calibrated, with the process involving individual calibration for both directions of traffic flow. It was assumed that 85% of sections (out of 6848) should have a GEH (Geoffrey E. Havers’ formula) less than 5. As a result, 99% of the sections in the network reached the value of GEH<5 for articulated lorries, 97% for trucks, 95% for light commercial vehicles, and 86% for passenger cars.
Polish water law defines flood-hazard areas as ‘locations determined by the initial flood-risk assessment to be at a significant risk of flooding or where such risk is likely to occur’ [
42]. For such areas, flood-risk maps were prepared, which showed (the data included in this study has been bolded): (1) areas of a low probability of occurrence (0.2%), or areas where extreme events were probable; (2) areas of a significant flood hazard, i.e., areas of a medium probability of occurrence (1%), and areas of a high probability of occurrence (10%) – part of water terrain with the 1% probability of a flood; areas between the shoreline and the stopbank or a natural high bank into which a stopbank had been incorporated, including islands and alluviums, which were land lots or a service strip; (3) areas within territories at risk of flooding related to destruction or damage of a stopbank, a storm embankment, or a damming structure [
42]. As well as the boundaries of the flood-hazard territories, the database also contained the high-water ordinate for the scenarios in which a flood was likely to occur once in ten or once in a hundred years. For the purpose of this study, the analyses of changes in accessibility were conducted for the scenario of a 1% probability of a flood. Since it is the most common practice to research territories of a one-hundred-year flood (Qp1%, i.e., discharge of probability of occurrence p = 1%) [
47,
48,
49,
50,
51,
52], the authors also decided to limit the scope of their scrutiny to this range.
2.3. The Research Methods
When the network applied to create the National Traffic Model was combined with flood-risk maps, it was possible to determine which parts of the network were at potential risk of flooding due to a one-hundred-year flood. Previously, we had limited our analyses exclusively to modifications of the network which were based on the said combination in order to research mobility [
6] and accessibility [
7,
28]. At some scales, however, the returned results would be encumbered with considerable errors (related to the location of some network sections at overpasses and embarkments rising over the level of flood waters). In order to eliminate such erroneous results, this time another control network was incorporated into the road map, namely – its altitude. For this purpose, data from the digital terrain mode (NMPT) was used. The implementation of the additional vertical control network was conducted as follows. Firstly, one metre spaced points were marked along all edges (which symbolize bridge objects) of the network, and their geographic coordinates were determined. Next, the spatially generated points were aligned with elevation points from the NMPT. At the same time, the information on the surface elevation of flood water (retrieved from the flood risk map) was ‘spread’ over flood-hazard areas by means of Thiessen polygons [
53,
54,
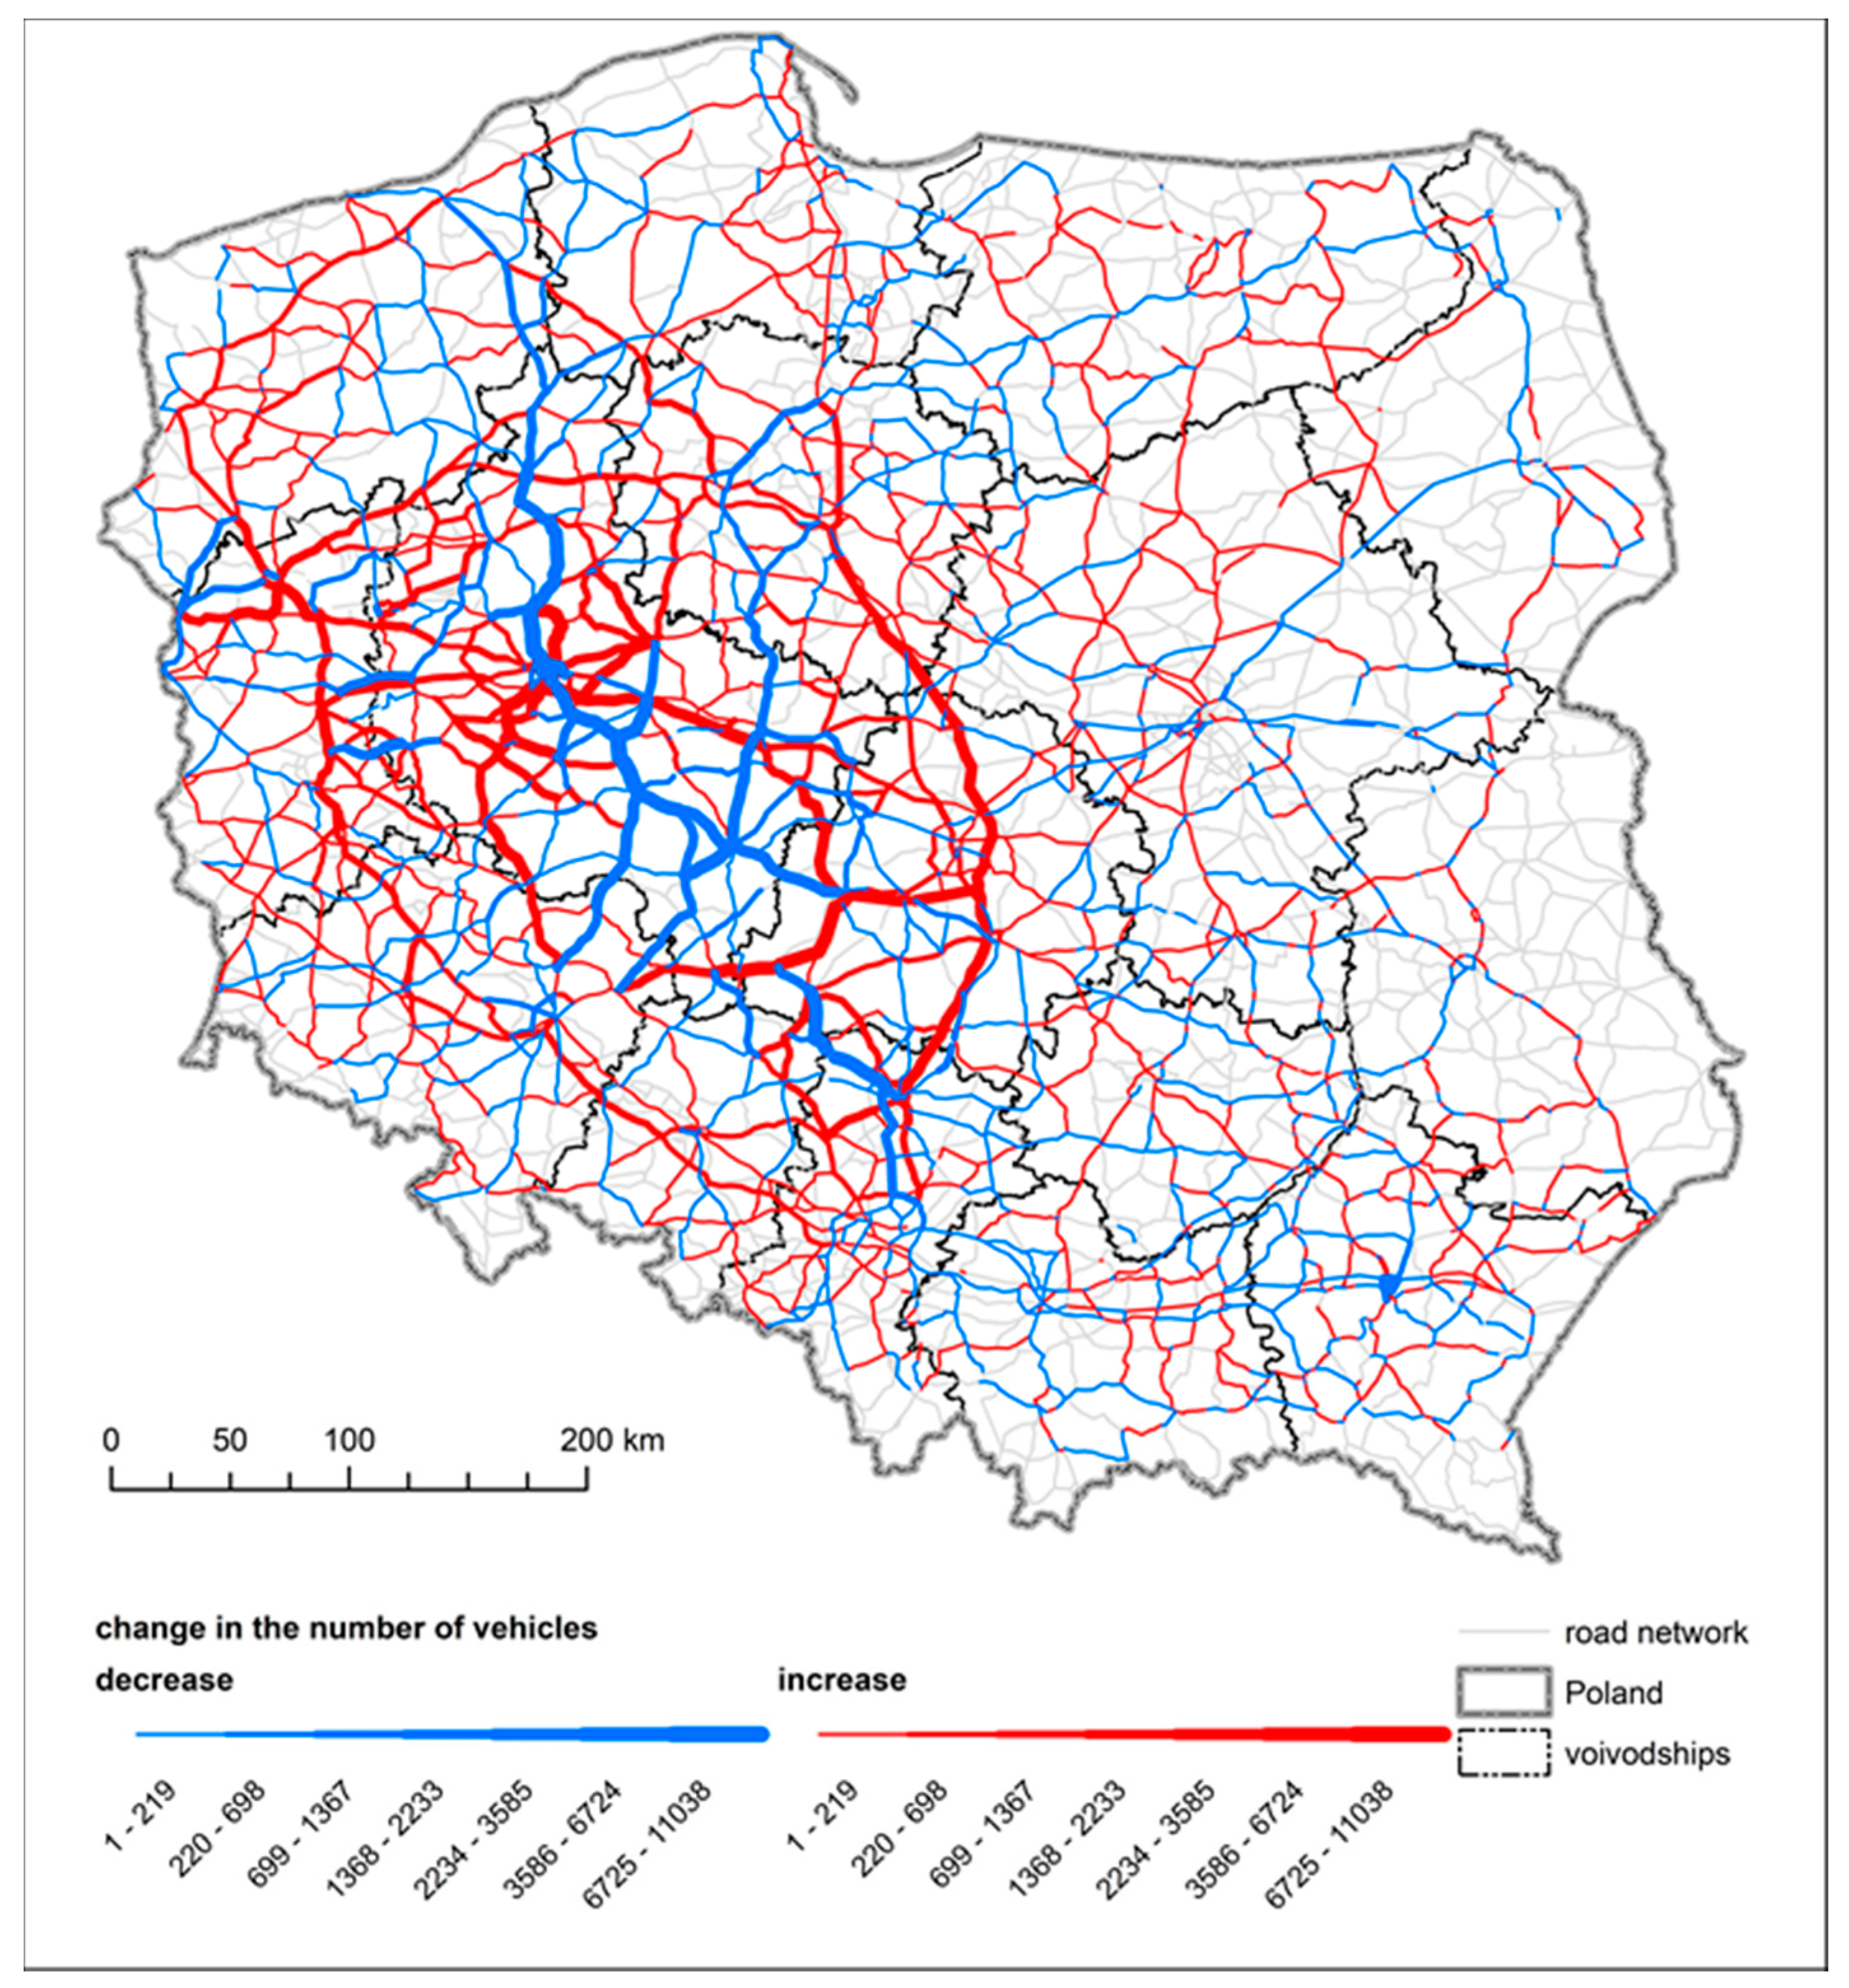
55]. Then, the results returned during the course of the analysis of Thiessen polygons were subtracted from elevations aligned from the NMPT for one metre spaced control points within the network. If the returned result represented a negative value, it meant that a given network section would be flooded in the event of the 1% risk flood. This rendered it possible to show not only the segments of the road network which ran within flood-hazard areas, but also specific sections over which flood waters would flow. This approach brought good results was verified when a series of macroscale maps (
Figure 4) were generated, a procedure which was aimed at testing its validity (due to the accuracy and size of the applied database, the generation of a single map of the entire Warta Water Region could not be completed within an acceptable period of time, even if good-quality hardware was used).
In the analyses, it was assumed that any flooding would result in closure of the afflicted section of the network. This approach is commonly applied and well-grounded, for instance, by Gissing’s studies [
56], where the authors proved the dangers of driving into road sections that seemed flooded by relatively shallow waters. Nevertheless, there are also studies which accept low levels of floodwater covering the roads [
57,
58,
59].
Further analyses included traffic simulations, changes in vehicle speed within the network, and measurements of potential accessibility. These were conducted for normal conditions – with no floods – and for a scenario of a one-hundred-year flood in the Warta Water Region. Taking into account the nature of the data source related to the traffic model, we decided to apply one of the most popular approaches to traffic simulation, i.e., a simulation utilising the algorithms of the VISUM Software on the basis of the existing National Traffic Model. This tool is often used in studies on a national scale [
60,
61]. It was presumed that a flood in the researched area would not last long and had no considerable impact on the changes in trip motivation (at such short notice no changes in residence, workplaces, and headquarters of companies, factories and warehouses were reported). However, this approach imposed a certain limitation due to the fact that we did not evaluate the probability of the occurrence of restrictions related to a temporary decrease in transport demand, which could have been an effect of the flood (e.g., delayed holiday returns, employees taking days off to obviate the necessity to commute through or around the flooded areas, etc.). Therefore, the analysis of the no-flood scenario was introduced, and then the resultant travel matrix was reapplied to study traffic distribution over the network, which only contained floodwater-related road closures. As a result, it was possible to demonstrate the changes in the load of individual network sections, including speed changes therein.
The next step was to analyse potential accessibility in Poland and the changes resulting from flooding in the Warta Water Region.
In order to measure potential accessibility, the following formula was applied:
where:
–transport accessibility of a given transport region
–function of weight attractiveness (here: linear function)
–weights available within a given transport region (here: the number of people)
–distance decay (here: exponential function)
–the total temporal distance related to a trip from region i to region j (here: distance measured along the transport network).
The time distance for the base variant (no flood) was determined on the basis of traffic distribution within the National Traffic Model. For the variant with a one-hundred-year flood, distances were applied on the basis of the network with road shutdowns (sections to be flooded), and the analysis took into account modified travel speeds resulting from traffic redistribution of traffic over the network whose size had been reduced by flooded sections. As a consequence, it was assumed that potential accessibility would not only be impacted by the infrastructure itself, but also by load-related driving conditions.
The description of the formula above is self-explanatory, and yet, the function of distance decay applied in accessibility studies may require a commentary. For the purposes of this paper, three different functions of distance decay were used: for short (commuting to work), long (business trips and holidaying), and ultralong trips (commodity transport by truck and lorry). The function may take the form of a power [
62], exponential [
36,
63], Gaussian [
64], or logistic function [
65].
For our research, we used an exponential function that took the following form:
where:
–distance decay
–travel time between transport regions
–beta parameter.
The difference between them lies in the value of the beta parameter. Here, we used the values applied by Rosik [
36] on the basis of the detailed data on mobility in Poland, for short, long and ultralong trips. These were β = 0.0154, β = 0.0050 and β = 0.0030, respectively.
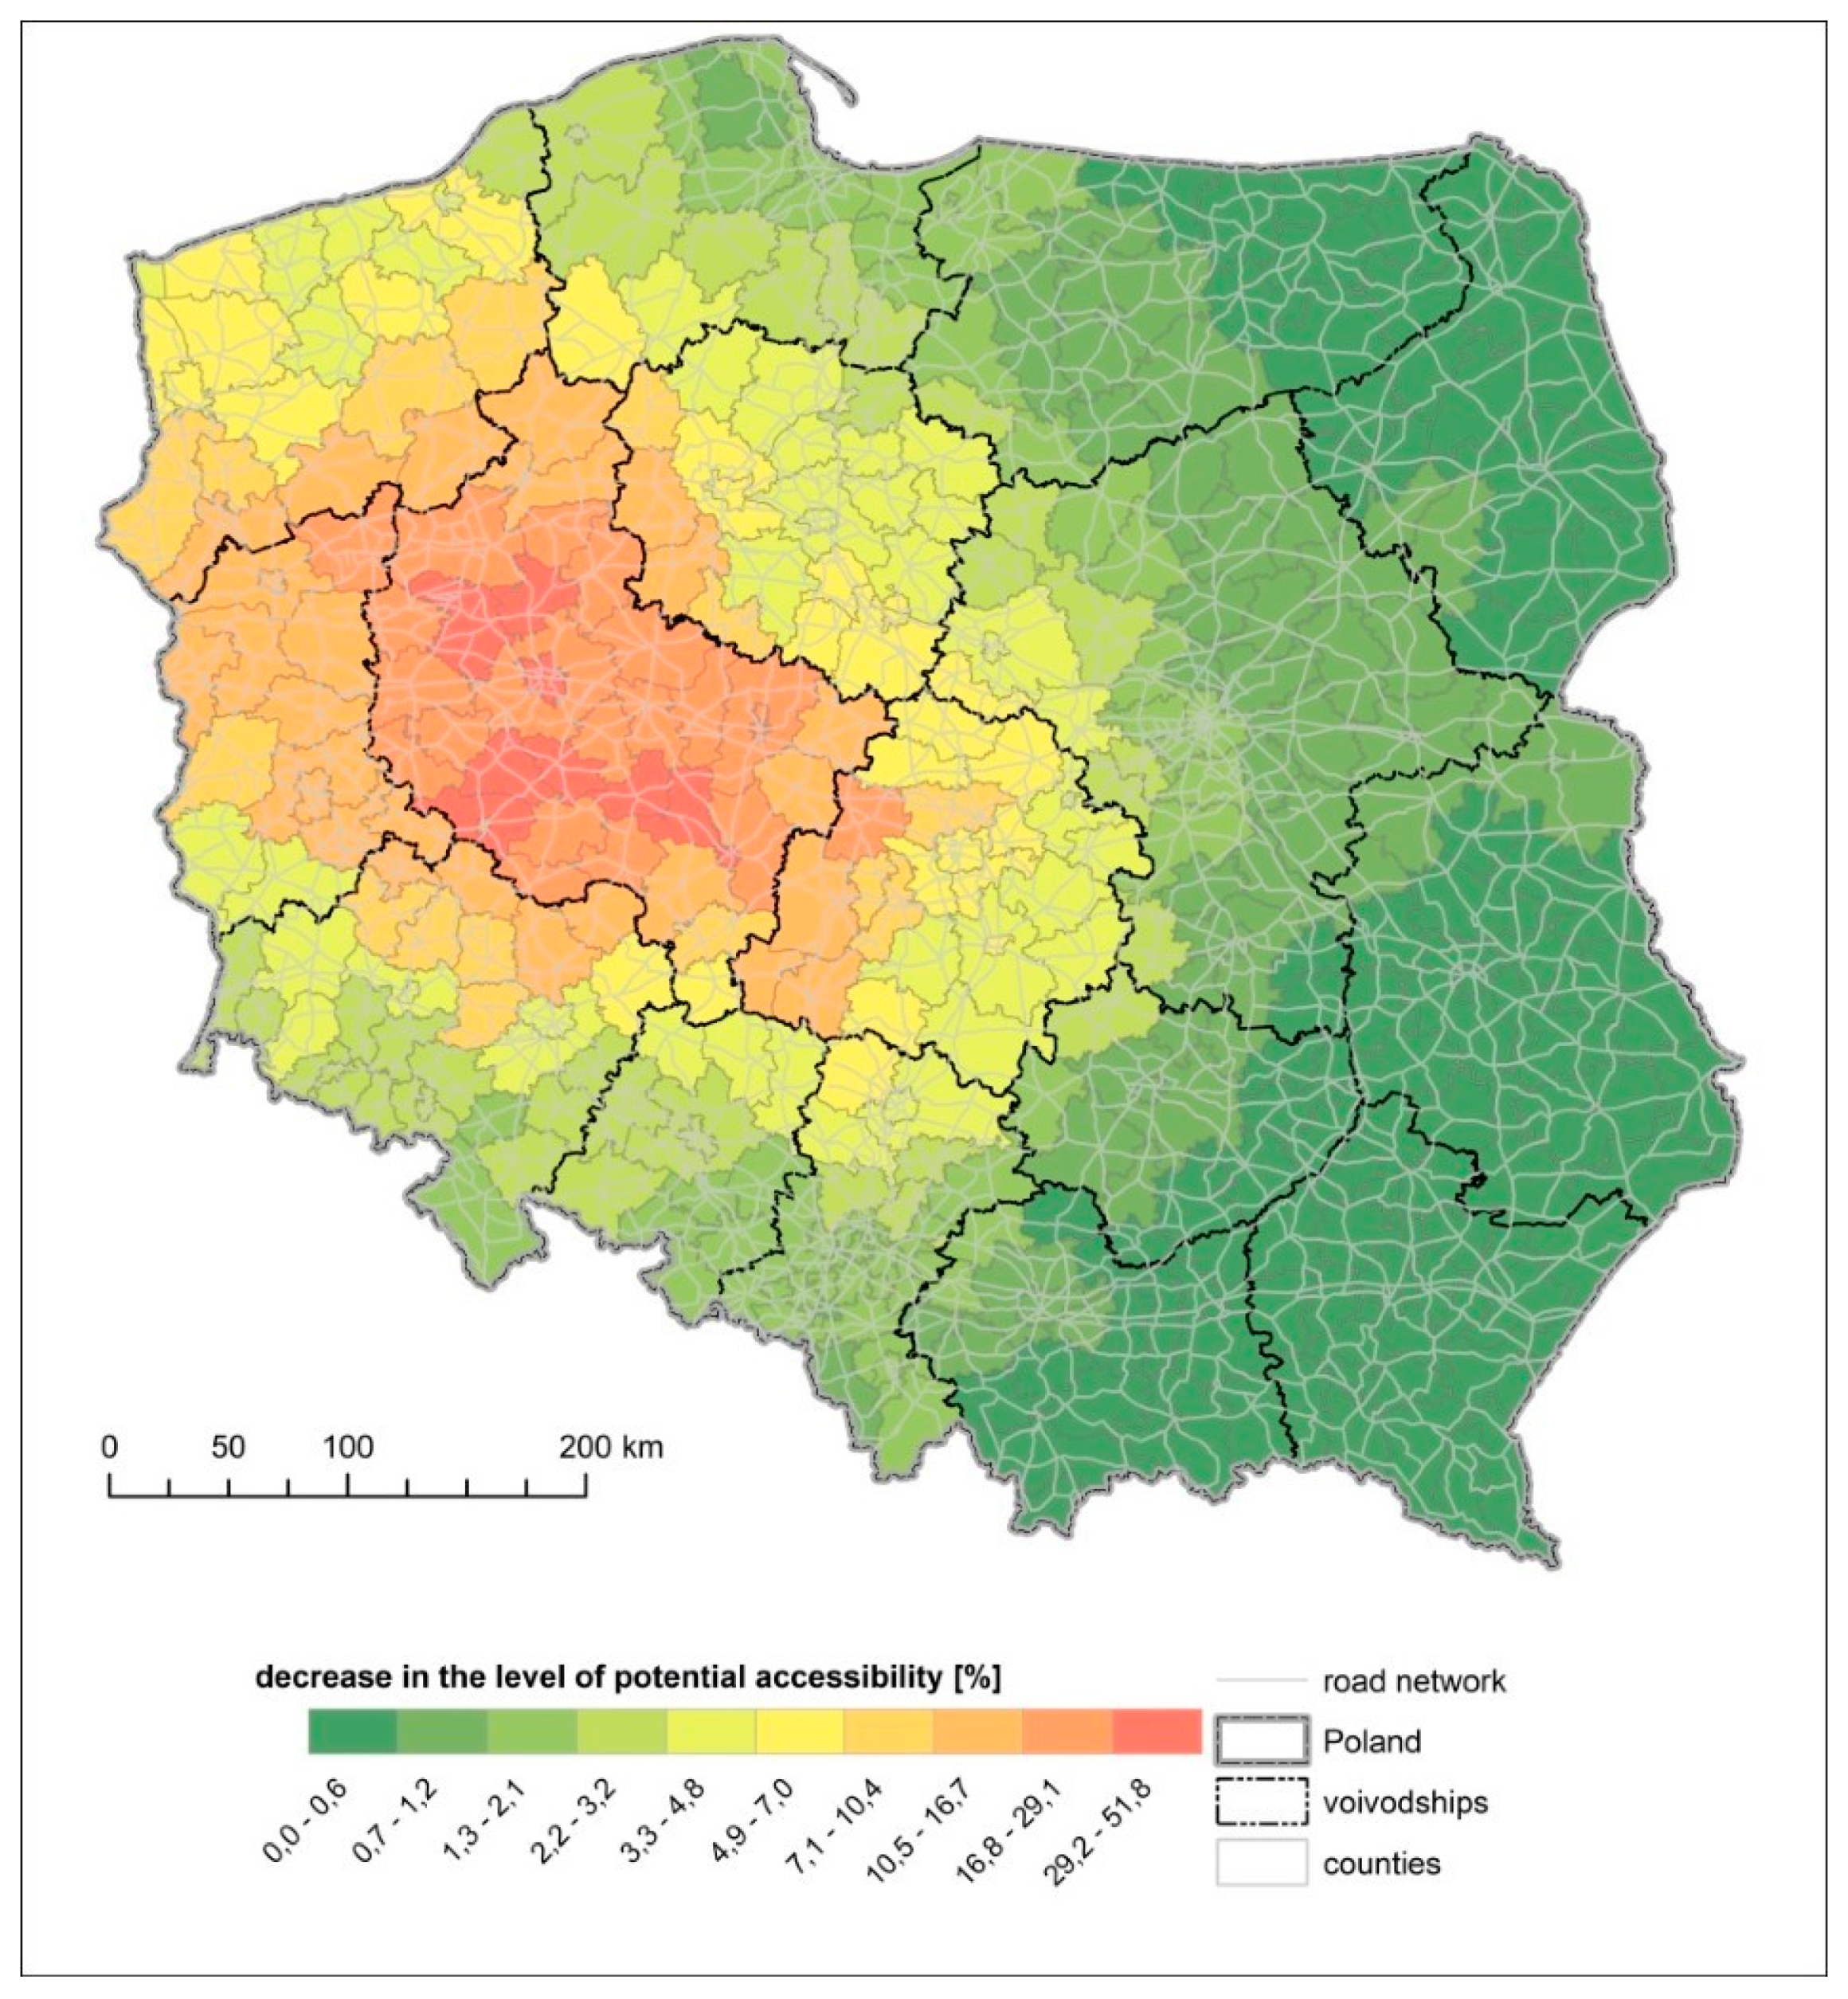
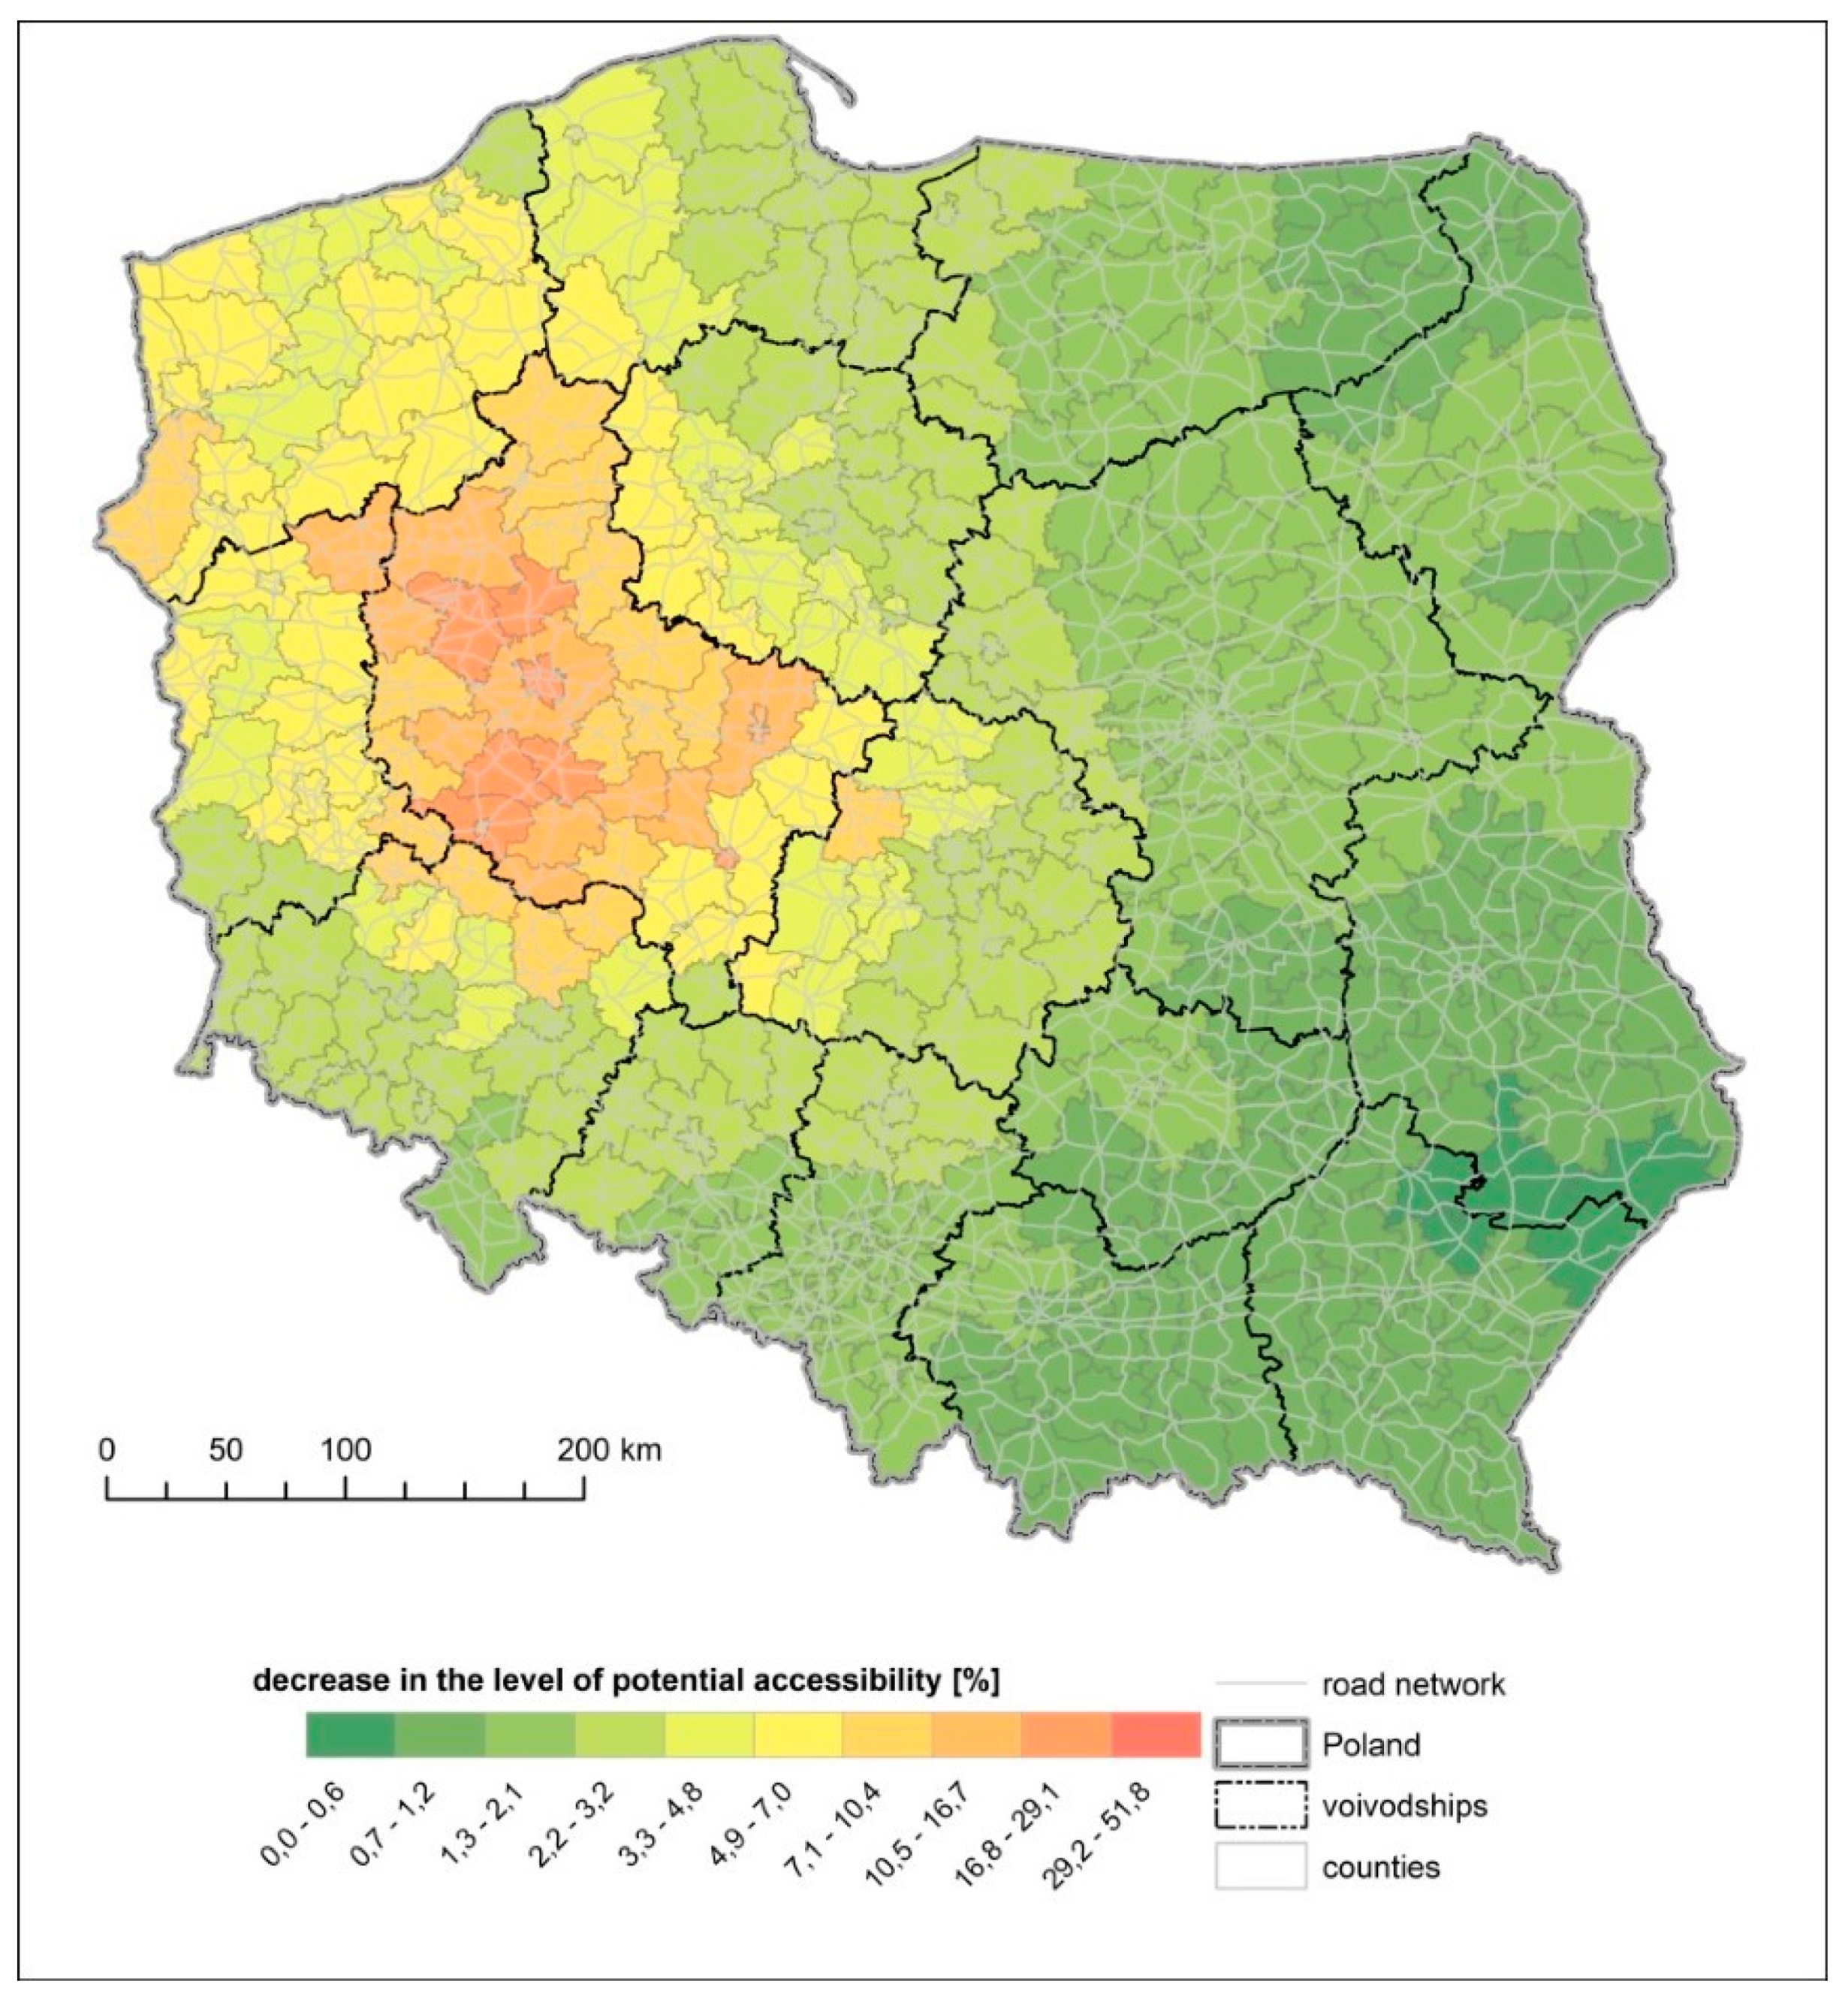
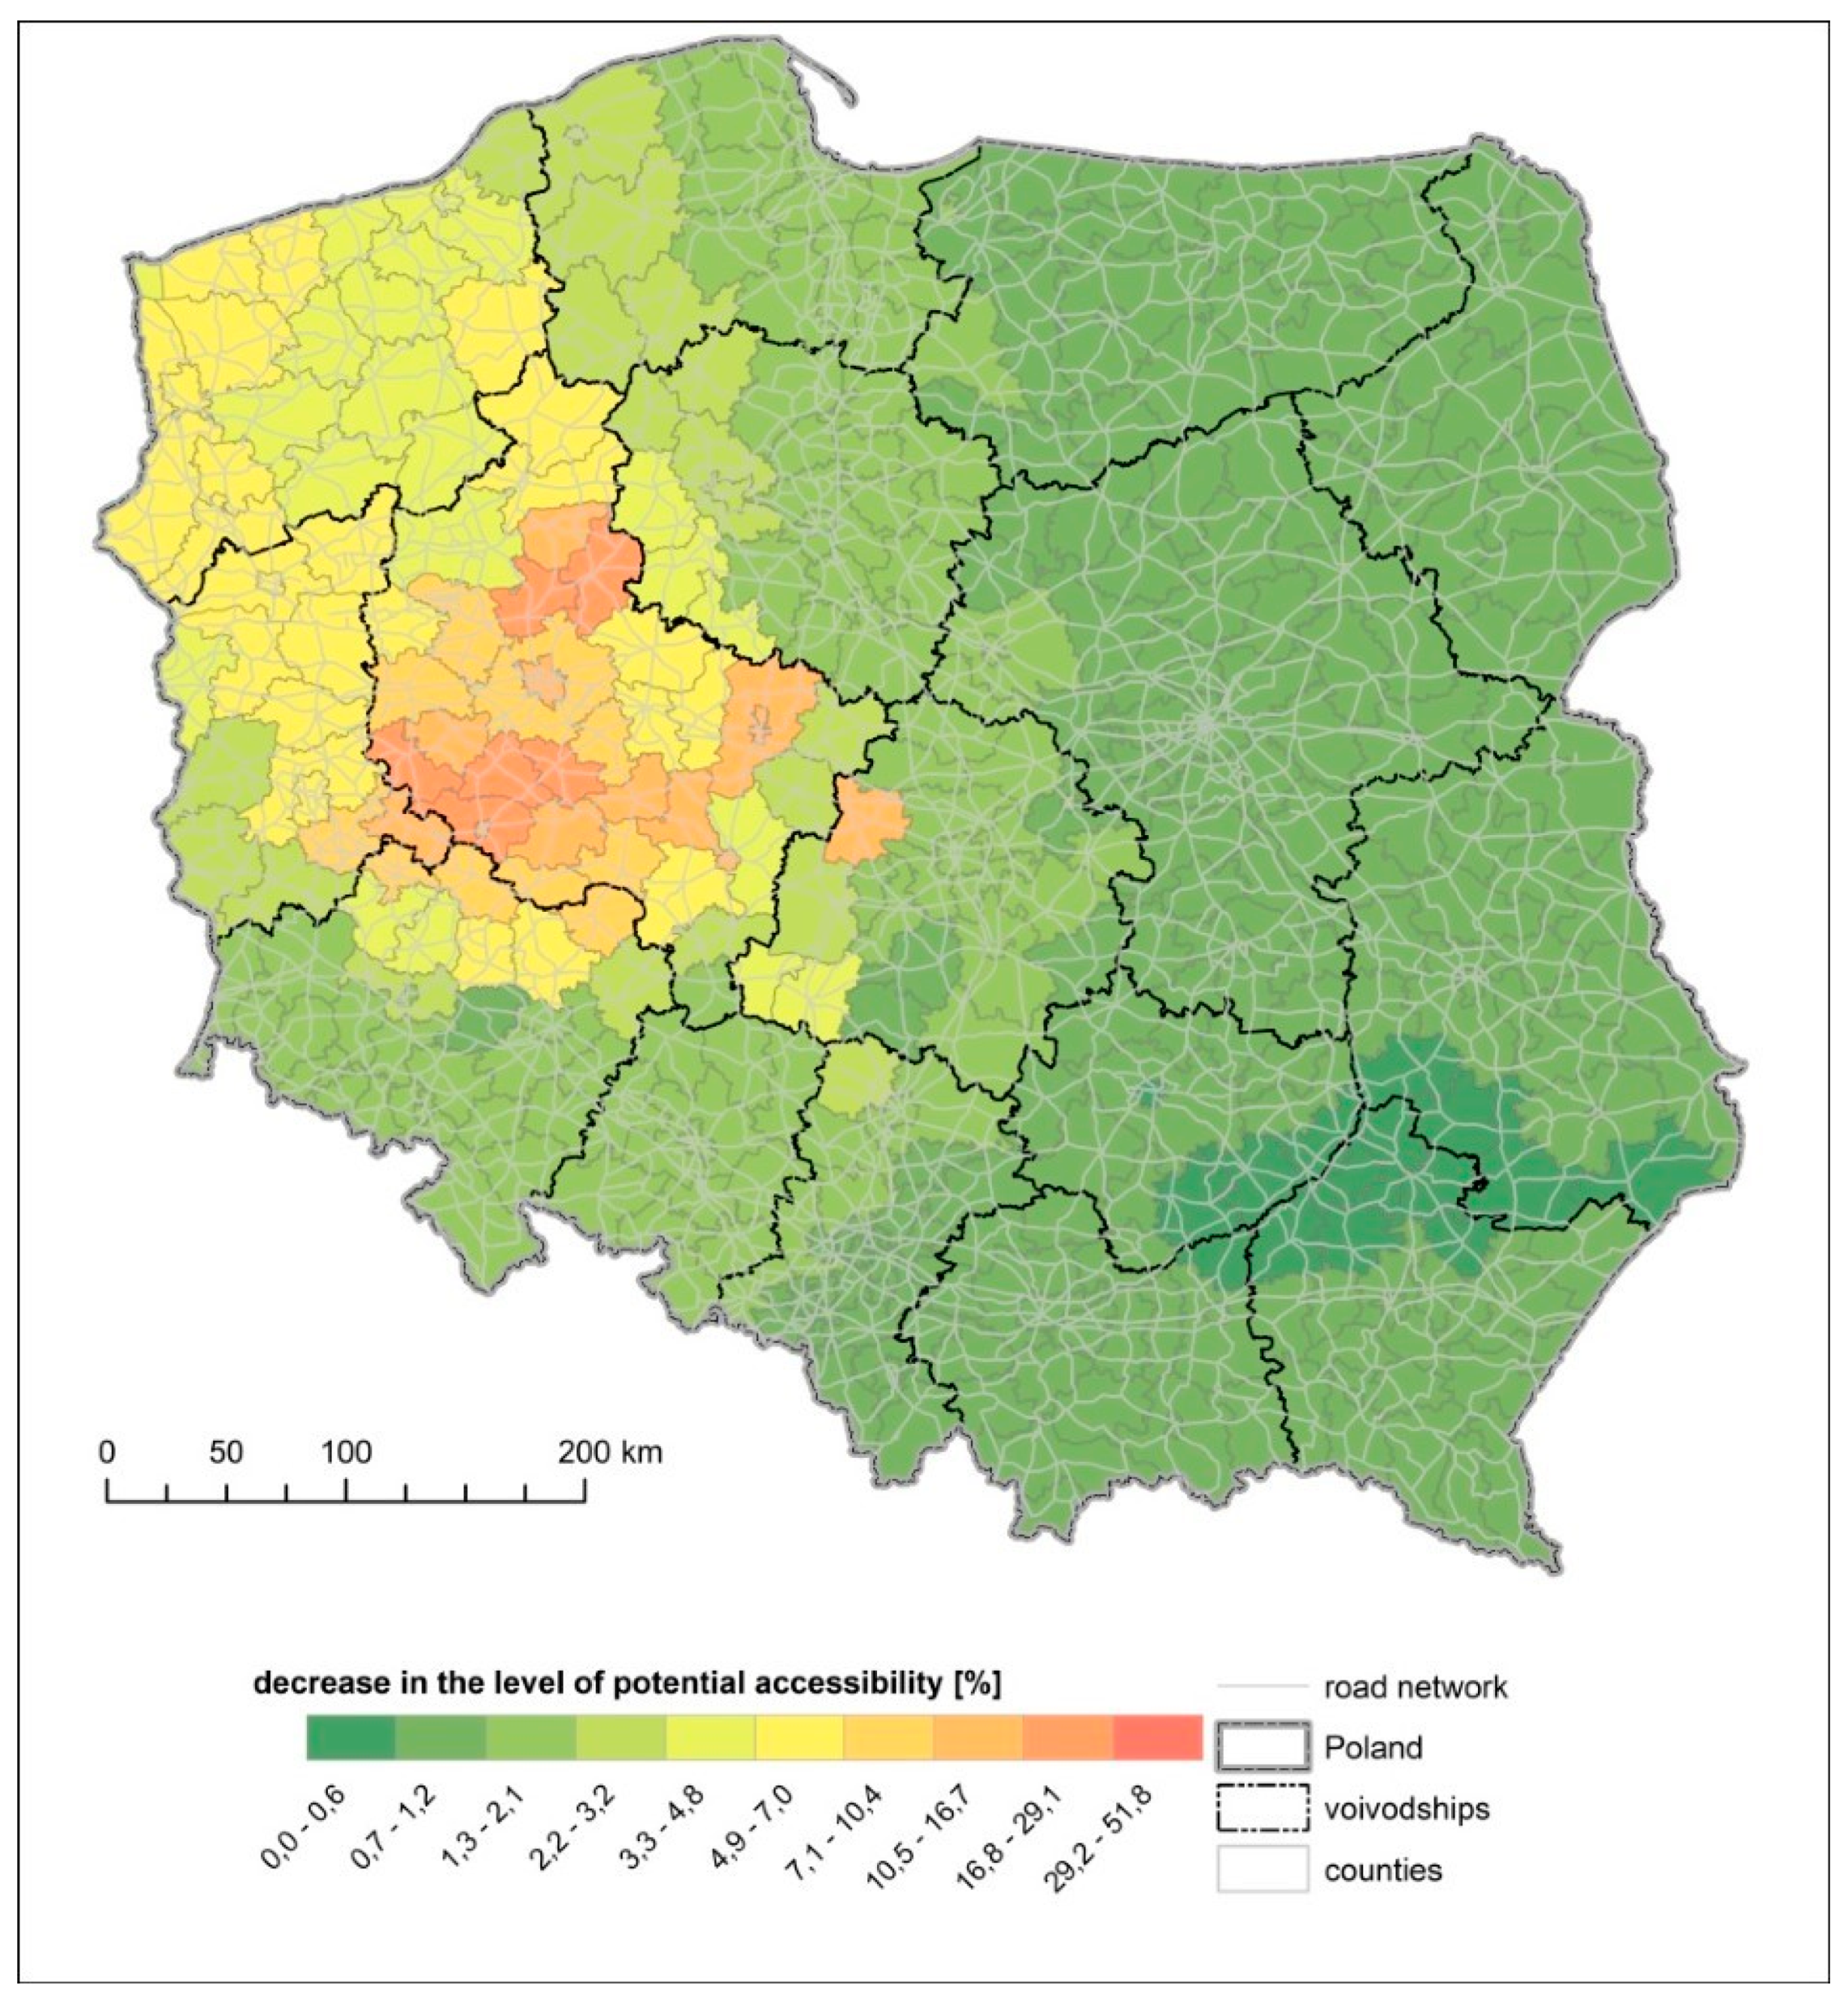
Having calculated the potential accessibility for the scenario with a flood (a one-hundred-year flood) and without a flood (base variant), we determined the difference in accessibility, which allowed us to present the vulnerability of the regional transport network to this natural disaster.
4. Conclusions
The main purpose of the article was to develop a method for researching accessibility in the event of a flood combined with the application of measurement based on mobility. It was assumed that changes in mobility (and the related travel speed) were so significant to accessibility in unusual circumstances that it was imperative to include them.
The application of research on mobility and accessibility – flooding scenarios in particular – indicates the impact that a flood can have on the capacity of the road network. In addition, it also allows for more efficient flood-risk management, which is vital for the analysis of indirect flood damage that is less frequently scrutinised in the literature due to difficulties in their assessment [
79]. Our study showed that the occurrence of a flood may cause indirect damages by diminishing the level of potential accessibility (i.e., the type of accessibility that most aptly demonstrates relationships between spatial management and transport) over a relatively large area, which quite commonly extended beyond the territories of river valleys (and even lowland water regions).
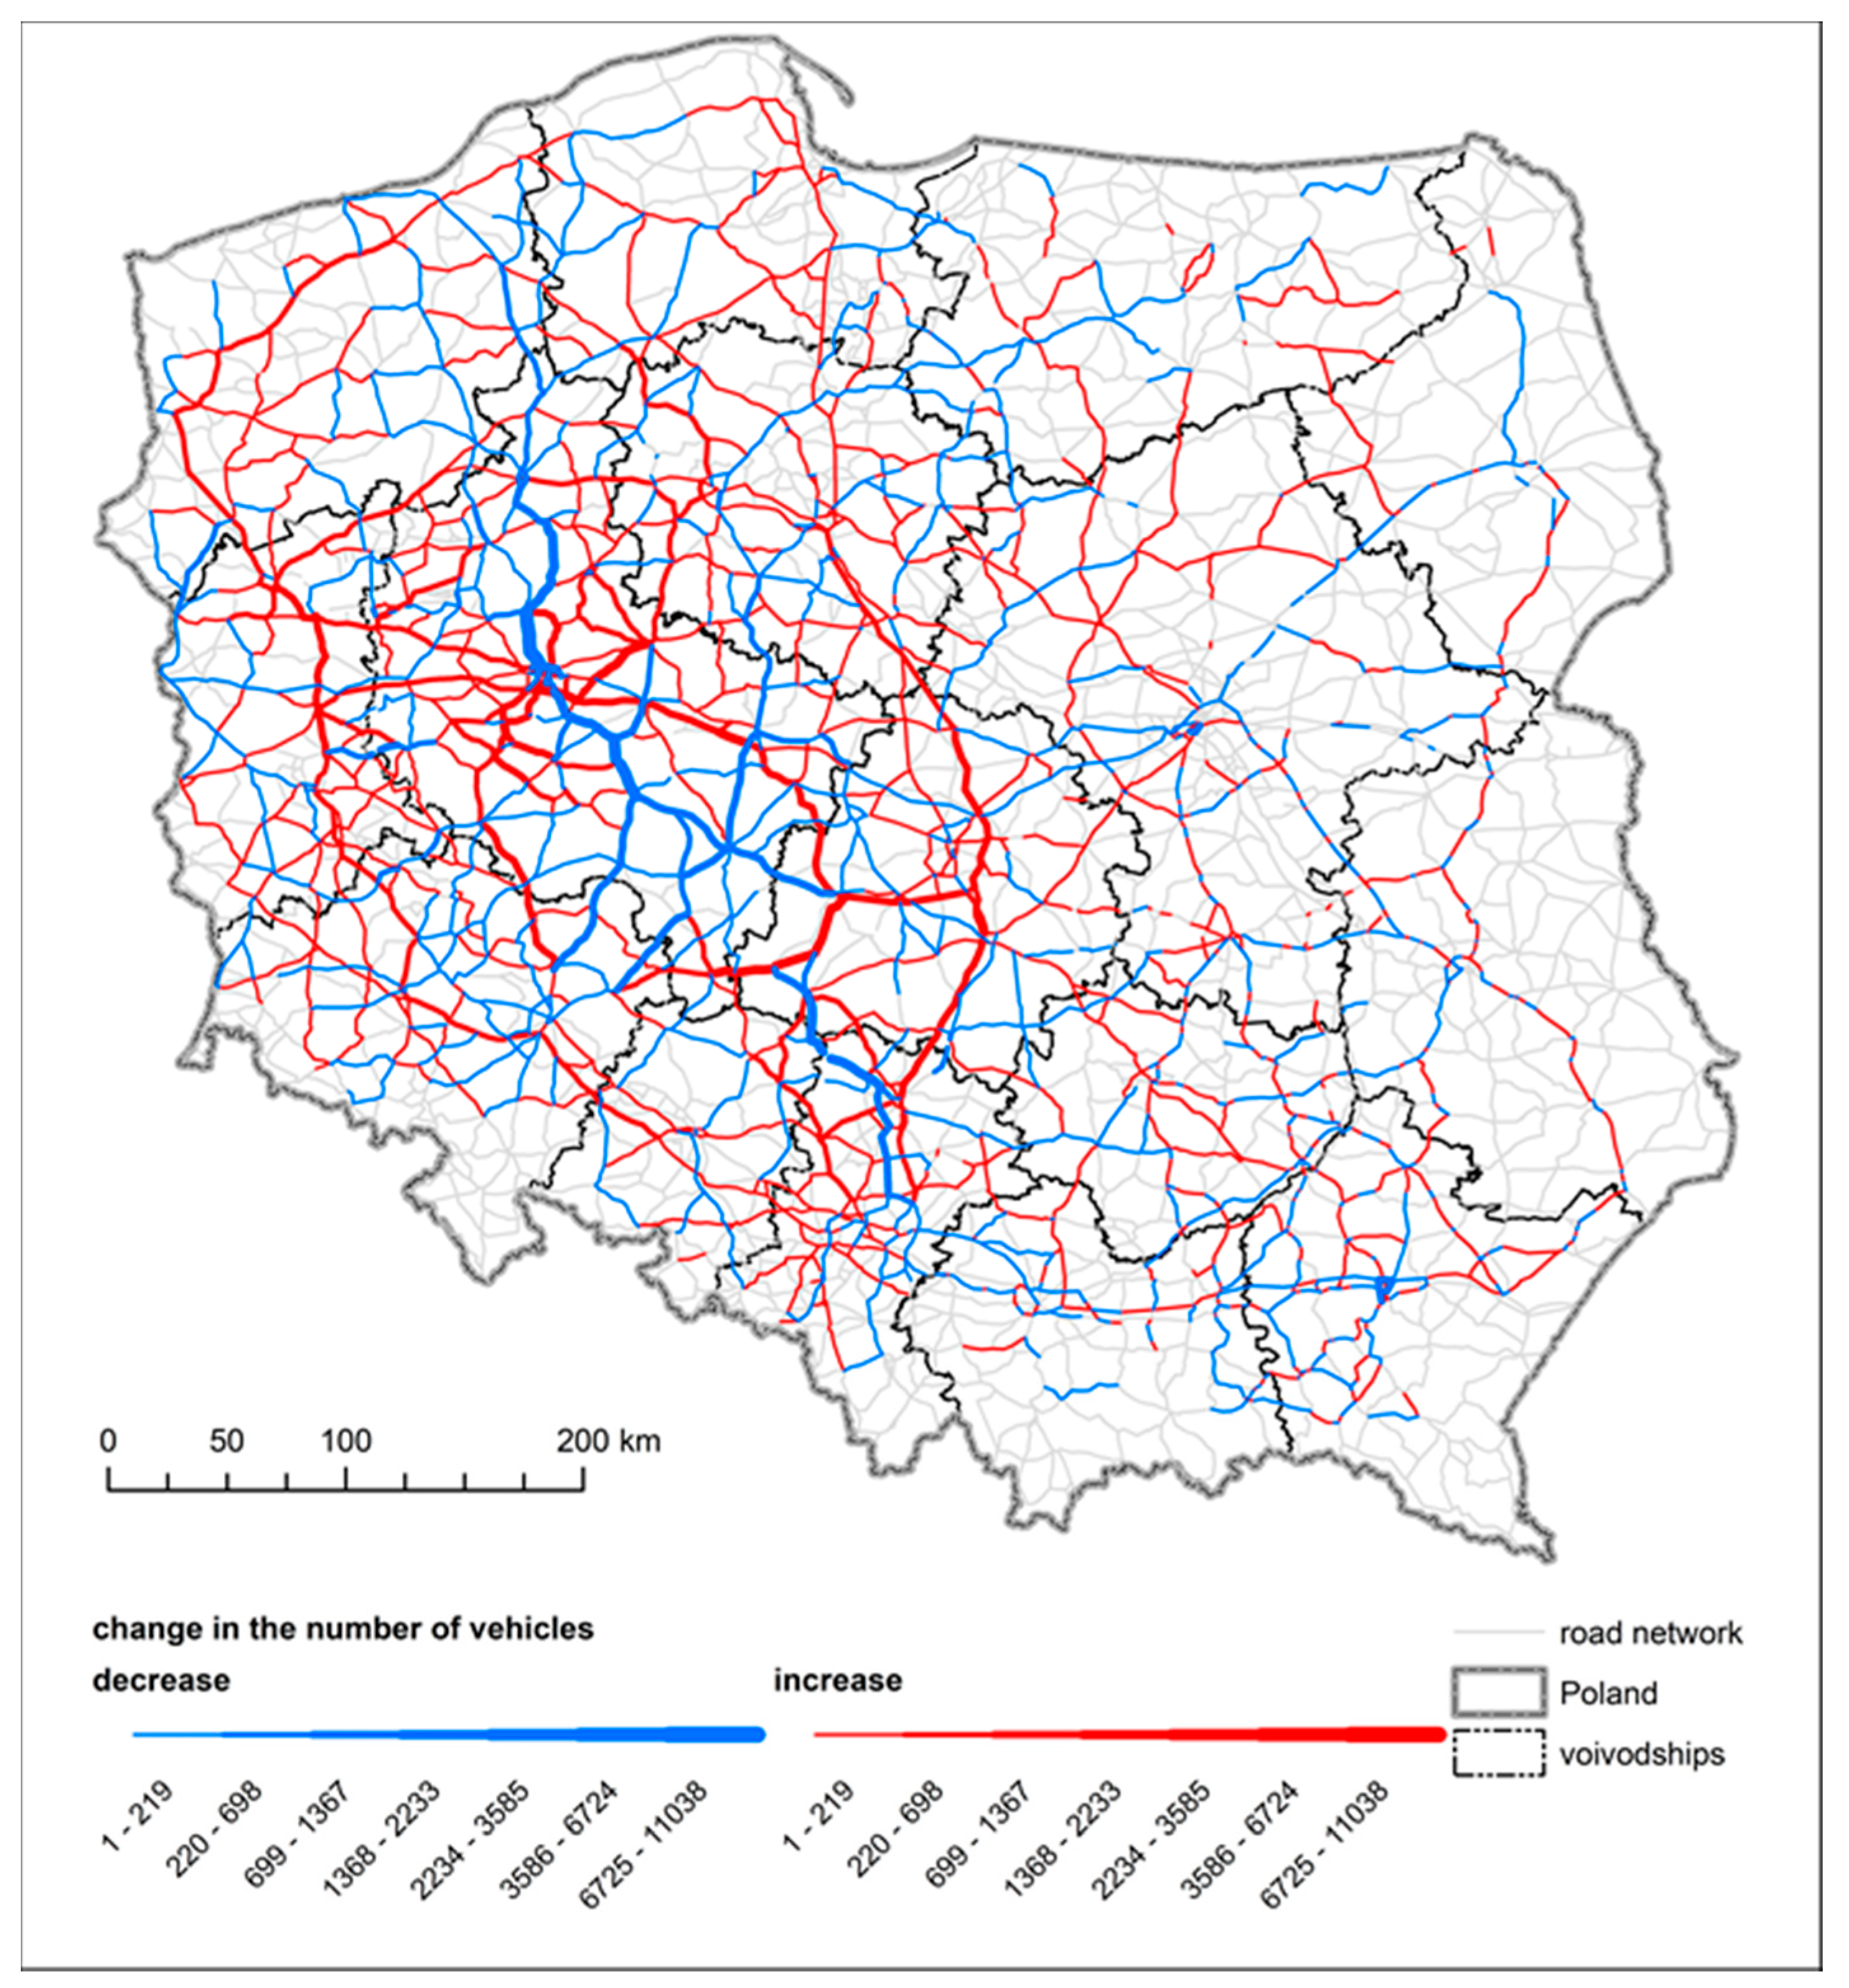
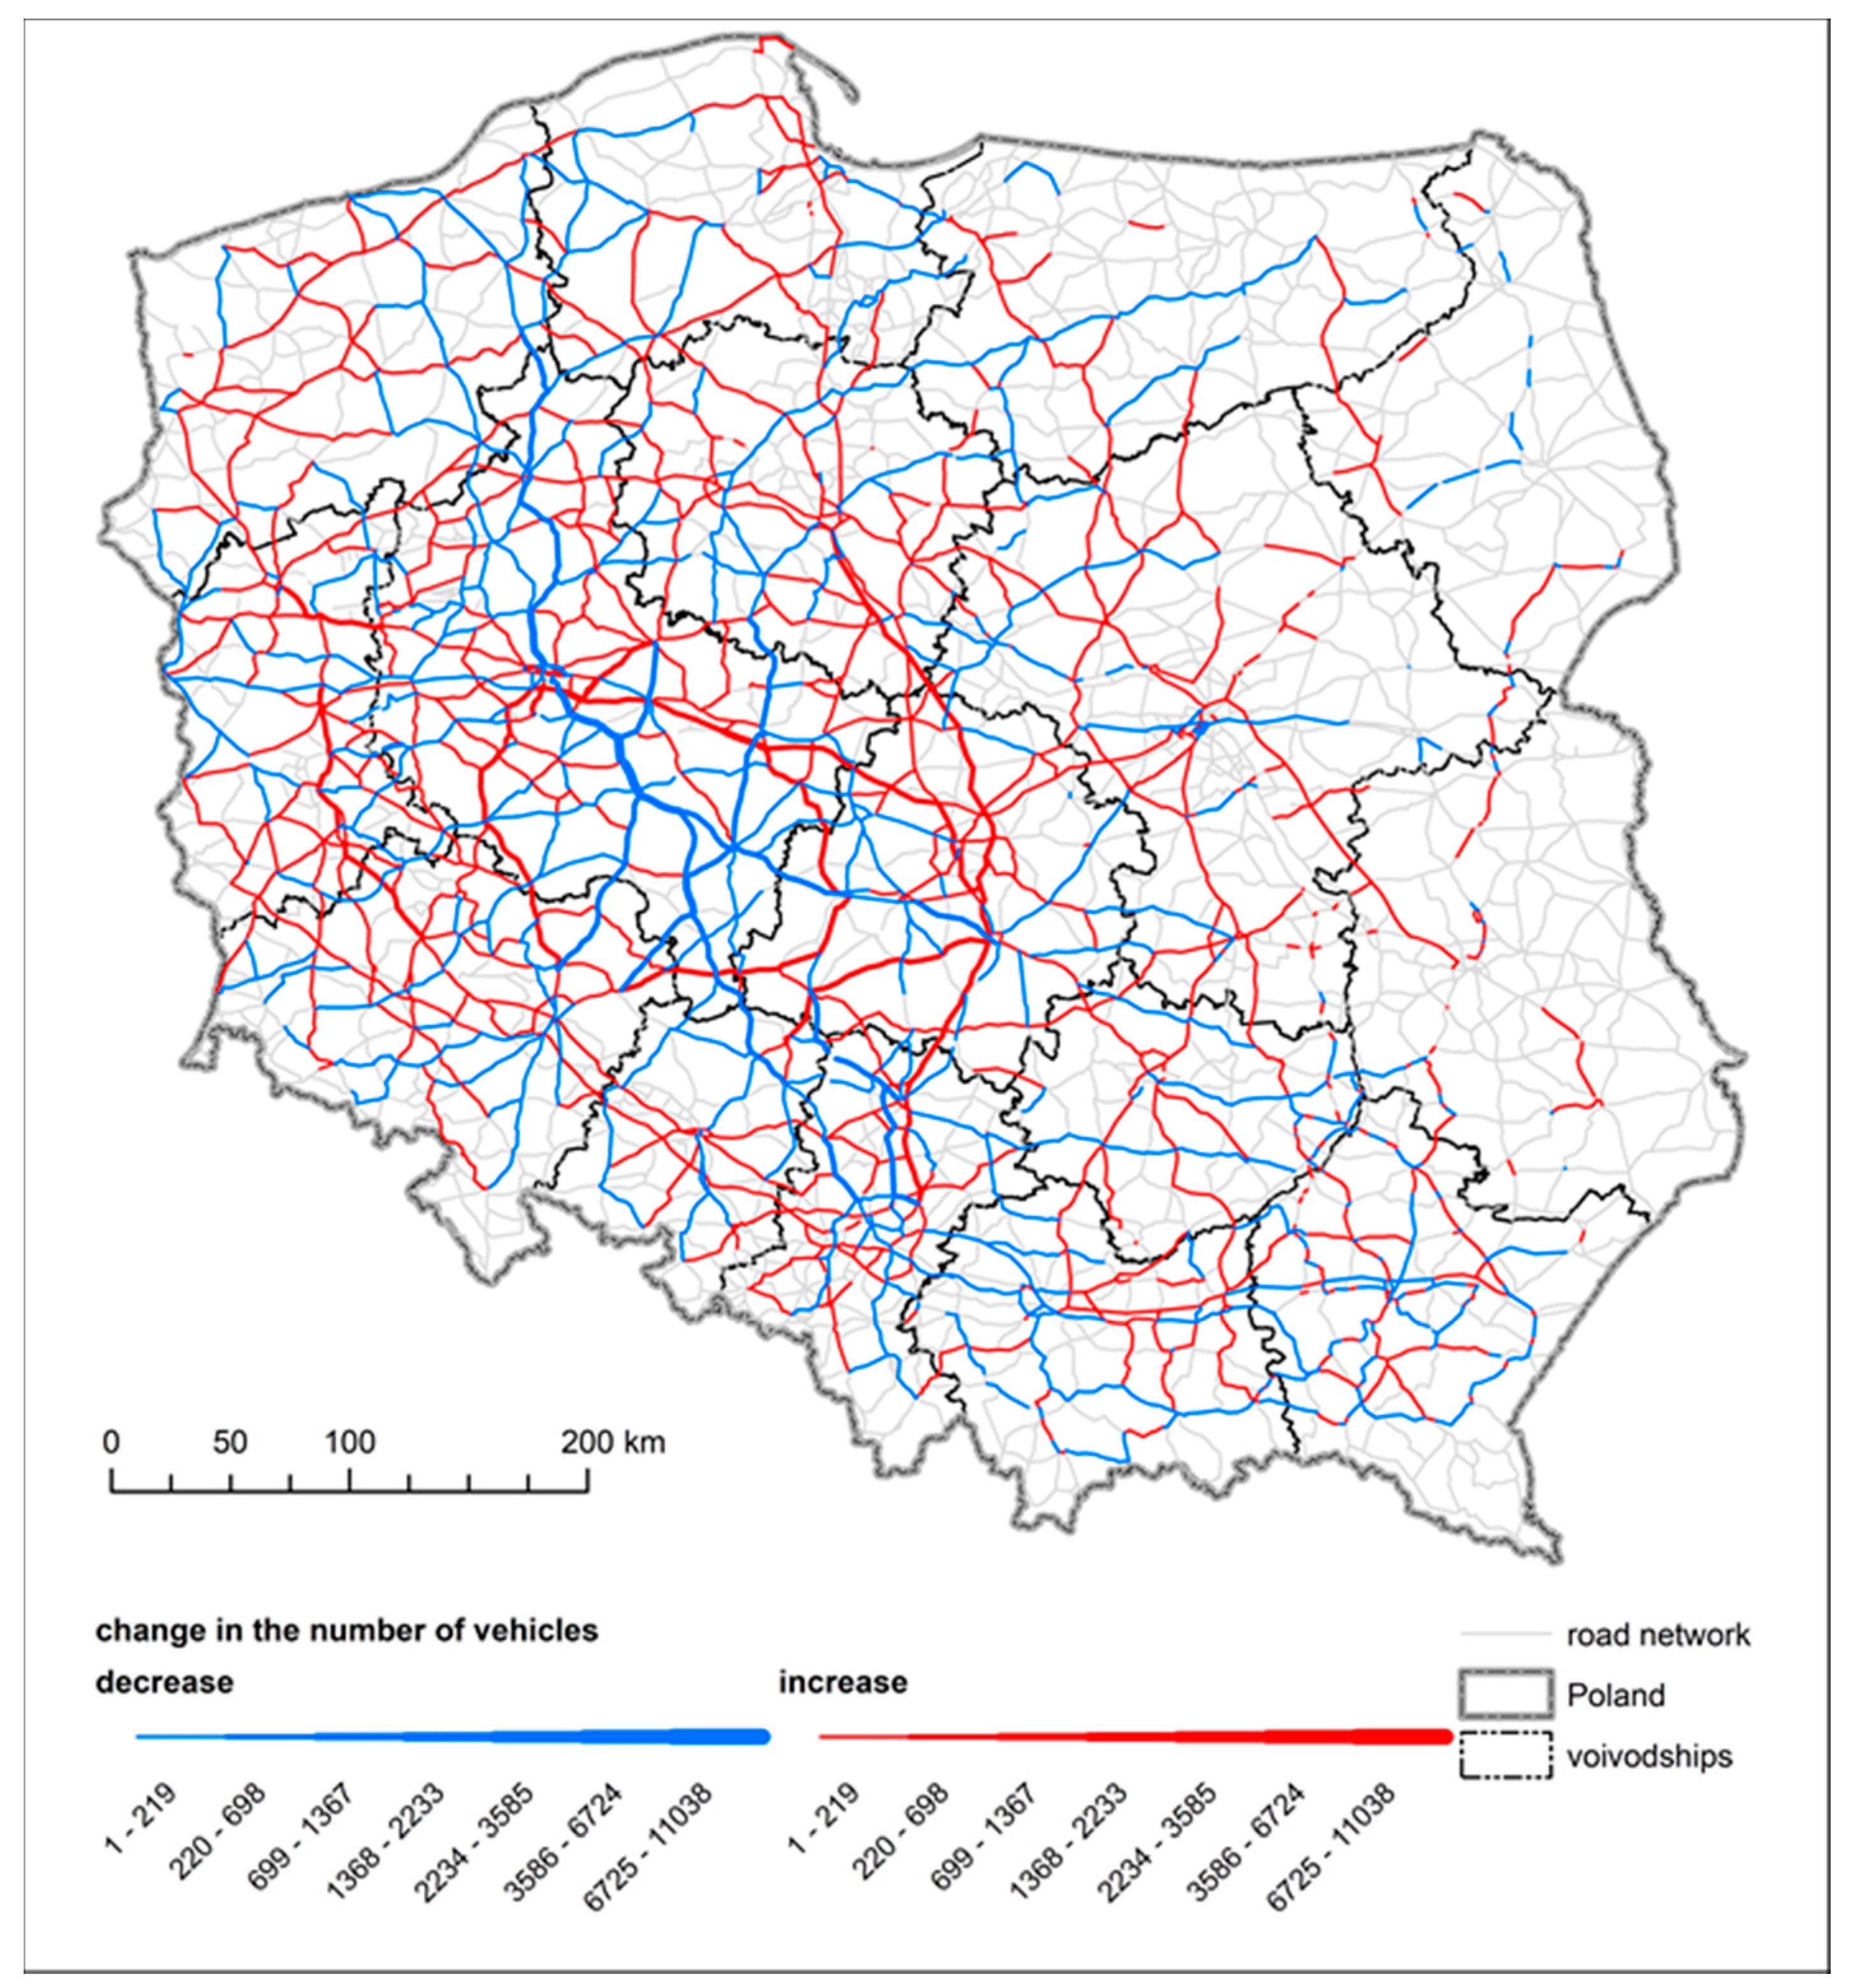
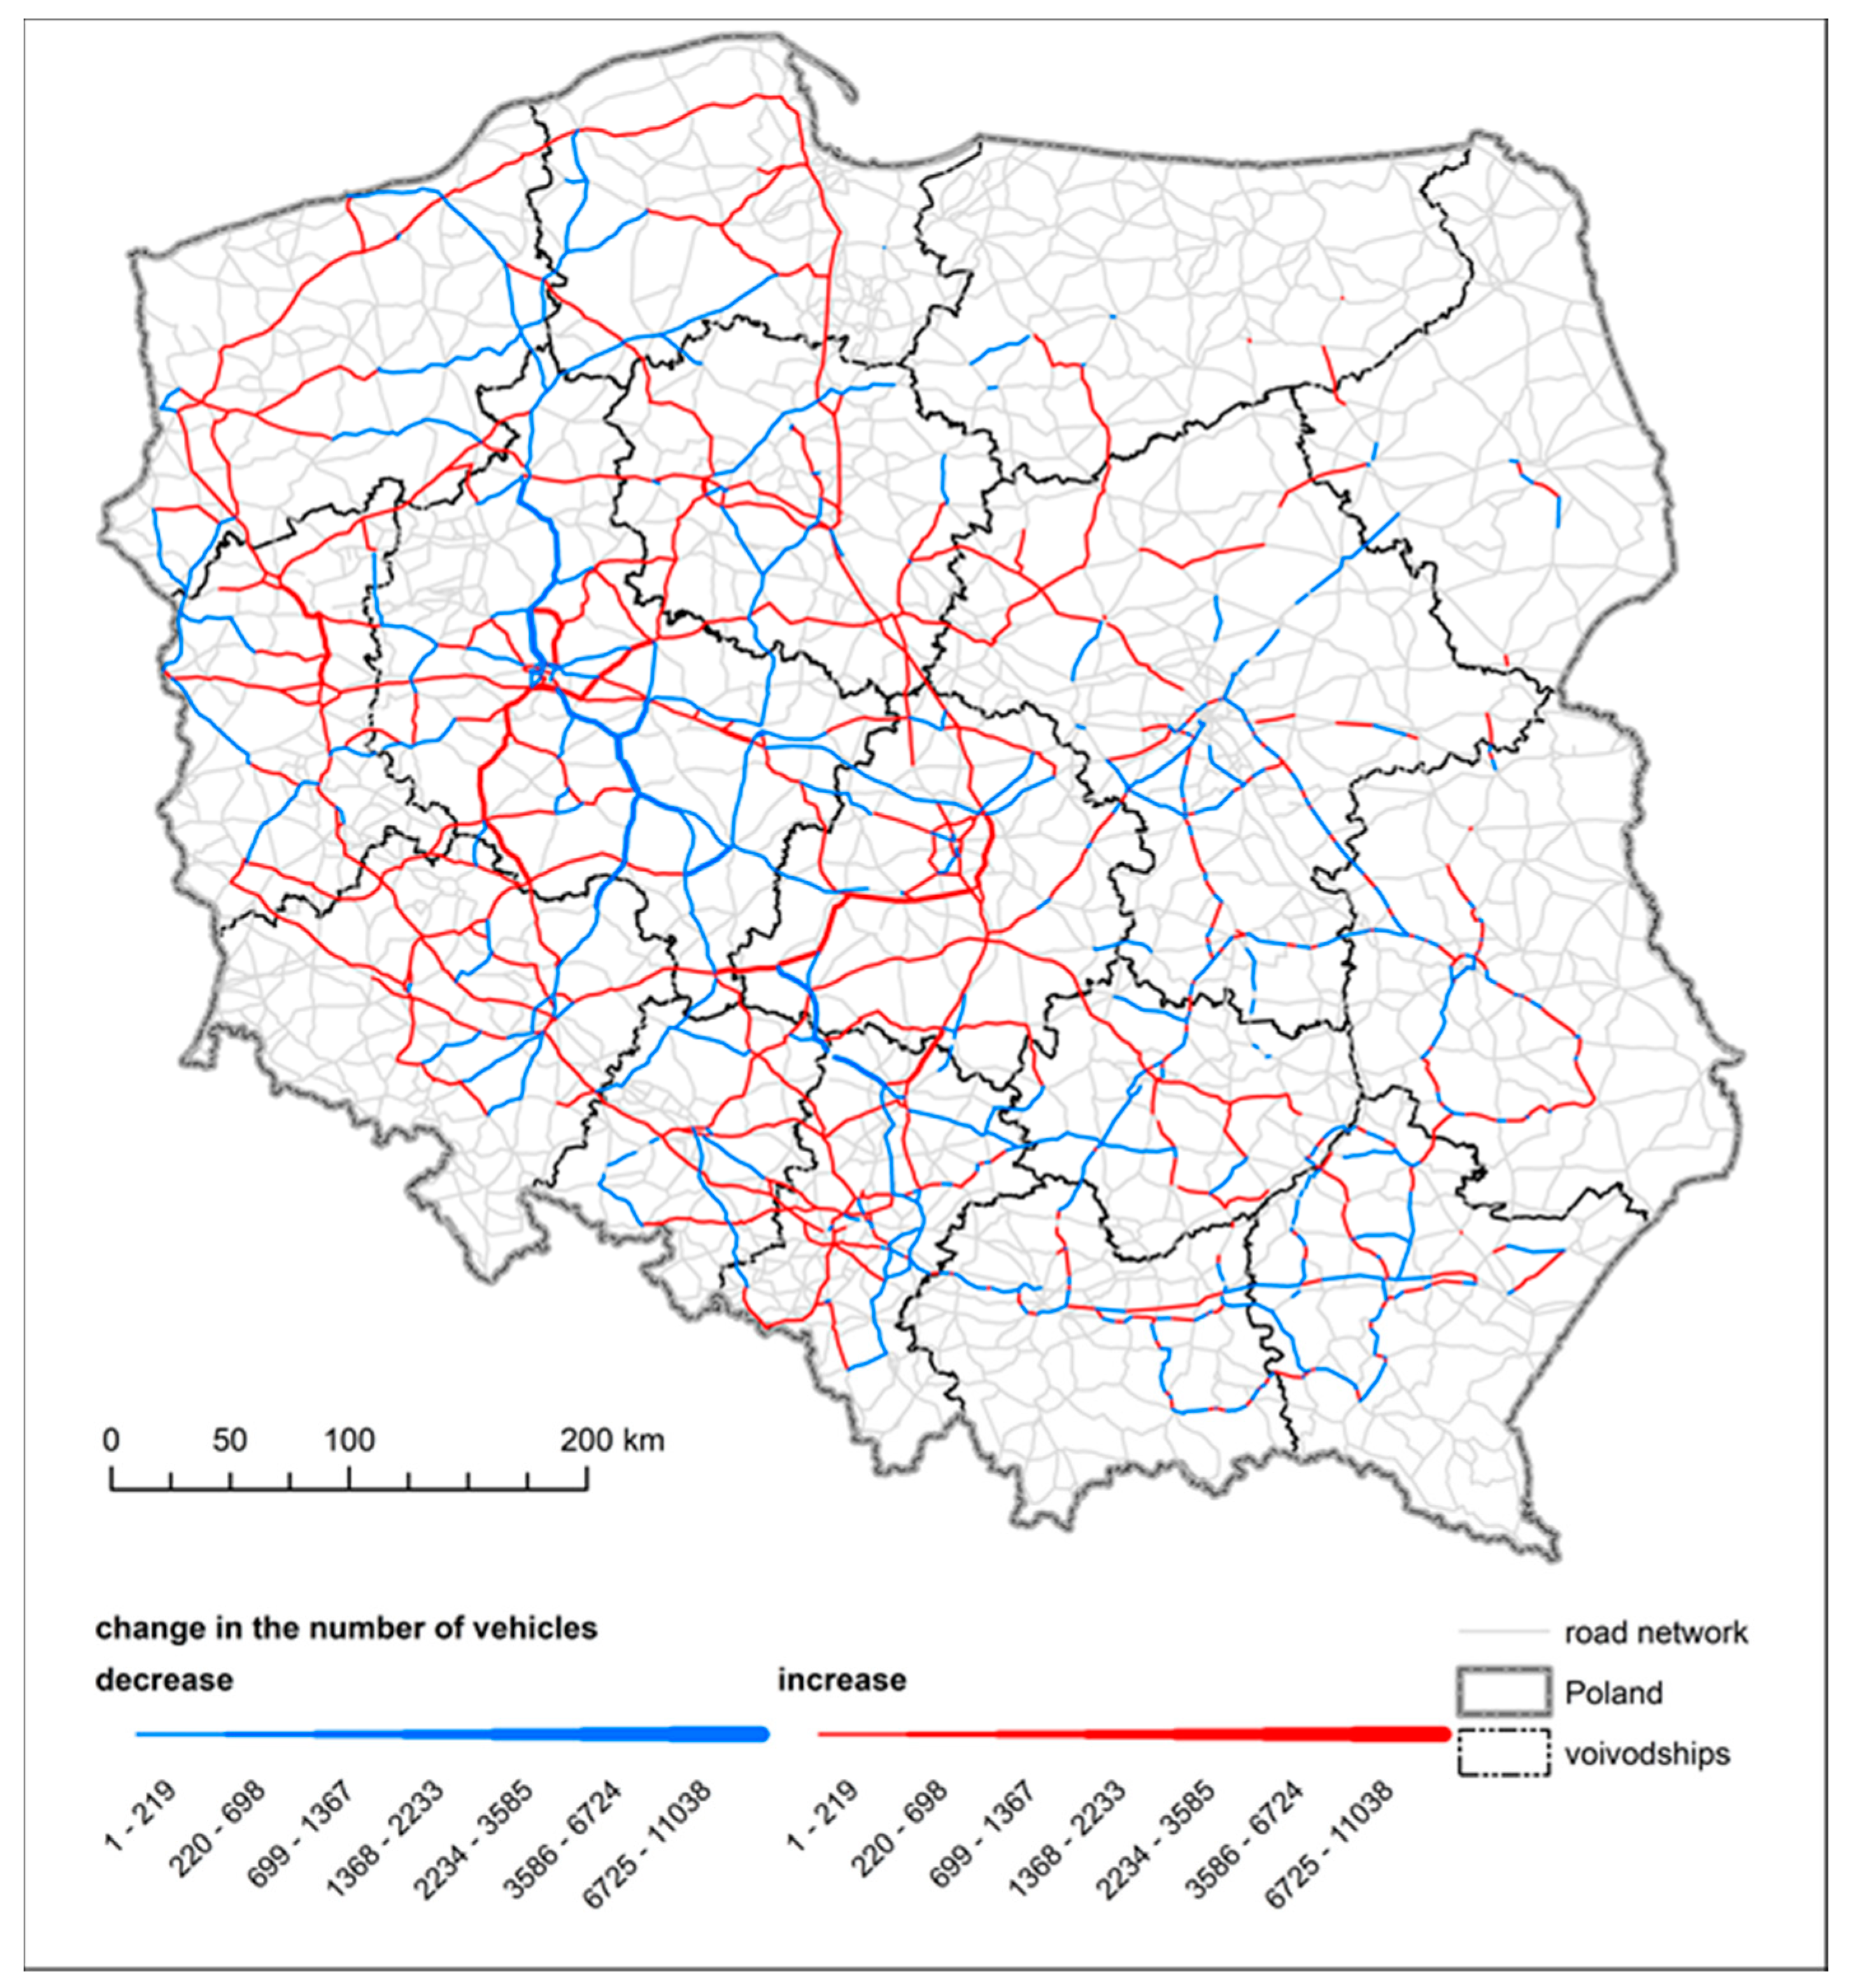
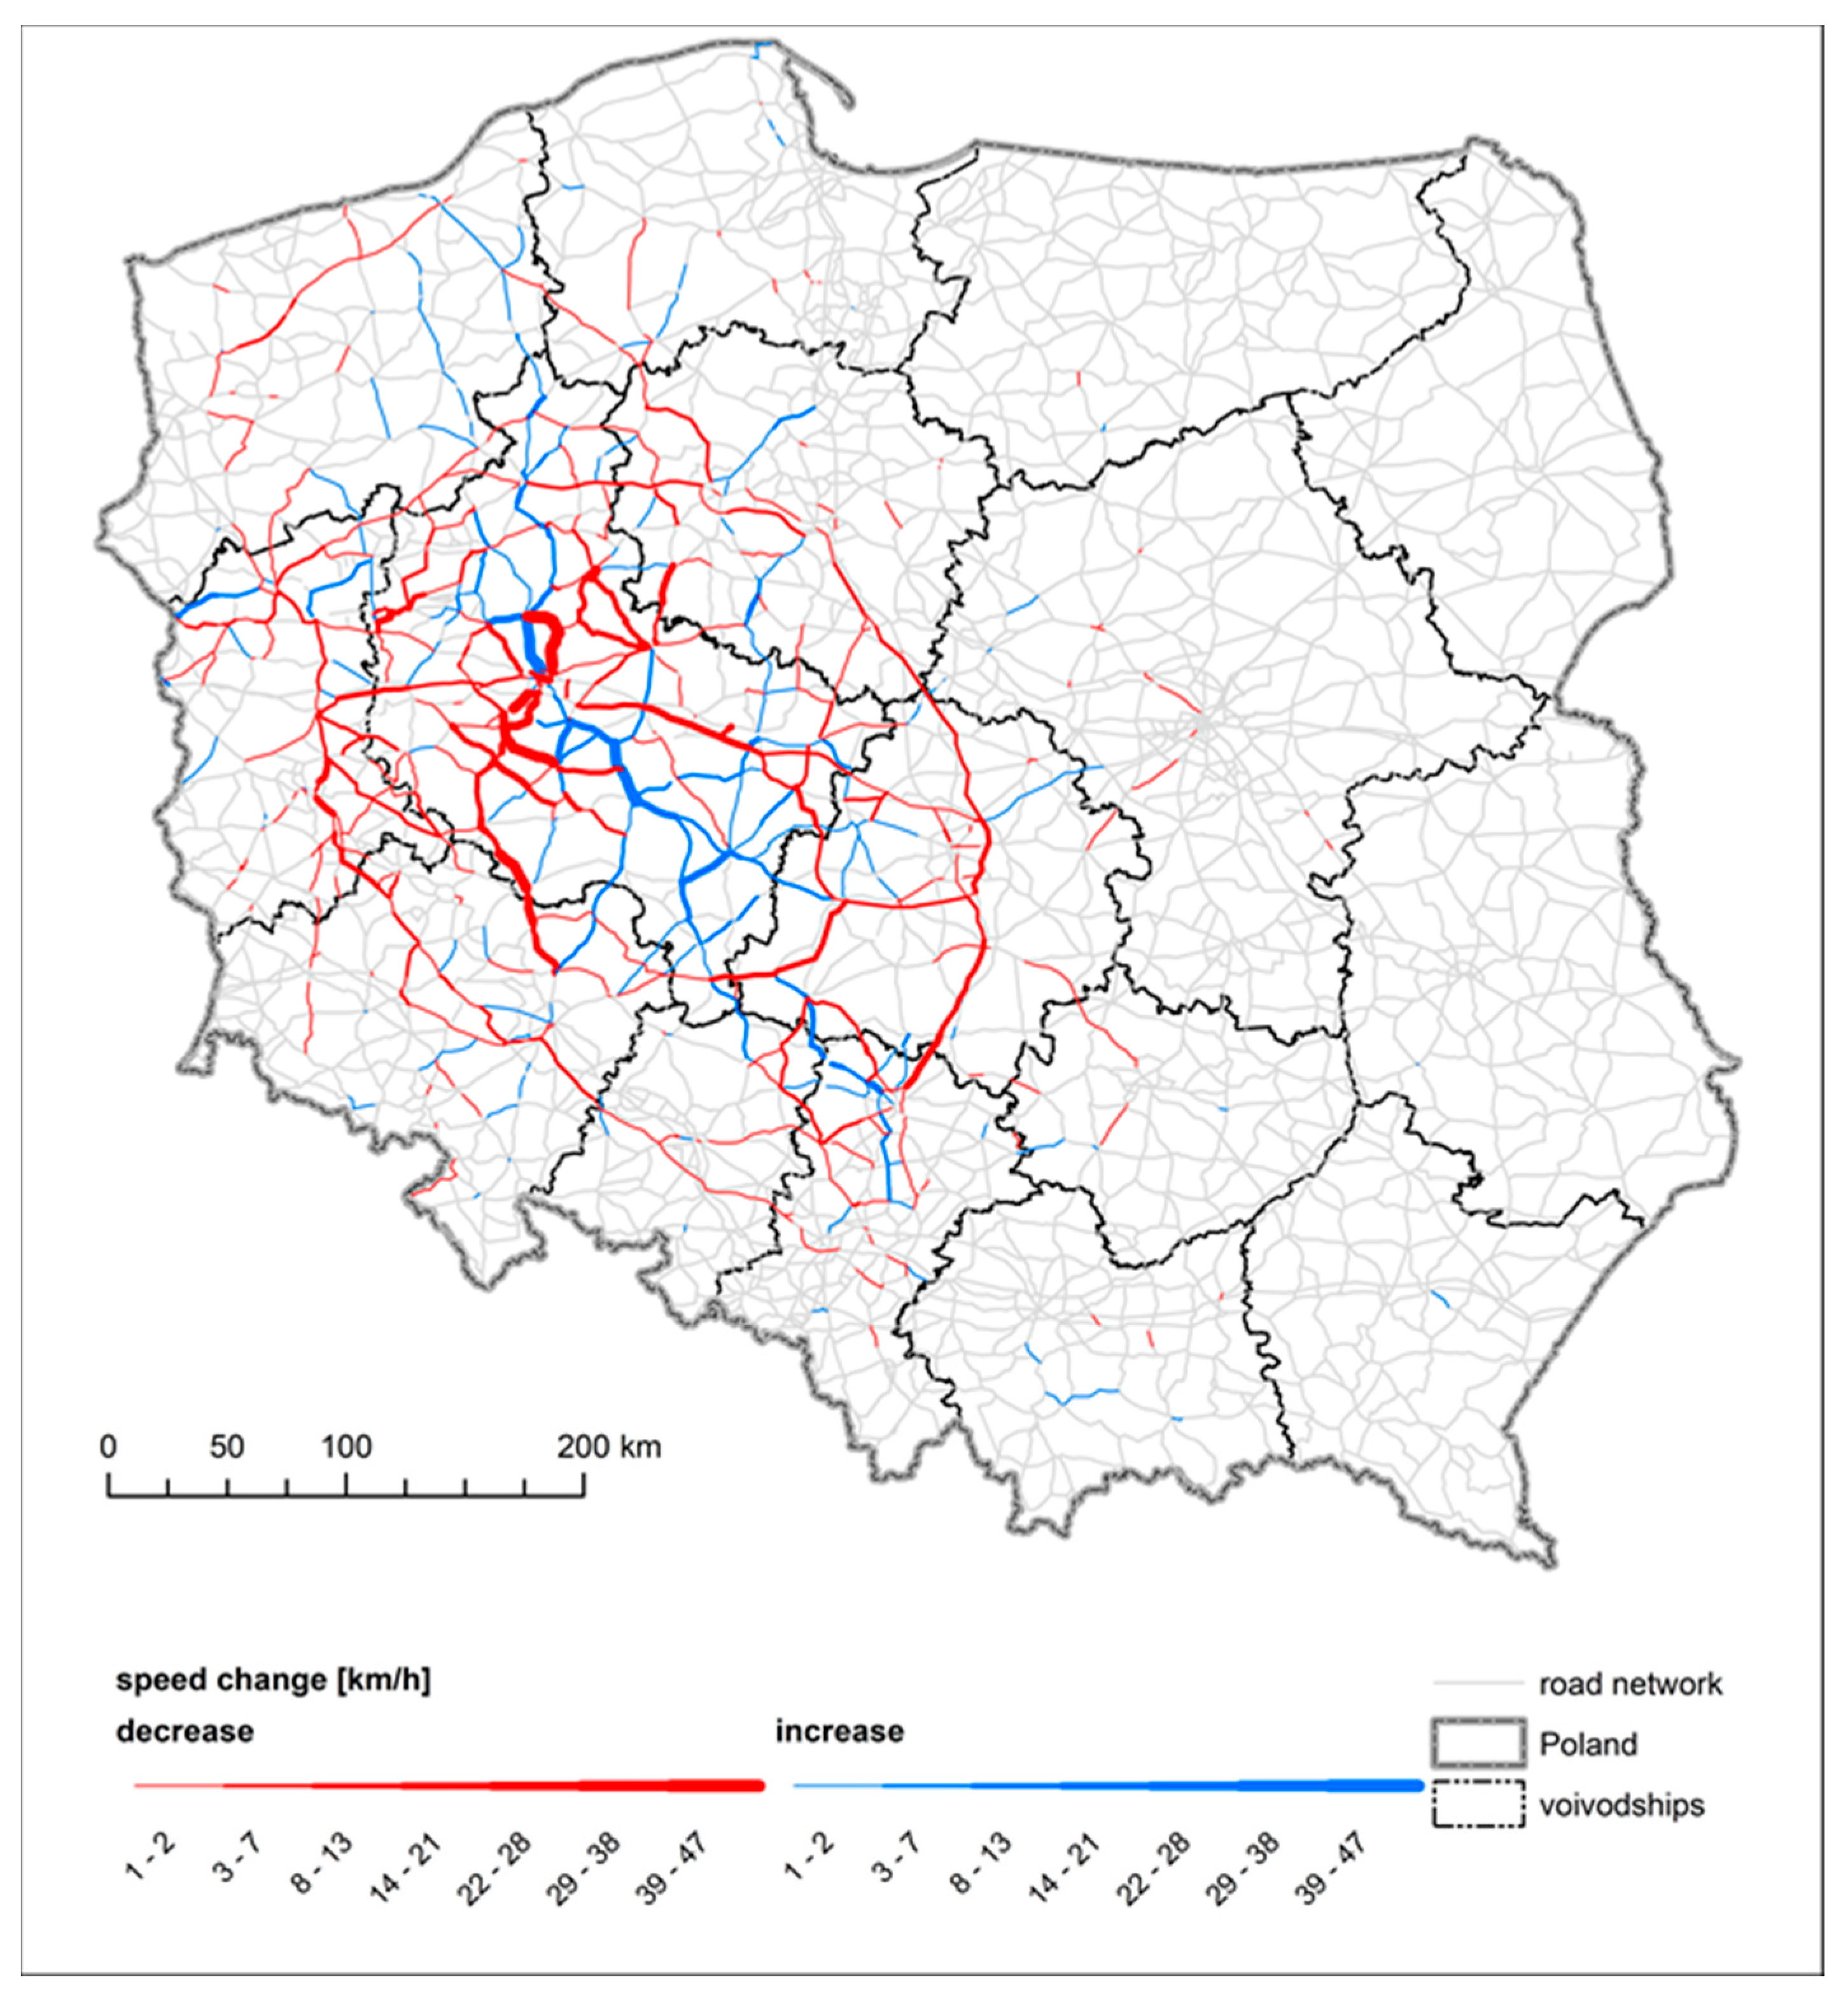
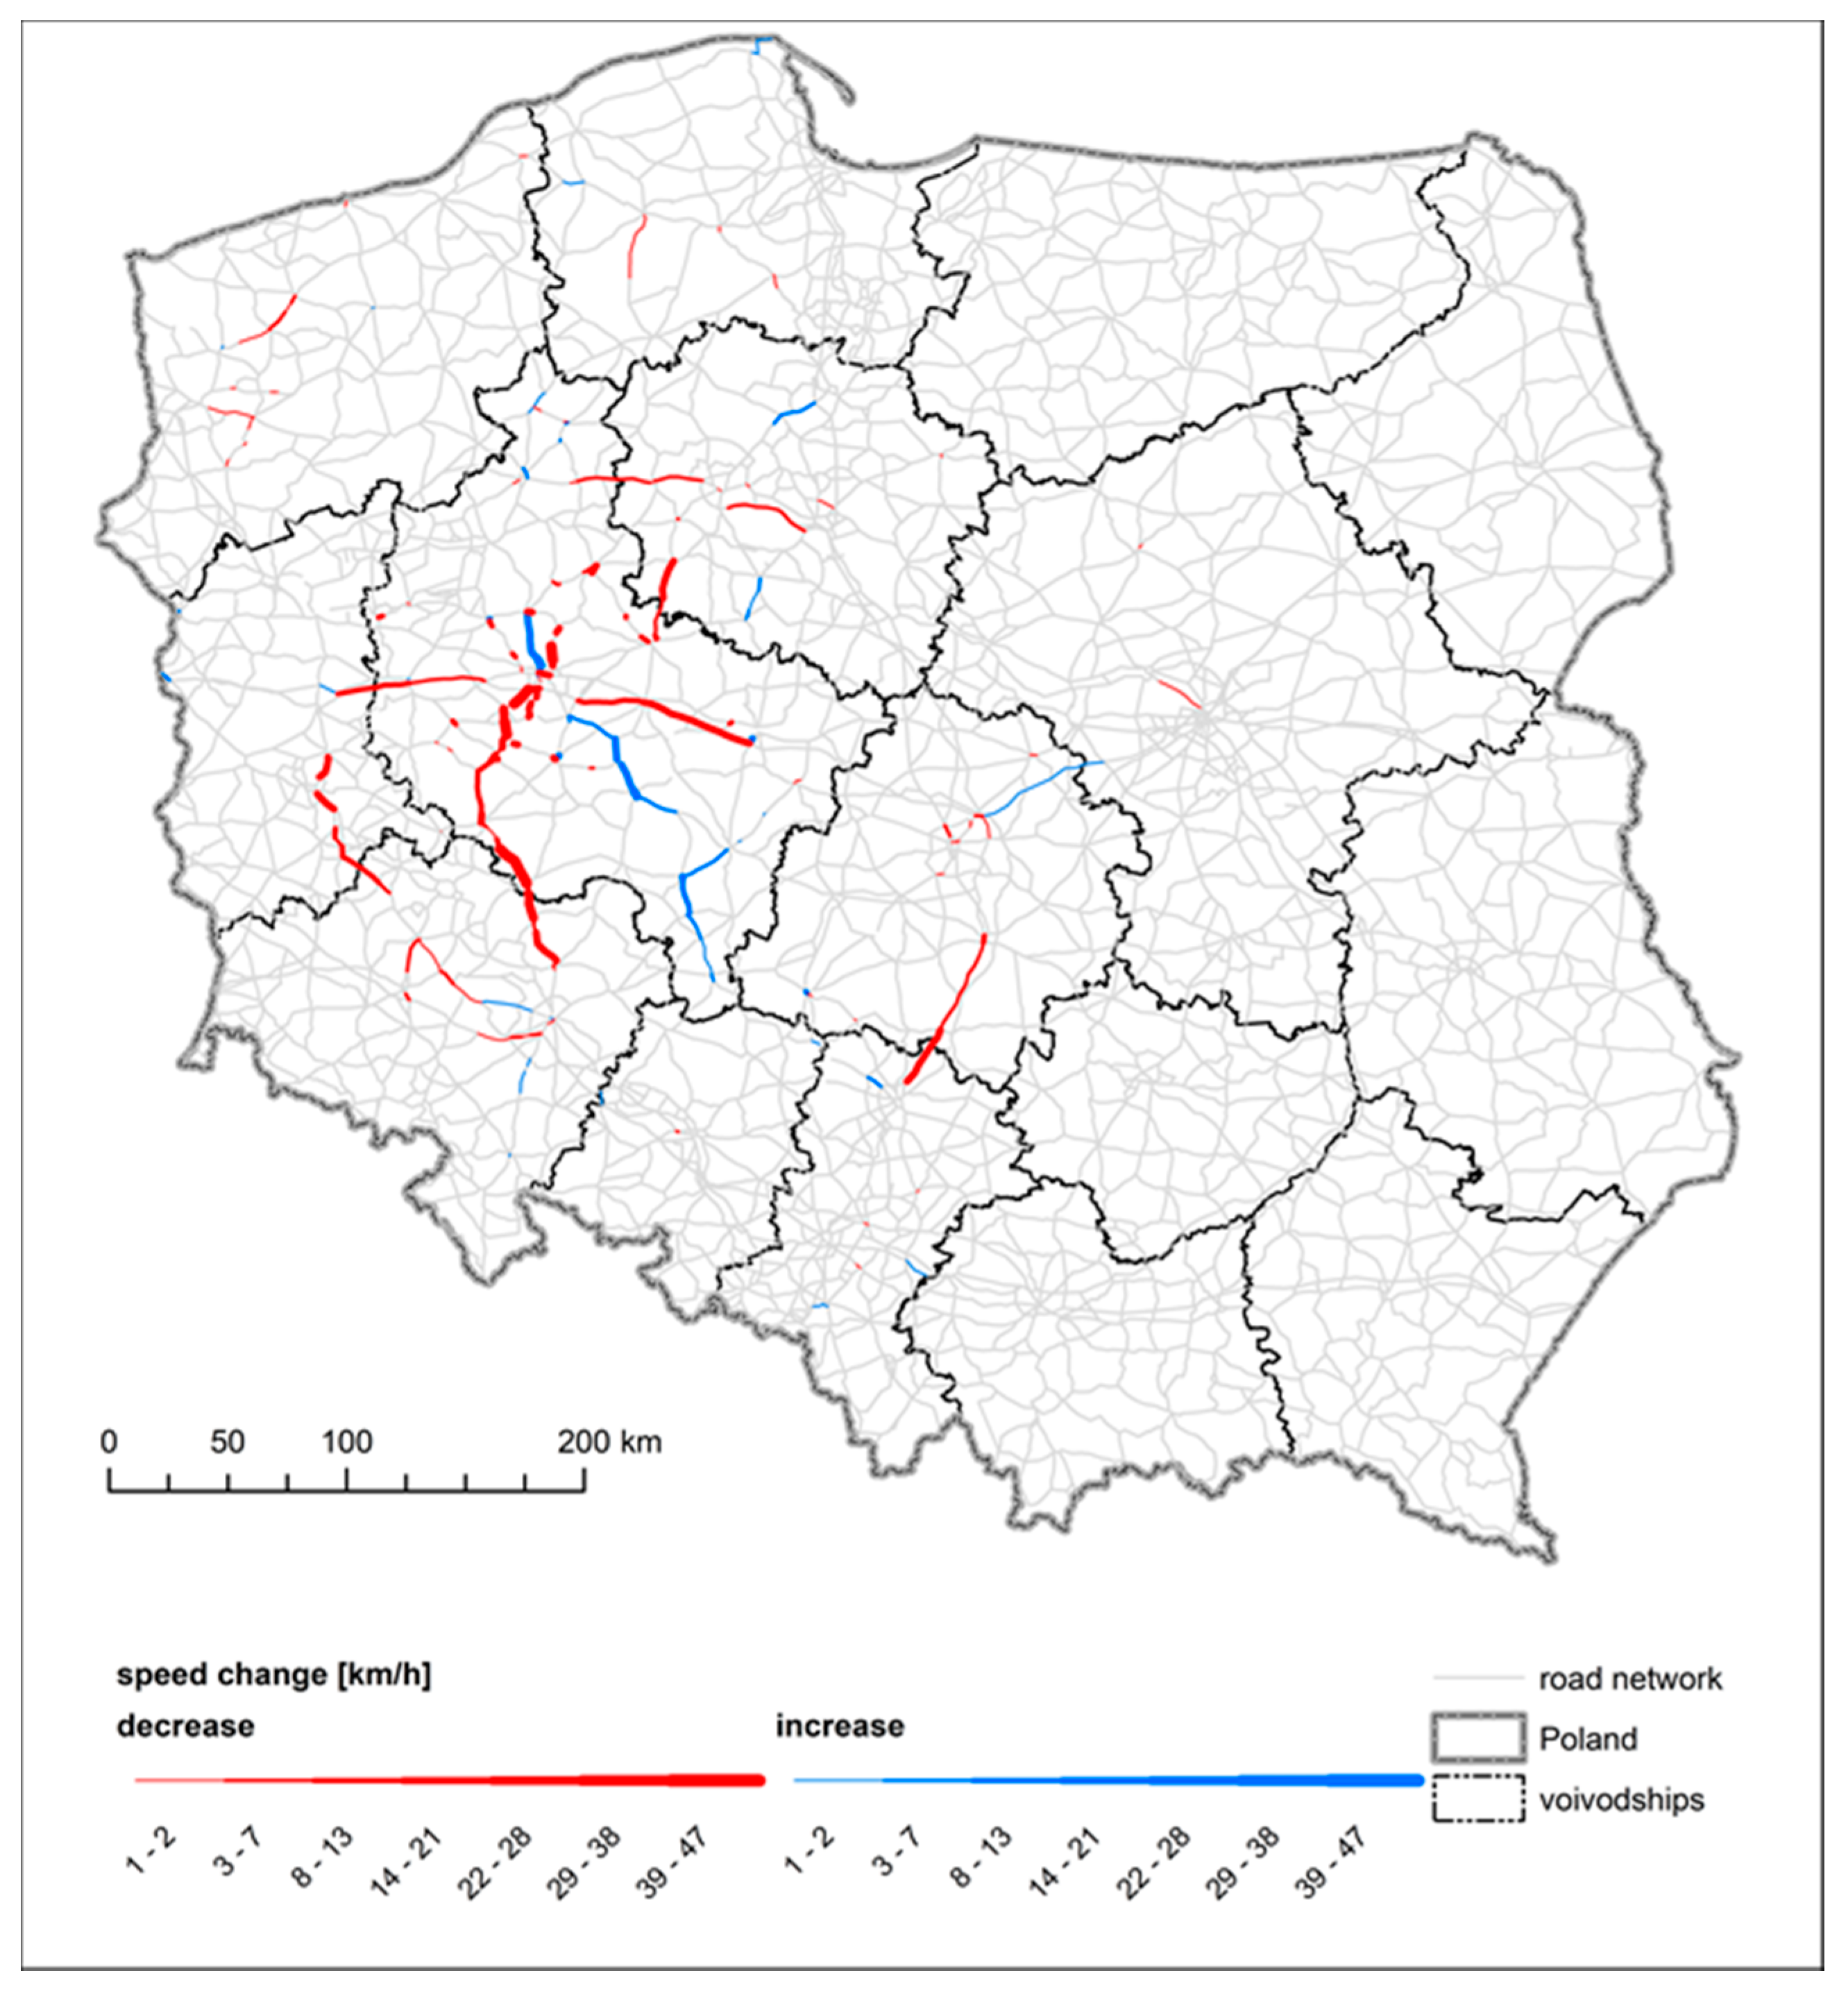
On the basis of the conducted analyses, it can be stated that the occurrence of a flood has an important influence on changes to the spatial distribution of traffic and the related travel speed. Such changes vary with regard to a given means of transport. In this respect, changes in the direction of the traffic flows that cause a decrease in density on some road sections are bound to increase (accelerate) trips taken by passenger cars and, to a much lesser degree, by lorries. This was in relation to sections with greater speed limits for the latter. On the other hand, the deterioration of driving conditions caused by non-typical incidents has the same impact on the travel speed of vehicles, regardless of their type. The changes we recorded would not have been noticeable if accessibility was measured by means of the most commonly applied speed-model-based methods.
Another aspect that the article reveals is the applicability of source materials available in the vast majority of EU states, among which the most crucial are flood-risk maps and the NMPT. The maps illustrating flood risks and the data on road ordinates render it possible to conduct studies identifying closures and shutdowns of sections within the transport network should a flood occur. Moreover, they can greatly impact strategies of flood-risk management.


