Abstract
As the world is digitizing fast, the increase in Big and Small Data offers opportunities to enrich official statistics for reporting on Sustainable Development Goals (SDG). However, survey data coming from an increased number of organizations (Small Data) and Big Data offer challenges in terms of data heterogeneity. This paper describes a methodology for combining various data sources to create a more comprehensive dataset on SDG 6.1.1. (proportion of population using safely managed drinking water services). We enabled digital volunteers to trace buildings on satellite imagery and used the traces on OpenStreetMap to facilitate visual detection of water points on Unmanned Aerial Vehicle (UAV) imagery and estimate the number of people served per water point. Combining data on water points identified on our UAV imagery with data on water points from field surveys improves the overall quality in terms of removal of inconsistencies and enrichment of attribute information. Satellite imagery enables scaling more easily than UAV imagery but is too costly to acquire at sufficiently high resolution. For small areas, our workflow is cost-effective in creating an up-to-date and consistent water point dataset by combining UAV imagery, Volunteered Geographic Information, and field survey data.
1. Introduction
Reporting on the Sustainable Development Goals (SDGs) (2015–2030) has become more complicated than reporting on the Millennium Development Goals (MDGs), given the increase in the number of goals, targets, and indicators. SDG 6 [1] is focused on ensuring availability and sustainable management of water and sanitation for all. It has eight targets and eleven indicators, whereas there is no separate MDG on water and sanitation. The MDGs have only three related indicators under Goal 7 (ensure environmental sustainability). Traditionally, the reporting uses census data from the National Statistics Office (NSO) and household surveys from ministries. Fritz et al. [2] give an overview of new additional data sources that have become available for measuring the SDGs. The ongoing digitization of society has led to an exponential increase in the volume of so-called Big Data. Big Data is not only large in volume, but is also produced continuously and varies in nature (structured and unstructured data). In addition to Big Data, Small Data also becomes more and more unlocked. Small Data is data from a wide variety of stakeholders, produced in a tightly controlled way using sampling techniques that limit their scope, temporality, size, and variety [3].
In terms of Big Data, See et al. [4] provide an overview of the value of combining remote sensing and geospatial data for more effective monitoring of SDGs. Geospatial data is defined here as data with explicit geographical locations. Walz et al. [5] show how remote sensing data and geostatistical data can be used to monitor the progress of an indicator from a global framework at the municipality level. In this case, the approach is tested on the Sendai framework, but the same approach can, in principle, also be tested for specific SDG indicators. We note that also remote sensing imagery contains geospatial data in terms of the bounding box of the images and the spatial reference system; however, in this case, no precise locations or objects are identified beforehand. Examples of geospatial data are mobile phone or social media data and Volunteered Geographic Information (VGI). ICT platforms have been developed that allow both professionals and citizens to report on water points via mobile devices (mostly phones) [6]. Fraisl et al. [7] mapped citizen science contributions to the UN SDGs and showed that based on the mapping exercise the Group on Earth Observations (GEO) undertook, [8] of the 29 indicators identified by GEO, citizen science could support 24. The Global Partnership for Sustainable Development Data (GPSDD) advocates for this kind of citizen-generated data [9]. It can complement official data sources, fill in data gaps, and give those hard to reach a voice on issues that matter the most to them. Georeferenced tweets or posts on social media can contain information on the functioning of public infrastructure. However, most developing countries where the monitoring of SDG 6 is essential have low internet and social media penetration rates, especially in rural areas. Call detail records can form a proxy for the number of users of a water point but are very hard to get access to and are often biased. Missing Maps [10] is an open VGI collaboration founded by the Humanitarian OpenStreetMap Community (HOTOSM), Médecins Sans Frontières (MSF), and the British and American Red Cross. The objective of this project is to map the most vulnerable places in the developing world so that humanitarian organizations can use these maps and data to better respond to crises. Through the Tasking Manager of Missing Maps, organizations can ‘request’ remote volunteers to trace aerial imagery for a particular area. The created polygons, lines, points, and attribute information are saved and stored as free and open data in the OSM database and can be accessed like other regular OSM extracts.
In terms of Small Data, humanitarian and development organizations regularly collect data on water and sanitation through household surveys, usually the areas where they intervene. The WHO/UNICEF Joint Monitoring Programme (JMP) collects household data, globally, on Water and Sanitation for Health (WASH) through surveys and aggregates this on a country level [11]. However, many other humanitarian and development actors collect data on specifically, for example, SDG 6.1.1. Proportion of population using safely managed drinking water services. Van den Homberg and Susha [12] developed a framework to characterize a data ecosystem and applied it to water points in Malawi. The framework consists of five dimensions: data infrastructure, data supply and demand, data governance, and actors. Results show that many governmental and NGO actors are involved in water supply projects with different funding sources and little overall governance. There is a large variety of geospatial data sharing platforms and online accessible information management systems with, however, a low adoption due to limited internet connectivity and low data literacy. The framework was also used to characterize the data quality of these data sources and to identify the gaps, such as lots of data not being open. Verplanke and Georgiadou [13] describe the complexity of establishing an open database to map all rural water points in an African nation (Tanzania). When bringing together unharmonized data from different sources, measurement errors have to be inventoried and characterized. Causes for errors range from material, observational, conceptual, and discursive errors [13]. Taking water quality as an example, some measurement methodologies are based on visual inspection or tasting of the water and are thus subjective, whereas other methods rely upon chemical test kits [13].
These new Big and Small Data sources offer opportunities to complement official statistics for reporting on SDGs, especially at the subnational level. Little attention has been devoted to SDG information on a subnational level. The UN SDG 6 report [14] identifies the lack of data in rural areas as a challenge for tracking progress. The recently launched UN-Water SDG 6 Data Portal [15] makes data on SDG 6 available in a user-friendly interface but is limited by the level at which data are available. For many countries such as Malawi, local data are lacking in the portal restricting the usability of the data by decision-makers. UN Water has introduced so-called data drives, where custodian agencies offer support to the focal points in terms of compiling data from different sources in a variety of ways, such as providing methodologies, helpdesks, webinars, and workshops [14]. Malawi published in June 2020 their first Voluntary National Review report for SDGs [16]. It describes the mechanism of how at the subnational level, local councils can coordinate the implementation and monitoring of the SDGs. However, the review admits that tracking progress and reporting on various initiatives need to be strengthened at these local levels. The description of SDG 6.1.1 clearly shows this, as only numbers at the national level are given and only progress in the period before 2016.
This paper assesses how Big Data can be used to complement data coming from Small Data to improve subnational reporting on SDG 6.1.1. For a case study in Malawi, we compare high and low-resolution satellite imagery with Unmanned Aerial Vehicle (UAV) imagery to find out which remote sensing imagery has sufficient resolution for water point identification. We assess the added value of combining the UAV imagery, VGI, and field survey data from different data providers by (a) cross-validating and resolving discrepancies in information on water point attributes from these different data providers and (b) enriching information on attributes or assessing if attributes can be added.
2. Materials and Methods
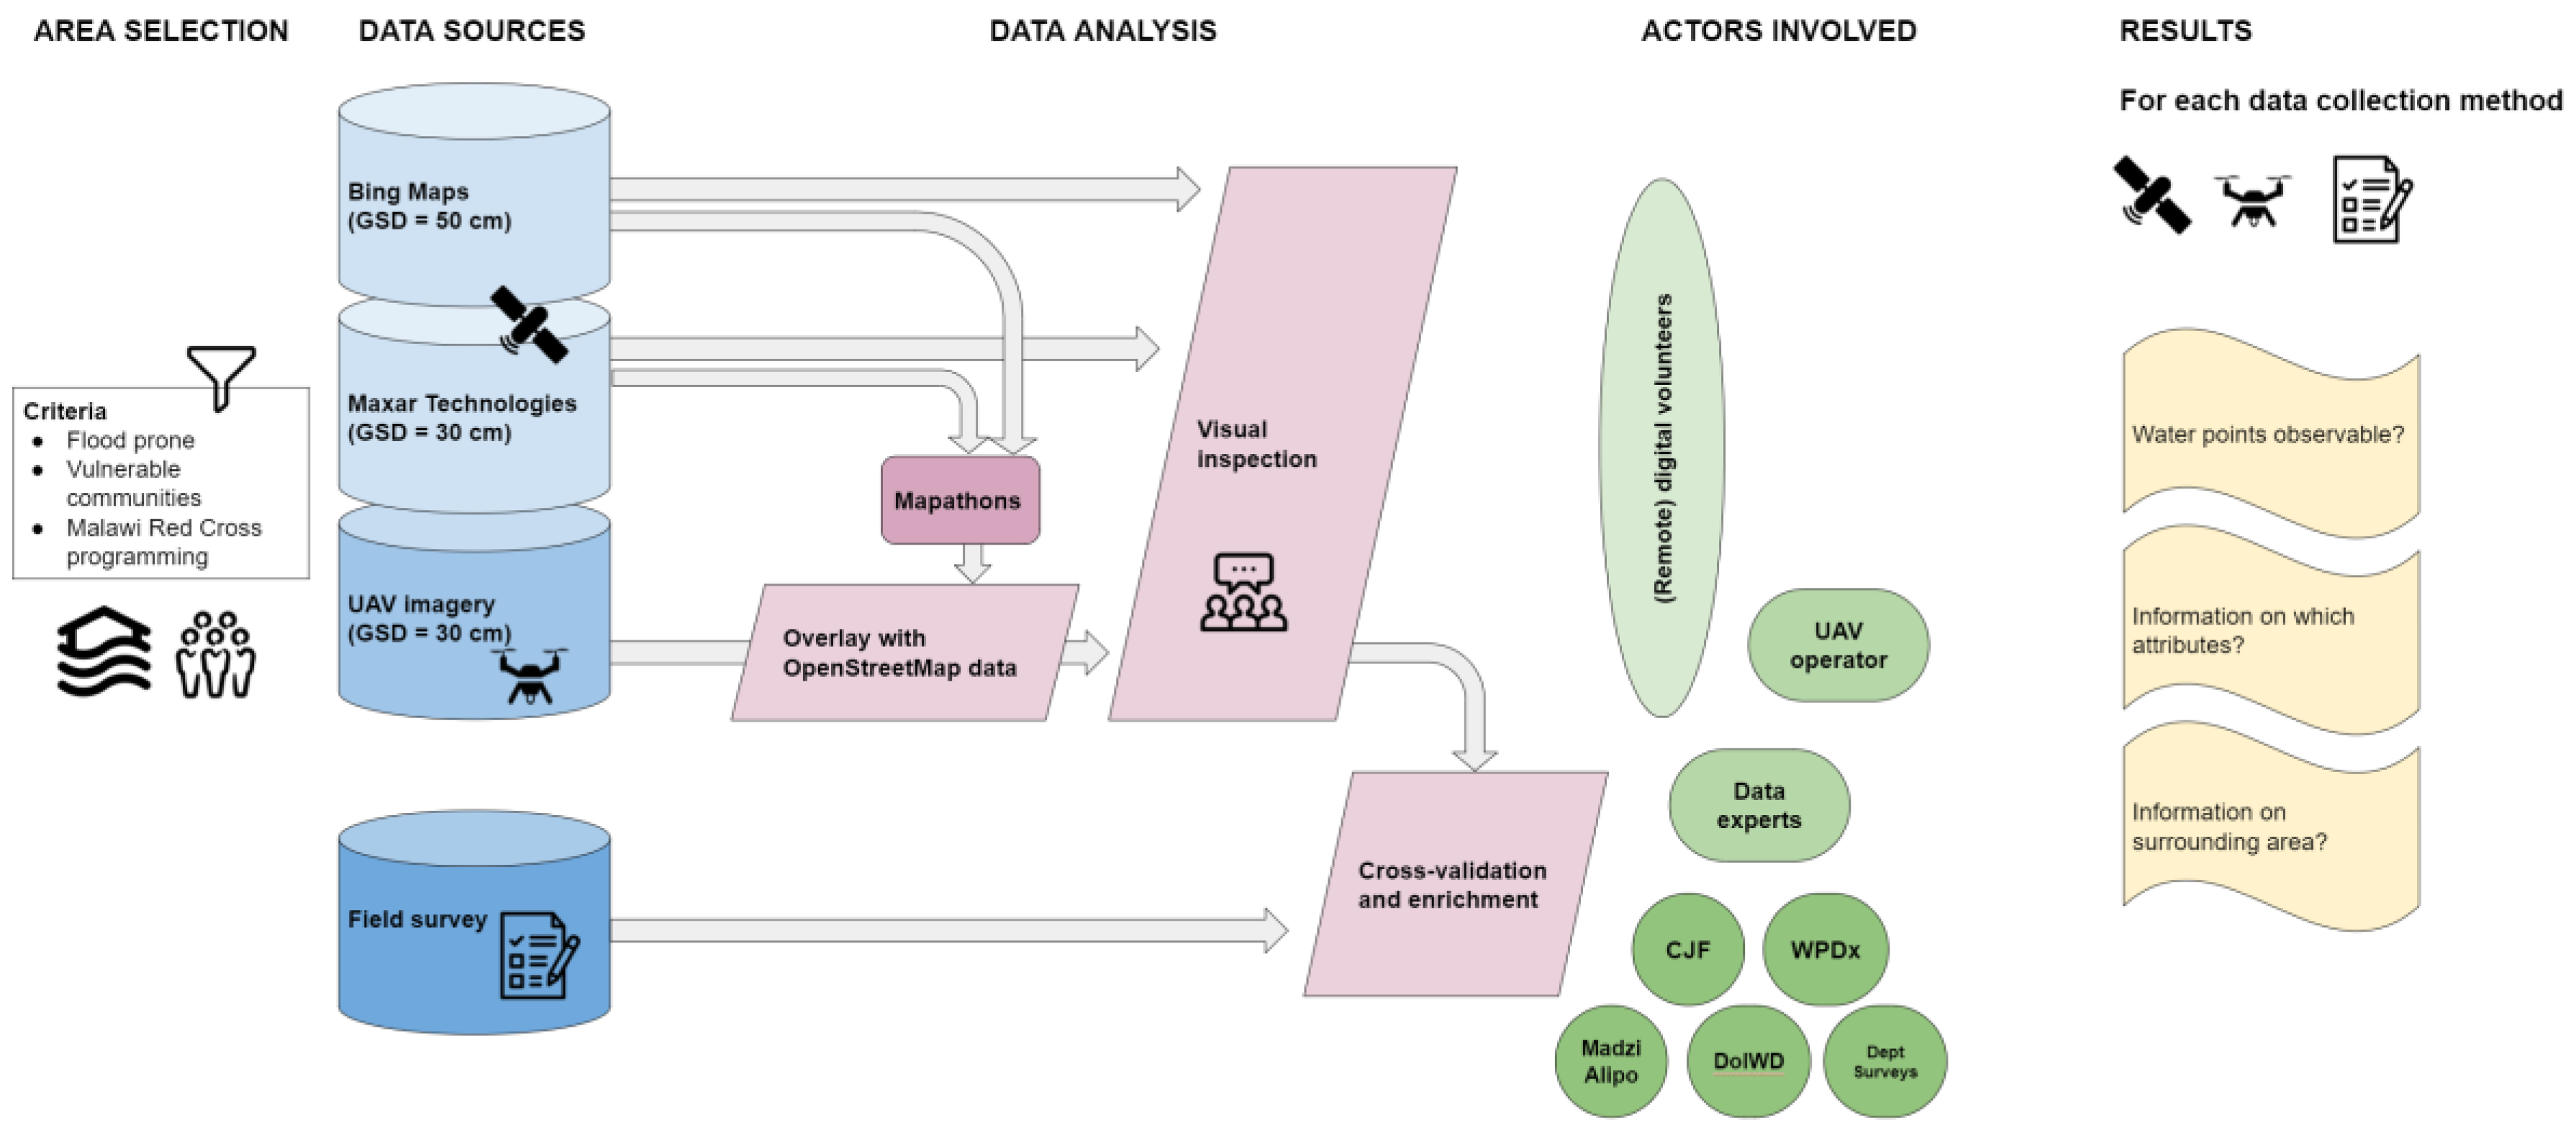
Figure 1 presents an overview of the research framework. Section 2.1 describes the area selection, and Section 2.2 the data sources used (satellite, UAV, and field survey data). The data analysis used to obtain the results is covered in Section 2.3. In Section 2.2 and Section 2.3, we describe which actors are involved in either the data collection or the data analysis.
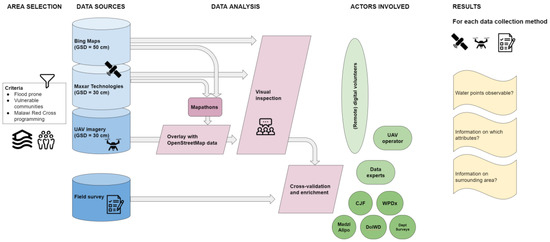
Figure 1.
The research framework. Ground Sample Distance (GSD), Unmanned Area Vehicles (UAV). The dark green circles represent organizations that collected data via field surveys on water points: Climate Justice Fund (CJF), Water Point Data Exchange (WPDx), Department of Irrigation and Water Development (DoIWD), Department of Surveys (Dept Surveys).
2.1. Area Selection
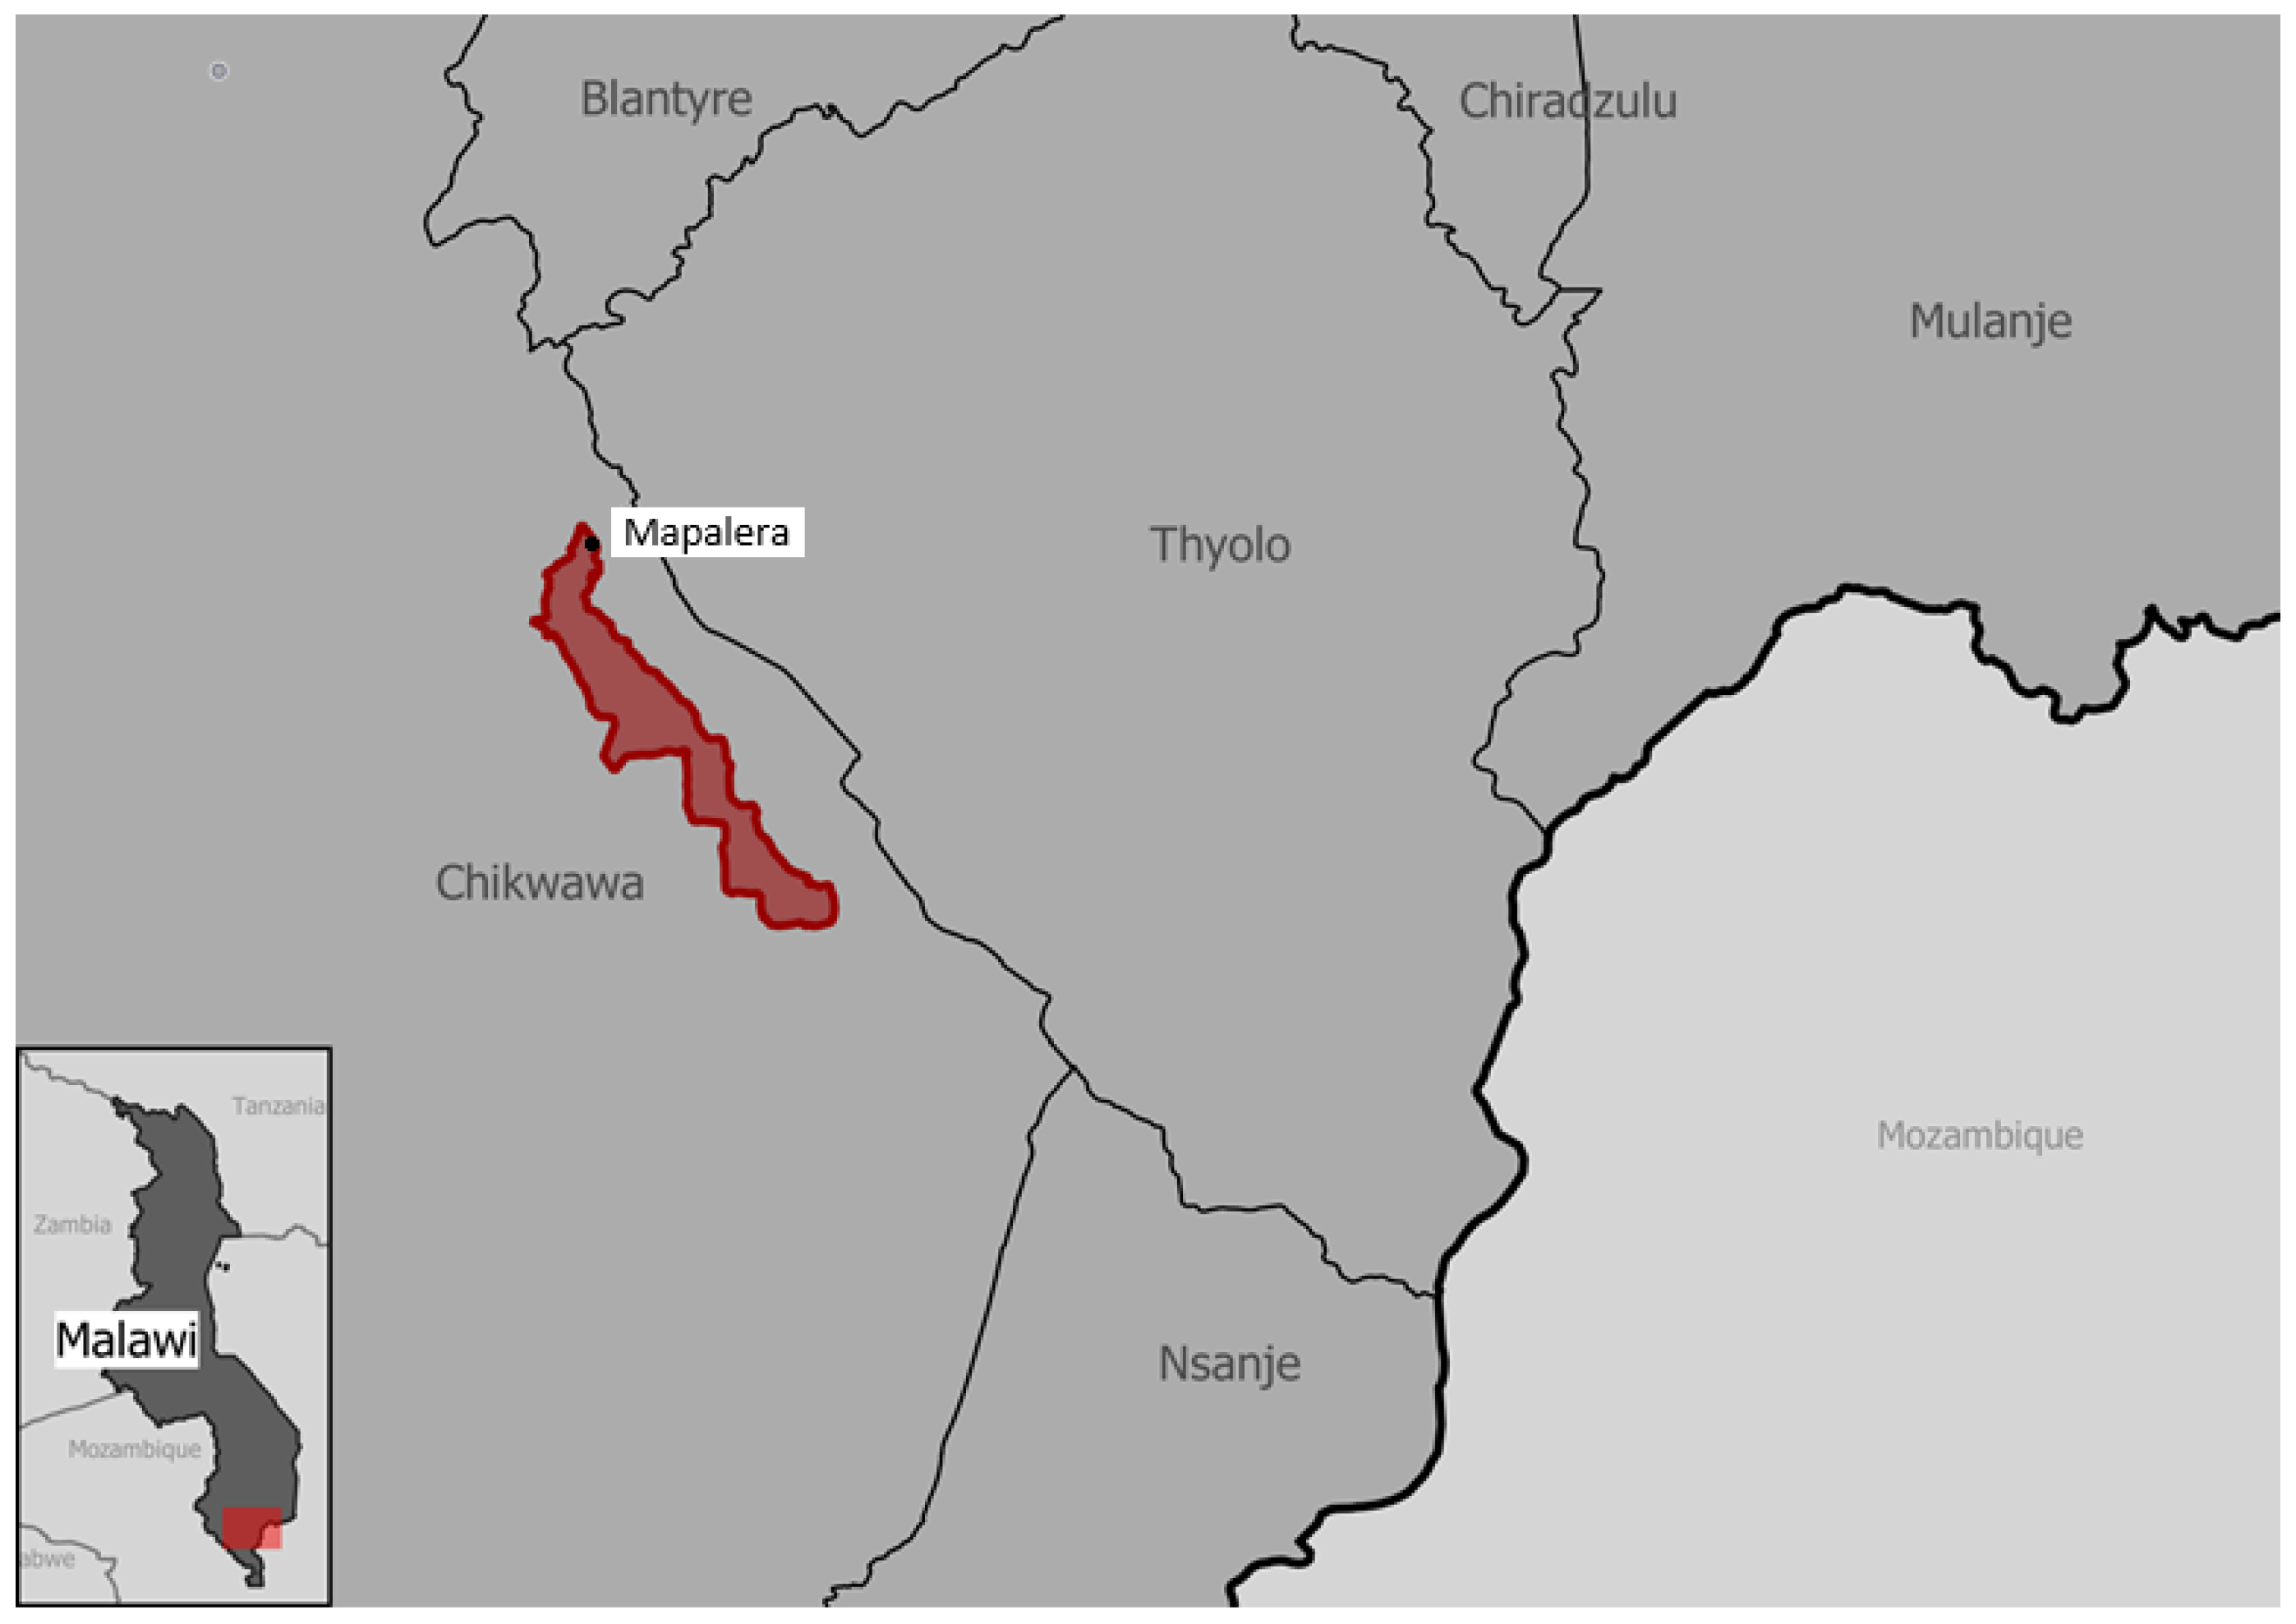
We focus on a case study in rural Malawi. Malawi is selected from an initial subset of low income and data-poor countries, given the in-country networks of the Red Cross, support by governmental organizations, and ongoing data-driven projects. We identified the Traditional Authorities (TA) Makhwira within the Chikwawa district, see Figure 2. This TA is also the intervention area of the second European Civil Protection and Humanitarian Aid Operations (ECHO) program implemented by the Malawi Red Cross Society (MRCS) with the support of the Netherlands Red Cross (NLRC), Belgian Red Cross-Flanders, and the Danish Red Cross. This program focuses on building flood resilience among vulnerable communities. The Community Risk Assessment (CRA) dashboard of 510, an initiative of the Netherlands Red Cross [17], is used to identify those communities. Water points in flood-prone areas are at risk of contamination and malfunctioning.
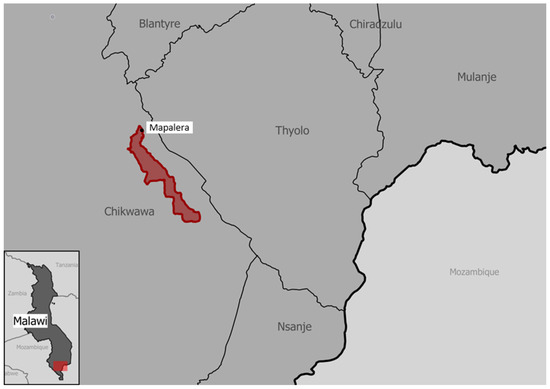
Figure 2.
Overview of the case study area, part of the Traditional Authority Makhwira in the district Chikwawa.
2.2. Data Sources
2.2.1. Satellite Imagery
We pursued three options to obtain satellite imagery. First, satellite imagery is freely available from Bing Maps, a web mapping service provided by Microsoft. Bing Maps sources its data from a variety of satellite data providers. For example, for Chikwawa, TomTom, HERE, Maxar Technologies, and Earthstar Geographics SIO are referenced depending on the zoom level. Up to 50 cm resolution was available. Second, Malawi held a population and housing census in 2018. A vital component was the delineation of statistical areas referred to as Enumeration Areas (EAs) for field enumeration, which is the spatial foundation for census datasets [18]. The Geographic Information System (GIS) unit of the Demography and Social Statistics division of the National Statistics Office (NSO) recruited the Regional Centre for Mapping of Resources for Development (RCMRD) to provide the satellite imagery and to perform a dwelling frame, capturing the location of around 200 to 300 dwelling units within about 25000 EAs. RCMRD used satellite imagery of ultra-urban areas at 0.5 m, regular urban at 2.5 m, and rural areas at 2.5 m [18]. This imagery was also used to plot facilities in villages such as schools, boreholes, and health centers. Unfortunately, it was not possible to obtain this satellite imagery. Third, Maxar Technologies provided the authors WorldView-3 satellite imagery at 30 cm ground sample distance for the UAV flight areas.
2.2.2. UAV Imagery
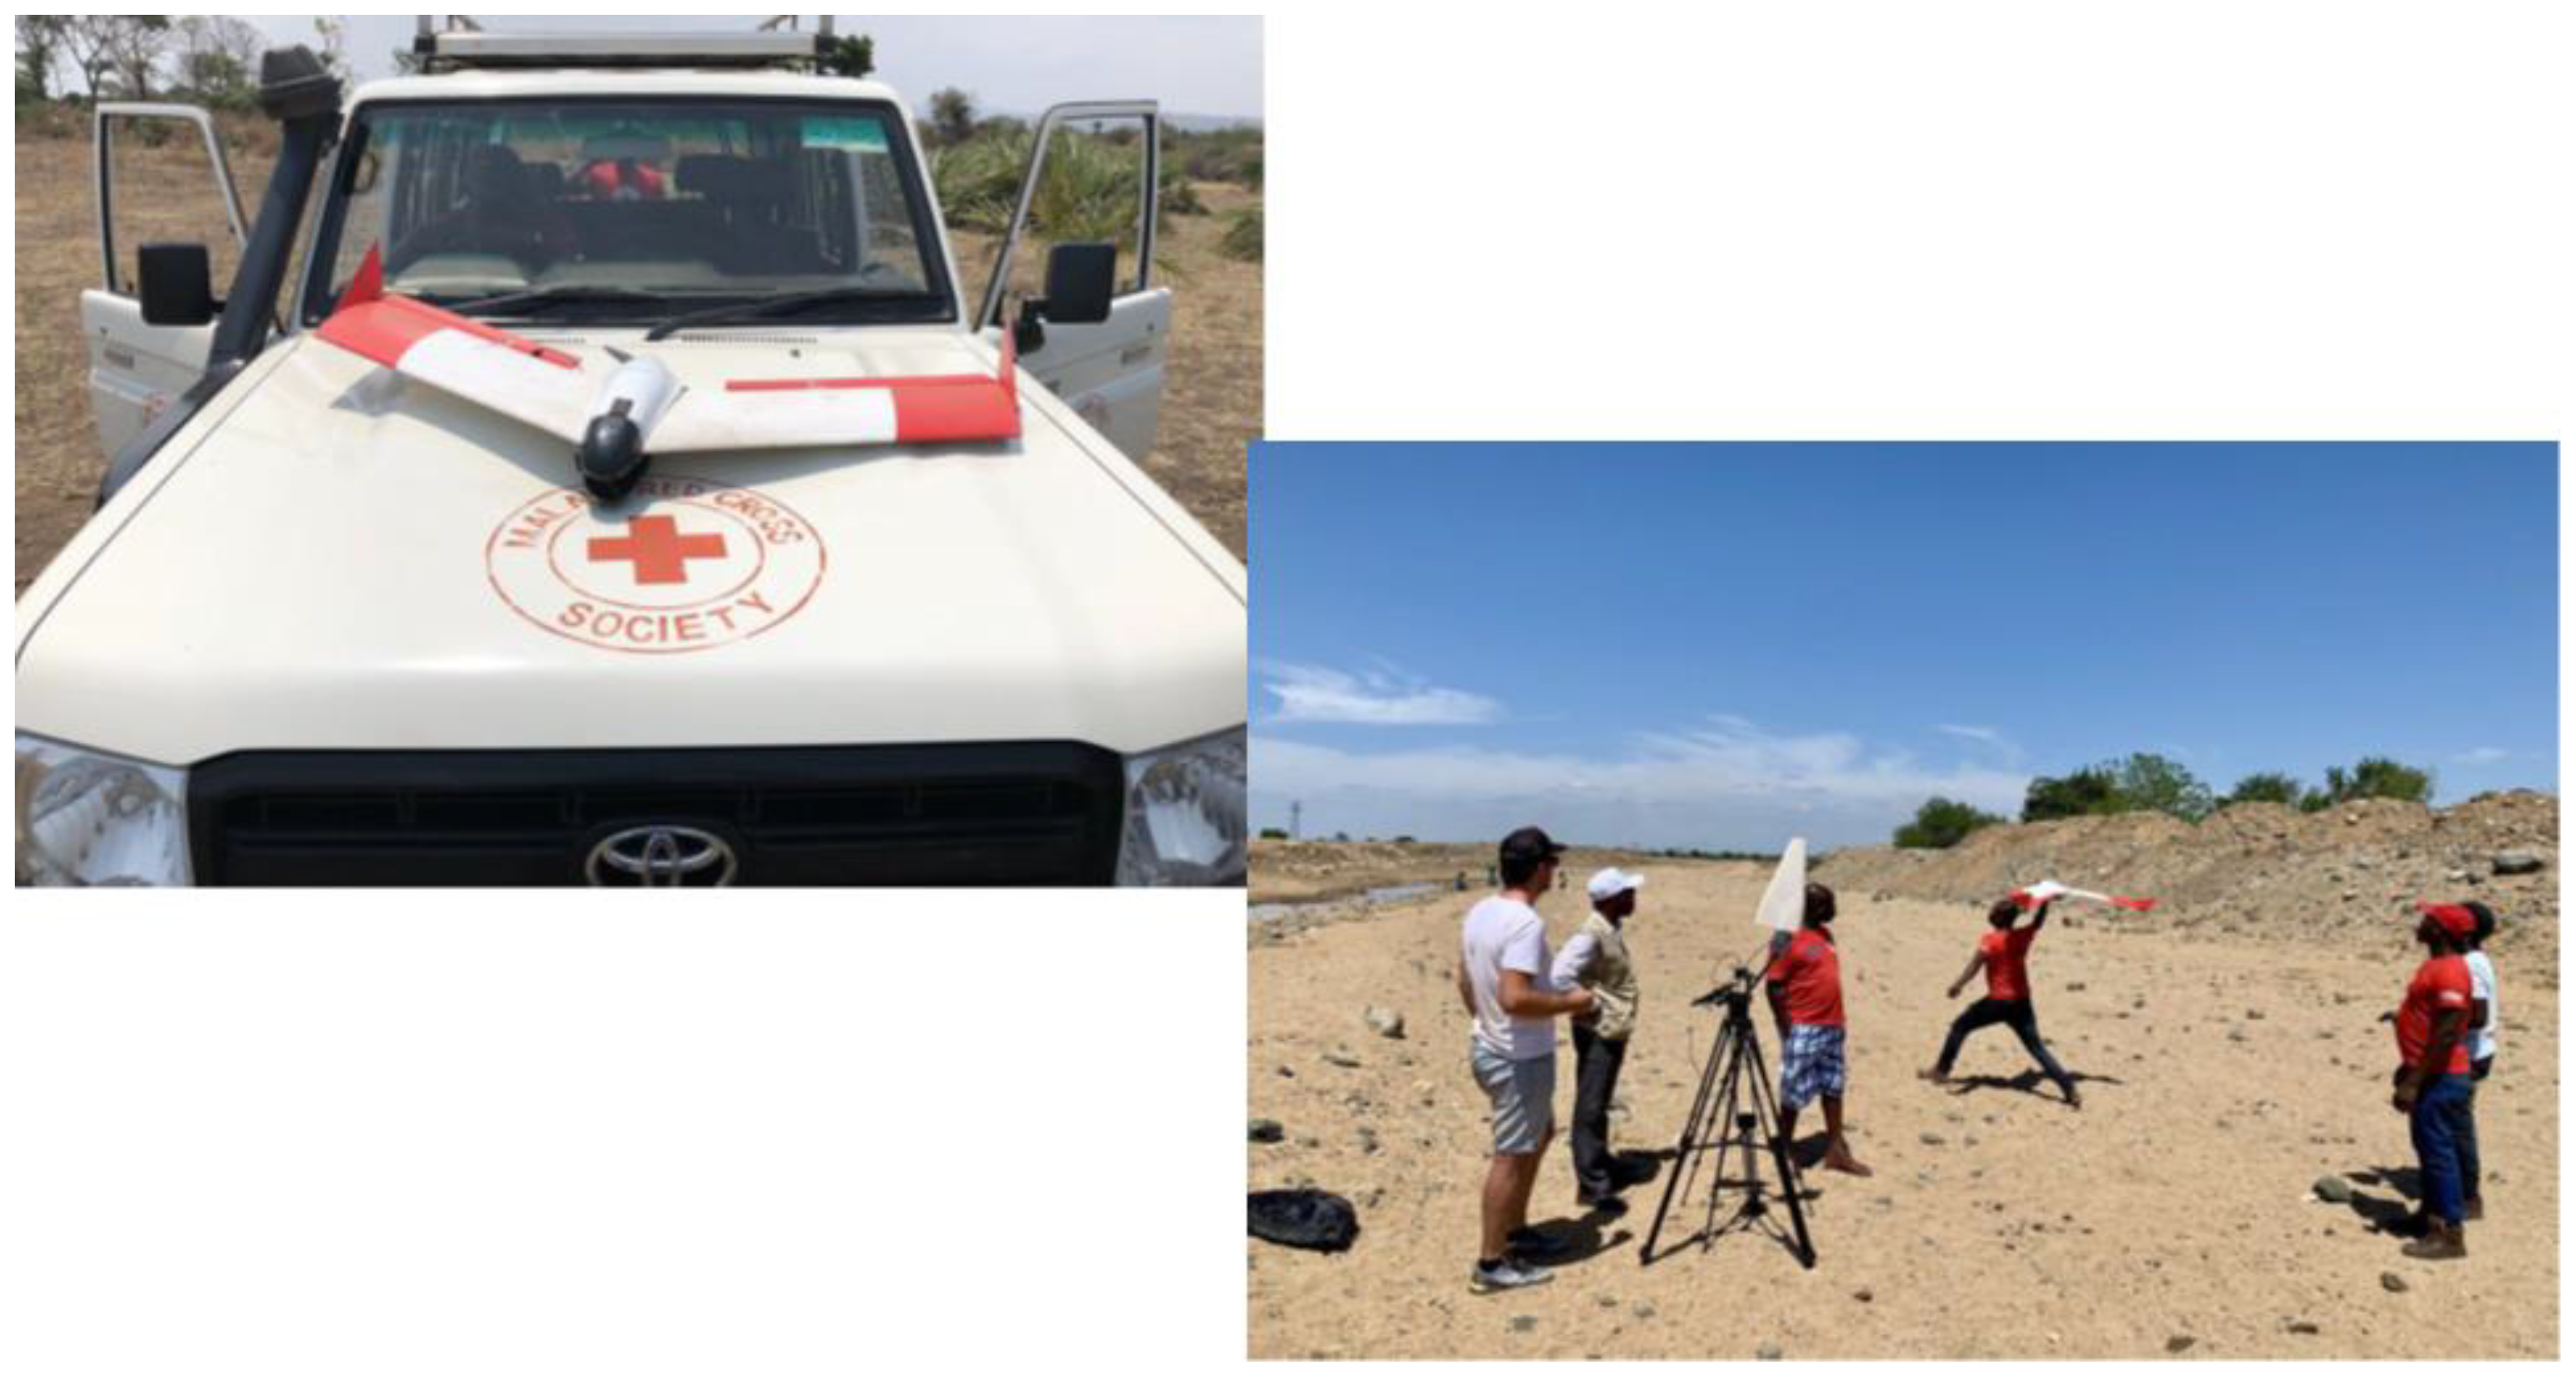
A Smartplane Freya, a fixed-wing UAV with 0.3 m2 wing area, a weight of around 1.5 kg and a RICOH GR II camera was used to obtain the UAV imagery. The UAV used only unlicensed ISM-bands. MRCS received flight permission from the Civil Aviation Authority (CAA) and a clearance from the Malawi Police Service. The regulations, enforced by Air Traffic Control from CAA, allow flying at 120 m, whereby in some cases, it is possible to fly up to an altitude of 500 m. MRCS organized a community sensitization campaign one week in advance. The campaign explained where the flight would take place and why the data collection took place to counter suspicions. MRCS used mobile van publicity and jingles that were played at the community radio stations Nyantepa and Gaka. Communities were also informed that sometimes an emergency landing is necessary and that they should not throw stones at the drone. Some people were afraid of the UAV capturing personal information about them and that this information could be used in election rigging. The drone usually flew at around 300 m altitude, whereby the optical imagery has a resolution of around 11 cm. The UAV has a flight time of maximum 60 min per battery. A single flight at 500 m altitude with a sidelap and overlap of each 70% can cover a maximum of 3.4 km2 per flight. The complete area consisted of 140 flights, each lasting 45 min, resulting in 105 h of flight time excluding relocation time. The UAV has a range of up to 60 km according to the manual, but in practice it was around 20 km due to wind or battery abnormalities. The flight area in Makhwira is 284 km2. Figure 3 gives an impression of the UAV mission.
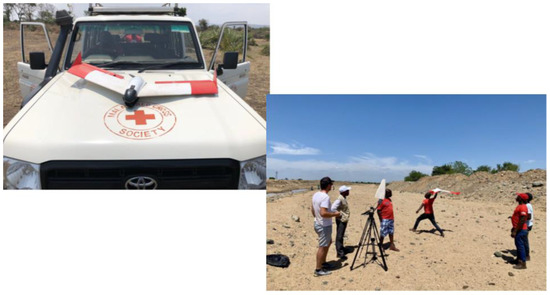
Figure 3.
Images of the UAV mission.
2.2.3. Field Survey Data
Several of the actors in the WASH sector in Malawi produce data on water points by regularly conducting field surveys. Susha and van den Homberg [12] extensively described the corresponding WASH data ecosystem in Malawi and also visualized it in a dashboard [19]. In this research, we focus only on those actors that produce data for the case study area. Of the nine data providers, four did not cover the area of the UAV imagery. The five data providers that did cover the area are Fisherman’s Rest (with their Madzi Alipo platform), the Climate Justice Fund (CJF), the Water Point Data Exchange (WPDx), the Department of Irrigation and Water Development (DoIWD) and the Department of Surveys (Dept Surveys). Apart from DoIWD, which is directly involved in water supply service provisioning, there are also government agencies that play a role from the data perspective. NSO provides the baseline data for the SDGs, including SDG 6.1.1. In 2015–2016, the large-scale Demographic Health Survey (DHS) was conducted. This survey provided insight into the current state of rural, urban, and overall water supply. According to the results of the DHS, 63% of rural households have access to basic water services, compared to 87% of urban households [16]. The worldwide DHS program (as sponsored by USAID) makes several of the underlying datasets available upon registration. Our current understanding is, however, that the answers on survey questions about access to water per household are not available with corresponding GPS coordinates as these coordinates are randomly displaced to ensure respondent confidentiality [20]. The government of Malawi is working with the University of Strathclyde and the Government of Scotland through the Climate Justice Fund: Water Futures Programme on getting water asset management data using their mWater data platform. However, for our study, we could only gain access to an example dataset and not the full dataset. The reasons for not opening up the dataset might be related to government accountability and protecting the unique position of the contractor. Apart from NSO, also the Department of Surveys (DoS) has a role in terms of data related to water points as their vision is to provide timely, accurate, and reliable geospatial information for sustainable development.
2.3. Analysing the Data
We define a water point as an improved source used for drinking water. Improved sources are the top three services levels as defined by [11], see Table 1.

Table 1.
WHO/UNICEF Joint Monitoring Programme for Water Supply and Sanitation (JMP) service ladder for household drinking water. Reprinted from [11], page 12.
Safely managed water points are on-premises, so in the near vicinity of a building. The basic and limited water points can be further away up to 30 min walking distance but usually close to the village it is serving. Therefore, to facilitate the visual detection of rural water points on UAV and satellite imagery, our first step was to overlay the images with OSM building data. The OSM building data were created via mapathons. In a mapathon, a large number of digital volunteers work on numerous tasks that consist of tracing buildings on satellite imagery from (mostly) Bing Maps with a sub-meter resolution, typically between 50 and 70 cm for specific areas. The Netherlands Red Cross organized over 20 mapathons in the Netherlands, mobilizing hundreds of mostly Dutch volunteers. The volunteers were either employees from a wide range of organizations or students from several universities. A minority of these participants had a background in GIS, so all mapathons started with a basic introduction to OSM. Between 2016 and 2017, due to these tasks, the number of newly mapped roads in Malawi doubled from 37,000 km to 78,000 km. Over 1.8 million buildings have been mapped since the start of the project in Malawi, a vast amount through the Netherlands Red Cross tasks. Several of these tasks were in the area of the UAV pilot; some were also outside this area. Experienced mappers, often the organizer of the mapathon but also others qualified as validators, checked the quality and validated the tasks conformed to the usual OSM mapping workflow [21].
After the overlaying of OSM data, eight volunteers of 510 visually inspected the images and mapped the water points. The eight volunteers were mostly Dutch MSc students doing their research or internship with 510 or just graduated students volunteering with 510. All had GIS skills. The water points were created in a spatial dataset based on the imagery. Additional information was added in the attribute list based on visual inspection of the surroundings and other metadata. After the initial mapping, 510 staff checked the data upon quality and consistency. The results were stored in the dataset and used for further analysis. Because of the number of volunteers, this process could be finished within a week. It would also have been an option to create OSM tasks for identifying water points via remote digital volunteers. However, the limited amount of UAV and satellite imagery available did not yet require upscaling from the crowd of OSM volunteers. Furthermore, clear guidelines for mapping water points have to be developed to reach a uniform and standardized way of open online mapping. In addition to manually, the options for automated water point detection were briefly explored. Currently, algorithms are being developed (such as deep learning) to detect building outlines and material in aerial imagery [22]. However, these are still in the development phase, and they do not yet work well with objects with small sizes like water points in combination with the limited image resolution available. Furthermore, a good test dataset needs to be available to teach the algorithm.
The OSM building footprint could not only be used for facilitating the identification of water points but also for obtaining more insights into the local situation. We calculated the size per house in and selected all houses larger than 15 and smaller than 100 in size. Buildings larger than 100 are assumed to be churches, schools, or industrial buildings. Subsequently, we could estimate the number of people living in a certain radius around a water point by relating building size to the number of people living on average in such houses. We used the ArcGIS Living Atlas of the World [23], which gives an average of 4.5 people per household.
3. Results
3.1. Results Satellite Imagery in Comparison to UAV Imagery
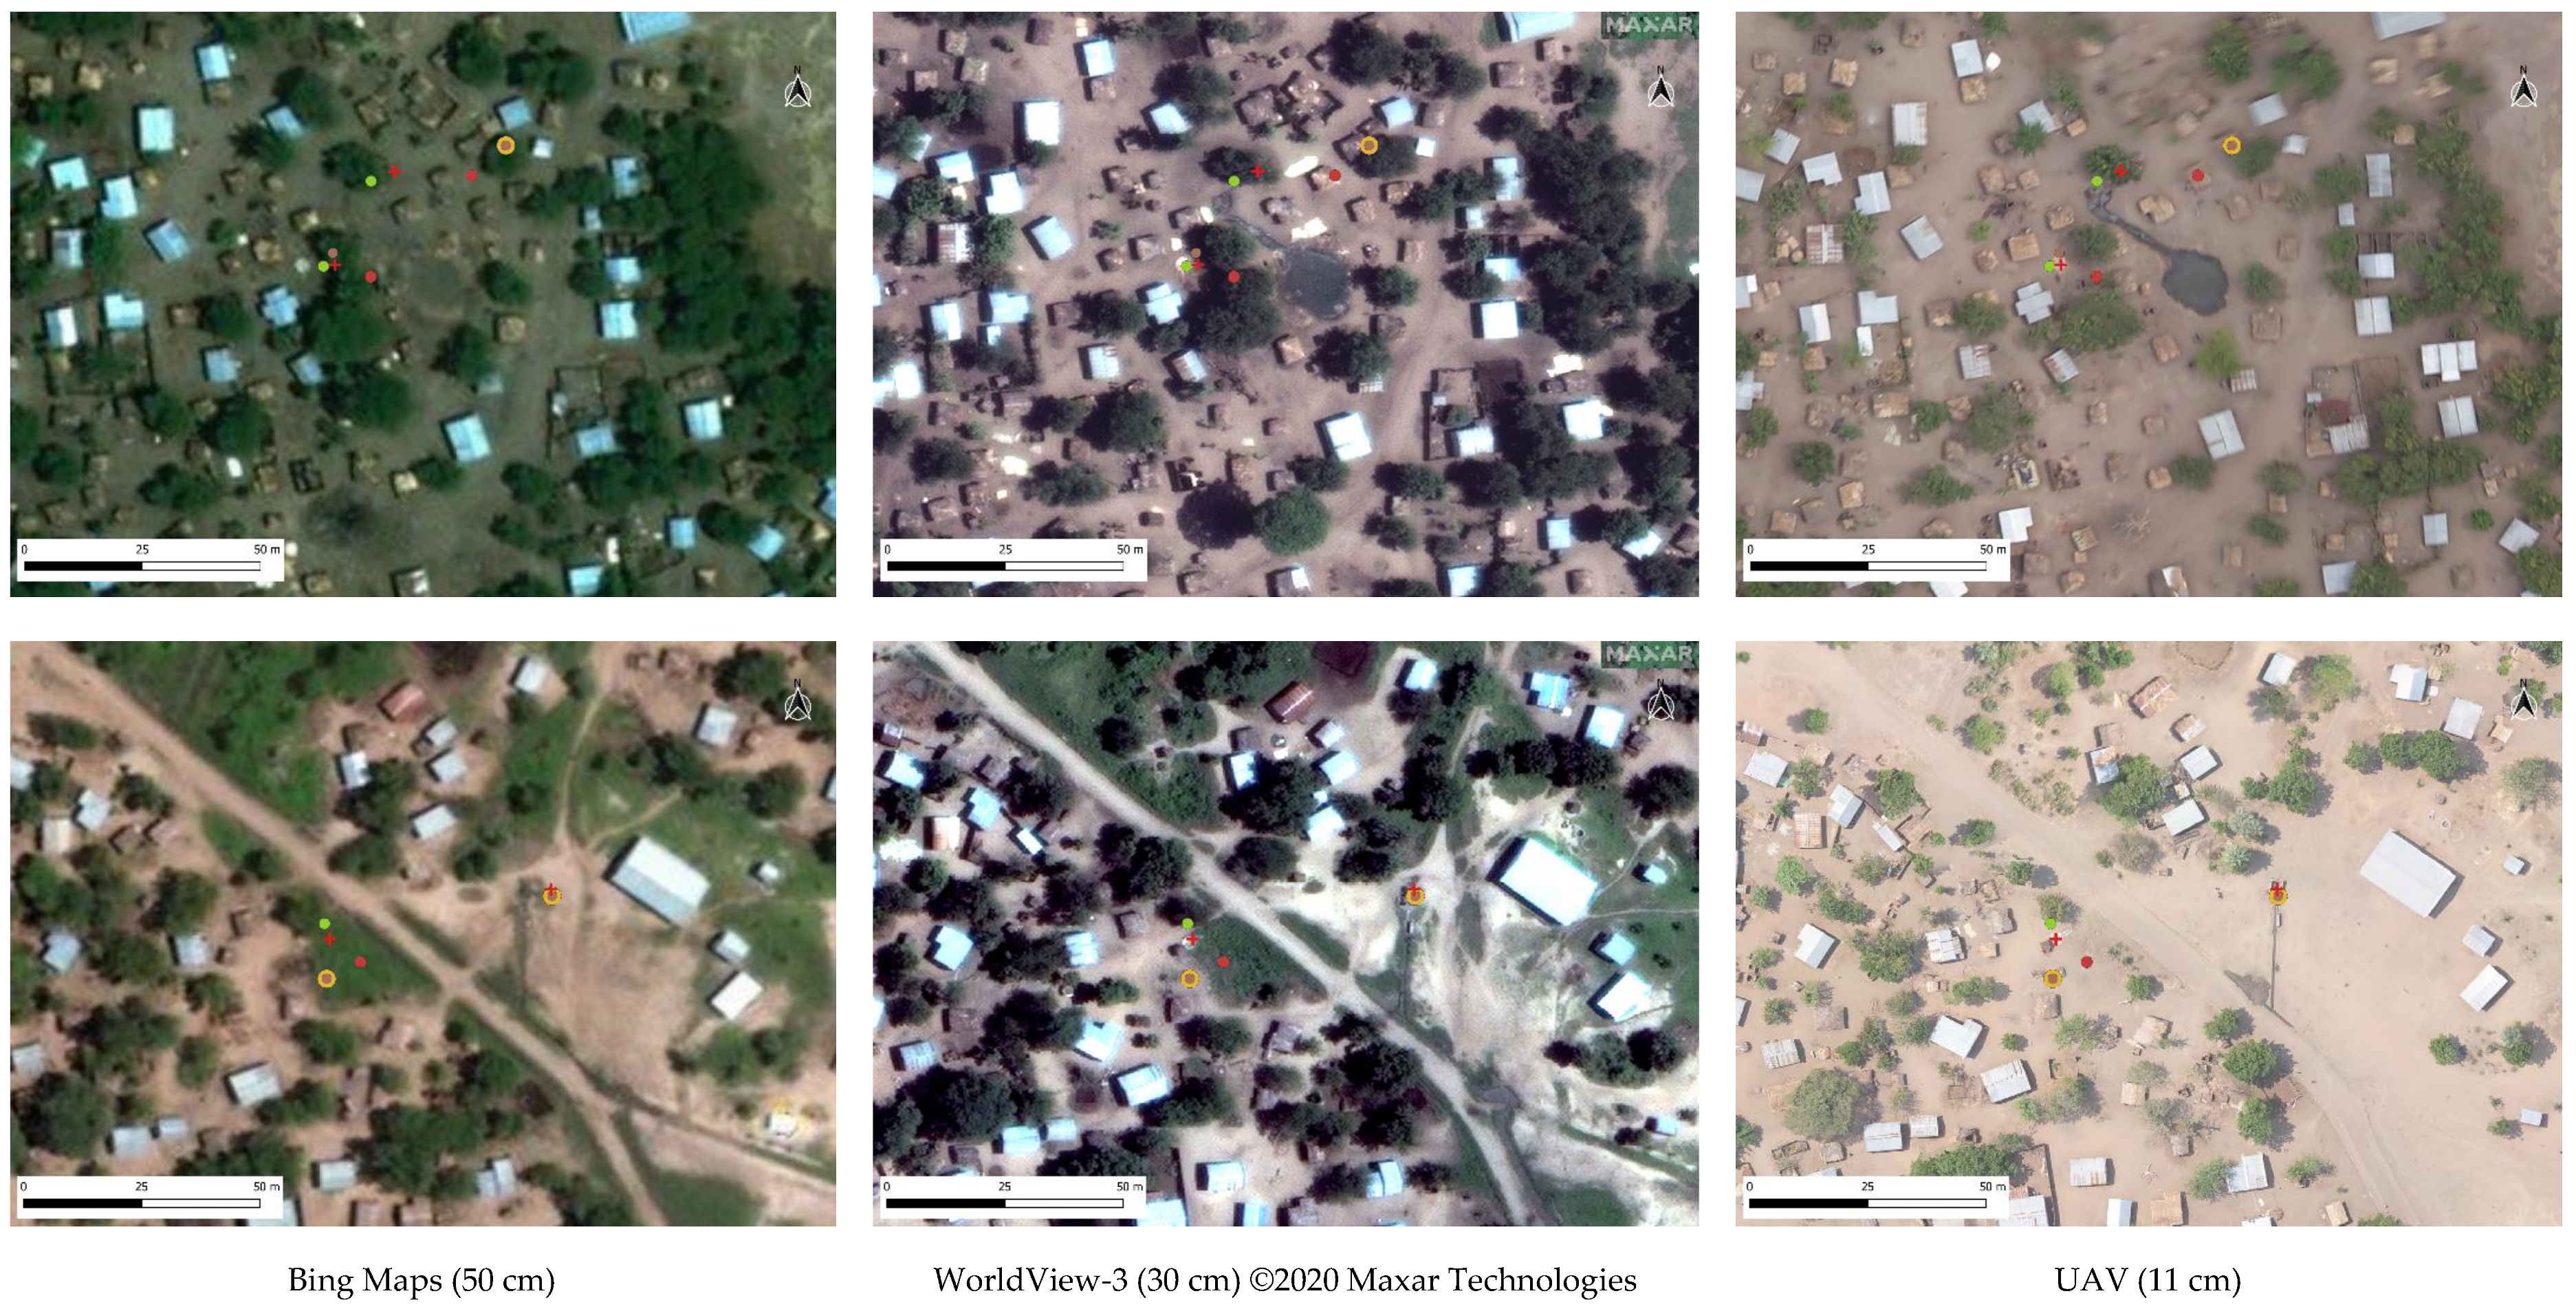
For five sites within the UAV flight area we compared the images with the three different resolutions available. Figure 4 shows the results for a zoom in on two sites. In each of the images of the top row, we have plotted a coloured dot for the water points in this area if listed in the field surveys and a red cross if identified by the digital volunteers through visual inspection on the UAV imagery. Most digital volunteers found it impossible to identify water points on the Bing Maps, except for larger water points, for example walled water points. It was possible on the WorldView-3 images, although it was slightly more complicated than on the UAV images. Unprotected boreholes were most challenging to identify, given that their size could be of the same order as the 30 cm resolution of the WorldView-3 images.
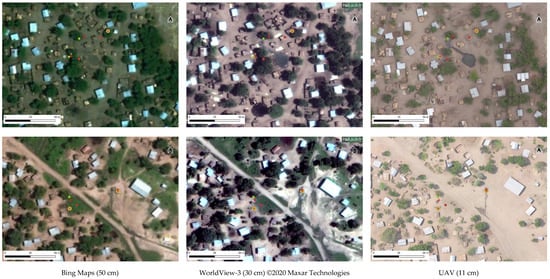
Figure 4.
Overview of the different imagery for 175 × 125 m2 for two different locations (top row and bottom row) in the case study area. The red cross refers to water points as identified on the UAV imagery. Green dots represent water points surveyed by Climate Justice Fund, red dots Water Point Data Exchange, yellow dots Department of Surveys, brown dots Madzi Alipo. In some cases, the brown and yellow dots coincide. No water points from the Department of Irrigation and Water Development survey were present in these segments.
In the area of the top row, Madzi Alipo (brown dot), CJF (green dot), Dept Surveys (yellow dot), and WPDx (red dot) each identified two water points. The Madzi Alipo database describes them as a piped water point (gravity feed) and a hand pump from Afridev. In both cases, they are functional and unprotected water points.
In the area of the bottom row, Madzi Alipo, CJF, Dept Surveys, and WPDx each identified two water points. The Madzi Alipo database describes them as a piped water point (not working) and a protected hand pump (working). The WPDx database describes them as a gravity-fed system.
3.2. Results UAV imagery
3.2.1. Visual Inspection
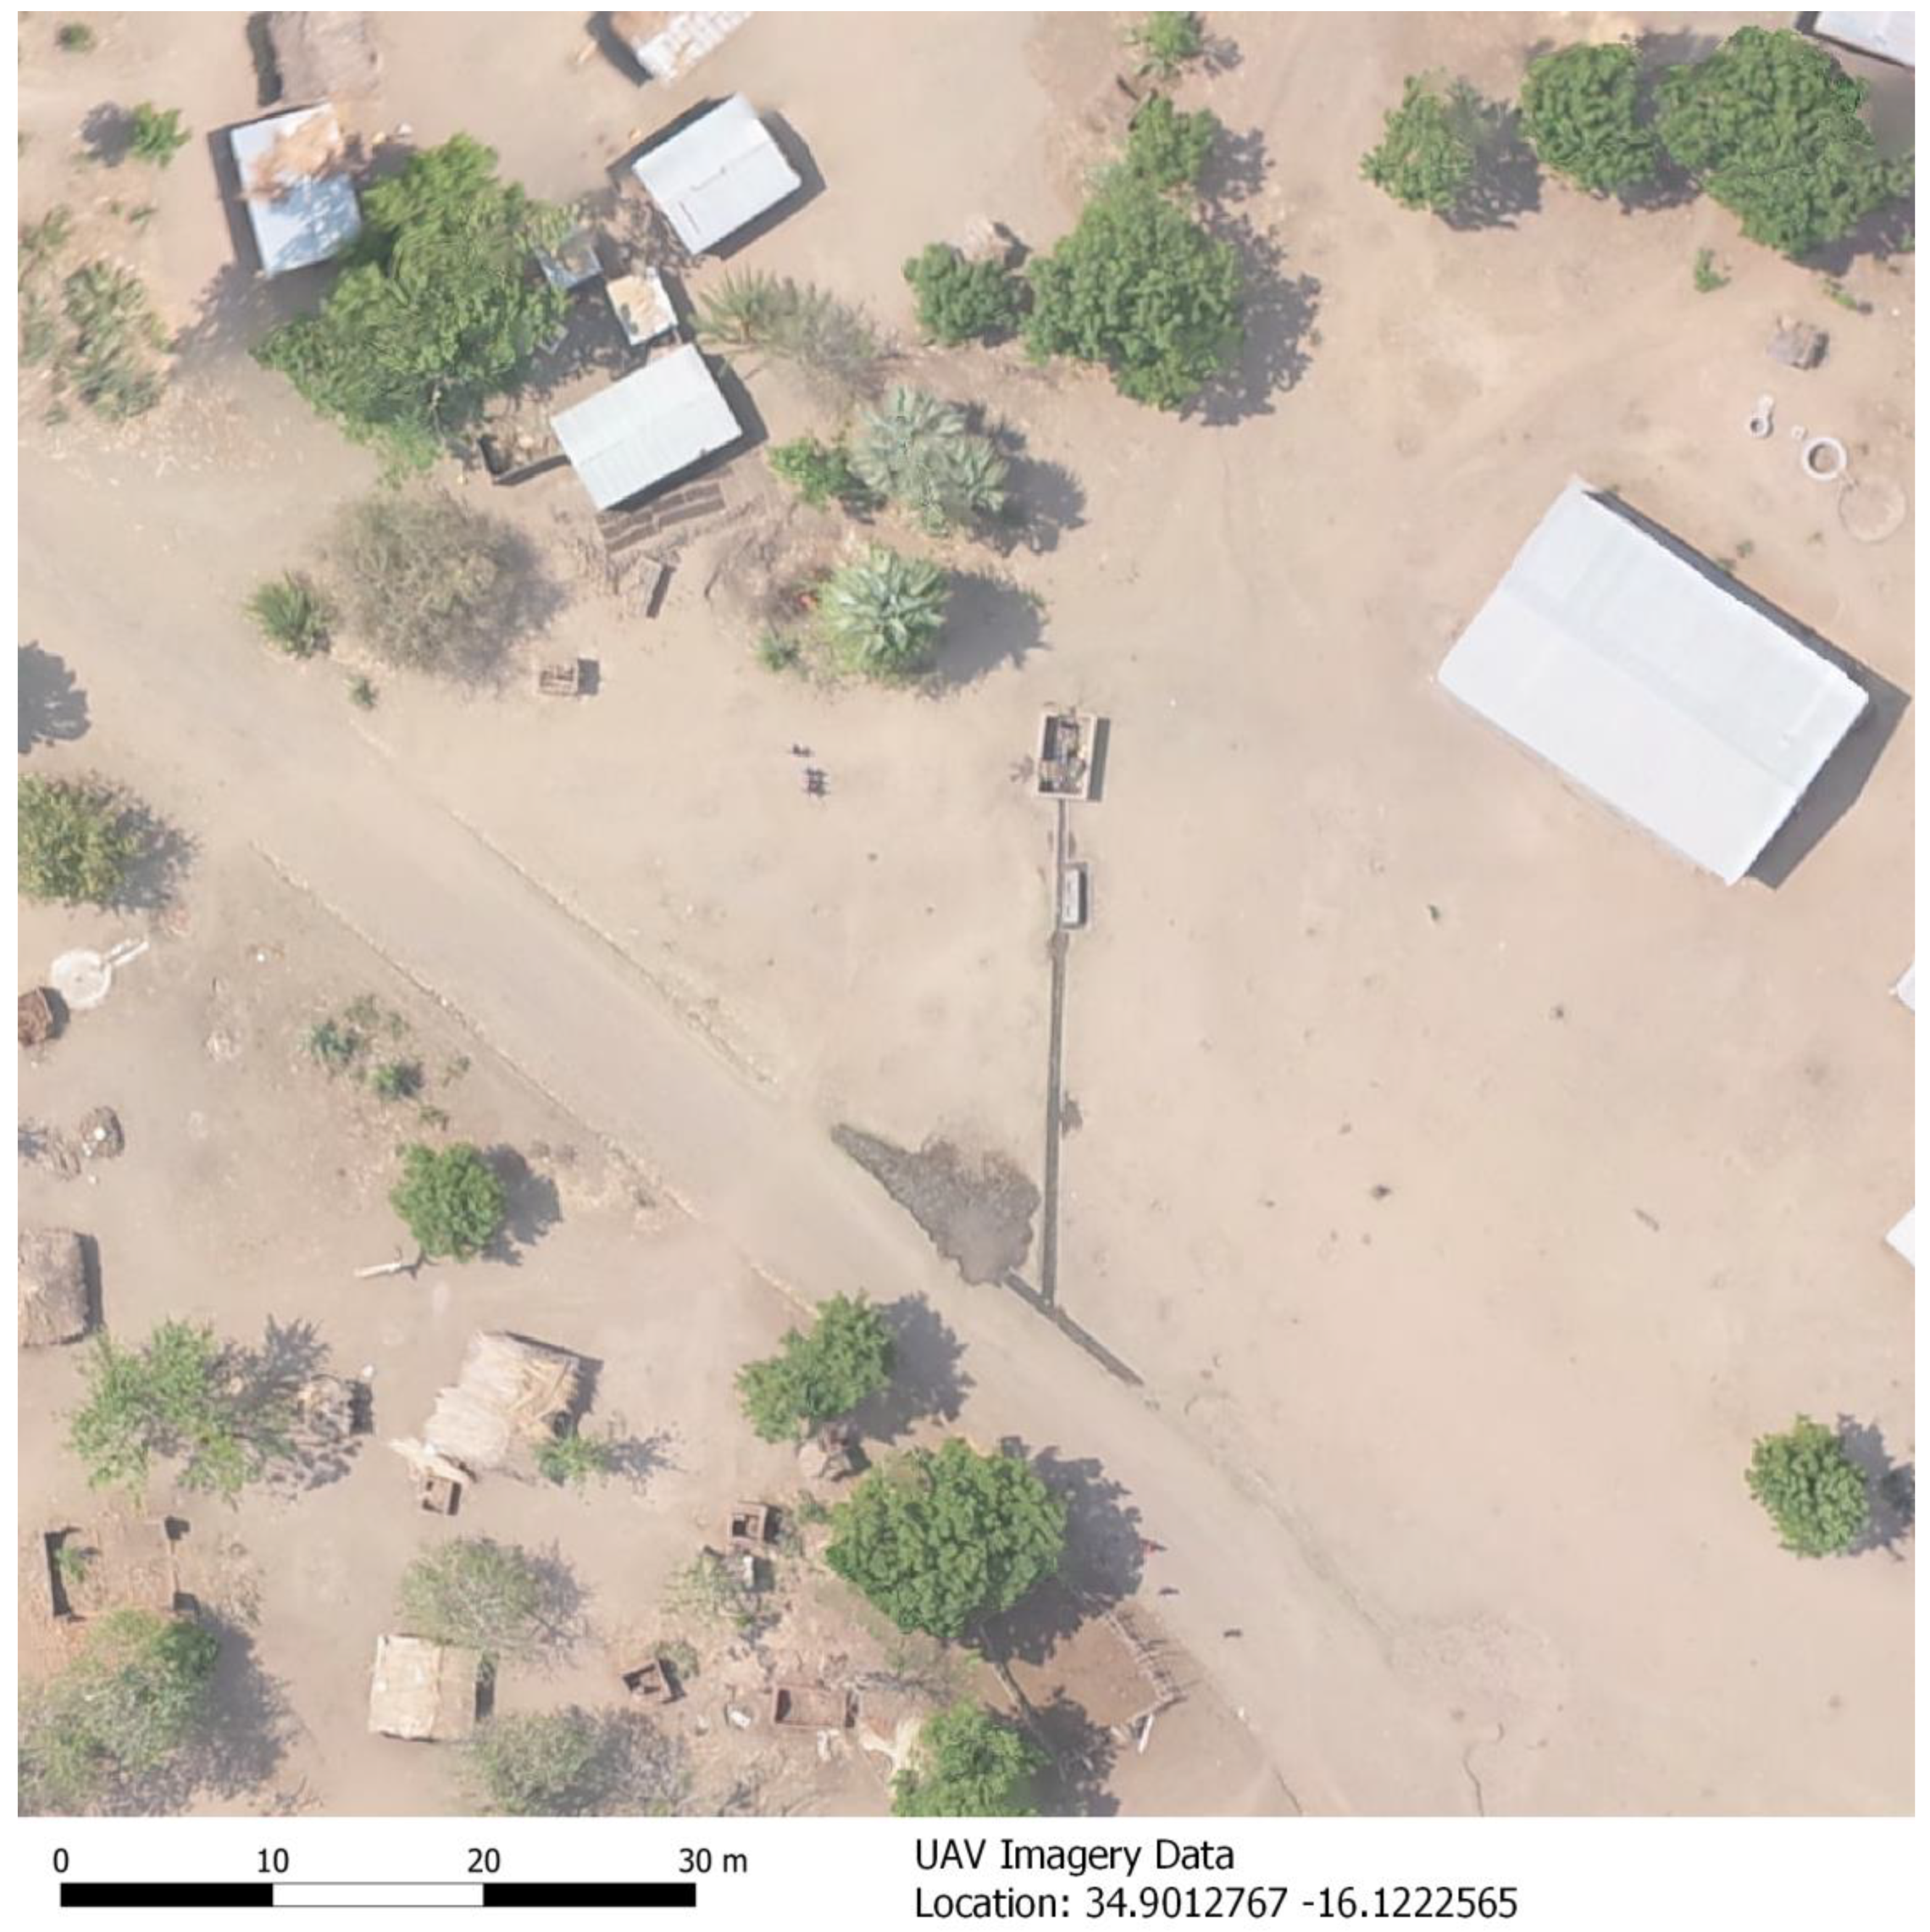
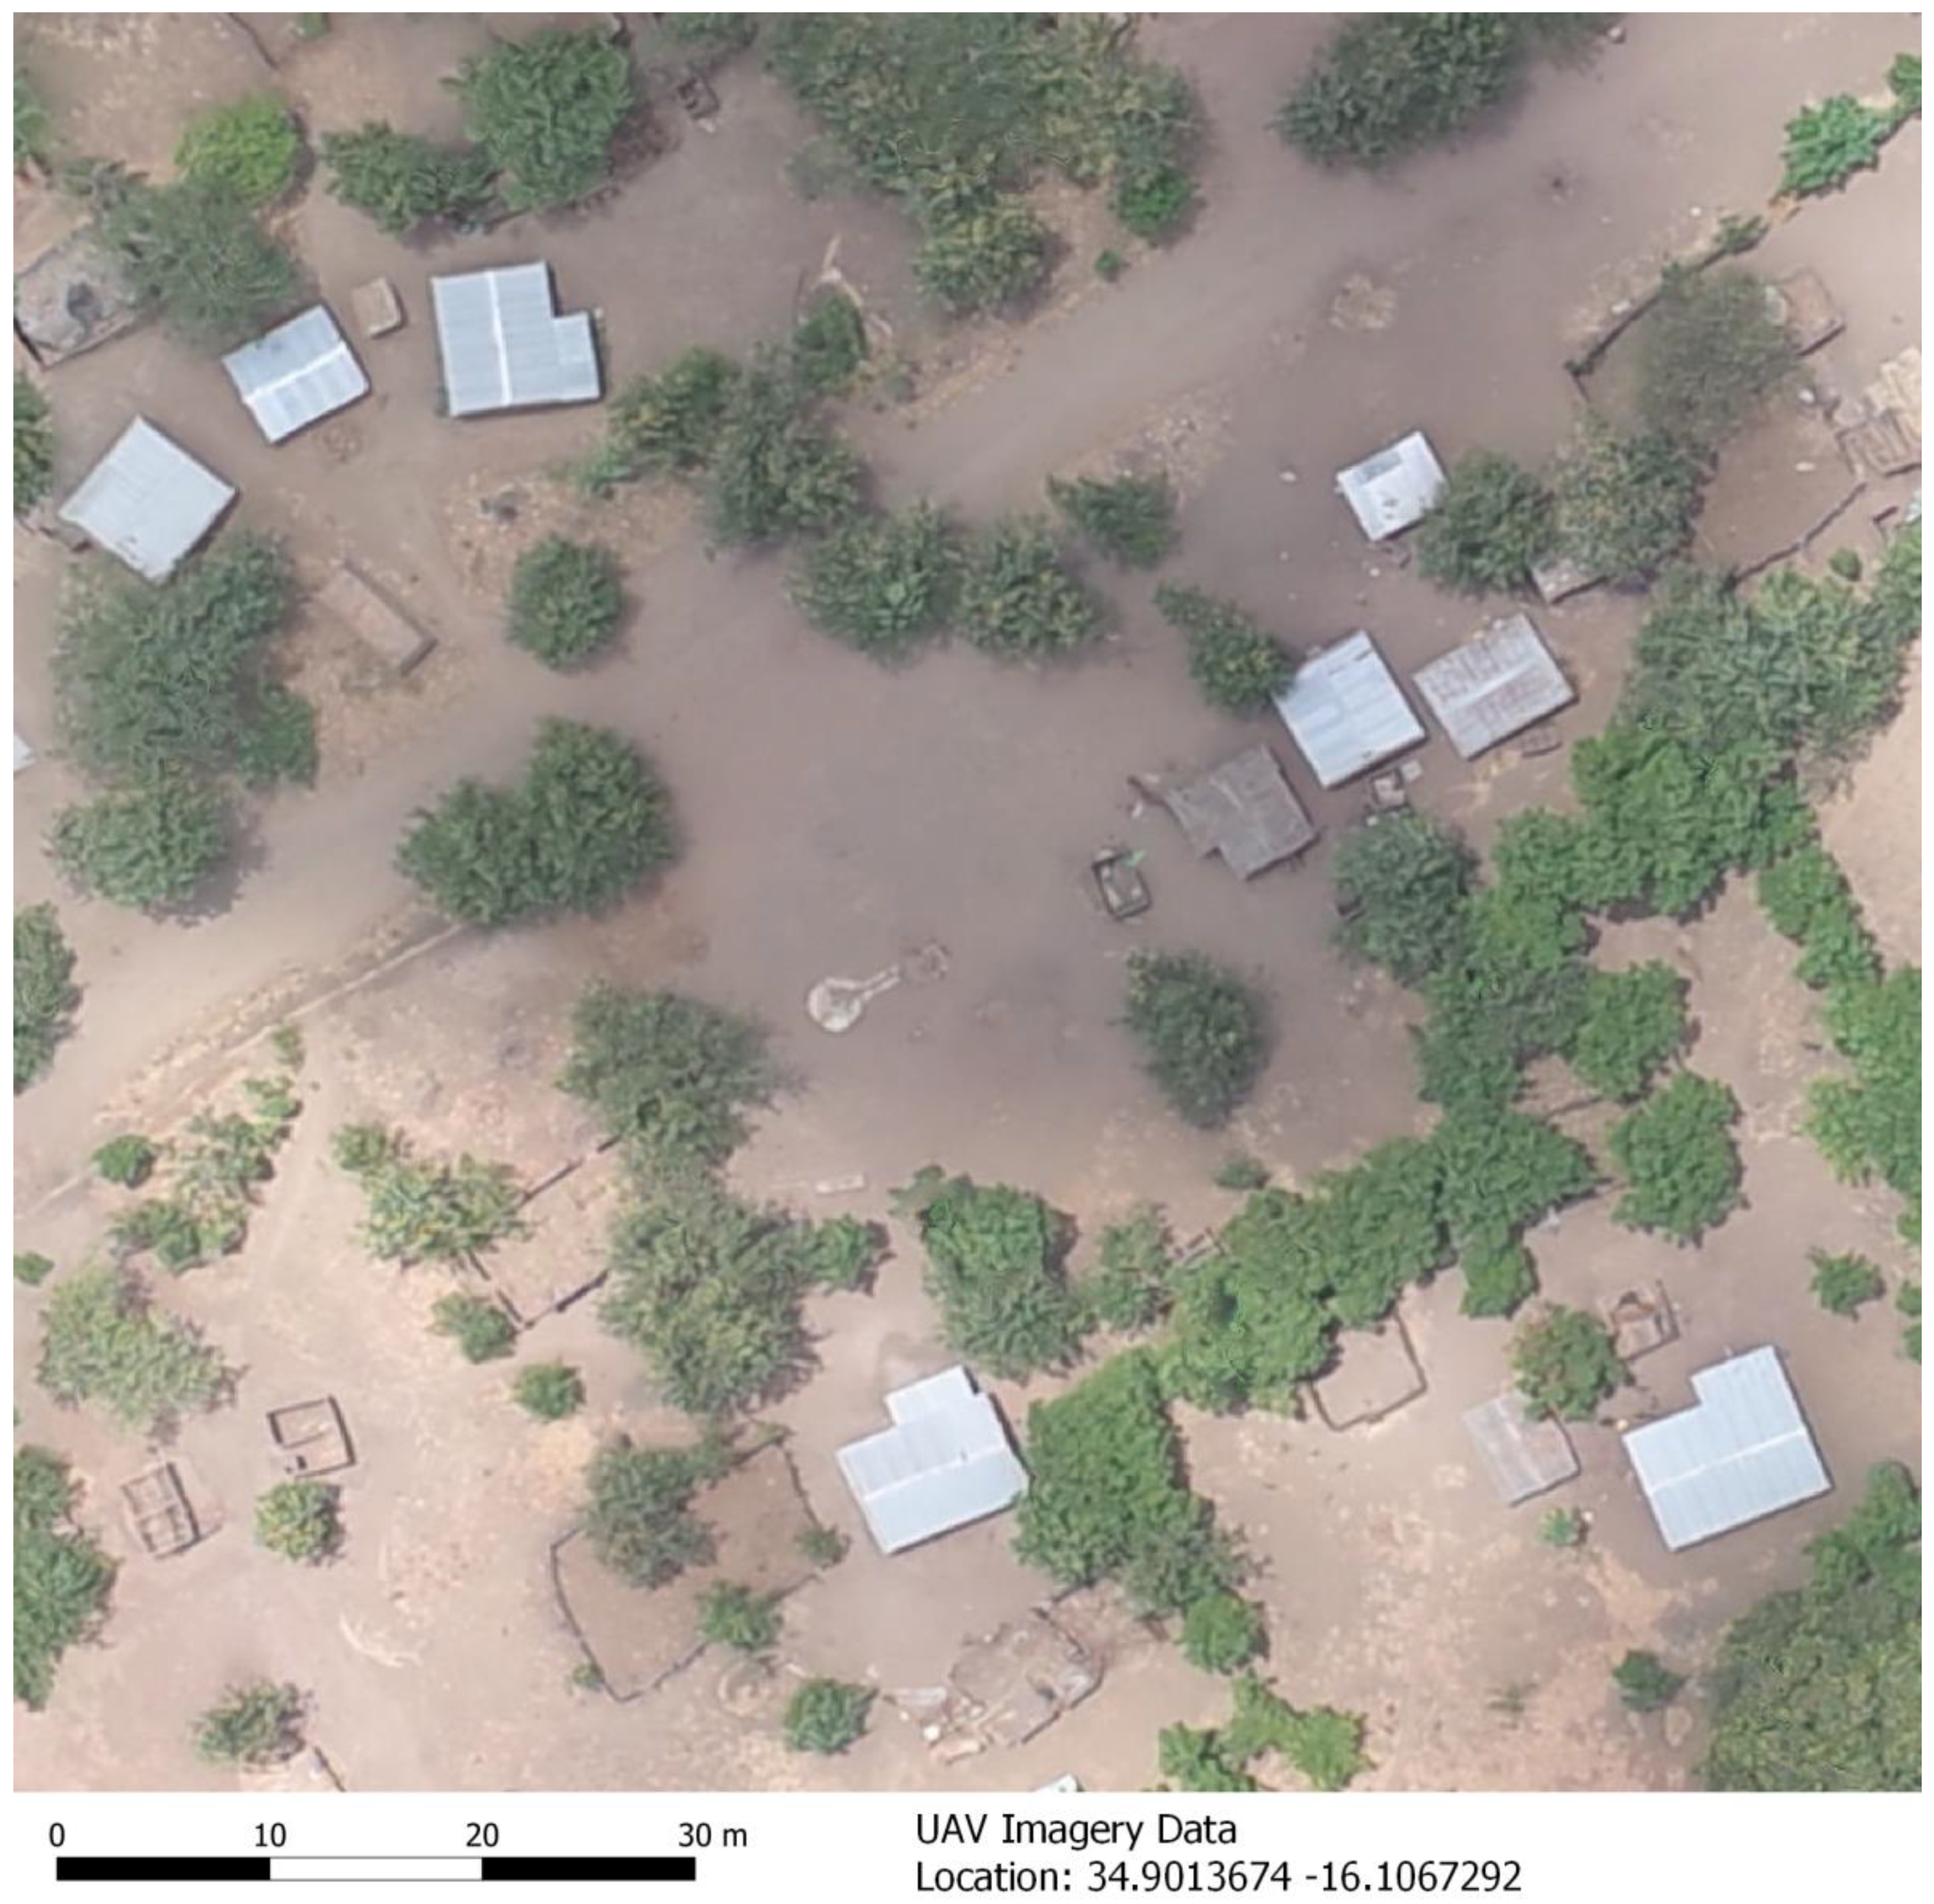
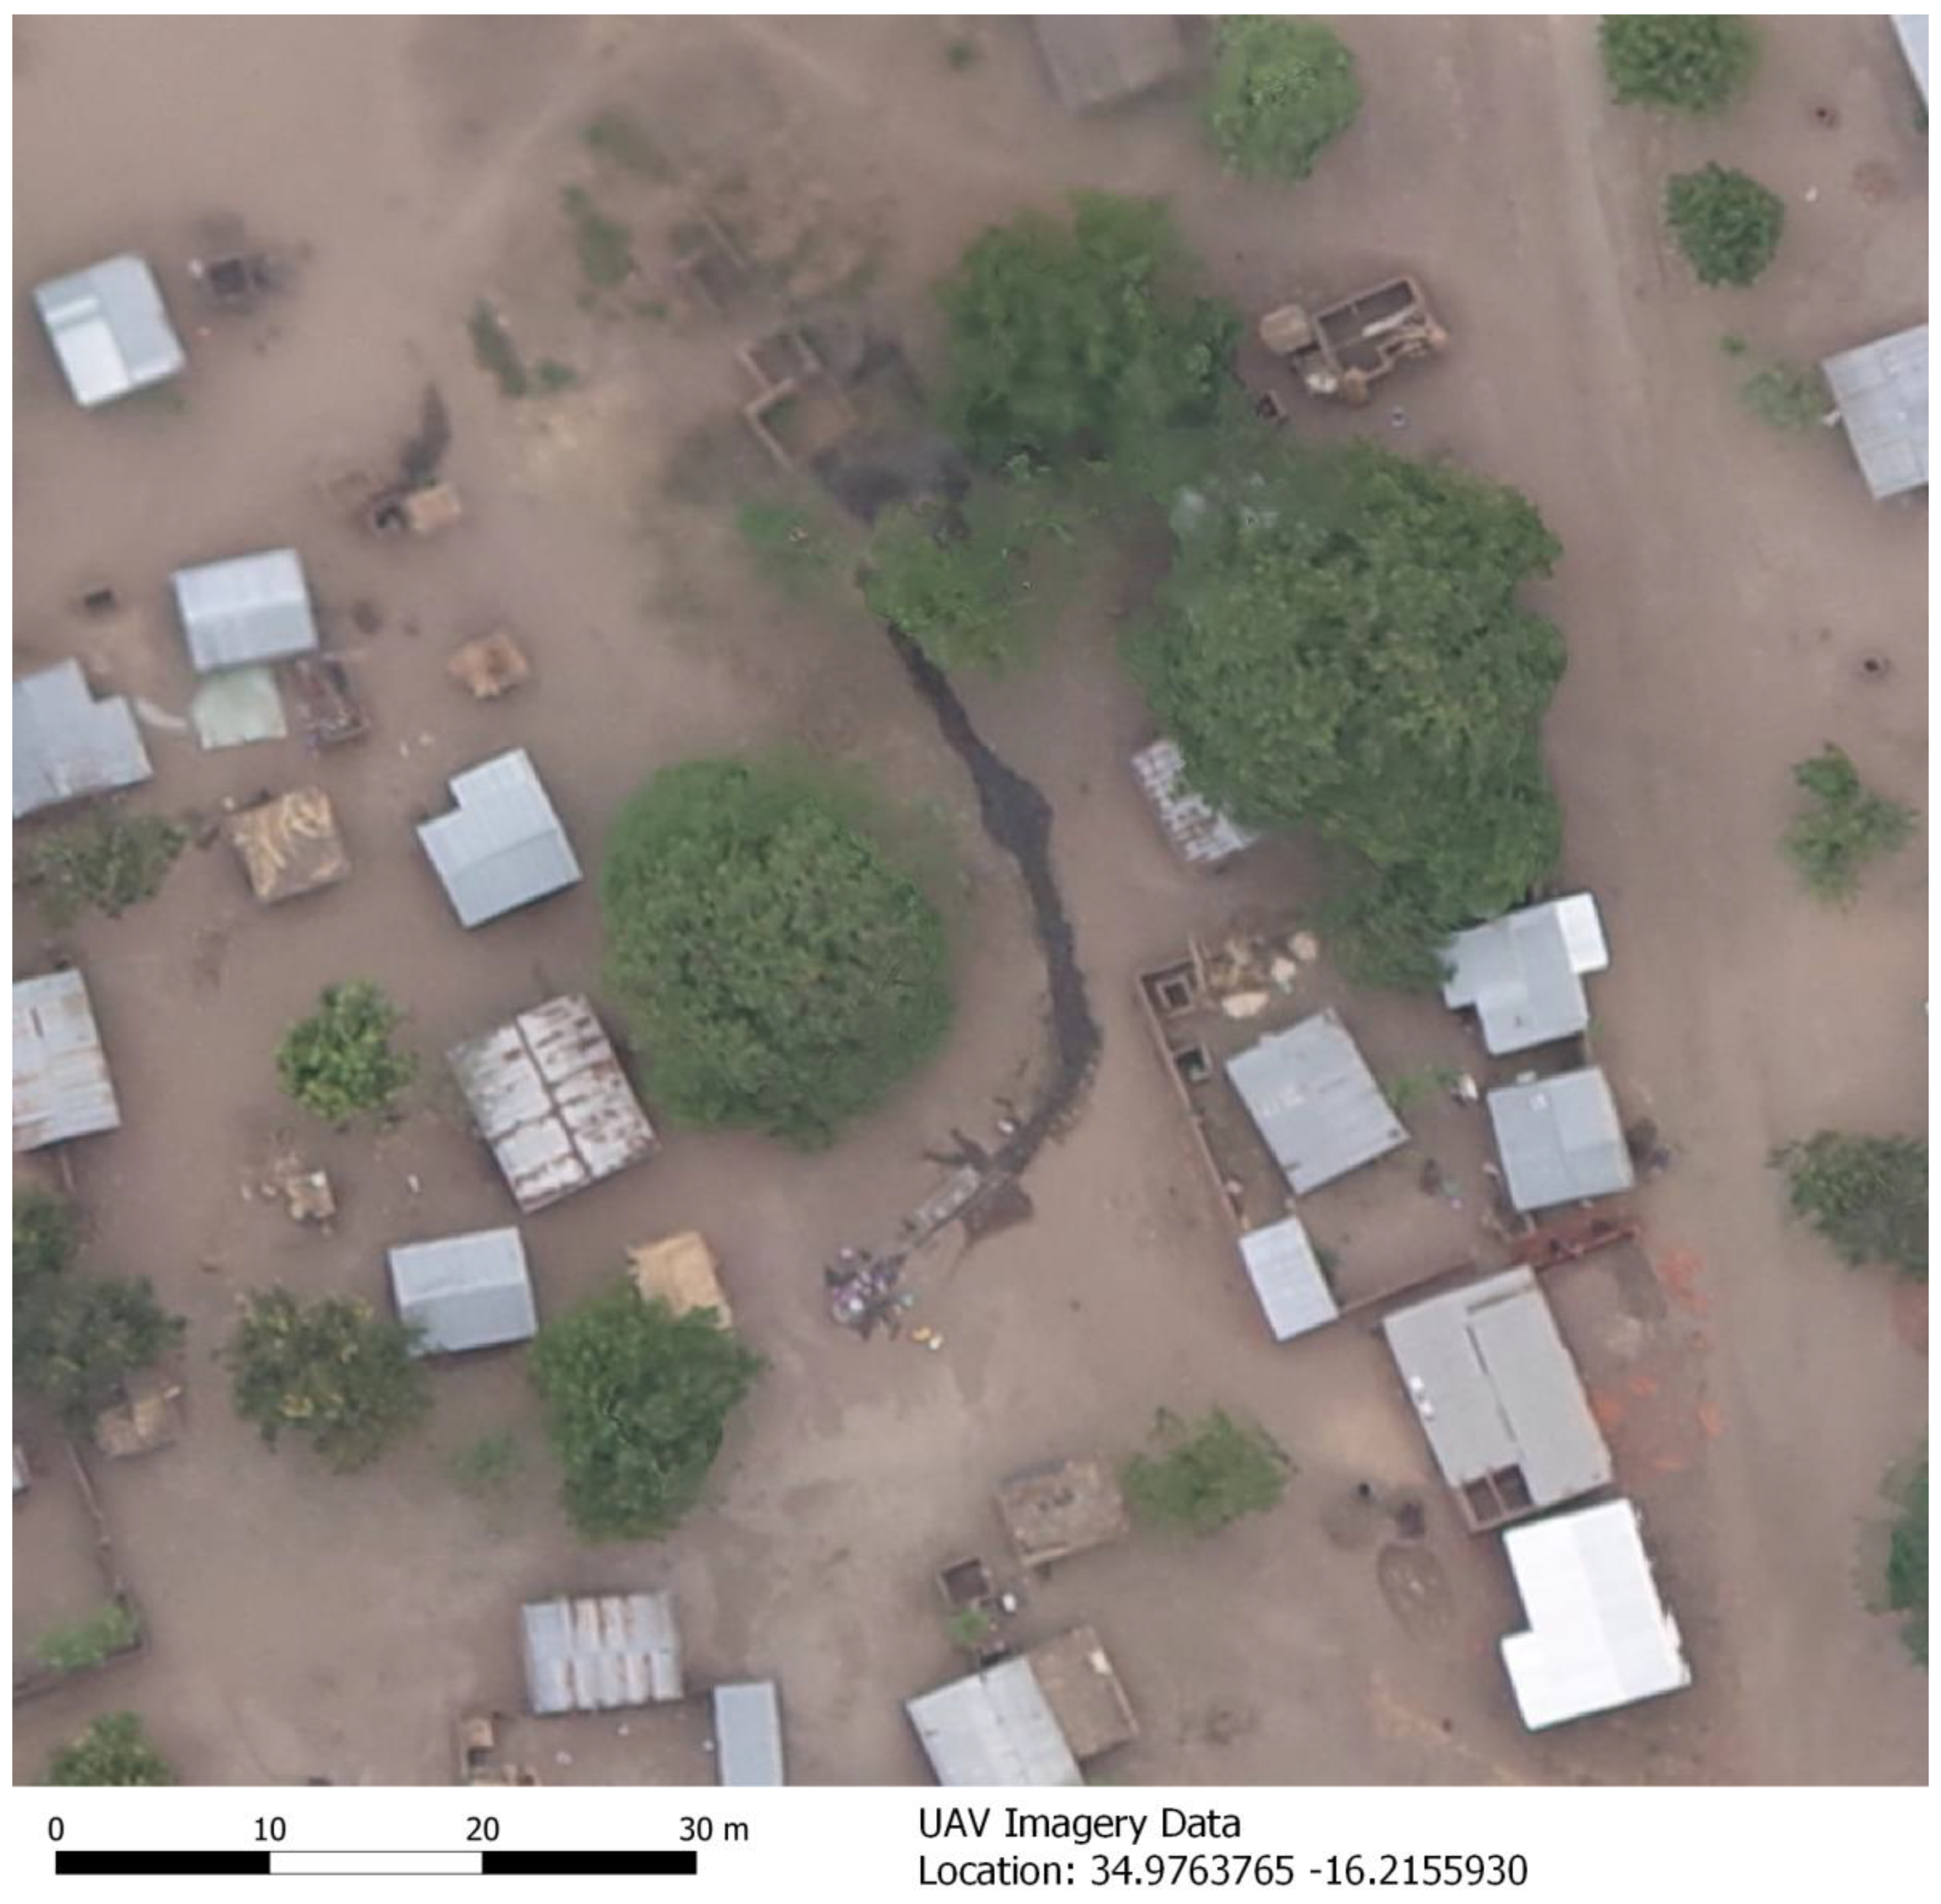
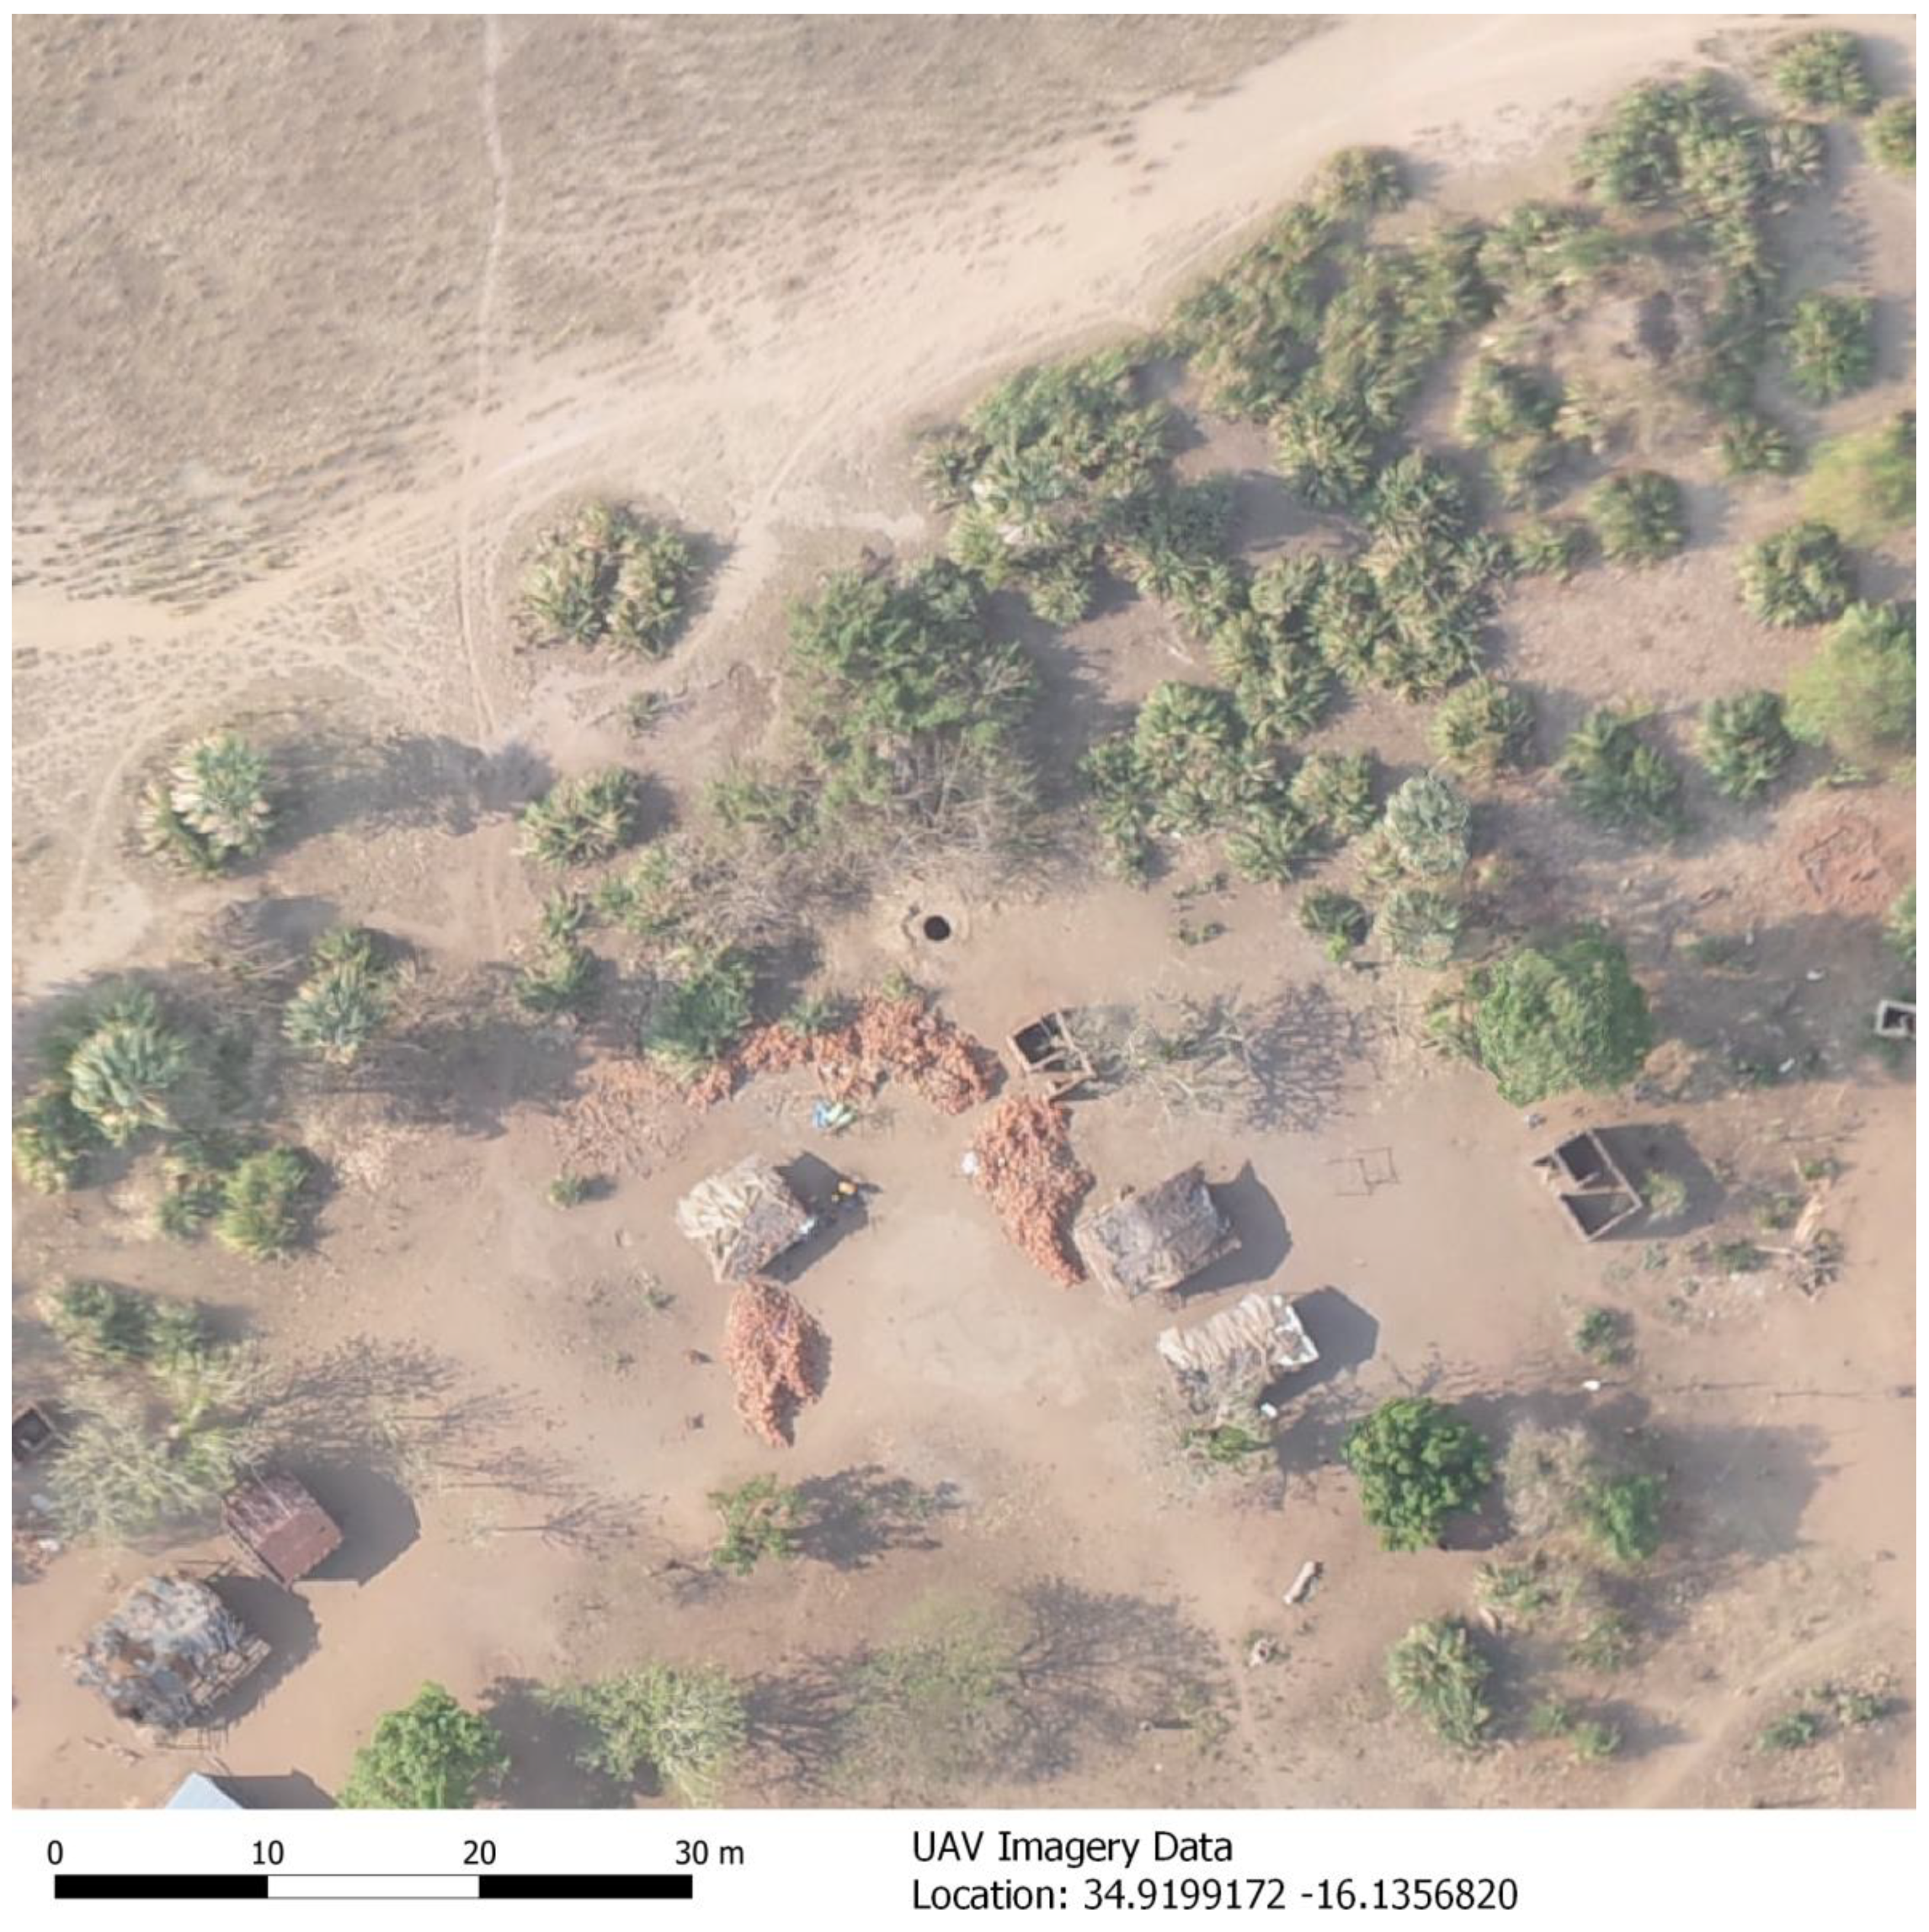
Figure 5, Figure 6, Figure 7 and Figure 8 show water points detected in UAV imagery. We can determine from a UAV image what the type of water point is and whether the water comes from an improved or unimproved source. Figure 5 shows a protected water point. The risk for dysfunctionality can be estimated by the level of protection of the water point (presence of walls, palisades, fences, or roofs). Dysfunctionality can also be deduced from dry soil around the water point (Figure 6), whereas wet spots on the soil show that the water point provides water (Figure 7). The risk for contamination can be assumed based on the proximity of the water source to visible sewage systems, latrines, or industries, for these can pollute ground- and surface water or water in rivers and lakes, or floods. Figure 8 shows a water point, located close to a latrine. It is possible to decide if a water point is located on a premise, but not whose premise it is. Therefore, the accessibility aspect of the location of a water point cannot be determined conclusively. In some cases, the UAV imagery allows us to say something on the usage of the water point if water spills, the presence of people, or buckets were visible.
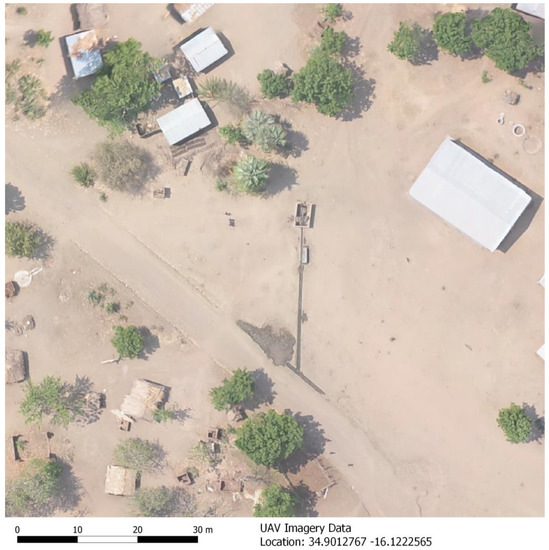
Figure 5.
Protected water point.
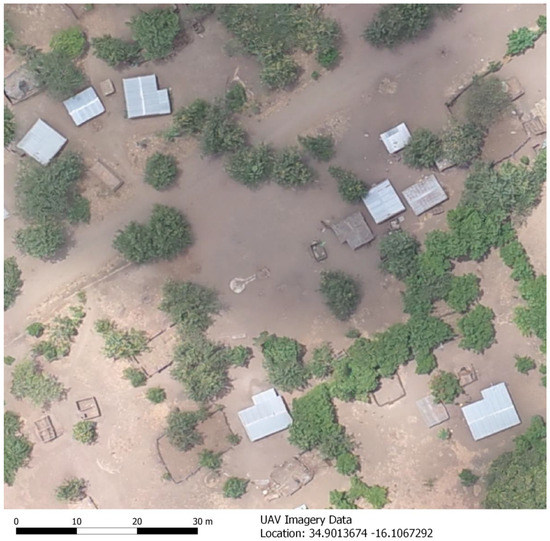
Figure 6.
Non-functional water point.
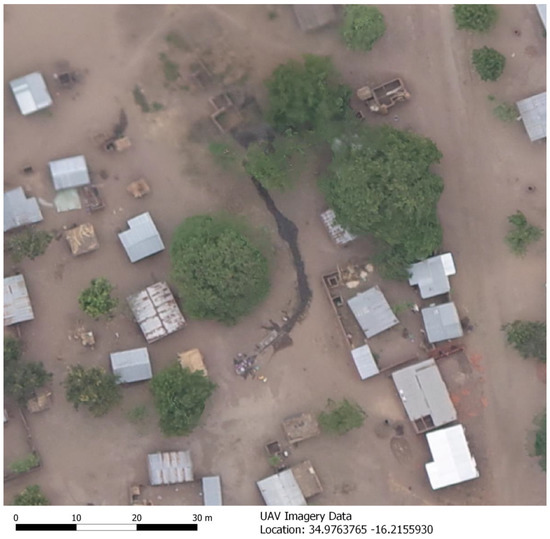
Figure 7.
Functional water point.
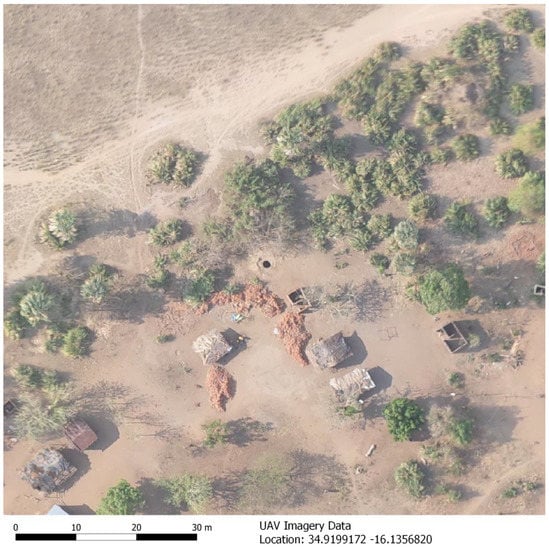
Figure 8.
Water point closely located to latrine.
3.2.2. Contrasting UAV Imagery with the Data on Water Points from other Organizations
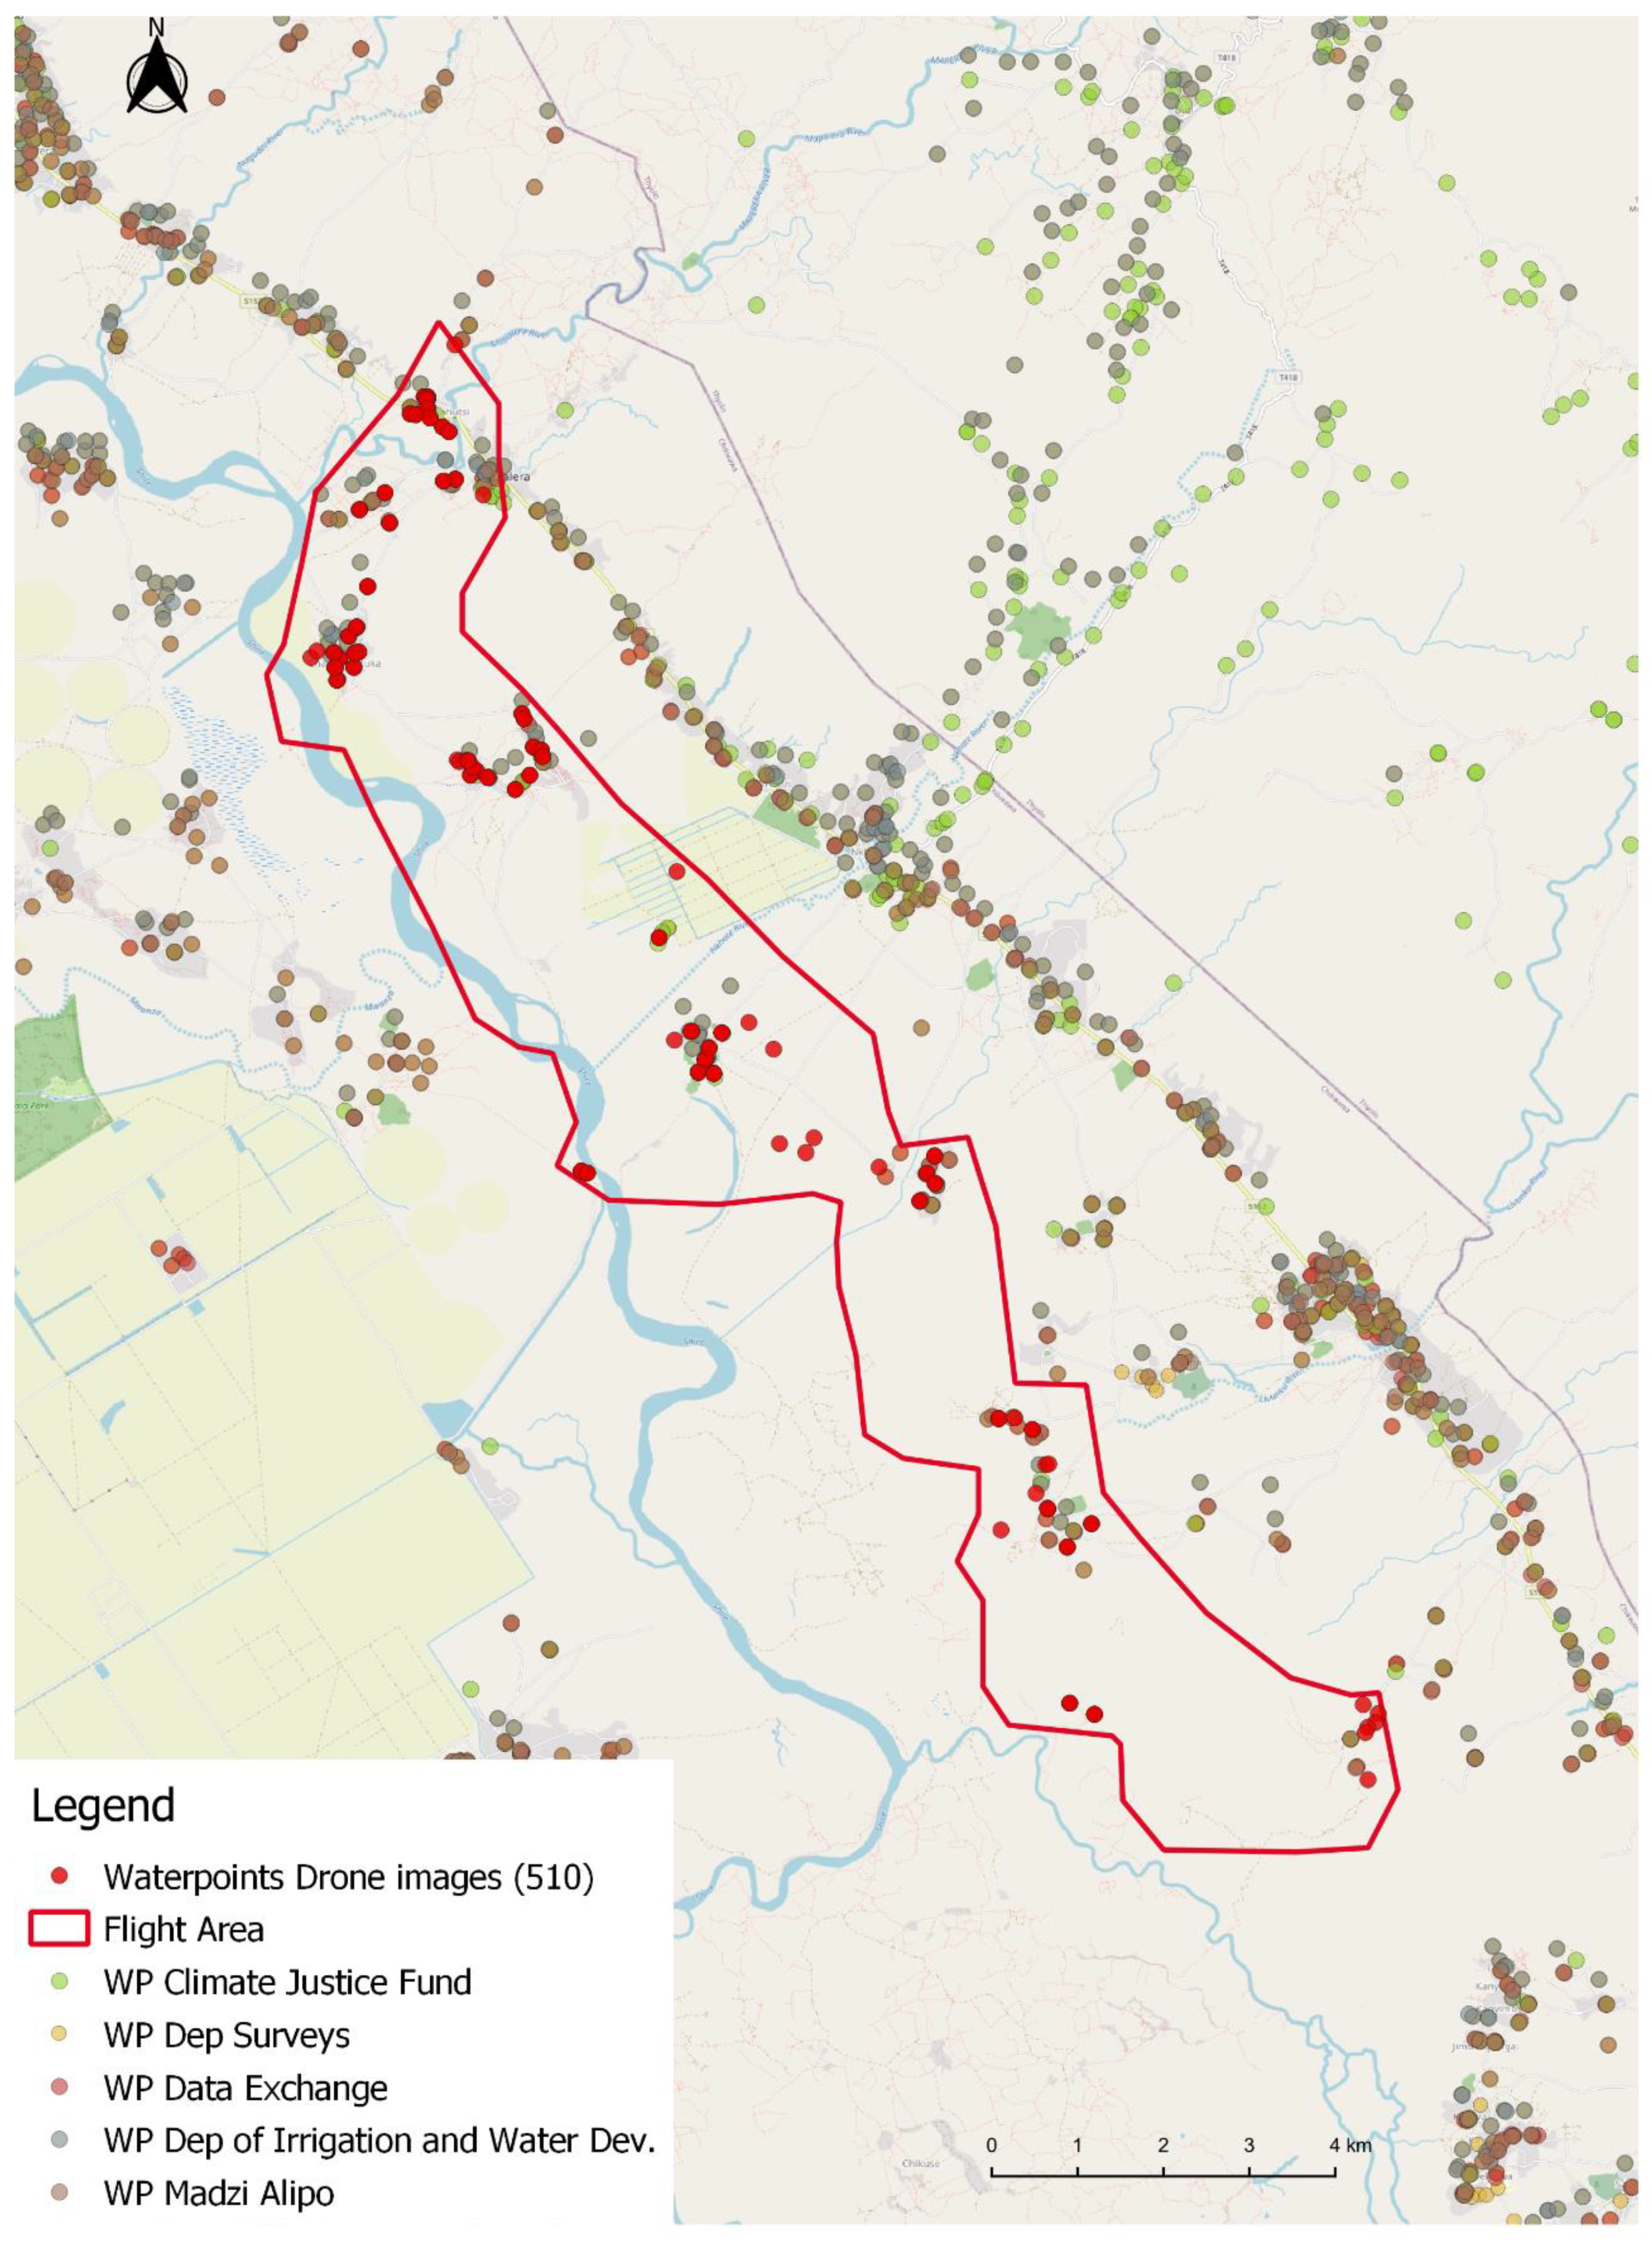
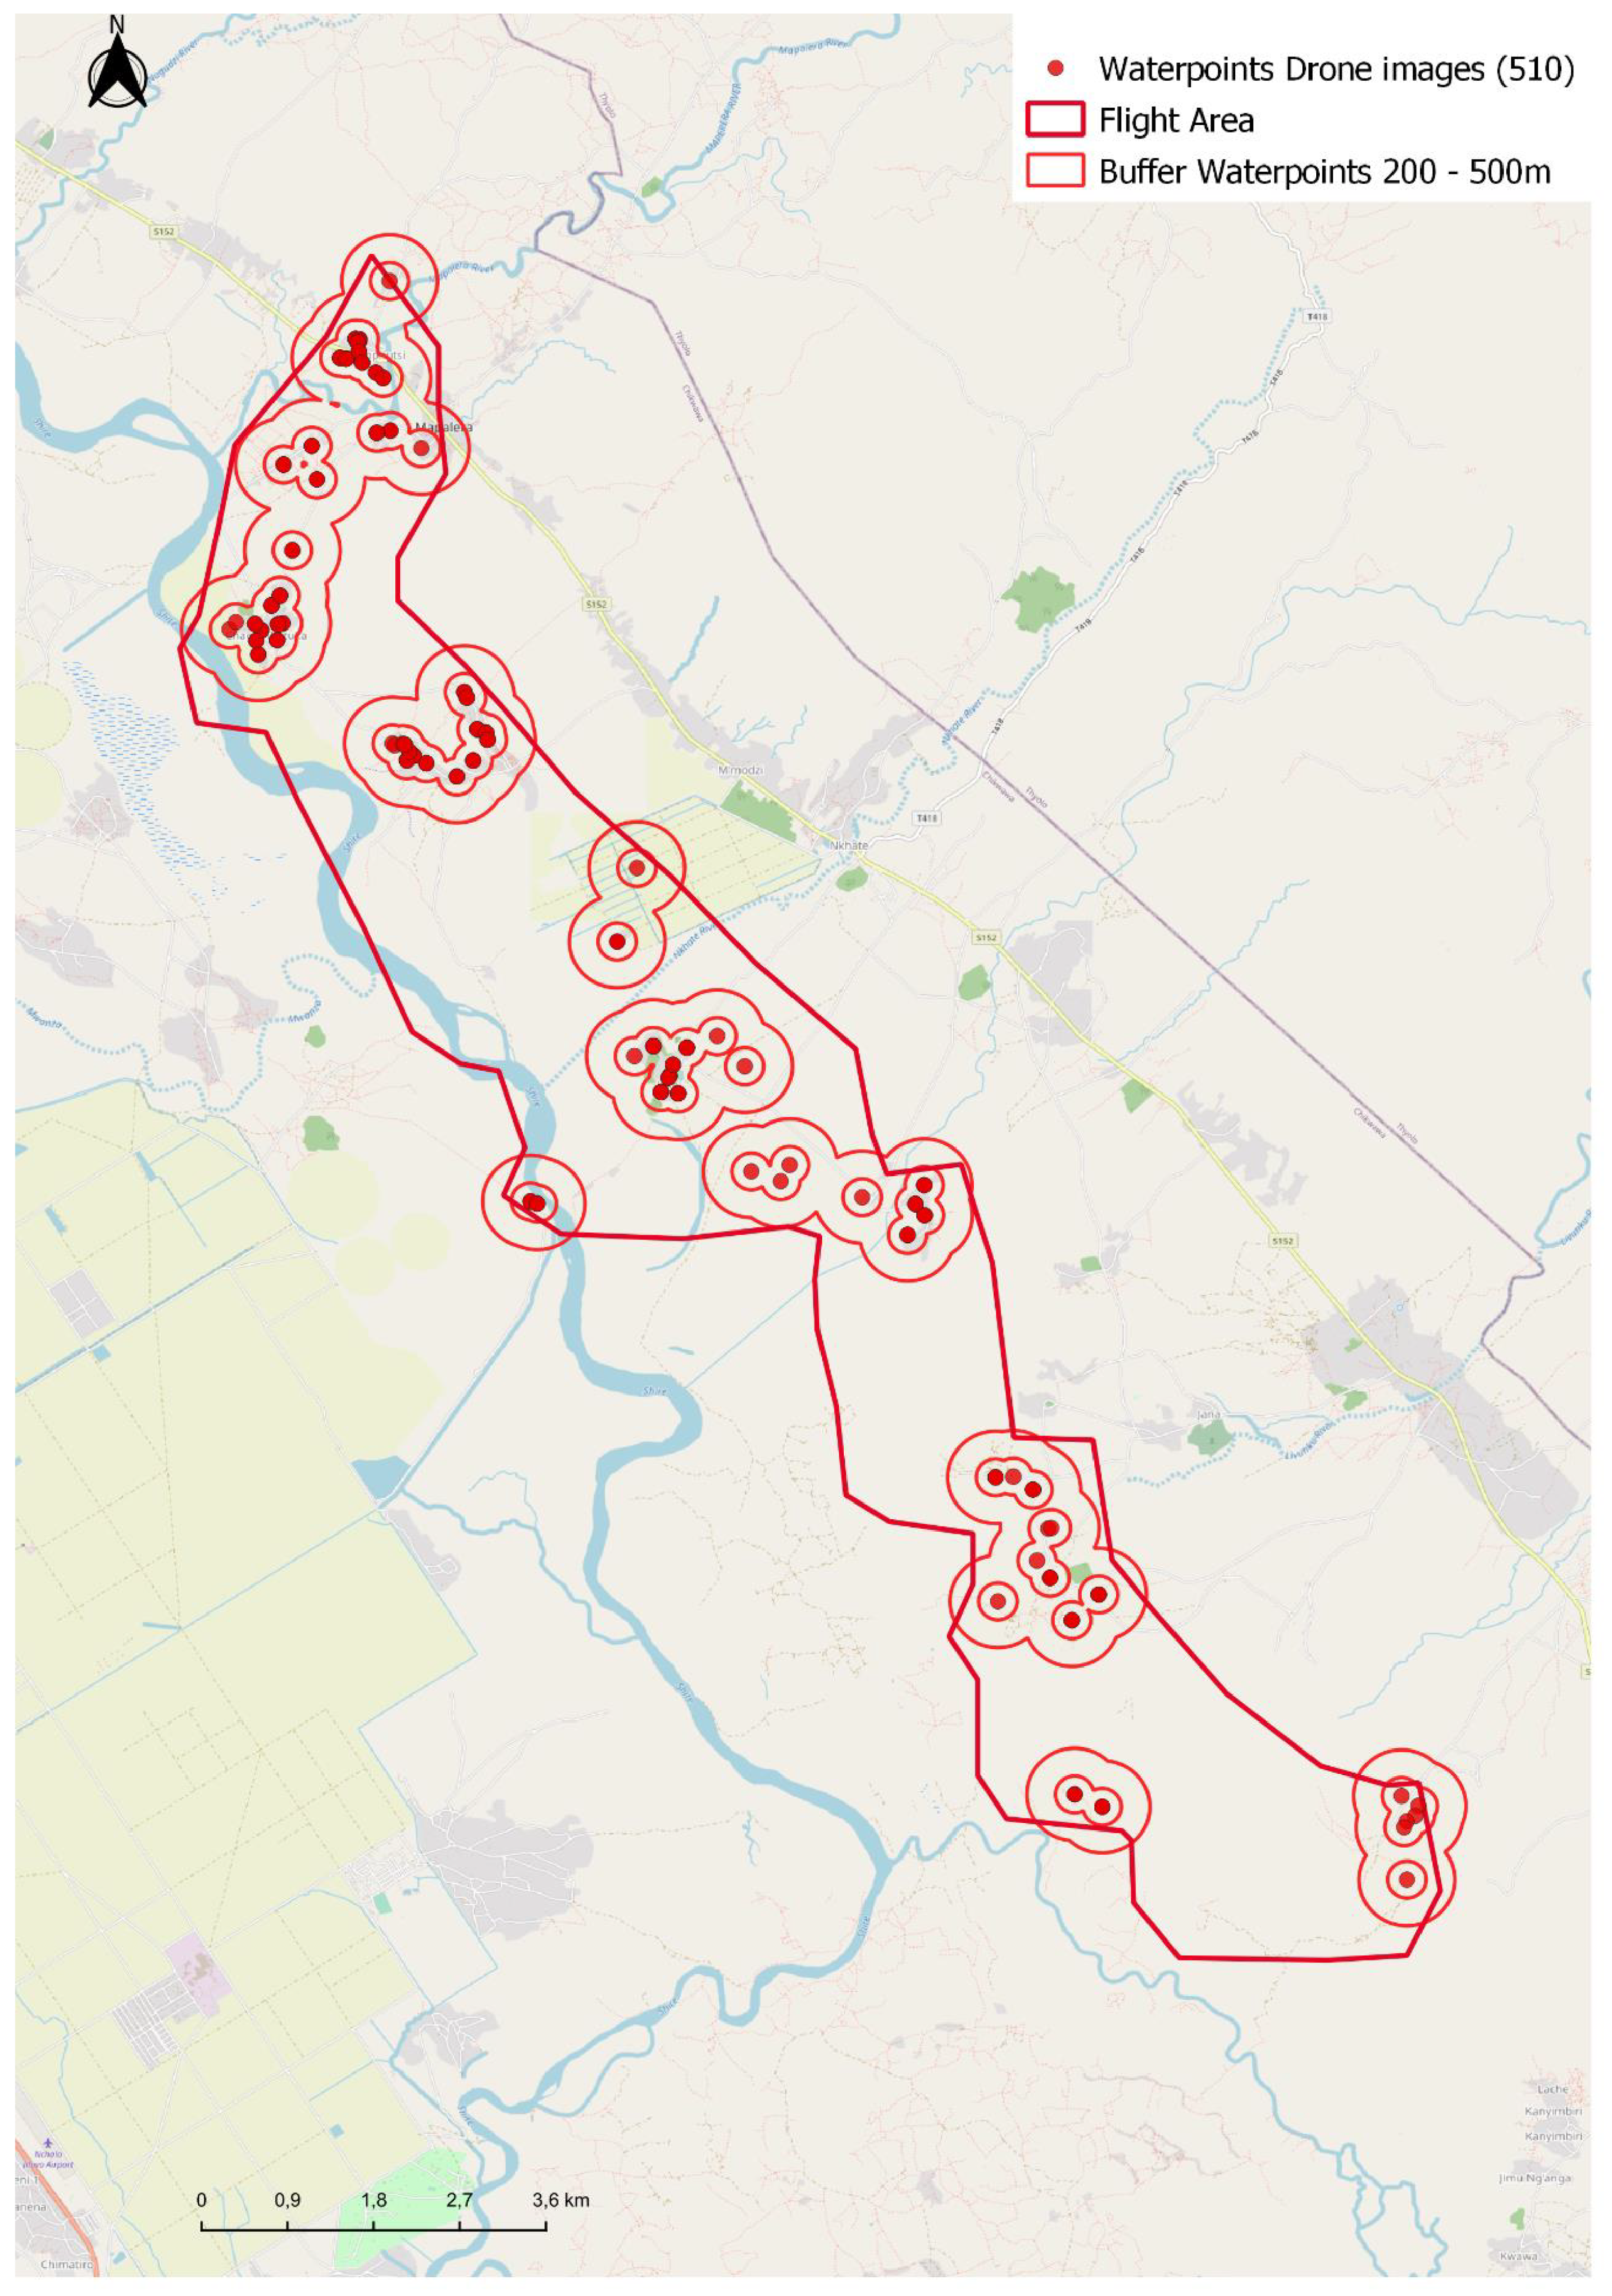
Figure 9 gives an overview of the water points (red circles) visually detected on the UAV imagery (red perimeter) as well as the water points from the field surveys. An automatic comparison in the open-source desktop GIS software QGIS enables finding water points in the water point field survey data within different buffers (15, 50, 100, 200, and 500 m). As shown in Figure 10, the 200 and 500 m buffers can, when close to the edge of the UAV flight area, fall outside the area. We consider that water points within 15 m from one another are the same water point as the accuracy of the GPS location might not be 100%.
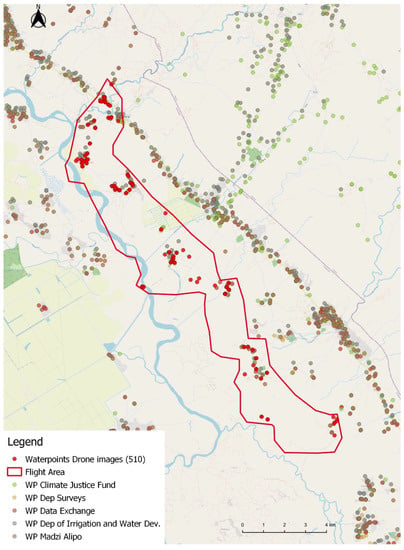
Figure 9.
Overview of water points (red circle) visually detected on the UAV imagery (red perimeter). Additionally, the water points from Madzi Alipo, Department of Irrigation and Water Development, Climate Justice Fund, Water Point Data Exchange, and Department of Surveys are depicted.
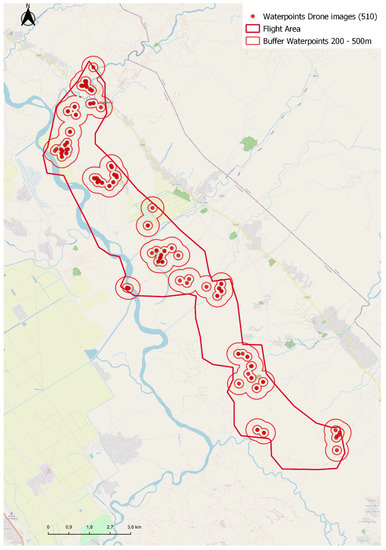
Figure 10.
Overview of the buffers (50 m, 100 m, 200 m, 500 m) created around the center point of the selected water points.
Table 2 shows that there is not a 100% match. The best match is with the Water Point Data Exchange data provider [24]. On the UAV imagery, more water points are detected, but also some water points are not matching. The non-matching can have multiple causes such as that the water point does not exist, it is below bushes/tree and not visible on the imagery, or it is no longer operational and dismantled. In these cases, only inspection in the field can provide a conclusive answer. In the case of matches, the more accurate location of water points can be added to OSM and the databases of the data providers. Table 3 gives an overview of the protection and the functionality of the water points as identified on the UAV imagery.

Table 2.
Comparison of water points found on UAV imagery (266 in total) with those in the databases.

Table 3.
Overview of water points identified in the UAV imagery.
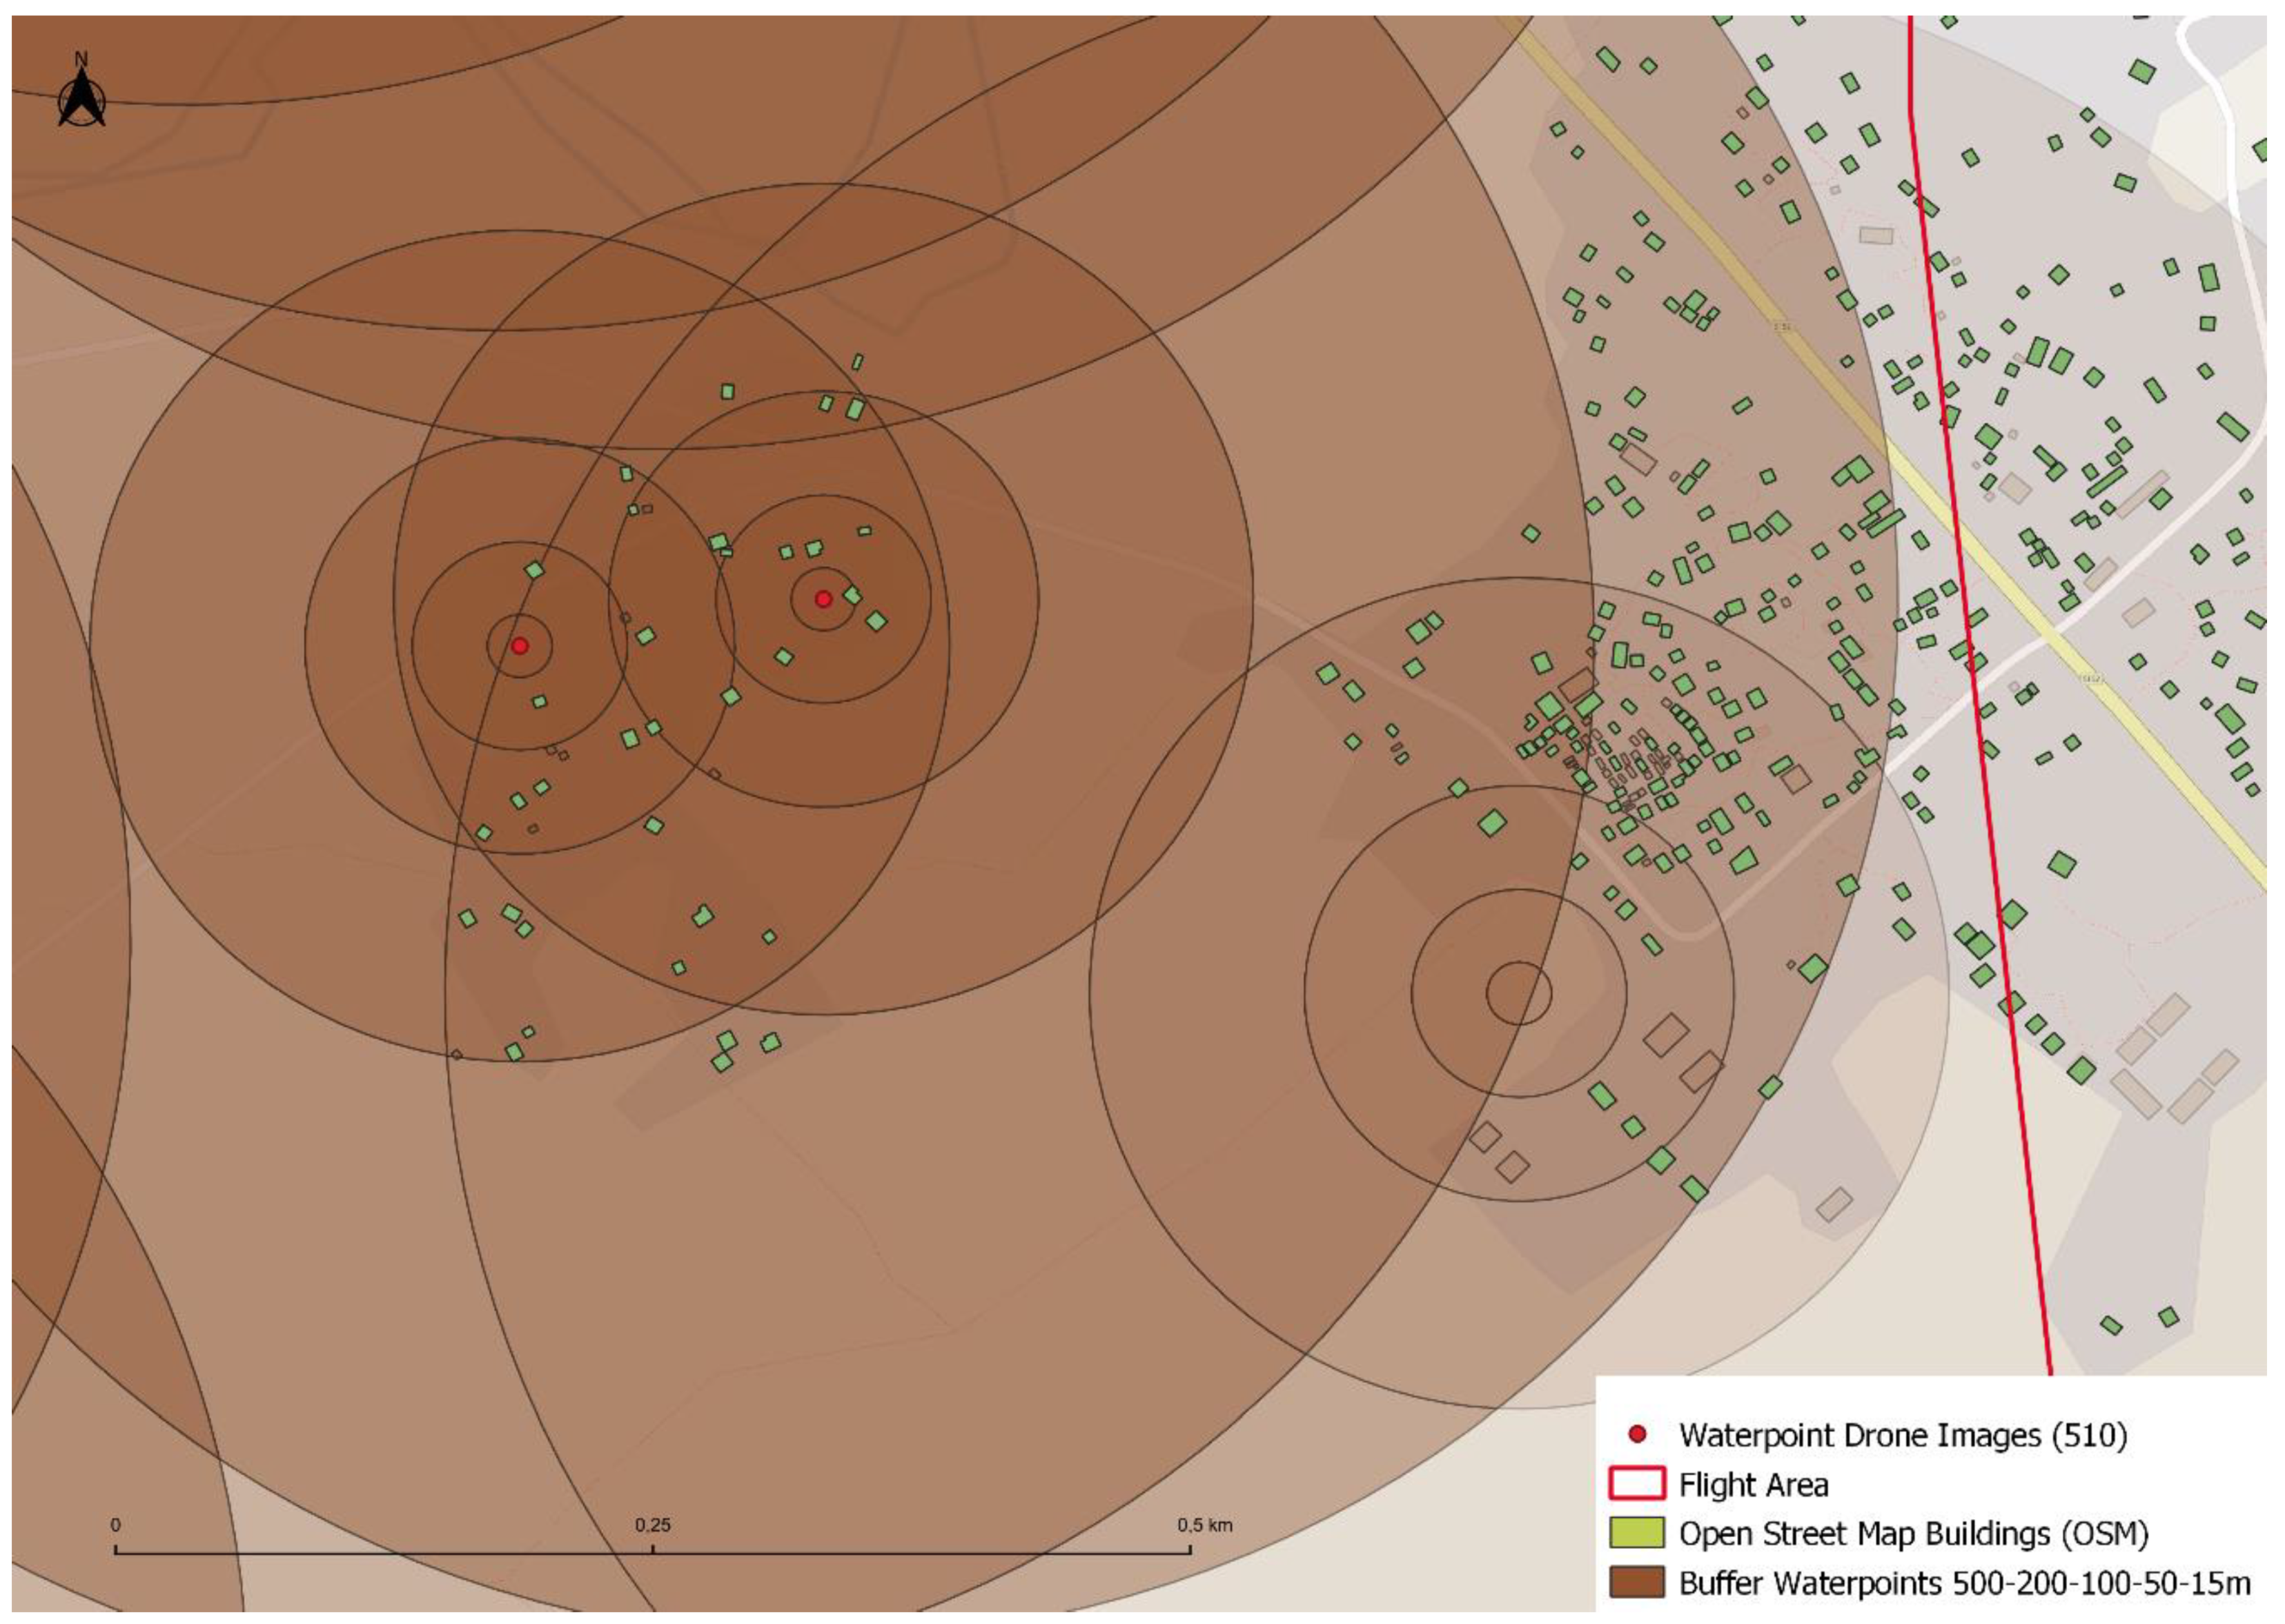
The next analysis is to calculate the number of OSM buildings in a radius around a water point in the UAV flight area (Figure 11). Table 4 gives the result for different ground surfaces of the buildings. The UAV imagery is closely located to the Mapalera town. As only part of the building footprint of this town is mapped by the OSM volunteers, there could be more water points close to the not mapped area that were not discovered during the visual detection. Therefore, the values in Table 4 are an estimation. It shows that all villages have one or more water points and that the biggest houses are located more in the center of the villages.
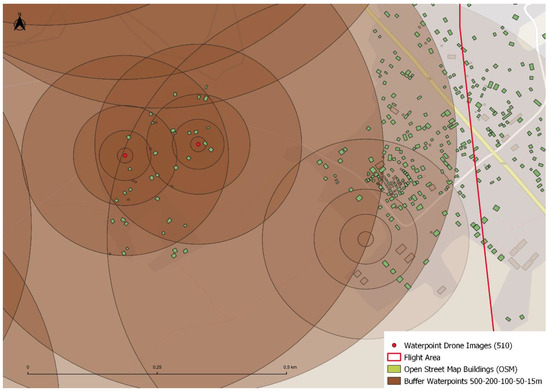
Figure 11.
Diagram showing how the number of OpenStreetMap buildings in different buffer zones around a water point can be calculated.

Table 4.
Overview of OpenStreetMap (OSM) buildings in the area with UAV images.
4. Discussion
Table 5 summarizes how data from various remote sensing, VGI, and field survey data can be combined to get more information on water points and their attributes. The left column is a long list of all the attributes found in the different water point datasets as provided by both governmental and NGO data providers [12]. We added an attribute on the number of users per water point.

Table 5.
Overview of the resolution and added value for water point attributes of the various data sources and their analysis method.
UAV images typically have a higher resolution than satellite images and are therefore more suitable for water point detection. The images we were able to collect with UAVs have a resolution of 11 cm, which is sufficient for the identification of water points. Satellite imagery of 30 cm resolution enables identifying the somewhat larger or walled water points, whereas 50 cm satellite imagery does not. The combination with OSM building footprint data are powerful and enables us to get more insights. However, the combination of OSM and UAV data did not fill all information gaps. Whereas our pilot proves that UAV imagery is promising in closing some information gaps, field surveys will remain necessary. Water quality, water point management, and whether a water point provides a free or a paid service cannot be determined from UAV imagery. Increased adoption of data collection tools that can capture spatial data instead of using paper or other non-spatial collection methods contributes to filling information gaps. Nevertheless, combining remote sensing data with field survey data can play an important role, especially if, for example, the remote sensing data are taken at more regular intervals than the field surveys.
Besides information gaps, combining remote sensing, VGI and field survey data is essential in responding to geographical gaps. Location analysis can be used to identify the spatial deficits in information coverage. Once these are identified, new data can efficiently be collected in target areas. This can be done either by conducting field surveys or by UAV missions as described above. Hereby the OSM community can support by mapping the targeted areas on the UAV imagery.
In terms of the different aerial imagery available, satellite imagery would be the most scalable compared to UAV and paerial photography. Commercial satellite data providers can capture any place on earth at very regular intervals and usually offer resolutions from 30 cm onwards. However, funding issues for high-resolution satellite imagery will need to be resolved. Prices for 50 cm resolution are typically between $20 to $40 per km2 [25], and hence higher resolution will be most likely more expensive. RCMRD gives as the surface of Malawi 118,484 , which would amount to a cost of over $2.3 million. This cost will be an upper limit as probably satellite providers reduce the cost per if one buys imagery for a very large area. RCMRD charged NSO US $1.1 million for technical assistance and the satellite imagery for the whole of Malawi (but for 0.5 m up to 2.5 m resolution) [18]. To compare, Malawian drone companies typically request around US $5 per hectare, which amounts to US $ 500 per km2. Costs for nationwide field surveys are more difficult to determine. According to [2] and [26], sample-based methods such as household surveys cost on average between US $460,000 to 1.7 million depending on the type of survey used.
5. Conclusions
The main implication of our research is that we have created, for small areas, a cost-effective workflow that can create an up-to-date and consistent water point dataset. This workflow combines UAV imagery, VGI, and field survey data. Important in combining these heterogeneous datasets is the information on buildings mapped through the open VGI platform OSM, whereby OSM enables easy and systematic scaling of the mapping to other areas. The resulting water point data fill a gap in the data needs for monitoring water-related SDGs on a sub-national level as it provides more details on the service level of water points at the household level. Our analysis clarifies the added value per data source, given that the attribute information and quality vary.
Future research will assess how collaboration with other organizations doing UAV analysis in Malawi can potentially enable scaling of the approach tested in this pilot. OpenAerialMap [27] already has some UAV imagery from different areas of Malawi available. The expectation is that the amount of openly available imagery will grow, given that more and more low-cost UAVs become available, and more and more governmental and humanitarian organizations start using them. We will also look into using other geospatial data such as the High-Resolution Settlement Layer, as it gives a high-resolution estimation of people living in the area. Digital Elevation Models extracted from UAV imagery can serve to identify which water points will be most at risk of getting flooded and for which return periods. Overall, building data collaboratives [12] will be essential to align the different data collection efforts and facilitate data sharing among the many actors involved in the fragmented WASH sector.
Author Contributions
Conceptualization, Marc van den Homberg; methodology, Marc van den Homberg and Arjen Crince; software, Arjen Crince and Jurg Wilbrink; validation, Marc van den Homberg, Arjen Crince, Daniël Kersbergen; formal Analysis, Marc van den Homberg, Arjen Crince; investigation, Marc van den Homberg; Arjen Crince; Jurg Wilbrink; Rob Lemmens; resources, Jurg Wilbrink, Marc van den Homberg, Simon Tembo, Gumbi Gumbi; data curation, Arjen Crince, Jurg Wilbrink, Daniël Kersbergen, Simon Tembo, Gumbi Gumbi; writing—original draft preparation, Marc van den Homberg; writing—review and editing, Marc van den Homberg; Rob Lemmens; visualization, Arjen Crince; supervision, Marc van den Homberg; project administration, Marc van den Homberg; funding acquisition, Marc van den Homberg. All authors have read and agreed to the published version of the manuscript.
Funding
This research is based on the results of the project “Building a Data Collaborative to support SDGs on Health and WASH in Malawi and the Democratic Republic of Congo” funded by the 2017 Innovation Fund of the Global Partnership for Sustainable Development Data (GPSDD) in partnership with the World Bank. The project consortium consisted of the Malawi Red Cross Society (MRCS), CartONG and 510, an initiative of The Netherlands Red Cross. The MRCS drone and the drone mission was financed through the first and second European Civil Protection and Humanitarian Aid Operations (ECHO) program in Malawi.
Conflicts of Interest
The authors declare no conflict of interest.
References
- Metadata Indicator SDG 6. Available online: https://unstats.un.org/sdgs/metadata (accessed on 30 November 2019).
- Fritz, S.; See, L.; Carlson, T.; Haklay, M.M.; Oliver, J.L.; Fraisl, D.; Wehn, U. Citizen science and the United Nations sustainable development goals. Nat. Sustain. 2019, 2, 922–930. [Google Scholar] [CrossRef]
- Kitchin, R.; Lauriault, T.P. Small data in the era of big data. GeoJournal 2015, 80, 463–475. [Google Scholar] [CrossRef]
- See, L.; Fritz, S.; Moorthy, I.; Danylo, O.; van Dijk, M.; Ryan, B. Using Remote Sensing and Geospatial Information for Sustainable Development. In From Summits to Solutions: Innovations in Implementing the Sustainable Development Goals; Desai, R., Kato, H., Kharas, H., McArthur, J.W., Eds.; Brookings Institution Press: Washington, DC, USA, 2018. [Google Scholar]
- Walz, Y.; Min, A.; Dall, K.; Duguru, M.; Villagran de Leon, J.-C.; Graw, V.; Dubovyk, O.; Sebesvari, Z.; Jordaan, A.; Post, J. Monitoring progress of the Sendai Framework using a geospatial model: The example of people affected by agricultural droughts in Eastern Cape, South Africa. Prog. Disaster Sci. 2020, 5, 100062. [Google Scholar] [CrossRef]
- Lemmens, R.; Lungo, J.; Georgiadou, Y.; Verplanke, J. Monitoring rural water points in Tanzania with mobile phones: The evolution of the SEMA app. ISPRS Int. J. Geo-Inf. 2017, 6, 316. [Google Scholar] [CrossRef]
- Fraisl, D.; Campbell, J.; See, L.; Wehn, U.; Wardlaw, J.; Gold, M.; Moorthy, I.; Arias, R.; Piera, J.; Oliver, J.L.; et al. Mapping citizen science contributions to the UN sustainable development goals. Sustain. Sci. 2020, 2020, 1–17. [Google Scholar]
- Anderson, K.; Ryan, B.; Sonntag, W.; Kavvada, A.; Friedl, L. Earth observation in service of the 2030 Agenda for Sustainable Development. Geo Spat. Inf. Sci. 2017, 20, 77–96. [Google Scholar] [CrossRef]
- Global Partnership for Sustainable Development Data GPSDD Using Citizen-Generated Data to monitor the SDGs. Available online: http://www.data4sdgs.org/sites/default/files/2017-09/Making%20Use%20of%20Citizen-Generated%20Data%20-%20Data4SDGs%20Toolbox%20Module.pdf (accessed on 29 July 2020).
- Scholz, S.; Knight, P.; Eckle, M.; Marx, S.; Zipf, A. Volunteered Geographic Information for Disaster Risk Reduction—The Missing Maps Approach and Its Potential within the Red Cross and Red Crescent Movement. Remote Sens. 2018, 10, 1239. [Google Scholar] [CrossRef]
- World Health Organization WHO. Safely Managed Drinking Water—Thematic Report On Drinking Water. Available online: https://www.who.int/water_sanitation_health/publications/safely-managed-drinking-water/en/ (accessed on 7 October 2020).
- Van den Homberg, M.; Susha, I. Characterizing data ecosystems to support official statistics with open mapping data for reporting on sustainable development goals. ISPRS Int. J. Geo-Inf. 2018, 7, 456. [Google Scholar] [CrossRef]
- Verplanke, J.; Georgiadou, Y. Wicked Water Points: The Quest for an Error Free National Water Point Database. ISPRS Int. J. Geo-Inf. 2017, 6, 244. [Google Scholar] [CrossRef]
- UN-Water. Overview 2019–2022 Data Collection Process and Timeline for SDG 6 Global Indicators. Available online: https://www.sdg6monitoring.org/activities/overview-2019-2022-data-collection-process-and-timeline-for-sdg-6-global-indicators/ (accessed on 29 April 2020).
- UN-Water SDG 6 Data Portal. Available online: https://www.sdg6data.org/ (accessed on 29 April 2020).
- Malawi 2020 Voluntary National Review Report for Sustainable Development Goals. 2020. Available online: https://sustainabledevelopment.un.org/content/documents/26317MalawiVNRReport.pdf (accessed on 7 October 2020).
- Community Risk Assessment Dashboard. Available online: https://dashboard.510.global/#!/ (accessed on 7 October 2020).
- Chirwa, I. Presented at the United Nations Regional Workshop on the 2020 World Programme on Population and Housing Censuses: International Standards and Contemporary Technologies. Available online: https://unstats.un.org/unsd/demographic-social/meetings/2017/lusaka--regional-workshop-on-2020-census/docs/s09-02-Malawi.pptx (accessed on 7 October 2020).
- Data4SDG: Characterizing the Data Supply Dimension of Data Ecosystems. Available online: https://rodekruis.github.io/Data4SDG_Malawi/ (accessed on 7 October 2020).
- ICF. 2018. Available online: https://dhsprogram.com/What-We-Do/GPS-Data-Collection.cfm (accessed on 1 November 2018).
- Albuquerque, J.P.D.; Herfort, B.; Eckle, M. The tasks of the crowd: A typology of tasks in geographic information crowdsourcing and a case study in humanitarian mapping. Remote Sens. 2016, 8, 859. [Google Scholar] [CrossRef]
- Ma, L.; Liu, Y.; Zhang, X.; Ye, Y.; Yin, G.; Johnson, B.A. Deep learning in remote sensing applications: A meta-analysis and review. ISPRS J. Photogram. Remote Sens. 2019, 152, 166–177. [Google Scholar] [CrossRef]
- ArcGIS. Available online: https://livingatlas.arcgis.com/en/browse/#d=2&srt=recent&cont=esriOnly&q=malawi%20and%20owner%3Aesri%20and%20tags%3Ademographics (accessed on 30 November 2019).
- The Water Point Data Exchange. Available online: https://www.waterpointdata.org/ (accessed on 30 November 2019).
- Buying Satellite Imagery: Pricing Information for High Resolution Satellite Imagery. Available online: http://www.landinfo.com/satellite-imagery-pricing.html (accessed on 30 November 2019).
- Espey, J.; Swanson, E.; Badiee, S.; Christensen, Z.; Fischer, A.; Levy, M.; Yetman, G.; de Sherbinin, A.; Chen, R.; Qiu, Y.; et al. Data for Development: A Needs Assessment for SDG Monitoring and Statistical Capacity Development. Available online: https://www.sdsntrends.org/research/2015/7/15/data-for-development-a-needs-assessment-for-sdg-monitoring-and-statistical-capacity-development (accessed on 7 October 2020).
- OpenAerialMap. Available online: https://openaerialmap.org/ (accessed on 30 November 2019).
© 2020 by the authors. Licensee MDPI, Basel, Switzerland. This article is an open access article distributed under the terms and conditions of the Creative Commons Attribution (CC BY) license (http://creativecommons.org/licenses/by/4.0/).

