
Forecasting Impacts on Vulnerable Shorelines: Vulnerability Assessment along the Coastal Zone of Messolonghi Area—Western Greece


Abstract
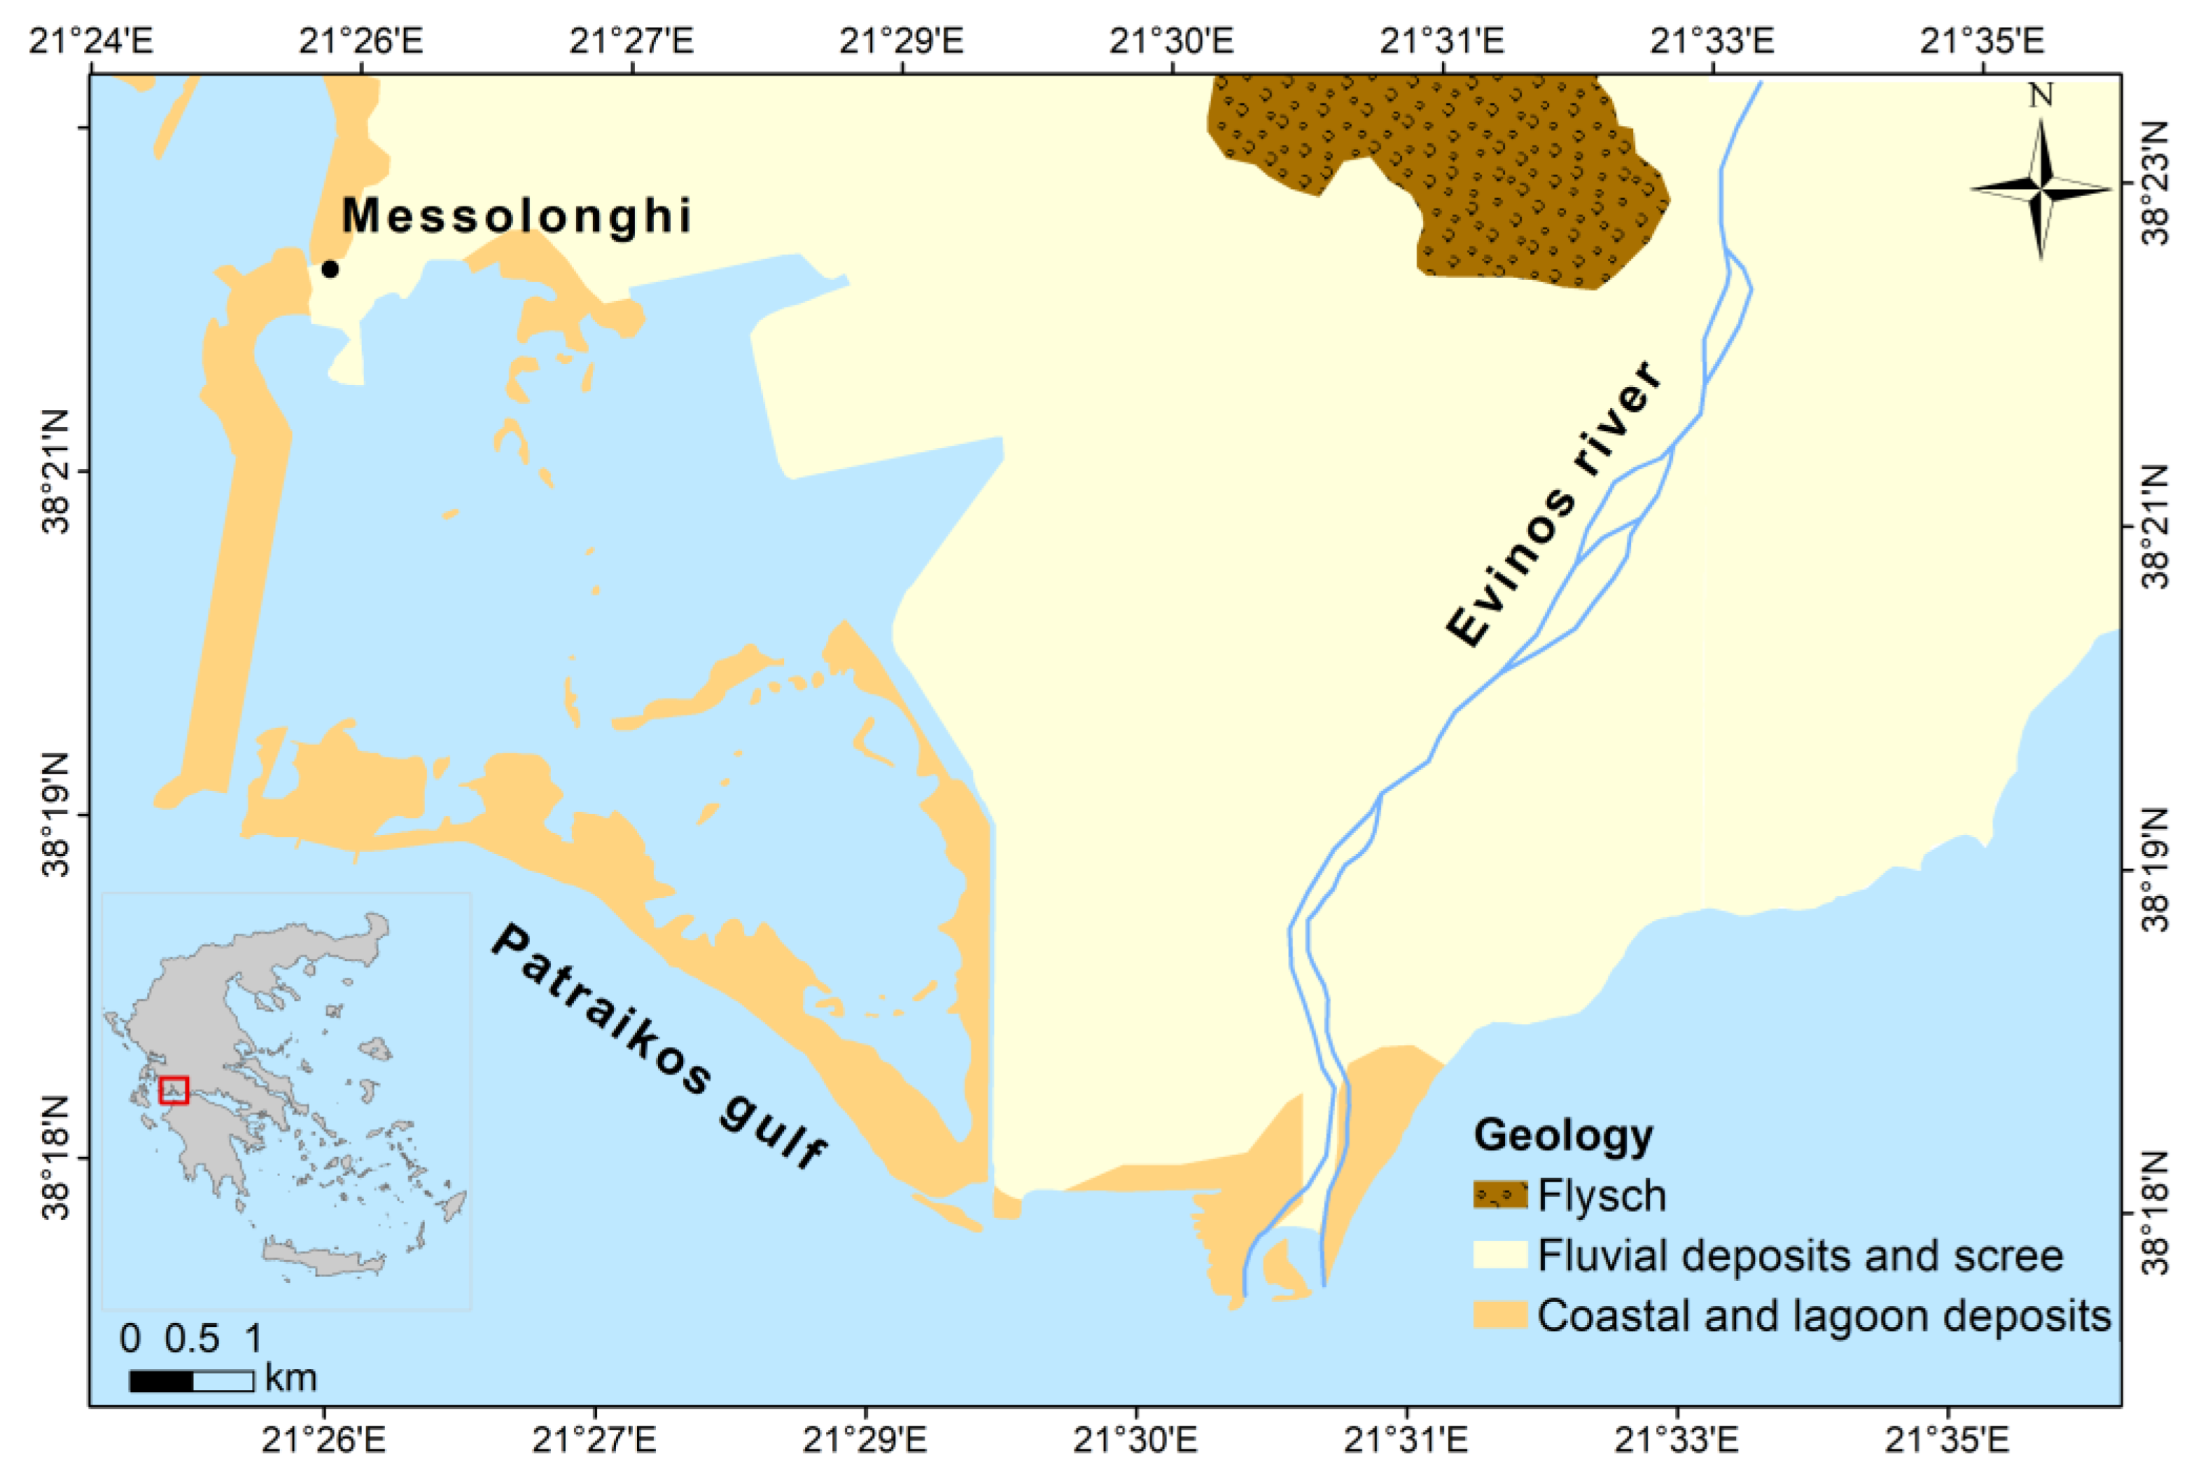
:1. Introduction
2. Materials and Methods
3. Results and Discussion
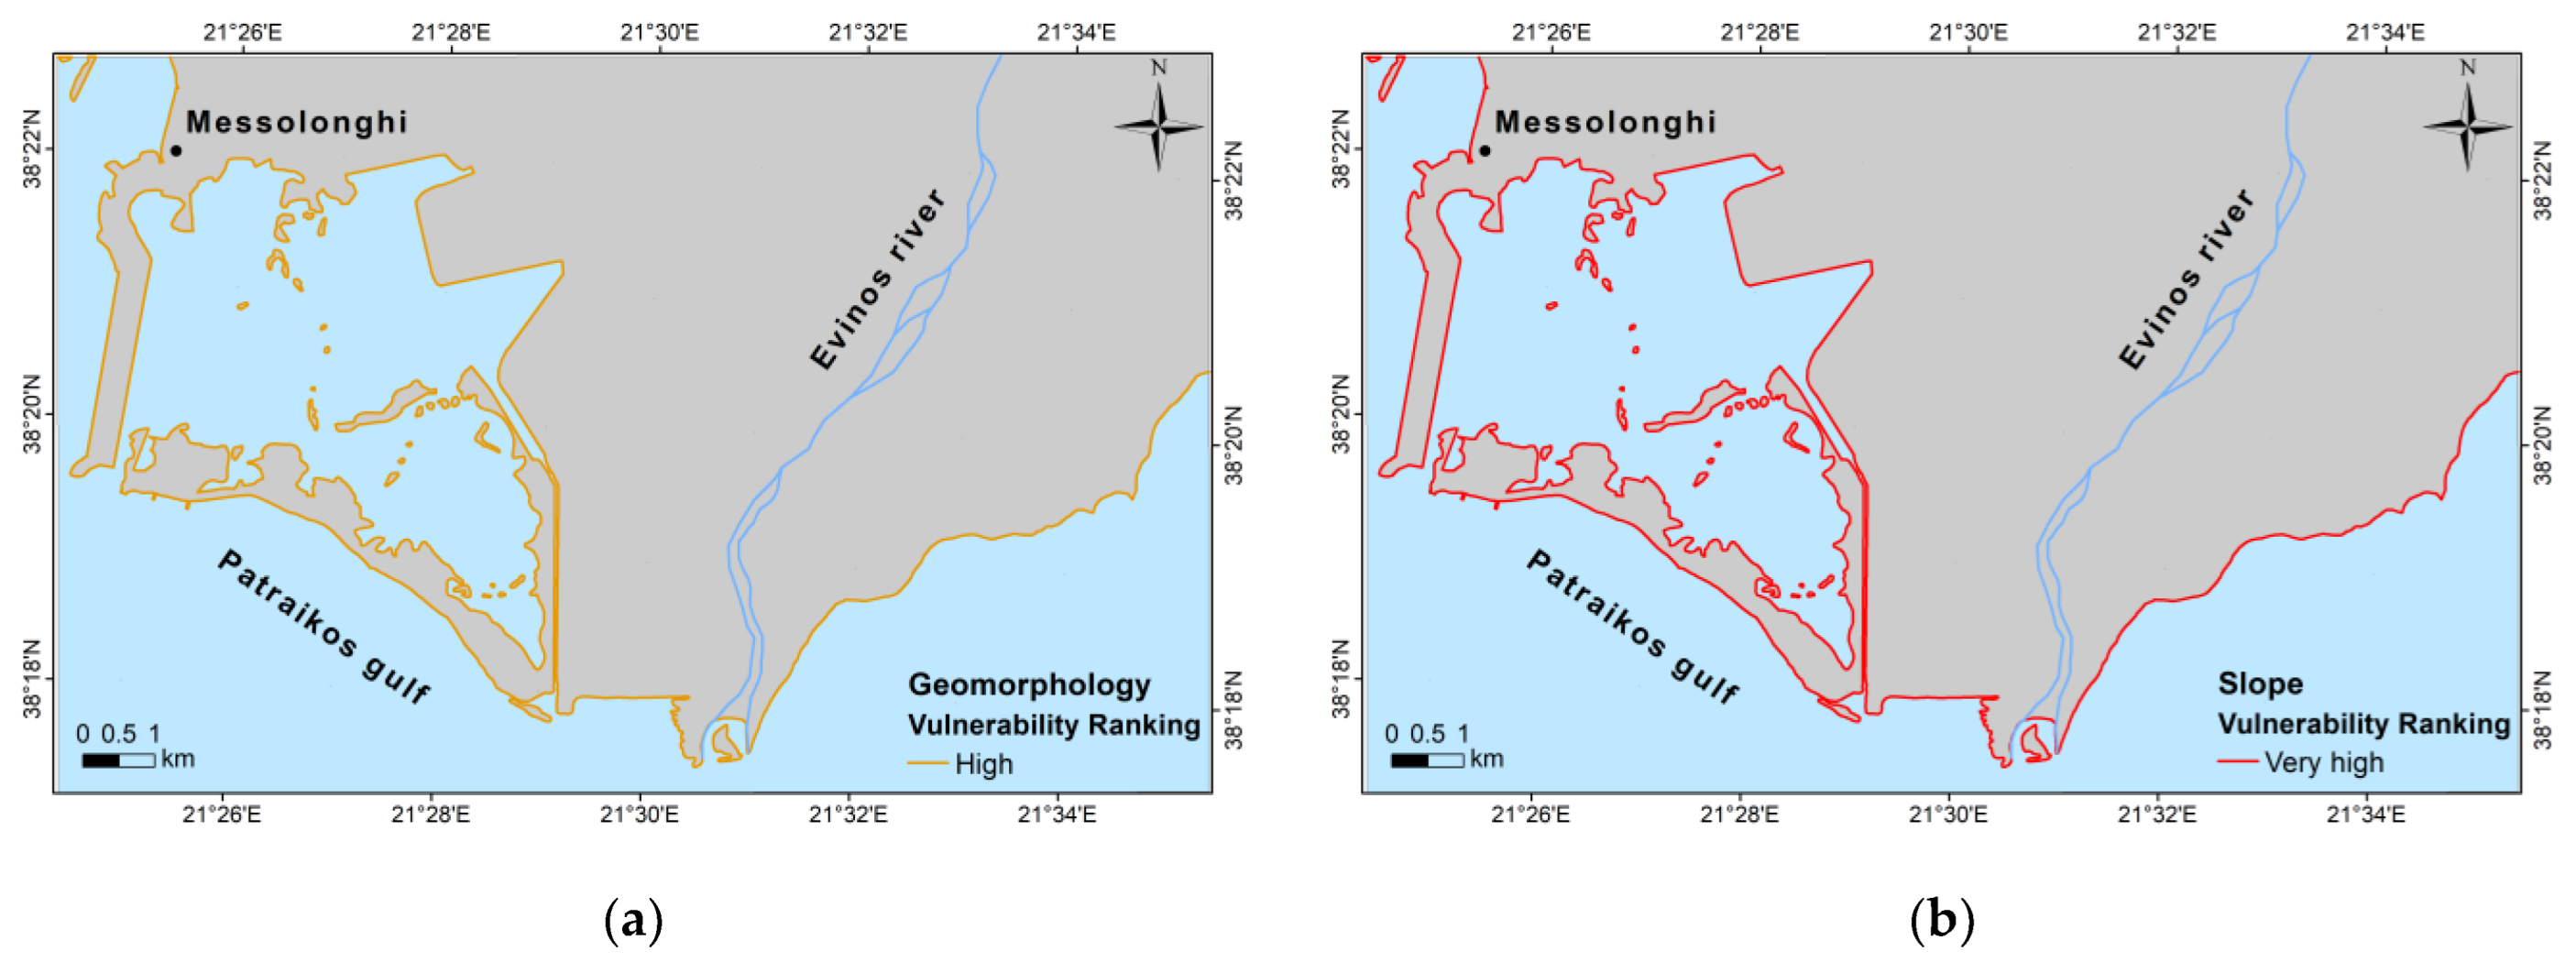
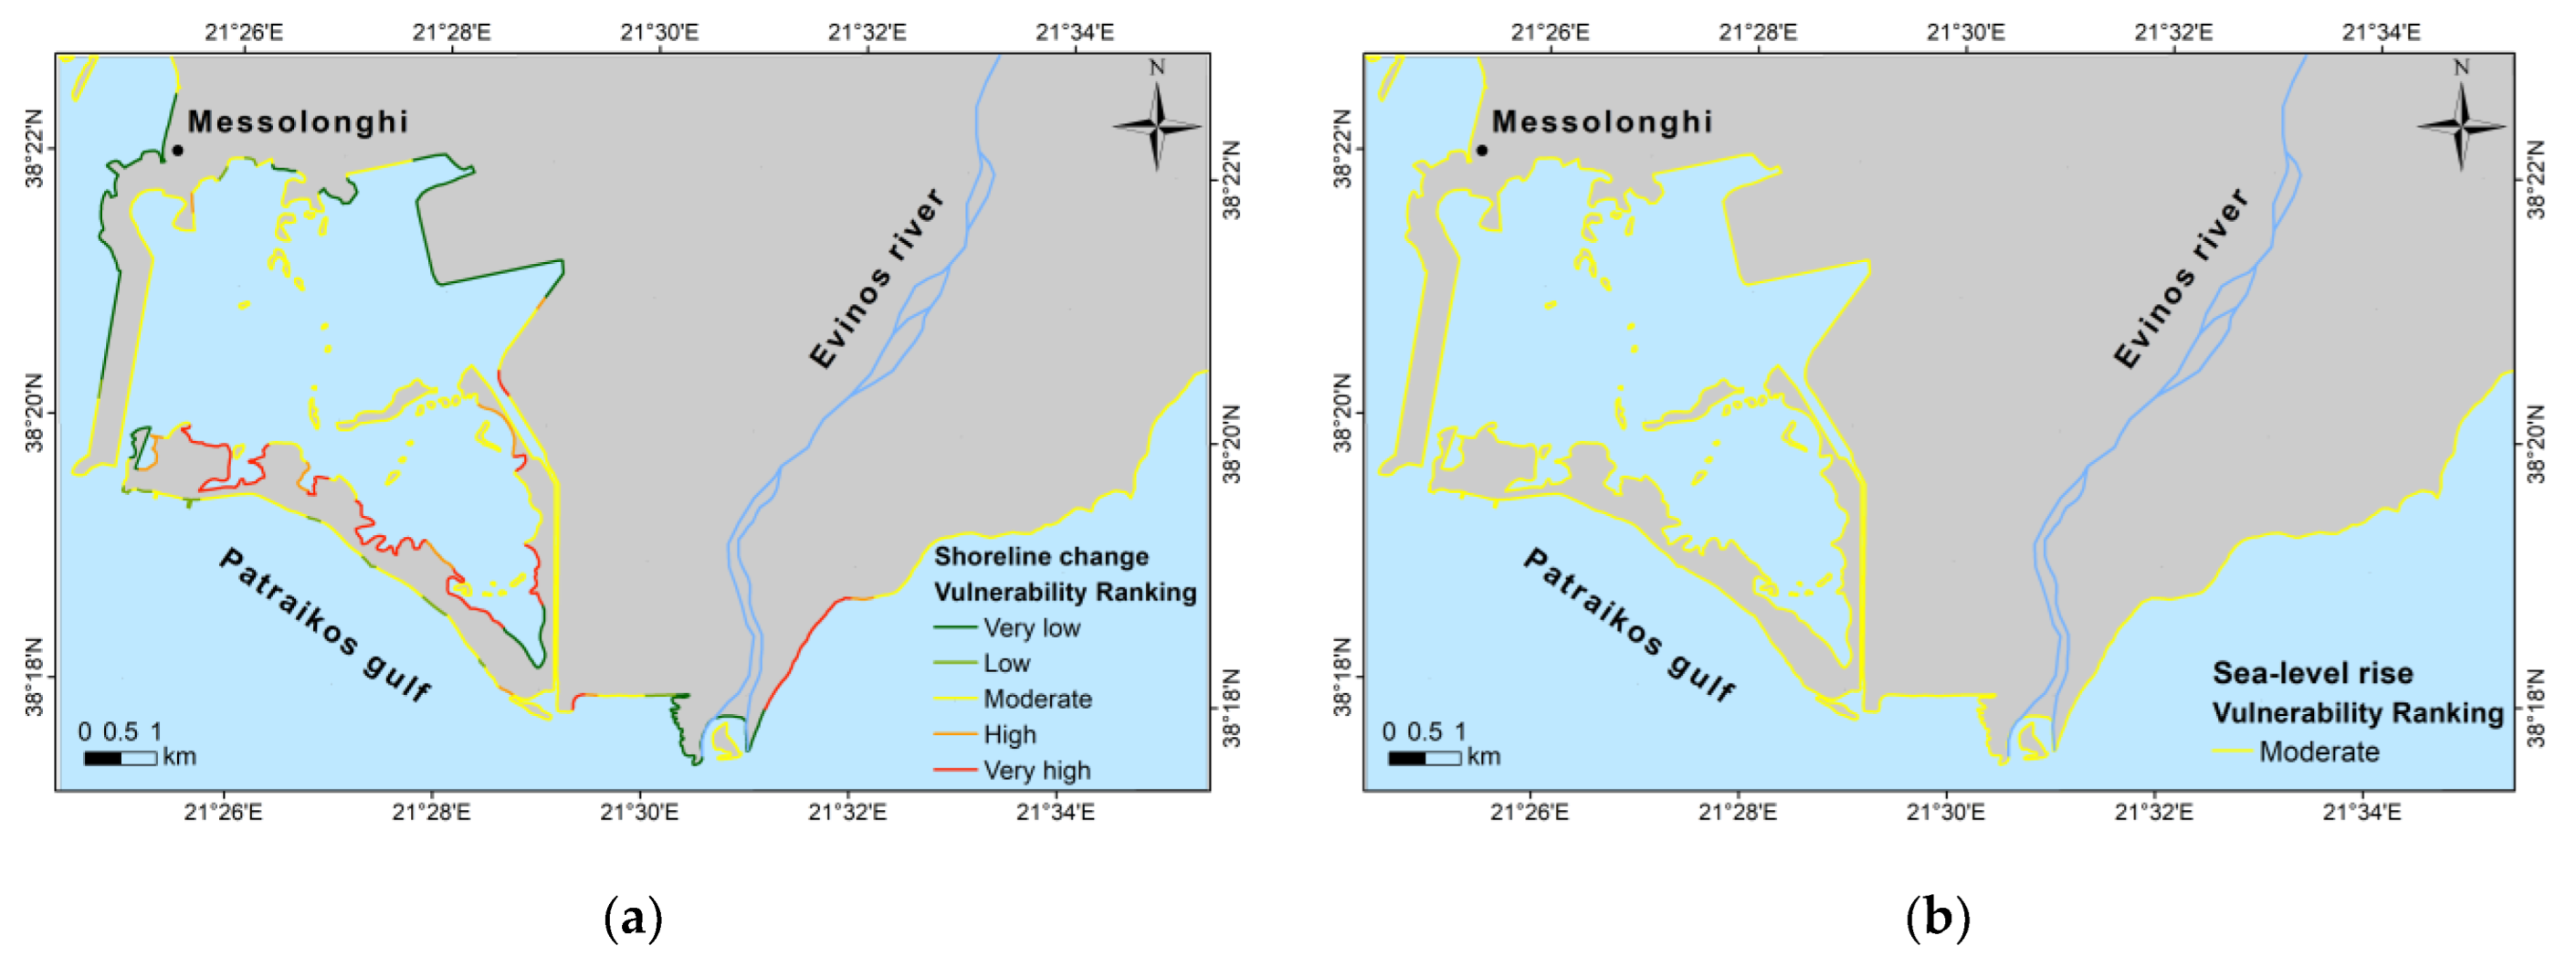
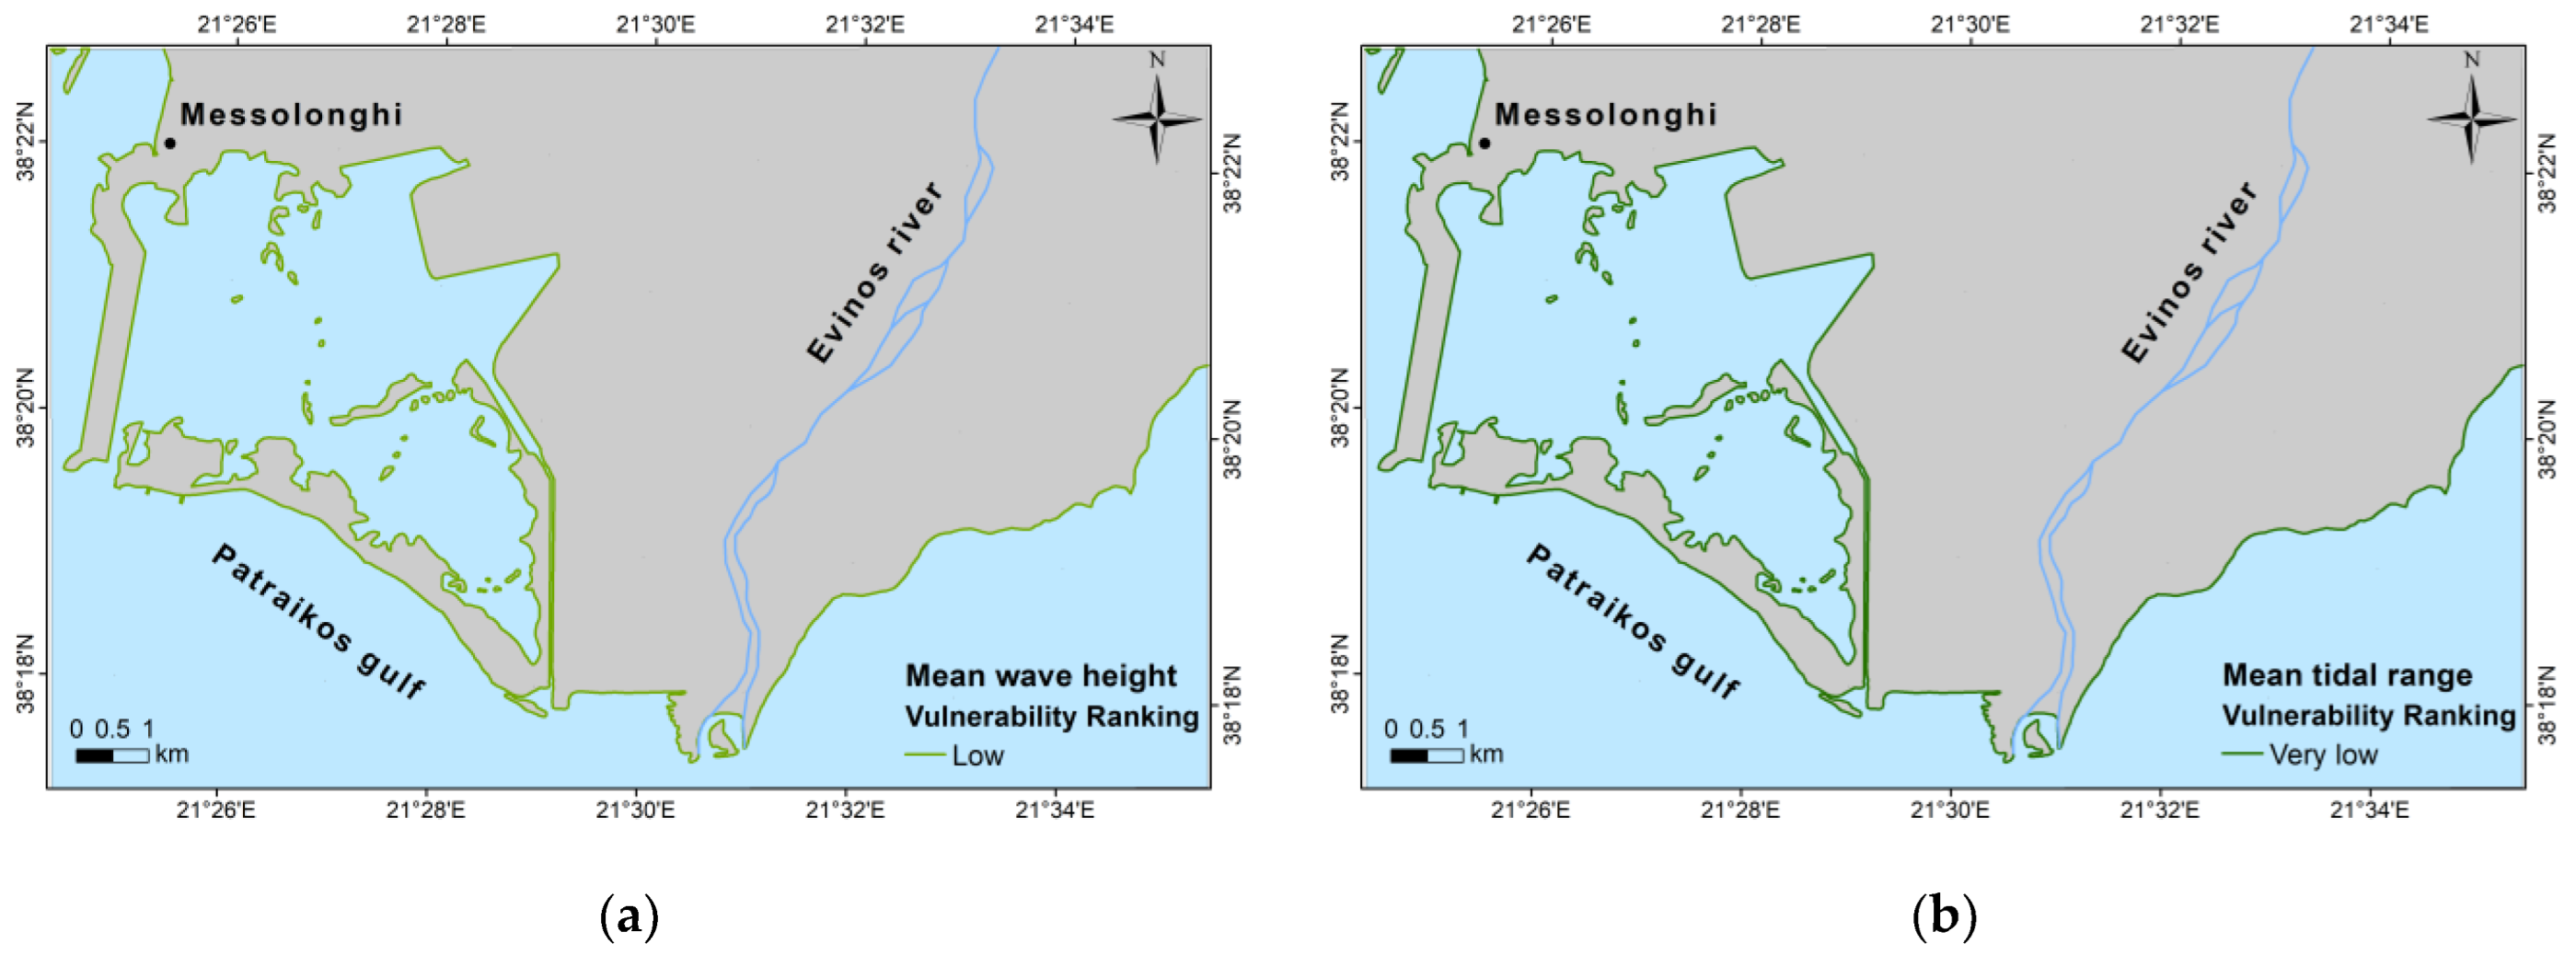
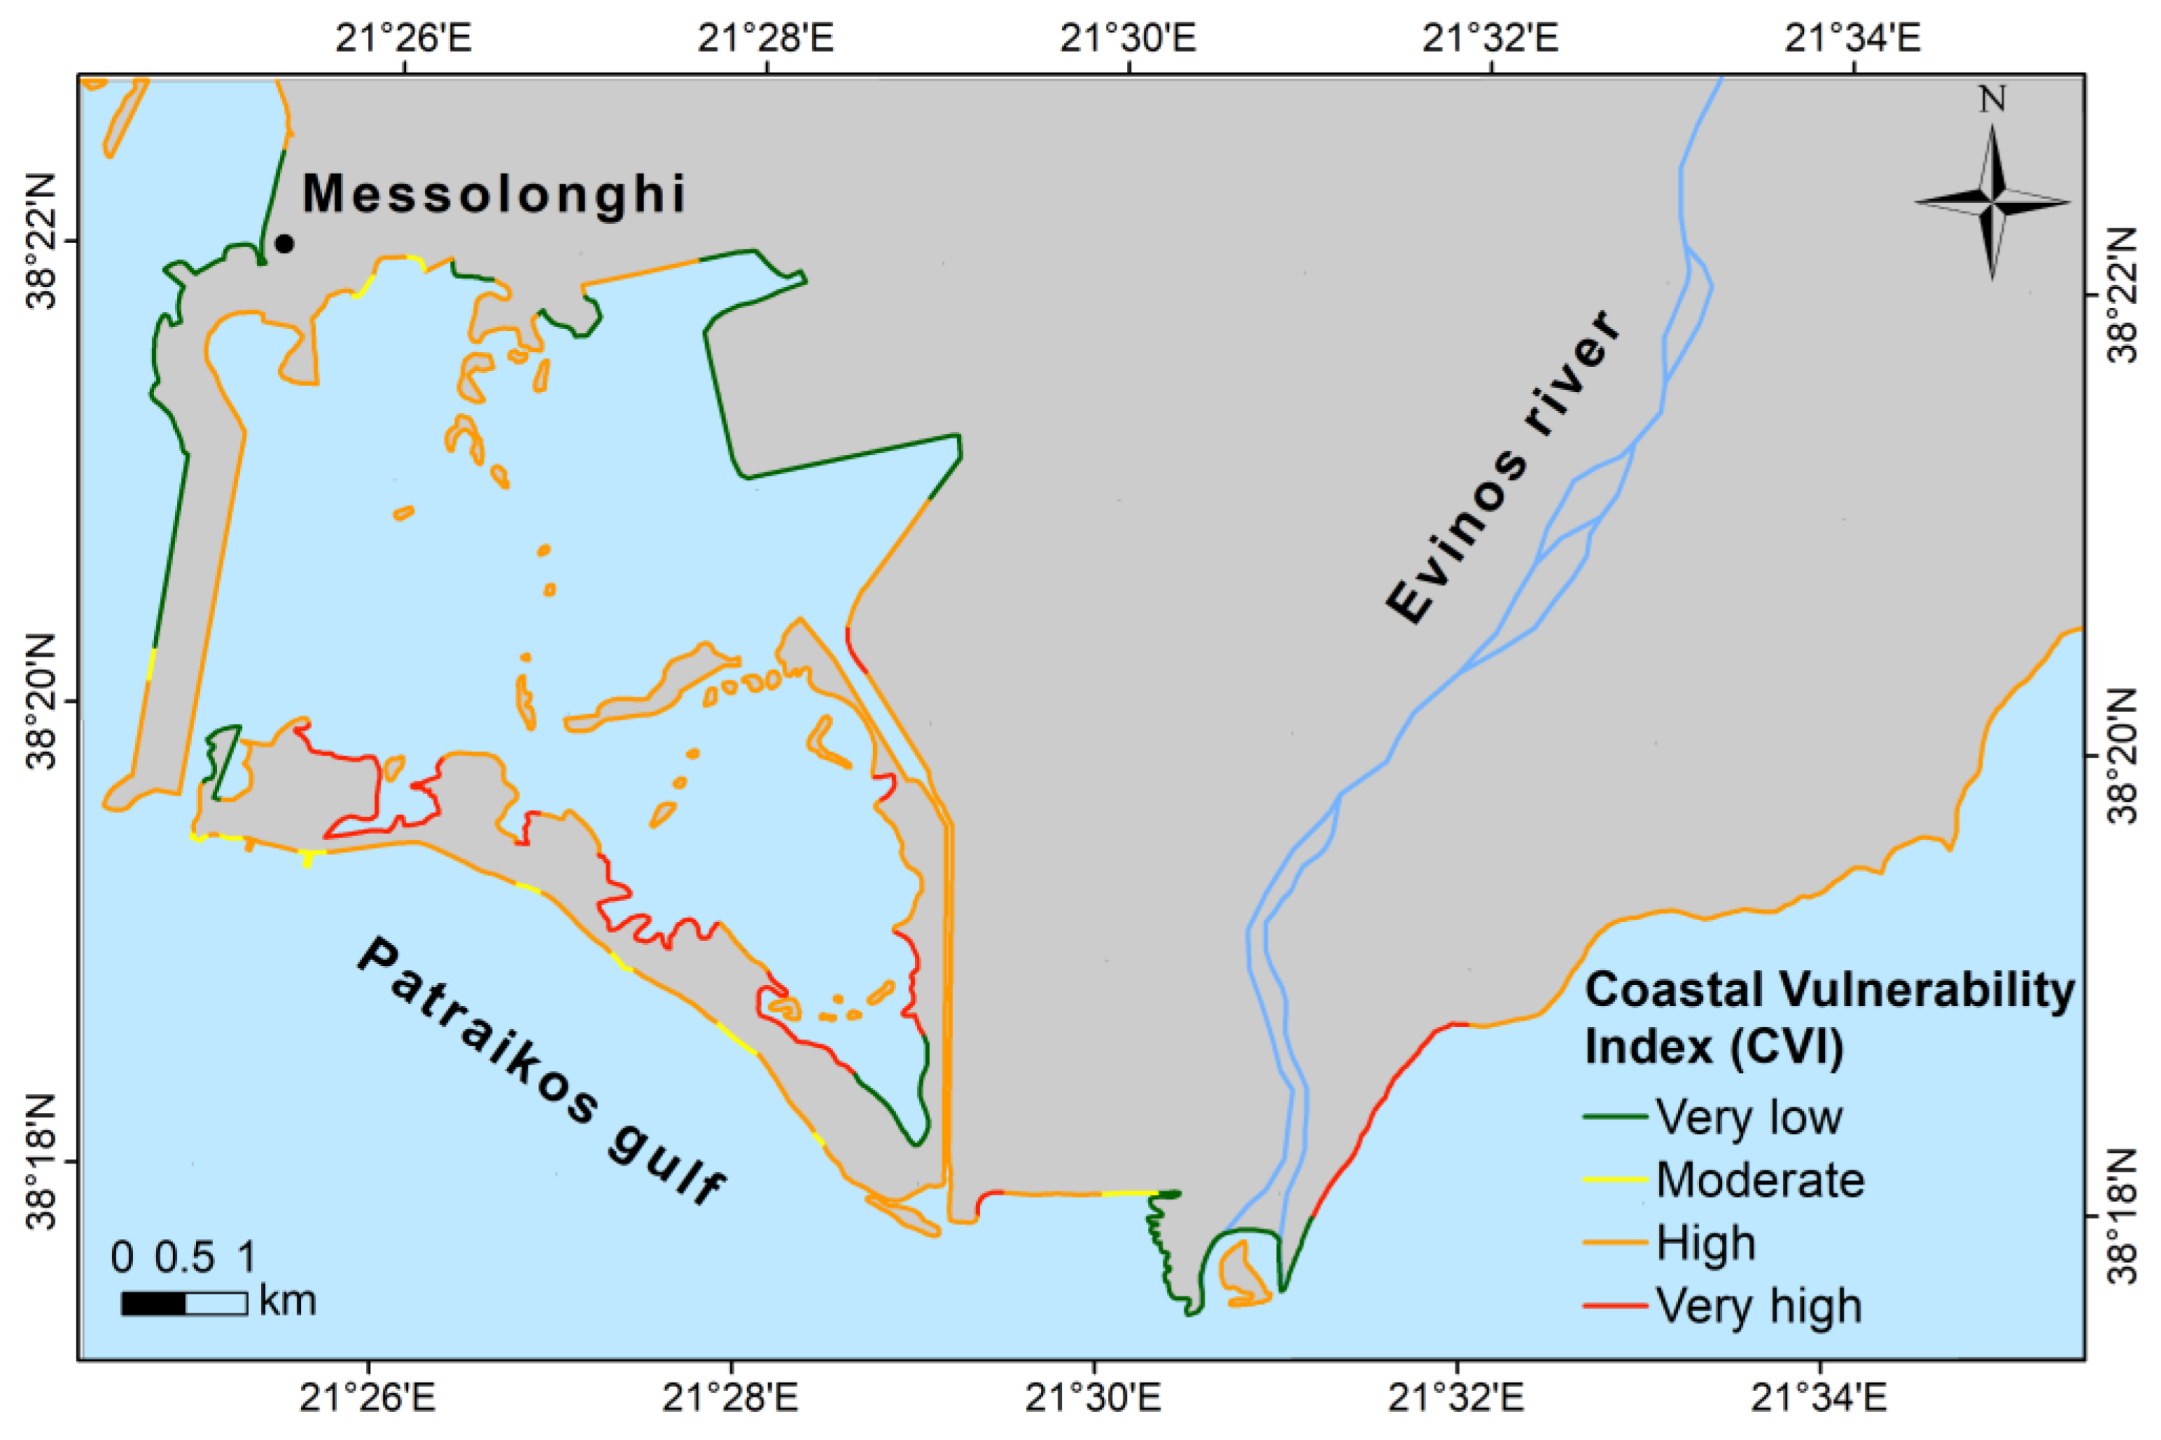
3.1. Calculation of the CVI and Coastal Inundation
3.1.1. Calculation of Coastal Vulnerability
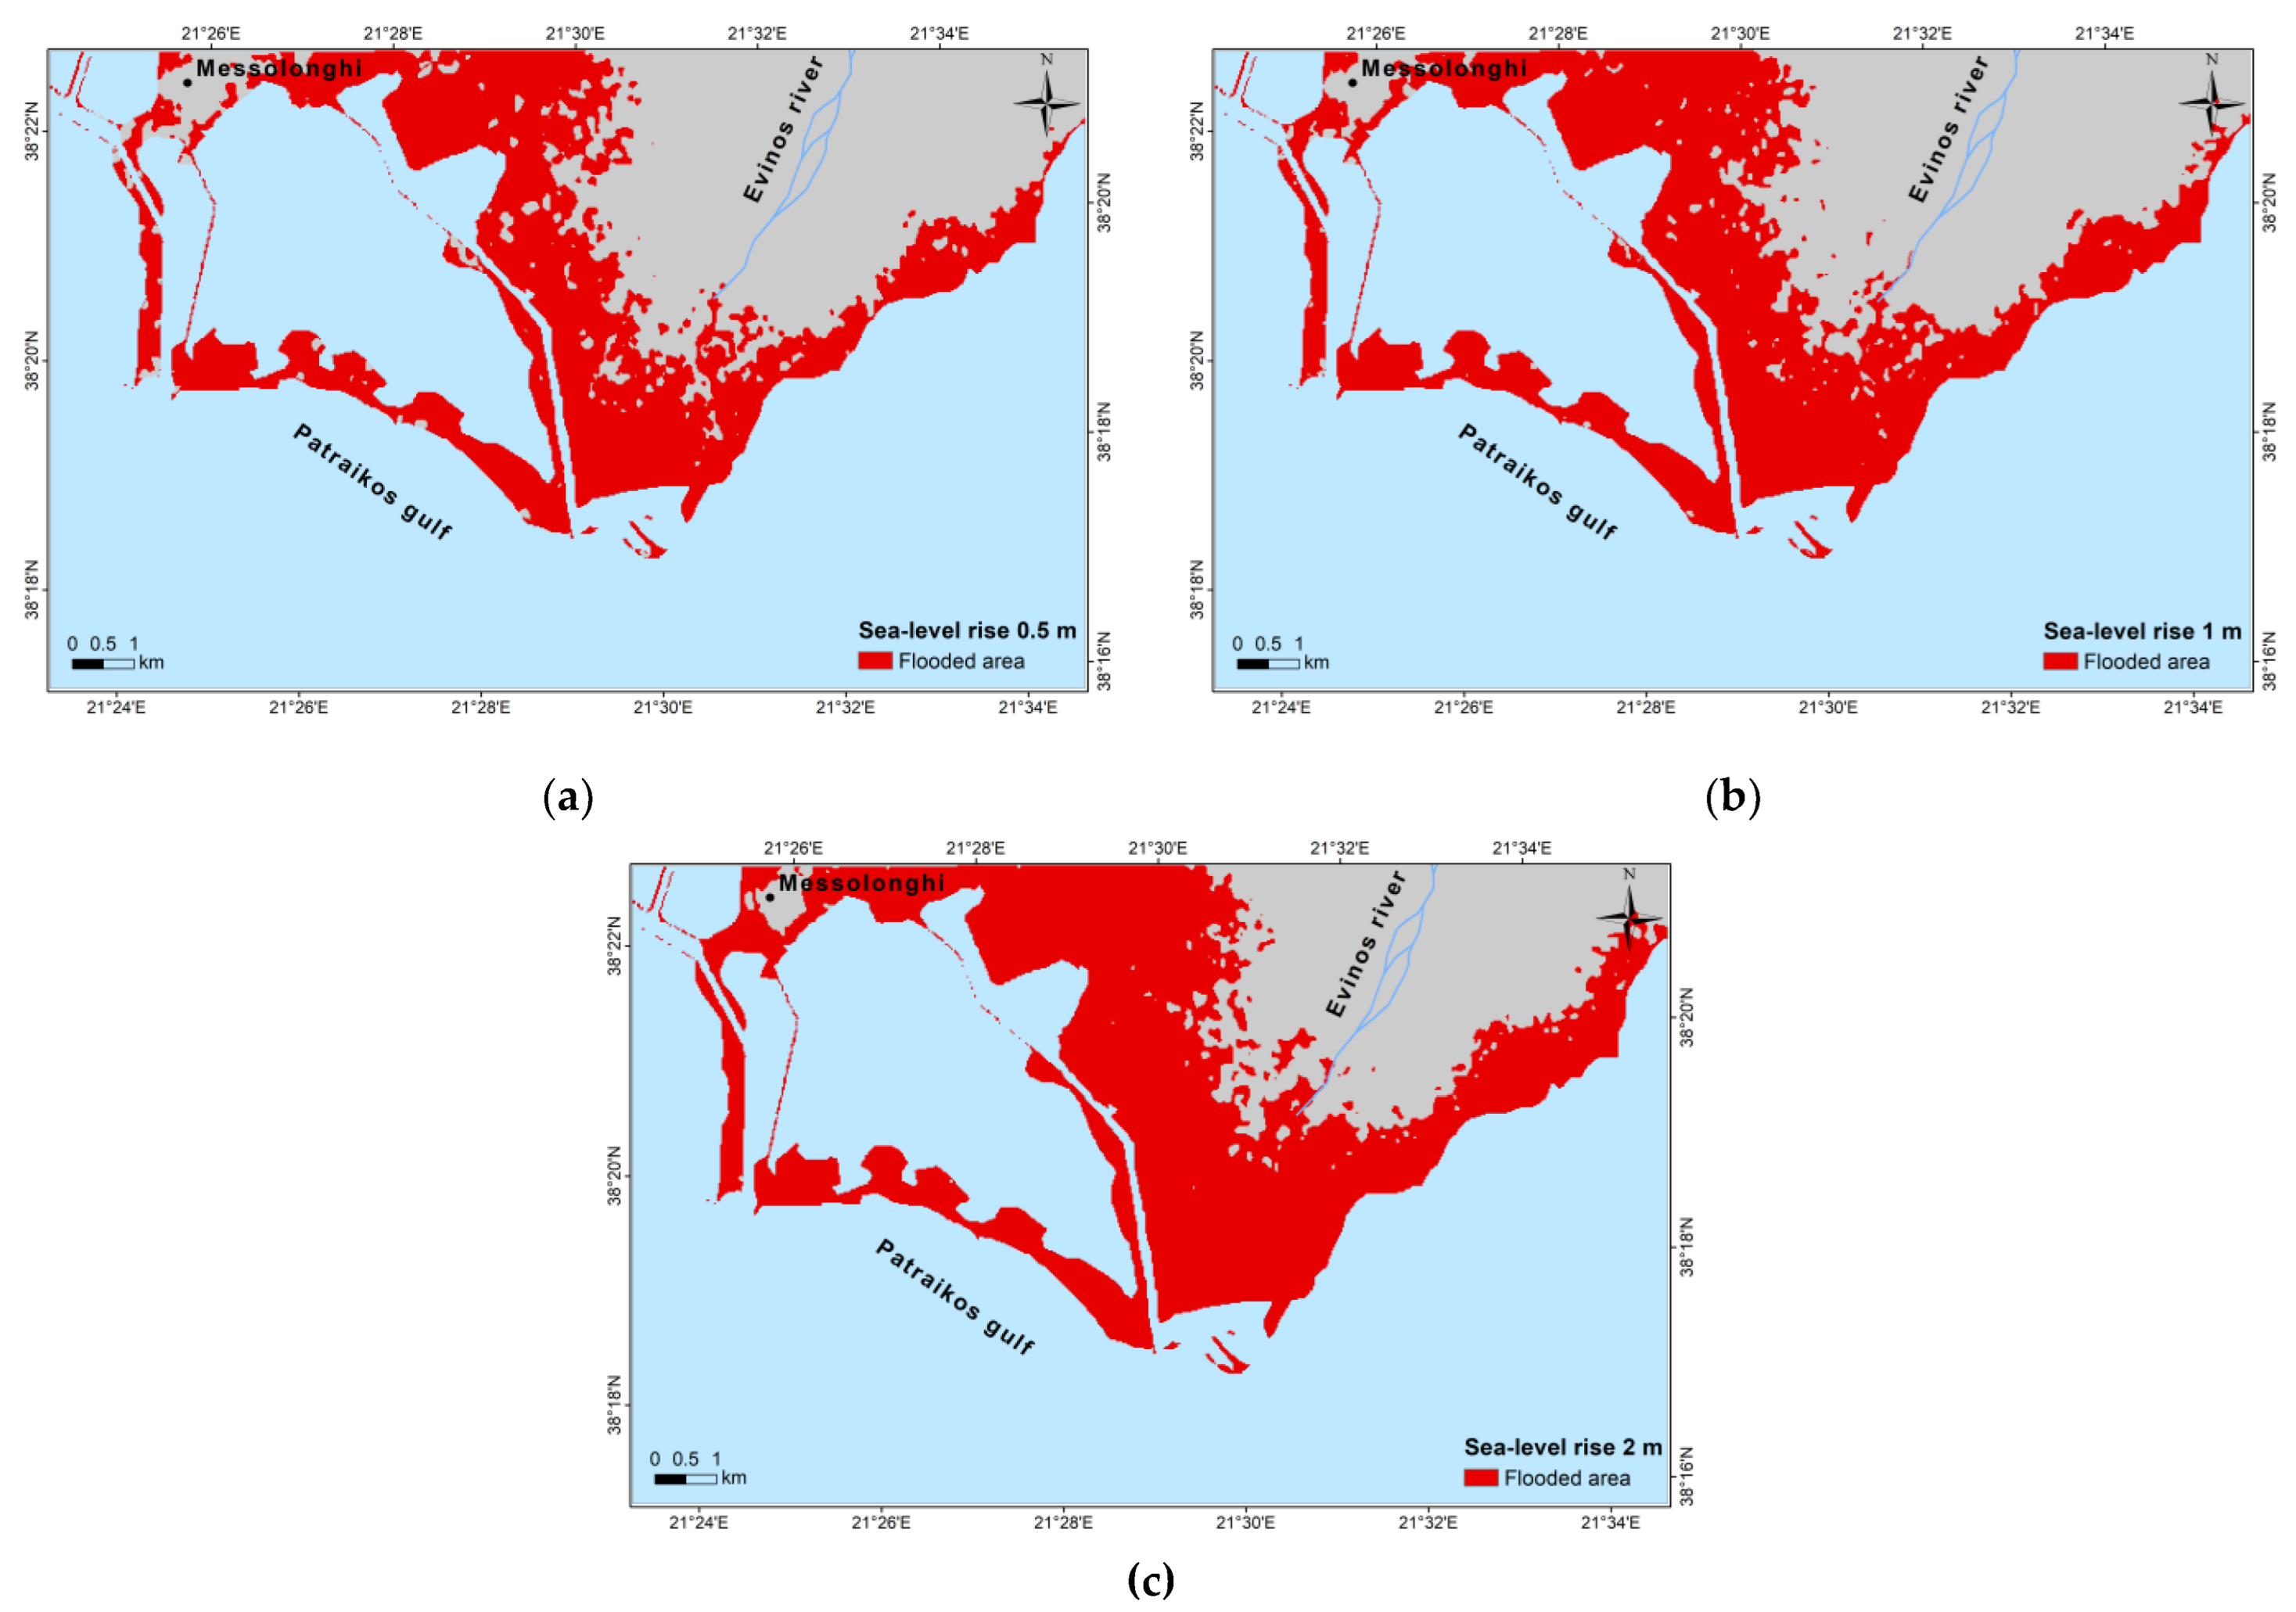
3.1.2. Sea-Level-Rise Scenarios and Coastal Inundation
4. Conclusions
Author Contributions
Funding
Institutional Review Board Statement
Informed Consent Statement
Data Availability Statement
Conflicts of Interest
References
- Tsakalos, E.; Dimitriou, E.; Kazantzaki, M.; Anagnostou, C.; Christodoulakis, J.; Filippaki, E. Testing Optically Stimulated Luminescence Dating on Sand-Sized Quartz of Deltaic Deposits from the Sperchios Delta Plain, Central Greece. J. Palaeogeogr. 2018, 7, 130–145. [Google Scholar] [CrossRef]
- Doukakis, E. Accelerated Sea Level Rise and Coastal Vulnerability in the Hersonisos Coastal Region (Crete, Greece). Medit. Mar. Sci. 2004, 5, 35. [Google Scholar] [CrossRef] [Green Version]
- Hzami, A.; Heggy, E.; Amrouni, O.; Mahé, G.; Maanan, M.; Abdeljaouad, S. Alarming Coastal Vulnerability of the Deltaic and Sandy Beaches of North Africa. Sci. Rep. 2021, 11, 2320. [Google Scholar] [CrossRef]
- Vandarakis, D.; Panagiotopoulos, I.P.; Loukaidi, V.; Hatiris, G.-A.; Drakopoulou, P.; Kikaki, A.; Gad, F.-K.; Petrakis, S.; Malliouri, D.I.; Chatzinaki, M.; et al. Assessment of the Coastal Vulnerability to the Ongoing Sea Level Rise for the Exquisite Rhodes Island (SE Aegean Sea, Greece). Water 2021, 13, 2169. [Google Scholar] [CrossRef]
- Rizzo, A.; Vandelli, V.; Buhagiar, G.; Micallef, A.S.; Soldati, M. Coastal Vulnerability Assessment along the North-Eastern Sector of Gozo Island (Malta, Mediterranean Sea). Water 2020, 12, 1405. [Google Scholar] [CrossRef]
- Nguyen, T.T.X.; Bonetti, J.; Rogers, K.; Woodroffe, C.D. Indicator-Based Assessment of Climate-Change Impacts on Coasts: A Review of Concepts, Methodological Approaches and Vulnerability Indices. Ocean. Coast. Manag. 2016, 123, 18–43. [Google Scholar] [CrossRef] [Green Version]
- Pörtner, H.-O.; Roberts, D.C.; Tignor, M.M.B.; Poloczanska, E.S.; Mintenbeck, K.; Alegría, A.; Craig, M.; Langsdorf, S.; Löschke, S.; Möller, V.; et al. (Eds.) Climate Change 2022: Impacts, Adaptation and Vulnerability. Contribution of Working Group II to the Sixth Assessment Report of the Intergovernmental Panel on Climate Change; Cambridge University Press: Cambridge, UK; New York, NY, USA, 2022. [Google Scholar]
- Li, L.; Cao, R.; Wei, K.; Wang, W.; Chen, L. Adapting Climate Change Challenge: A New Vulnerability Assessment Framework from the Global Perspective. J. Clean. Prod. 2019, 217, 216–224. [Google Scholar] [CrossRef]
- Gargiulo, C.; Battarra, R.; Tremiterra, M.R. Coastal Areas and Climate Change: A Decision Support Tool for Implementing Adaptation Measures. Land Use Policy 2020, 91, 104413. [Google Scholar] [CrossRef]
- European Environment Agency. Europe’s Changing Climate Hazards; Publications Office: Luxembourg, 2021. [Google Scholar]
- Ferreira, J.C.; Cardona, F.S.; Jóia Santos, C.; Tenedório, J.A. Hazards, Vulnerability, and Risk Analysis on Wave Overtopping and Coastal Flooding in Low-Lying Coastal Areas: The Case of Costa Da Caparica, Portugal. Water 2021, 13, 237. [Google Scholar] [CrossRef]
- Bosom, E.; Jiménez, J.A. Probabilistic Coastal Vulnerability Assessment to Storms at Regional Scale – Application to Catalan Beaches (NW Mediterranean). Natural Hazards and Earth System Sciences 2011, 11, 475–484. [Google Scholar] [CrossRef]
- Villatoro, M.; Silva, R.; Méndez, F.J.; Zanuttigh, B.; Pan, S.; Trifonova, E.; Losada, I.J.; Izaguirre, C.; Simmonds, D.; Reeve, D.E.; et al. An Approach to Assess Flooding and Erosion Risk for Open Beaches in a Changing Climate. Coast. Eng. 2014, 87, 50–76. [Google Scholar] [CrossRef] [Green Version]
- Cirella, G.T.; Semenzin, E.; Critto, A.; Marcomini, A. Natural Hazard Risk Assessment and Management Methodologies Review: Europe. In Sustainable Cities and Military Installations; Linkov, I., Ed.; Springer: Dordrecht, The Netherlands, 2014; pp. 329–358. [Google Scholar]
- Rangel-Buitrago, N.; Anfuso, G. Review of the Existing Risk Assessment Methods. In Risk Assessment of Storms in Coastal Zones: Case Studies from Cartagena (Colombia) and Cadiz (Spain); Rangel-Buitrago, N., Anfuso, G., Eds.; SpringerBriefs in Earth Sciences; Springer: Cham, Switzerland, 2015; pp. 7–13. ISBN 978-3-319-15844-0. [Google Scholar]
- Gornitz, V. Global Coastal Hazards from Future Sea Level Rise. Palaeogeogr. Palaeoclimatol. Palaeoecol. 1991, 89, 379–398. [Google Scholar] [CrossRef]
- Gornitz, V.M.; Daniels, R.C.; White, T.W.; Birdwell, K.R. The Development of a Coastal Risk Assessment Database: Vulnerability to Sea-Level Rise in the U.S. Southeast. J. Coast. Res. 1994, 12, 327–338. [Google Scholar]
- Thieler, R.; Hammar-Klose, E. National Assessment of Coastal Vulnerability to Sea-Level Rise: Preliminary Results for the U.S. Atlantic Coast; USGS Numbered Series; USGS: Reston, VA, USA, 1999.
- Tragaki, A.; Gallousi, C.; Karymbalis, E. Coastal Hazard Vulnerability Assessment Based on Geomorphic, Oceanographic and Demographic Parameters: The Case of the Peloponnese (Southern Greece). Land 2018, 7, 56. [Google Scholar] [CrossRef] [Green Version]
- Gaki-Papanastassiou, K.; Karymbalis, E.; Poulos, S.; Seni, A.; Zouva, C. Coastal Vulnerability Assessment to Sea-Level Rise Bαsed on Geomorphological and Oceanographical Parameters: The Case of Argolikos Gulf, Peloponnese, Greece*. Hell. J. Geosci. 2010, 45, 109–122. [Google Scholar]
- Pramanik, M.K.; Biswas, S.S.; Mondal, B.; Pal, R. Coastal Vulnerability Assessment of the Predicted Sea Level Rise in the Coastal Zone of Krishna–Godavari Delta Region, Andhra Pradesh, East Coast of India. Environ. Dev. Sustain. 2016, 18, 1635–1655. [Google Scholar] [CrossRef]
- Bush, D.M.; Pilkey, O.H.; Neal, W.J. Living by the Rules of the Sea; Living with the Shore; Duke University Press: Durham, NC, USA, 1996; ISBN 978-0-8223-1796-8. [Google Scholar]
- Cooper, J.A.G.; McLaughlin, S. Contemporary Multidisciplinary Approaches to Coastal Classification and Environmental Risk Analysis. J. Coast. Res. 1998, 14, 512–524. [Google Scholar]
- Ojeda, J.; Álvarez, J.I.; Martín, D.; Fraile, P. El uso de las TIG para el cálculo del indice de vulnerabilidad costera (CVI) ante una potencial subida del nivel del mar en la costa andaluza (España). GeoFocus. Int. Rev. Geogr. Inf. Sci. Technol. 2009, 83–100. [Google Scholar]
- Raji, O.; Niazi, S.; Snoussi, M.; Dezileau, L.; Khouakhi, A. Vulnerability Assessment of a Lagoon to Sea Level Rise and Storm Events: Nador Lagoon (NE Morocco). Coas 2013, 65, 802–807. [Google Scholar] [CrossRef]
- Gaki-Papanastassiou, K.; Maroukian, H.; Pavlopoulos, K.; Zamani, A. The Implications of the Expected Sea-Level Rise on the Low-Lying Areas of Continental Greece in the next Century. In Proceedings of the Proceedings of an International Symposium of the IAEG, Athens, Greece, 23–27 June 1997; A A Balkema Publishers: Athens, Greece, 1997; pp. 121–126. [Google Scholar]
- Tsimplis, M.; Marcos, M.; Colin, J.; Somot, S.; Pascual, A.; Shaw, A.G.P. Sea Level Variability in the Mediterranean Sea during the 1990s on the Basis of Two 2d and One 3d Model. J. Mar. Syst. 2009, 78, 109–123. [Google Scholar] [CrossRef]
- Messolonghi Lagoons | Ramsar Sites Information Service. Available online: https://rsis.ramsar.org/ris/62 (accessed on 5 December 2022).
- Maroukian, H.; Karymbalis, E. Geomorphic Evolution of the Fan Delta of the Evinos River in Western Greece and Human Impacts in the Last 150 Years. Z. Für Geomorphol. 2004, 48, 201–217. [Google Scholar] [CrossRef]
- Chronis, G.; Piper, D.J.W.; Anagnostou, C. Late Quaternary Evolution of the Gulf of Patras, Greece: Tectonism, Deltaic Sedimentation and Sea-Level Change. Mar. Geol. 1991, 97, 191–209. [Google Scholar] [CrossRef]
- EU-DEM—Copernicus Land Monitoring Service. Available online: https://land.copernicus.eu/imagery-in-situ/eu-dem (accessed on 5 December 2022).
- Lambeck, K. Sea-Level Change and Shore-Line Evolution in Aegean Greece since Upper Palaeolithic Time. Antiquity 1996, 70, 588–611. [Google Scholar] [CrossRef] [Green Version]
- Lambeck, K.; Purcell, A. Sea-Level Change in the Mediterranean Sea since the LGM: Model Predictions for Tectonically Stable Areas. Quat. Sci. Rev. 2005, 24, 1969–1988. [Google Scholar] [CrossRef]
- Soukissian, T.; Hatzinaki, M.; Gerasimos, K.; Papadopoulos, A.; Kallos, G.; Anadranistakis, M. Wind and Wave Atlas of the Hellenic Seas; Hellenic Centre for Marine Research: Athens, Greece, 2007; ISBN 978 960 86651 9-4. [Google Scholar]
- Tsimplis, M.N. Tidal Oscillations in the Aegean and Ionian Seas. Estuar. Coast. Shelf Sci. 1994, 39, 201–208. [Google Scholar] [CrossRef]
- Pendleton, E.; Theiler, R.; Williams, J. Coastal Vulnerability Assessment of Cape Hatteras National Seashore (CAHA) to Sea-Level Rise; Open-File Report; USGS: Reston, VA, USA, 2005; 18p.
- Karymbalis, E.; Chalkias, C.; Chalkias, G.; Grigoropoulou, E.; Manthos, G.; Ferentinou, M. Assessment of the Sensitivity of the Southern Coast of the Gulf of Corinth (Peloponnese, Greece) to Sea-Level Rise. Open Geosci. 2012, 4, 561–577. [Google Scholar] [CrossRef]
- CORINE Land Cover—Copernicus Land Monitoring Service. Available online: https://land.copernicus.eu/pan-european/corine-land-cover (accessed on 5 December 2022).
- Digital Shoreline Analysis System (DSAS) | U.S. Geological Survey. Available online: https://www.usgs.gov/centers/whcmsc/science/digital-shoreline-analysis-system-dsas (accessed on 5 December 2022).
- Boumboulis, V.; Apostolopoulos, D.; Depountis, N.; Nikolakopoulos, K. The Importance of Geotechnical Evaluation and Shoreline Evolution in Coastal Vulnerability Index Calculations. J. Mar. Sci. Eng. 2021, 9, 423. [Google Scholar] [CrossRef]
- Widura, E.; Mardiatno, D. Assessment of the Coastal Vulnerability Index (CVI) for Disaster Mitigation Strategies in Some Coastal Tourism Areas in Gunungkidul, Yogyakarta-Indonesia. IOP Conf. Ser. Earth Environ. Sci. 2022, 989, 012014. [Google Scholar] [CrossRef]
- Oloyede, M.O.; Williams, A.B.; Ode, G.O.; Benson, N.U. Coastal Vulnerability Assessment: A Case Study of the Nigerian Coastline. Sustainability 2022, 14, 2097. [Google Scholar] [CrossRef]
- Koroglu, A.; Ranasinghe, R.; Jiménez, J.A.; Dastgheib, A. Comparison of Coastal Vulnerability Index Applications for Barcelona Province. Ocean. Coast. Manag. 2019, 178, 104799. [Google Scholar] [CrossRef]
- Garner, G.G.; Hermans, T.; Kopp, R.E.; Slangen, A.B.A.; Edwards, T.L.; Levermann, A.; Nowicki, S.; Palmer, M.D.; Smith, C.; Fox-Kemper, B.; et al. IPCC AR6 Sea Level Projections 2021. Available online: https://www.wdcclimate.de/ui/entry?acronym=IPCC-DDC_AR6_Sup_SLPr (accessed on 5 December 2022).

| Variable | Categories | ||||
|---|---|---|---|---|---|
| Very Low (1) | Low (2) | Moderate (3) | High (4) | Very High (5) | |
| Geomorphology | Rocky cliffed coasts, Fjords | Medium cliffs, Indented coasts | Low cliffs, Glacial drift, Alluvial plains | Cobble Beaches, Estuary, Lagoon | Barrier beaches, Sand beaches, Salt marsh, Mud flats, Deltas, Mangrove, Coral reefs |
| Coastal slope (%) | >1.2 | 1.2 to 0.9 | 0.9 to 0.6 | 0.6 to 0.3 | <0.3 |
| Shoreline erosion (−)/accretion (+) (m/yr) | > (+2.0) | (+1.0) to (+2.0) | (−1.0) to (+1.0) | (−2.0) to (−1.0) | <(−2.0) |
| Relative sea-level change (mm/yr) | <1.8 | 1.81 to 2.5 | 2.51 to 3.0 | 3.01 to 3.4 | >3.4 |
| Mean wave height (m) | <0.55 | 0.55 to 0.85 | 0.86 to 1.05 | 1.06 to 1.25 | >1.25 |
| Mean tide range (m) | >6.0 | 4.0 to 6.0 | 2.0 to 4.0 | 1.0 to 2.0 | <1.0 |
| Sea-Level-Rise Scenarios | ||||||
|---|---|---|---|---|---|---|
| 0.5 m | 1 m | 2 m | ||||
| Flooded Area | ||||||
| Land-Use Type | km2 | % | km2 | % | km2 | % |
| Permanently irrigated land | 15.88 | 55.51 | 18.77 | 58.06 | 24.1 | 62.76 |
| Beaches, dunes, sands | 3.81 | 13.32 | 4.1 | 12.68 | 4.29 | 11.17 |
| Non-irrigated arable land | 3.12 | 10.91 | 3.17 | 9.81 | 3.2 | 8.33 |
| Salines | 1.38 | 4.82 | 1.41 | 4.36 | 1.42 | 3.70 |
| Coastal lagoons | 1.31 | 4.58 | 1.34 | 4.14 | 1.36 | 3.54 |
| Rice fields | 1.14 | 3.98 | 1.16 | 3.59 | 1.16 | 3.02 |
| Discontinuous urban fabric | 0.53 | 1.85 | 0.79 | 2.44 | 1.16 | 3.02 |
| Water courses | 0.34 | 1.19 | 0.36 | 1.11 | 0.38 | 0.99 |
| Industrial or commercial units | 0.12 | 0.42 | 0.16 | 0.49 | 0.2 | 0.52 |
| Salt marshes | 0.8 | 2.80 | 0.84 | 2.60 | 0.84 | 2.19 |
| Complex cultivation patterns | 0.08 | 0.28 | 0.1 | 0.31 | 0.1 | 0.26 |
| Continuous urban fabric | 0.01 | 0.03 | 0.04 | 0.12 | 0.1 | 0.26 |
| Total flooded area | 27.51 | 31.1 | 37.07 | |||
Disclaimer/Publisher’s Note: The statements, opinions and data contained in all publications are solely those of the individual author(s) and contributor(s) and not of MDPI and/or the editor(s). MDPI and/or the editor(s) disclaim responsibility for any injury to people or property resulting from any ideas, methods, instructions or products referred to in the content. |
© 2023 by the authors. Licensee MDPI, Basel, Switzerland. This article is an open access article distributed under the terms and conditions of the Creative Commons Attribution (CC BY) license (https://creativecommons.org/licenses/by/4.0/).
Share and Cite
Filippaki, E.; Tsakalos, E.; Kazantzaki, M.; Bassiakos, Y. Forecasting Impacts on Vulnerable Shorelines: Vulnerability Assessment along the Coastal Zone of Messolonghi Area—Western Greece. Climate 2023, 11, 24. https://doi.org/10.3390/cli11010024
Filippaki E, Tsakalos E, Kazantzaki M, Bassiakos Y. Forecasting Impacts on Vulnerable Shorelines: Vulnerability Assessment along the Coastal Zone of Messolonghi Area—Western Greece. Climate. 2023; 11(1):24. https://doi.org/10.3390/cli11010024
Chicago/Turabian StyleFilippaki, Eleni, Evangelos Tsakalos, Maria Kazantzaki, and Yannis Bassiakos. 2023. "Forecasting Impacts on Vulnerable Shorelines: Vulnerability Assessment along the Coastal Zone of Messolonghi Area—Western Greece" Climate 11, no. 1: 24. https://doi.org/10.3390/cli11010024