Article

Assessment of Rural Flood Risk and Factors Influencing Household Flood Risk Perception in the Haut-Bassins Region of Burkina Faso, West Africa

by
Madou Sougué
1,*,
Bruno Merz
2,3,*,
Amadé Nacanabo
4,5,
Gnibga Issoufou Yangouliba
6,7,
Ibrahima Pouye
1,
Jean Mianikpo Sogbedji
8 and
François Zougmoré
9
1
West African Science Service Center on Climate Change and Adapted Land Use, WASCAL/Togo, Doctorate Research Program on Climate Change and Disaster Risk Management, Université de Lomé, Lomé 01 BP 1515, Togo
2
GFZ German Research Centre for Geosciences, Section Hydrology, 14473 Potsdam, Germany
3
Institute for Environmental Sciences and Geography, University Potsdam, 14469 Potsdam, Germany
4
Sciences Transversales/Sciences Économiques et Gestion (SEG), Université Virtuelle du Burkina Faso, Ouagadougou 64 BP, Burkina Faso
5
Laboratoire d’Economie de Poitiers (LÉP), 2 Rue Jean Carbonnier, TSA 81100, CEDEX 9, 86073 Poitiers, France
6
Sciences Transversales/Géomatique, Université Virtuelle du Burkina Faso, Ouagadougou 64 BP, Burkina Faso
7
Competence Center, West African Science Service Centre on Climate Change and Adapted Land Use (WASCAL), Ouagadougou P.O. Box 9507, Burkina Faso
8
Department of Soil Sciences, Université de Lomé, Lomé 01 BP 1515, Togo
9
Department of Exact and Applied Sciences, Université Joseph KI-ZERBO, Ouagadougou 03 BP 7021, Burkina Faso
*
Authors to whom correspondence should be addressed.
Climate 2024, 12(6), 80; https://doi.org/10.3390/cli12060080
Submission received: 30 March 2024 / Revised: 17 May 2024 / Accepted: 18 May 2024 / Published: 31 May 2024

Abstract

:
In the past two decades, several floods have affected people and their properties in Burkina Faso, with unprecedented flooding occurring in Ouagadougou in September 2009. So far, most studies have focused on Ouagadougou and surrounding localities and have paid little attention to other flood-prone regions in Burkina Faso. Consequently, there is a data and knowledge gap regarding flood risk in the Haut-Bassins region, which in turn hinders the development of mitigation strategies and risk reduction measures in affected communities. This study demonstrates how data collected at the household level can be used to understand flood risk and its components at the village level in this data-scarce region. Using an indicator-based method, we analyzed both flood risk and flood risk perception at the village level. Moreover, we determined the factors influencing flood risk perception at the household level using an ordered logit model. We found that 12 out of the 14 villages in our sample group had experienced high levels of flood risk. The management of runoff from the nearest urban areas as well as poorly designed civil engineering infrastructures, such as roads, were highlighted by households as significant factors that increased their vulnerability. Additionally, we found that the perceived flood risk consistently exceeds the estimated flood risk, with an insignificant positive correlation between both risk indices. Regression results indicate that flood risk perception is mainly influenced by informational and behavioral factors of households. The findings of this study can provide valuable information to municipal and regional authorities involved in disaster risk management within the study area. Moreover, our/this method is transferable to other data-scarce regions.

1. Introduction

In the last two decades, floods have become increasingly frequent and intense in West African Sahel countries. Numerous floods have affected the West African Sahel region, making many people homeless, damaging important properties, and destroying farmlands [1,2,3]. In addition to these direct consequences, floods have led to disease outbreaks [4] and caused food security issues [5]. In Burkina Faso, flood occurrences have increased significantly to five flood events per year during the decade 2006–2016 compared to one event per year in the period 1986–2005 [6]. In 2017, floods that were accompanied by strong winds caused the internal displacement of approximately 30,862 people in 12 out of 13 regions of Burkina Faso represented in this study [3]. The Haut-Bassins region was the second most flood-affected region in Burkina Faso between 1986 and 2016. During this period, floods affected between 3493 and 6776 individuals, including between 619 and 1300 who were left homeless and between 11 and 15 deaths [6]. In 2020, all regions in Burkina Faso were affected by several flood events, destroying properties and farmland in the Haut-Bassins region [7]. Human and economic losses associated with this increased upward trend in flood frequency are expected to increase significantly with global warming [8]. Economic damages from climate extremes have been detected in climate-exposed sectors, such as agriculture, forestry, fisheries, energy, and tourism [9]. Individual livelihoods have been affected through, for example, income, human health, and food security, with adverse effects on gender and social equity [9]. Against this background, it becomes necessary to pay particular attention to adaptation options, including disaster risk management, as despite progress, adaptation gaps exist across sectors and regions and there is increased evidence of maladaptation in various sectors and regions [9].
In many African countries, the number of climate-related research publications authored by local researchers is notably low compared to other regions around the world. Studies conducted by external researchers may be less focused on local priorities due to data availability, disparities in funding, and research leadership [10]. Moreover, flood risk assessment is still a challenge in Burkina Faso as flood risk management is concentrated on the emergency response phase rather than on understanding flood characteristics and associated impacts as a basis for sustainable adaptation strategies. In addition, most studies that focused on flood hazards [6,11,12,13], flood vulnerability [14,15], and coping capacity [16] have been performed in Ouagadougou city and surrounding localities, as a direct consequence of the unprecedented flooding in 2009. Other regions have received little attention, despite all regions of Burkina Faso, including the Haut-Bassins, being highly vulnerable to floods [7]. Overall, flood risk assessment remains rudimentary at the national level and authorities and communities mostly select flood adaptation measures without a scientific basis. In contrast, according to the Sendai framework, any development and implementation of disaster adaptation strategies should be based on the understanding of all risk components [17].
Flood risk emerges from the interaction of hazard and vulnerability [18]. This definition of risk was also used to assess the risk of multi-hazard events, including floods and droughts, in West Africa [19]. While there is a common understanding of the term hazard, vulnerability is one of the most ambiguous terms used in disaster risk management. There is currently no consensus on how to conceptualize and operationalize this term [18,20,21] and scientists tend to define and frame the term according to their area of expertise [21]. Despite attempts to harmonize these different perspectives, diversity still persists and it is crucial to specify the framework used in any study. In the context of this study, we adopted the vulnerability frameworks of UNESCO-IHE (Institute of Water Education, Delft, The Netherlands [22]) and MOVE (Methods for the Improvement of Vulnerability Assessment in Europe [21]). Both frameworks describe vulnerability as the result of three components, namely exposure, susceptibility, and resilience (UNESCO-IHE) or lack of resilience (MOVE), respectively.
Fostering effective flood adaptation measures in African countries presents a set of common challenges. Structural measures are largely absent and the existing ones are not well maintained [23]. Non-structural measures, such as land use planning, early warning, and flood insurance, are impaired by misinterpretations and a lack of coordination among various stakeholders and decision-makers. These challenges hinder the governments’ and local authorities’ ability to adequately support flood-prone communities. To ensure the successful implementation of flood adaptation measures, possible solutions have to be identified and accepted by all stakeholders. There are national as well as municipal governing bodies that are dedicated to disaster prevention and management. Despite this infrastructure, they are reactive instead of proactive. This is largely due to the challenges posed by quantifying flood risk, in particular due to limited data availability and the necessity of expertise in flood disaster management, which makes it difficult for decision-makers to make informed decisions. So far, only the study of [24], which focused on flood susceptibility mapping at the Kou Valley level, was carried out in the study area. However, local studies are crucial for identifying specific needs and implementing actions that consider local conditions, rather than solely relying on regional and national studies. Local studies provide a deeper understanding of flood risks and vulnerabilities associated with the local context, which can inform more targeted and effective disaster risk management strategies.
About three-quarters of the population of Burkina Faso lives in rural areas [25]. Previous studies have mainly focused on flood disasters in urban areas of Burkina Faso [6,11,12,13,14,15,16]. Therefore, it is crucial to conduct studies in rural areas, as they are much more vulnerable to flood disasters due to the weakness of building structures and a lack of sufficient attention to disaster prevention and mitigation [26]. Studies conducted in rural areas of China [26,27] on flood risk aimed to guide the layout of rescue and relief goods. Similarly, studies carried out in rural areas of Zimbabwe [28] and in rural communities in the Oti River Basin, West Africa [29], addressed flood risk to help determine the level of flooding and identify the main factors contributing to flood risk. Research has been conducted in the context of rural flood risk to contribute to the development of a new comprehensive and systematic methodology for assessing flood risk in Nan Province, Thailand [30].
The Protection Motivation Theory (PMT) is a widely used theory to explain the risk-reducing behavior of people against natural disasters [31]. PMT has two main components, namely the threat appraisal and coping appraisal, with the threat appraisal also referred to as risk perception [31]. Risk perception can be understood as the risk a person envisages. It depends on the individual’s subjective assessment of the risk sources [32]. It results from how they assess the likelihood of a particular hazard occurring to them and how concerned they are about this hazard and its impacts [33]. Risk perception is widely used to understand community responses to disaster risk [34]. According to PMT, a higher risk perception, when combined with a high coping appraisal, may motivate people to take protective actions aimed at reducing their risk [31], such as by acting on flood early warnings, opting for insurance, undertaking precaution, adaptation or preparedness measures, and complying with emergency protocols [34]. However, a higher risk perception when accompanied by a low coping appraisal, can lead people to avoid taking protective actions against the risk, which is referred to as fatalism [31]. Many studies have been conducted in the context of flood perception risk elsewhere in different parts of the world [16,35,36,37,38,39,40,41,42].
This study focuses on the Haut-Bassins region, 1 of the 13 regions in Burkina Faso, with substantial potential for agricultural and livestock development. This potential is largely attributed to the abundance of water resources and the position of the region within the climatic zone known for the highest amount of rainfall in Burkina Faso. The plains account for 25% of the country’s rice farms, contributing about 46% of the national rice production [43]. In addition, the Haut-Bassins region accounts for 41% of the national cotton production [44]. Despite this economic relevance, the Haut-Bassins is considered as the second flood-prone region in Burkina Faso [6]. Moreover, its rural poor population, heavily reliant on rain-fed agriculture, lacks the capacity to cope with climate variability [45]. To close the knowledge gap about flood risk in this region, this study presents a method that allows the assessment of flood risk from the microscale (household) to larger scales (such as the village scale). The method is particularly beneficial for developing countries where challenges exist due to limited data availability that is required for managing flood risk and vulnerability. This study demonstrates how data collected at the household level provide a comprehensive understanding of flood risk assessment at the village level. We further investigate the relation between flood risk and perceived risk and analyze the factors influencing flood risk perception at the household level. This study presents a framework that could serve as an alternative for monitoring flood vulnerability and risk across different administrative scales in Burkina Faso and other data-scarce regions.

2. Study Area and Methods

2.1. Study Area Description

The study area (Figure 1) is located in the western part of Burkina Faso. It consists of 14 villages distributed across four municipalities in the Haut-Bassins region. In total, 83,105 residents live in these villages [25], which cover an area of 5235 km2. Its rural population has grown rapidly since the 1970s, caused by internal migration from all regions of Burkina Faso to settle in the Kou Valley, which was developed to boost rice production. The Kou River is one of the tributaries of the Mouhoun River (also known as Black Volta River), the main river in Burkina Faso. The climate has two seasons, namely the dry season from November to April and the rainy season from May to October, with an average annual rainfall between 900 and 1200 mm. Floods typically occur in August and September due to heavy rainfall. The annual average temperature is about 26 °C and the highest temperature values are recorded between March and April.
We selected this study area based on three considerations. Firstly, these villages have experienced several floods [6] and have been identified as being susceptible to flooding [24]. from the International Disaster Database EM-DAT confirms the occurrence of severe floods in the study area, affecting thousands of people and their livelihoods [46]. Secondly, extreme rainfall, the main driver of floods in Sahelian countries, is expected to increase in the future [47,48]. Thirdly, after the commissioning of the Samandeni dam, the third largest hydroelectric and agricultural dam in the country, some households reported that their farmlands were increasingly flooded. As of the date of the survey used for the basis of our study, some communities close to the dam have not complied with the relocation process and have continued to live in flood-prone areas. This situation places these communities in a position of potentially severe exposure to flooding.

2.2. Identification of Flood-Prone Households and Data Collection

To identify flood-prone households in the study area, we proceeded in several steps. We firstly selected villages that had experienced flooding between 2006 and 2020. Together with the regional authorities of CONASUR (National Council for Emergency Relief and Rehabilitation, national institution of Burkina Faso in charge of disaster and human crises, http://www.conasur.gov.bf/, accessed on 27 April 2021) in the Haut-Bassins, we compiled a list of villages in the four municipalities that had experienced floods based on available historical data. We merged this list with the one obtained from discussion with the general secretaries of municipalities, as not all past floods were recorded in the CONASUR database. The resulting list was used to select villages that had been flooded at least once in the last 15 years.
As a next step, we used Cohran’s formula for a finite population [49,50] to estimate a sample size that ensures the representation of households affected by floods for a desired confidence level. Cohran’s formula estimates the adequate sample size (n) for a given population N as [50], as follows:
n = n 0 1 + n 0 1 N  
with
n 0 = Z 2 p q e 2  
Where Z is the Z value (e.g., Z = 1.96 for 95% confidence interval), e is the desired level of precision, i.e., the margin of error, and p is the estimated proportion of the population with the attribute in question. When there is no literature on p and no pilot survey has been conducted to determine its value, p is set to 0.5, which ensures that the sample size is representative of the characteristic of interest for which the study is carried out and q corresponds to the opposite of p (q = 1 − p).
Then, a stratified random sampling method was used to proportionally distribute the number of households to be interviewed to each village, according to its population size. All households in each village were considered a homogeneous group in the stratified random sampling process.
To facilitate data collection in the villages, we were assisted by the head of the Village Development Council (CVD) who introduced us to households with the support of the general secretaries of the municipalities and heads of the villages. With the agreement of village residents, the members of the CVD are selected and operate under the supervision of the municipal council to help prepare and implement communal development plans in the village [51]. Members of the CVD are not part of the municipal staff and receive no remuneration or compensation. Despite the help of CVD heads, households in sector 3 of Soungallodaga refused to be interviewed due to their dissatisfaction with the relocation caused by the construction of the Samandeni dam. In addition, five households were not able to be interviewed in Bama due to time constraints that prevented the continuation of the interview. A total of 376 valid and complete questionnaires were collected out of 381 recorded. The survey was conducted between May and June 2021. The questionnaire was addressed to the head of the household proceeding to a face-to-face interview. The aim of the study was explained to the respondent of the household and his or her consent was obtained before interviewing. Respondents were at least 18 years old at the date of the survey.

2.3. Selection of Household Flood Risk Indicators

Flood risk analysis aims to quantitatively assess the flood risk [18]. Typically, it evaluates the components of risk and the capacity to reduce risk and provides risk information to residents, municipalities, governments, and insurance companies [52].
We used a composite indicator-based method to estimate the household flood risk. This approach is flexible, transparent, and easy to understand and use by decision-makers [53]. Furthermore, it facilities mapping and comparing vulnerability and risk across regions; it enhances communication between the public and policymakers and it helps assess any progress achieved [54]. It also facilitates monitoring and evaluation of flood risk, as well as the appropriate allocation of resources for risk reduction [50]. A challenge of the indicator-based assessment is the selection of a minimum number of proper indicators to characterize the vulnerability of the system under study. We based our selection on earlier studies and used indicators that were shown to be informative for assessing household risk (Table 1). In addition, we chose the indicators in such a way that multicollinearity was avoided [55]. Based on this deductive approach, we selected indicators for the hazard, exposure, susceptibility, and resilience components of household flood risk.

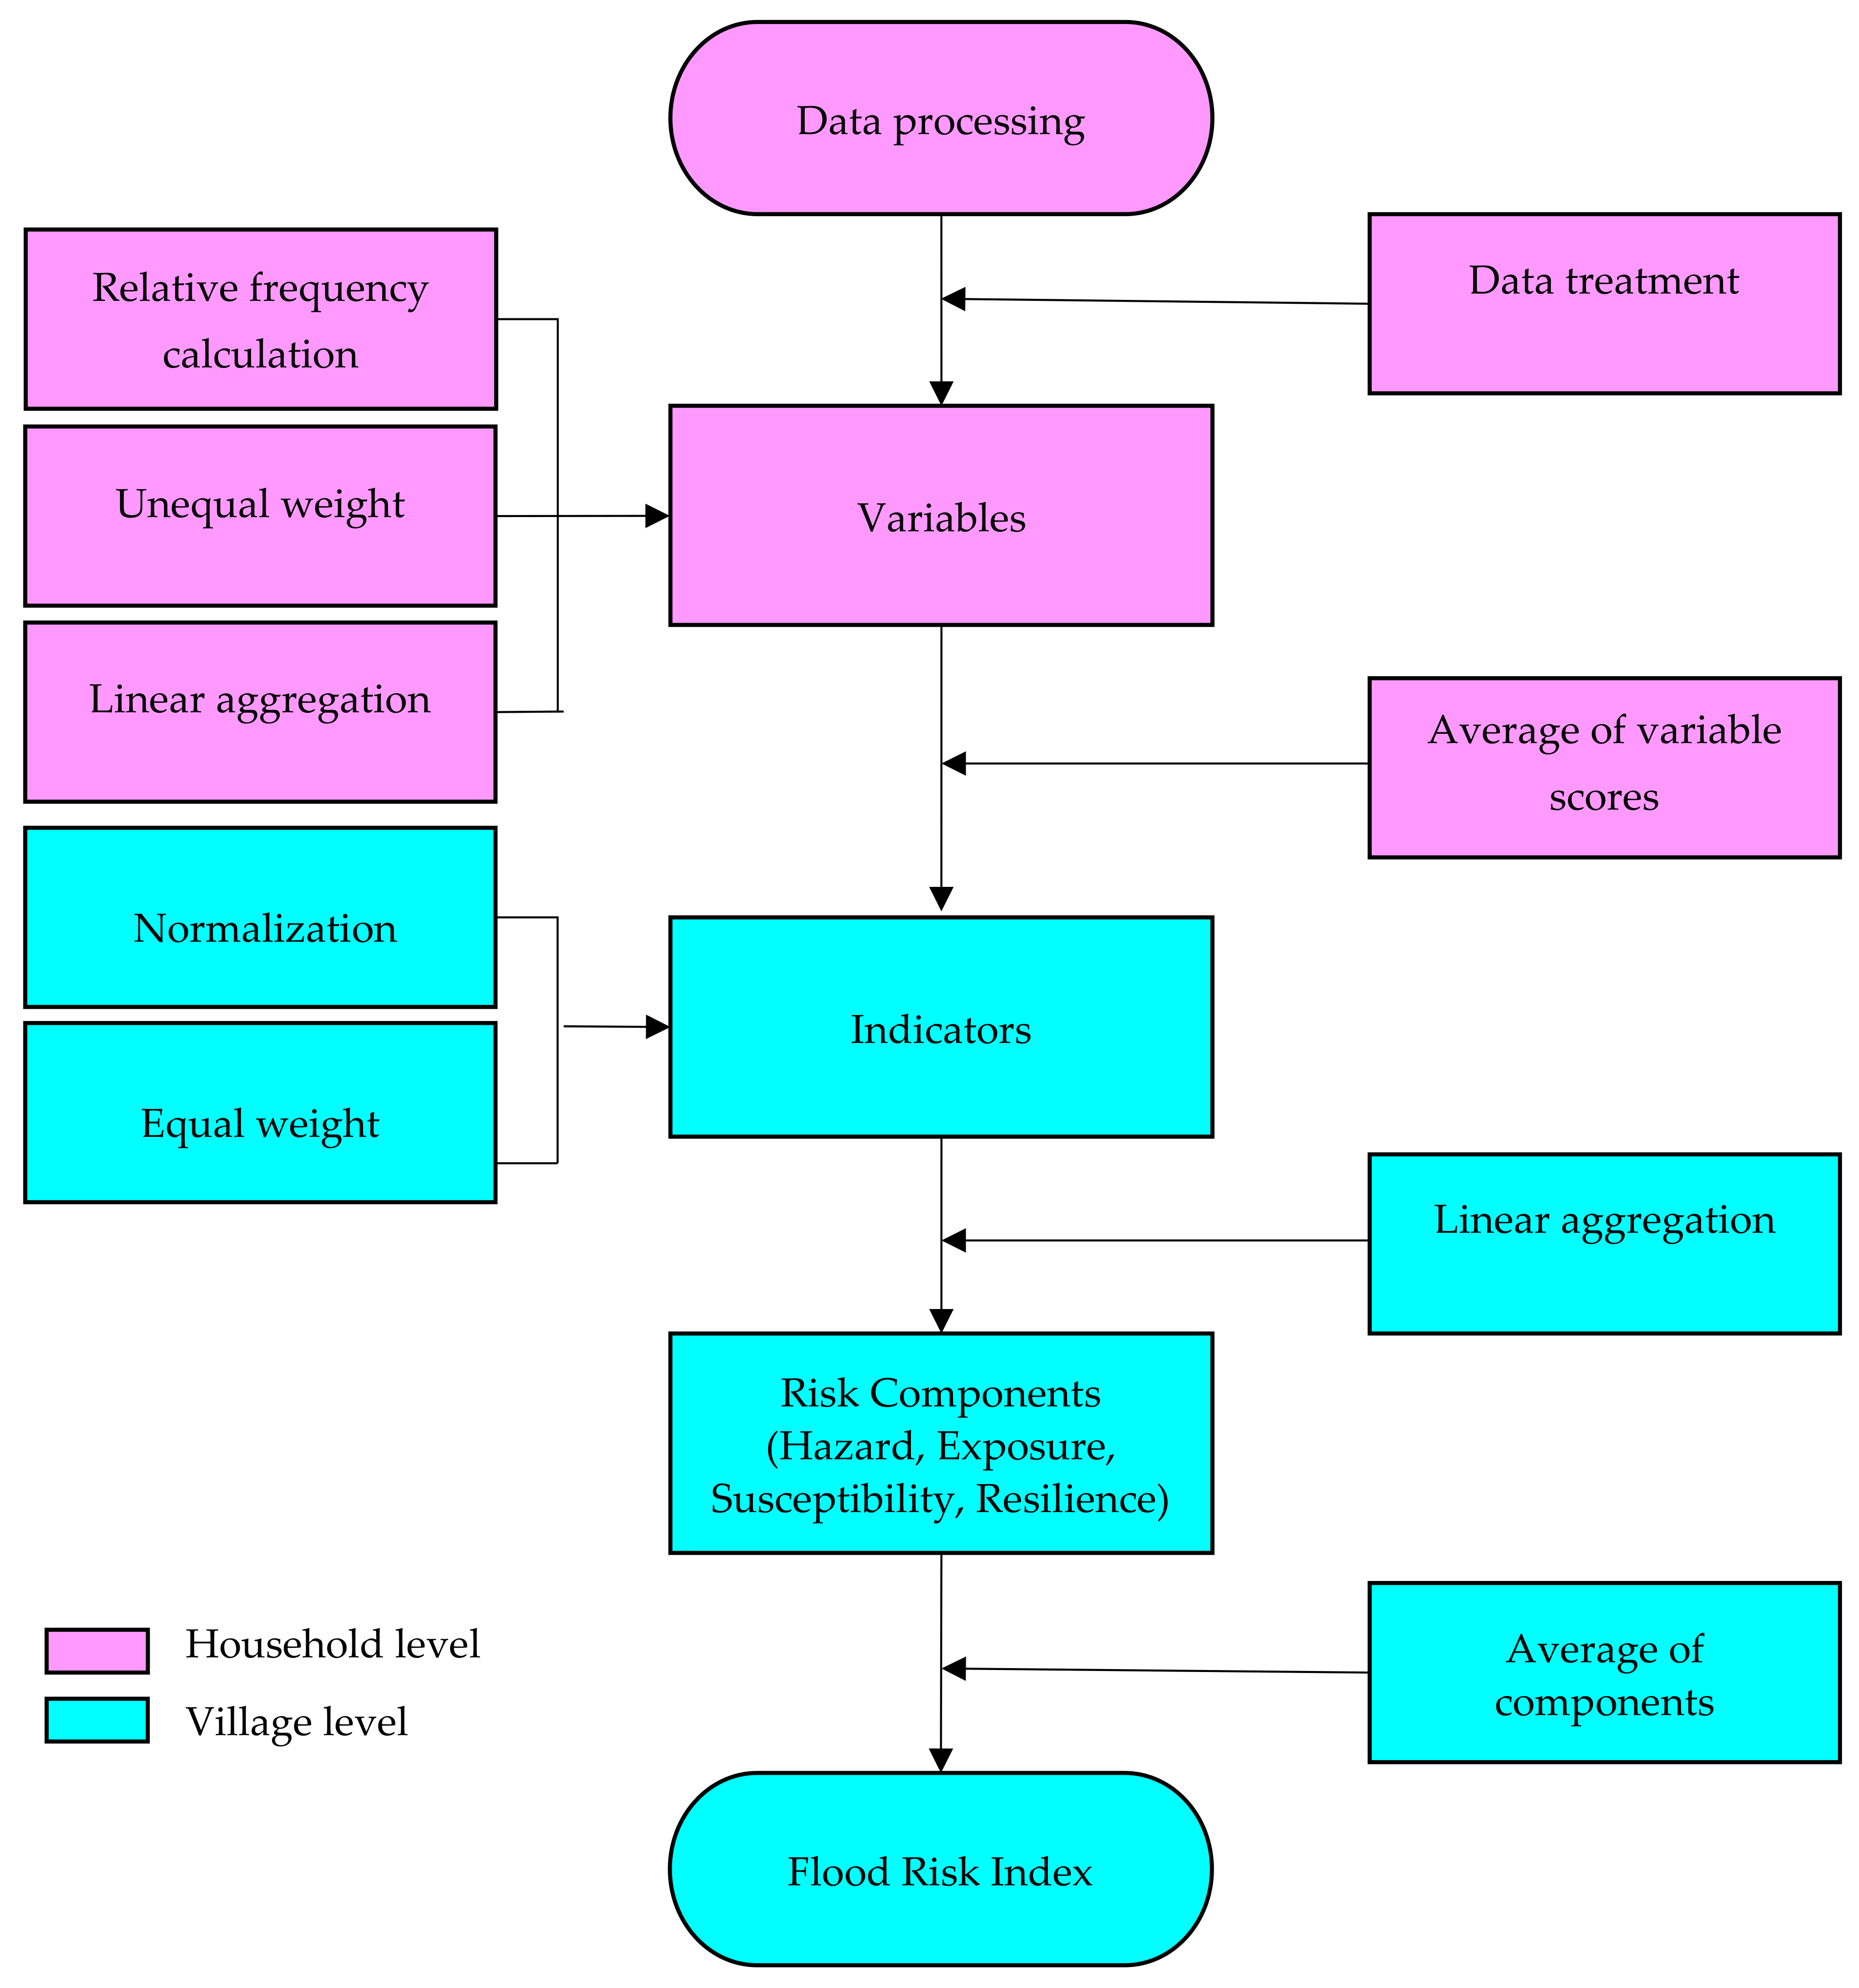
2.4. Development of the Flood Risk Index

An indicator can be a single variable or a complex aggregate measure describing a system or process [54]. Indicators can be formed from both quantitative and qualitative variables. In this study, most indicators were constructed from qualitative variables ranging from two to six classes. Data were gathered at the household level but the indicators, the risk index, and its components were calculated at the village level (Figure 2).
The first step involved processing the data to exclude incomplete questionnaires. Subsequently, we calculated the relative frequency of the variables used as input to the indicators at the village level. Variables were categorized into different classes, ranging from two (for instance, binary variables such as Yes or No) to six, based on their characteristics relating to household vulnerability to floods. We assigned unequal weights to each class of variables, depending on their vulnerability level. A value of one was assigned to the most vulnerable classes, while the value zero was assigned to the least vulnerable classes. For binary responses, the weights are zero (Yes) or one (No). For variables with three classes, the weights were assigned as 0.33, 0.67, and 1. Similarly, we assigned weights for variables with a higher number of classes. For instance, for variables with five classes, the weights are 0.2, 0.4, 0.6, 0.8, and 1 [58]. Then, a linear aggregation was employed to combine all classes of variables into a single score. This linear aggregation can be expressed as follows:
V = j = 1 n w i K i
where w j represents the weight assigned to class j of the variable and K j corresponds to the relative frequency of class j of the variable. V is the score of the variable, n is the number of classes for the variable, and the value score of each indicator is the arithmetic average of V for the variables that make up the indicator. The indicator score is expressed as
X = 1 m V 1 + V 2 + + V m
where X represents the indicator score and m denotes the number of variables included in the indicator. After constructing the indicators, they were normalized to a range of 0–1. This normalization process is essential because the indicators are measured in different units and on different scales. The normalization is expressed as
XN = X m i n X m a x X m i n X  
where X refers to the original indicator and XN is the normalized indicator. After normalization, we applied the equal weighting method to assign weights to the indicators. The equal weighting method is straightforward, easy to reproduce, and eliminates any potential for subjective interpretation [54,59].
After weighing the indicators, four composite indicators representing the hazard, exposure, susceptibility, and resilience components were calculated using the arithmetic average as a linear aggregation method. Following this, the Flood Risk Index (FRI) [50,60] and Flood Vulnerability Index (FVI) [59] were computed, as follows:
F R I = 1 4 H + E + S + 1 R
and
F V I = 1 3 E + S + 1 R
where H, E, S, and R denote the hazard, exposure, susceptibility, and resilience component, respectively. The term “1 − R” indicates “lack of Resilience”. To represent the risk and the risk components of a certain village verbally, we transformed the numeric values, which range from 0 to 1, according to Table 2 [28].

2.5. Risk Perception and Flood Risk Perception Index

Managing and communicating flood risks necessitates a strong understanding of how people perceive risk [35]. Therefore, examining flood risk perception has become crucial for implementing effective measures against flood disasters.
Unlike the risk index, which was estimated using the indicator-based method, risk perception was collected directly during the survey. We asked the respondents how they assessed the risk of flooding in their household by assigning their risk to either “Not at all”, “very low”, “low”, “medium”, “high”, or “very high”. After processing the data, we observed that all the households surveyed perceived their flood risk level as either “medium”, “high”, or “very high”. To enable comparisons at the village level between the flood risk estimated from indicators and the flood risk perception directly rated by households, we employed the flood risk perception index [39,61]. This index was introduced to evaluate the flood risk perception of rural households in China, using four indicators: likelihood, fear, impact, and awareness [39,61]. Researchers [34,36] in Pakistan have developed a flood risk perception index using more than four indicators. Hence, there is no consensus on how flood risk perception should be represented by an index.
In this study, the flood risk perception index at the village level was constructed directly using the single flood risk perception variable. The households rated the perception variable. The flood risk perception index was constructed in two steps. We first transformed the classes “medium”, “high”, and “very high” of the flood risk perception variable to 0.6, 0.8, and 1. Then, the Flood Risk Perception Index (FRPI) was calculated for each village, as follows:
F R P I = 1 n i = 1 n S i
where S i corresponds to the different flood risk perceptions (0.6, 0.8, or 1.0) of the households and n denotes the number of households being interviewed in each village.

2.6. Determinants Influencing Flood Risk Perception

Flood risk perception varies between individuals and between communities [34,62]. The contextual factors include culture, history, government policy, religion, trust in government, and public protection measures [62].
To identify the determinants of the household flood risk perception, an ordered logistic model was used. The model establishes a relationship between the flood risk perception y , corresponding to one of the three states “medium”, “high”, or “very high”, and the influencing factors. The model parameters were estimated applying the maximum likelihood statistic. The unobservable variable y * is the latent variable corresponding to the dependent variable y , X is the set of influencing factors, β is the corresponding vector of parameters to be estimated, and ϵ is the term error of the logistic distribution:
y * = β X + ϵ
Considering the critical values α 1   α 2 α 3 to be estimated, the relationship between y * and y depends on whether y * is greater or smaller than the given critical value, that is, if y * α 1 , risk perception is low ( y = 1); if   α 1   y *   α 2   , risk perception is medium ( y = 2); and if y * >   α 2   ,   risk   perception   is   high   ( y = 3). The response probability of the dependent variable is given by [63], as follows:
P y = 1 = P y * α 1 = P β X + ϵ α 1 = Φ α 1 β X P y = 2 = P α 1 < y * α 2 = Φ α 2 β X Φ α 1 β X P y = 3 = P y * > α 2 = 1 Φ α 3 β X
To ensure a good model fit and to test whether the model is meaningful, we applied the likelihood ratio test, which is a hypothesis test used to choose the best model out of several nested models [64]. The multicollinearity test was also performed to avoid a high intercorrelation amongst the covariables. Finally, the Wald test was applied to determine the significance of individual regression coefficients [64], i.e., to access whether an independent variable has a significant effect on flood risk perception. We assumed a threshold of 0.1, i.e., variables with a probability lower than 0.1 are assumed to significantly influence risk perception.
Unlike the linear regression model, the interpretation of coefficients from a logistic regression is not straightforward because the coefficients cannot directly be used to quantify the relative effect or impact of the covariables on the dependent variable. Instead, the sign of the coefficients is used to evaluate whether the covariables impact negatively or positively the dependent variable. Thus, we used the odds ratio (OR) and the elasticity to quantify the effect of the covariables. An Odds is defined as the probability of an event occurring divided by the probability of that event not occurring:
O d d s = P 1 P
where P denotes the probability of an event to occur. The OR is defined as the ratio of two Odds values. In the logistic regression, the OR of a covariable X i can be calculated as follows:
O R = exp β i
Here, β i is the coefficient associated with X i . When X i is a categorial variable with m categories (from X i , 1 to X i , m ), assuming all other covariables remain constant, the OR compares the odds of an event occurring for each subsequent category (from X i + 2   t o   X i + m ) relative to reference category X i , 1 . A value of OR > 1 implies that the odds of the dependent variable occurring, given a unit increase in the independent X i , are multiplied by the value of the OR. An OR smaller than one indicates that the odds of the dependent variable occurring, given a unit increase in the independent variable X i , are reduced by the value of the OR [63].
In addition to the OR, we employed pseudo-elasticity to measure the impact of changes in independent variables on flood risk perception. For discrete variables, pseudo-elasticity E X n k P n k is defined as [63,65,66]:
E X n k P n k = P n k g i v e n   X n k = 1 P g i v e n   X n k = 0 P g i v e n   X n k = 0
Here, the pseudo-elasticity value E X n k P n k represents the percentage change in the probability P n k of flood risk perception of the nth household for the kth independent variable, from a vector X of independent variables. The pseudo-elasticity is computed for each household individually. To estimate the pseudo-elasticity for all households, the average pseudo-elasticity is calculated [65].

3. Results

3.1. Assessment of Flood Risk Components

Out of the 14 villages in the study area, 13 are characterized by high to very high hazard of flooding (Figure 3a), apart from a village in the northern part where the flood hazard is moderate. The villages most exposed to flooding are located in the west-central region (Figure 3b). Lahirasso (village 11), with an exposure score of 0.56, exhibits the lowest flood exposure due to the lowest human exposure among all villages as well as low assets exposure. Tanwogma (village 7) and Seguere (village 10) have the highest exposure scores (>0.8), as both residents and their assets are strongly exposed to floods. However, the local exposure in Tanwogma is not as high as local exposure in Seguere. Food susceptibility is moderate with values of the susceptibility indicator ranging from 0.47 to 0.58 across all villages (Figure 3d). This small variation indicates that susceptibility to flooding is not statistically different from one village to another. In all villages, except for Lahirasso (village 11) and Nematoulaye (village 12) in the northern area, households show a moderate lack of resilience (Figure 3e). Lack of resilience ranges from 0.48 to 0.66, with the highest values for Lahirasso (0.66) and Nematoulaye (0.63). In both villages, none of the residents have subscribed to health or agricultural insurance and a small proportion of residents have knowledge about flooding and warning systems.
Flood vulnerability, composed of exposure, susceptibility, and lack of resilience, scores from 0.56 to 0.66 (Figure 3c) from moderately to highly vulnerable. Overall, 50% of the villages are classified as moderately vulnerable and the other 50% are classified as highly vulnerable to floods. Again, the variation across the villages is small. Combining the hazard and vulnerability indicators shows that flood risk is high throughout the study area (Figure 3f), except for Lahirasso (village 11) and Banakeledaga (village 9). These two villages show moderate risk, mainly due to low values of hazard and susceptibility for Lahirasso, and low values of susceptibility and lack of resilience for Banakeledaga. About 93% of the surveyed households live in the 12 villages with high flood risk. High risk is mainly a consequence of high values of hazard and exposure, whereas susceptibility and lack of resilience are predominately moderate throughout the study area. Overall, the variation in the flood risk index is rather small, ranging from 0.55 to 0.68.

3.2. Flood Risk Perception, Flood Risk Perception Index, and Link with Flood Risk Index

3.2.1. Perception of Flood Risk by Households

Unlike flood risk assessed using the indicator-based method, the head of household was asked directly about their perception of flood risk. In total, 14.4%, 26.6%, and 59% of households perceived flood risk as medium, high, and very high, respectively (Figure 4). The highest are found for Kadomba (village 14), where 85% of the households perceived the risk of flooding as very high.

3.2.2. Link between the Flood Risk Perception Index and the Estimated Flood Risk Index

The flood risk perception index at the village level, directly calculated from the risk perception of the households, consistently exceeds the risk index derived from various indicators (Figure 5). FRPI ranges from 0.81 to 0.97, while FRI does not reach 0.8 in any village. An explanation for the much higher values of FRPI is that the households believed that they would receive assistance from government and non-governmental organizations when they rated the flood risk as high. During the survey interview, some households inquired about the likelihood of receiving support from national authorities. FRI and FRPI are correlated (Pearson correlation coefficient: 0.38), although this correlation is not statistically significant (p-value = 0.18). The R-squared value, which indicates the proportion of the variance of FRI that is explained by FRPI is low, with a value of 0.14.

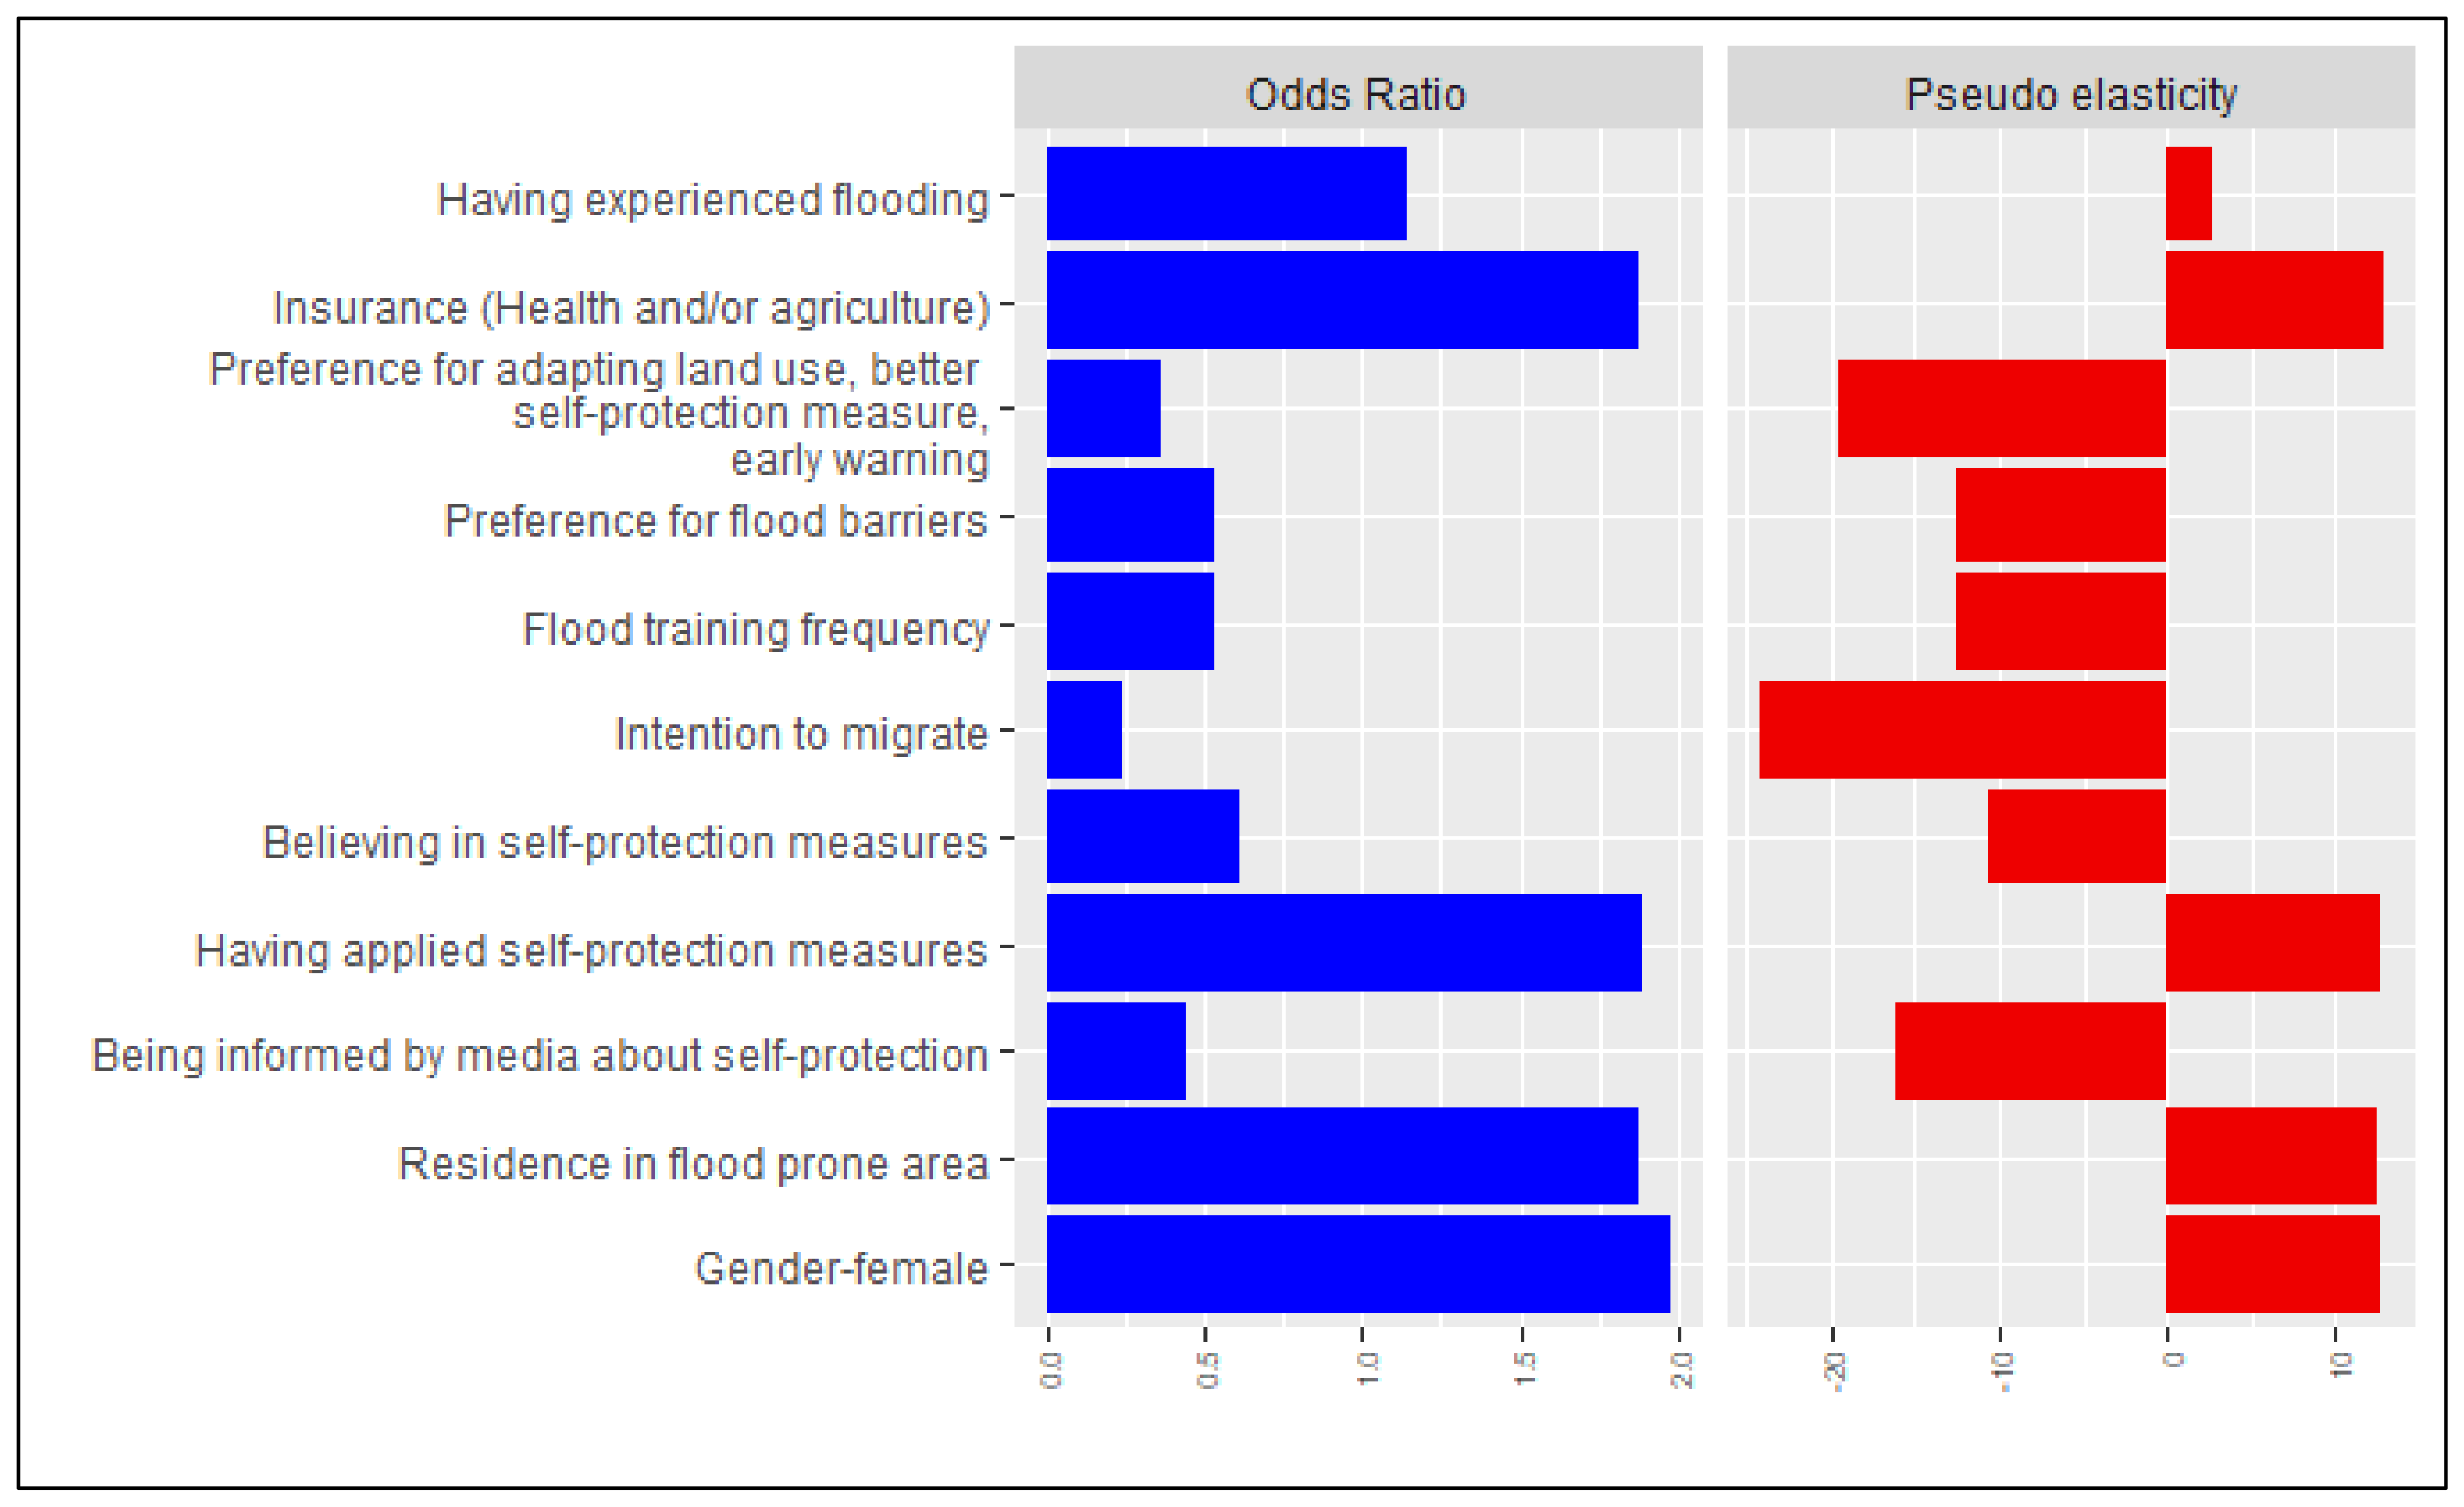
3.3. Analyzing Factors Influencing Household Flood Risk Perception

We used the ordered logistic model to determine the influence of various factors on the households’ perception of flood risk.
The results of the regression revealed that being female as the head of the household positively influences the household’s perception of flood risk (OR = 1.98, pseudo-elasticity = 12.6%). It implies that a female household head is approximately twice as likely to perceive a very high flood risk compared to a male household head. Elasticity analysis indicates that when the household head changes from a man to a woman, the probability of perceiving flood risk as very high increases by 12.6% on average.
We found that households that perceived themselves as being located in a flood-prone area had a higher perception of flood risk (OR = 1.88). Households in flood-prone areas were approximatively twice as likely to perceive a very high flood risk compared to those living outside flood-prone areas. The elasticity analysis also showed that living in a flood-prone area or moving from a safe location to a flood-prone location, influenced their perception of risk, increasing the probability of perceiving flood risk as very high by 12.4% on average. For instance, some of the households in Soungallodaga (village 8, Figure 3) reported in the interview that they were relocated to a flood-prone area compared to their original location because there was no drainage system for runoff in the village. Similarly, some households in Bama (village 1, Figure 3) reported that the drainage system was not maintained, so their residences became flood-prone.
Conversely, being informed by the media about self-protection against flooding reduced the household flood risk perception (OR = 0.44 and pseudo-elasticity = −16.1%). This suggests that households informed by the media may learn how to implement preparedness measures, thus reducing their concern about flood impacts. Having applied self-protection measures against flooding decreases the probability of households perceiving flood risk as very high (OR = 0.24 and pseudo elasticity = −24.2%). This indicates that these households tend to believe in the efficacy of these measures.
Believing that self-protection can diminish flood impacts reduced flood risk perception. Households that believed in self-protection as an efficient measure against floods perceived lower flood risk (OR = 0.61). Similarly, the elasticity analysis revealed that believing in self-protection reduced the probability of perceiving flood risk as very high by 10.6% on average. These results indicate that households may believe in the efficacy of self-protection measures, which is an important factor in motivating people to adopt protective behaviors.
The intention to migrate to less flood-prone areas due to anticipated increases in flood risk is negatively correlated to household flood risk perception (OR = 0.54). The elasticity analysis also reveals that households intending to migrate were associated with a lower likelihood of perceiving flood risk as very high by 12.6% on average. From these results, we conclude that, even though households fully understand the level of flood risk they face, it is hard for them to accept a decision to move as a self-protection option. However, despite the expectation of increasing flood risk, about 65.2% of the households did not show interest in migrating. This may be explained by a lack of knowledge about suitable places to move to. Additionally, they might have heard negative reports about the relocated villages prior to the construction of the Samandeni dam, leading them to avoid situations similar to those experienced by the relocated households. Moreover, a decision to migrate could significantly affect the traditions and culture of communities, which are a heritage passed down from generation to generation that some households are not prepared to lose.
Households expressed a need to increase their capacity for self-protection measures. The effectiveness of the training diminished as the frequency of these sessions reduced. Households receiving monthly training showed a higher perception of flood risk, compared to those who received training bi-annually (OR = 1.89). Similarly, households who received monthly training experienced a 12.6% increase in the likelihood of perceiving flood risk as very high, compared to those with bi-annual training. This indicates that households receiving bi-annual training in self-protection measures tend to underestimate flood risk compared to those receiving monthly training.
Households that preferred flood barriers as self-protection measures had a lower likelihood of perceiving flood risk as very high, compared to those who preferred dikes (OR = 0.54 and elasticity = −12.5%). Additionally, households that preferred adapting land use in flood-prone areas, adopting better self-protection measures, and receiving early warnings from authorities had a lower (OR = 0.36 and elasticity = −19.5%) likelihood to perceive flood risk as very high, compared to those who preferred dikes.
Our data showed a positive correlation (OR = 1.88 and elasticity = 13%) between the preference for subscribing to health or agriculture insurance and flood risk perception. However, this influence is small and not statistically significant. Moreover, having experienced floods more than once is positively correlated with flood risk perception (OR = 1.14, elasticity = 2.8%) but this correlation is not statistically significant. Figure 6 summarizes the impact of the factors influencing household flood risk perception.

4. Discussion

This study evaluated the flood risk faced by the rural households in flood-prone villages within four municipalities in the Haut-Bassins region, Burkina Faso. Results indicate a spatial variation in household flood risk within the study area, with levels ranging from moderate to high levels. Furthermore, the study analyzed the factors influencing food risk perception using an ordered logit model.

4.1. Household Flood Risk Assessment

The level of flood hazard is uniform (high) across the villages, with the exception of the two villages Lahirasso (village 11, medium) and Kadomba (village 14, very high). This uniformity is attributed to the fact that the villages are rather close to each other and located within the same valley. Households in Lahirasso reported that flooding primarily occurred around the periphery of the village and occasionally reached residential areas. Residents of Kadomba and Santidougou (village 13) reported that the flood hazard increased significantly after asphalting the national road through the village linking Bobo-Dioulasso and Dédougou cities. They attributed this increase to the narrow bridge spanning the river, which they believe directs runoff water from heavy rainfall toward the village, possibly causing inundation. Many households mentioned that their properties were located at a lower elevation than the newly asphalted road. The elevated road disrupts the natural runoff system, leading to water stagnation, which in turn exacerbates the risk of flooding within the village.
Flood exposure is high in 11 villages, very high in two villages (Seguere, village 7; Tanwogma, village 10), and medium in Bama (village 1). Distance to the river is one of the commonly used determinants in assessing flood exposure and risk [67,68]. However, there is not a distinct distance from which exposure to floods is low [69]. We observed that there was not a single factor that dominated the level of household exposure, given the different indicators (local, human, and assets exposure) that contribute to flood exposure. The Government of Burkina Faso has listed Seguere as one of the villages scheduled for relocation, due to the expansion of agricultural development, particularly for rice cultivation, facilitated by the construction of the Samandeni dam.
Flood susceptibility is medium across the entire study area. Housing amenities and natural resource degradation were particularly important in affecting susceptibility. Key indicators, which included residences, their farmland, and the quality of their water resources, significantly influenced flood susceptibility, accounting for roughly 47% of the total indicators. As old houses built from mud bricks are more susceptible to flooding [55], it becomes evident that housing conditions and access to basic amenities significantly influence flood susceptibility. In particular, households without access to clean water and sanitary facilities were more susceptible to floods. Specific instances were highlighted in Banahorodougou, Desso, and Souroukoudou (villages 3, 5, and 9), located near the city of Bobo Dioulasso. These villages have experienced frequent floods over the years, leading to the erosion of sediment from city areas onto farmlands. This process has rendered several hundred hectares unsuitable for agriculture. Furthermore, households that rely on wells for their drinking water reported a decrease in water quality following floods. This deterioration escalates the risk of communicable diseases, posing a serious public health concern.
Most villages showed a moderate lack of resilience, apart from Lahirasso and Nematoulaye (villages 11 and 12), with a high lack of resilience. Nematoulaye, located in a rice-growing lowland area, is particularly vulnerable to flooding. The head of the village communicated that the community had agreed to move to less flood-prone areas with government support once the survey was completed. However, the ability of households to cope with floods can be diminished by a lack of disaster knowledge, emergency preparedness, and/or low insurance coverage. Particular attention should be paid to these aspects to improve the ability of households to cope with floods.
Flood vulnerability is medium in 50% of villages and high in the other 50%. The most vulnerable households are typically located in rice-growing lowlands where flood hazards are expected to be high. However, households in Banahorodougou, Banakeledaga, Desso, and Souroukoudougou (villages 3, 4, 5, and 9; Figure 3) have indicated that in recent years, floods in their villages were primarily caused by the management of runoff from the urban area of Bobo-Dioulasso. Furthermore, households in these villages reported that hundreds of hectares of farmland have become unsuitable for agriculture due to the sedimentation caused by runoff from the drainage systems of Bobo-Dioulasso. Therefore, the vulnerability assessment of these villages depends on the management of the urban areas of Bobo-Dioulasso. These findings align with another study [70], which proposed a theoretical and conceptual framework that considers urban–rural linkages in rural vulnerability assessments. This conceptual framework suggests that the flood vulnerability of rural areas should not be assessed independently but should be connected with the nearest urban areas, which is key to reducing the vulnerability of these villages [70]. Furthermore, poorly designed civil engineering infrastructures, such as roads, were highlighted by households as a significant factor increasing the vulnerability of households in Santidougou and Kadomba (villages 13 and 14, Figure 3) traversed by a national road connecting Bobo-Dioulasso and Dédougou.
Most of the villages experienced high levels of flood risk, except for Banakeledaga and Lahirasso (villages 4, 11) with moderate flood risk. Flood hazard and exposure were key components contributing to high risk levels. The lower scores for susceptibility and lack of resilience that we find in our study area suggest that households have increasingly adapted to floods. The degree of flood risk was considered moderate due to the elevated location of the village.
We found a positive, but insignificant correlation (p = 0.38) between the flood risk index and the flood risk perception index. The study of [56] found a significant positive correlation for urban communities. More studies are needed to understand whether these different results are linked to the different environments (urban versus rural area).

4.2. Factors Influencing Households’ Flood Risk Perception

Our results show that the flood experiences of households and their implementation of self-protection measures played a significant role in reducing the perception of flood risk. Their flood experience amplified their perception of flood risk. To mitigate this risk, they took measures to reduce flood risk. Learning self-protection practices from the media can effectively decrease household flood risk.
Many households believed that self-protection measures could minimize flood risk. With a growing skepticism toward national disaster risk management, households increasingly turned to self-management of flood events. As the rainy season drew near, residents began to organize and clean the drainage system of the community. Self-protection measures had proven to be the most effective mitigation strategy up to the 100-year return period [71]. Beyond this point, its effectiveness declines significantly [72]. These findings suggest that coordinating self-protection efforts by authorities could substantially improve flood risk mitigation.
Households perceived relocation as an effective flood mitigation measure. However, the implementation of relocation measures should be carefully considered, as several African countries have encountered many difficulties in its implementation [72]. For instance, after the unprecedented floods of 2009 in Ouagadougou, the relocation program of the government turned into a challenge for the government and not into a solution. Renters, who were a portion of the victims, were excluded from a resettlement site at Yagma, located about 20 kilometers from Ouagadougou [73]. This site, chosen without considering amenities and livelihood opportunities, lacked essential services such as water and electricity; health clinics and secondary schools were too far, transportation was scarce, and economic opportunities were limited [73]. Thus, any relocation program must carefully ensure that it does not become a source of injustice. This is in line with a study in Africa and Asia [72] reporting that relocation typically generates winners and losers. The new site could offer opportunities for some new settlers, whereas others could lose their customers, businesses, or employment. It also argued that governments and aid agencies should be better informed about flooding, its characteristics and impacts, and the degree of people resisting shocks before proceeding to any flood relocation.
We found that women perceived a higher flood risk compared to men. Our finding agrees with [74], which also stated that women perceived higher levels of flood risk. Gender inequality is higher in countries where both legal and cultural differences between genders are strong [75], as is the case in Burkina Faso. In Burkina Faso, gender inequality is mainly attributed to the socio-cultural weights of tradition rather than to legal factors [76]. Men and women have the same rights in both the private and public sectors. However, it remains challenging for women to be leaders in their communities, especially in their roles as guardians of tradition and lands. Before performing regression analysis, we conducted a correlation analysis of each factor with flood risk perception. The results showed no significant link between socio-economic factors, including household head schooling (p = 0.58), household occupation (p = 0.33), household income (p = 0.88), and flood risk perception. Therefore, we concluded that these factors should not be considered in the ordered logit regression. Other studies also found only insignificant effects of socioeconomic factors, including education, occupation, and income, on flood risk perception [35,41,74,77].

5. Limitations

This study acknowledges its limitations. While the indicator-based approach is simple and effective for monitoring flood risks, it fails to estimate flood losses and lacks insight into vulnerability dynamics. Specifically, it cannot provide estimates of building and contents losses nor address future human–flood interactions, including potential changes in vulnerability. Furthermore, the analysis of factors influencing the perception of flood risk could be improved. The concepts of threat appraisal, referred to as risk perception, and coping appraisal are two factors of the Protection Motivation Theory, but this research does not consider coping appraisal. Given the relationship between flood risk perception and flood coping appraisal [31], understanding how households might respond based on their coping appraisal in relation to their flood risk perception is essential. Therefore, the Structural Equation Modeling framework is a suitable choice, as it is particularly useful for testing complex relationships simultaneously in a single model, rather than employing multiple models [78,79,80].

6. Conclusions

To our knowledge, this work is the first study in the Hauts-Bassins region to provide detailed insights into actual and perceived flood risk using household-level data. The national disaster risk management agency lacks data about the risk of flooding. Therefore, our approach to household surveys is considered a viable option to fill this knowledge gap.
Our study provided essential knowledge about the flood risks faced by households at the village level and determined the factors that influenced household flood risk perception. Our findings revealed that the drainage system in certain areas of Bobo-Dioulasso city directly impacted the flood risk levels in nearby villages and the vulnerability of their inhabitants. Additionally, the construction of road infrastructures, particularly during the asphalting phase of the road connecting Bobo-Dioulasso and Dédougou, was identified as a potential driver that may have contributed to increased flooding in some villages. We found a positive but weak correlation between the estimated flood risk and the perceived flood risk. Our results suggest that households may overestimate flood risk compared to the more objective approach of using an indicator-based method. Informational factors, such as being informed by media about self-protection and having applied self-protection measures, along with behavioral factors like the intention to migrate, flood training frequency, preference for flood barriers, adapting land use, better self-protection, and early warnings, have been found to strongly influence perceptions of household flood risk.
Very little research on natural hazards has been conducted in Burkina Faso and even less has been conducted in our study area. Our findings can serve as a starting point for developing effective risk reduction and climate adaptation strategies. Future work should consider exploring multi-variable flood loss models for residential buildings and contents [81,82], as well as paying attention to how floods interact with and affect vulnerability using the socio-hydrological modeling approach [83]. This may help to overcome the reactive approach of the national disaster risk management agency in Burkina Faso and foster a more proactive flood risk management.

Supplementary Materials

The following supporting information can be downloaded at https://www.mdpi.com/article/10.3390/cli12060080/s1: Table S1. The scores of variables and indicators are calculated and used to estimate risk and its components. Numbers denote villages: 1: Bama, 2: Badara, 3: Banahorodougou, 4: Banakeledaga, 5: Desso, 6: Lanifiera, 7: Seguere, 8: Soungallodaga, 9: Souroukoudougou, 10: Tanwogma, 11: Lahirasso, 12: Nematoulaye, 13: Santidougou, 14: Kadomba. Table S2. Each class of variables is assigned an unequal weight. These weights are then multiplied by the corresponding relative frequencies of the variable classes. Finally, the average of the scores of the classes of the same variable determines the contribution to the indicator's construction.

Author Contributions

Investigation, resources, data curation, and writing—original draft preparation, M.S.; conceptualization, methodology, visualization, writing—review and editing, and funding acquisition, M.S. and B.M.; software and formal analysis, M.S., A.N., G.I.Y. and I.P.; validation, M.S., B.M., J.M.S. and F.Z.; and supervision and project administration, B.M., J.M.S. and F.Z. All authors have read and agreed to the published version of the manuscript.

Funding

This work was supported by the German Federal Ministry of Education and Research (BMBF) through the West African Science Service Center on Climate Change and Adapted Land Use (WASCAL) and German Research Centre for Geosciences (GFZ) at the University of Potsdam.

Data Availability Statement

The survey data used in the study are available and can be obtained from the authors upon request.

Acknowledgments

The authors would like to thank the West Africa Science Service Centre on Climate Change and Adapted Land Use (WASCAL), funded by the German Federal Ministry of Education and Research (BMBF), for its financial support that allowed M. S. to undertake part of this research as part of his doctoral research.

Conflicts of Interest

The authors declare no conflicts of interest.

References

  1. Li, C.; Chai, Y.; Yang, L.; Li, H. Spatio-Temporal Distribution of Flood Disasters and Analysis of Influencing Factors in Africa. Nat. Hazards 2016, 82, 721–731. [Google Scholar] [CrossRef]
  2. Schraven, B.; Adaawen, S.; Rademacher-Schulz, C.; Segadlo, N. Climate Change Impacts on Human (Im-) Mobility in Sub-Saharan Africa: Recent Trends and Options for Policy Responses; Deutsche Gesellschaft für Internationale Zusammenarbeit: Bonn, Germany; Eschborn, Germany, 2020. [Google Scholar]
  3. Teye, J.K. Migration in West Africa: IMISCOE Regional Reader; Springer Nature: Berlin/Heidelberg, Germany, 2022. [Google Scholar]
  4. Ahern, M.; Kovats, R.S.; Wilkinson, P.; Few, R.; Matthies, F. Global Health Impacts of Floods: Epidemiologic Evidence. Epidemiol. Rev. 2005, 27, 36–46. [Google Scholar] [CrossRef] [PubMed]
  5. Reed, C.; Anderson, W.; Kruczkiewicz, A.; Nakamura, J.; Gallo, D.; Seager, R.; McDermid, S.S. The Impact of Flooding on Food Security across Africa. Proc. Natl. Acad. Sci. USA 2022, 119, e2119399119. [Google Scholar] [CrossRef]
  6. Tazen, F.; Diarra, A.; Kabore, R.F.W.; Ibrahim, B.; Bologo/Traoré, M.; Traoré, K.; Karambiri, H. Trends in Flood Events and Their Relationship to Extreme Rainfall in an Urban Area of Sahelian West Africa: The Case Study of Ouagadougou, Burkina Faso. J. Flood Risk Manag. 2019, 12, e12507. [Google Scholar] [CrossRef]
  7. IFRC Emergency Plan of Action (EPoA) Burkina Faso: Floods—IFRC. Available online: https://www.icrc.org/fr/ou-nous-intervenons/africa/burkina-faso (accessed on 2 November 2022).
  8. Dottori, F.; Szewczyk, W.; Ciscar, J.-C.; Zhao, F.; Alfieri, L.; Hirabayashi, Y.; Bianchi, A.; Mongelli, I.; Frieler, K.; Betts, R.A. Increased Human and Economic Losses from River Flooding with Anthropogenic Warming. Nat. Clim. Change 2018, 8, 781–786. [Google Scholar] [CrossRef]
  9. Howarth, C.; Viner, D. Integrating Adaptation Practice in Assessments of Climate Change Science: The Case of IPCC Working Group II Reports. Environ. Sci. Policy 2022, 135, 1–5. [Google Scholar] [CrossRef]
  10. Trisos, C.H.; Adelekan, I.O.; Totin, E.; Ayanlade, A.; Efitre, J.; Gemeda, A.; Kalaba, K.; Lennard, C.; Masao, C.; Mgaya, Y.; et al. Africa. In Climate Change 2022: Impacts, Adaptation and Vulnerability. Contribution of Working Group II to the Sixth Assessment Report of the Intergovernmental Panel on Climate Change; Pörtner, H.-O., Roberts, D.C., Tignor, M.M.B., Poloczanska, E.S., Mintenbeck, K., Alegría, A., Craig, M., Langsdorf, S., Löschke, S., Möller, V., et al., Eds.; Cambridge University Press: Cambridge, UK, 2022. [Google Scholar]
  11. Bouvier, C.; Chahinian, N.; Adamovic, M.; Cassé, C.; Crespy, A.; Crès, A.; Alcoba, M. Large-Scale GIS-Based Urban Flood Modelling: A Case Study On the City of Ouagadougou. In Advances in Hydroinformatics; Springer: Berlin/Heidelberg, Germany, 2018; pp. 703–717. [Google Scholar]
  12. Coulibaly, G.; Leye, B.; Tazen, F.; Mounirou, L.A.; Karambiri, H. Urban Flood Modeling Using 2D Shallow-Water Equations in Ouagadougou, Burkina Faso. Water 2020, 12, 2120. [Google Scholar] [CrossRef]
  13. De Risi, R.; Jalayer, F.; De Paola, F.; Lindley, S. Delineation of Flooding Risk Hotspots Based on Digital Elevation Model, Calculated and Historical Flooding Extents: The Case of Ouagadougou. Stoch. Environ. Res. Risk Assess. 2018, 32, 1545–1559. [Google Scholar] [CrossRef]
  14. Da, M.L.C.; Hangnon, H.; Amalric, M.; Nikiema, A.; Robert, E.; Bonnet, E. Revealing Social Vulnerability Profiles for Urban Flood Management: The Case of Ouagadougou (Burkina Faso). Cybergeo Eur. J. Geogr. 2022, 1–46. [Google Scholar] [CrossRef]
  15. Karambiri, H.; Tazen, F.; Traore, K.; Bologo, M.; La, T.; Coulibaly, M.G. Floods Vulnerability Index “Grand Ouaga Area”(Burkina FASO). 2019. Available online: https://www.ceh.ac.uk/sites/default/files/2023-01/AMMA-2050-technical-support-6-Flood-Vulnerability-Index.pdf (accessed on 20 November 2022).
  16. Schlef, K.E.; Kaboré, L.; Karambiri, H.; Yang, Y.E.; Brown, C.M. Relating Perceptions of Flood Risk and Coping Ability to Mitigation Behavior in West Africa: Case Study of Burkina Faso. Environ. Sci. Policy 2018, 89, 254–265. [Google Scholar] [CrossRef]
  17. UNDRR United Nations Office for Disaster Risk Reduction (UNDRR). Available online: https://www.undrr.org/ (accessed on 12 November 2022).
  18. Merz, B.; Hall, J.; Disse, M.; Schumann, A. Fluvial Flood Risk Management in a Changing World. Nat. Hazards Earth Syst. Sci. 2010, 10, 509–527. [Google Scholar] [CrossRef]
  19. Asare-Kyei, D.; Renaud, F.G.; Kloos, J.; Walz, Y.; Rhyner, J. Development and Validation of Risk Profiles of West African Rural Communities Facing Multiple Natural Hazards. PLoS ONE 2017, 12, e0171921. [Google Scholar] [CrossRef] [PubMed]
  20. Birkmann, J. Measuring Vulnerability to Promote Disaster-Resilient Societies: Conceptual Frameworks and Definitions. Meas. Vulnerability Nat. Hazards Towards Disaster Resilient Soc. 2006, 1, 3–7. [Google Scholar]
  21. Birkmann, J.; Cardona, O.D.; Carreño, M.L.; Barbat, A.H.; Pelling, M.; Schneiderbauer, S.; Kienberger, S.; Keiler, M.; Alexander, D.; Zeil, P. Framing Vulnerability, Risk and Societal Responses: The MOVE Framework. Nat. Hazards 2013, 67, 193–211. [Google Scholar] [CrossRef]
  22. Balica, S.; Wright, N.G. Reducing the Complexity of the Flood Vulnerability Index. Environ. Hazards 2010, 9, 321–339. [Google Scholar] [CrossRef]
  23. Ouikotan, R.B.; Van der Kwast, J.; Mynett, A.; Afouda, A. Gaps and Challenges of Flood Risk Management in West African Coastal Cities. In Proceedings of the XVI World Water Congress, Cancun, Mexico, 29 May–3 June 2017. [Google Scholar]
  24. Guelbeogo, S.; Ouedraogo, L. Cartographie Des Risques d’inondation Dans Le Bassin Versant Du Kou Au Burkina Faso. Afr. Sci. 2022, 21, 60–75. [Google Scholar]
  25. Institut National de La Statistique et de La Démographie: 5e RGPH. Available online: http://insd.bf/index.php/rgph-5 (accessed on 2 January 2023).
  26. Zhang, Q.; Zhang, J.; Jiang, L.; Liu, X.; Tong, Z. Flood Disaster Risk Assessment of Rural Housings—A Case Study of Kouqian Town in China. Int. J. Environ. Res. Public Health 2014, 11, 3787–3802. [Google Scholar] [CrossRef]
  27. Zhen, Y.; Liu, S.; Zhong, G.; Zhou, Z.; Liang, J.; Zheng, W.; Fang, Q. Risk Assessment of Flash Flood to Buildings Using an Indicator-Based Methodology: A Case Study of Mountainous Rural Settlements in Southwest China. Front. Environ. Sci. 2022, 10, 931029. [Google Scholar] [CrossRef]
  28. Mudavanhu, C.; Manyangadze, T.; Mavhura, E.; Pedzisai, E.; Manatsa, D. Rural Households’ Vulnerability and Risk of Flooding in Mbire District, Zimbabwe. Nat. Hazards 2020, 103, 3591–3608. [Google Scholar] [CrossRef]
  29. Komi, K.; Amisigo, B.A.; Diekkrüger, B. Integrated Flood Risk Assessment of Rural Communities in the Oti River Basin, West Africa. Hydrology 2016, 3, 42. [Google Scholar] [CrossRef]
  30. Tingsanchali, T.; Promping, T. Comprehensive Assessment of Flood Hazard, Vulnerability, and Flood Risk at the Household Level in a Municipality Area: A Case Study of Nan Province, Thailand. Water 2022, 14, 161. [Google Scholar] [CrossRef]
  31. Bubeck, P.; Wouter Botzen, W.J.; Laudan, J.; Aerts, J.C.J.H.; Thieken, A.H. Insights into Flood-Coping Appraisals of Protection Motivation Theory: Empirical Evidence from Germany and France. Risk Anal. 2018, 38, 1239–1257. [Google Scholar] [CrossRef]
  32. Rundmo, T. Risk Perception and Safety on Offshore Petroleum Platforms—Part II: Perceived Risk, Job Stress and Accidents. Saf. Sci. 1992, 15, 53–68. [Google Scholar] [CrossRef]
  33. Rundmo, T. Risk Perception and Safety on Offshore Petroleum Platforms—Part I: Perception of Risk. Saf. Sci. 1992, 15, 39–52. [Google Scholar] [CrossRef]
  34. Rana, I.A.; Jamshed, A.; Younas, Z.I.; Bhatti, S.S. Characterizing Flood Risk Perception in Urban Communities of Pakistan. Int. J. Disaster Risk Reduct. 2020, 46, 101624. [Google Scholar] [CrossRef]
  35. Shah, A.A.; Ajiang, C.; Khan, N.A.; Alotaibi, B.A.; Tariq, M.A.U.R. Flood Risk Perception and Its Attributes among Rural Households under Developing Country Conditions: The Case of Pakistan. Water 2022, 14, 992. [Google Scholar] [CrossRef]
  36. Ullah, F.; Saqib, S.E.; Ahmad, M.M.; Fadlallah, M.A. Flood Risk Perception and Its Determinants among Rural Households in Two Communities in Khyber Pakhtunkhwa, Pakistan. Nat. Hazards 2020, 104, 225–247. [Google Scholar] [CrossRef]
  37. Yin, Q.; Ntim-Amo, G.; Ran, R.; Xu, D.; Ansah, S.; Hu, J.; Tang, H. Flood Disaster Risk Perception and Urban Households’ Flood Disaster Preparedness: The Case of Accra Metropolis in Ghana. Water 2021, 13, 2328. [Google Scholar] [CrossRef]
  38. Yaseen, M.; Ullah, F.; Visetnoi, S.; Ali, S.; Saqib, S.E. Does the Nature of Floods Matter in the Risk Perception of Households? A Comparative Assessment among the Rural Households Prone to Flash and Riverine Floods in Pakistan. Water 2023, 15, 504. [Google Scholar] [CrossRef]
  39. Liu, D.; Li, Y.; Shen, X.; Xie, Y.; Zhang, Y. Flood Risk Perception of Rural Households in Western Mountainous Regions of Henan Province, China. Int. J. Disaster Risk Reduct. 2018, 27, 155–160. [Google Scholar] [CrossRef]
  40. Adelekan, I.O.; Asiyanbi, A.P. Flood Risk Perception in Flood-Affected Communities in Lagos, Nigeria. Nat. Hazards 2016, 80, 445–469. [Google Scholar] [CrossRef]
  41. Lechowska, E. Approaches in Research on Flood Risk Perception and Their Importance in Flood Risk Management: A Review. Nat. Hazards 2022, 111, 2343–2378. [Google Scholar] [CrossRef]
  42. Thistlethwaite, J.; Henstra, D.; Brown, C.; Scott, D. How Flood Experience and Risk Perception Influences Protective Actions and Behaviours among Canadian Homeowners. Environ. Manag. 2018, 61, 197–208. [Google Scholar] [CrossRef]
  43. Souleymane, O. Technical and Economic Efficiency of Rice Production in the Kou Valley (Burkina Faso): Stochastic Frontier Approach. Asian J. Agric. Rural. Dev. 2015, 5, 53–63. [Google Scholar]
  44. Herrera, R.; Ilboudo, L. Les Défis de l’agriculture Paysanne: Le Cas Du Burkina Faso. L’Homme la Soc. 2012, 183–184, 83–95. [Google Scholar] [CrossRef]
  45. Sultan, B.; Gaetani, M. Agriculture in West Africa in the Twenty-First Century: Climate Change and Impacts Scenarios, and Potential for Adaptation. Front. Plant Sci. 2016, 7, 1262. [Google Scholar] [CrossRef]
  46. EM-DAT|The International Disasters Database. Available online: https://www.emdat.be/ (accessed on 20 November 2022).
  47. Dayamba, S.D.; D’haen, S.; Coulibaly, O.J.D.; Korahiré, J.A. Étude de La Vulnérabilité Des Systèmes de Production Agro-Sylvo-Pastoraux Face Aux Changements Climatiques Dans Les Provinces Du Houet et Du Tuy Au Burkina Faso; Climate Analytics Inc.: New York, NY, USA, 2019. [Google Scholar]
  48. Sougué, M.; Merz, B.; Sogbedji, J.M.; Zougmoré, F. Extreme Rainfall in Southern Burkina Faso, West Africa: Trends and Links to Atlantic Sea Surface Temperature. Atmosphere 2023, 14, 284. [Google Scholar] [CrossRef]
  49. Cochran, W.G. Sampling Techniques; John Wiley & Sons: Hoboken, NJ, USA, 1977. [Google Scholar]
  50. Mondal, M.S.H.; Murayama, T.; Nishikizawa, S. Assessing the Flood Risk of Riverine Households: A Case Study from the Right Bank of the Teesta River, Bangladesh. Int. J. Disaster Risk Reduct. 2020, 51, 101758. [Google Scholar] [CrossRef]
  51. Burkina Faso Loi N° 055-2004/An Portant Code General Des Collectivités Territoriales Au Burkina Faso. Available online: https://www.dgb.gov.bf/edocman/loi-055-2004.pdf (accessed on 31 August 2023).
  52. Shah, M.A.R.; Rahman, A.; Chowdhury, S.H. Challenges for Achieving Sustainable Flood Risk Management. J. Flood Risk Manag. 2018, 11, S352–S358. [Google Scholar] [CrossRef]
  53. De Brito, M.M.; Evers, M.; Höllermann, B. Prioritization of Flood Vulnerability, Coping Capacity and Exposure Indicators through the Delphi Technique: A Case Study in Taquari-Antas Basin, Brazil. Int. J. Disaster Risk Reduct. 2017, 24, 119–128. [Google Scholar] [CrossRef]
  54. Damm, M. Mapping Social-Ecological Vulnerability to Flooding. Ph.D. Thesis, Universitäts-und Landesbibliothek Bonn, Bonn, Germany, 2010. [Google Scholar]
  55. Hamidi, A.R.; Zeng, Z.; Khan, M.A. Household Vulnerability to Floods and Cyclones in Khyber Pakhtunkhwa, Pakistan. Int. J. Disaster Risk Reduct. 2020, 46, 101496. [Google Scholar] [CrossRef]
  56. Rana, I.A.; Routray, J.K. Actual Vis-à-Vis Perceived Risk of Flood Prone Urban Communities in Pakistan. Int. J. Disaster Risk Reduct. 2016, 19, 366–378. [Google Scholar] [CrossRef]
  57. Jamshed, A.; Rana, I.A.; Birkmann, J.; Nadeem, O. Changes in Vulnerability and Response Capacities of Rural Communities after Extreme Events: Case of Major Floods of 2010 and 2014 in Pakistan. J. Extrem. Events 2017, 4, 1750013. [Google Scholar] [CrossRef]
  58. Rana, I.A.; Routray, J.K. Integrated Methodology for Flood Risk Assessment and Application in Urban Communities of Pakistan. Nat. Hazards 2018, 91, 239–266. [Google Scholar] [CrossRef]
  59. Nazeer, M.; Bork, H.-R. A Local Scale Flood Vulnerability Assessment in the Flood-Prone Area of Khyber Pakhtunkhwa, Pakistan. Nat. Hazards 2021, 105, 755–781. [Google Scholar] [CrossRef]
  60. Maskrey, A. Disaster Mitigation: A Community Based Approach; Oxfam GB: Oxford, UK, 1989. [Google Scholar]
  61. Liu, D.; Li, M.; Li, Y.; Chen, H. Assessment of Public Flood Risk Perception and Influencing Factors: An Example of Jiaozuo City, China. Sustainability 2022, 14, 9475. [Google Scholar] [CrossRef]
  62. Lechowska, E. What Determines Flood Risk Perception? A Review of Factors of Flood Risk Perception and Relations between Its Basic Elements. Nat. Hazards 2018, 94, 1341–1366. [Google Scholar] [CrossRef]
  63. Ma, C.; Zhou, J.; Yang, D. Causation Analysis of Hazardous Material Road Transportation Accidents Based on the Ordered Logit Regression Model. Int. J. Environ. Res. Public Health 2020, 17, 1259. [Google Scholar] [CrossRef] [PubMed]
  64. The Pennsylvania State University 12.1—Logistic Regression|STAT 462. Available online: https://online.stat.psu.edu/stat462/node/207/ (accessed on 5 September 2023).
  65. Kim, J.-K.; Ulfarsson, G.F.; Kim, S.; Shankar, V.N. Driver-Injury Severity in Single-Vehicle Crashes in California: A Mixed Logit Analysis of Heterogeneity Due to Age and Gender. Accid. Anal. Prev. 2013, 50, 1073–1081. [Google Scholar] [CrossRef]
  66. Ulfarsson, G.F.; Mannering, F.L. Differences in Male and Female Injury Severities in Sport-Utility Vehicle, Minivan, Pickup and Passenger Car Accidents. Accid. Anal. Prev. 2004, 36, 135–147. [Google Scholar] [CrossRef]
  67. Samanta, S.; Koloa, C.; Kumar Pal, D.; Palsamanta, B. Flood Risk Analysis in Lower Part of Markham River Based on Multi-Criteria Decision Approach (MCDA). Hydrology 2016, 3, 29. [Google Scholar] [CrossRef]
  68. Tehrany, M.S.; Pradhan, B.; Mansor, S.; Ahmad, N. Flood Susceptibility Assessment Using GIS-Based Support Vector Machine Model with Different Kernel Types. Catena 2015, 125, 91–101. [Google Scholar] [CrossRef]
  69. Roy, S.; Bose, A.; Chowdhury, I.R. Flood Risk Assessment Using Geospatial Data and Multi-Criteria Decision Approach: A Study from Historically Active Flood-Prone Region of Himalayan Foothill, India. Arab. J. Geosci. 2021, 14, 999. [Google Scholar] [CrossRef]
  70. Jamshed, A.; Birkmann, J.; Feldmeyer, D.; Rana, I.A. A Conceptual Framework to Understand the Dynamics of Rural–Urban Linkages for Rural Flood Vulnerability. Sustainability 2020, 12, 2894. [Google Scholar] [CrossRef]
  71. Garrote, J.; Bernal, N.; Díez-Herrero, A.; Martins, L.R.; Bodoque, J.M. Civil Engineering Works versus Self-Protection Measures for the Mitigation of Floods Economic Risk. A Case Study from a New Classification Criterion for Cost-Benefit Analysis. Int. J. Disaster Risk Reduct. 2019, 37, 101157. [Google Scholar] [CrossRef]
  72. Arnall, A. Resettlement as Climate Change Adaptation: What Can Be Learned from State-Led Relocation in Rural Africa and Asia? Clim. Dev. 2019, 11, 253–263. [Google Scholar] [CrossRef]
  73. McLeman, R.; Schade, J.; Faist, T. (Eds.) Environmental Migration and Social Inequality; Advances in Global Change Research; Springer International Publishing: Cham, Switzerland, 2016; Volume 61, ISBN 978-3-319-25794-5. [Google Scholar]
  74. Kellens, W.; Zaalberg, R.; Neutens, T.; Vanneuville, W.; De Maeyer, P. An Analysis of the Public Perception of Flood Risk on the Belgian Coast. Risk Anal. 2011, 31, 1055–1068. [Google Scholar] [CrossRef]
  75. Ardaya, A.B.; Evers, M.; Ribbe, L. What Influences Disaster Risk Perception? Intervention Measures, Flood and Landslide Risk Perception of the Population Living in Flood Risk Areas in Rio de Janeiro State, Brazil. Int. J. Disaster Risk Reduct. 2017, 25, 227–237. [Google Scholar] [CrossRef]
  76. Helmfrid, S. Towards Gender Equality in Burkina Faso—Recherche Google. Available online: https://www.google.com/url?sa=t&source=web&rct=j&opi=89978449&url=https://cdn.sida.se/publications/files/sida3965en-towards-gender-equality-in-burkina-faso.pdf&ved=2ahUKEwia9PCciI6FAxUtU6QEHdbhCoMQFnoECBQQAQ&usg=AOvVaw1Fkal53hpzaxim5KC45KNo (accessed on 25 March 2024).
  77. O’Neill, E.; Brereton, F.; Shahumyan, H.; Clinch, J.P. The Impact of Perceived Flood Exposure on Flood-Risk Perception: The Role of Distance. Risk Anal. 2016, 36, 2158–2186. [Google Scholar] [CrossRef]
  78. Christ, S.L.; Lee, D.J.; Lam, B.L.; Zheng, D.D. Structural Equation Modeling: A Framework for Ocular and Other Medical Sciences Research. Ophthalmic Epidemiol. 2014, 21, 1–13. [Google Scholar] [CrossRef]
  79. Faruk, M.O.; Maharjan, K.L. Factors Affecting Farmers’ Adoption of Flood Adaptation Strategies Using Structural Equation Modeling. Water 2022, 14, 3080. [Google Scholar] [CrossRef]
  80. Kurata, Y.B.; Ong, A.K.S.; Ang, R.Y.B.; Angeles, J.K.F.; Bornilla, B.D.C.; Fabia, J.L.P. Factors Affecting Flood Disaster Preparedness and Mitigation in Flood-Prone Areas in the Philippines: An Integration of Protection Motivation Theory and Theory of Planned Behavior. Sustainability 2023, 15, 6657. [Google Scholar] [CrossRef]
  81. Chinh, D.T.; Dung, N.V.; Gain, A.K.; Kreibich, H. Flood Loss Models and Risk Analysis for Private Households in Can Tho City, Vietnam. Water 2017, 9, 313. [Google Scholar] [CrossRef]
  82. Chinh, D.T.; Gain, A.K.; Dung, N.V.; Haase, D.; Kreibich, H. Multi-Variate Analyses of Flood Loss in Can Tho City, Mekong Delta. Water 2015, 8, 6. [Google Scholar] [CrossRef]
  83. Schoppa, L.; Barendrecht, M.H.; Paprotny, D.; Sairam, N.; Sieg, T.; Kreibich, H. Projecting Flood Risk Dynamics for Effective Long-Term Adaptation. Earth’s Future 2024, 12, e2022EF003258. [Google Scholar] [CrossRef]
Figure 1. Topography and location of rivers, the Samandeni dam, and the 14 villages where the household survey was conducted in the four municipalities (Bama, Bobo-Dioulasso, Padema, and Satiri) of the Haut-Bassins region. Only villages were surveyed that experienced floods at least once between 2006 and 2020.
Climate 12 00080 g001
Figure 2. Flowchart of how the flood risk index at the village level was calculated from variables collected at the household level.
Climate 12 00080 g002
Figure 3. Scores of flood risk and its components for the flood-prone villages in the study area. Red (1–0.8), orange (0.8–0.6), yellow (0.6–0.4), light green (0.4–0.2), and green (0.2–0) colors denote very high, high, moderate, low, and very low, respectively. Numbers denote villages: 1: Bama, 2: Badara, 3: Banahorodougou, 4: Banakeledaga, 5: Desso, 6: Lanifiera, 7: Seguere, 8: Soungallodaga, 9: Souroukoudougou, 10: Tanwogma, 11: Lahirasso, 12: Nematoulaye, 13: Santidougou, and 14: Kadomba. The purple dot shows the location of the dam of Samandeni. The spectrum from green to red symbolizes a range from very low to very high degrees of risk and its components. Light green, yellow, and orange colors denote, respectively, low, moderate, and high degrees of risk and its components. Specifically, green signifies very low scores for hazard (a), exposure (b), vulnerability (c), susceptibility (d), lack of resilience (e), and risk (f). Conversely, red indicates very higher scores. Additional data is available in Supplementary Materials.
Climate 12 00080 g003
Figure 4. Households’ perception of flood risk in their respective villages.
Climate 12 00080 g004
Figure 5. Relationship between the flood risk index (FRI) and the flood risk perception index (FRPI) for the 14 villages. Numbers denote villages: 1: Bama, 2: Badara, 3: Banahorodougou, 4: Banakeledaga, 5: Desso, 6: Lanifiera, 7: Seguere, 8: Soungallodaga, 9: Souroukoudougou, 10: Tanwogma, 11: Lahirasso, 12: Nematoulaye, 13: Santidougou, and 14: Kadomba.
Climate 12 00080 g005
Figure 6. Odds ratio (blue) and pseudo elasticity (red) of the factors influencing household flood risk perception. Social factor includes gender, while geographical factor includes residence in a flood-prone area. Informational factors encompass being informed by media about self-protection and having applied self-protection measures. Contextual factors include believing in self-protection measures. Behavioral factors include intention to migrate, flood training frequency, preference for flood barriers, adapting land use, better self-protection, and early warnings. Cognitive factors include insurance and having experienced a flood.
Climate 12 00080 g006
Table 1. Indicators selected for assessing household flood risk, based on [50,55,56,57].
Components and
Subcomponents
Description and Relevance
Hazard
Flood frequencyPast flood events show that the area is flood-prone and higher frequency of flooding implies higher risk.
Flood intensityHigher flood depth results in higher damages.
Exposure
Local exposureElevation and proximity to the river increase the household exposure.
Human exposureFamily members injured or affected by communicable diseases by previous flooding implies that the household is exposed.
Assets exposureDamage to the house, loss of household goods, inundation of agricultural land, and crops from previous floods indicates household exposure.
Susceptibility
Socio-demographic factorsHouseholds with female or young heads, dependent members (children and elders), women, low literacy, or large household size are more vulnerable to flooding.
Health conditionsHouseholds with special needs have limited mobility in case of emergency; longer distance to health centre increases vulnerability.
Economic conditionHouseholds with low or unstable income or households, which have taken loans and do not have access to financial institutions, are more vulnerable and recover worse from flooding.
Housing and amenitiesEarthen and wood houses, elderly houses, and households without access to drinking water, sanitary toilet, tubewell, or electricity are more vulnerable to floods.
Land ownershipAs household occupants are mostly farmers, agricultural land supports the recovery process. Households living on rented land have fewer options or less willingness to fortify their house, thus increasing vulnerability.
Natural resources degradationFarmland degradation affects crop cultivation and productivity and degradation of water quality affects human and crop health.
Resilience
KnowledgeBetter knowledge of disaster risk and understanding of flood warnings increase the awareness and preparedness of households in case of flooding.
Emergency preparednessHouseholds that have saved crops or undertaken emergency planning are better prepared and more capable of coping with floods.
Access to informationHouseholds that possess phones, TV sets, radios, or transportation means and households that received an early warning the last time a flood occurred are more aware and better able to receive early warning flood information and to respond during evacuation and recovery.
Mitigation measuresHouseholds that have taken mitigation measures after the last flood are better aware of flooding.
Livelihood diversificationHouseholds with members employed outside the community, multiple-earning members, non-agriculture income, and livestock tend to less be affected by flooding. Households that were able to recover from the last flood using their own resources are considered more capable to cope with flooding.
Social networkGood cooperation with neighbors; the community helps households to scope with floods. Households living in their community for a longer time will be aware of evacuation routes and the geography of their locality.
InsuranceInsurance increases the capacity to recover from flooding.
Land use adaptationAfforestation and increasing vegetation tend to reduce runoff. Changes to crop types that are less vulnerable to flooding.
AttitudeHouseholds that perceive flooding as likely and households that believe that flooding is God’s will tend to be less prepared for future floods. Households that tend to agree with government policies are inclined to follow flood initiatives, increasing their resilience.
Table 2. Transformation of numeric values of risk and its components (hazard, exposure, susceptibility, lack of resilience, and vulnerability) to five semi-quantitative levels from ‘very low’ to ‘very high’.
Levels of Measurement
Risk and Its Components1–0.80.8–0.60.6–0.40.4–0.20.2–0
Very highHighModerateLowVery low
Disclaimer/Publisher’s Note: The statements, opinions and data contained in all publications are solely those of the individual author(s) and contributor(s) and not of MDPI and/or the editor(s). MDPI and/or the editor(s) disclaim responsibility for any injury to people or property resulting from any ideas, methods, instructions or products referred to in the content.

