Abstract
The temporal and spatial variation in seasonal sea ice in Hudson Strait is examined using time series and spatial clustering analyses. For the period from 1971 to 2018, a time series of sea ice breakup and freeze-up dates and ice-free season length at twenty-four grid points were generated from sea ice charts derived from satellite and other data. These data were analyzed temporally and spatially. The temporal analyses indicated an unambiguous response to a warming climate with statistically significant earlier breakup dates, later freeze-up dates, and longer ice-free seasons, that were statistically linked to coincident regional surface air temperatures. The rate of change in freeze-up dates and ice-free season length was particularly strong in the early 2000s and less so in the 2010s. There was evidence that breakup date behaviour was not only coincident with regional temperatures but likely with temperature and ice conditions of the previous year. Later freeze-up dates were directly linked to earlier breakup dates using detrended time series. Spatial clustering analysis on the Hudson Strait gridded sea ice data revealed distinctive signatures for Ungava Bay, Frobisher Bay, and for grid points close to the shore and a clear linkage to the underlying circulation of Hudson Strait.
1. Introduction
The Arctic region, resulting from anthropogenically induced climate change, is experiencing an increase in air temperature at nearly four times the rate as compared with the rest of the world since about the 1950s, coincident with reductions in sea ice distribution documented in [1] since 1979. Hudson Strait, embedded in the Arctic region, is part of the Hudson Bay System, which includes Hudson Bay, Foxe Basin, and Hudson Strait. Hudson Strait is the gateway for this system from the Atlantic Ocean and is critically important for shipping navigation [2,3,4,5], and it is central to the hunting and well-being of local communities [6]. Hudson Strait’s sea ice is seasonal in nature. The sea ice formation is a combination of ice advecting into the strait from Foxe Basin in mid to late November coupled with the local production of sea ice as a result of declining autumn and winter air temperatures typically following a west-to-east pattern into December. The breakup of the sea ice in June and July follows a less coherent pattern and is complicated by the exiting of sea ice formed in Hudson Bay and Foxe Basin [7,8,9,10,11] as well as ocean dynamics and prevailing atmospheric winds.
Sea ice formation and breakup was examined at three locations (“west”, “central”, “east”) in Hudson Strait for the period of 1971–1999 but no significant trends were found in the breakup and freeze-up dates, nor the ice-covered season [9]. There was large interannual variability of these measures, and [9] suggested that since 1990, a trend for early breakups, later freeze-ups, and shorter ice-covered seasons may be emerging, although they were careful to note that this change could be part of a low-frequency oscillation [9]. Sea ice conditions were examined near Iqaluit, NU (63.74° N, 68.52° W) in Frobisher Bay, an inlet discharging into Hudson Strait [7]. The study period was from 1982 to 2010 and was complemented by an analysis of the concurrent climate record of the Iqaluit airport [7]. Their results differed from those of [9], as they found that the freeze-up of sea ice in the fall was later in a statistically significant fashion at a rate of 1.7 days per year during the study period. In addition, the breakup, also statistically significant, was 0.7 days earlier per year, leading to a combined increase in ice-free season of 2.4 days per year, or 70 days longer at the end of the study period compared to the beginning, an astonishing change of over two months with substantial impacts on the community [7,8,9,10,11]. The year, 2010, at the end of the study period, was anomalously warm and has been used as a proxy for future climate change [12]. Another study [10] used ice charts for the Hudson Bay System from 1971 to 2009 and found breakup dates 0.56 days earlier per year in Hudson Strait, roughly consistent with [7]. More recently, ref. [10] used gridded satellite passive microwave sensor sea ice data for the period 1980 to 2014 and found an earlier breakup rate of change of 1.05 days per year, a later freeze-up rate of change by 0.75 days per year, and an increased ice-free season by 1.76 days per year. A clear response to the radiative impact of a warming climate on sea ice conditions was documented [4]. However, nuance is provided by ocean circulation in the strait, largely driven by incoming Atlantic basin waters at depth flowing cyclonically adjacent to the northern coast of the strait and exiting surface flow from Hudson Bay and Foxe Basin through the strait to the Atlantic Ocean, along the southern coast. In addition, as first noted by [13] and further explored in [3,4], there appears to be year-to-year thermal inertia that influences the sea ice annual cycle, particularly breakup timing. In this work, we focused on sea ice extent rather than ice thickness due to a paucity of sea ice thickness data.
Research Objectives
This work builds on the preliminary sea ice analysis presented in [9] for Hudson Strait and for Frobisher Bay [7,12] using methods developed in [4]. The following research questions are addressed:
- How statistically significant are the temporal changes in the breakup, freeze-up, and ice-free seasons for the 24 grid points representing Hudson Strait for three time periods, 1971–2018, 1971–1994, 1995–2018, and the relationship to concurrent temperature change?
- Using a spatial cluster analysis, how coherent is the nature of breakup, freeze-up, and ice-free season spatially, using the three time periods?
2. Materials and Methods
2.1. Surface Air Temperature Data
Surface air temperature data (annual mean temperature, Tmean) were obtained from the Environment and Climate Change Canada archive (https://climate.weather.gc.ca/historical_data/search_historic_data_e.html (accessed on 15 July 2023)). Mean surface air temperatures were used to assess the temporal evolution of temperature in the Hudson Strait region at Cape Dorset (Kinngait), NU (64.23° N, 76.54° W), Iqaluit, NU (63.74° N, 68.52° W), and Kuujjuaq, QC (58.10° N, 68.42° W) (Figure 1). The climate records were uneven in data completeness. Data were available for Cape Dorset (Kinngait) for 1971, 1980–1993, 1995–1998, and 2000–2006. For Iqaluit, the following years were available 1971–1995, 2000–2006, and 2008–2018. For Kuujjuaq, the available years were 1971–2002, 2005, 2008–2013, and 2015–2018.
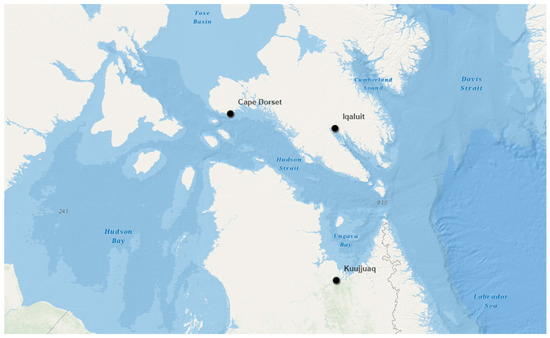
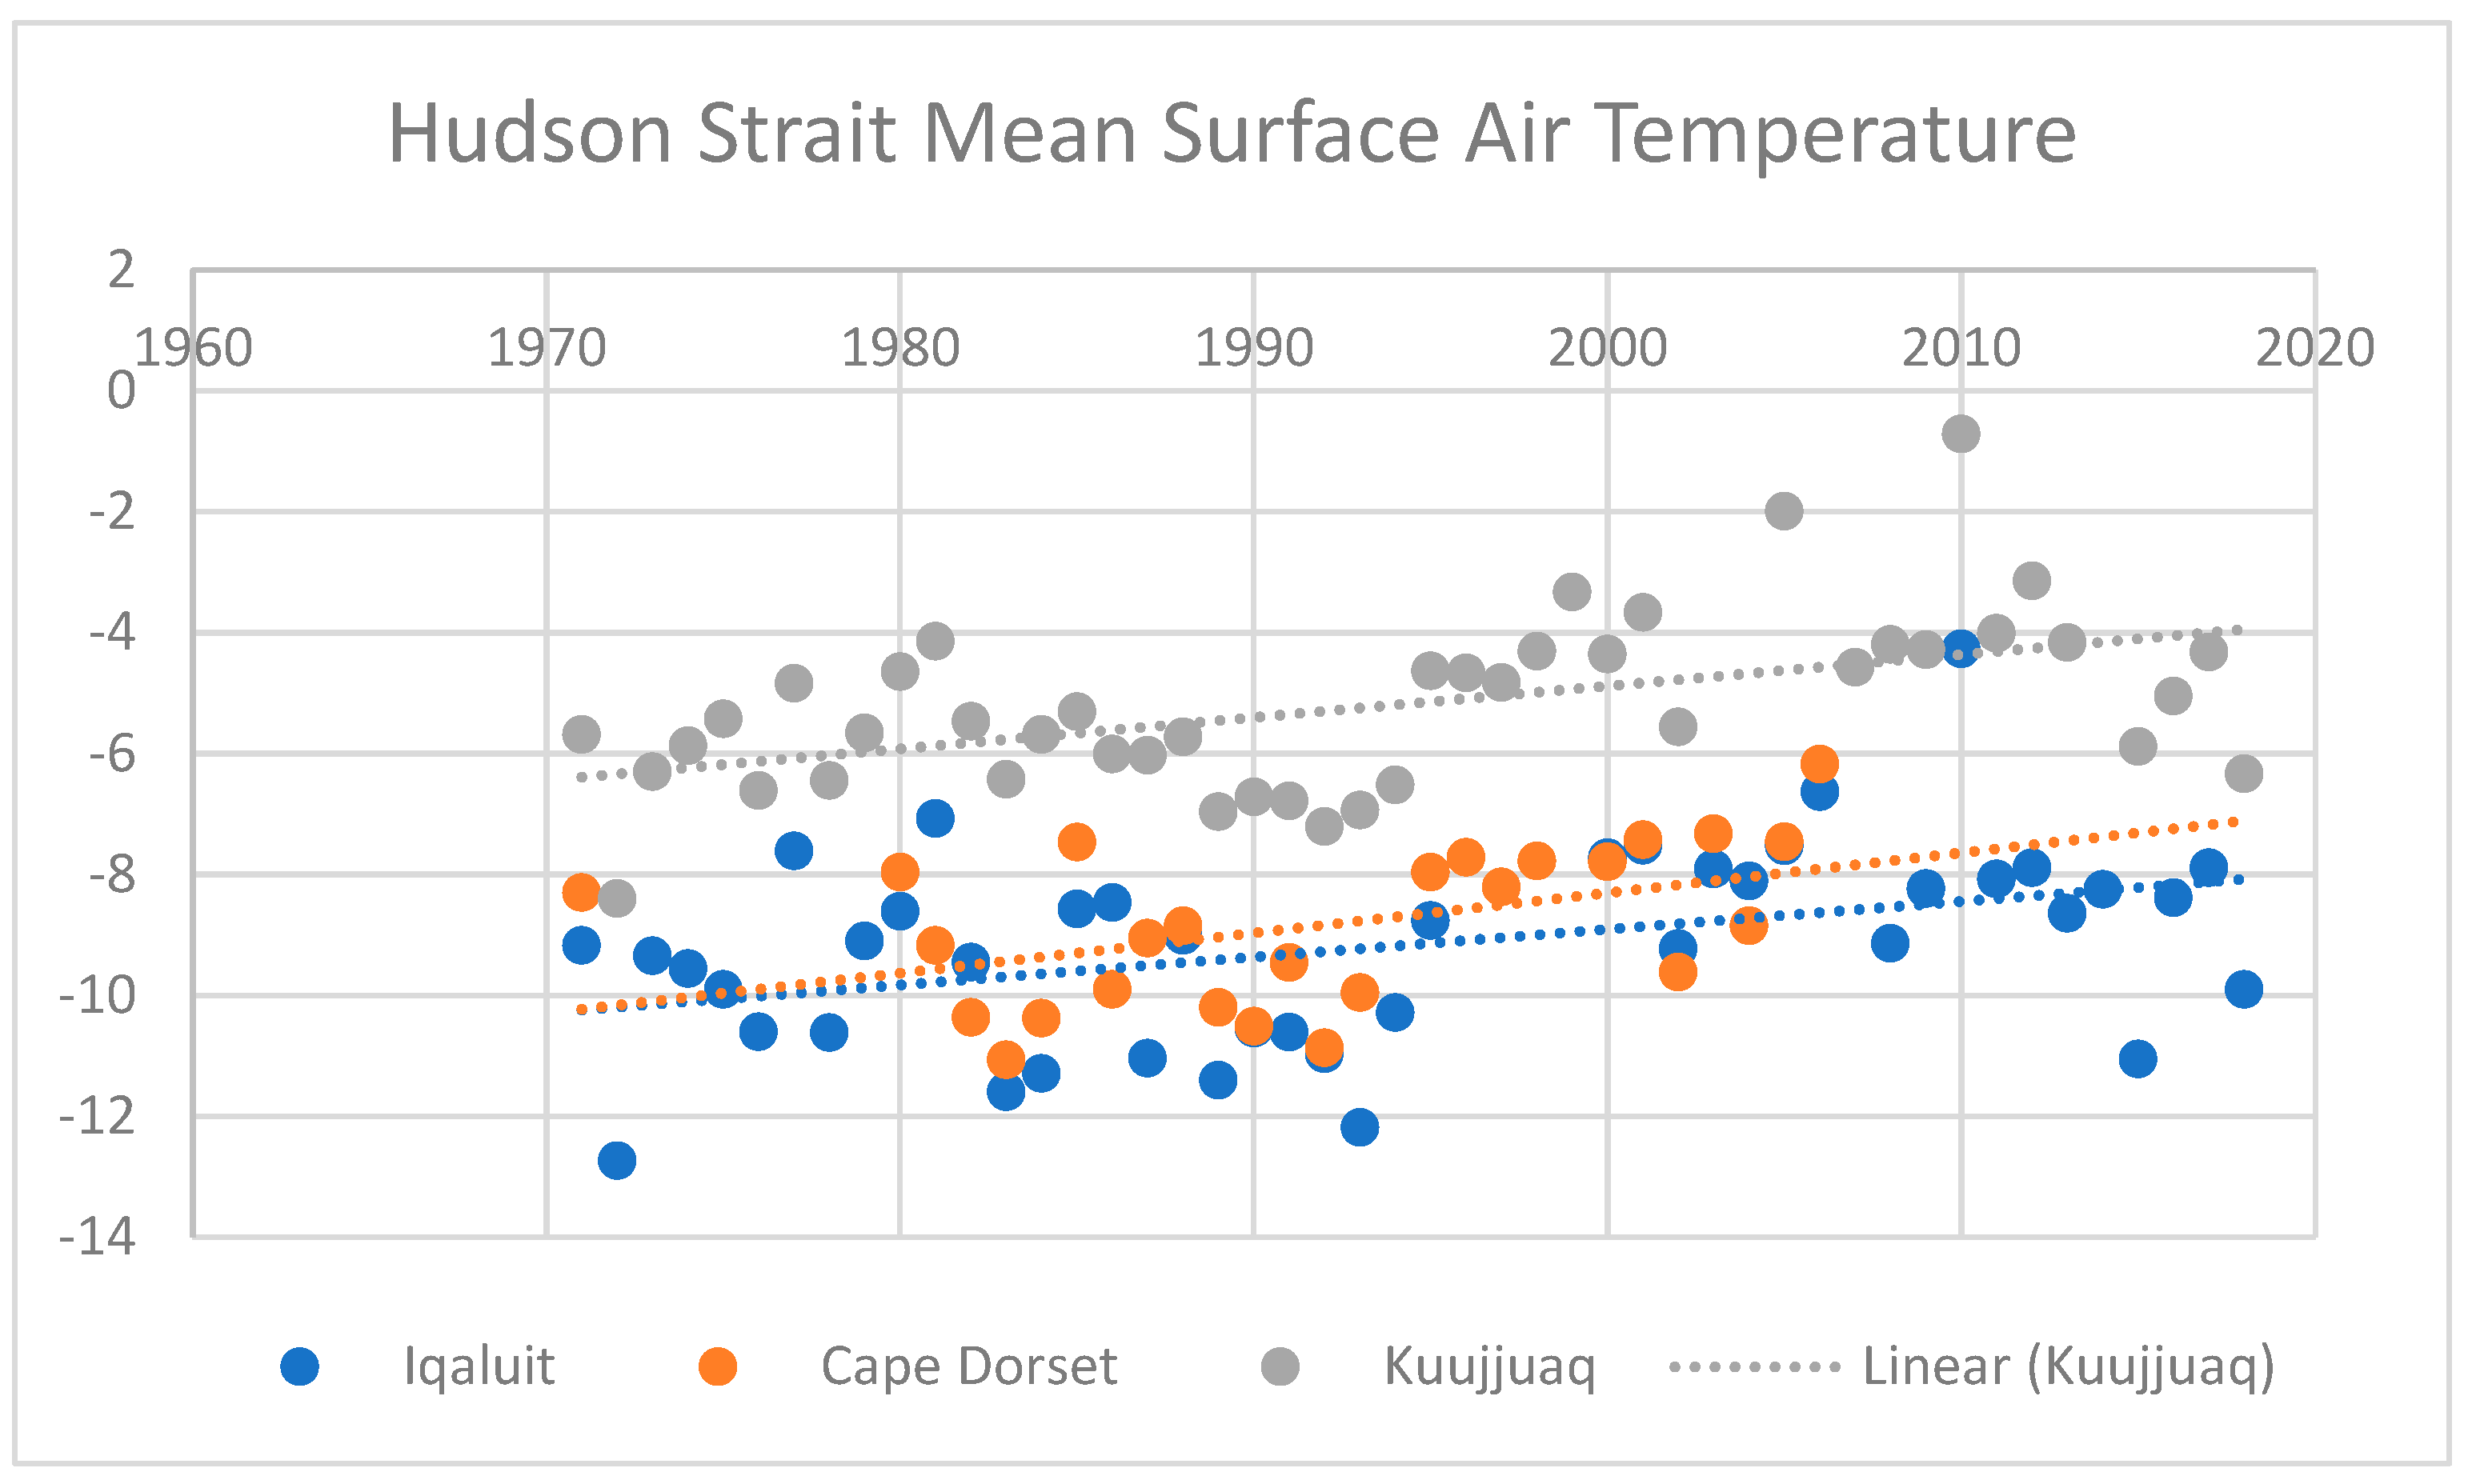
Figure 1.
Hudson Strait including surrounding water bodies, Hudson Bay, Foxe Basin, and three communities with temperature data used in the study: Cape Dorset (Kinngait), NU, Iqaluit, NU, and Kuujjuaq, QC. The scale is 1:800,000. The figure is oriented with north at the top.
2.2. Sea Ice Data
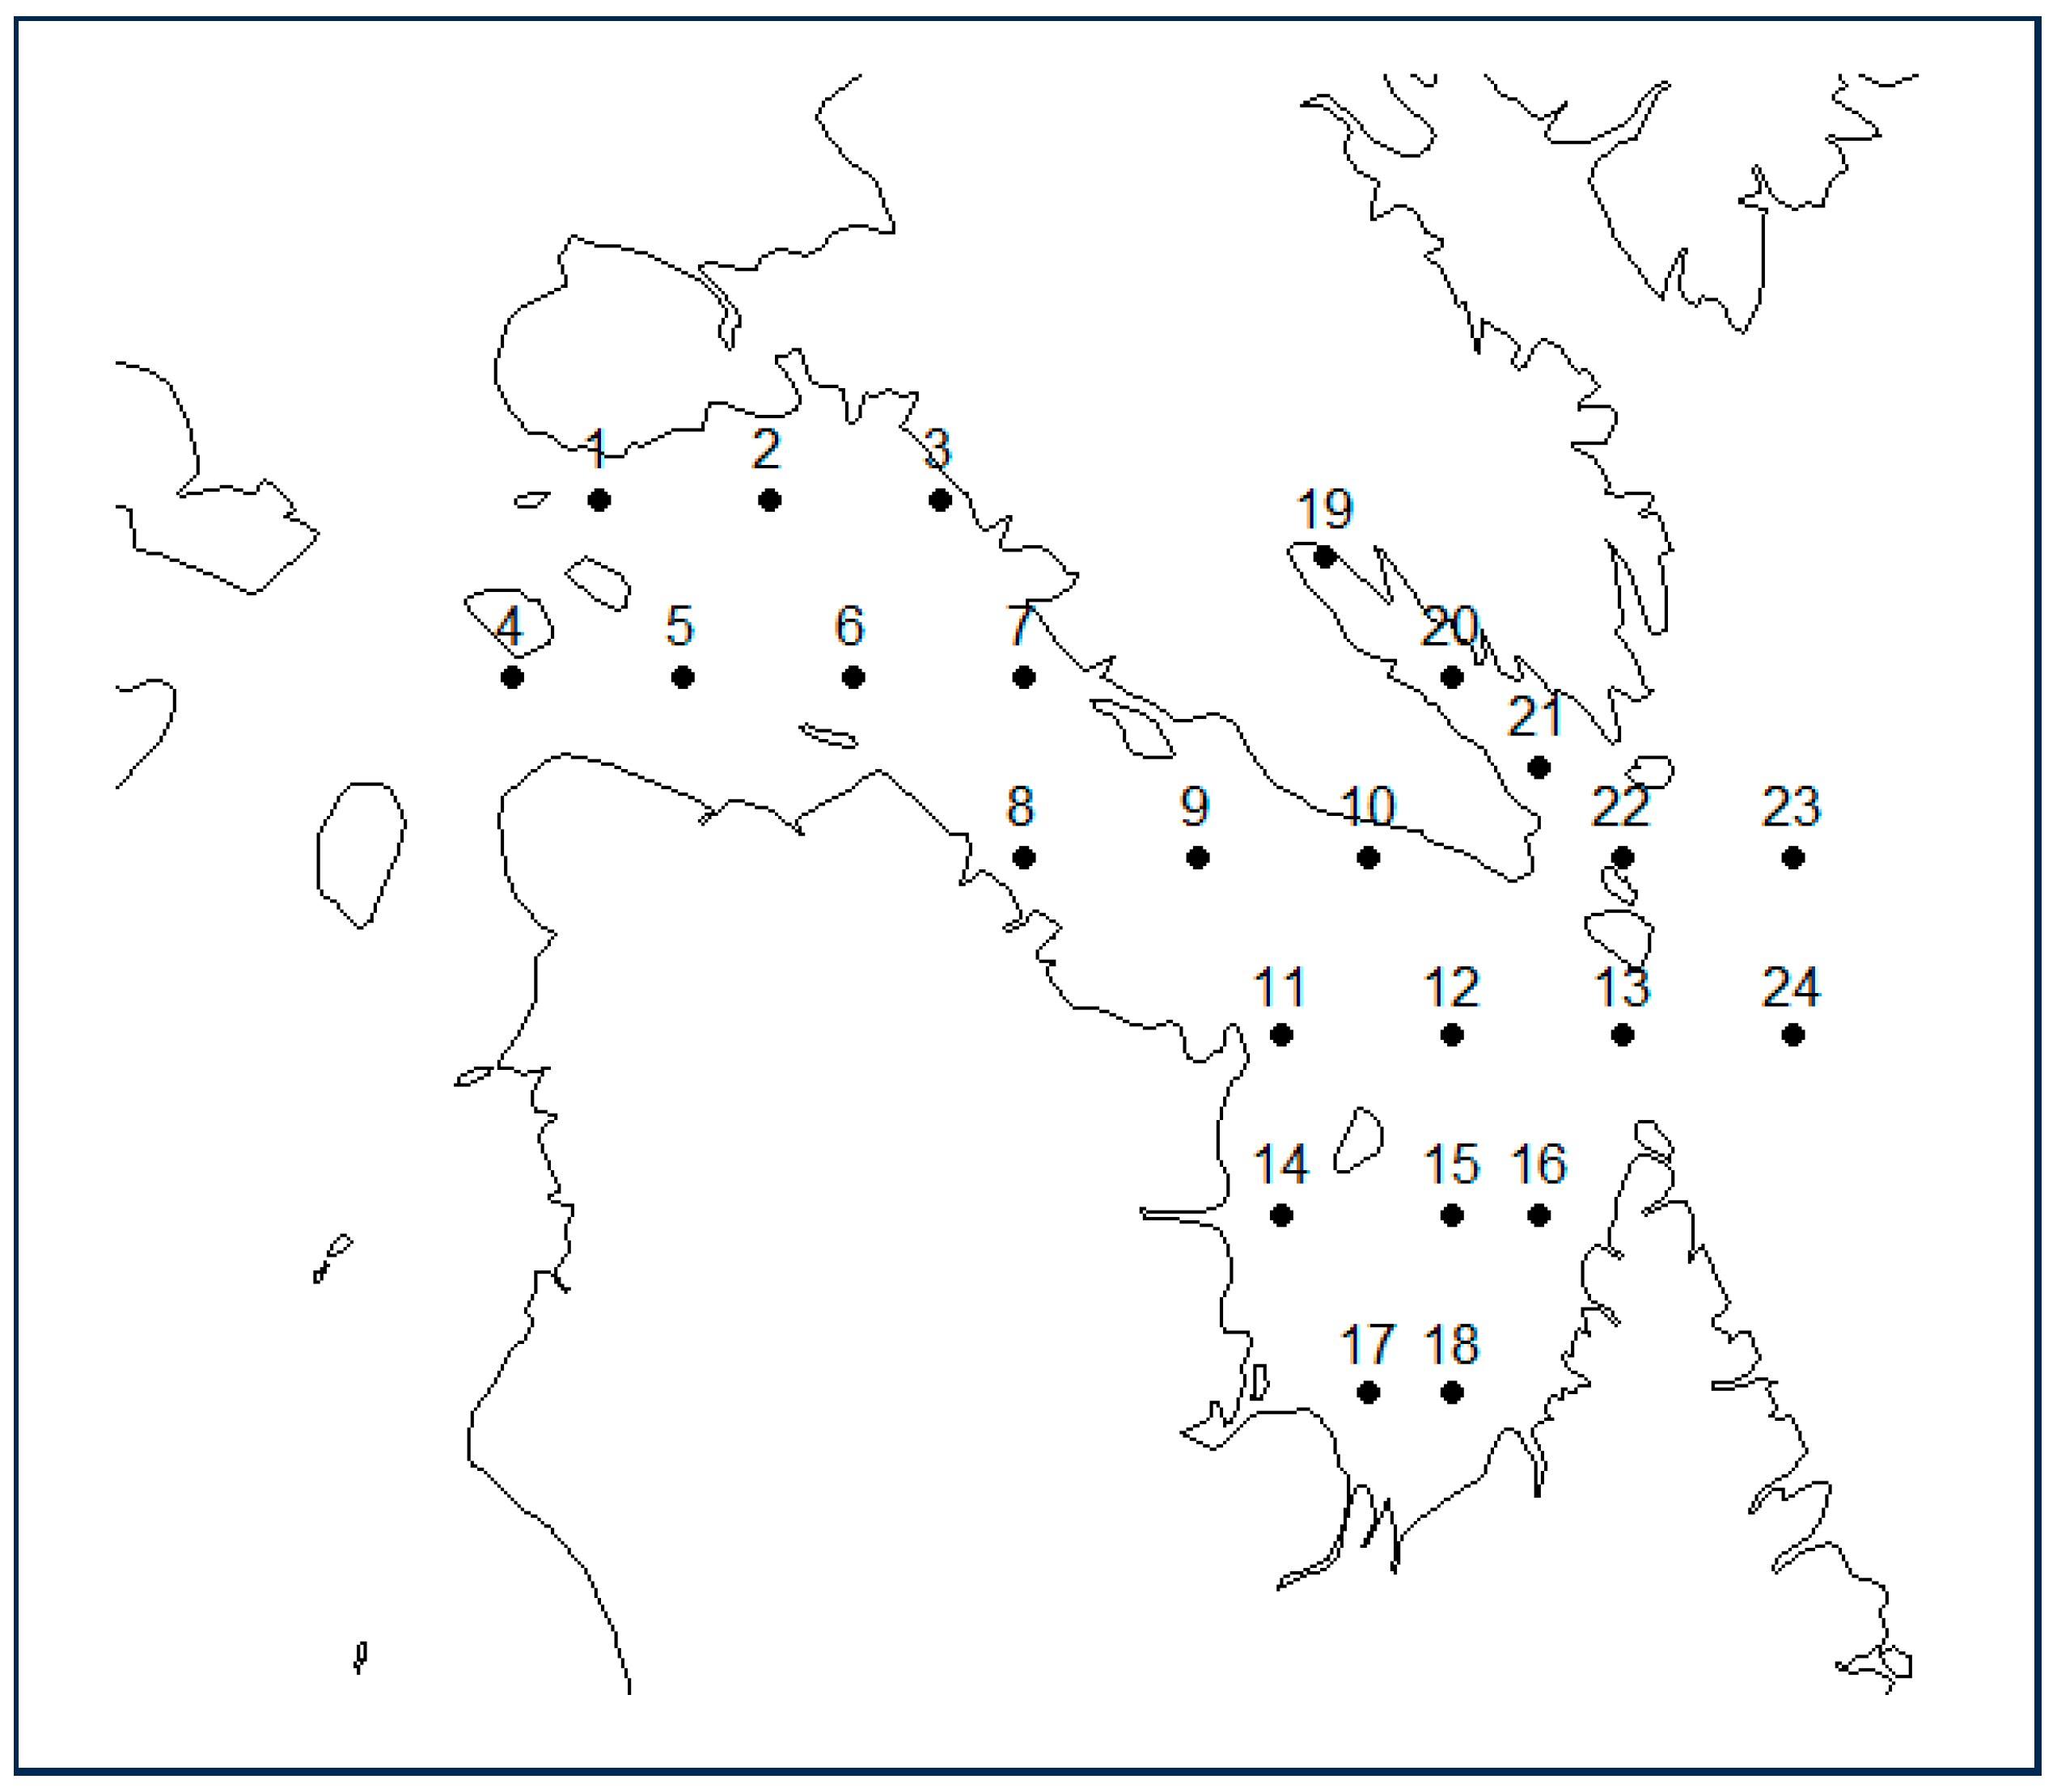
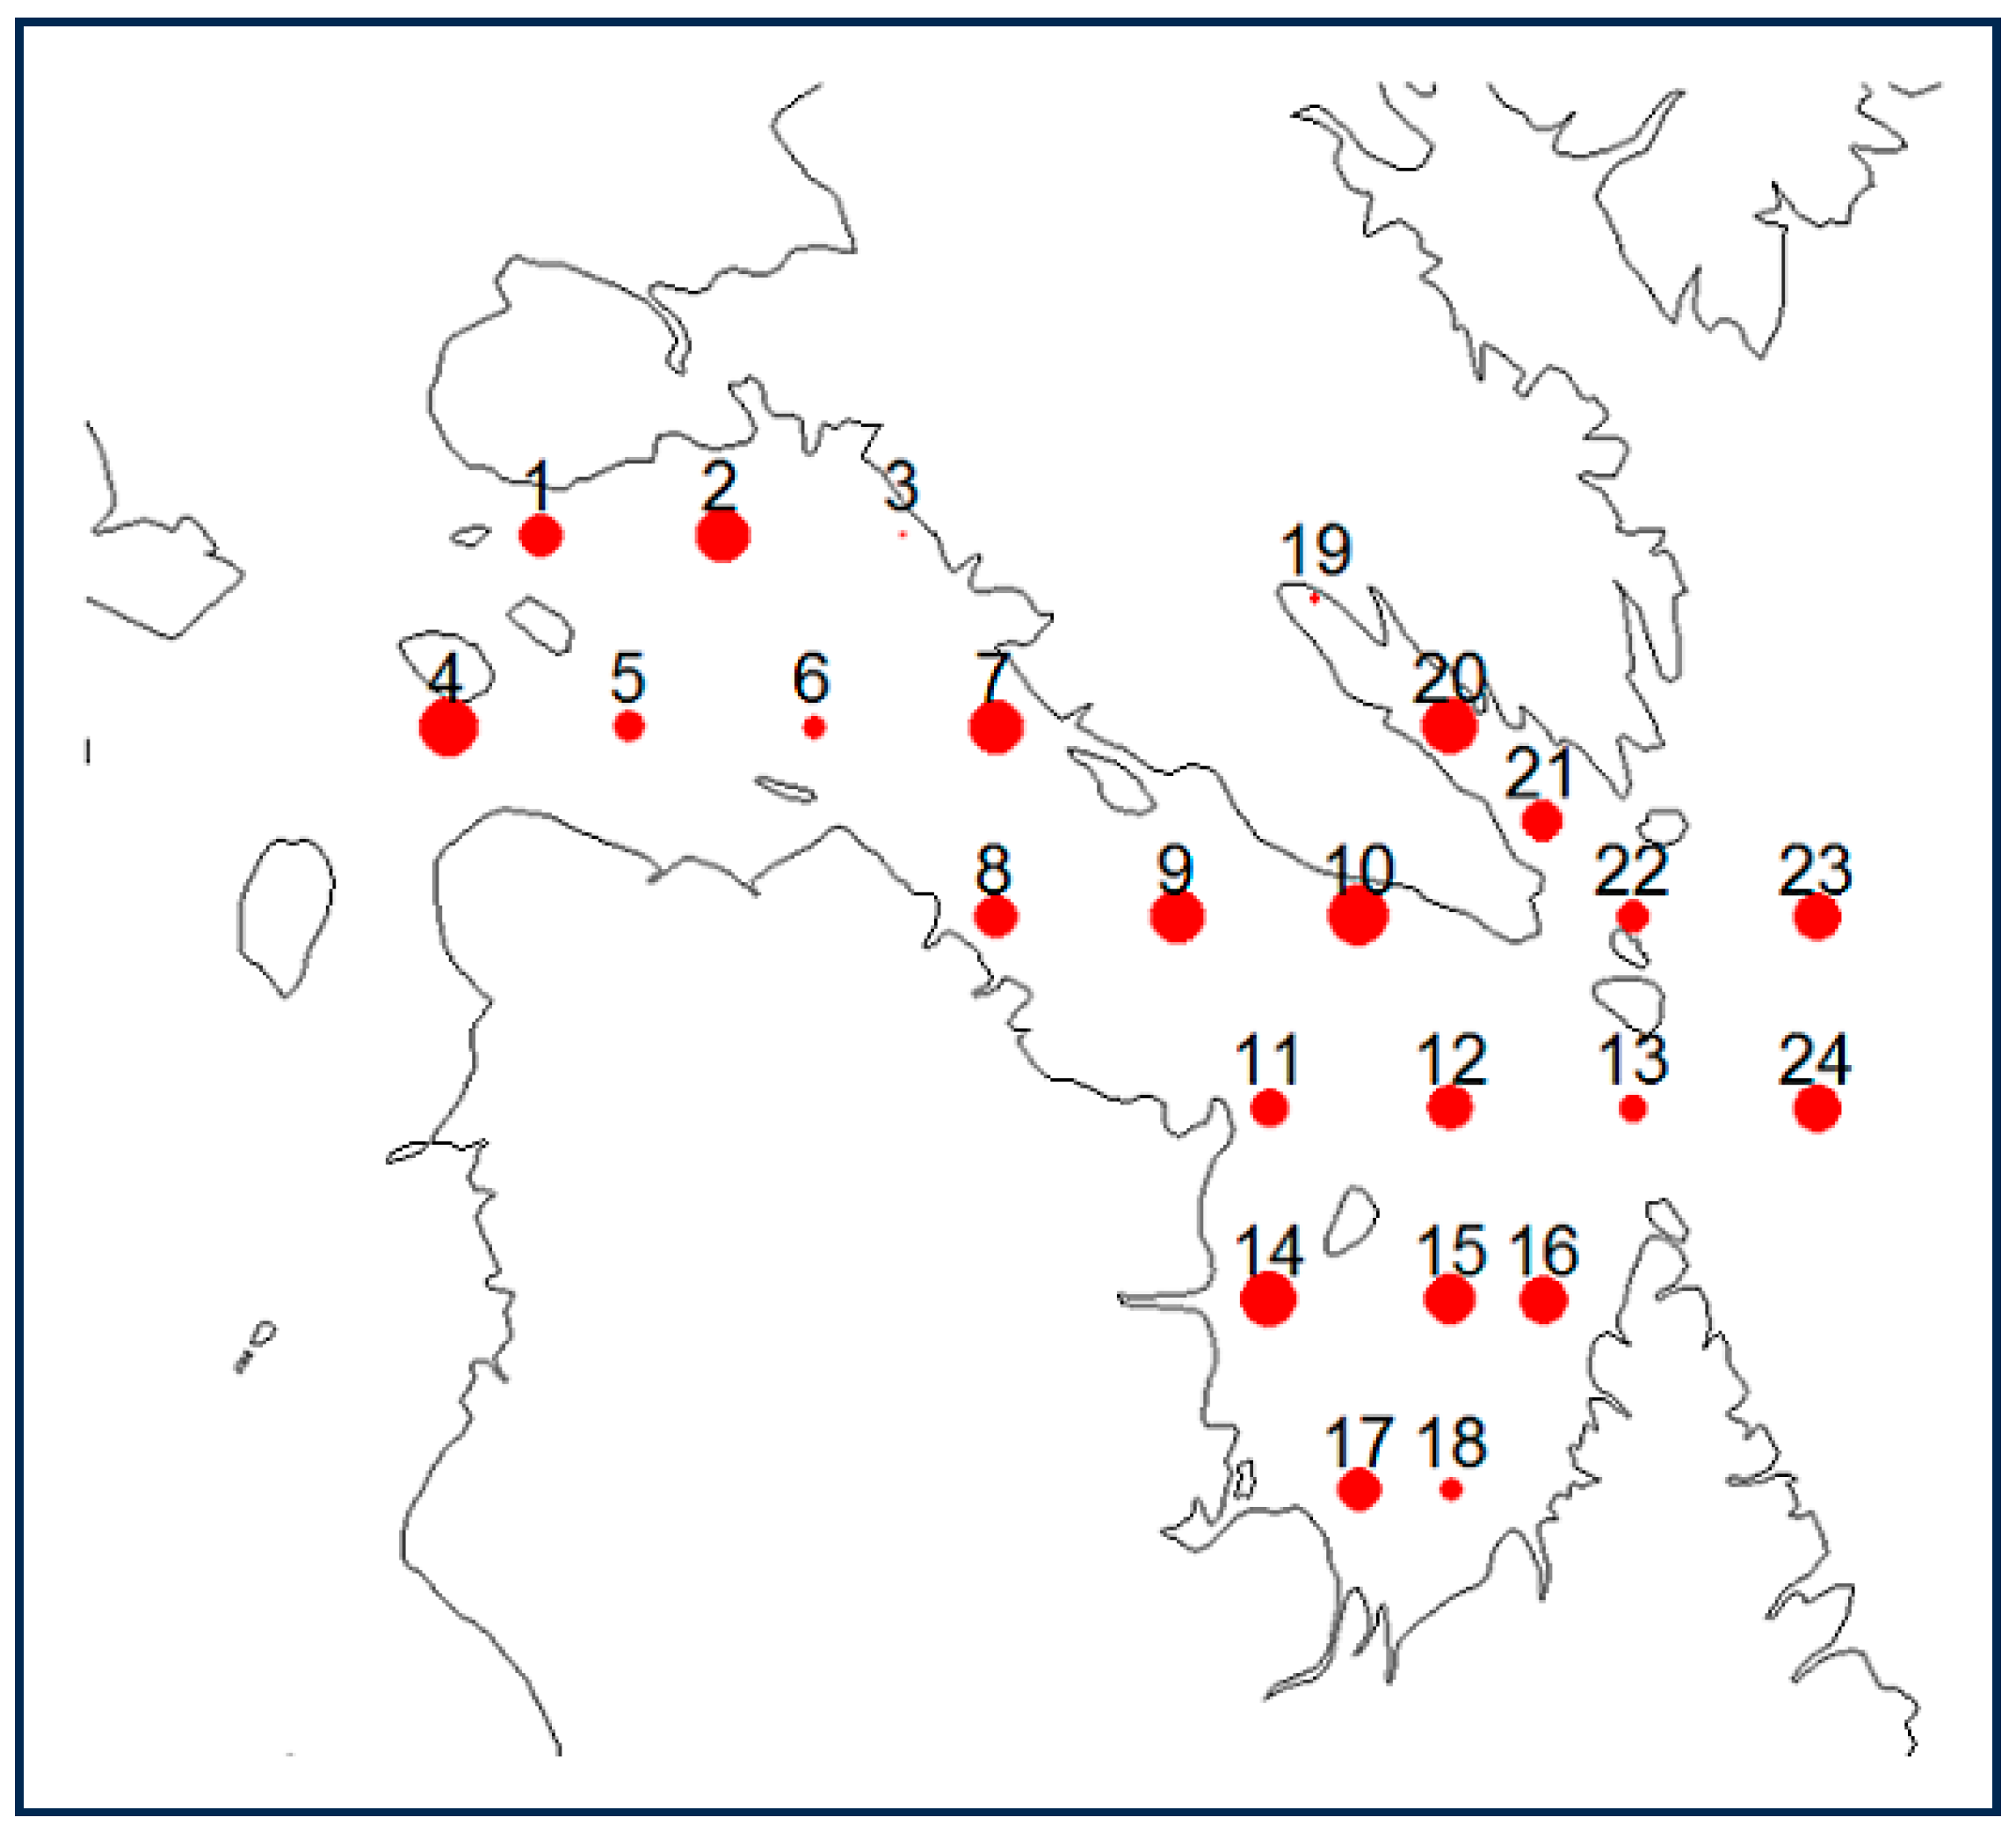
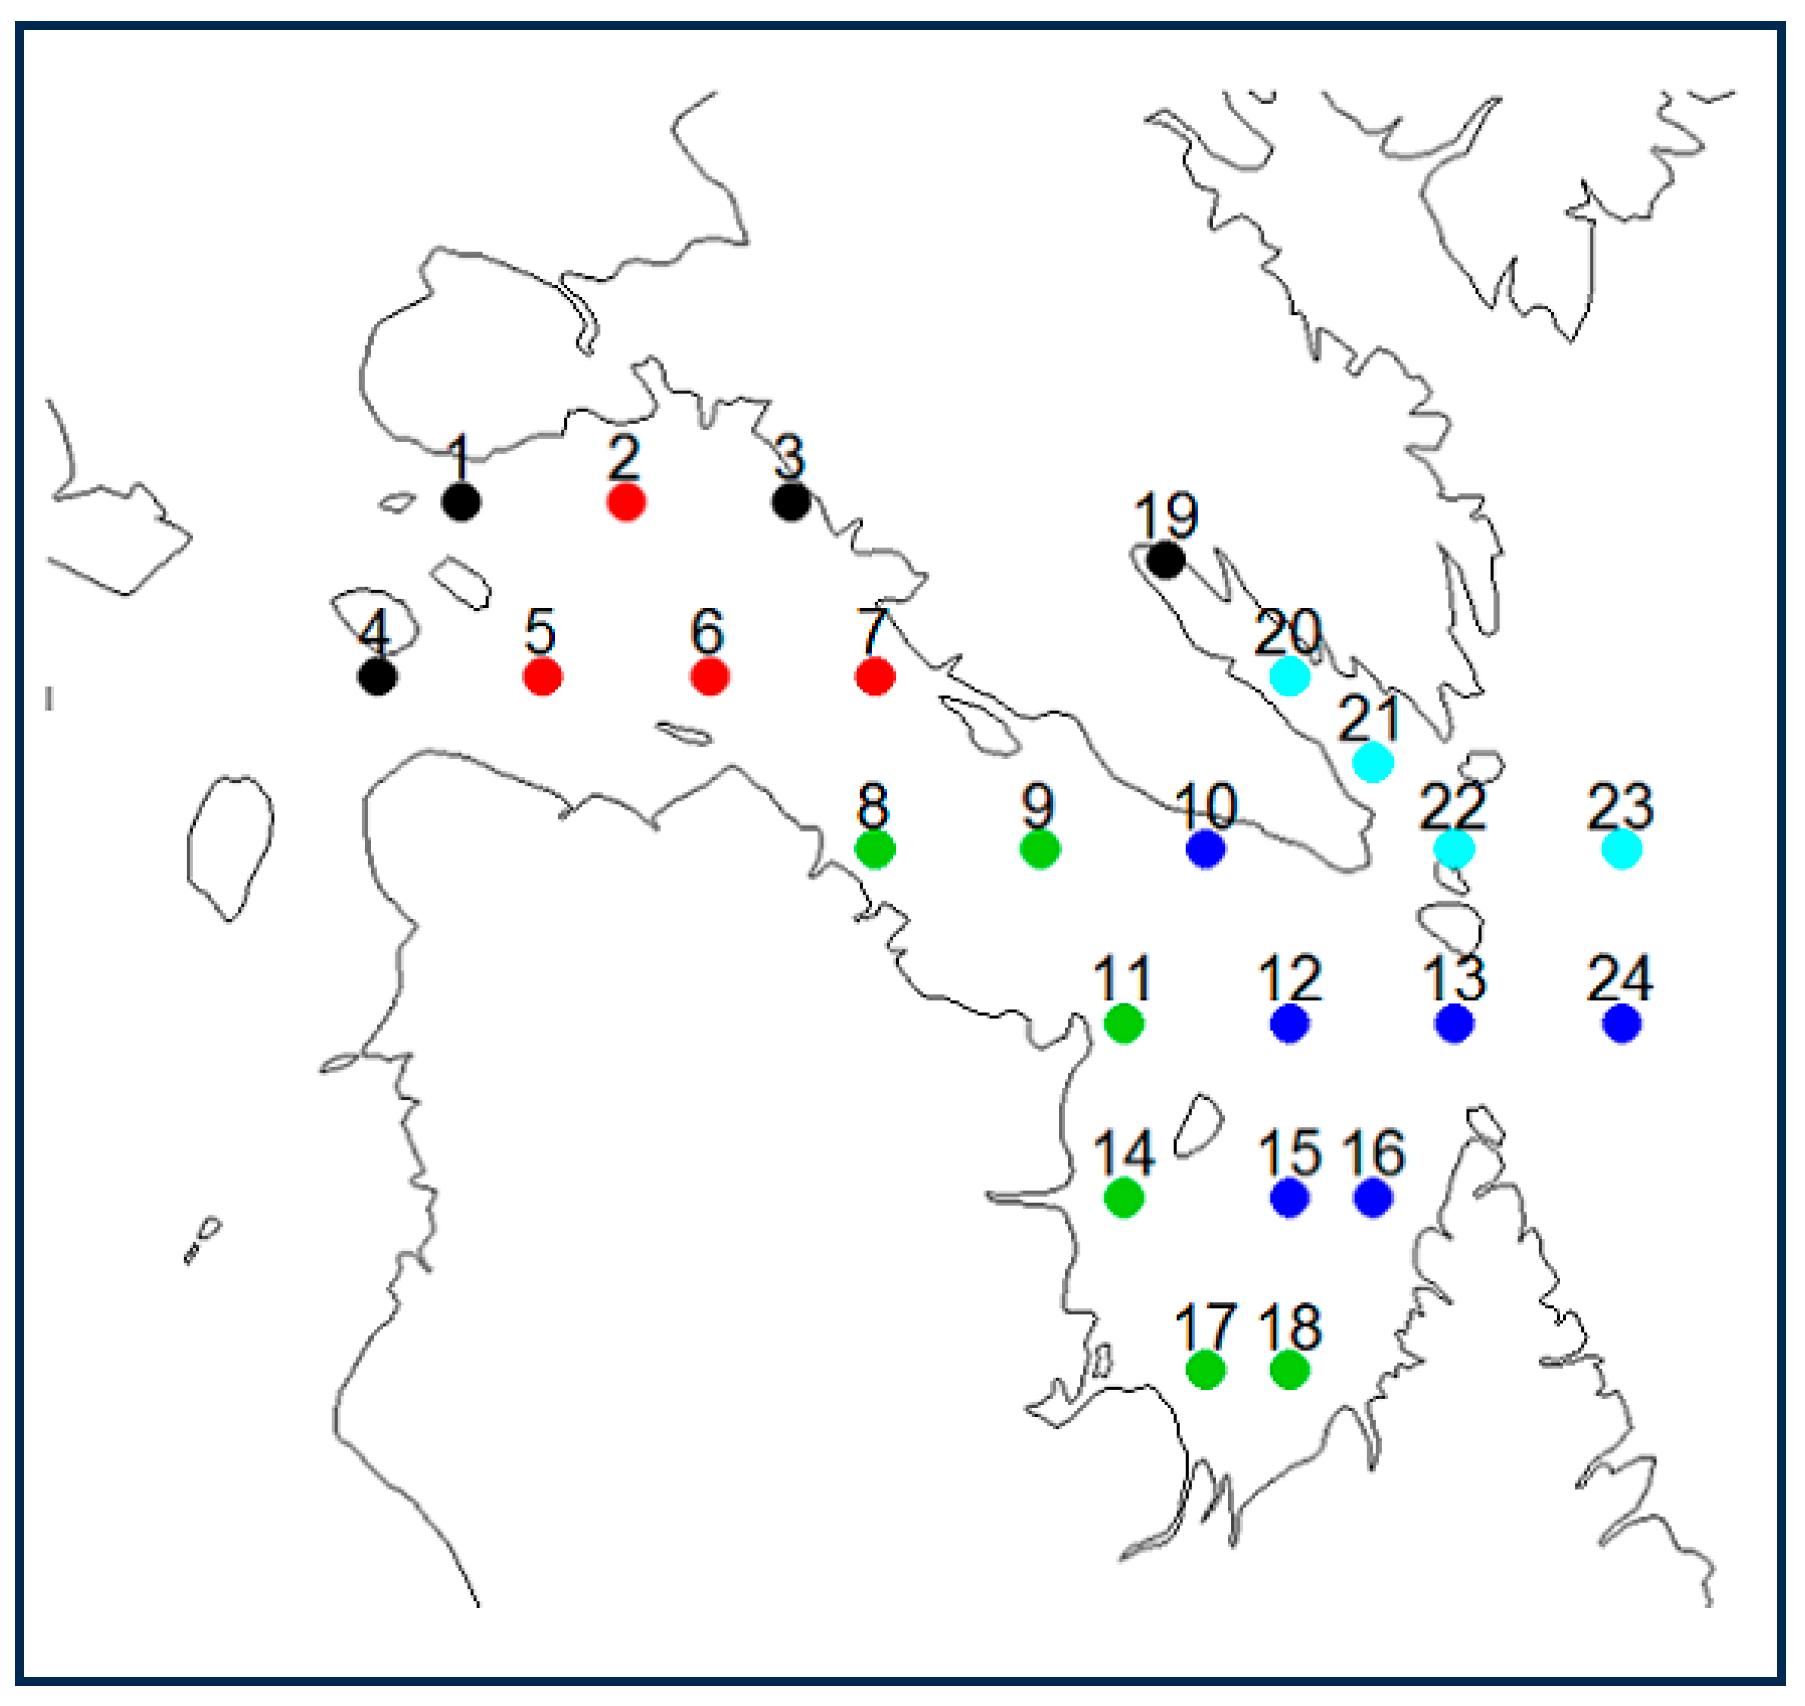
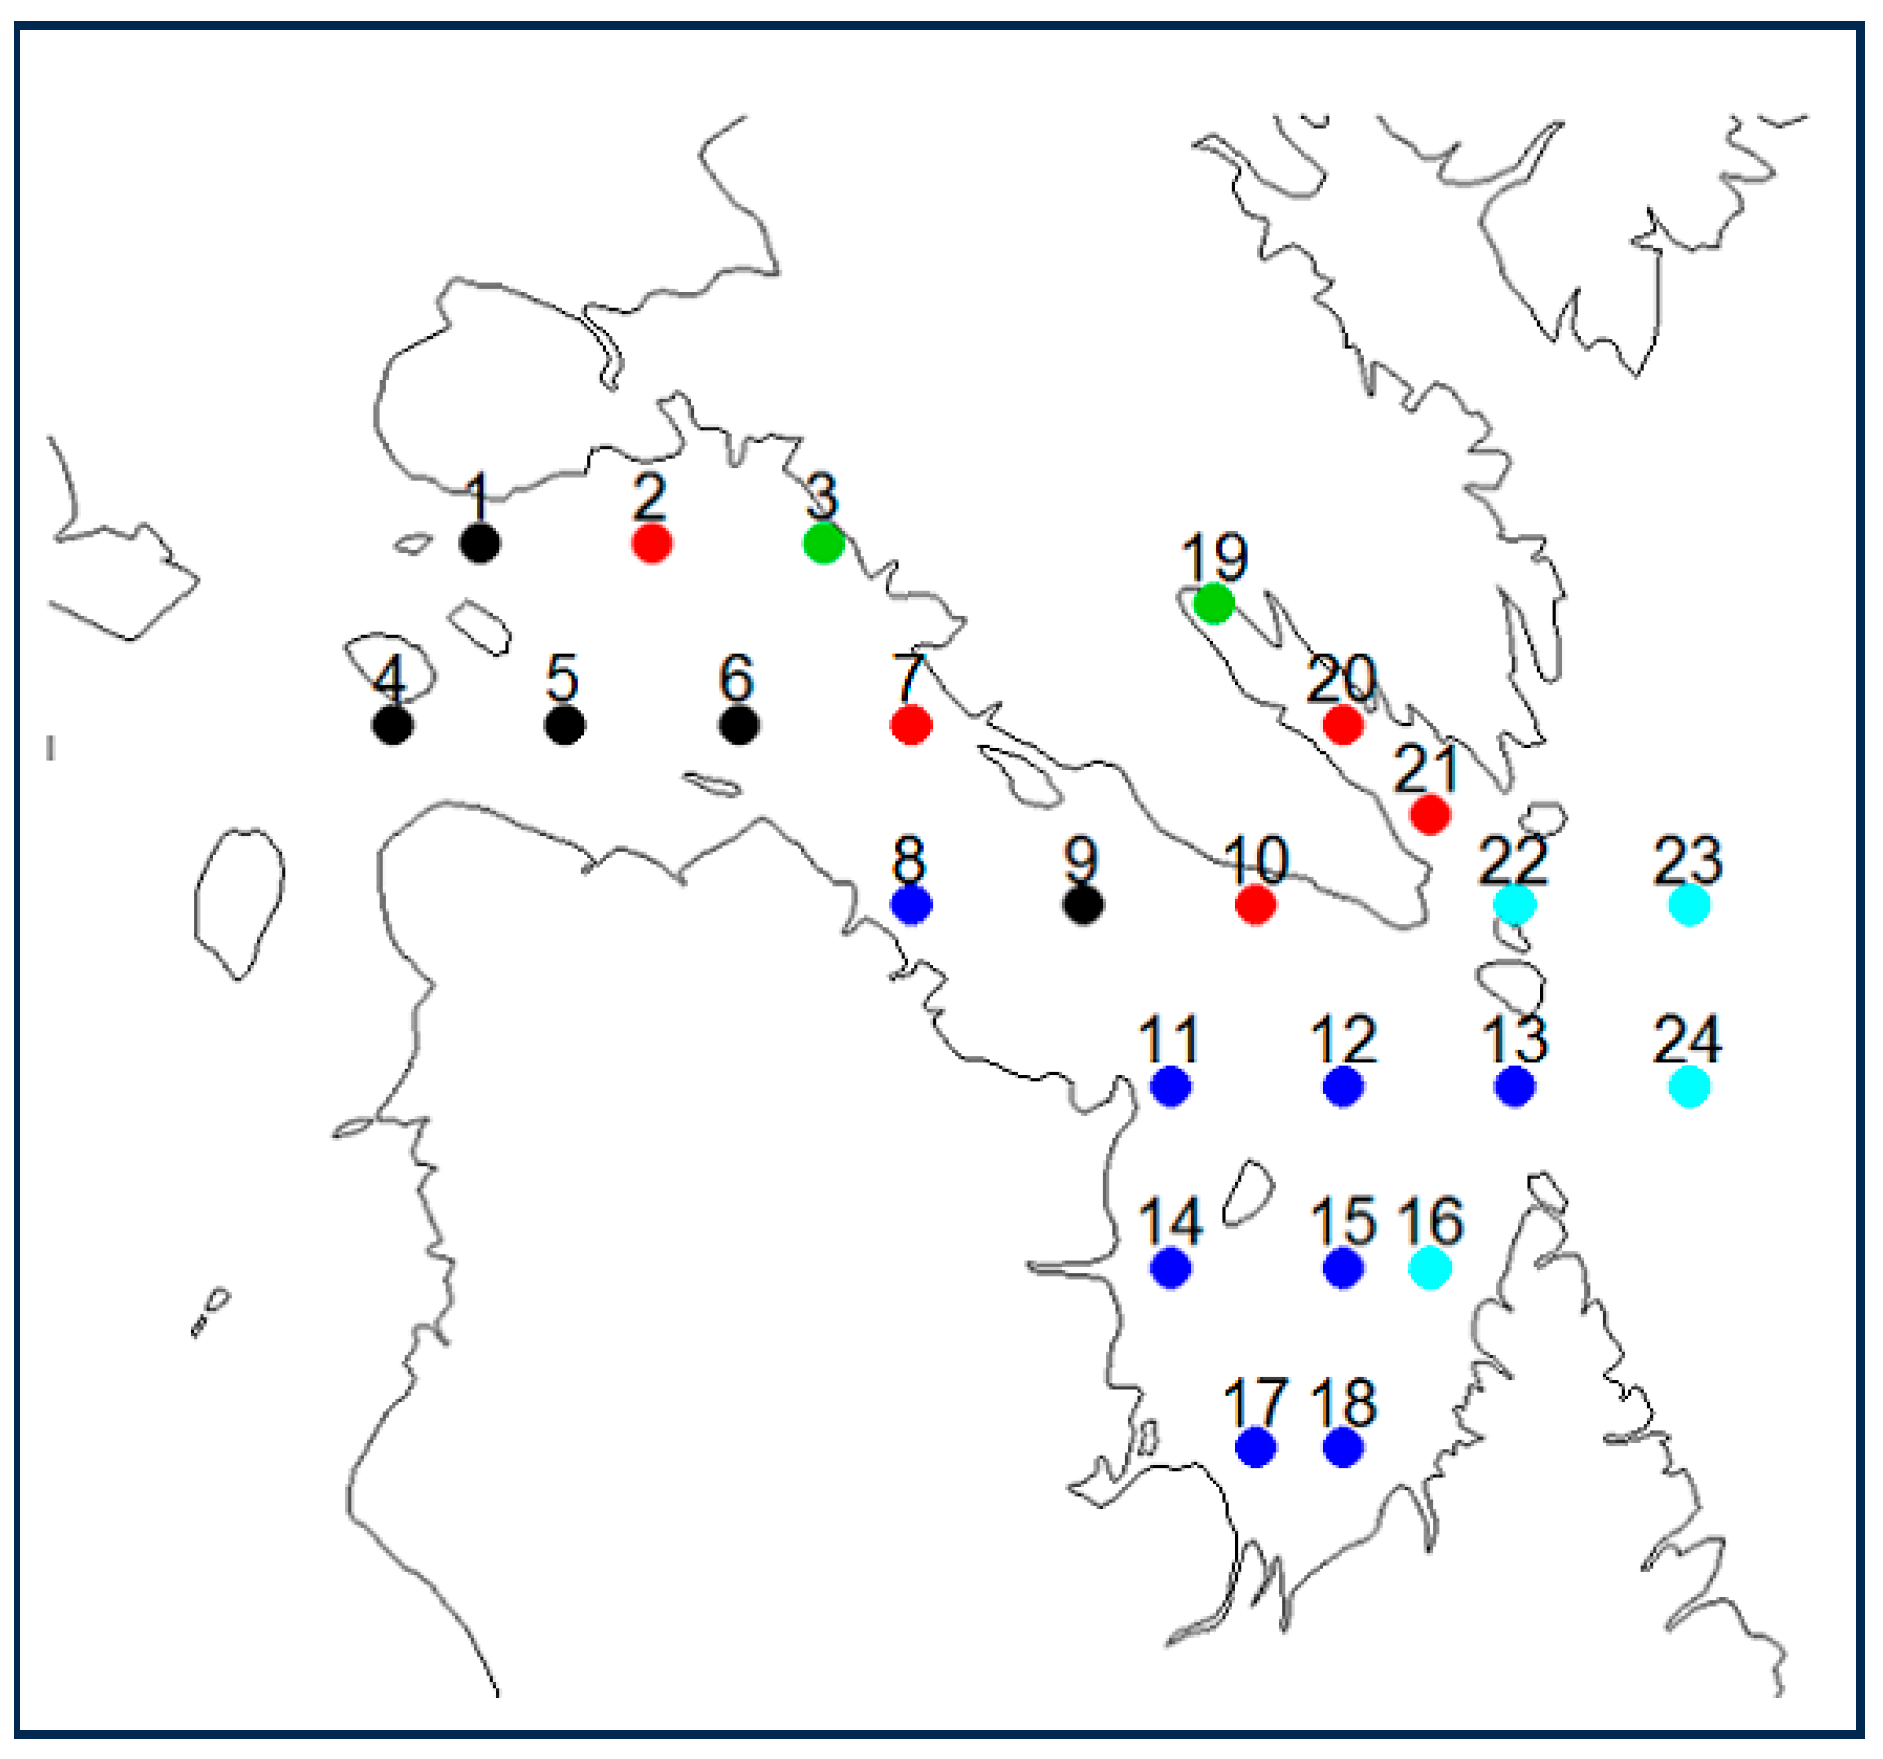
A grid of 24 discrete points was developed to represent Hudson Strait (Figure 2). In order to determine the breakup and freeze-up dates from 1971 to 2018 for each of the sampling locations for Hudson Strait, as described below, the same methodology utilized by others [9,14,15,16,17,18,19] was employed. Ice-free season length was derived from the difference of the other two metrics. The grid distancing was approximately 90 km. The locations were adjusted to adapt to the Hudson Strait coastline. We note, unlike satellite data, the points were discrete and not representing a grid box, as is the case with satellite data (pixels). Thus, the grid locations near coasts were not an amalgam of land and ice but unambiguous ice concentrations.
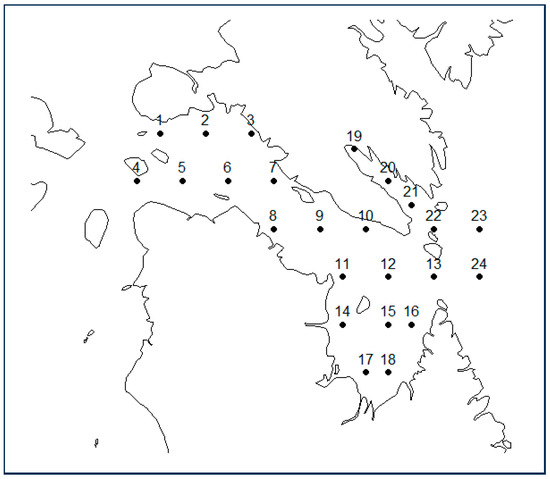
Figure 2.
Hudson Strait’s 24 sea ice grid points. The scale is 1:900,000.
The Canadian Ice Service (CIS) has issued sea ice concentration data for the Arctic region since 1971 on a weekly basis, except during the winter months of January to May when they are issued bi-weekly. The sea ice concentration data are expressed in tenths (from 0 to 10/10), which refers to the surface area that is covered by ice. The CIS images, which contain the sea ice concentration data, are developed by utilizing all of the available information such as satellite imagery, ship and aircraft reconnaissance observations, shore observations, and climate data. This information is available online at https://iceweb1.cis.ec.gc.ca/Archive/page1.xhtml?lang=en (accessed on 12 May 2024). The sea ice concentrations for those images were obtained for every sampling point that was superimposed over the study area (Figure 2) and the dates of the ice breakup, ice freeze-up, and the derived ice-free season length were catalogued for each year (from 1971 to 2018) with an accuracy of +/−1 week [9,14,15,16,17,18,19]. The ice breakup date was defined as the first date when the ice concentration was 5/10 or less during the spring and summer months, while the ice freeze-up date was determined to be the earliest date when the ice concentration reached 5/10 or more between October and December. These specific thresholds used to determine the breakup and freeze-up dates were in accordance with that used by both the Canadian Sea Ice Service and the World Meteorological Organization (WMO). The breakup and freeze-up dates were expressed numerically as the ordinal day of the year, where 1 January was the 1st day and 31 December was the 365th day, unless there was a leap year in which case 31 December would be the 366th day of the year [15,16].
2.3. Time Series Analysis
The Kendall correlation is a nonparametric measure of correlation that assesses monotonicity of trends without assuming a normal distribution of data. Specifically, the correlation using time is called a Mann–Kendall correlation and it can be used to test (statistically) whether a trend is unchanging against an alternative hypothesis that the trend is increasing or decreasing [15,16,20]. Thus, the Mann–Kendall test is a frequently used nonparametric test to investigate the statistical significance of a time trend [20]. It sums the signs of all the slopes of all possible pairs in the data set over n, the number of data points. The test is based on the assumption of independence among the observations. However, observations in time series can be autocorrelated, and this can influence the detection of a significant trend. Thus, it is crucial to check the autocorrelation in a given series and to adjust the test if necessary [14,15,16]. In order to account for the possibility of autocorrelation within each of the three data sets (for the three metrics), an adjustment was performed using the adjustment method of [21] employing the fume package in R. The fume package’s mkTrend function carries out the adjusted and unadjusted Mann–Kendall tests and only the adjusted values are presented in this work. The Mann–Kendall correlations (tests for trend significance) were performed for each of the three metrics for each of the three separate time periods, 1971 to 2018, 1971 to 1994, and 1995 to 2018). A p-value threshold of less than 0.05 was considered significant, as used previously [14,15,16].
The Theil–Sen method is a nonparametric slope estimator of the rate of change in the variables considered (three metrics) in terms of days per year that is not affected by outliers [15,16,22]. The slope represents the rate of change in the variables considered (breakup date, freeze-up date, and ice-free season) in days per year [14,15,16]. The Theil–Sen method was used for the three metrics for each of the three time periods, namely, the full time period, 1971–2018, and the two distinct time periods, 1971–1994 and 1995–2018, by utilizing the statistical program R. The Theil–Sen slope is given by:
β = median
((Yj − Yi)/(tj − ti)), for all i > j
Using both temperature and sea ice time series, a correlation analysis was performed using linear regression to assess the relationship between local air temperature and the local sea ice cycle [14].
2.4. Spatial Analysis
Cluster analysis [23] is used to divide observations into groups or clusters, based on the values of several observed variables. The Ward’s method used in this study begins with each point as a separate cluster. The process followed is described below:
- Each point begins in a cluster by itself.
- Merge two clusters in order to produce the smallest increase in the sum of squares (merging cost). The merging cost is the increase in sum of squares when two clusters are merged.
- Keep merging until k clusters are reached.
The Ward’s method was run for each of the three metrics for the Hudson Strait grid points for each of the time periods, 1971–2018, 1971–1994, and 1995–2018 by utilizing the statistical program R. Five clusters were chosen for the Hudson Strait data set, based on familiarity with the behaviour of sea ice in the strait. There is, however, some degree of arbitrariness in choosing a specific number of clusters. We address this issue in more detail in Section 3.3.
3. Results
3.1. Temperature Analysis
Three climate data time series for mean temperature were used to assess the time evolution of temperature in the Hudson Strait region, Kinngait (Cape Dorset), NU, Iqaluit, NU and Kuujjuaq, QC (Figure 1). These three stations provide a good spatial representation of the Hudson Strait region. These are the only climate stations with a substantive, coincident record in the Hudson Strait region.
These results of the plotted time series are displayed in Figure 3. All three time series showed a statistically significant (Mann–Kendall p < 0.05 for all three time series) increase in temperature during the study period of 1971–2018, consistent with an Iqaluit analysis reported in [7,12] for the period 1982 to 2010. They reported a 1.3 °C increase per decade. The longer time period (48 years) yielded a lower annual rate of 0.46 °C at Iqaluit and 0.52 °C per decade at Kuujjuaq. The year 2010, as can be easily seen in the Figure 3, was anomalous in both Iqaluit and Kuujjuaq (data not available for Kinngait). This 2010 anomaly disproportionately affected the trend estimate as it was the last year in the [7,12] analysis. The anomaly of 2010 was the focus of [12] and served as proxy for future change. The temperatures at Kuujjuaq were considerably higher than those at Iqaluit and Kinngait, which came as no surprise as Kuujjuaq is at the southern extent of the study region (Figure 1). These results are consistent with the broader spatial atmospheric warming in the Arctic of 4.5 °C for the period from 1982 to 2021 [1].

Figure 3.
Hudson Strait’s mean surface air temperature record (°C) at Cape Dorset (Kinngait), NU, Iqaluit, NU, and Kuujjuaq, QC.
3.2. Sea Ice Time Series Analysis
The Mann–Kendall correlation and Theil–Sen slope estimator were used to quantify the temporal evolution of the sea ice metrics for each of the 24 grid points. These results are presented in Table 1 for the time of ice breakup for three time periods, 1971–2018, 1971–1994, and 1995–2018. The latter two were included to determine if there had been a significant change in behaviour throughout the 48-year period.

Table 1.
Breakup in Hudson Strait. Mann–Kendall test (significance) and Theil–Sen slope, (*** p < 0.01, ** p < 0.05, * p < 0.1, NS p > 0.1). § indicates autocorrelation (lag 1 with a 0.14 threshold). See Figure 2 for locations.
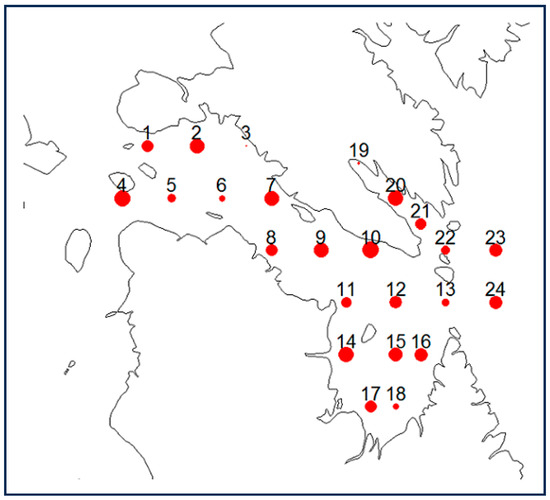
For the 1971–2018 time period, 23 of the 24 points (excluding point 3) had statistically significant changes in the breakup dates using the Mann–Kendall test with p-values less than 0.05. The rate of change for the statistically significant points ranged from −0.198 to −1.241 days per year, which indicated 10 to 60 days earlier in breakup over the study period. These are presented in Figure 4 with the size of dots scaled to the rates of change appearing in Table 1. This is a remarkable range of statistically significant trends, reflective of the varied dynamics of the region. The smallest change (10 days for point 19) occurred at the top of Frobisher Bay (at Iqaluit), an inlet that is protected from the more vigorous circulation of the rest of Hudson Strait, although the nearest point (point 20) had a large rate of change, suggesting that advective constraints only occur at the top of the inlet. Point 3 also had a low rate of change and shared with point 19 close proximity to the coast and areas of relatively weak circulation (backwaters). At the other end of the spectrum, a 60-day change occurred at point 10, and while it was close to shore, as 3 and 19 were, it appeared to be in a more dynamically active part of the Strait [11]. Nearby, point 9 was also large in magnitude. Ungava Bay with slower moving waters is less affected by the advection of ice into the Bay. The breakup rate of change (−0.7 days per year) found in [7] for the period of 1982 to 2010 for Frobisher Bay was high compared to point 19 (−0.198 days per year) near the Iqaluit shore but lower than the next point (20) (−1.143 days per year) in Frobisher Bay.
Fourteen of the twenty-four breakup points had autocorrelation (lag 1 with a threshold of 0.14) in the time series for the 1971–2018 period. The autocorrelation was less widespread for the freeze-up (6 of 24 points) and ice-free season (9 of 24). While this autocorrelation was accounted for in the trend analysis, the presence of autocorrelation is noteworthy. This suggests one year’s breakup impacts the following year as explored for three locations in [13]. For breakup, Frobisher Bay had a spatially coherent cluster of autocorrelated points (19, 20, 21, 22, 23, 24), as well as the central channel of Hudson Strait (1, 4, 6, 8, 9, 12) roughly collocated with the locations used in [9]. Ungava Bay, however, did not have notable spatial coherence of autocorrelated points (14, 18). While a thermal inertia argument can be straightforwardly invoked to explain climatic memory in Frobisher Bay with limited advection of ocean waters, this argument does readily apply to the central channel of Hudson Strait because of the more active flow. Climate memory or preconditioning of the mixed layer, a form of thermal inertia, was proposed by [19]. This would be straightforward as in the case of Frobisher Bay with little heat advection in a relatively closed system, but this is not the case for Hudson Strait with incoming water from the Atlantic at depth and surface flow coming from Hudson Bay and Foxe Basin. However, since the Hudson Bay System is largely closed (with the exception of the small inputs at northwesternmost parts of Foxe Basin), the Hudson Strait surface flow may be a reflection of regional memory stemming from a relatively homogenous regional climate. For example, if the antecedent year is a colder one for the entire system, the Hudson Strait outflow will reflect this leading to earlier freeze-up and a later breakup and vice versa. Ungava Bay, on the other hand, because of the prevailing currents may be the recipient of advected sea ice that is less directly related to the temperature of the surface waters.
The slopes of the time series of subdivided periods, 1971–1994 and 1995–2018, were largely not statistically significant. However, there were a few interesting observations. Point 4, which served as the gateway point for waters exiting Hudson Bay, was the only point that exhibited a statistical significance less than p = 0.01 and the largest rate of change measured at any point in any of the time frames (−2.46 days per year for the 1995–2018 period). This was the equivalent of a 60-day earlier breakup occurring in the second half of the study period. Coupled with this was a relatively slow change in the first 24 years. To a lesser extent, this behaviour was also seen at central locations 6 and 7. The lack of statistical significance in the first period, 1971–1994, is consistent with [9] who found the same result for a time series of three locations (roughly equivalent to points 6, 9, and 12) for the period 1971–1999 [9]. A trend to earlier breakups from 1990 was emerging from the data analyzed by [9], and this was indeed the case as demonstrated in the longer analysis, a result also confirmed by [4,10,24].
The Mann–Kendall correlation and Theil–Sen slope estimator for freeze-up are presented in Table 2 for the three time periods. For the 1971–2018 time period, all the slopes for the 24 points were statistically significant using the Mann–Kendall test with p-values less than 0.05 for all grid points. The rate of change ranged from 0.385 to 1.135 days per year which indicated 19 to 54 days later in freeze-up over the study period. The 54 days value was an outlier with all other points having 34 days or less. This behaviour, strikingly different from the breakup behaviour, suggests the freeze-up is more of a response to thermal forcing and less dependent on the advection of sea ice into or out of the region, as expected since the starting point is the end of the ice-free season in the Hudson Bay System and no or limited sea ice is available for advection. This is consistent with the description of breakup versus freeze-up found in [8,9].
Table 2.
Freeze-up in Hudson Strait. Mann–Kendall test (significance) and Theil–Sen slope, (*** p < 0.01, ** p < 0.05, NS p > 0.1). § indicates autocorrelation (lag 1 with a threshold of 0.14). See Figure 2 for locations.
The slopes of the time series of subdivided periods, 1971–1994 and 1995–2018, were not statistically significant, and unlike the steadier trend for the breakup, the freeze-up had considerable variability within the sub-periods, leading to the lack of statistical significance, even though the full time period was unambiguously so. The lack of statistical significance in the first period, 1971–1994, is consistent with [9], who found the same result for a time series of three locations (roughly equivalent to points 5, 9, and 12) for the period 1971–1999. For Iqaluit (Frobisher Bay), [7] found a statistically significant trend of a freeze-up 1.7 days per year later. Points 19 and 20 (within Frobisher Bay) in this analysis had rates of change about one-third of this rate, suggesting that the rate found in [7] may be an overestimate as a result of the anomalous year of 2010 which ended their time series and the use of linear regression. In this work, we used the Mann–Kendall test and Theil–Sen slope estimator, both less influenced by data outliers, as well as a longer time series, 1971–2018. Both [10] and [4] found values lower than [13]’s results.
The Mann–Kendall correlation and Theil–Sen slope estimator for the ice-free season are presented in Table 3 for the three time periods. For the 1971–2018 period, all but one of the 24 points were statistically significant using the Mann–Kendall test with p-values less than 0.05 for all but one grid points. The sole outlier was point 18 at the base of Ungava Bay. The rate of change ranged from 0.525 to 2.500 days per year which indicated a 25-to-120-day longer ice-free season over the study period. As expected, this was largely additive to the earlier breakup and later freeze-up of seasonal sea ice reported above. The lowest rates of change occurred at points 3 and 19, both being landfast sea ice close to the shore of Baffin Island, and relatively unaffected by ocean currents and advecting sea ice. The increase in the ice-free season for these points largely is likely the result of the thermally driven freeze-up changes.
Table 3.
Ice-free season in Hudson Strait. Mann–Kendall test and Theil–Sen slope, (*** p < 0.01, ** p < 0.05, * p < 0.1, NS p > 0.1). § indicates autocorrelation (lag 1 with a threshold of 0.14). See Figure 2 for locations.
As with the breakup, the subdivided periods, 1971–1994 and 1995–2018, were largely not statistically significant (p < 0.05) with a few important exceptions. Points 1 and 4, the western entry points into Hudson Strait were strongly statistically significant (p < 0.01) during the period from 1995 to 2018, similar to the breakup results, suggesting upstream changes in recent years from Hudson Bay and Foxe Basin were propagating into the Strait. Once again, the lack of statistical significance in the first period, 1971–1994, is consistent with [9], who found the same result for a time series of three locations in Hudson Strait. Ref. [7] found a large and statistically significant increase in the ice-free season, of 2.4 days per year, for the period from 1982 to 2010. Location 20 in Frobisher Bay had a rate of increase of 1.62 days per year in this work, roughly 70% of the increase found in [7]. As noted for the freeze-up analysis, [7]’s results may be an overestimate due to the 2010 outlier year. Ref. [4] calculated a rate of 1.75 days per year which falls within the range of rates found in this work.
A correlation analysis was performed for the three sea ice metrics with the years of coincident temperature data (Kinngait, Iqaluit, Kuujjuaq). For freeze-up dates at all points, there were statistically significant correlations with annual surface air temperature at all three locations for all 24 points. For the ice-free season, all 24 points were statistically significant for Iqaluit and Kuujjuaq, but 2 of the 24 points were not, so for Kinngait, both (13, 17) were located close to Kinngait but at the exit of Hudson Strait (13) and in Ungava Bay (17). This signal was considerably less clear for breakup dates, especially for Kinngait in which only 8 of the 24 points had a statistically significant correlation with higher values for Iqaluit (19) and Kuujjuaq (21). Breakup does occur early (spring) in the year and the annual temperature spans January to December, and this may account for the lower number of correlated points compared to freeze-up dates. In addition, based on previous work for Hudson Strait [4,9,13], this metric is likely also dependent on antecedent temperatures from the previous year. The coefficient of determination (R2) varied from 17 to 59% for the ice-free season, and similar values were obtained for the freeze-up date analysis (12 to 69%). Lower values were found for the breakup date analysis, ranging from 10% to 43%. Correlation does not in and of itself indicate causation or which variable is causative. While the atmosphere is clearly a driver of surface conditions, in this instance, changes in sea ice conditions can influence atmospheric conditions, especially given the dramatically different surface radiative conditions for ice-covered and ice-free conditions. These results though indicate the likely importance of ambient temperature but also point to other factors that need consideration such as antecedent temperatures from the previous year and the advection of sea ice especially during the breakup. We also explored within-season thermal inertia or “shorter-term climate memory”. A correlation analysis was conducted between detrended breakup and freeze-up dates within the same year. Based on [13,25], we anticipated that earlier breakup dates would allow for more open-ice season absorption of energy from the atmosphere and thus in general lead to later freeze-up dates. This proved to be the case for 21 of 24 grid points (Table 4). These correlations were less than those generated from the original data (not detrended), indicating that the more general warming of the region was contributing to the changes in sea ice conditions as well as the seasonal thermal inertia indicated by the detrended analysis.
Table 4.
Linear correlation (Cor) between breakup and freeze-up dates time series and correlation between breakup and freeze-up dates for detrended time series (Det) for the 24 points (Figure 2). The three points that did not have a negative correlation for the detrended data are bolded (12, 13, 18).
3.3. Spatial Analysis
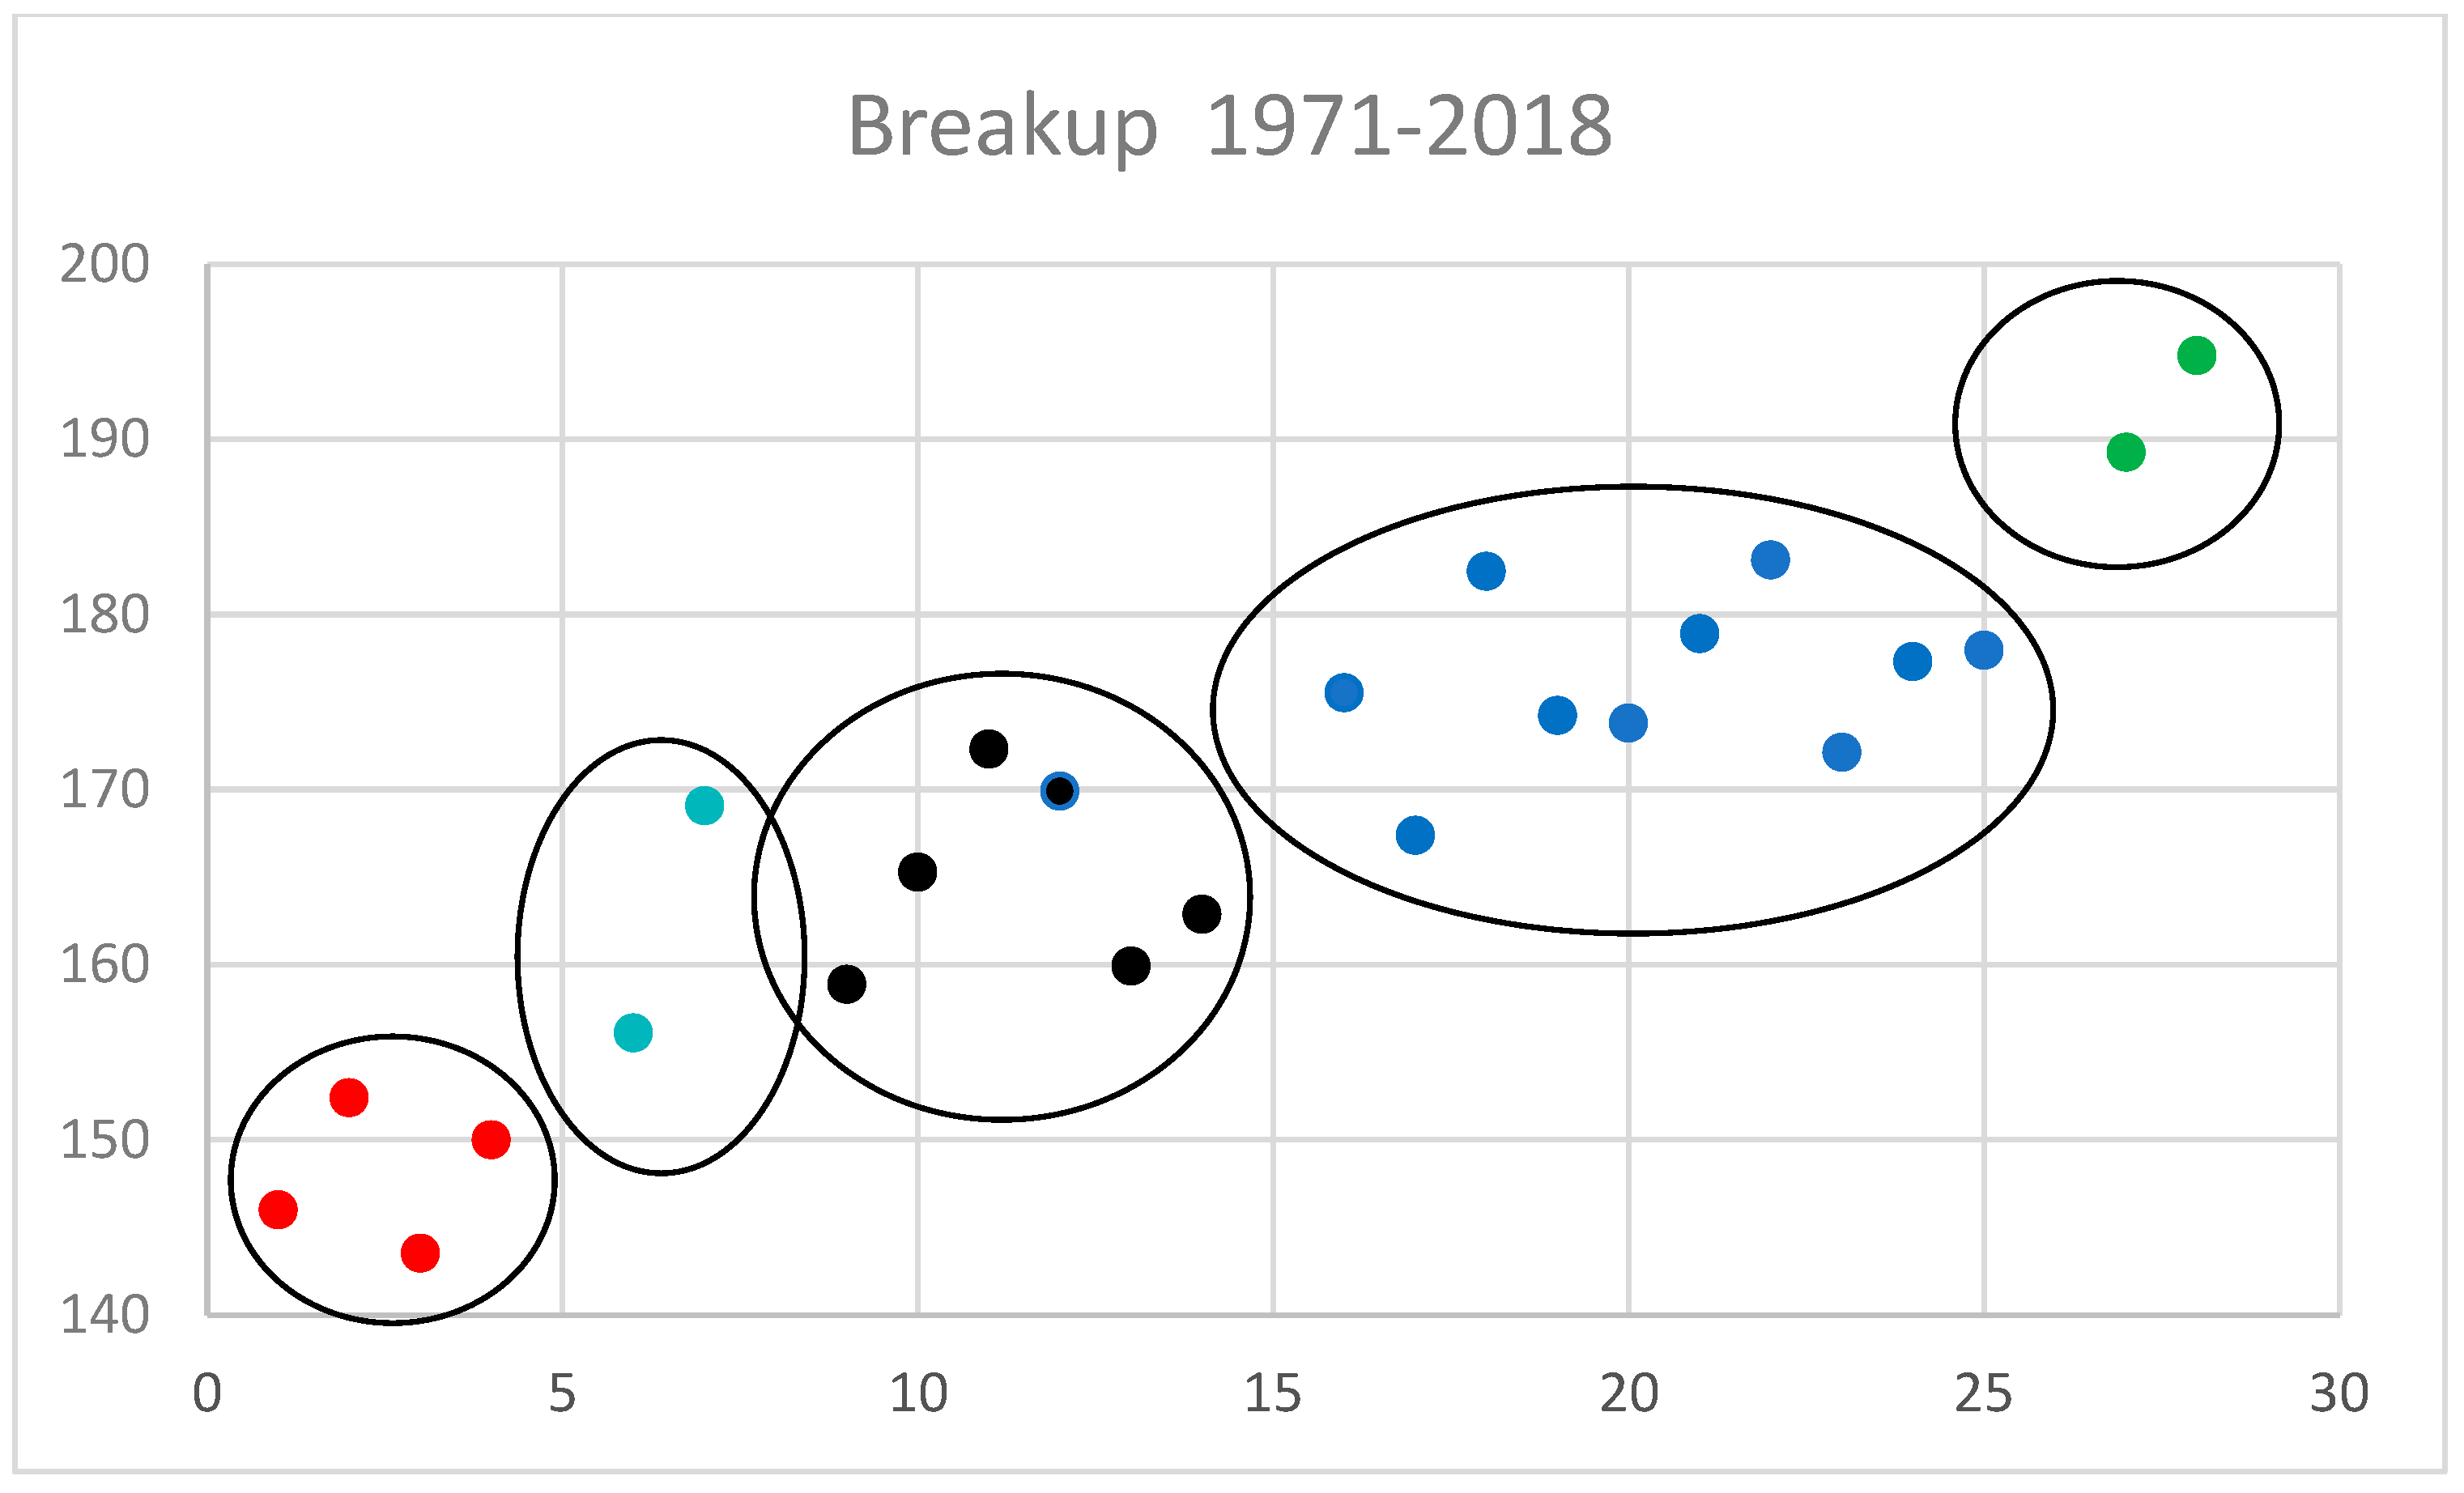
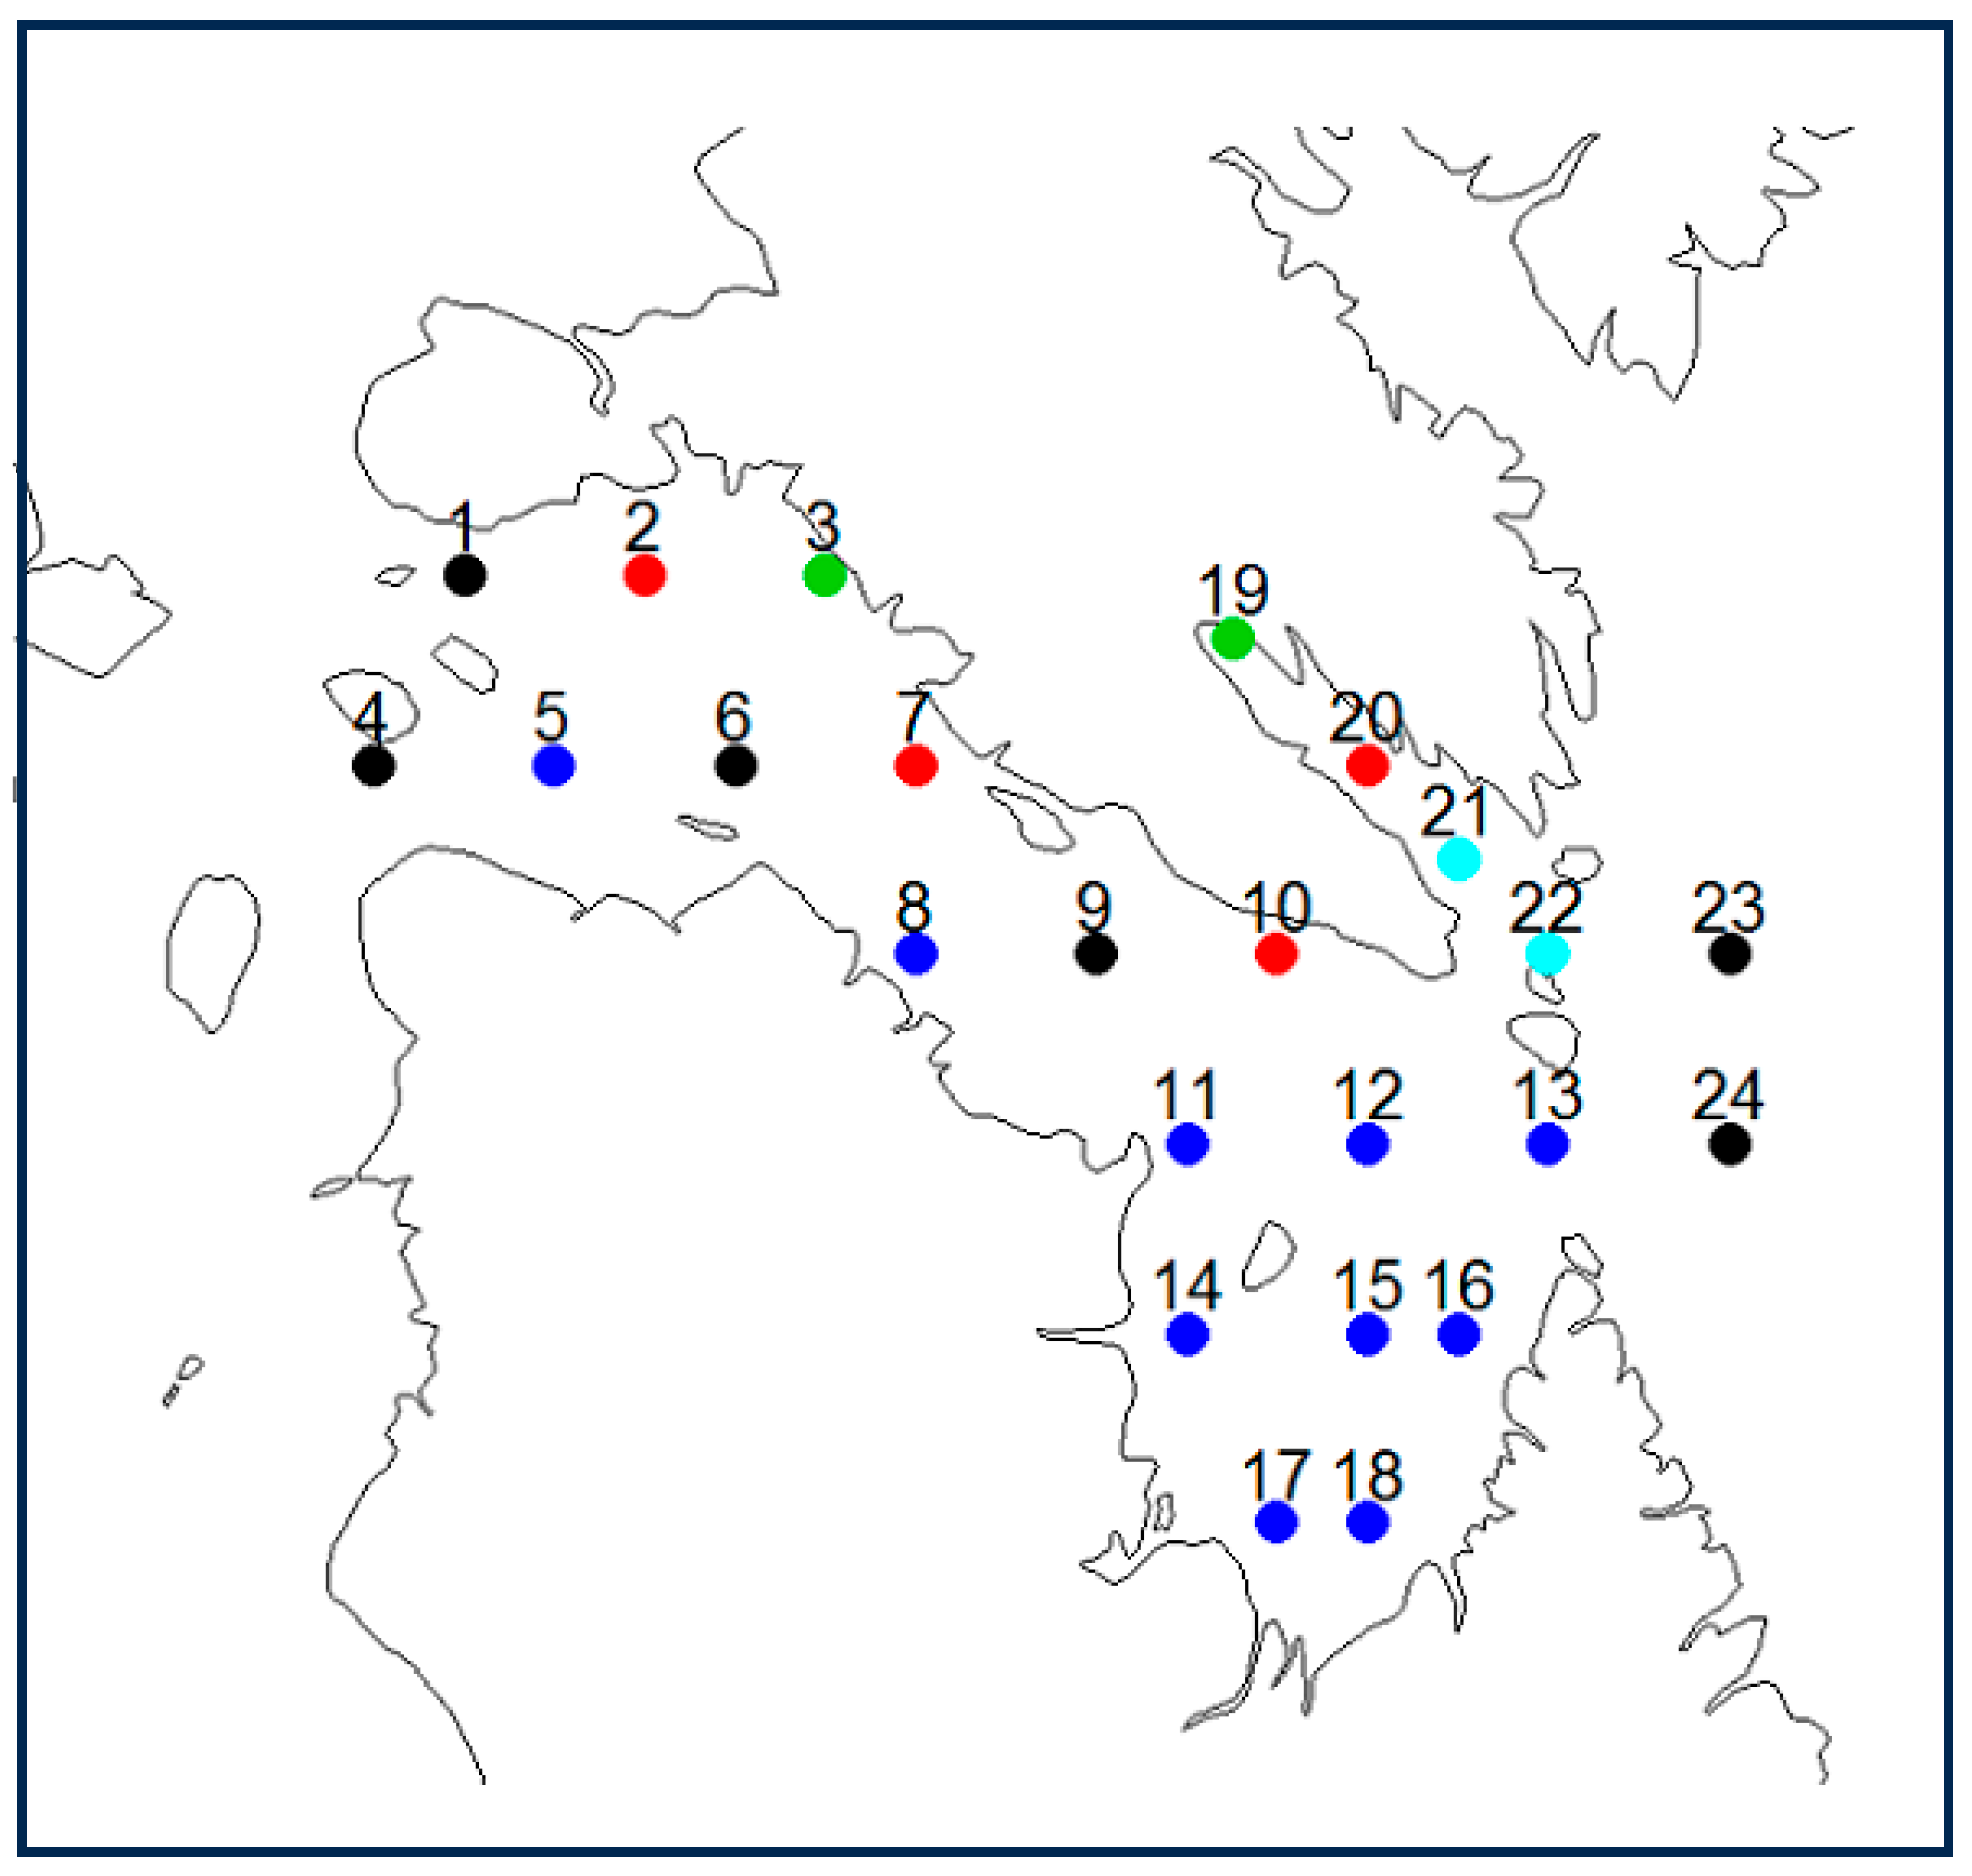
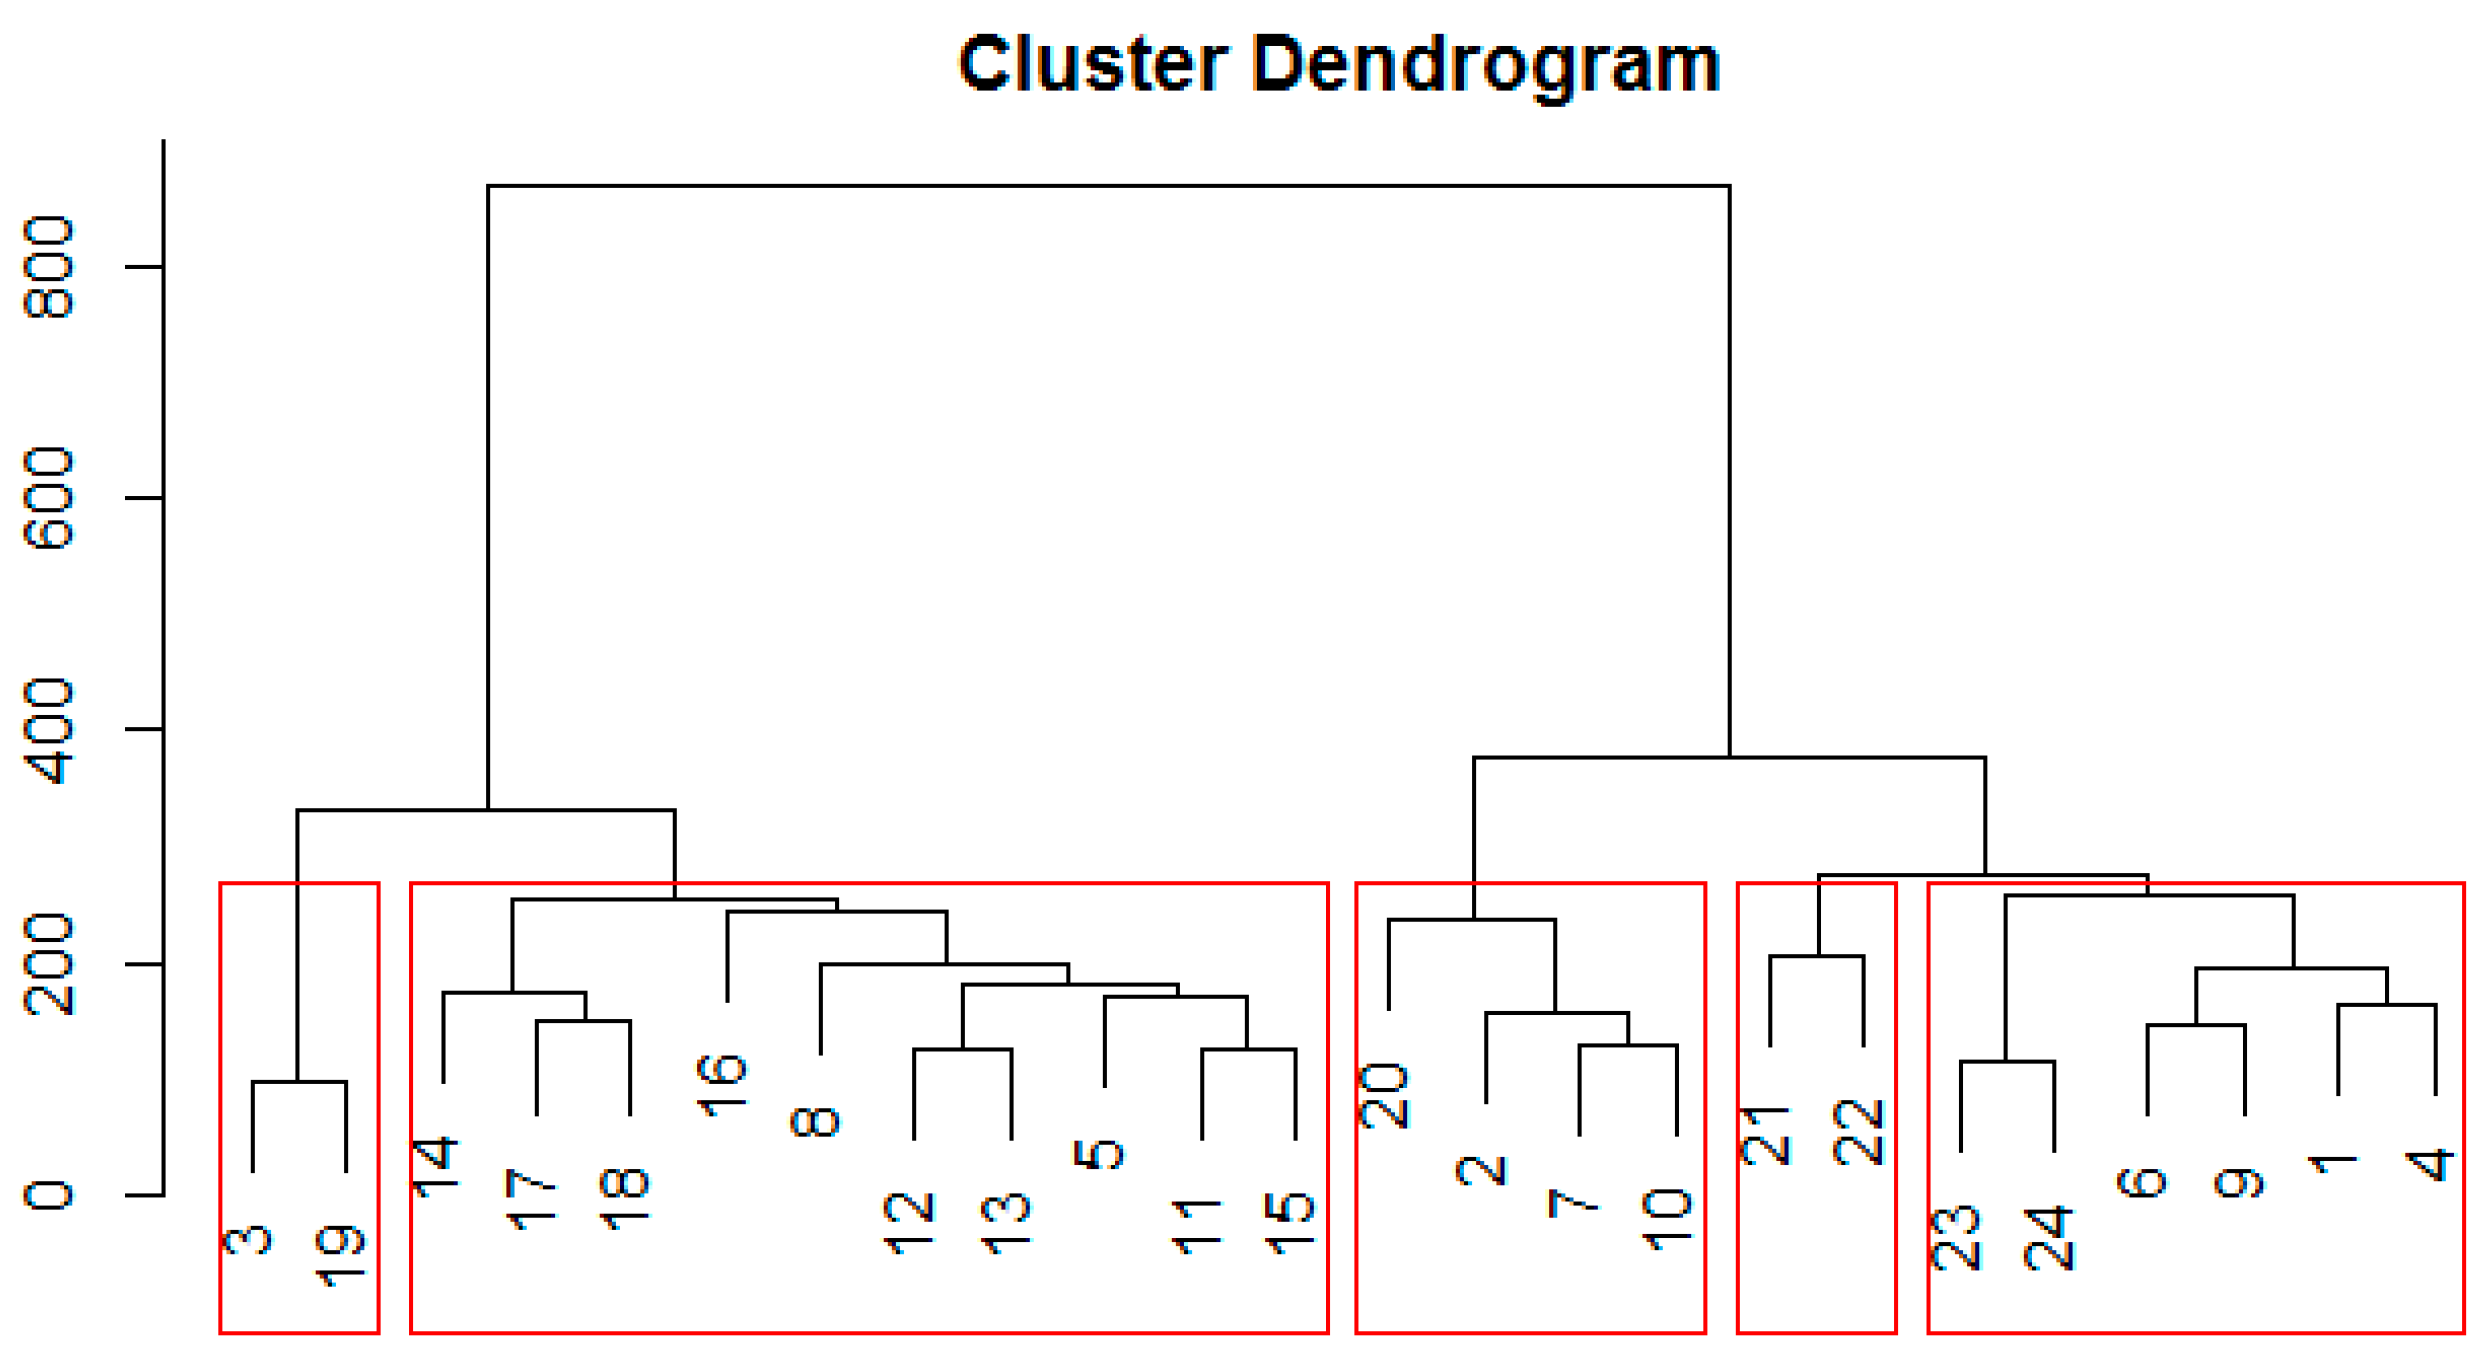
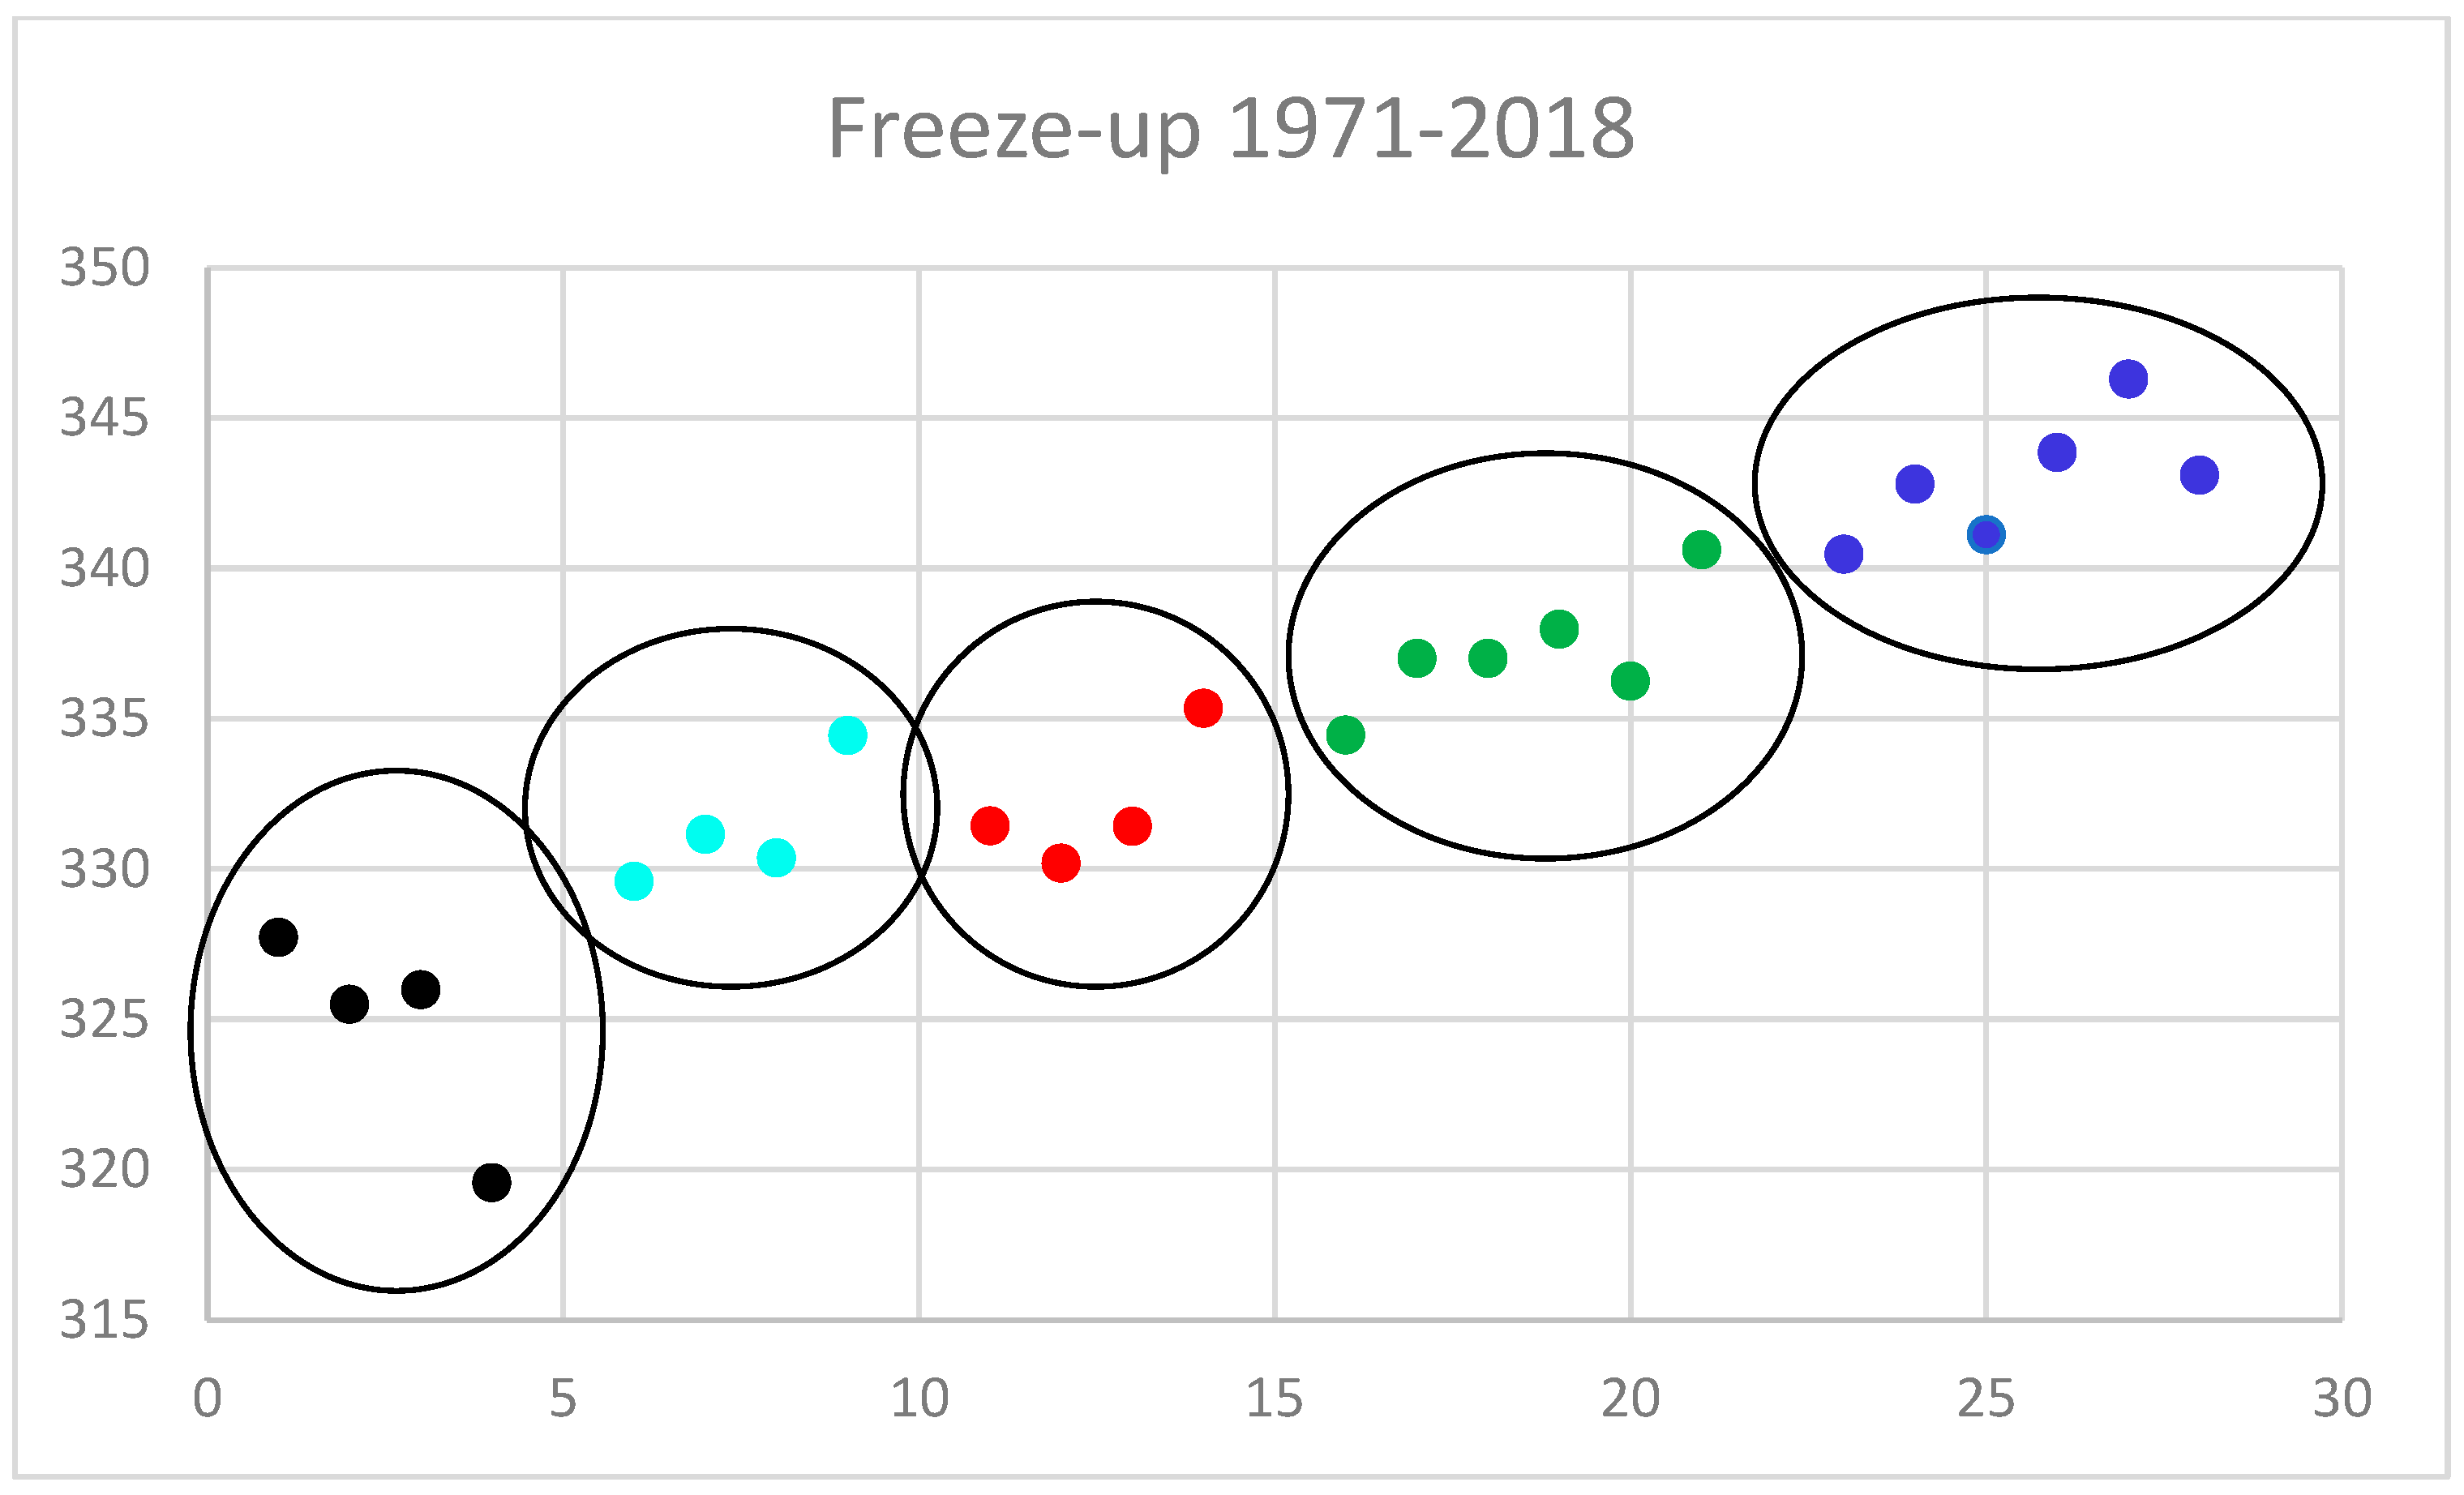
The spatial clustering of the 24 Hudson Strait grid points was explored using the Ward’s method. For breakup, the five clusters of grid points are presented in Figure 5 and Figure 6. To help understand the nature of the ice breakup and its relation to the clusters, Figure 5 shows the clustered points as a function of the average breakup date for each point. Figure 6 shows the spatial distribution of the clusters. The red cluster along the northern shore was the first to break up, likely aided by the prevailing wind from the northwest. This cluster was joined by one of the Frobisher Bay points (20) of similar latitude and influence from the prevailing winds. Immediately adjacent to the red cluster points are the two green points, which were the last to break up, likely due to their close proximity to land in areas sheltered from the prevailing flow. The second most persistent cluster (later breakup) is the blue one, largely in Ungava Bay and on the south shore of Hudson Strait. This cluster was the largest one and indicated coherent sea ice behaviour centred on Ungava Bay (11–18) as well as the non-contiguous points 5 and 8 along the southern shore of Western Hudson Strait, following the pathway of exiting flow from Hudson Bay to Hudson Strait and through the strait to the Atlantic Ocean. Frobisher Bay illustrated an unusual temporal sequence of sea ice breakup, beginning with green (the latest breakup) at the top of the Bay, followed by red, the earliest breakup and two turquoise points, the next earliest breakup. The remaining cluster (black) had representation at the western extent of Hudson Strait (1, 4, 6) and eastern extent of Hudson Strait (23, 24) as well as a central point (9). To more fully understand this, the cluster dendrogram that produced these clusters is presented in Figure 7. A dendrogram provides greater granularity in understanding the similarity among the grid points. For example, the black cluster of points 1, 4, 6, 9, 23, and 24, were formed from three subgroupings of 1 and 4, 6 and 9, and 23 and 24, subgroupings that were more spatially coherent, the first pair at the western entrance of the Strait, the latter two at the Strait eastern exit. Point 9 was immediately downstream of point 6, suggestive of the nature of the dissipating of sea ice during breakup. The red cluster of 2, 7, 10, and 20 had a closer link between 7 and 10 than with 2 and 20, which were further away. Figure 7 also provides insights on the choice of five clusters for the spatial analysis. Moving to six clusters could involve breaking up the black cluster into two clusters, separating 23 and 24 from the others. This makes physical sense. Another choice would be to separate points 14, 17, and 18 from the remaining points in the blue cluster. This follows the flow within Ungava Bay but is a subclustering that is less physically obvious than that considered for the black cluster, where points were not contiguous.

Figure 5.
Spatial clusters for Hudson Strait as a function of the average breakup date (ordinal day of the year). The vertical axis is the day of the year when breakup occurs. The x axis is a counter for the 24 points with a blank between each cluster.
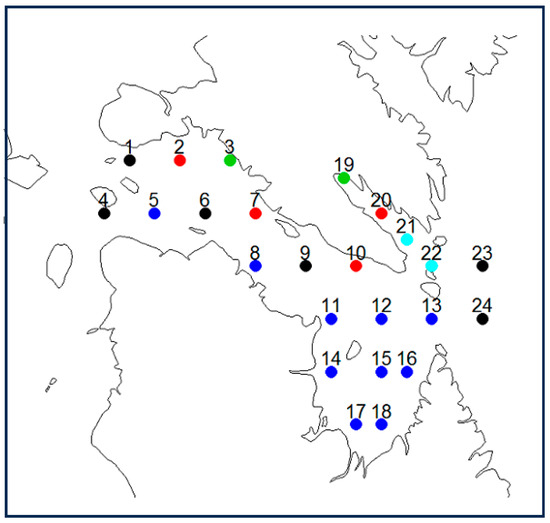
Figure 6.
Spatial representation of the cluster analysis for breakup dates for the period of 1971–2018 for Hudson Strait. The colour of the points matches those in Figure 5.
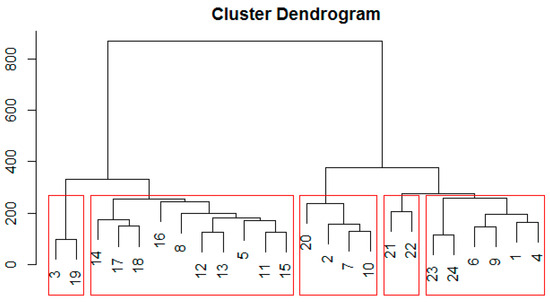
Figure 7.
Cluster dendrogram for breakup in Hudson Strait, 1971–2018. The vertical axis is the sum of squares of the difference of the observations from the average value of the cluster. The numbers are the grid points shown in Figure 2. The red boxes represent the clustering found in Figure 5 and Figure 6.
We now turn to a similar cluster analysis for freeze-up in Hudson Strait. These are presented in Figure 8 and Figure 9. Figure 8 provides the freeze-up sequence which begins at the western edge of the Strait (black cluster), progresses through the red and green clusters, and ends at the eastern mouth of the Strait (blue cluster). In parallel to the red cluster the turquoise cluster forms in Frobisher Bay. A different picture emerged for the freeze-up than for breakup (Figure 9). As noted in [4,13], sea ice freeze-up followed a northwest-to-southeast sequence with the exception of the turquoise cluster in Frobisher Bay, as confirmed in Figure 8, unlike the breakup, and appeared to be dominated by radiative (thermal forcing by the atmosphere) rather than dynamic forcing (advecting sea ice).
Figure 8.
Spatial clusters for Hudson Strait as a function of the average freeze-up date (ordinal day of the year).
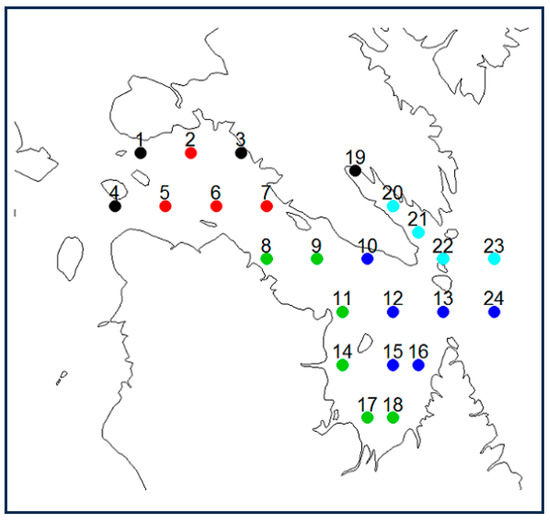
Figure 9.
Spatial representation of the cluster analysis for freeze-up dates for the period of 1971–2018 for Hudson Strait. The colour of the points matches those in Figure 8.
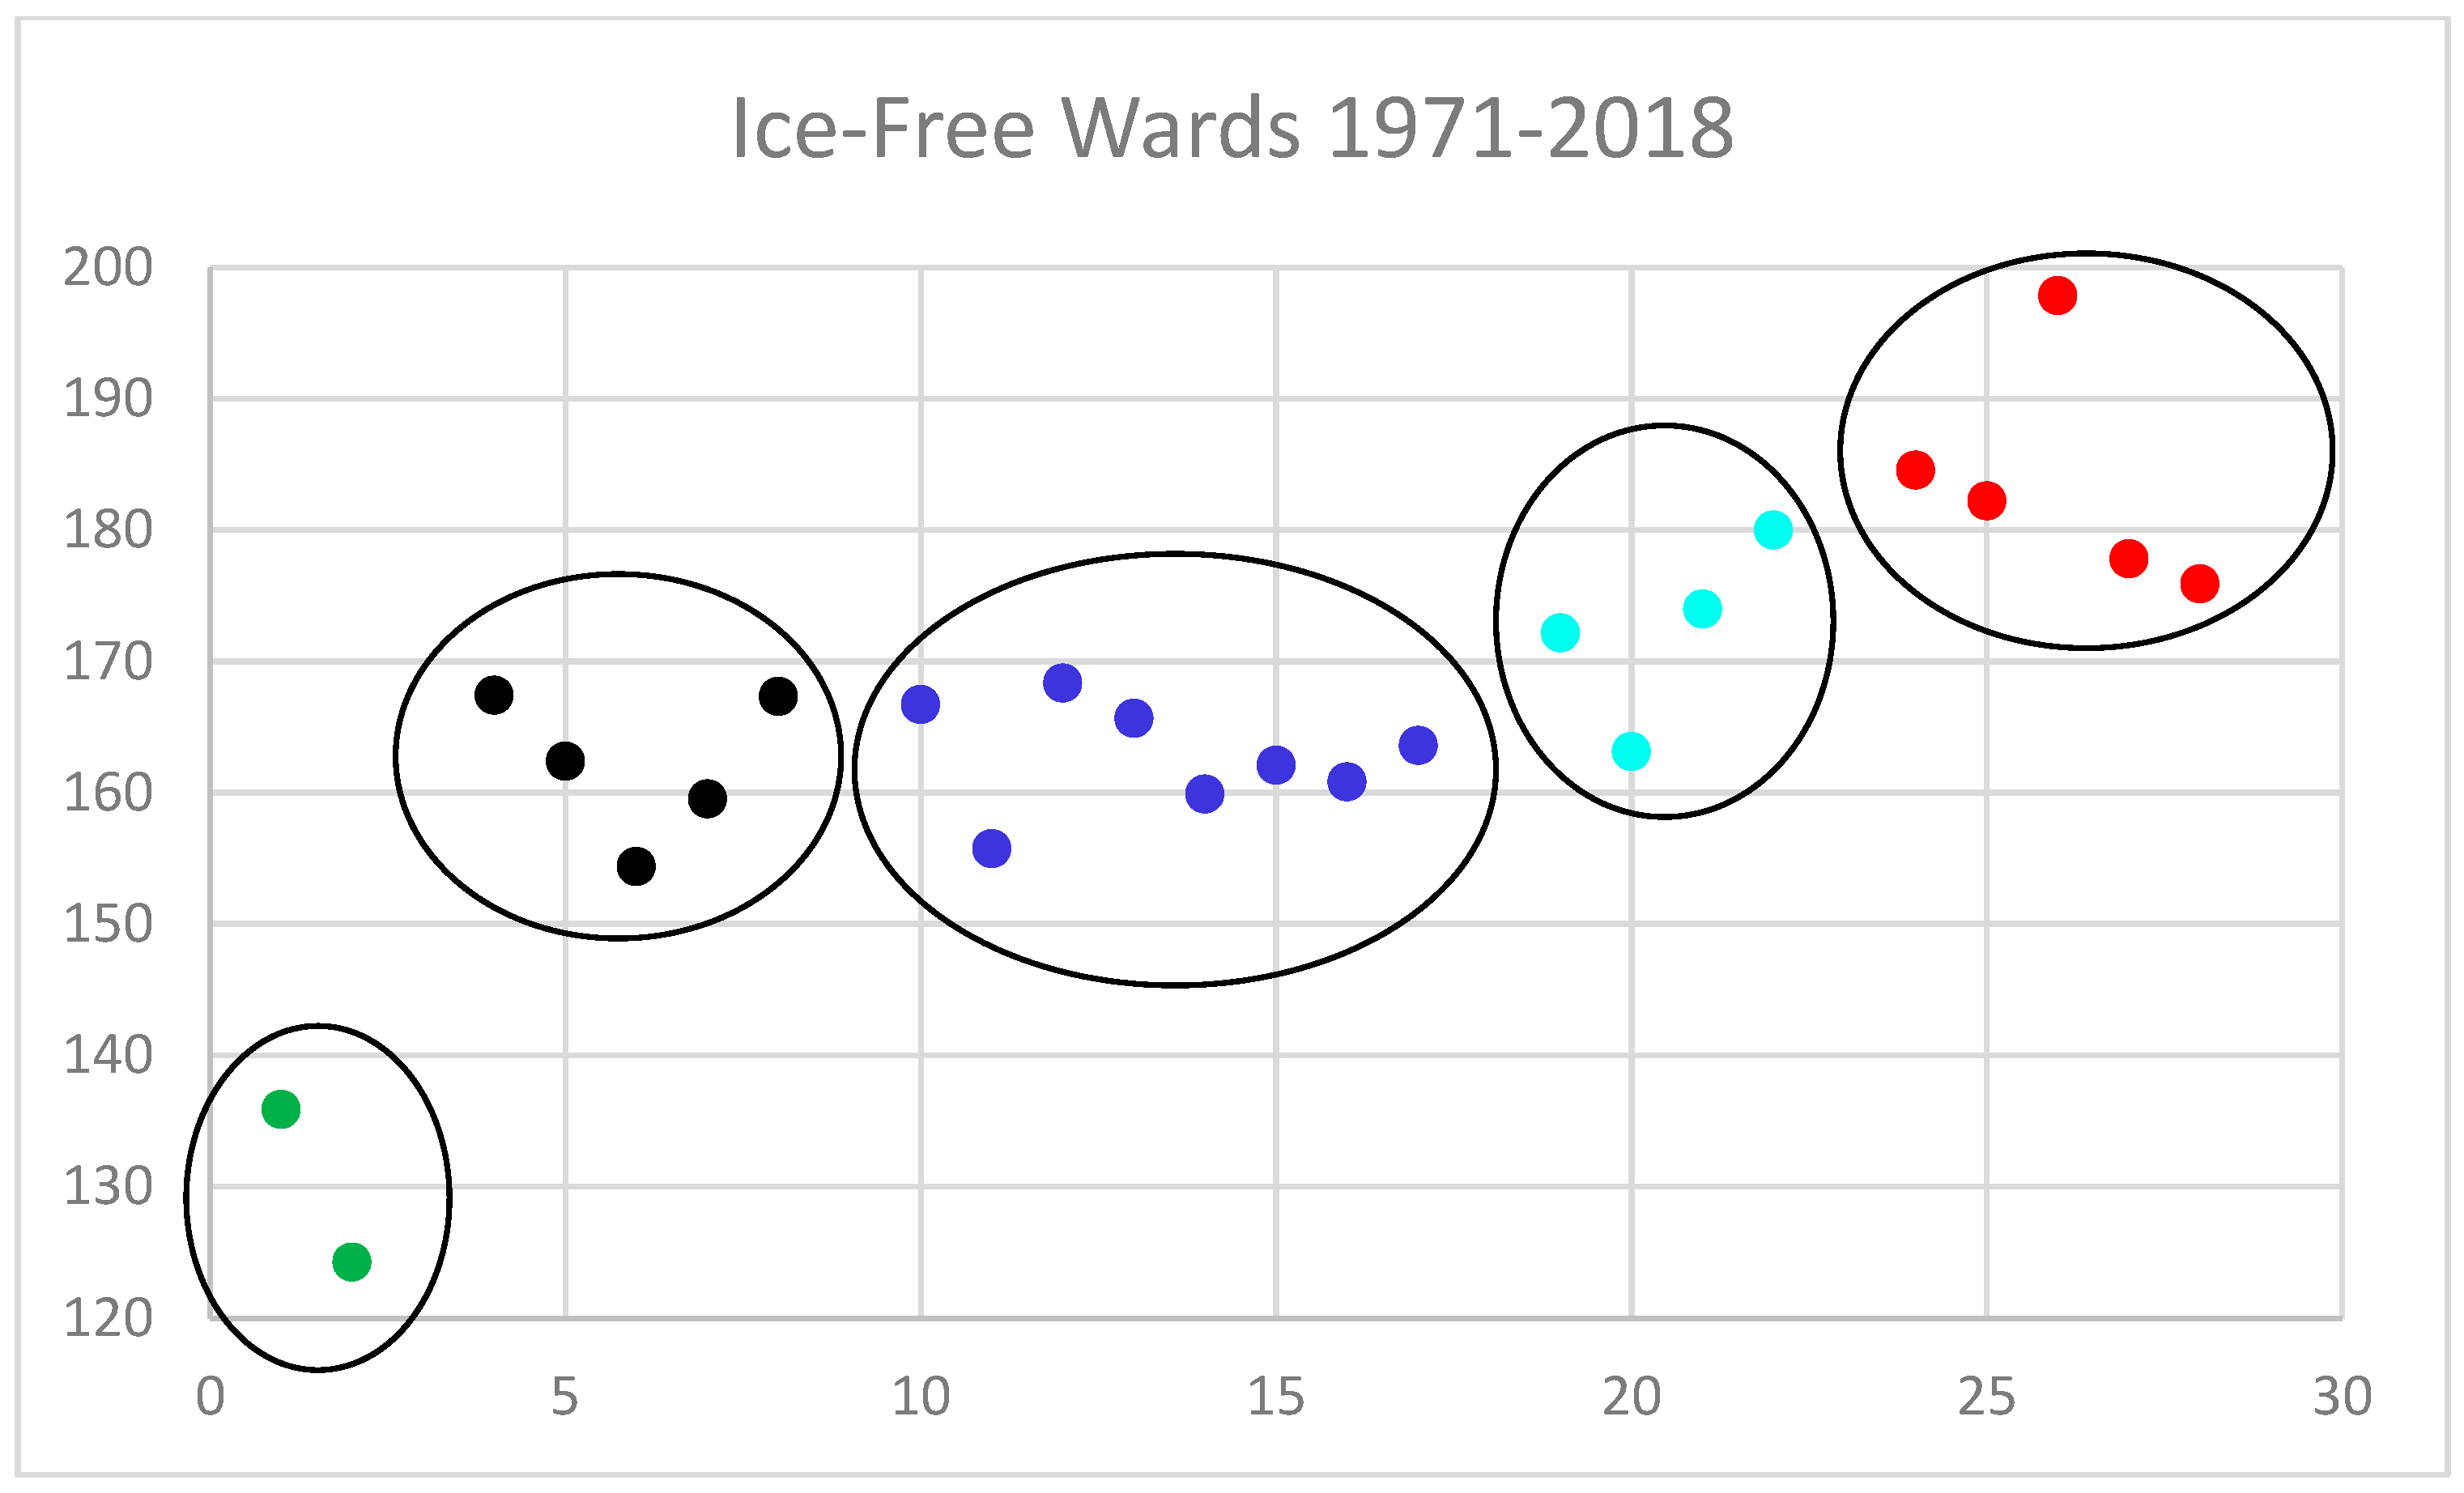
Finally, we examined the clustering for the ice-free season in Figure 10 and Figure 11. Figure 10 provides the order of shortest (green) to longest (red) ice-free season with the others in between (black, blue, turquoise). These clusters were reminiscent of those generated for the breakup analysis, including the green shoreline cluster (3, 19) and the blue one centred on Ungava Bay (11, 12, 13, 14, 15, 17, 18) (Figure 11). The others included a black western entrance cluster (1, 4, 5, 6, 9) and turquoise eastern exit cluster (22, 23, 24). The final cluster (red) was a north shore cluster (2, 7, 10, 20, 21). With a variation in a few points (5, 16, 21), the pattern was essentially the same as the breakup distribution. The green cluster (3, 19) was a notable outlier, as these points combined the latest breakup with the earliest freeze-up to form an anomalously (for Hudson Strait) short ice-free period and reflective of their proximity to the shore and isolation from the prevailing current flow.

Figure 10.
Spatial clusters for Hudson Strait as a function of the average length of the ice-free season.

Figure 11.
Spatial representation of the cluster analysis for the ice-free season for the period of 1971–2018 for Hudson Strait. The colour of the points matches those in Figure 10.
4. Discussion
This work was a temporal and spatial expansion of previous work [9] in Hudson Strait, as well as the inclusion of a spatial clustering analysis. Two questions were addressed, and this section is structured in this order.
How statistically significant are the temporal changes in the breakup, freeze-up, and ice-free season for the 24 grid points representing Hudson Strait for three time periods, 1971–2018, 1971–1994, 1995–2018, and the relationship to concurrent temperature change?
This paper provided a contemporary assessment of sea ice conditions in Hudson Strait through temporal and spatial analyses. An earlier assessment [9] found no statistically significant changes in sea ice formation and breakup and related ice-free seasons. In this work, a three-grid representation [9] was expanded to 24 points and included a specific representation of Ungava and Frobisher’s Bays and lengthened the time series to 2018 from 1999. Changes to the three metrics became statistically significant, a result predicted in [9] given the changes that had occurred since 1999 but failed to reach statistical significance then. Ref. [7] using a different times series (1982–2010) did find statistically significant changes in the three metrics for Iqaluit and Frobisher Bay, consistent with [2,4,10]. However, the magnitude of changes found in [7] may have been overestimated due to the outlier nature of [12] which linear regression is particularly susceptible to. However, in this work we used the Mann–Kendall test and Theil–Sen slope estimator to determine statistical significance and the magnitudes of the trends which, as a nonparametric analyses, are less sensitive to outliers.
Later freeze-up (2 to 15 days per decade) and longer ice-free season (6 to 30 days per decade) were strongly and statistically significantly correlated to coincident surface air temperatures at three locations in the Hudson Strait region, Kinngait, Iqaluit, and Kuujjuaq. Earlier breakup dates (4 to 10 days per decade), while statistically significant, were less well linked to regional temperatures, likely a result of two mechanisms, first, the influence of oceanic flow on the distribution that enables the displacement of sea ice from its thermally generated source region and second, the dependence of breakup dates on the previous year’s temperature and sea ice conditions [3,4,13], an indication of climate memory or preconditioning, also supported by a substantial autocorrelation of the time series (lag 1 with a threshold of 0.14), especially for the breakup. We also found a within-season amplifier of sea ice change. Using detrended time series, an earlier breakup was well correlated to a later freeze-up, likely due to the greater thermal inertia accumulated in the open-ice season, as previously found [25]. This indicates that the later freeze-up is a response both to regional temperature change as well as internal mechanisms linking sea ice to the thermal inertia in the strait’s seawater. Thus, while regional change in climate triggers the change in sea ice, internal mechanisms work to amplify that change.
Using a spatial cluster analysis, how coherent is the nature of breakup, freeze-up, and ice-free season spatially using three time periods?
For the first time, a spatial clustering analysis was conducted on Hudson Strait’s gridded sea ice data revealing the distinctive signatures of Ungava Bay, Frobisher Bay, and grid points close to the shore. The clustering differed for the three metrics, breakup, freeze-up, and ice-free season. The freeze-up clustering followed a northwest-to-southeast progression of ice formation, indicative of the domination of radiative (thermal) forcing with little to no influence of advecting sea ice at the end of the ice-free season. The breakup and ice-free season clusters were more nuanced, likely indicating the role of advecting sea ice, ocean currents, and atmospheric winds, with points along the northern shore of Hudson Strait and Frobisher Bay being distinct from those in the central channel, southern shore of Hudson Bay, and Ungava Bay, reflective of the strait’s cyclonic flow and exiting flow from Hudson Bay and Foxe Basin through Hudson Strait along the southern shore, including Ungava Bay, to the Atlantic Ocean. There was evidence of interannual climate memory or preconditioning, especially with breakup dates, consistent with [4,13].
5. Conclusions
The temporal and spatial variation in seasonal sea ice in Hudson Strait were examined using both time series and spatial clustering analyses. For the period from 1971 to 2018, time series of sea ice breakup and freeze-up dates and ice-free season length were generated from sea ice charts on a 24-point grid. The temporal analyses indicated a direct response to a warming climate with statistically significant changes for all three metrics that were statistically linked to concurrent surface air temperatures from local climate stations. The rates of change in freeze-up dates and ice-free season length were particularly strong in the early 2000s but less so in the 2010s. In addition, the presence of significant autocorrelation suggested that the breakup date behaviour appeared to be influenced by the previous year’s temperature and ice conditions. Later freeze-up dates were directly linked to earlier breakup dates using detrended time series, causing an amplification of the impact of warmer regional temperatures. The spatial clustering analyses on the Hudson Strait sea ice data indicated distinctive clusters for Ungava Bay, Frobisher Bay, and for grid points close to the shore, where ocean dynamics were minimal.
Author Contributions
Conceptualization, S.K. and W.A.G.; methodology, S.K. and K.B.; software, K.B.; formal analysis, S.K. and K.B.; investigation, S.K.; resources, W.A.G.; data curation, S.K. and K.B.; writing—original draft preparation, S.K. and W.A.G.; writing—review and editing, W.A.G.; visualization, K.B.; supervision, W.A.G.; project administration, W.A.G.; funding acquisition, W.A.G. All authors have read and agreed to the published version of the manuscript.
Funding
This research was funded by NSERC RGPIN-2018-06801.
Data Availability Statement
Temperature data were accessed from the national archive (Environment and Climate Change Canada), https://climate.weather.gc.ca/historical_data/search_historic_data_e.html (accessed on 15 July 2023); Sea ice data were obtained from the Canadian Ice Service, https://iceweb1.cis.ec.gc.ca/Archive/page1.xhtml?lang=en (accessed on 12 May 2024).
Conflicts of Interest
The authors declare no conflicts of interest.
References
- Rantanen, M.; Karpechko, A.Y.; Lipponen, A.; Nordling, K.; Hyvärinen, O.; Ruosteenoja, K.; Vihma, T.; Laaksonen, A. The Arctic has warmed nearly four times faster than the globe since 1979. Commun. Earth Environ. 2022, 3, 168. [Google Scholar] [CrossRef]
- Tivy, A.; Howell, S.E.L.; Alt, B.; McCourt, S.; Chagnon, R.; Crocker, G.; Carrieres, T.; Yackel, J.J. Trends and variability in summer sea ice cover in the Canadian Arctic based on the Canadian Ice Service Digital Archive, 1960–2008 and 1968–2008. J. Geophys. Res. 2011, 116, C03007. [Google Scholar] [CrossRef]
- Andrews, J.; Babb, D.; Barber, D.G. Climate change and sea ice: Shipping accessibility on the marine transportation corridor through Hudson Bay and Hudson Strait (1980–2014). Elem. Sci. Anthr. 2017, 5, 15. [Google Scholar] [CrossRef]
- Andrews, J.; Babb, D.; Barber, D.G. Climate change and sea ice: Shipping in Hudson Bay, Hudson Strait, and Foxe Basin (1980–2016). Elem. Sci. Anthr. 2018, 6, 19. [Google Scholar] [CrossRef]
- Babb, D.G.; Kirillov, S.; Galley, R.J.; Straneo, F.; Ehn, J.K.; Howell, S.E.L.; Brady, M.; Ridenour, N.A.; Barber, D.G. Sea Ice Dynamics in Hudson Strait and Its Impact on Winter Shipping Operations. J. Geophys. Res. Oceans 2021, 126, e2021JC018024. [Google Scholar] [CrossRef]
- Laidler, G.J.; Elee, P. Human geographies of sea ice: Freeze/thaw processes around Cape Dorset, Nunavut, Canada. Polar Rec. 2008, 44, 51–76. [Google Scholar] [CrossRef]
- Ford, J.D.; McDowell, G.; Shirley, J.; Pitre, M.; Siewierski, R.; Gough, W.; Duerden, F.; Pearce, T.; Adams, P.; Statham, S. The Dynamic Multiscale Nature of Climate Change Vulnerability: An Inuit Harvesting Example. Ann. Assoc. Am. Geogr. 2013, 103, 1193–1211. [Google Scholar] [CrossRef]
- Crane, R.G. Seasonal variations of sea ice extent in the Davis Strait–Labrador Sea area and relationship with syn-optic-scale atmospheric circulation. Arctic 1978, 31, 434–447. [Google Scholar] [CrossRef]
- Houser, C.; Gough, W.A. Variations in Sea Ice in the Hudson Strait: 1971–1999. Polar Geogr. 2003, 27, 1–14. [Google Scholar] [CrossRef]
- Galbraith, P.S.; Larouche, P. Sea-surface temperature in Hudson Bay and Hudson Strait in relation to air temperature and ice cover breakup, 1985–2009. J. Mar. Syst. 2011, 87, 463–475. [Google Scholar] [CrossRef]
- Ridenour, N.A.; Straneo, F.; Holte, J.; Gratton, Y.; Myers, P.G.; Barber, D.G. Hudson Strait Inflow: Structure and Variability. J. Geophys. Res. Oceans 2021, 126, e2020JC017089. [Google Scholar] [CrossRef]
- Statham, S.; Ford, J.; Berrang-Ford, L.; Gough, W.; Siewierski, R.; Lardeau, M.P. Anomalous climatic conditions during winter 2010/11 and vulnerability of the traditional Inuit food system in Iqaluit, Nunavut. Polar Rec. 2015, 51, 301–317. [Google Scholar] [CrossRef]
- Gough, W.A.; Houser, C. Climate Memory and Long-Range Forecasting of Sea Ice Conditions in Hudson Strait. Polar Geogr. 2005, 29, 17–26. [Google Scholar] [CrossRef]
- Kowal, S.; Gough, W.A.; Butler, K. Temporal and Spatial Evolution of Seasonal Sea Ice of Arctic Bay, Nunavut. Coasts 2023, 3, 113–124. [Google Scholar] [CrossRef]
- Gagnon, A.S.; Gough, W.A. Trends in the Dates of Ice Freeze-up and Breakup over Hudson Bay, Canada. Arctic 2005, 58, 370–382. [Google Scholar] [CrossRef]
- Kowal, S.; Gough, W.A.; Butler, K. Temporal evolution of Hudson Bay Sea Ice (1971–2011). Theor. Appl. Clim. 2017, 127, 753–760. [Google Scholar] [CrossRef]
- Archer, L.; Ford, J.; Pearce, T.; Kowal, S.; Gough, W.A.; Allurut, M. Longitudinal assessment of climate vulner-ability: A case study from the Canadian Arctic. Sustain. Sci. 2017, 12, 15–29. [Google Scholar] [CrossRef]
- Etkin, D.A. Break-up in Hudson Strait: Its sensitivity to air temperatures and implications for climate warming. Climatol. Bull. 1991, 25, 21–34. [Google Scholar]
- Stirling, I.; Derocher, A.E. Possible Impacts of Climatic Warming on Polar Bears. Arctic 1993, 46, 240–245. [Google Scholar] [CrossRef]
- Neave, H.R.; Worthington, P.L. Distribution-Free Tests; Unwin Hyman Limited: London, UK, 1988. [Google Scholar]
- Hamed, K.H.; Rao, A.R. A modified Mann-Kendall trend test for autocorrelated data. J. Hydrol. 1998, 204, 182–196. [Google Scholar] [CrossRef]
- Sen, P.K. Estimates of the Regression Coefficient Based on Kendall’s Tau. J. Am. Stat. Assoc. 1968, 63, 1379–1389. [Google Scholar] [CrossRef]
- Johnson, R.A.; Wichern, D.W. Applied Multivariate Statistical Analysis, 5th ed.; Prentice-Hall: Upper Saddle River, NJ, USA, 2002. [Google Scholar]
- Hochheim, K.P.; Barber, D.G. An Update on the Ice Climatology of the Hudson Bay System. Arct. Antarct. Alp. Res. 2014, 46, 66–83. [Google Scholar] [CrossRef]
- Stroeve, J.C.; Crawford, A.D.; Stammerjohn, S. Using timing of ice retreat to predict timing of fall freeze-up in the Arctic. Geophys. Res. Lett. 2016, 43, 6332–6340. [Google Scholar] [CrossRef]

Disclaimer/Publisher’s Note: The statements, opinions and data contained in all publications are solely those of the individual author(s) and contributor(s) and not of MDPI and/or the editor(s). MDPI and/or the editor(s) disclaim responsibility for any injury to people or property resulting from any ideas, methods, instructions or products referred to in the content. |
© 2024 by the authors. Licensee MDPI, Basel, Switzerland. This article is an open access article distributed under the terms and conditions of the Creative Commons Attribution (CC BY) license (https://creativecommons.org/licenses/by/4.0/).