Conducting a Tailored and Localised Marine Heat Wave Risk Assessment for Vanuatu Fisheries
Abstract
:1. Introduction
1.1. Marine Heat Waves in Vanuatu Fisheries
1.2. Fisheries Risk Management in Vanuatu through Marine Heat Wave Risk Assessment
1.3. Aims and Objectives
- 1.
- Can an integrated and tailored risk assessment methodology accurately indicate disaster risk for MHWs within Vanuatu before a disaster event occurs?
- 2.
- How can expanding risk knowledge through risk assessment lessen the specific sectoral impacts of MHWs in the fisheries sector of Vanuatu?
2. Materials and Methods
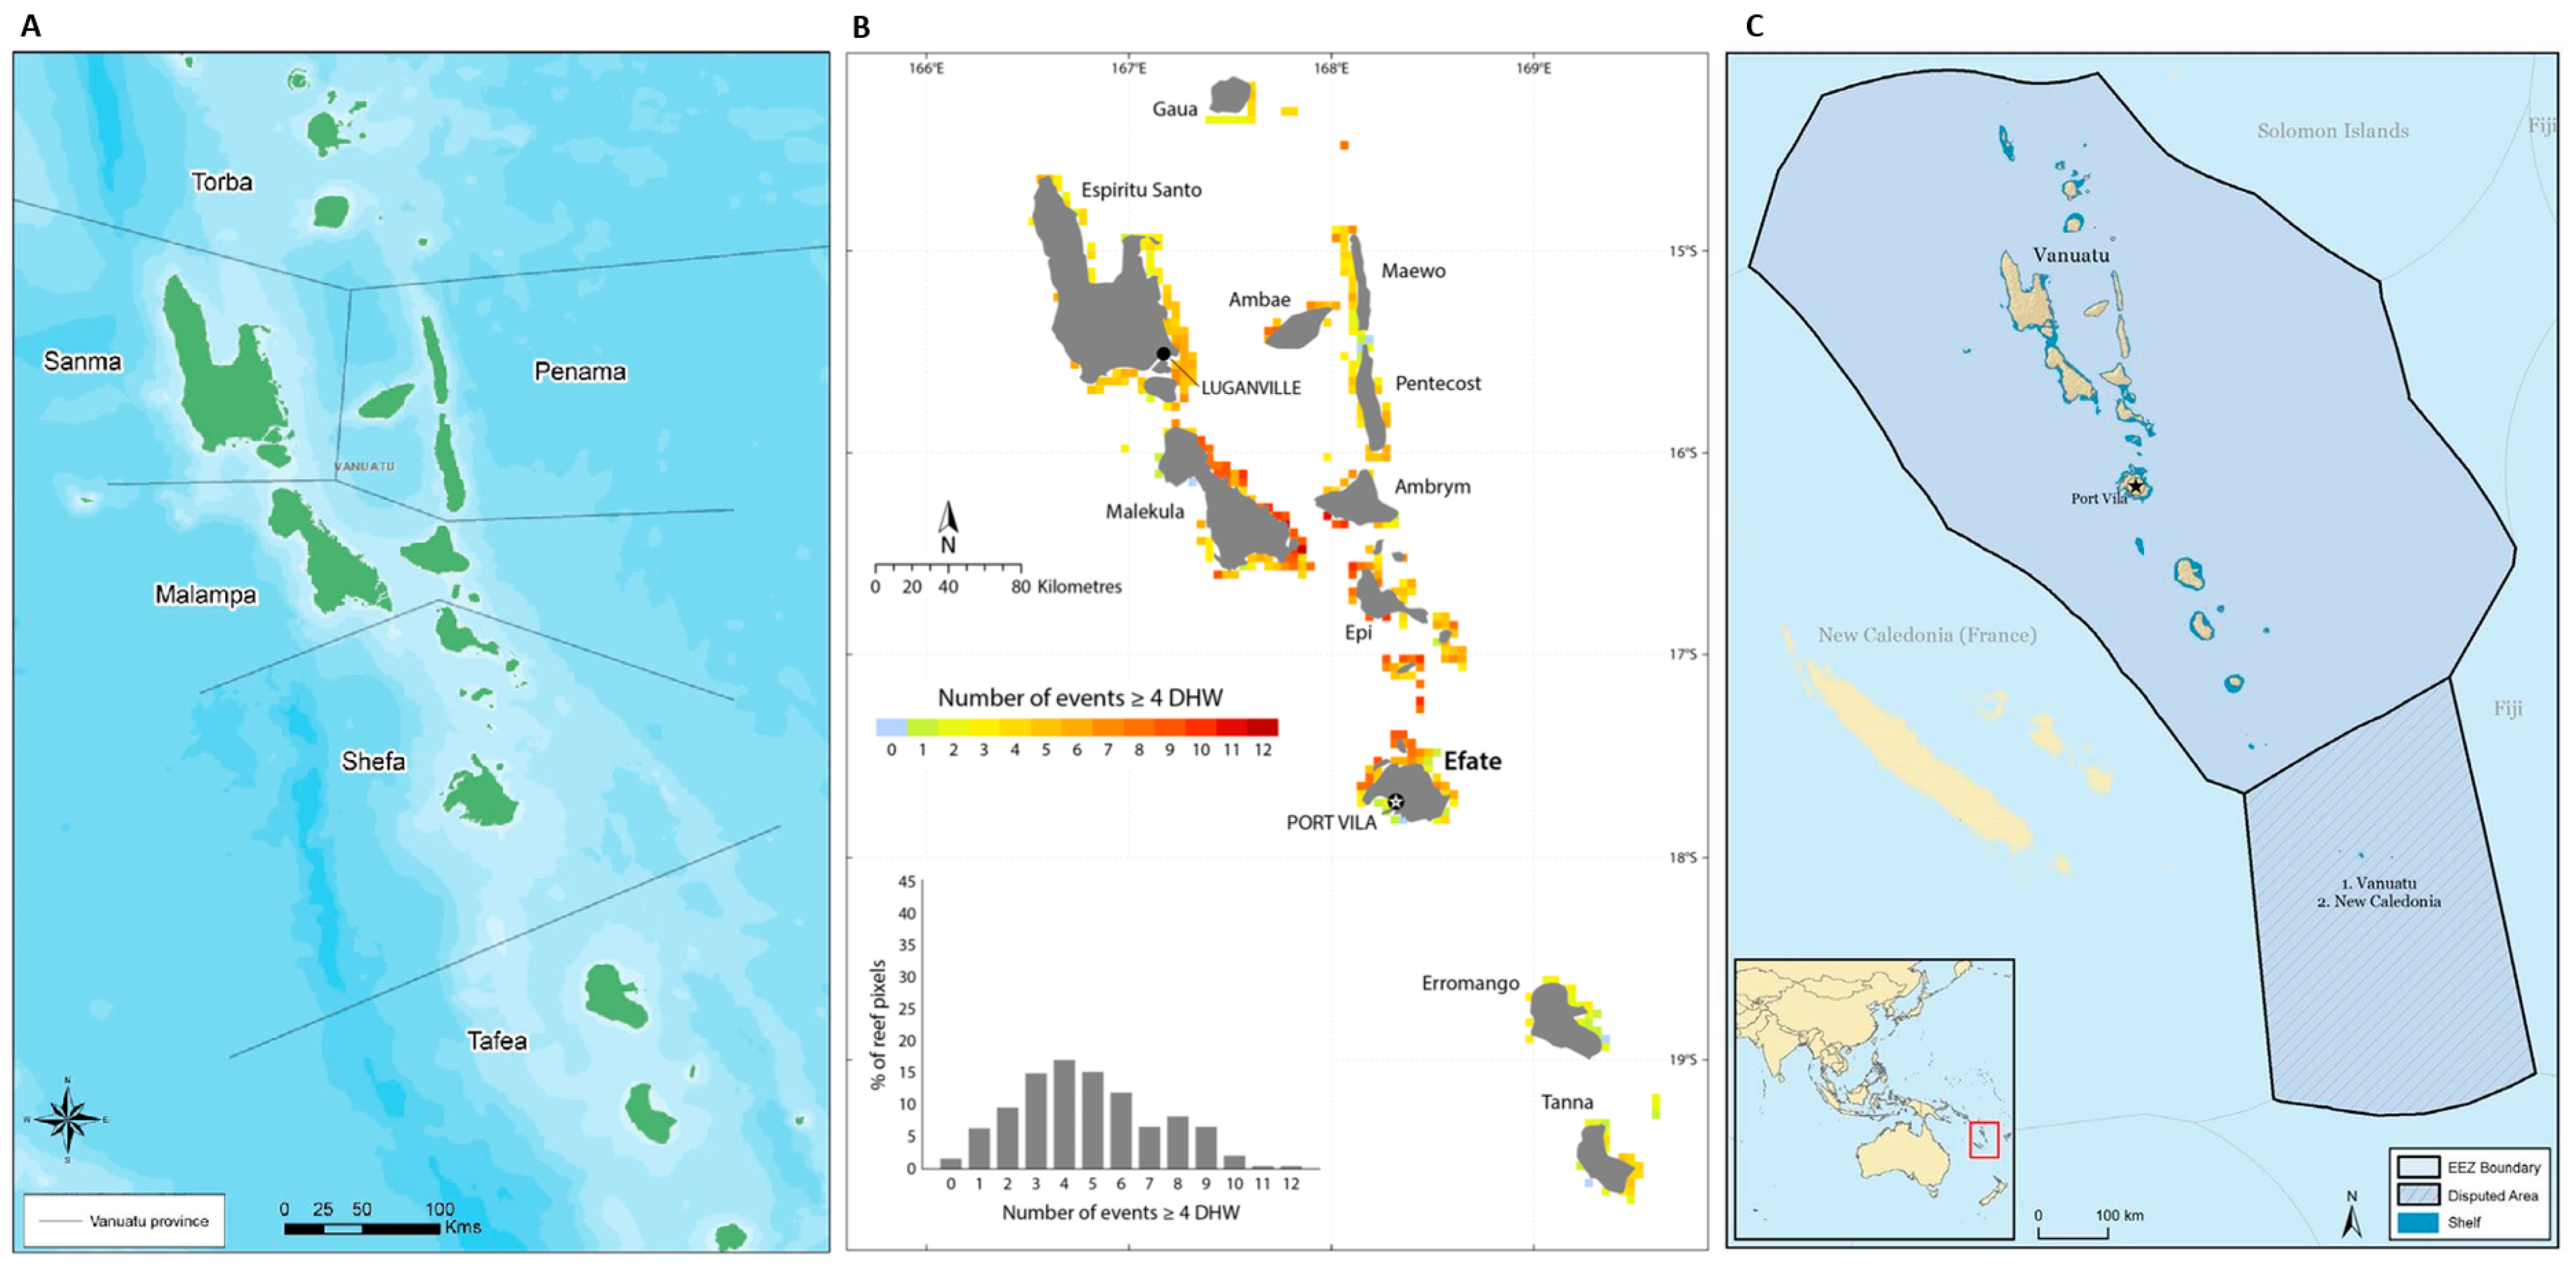
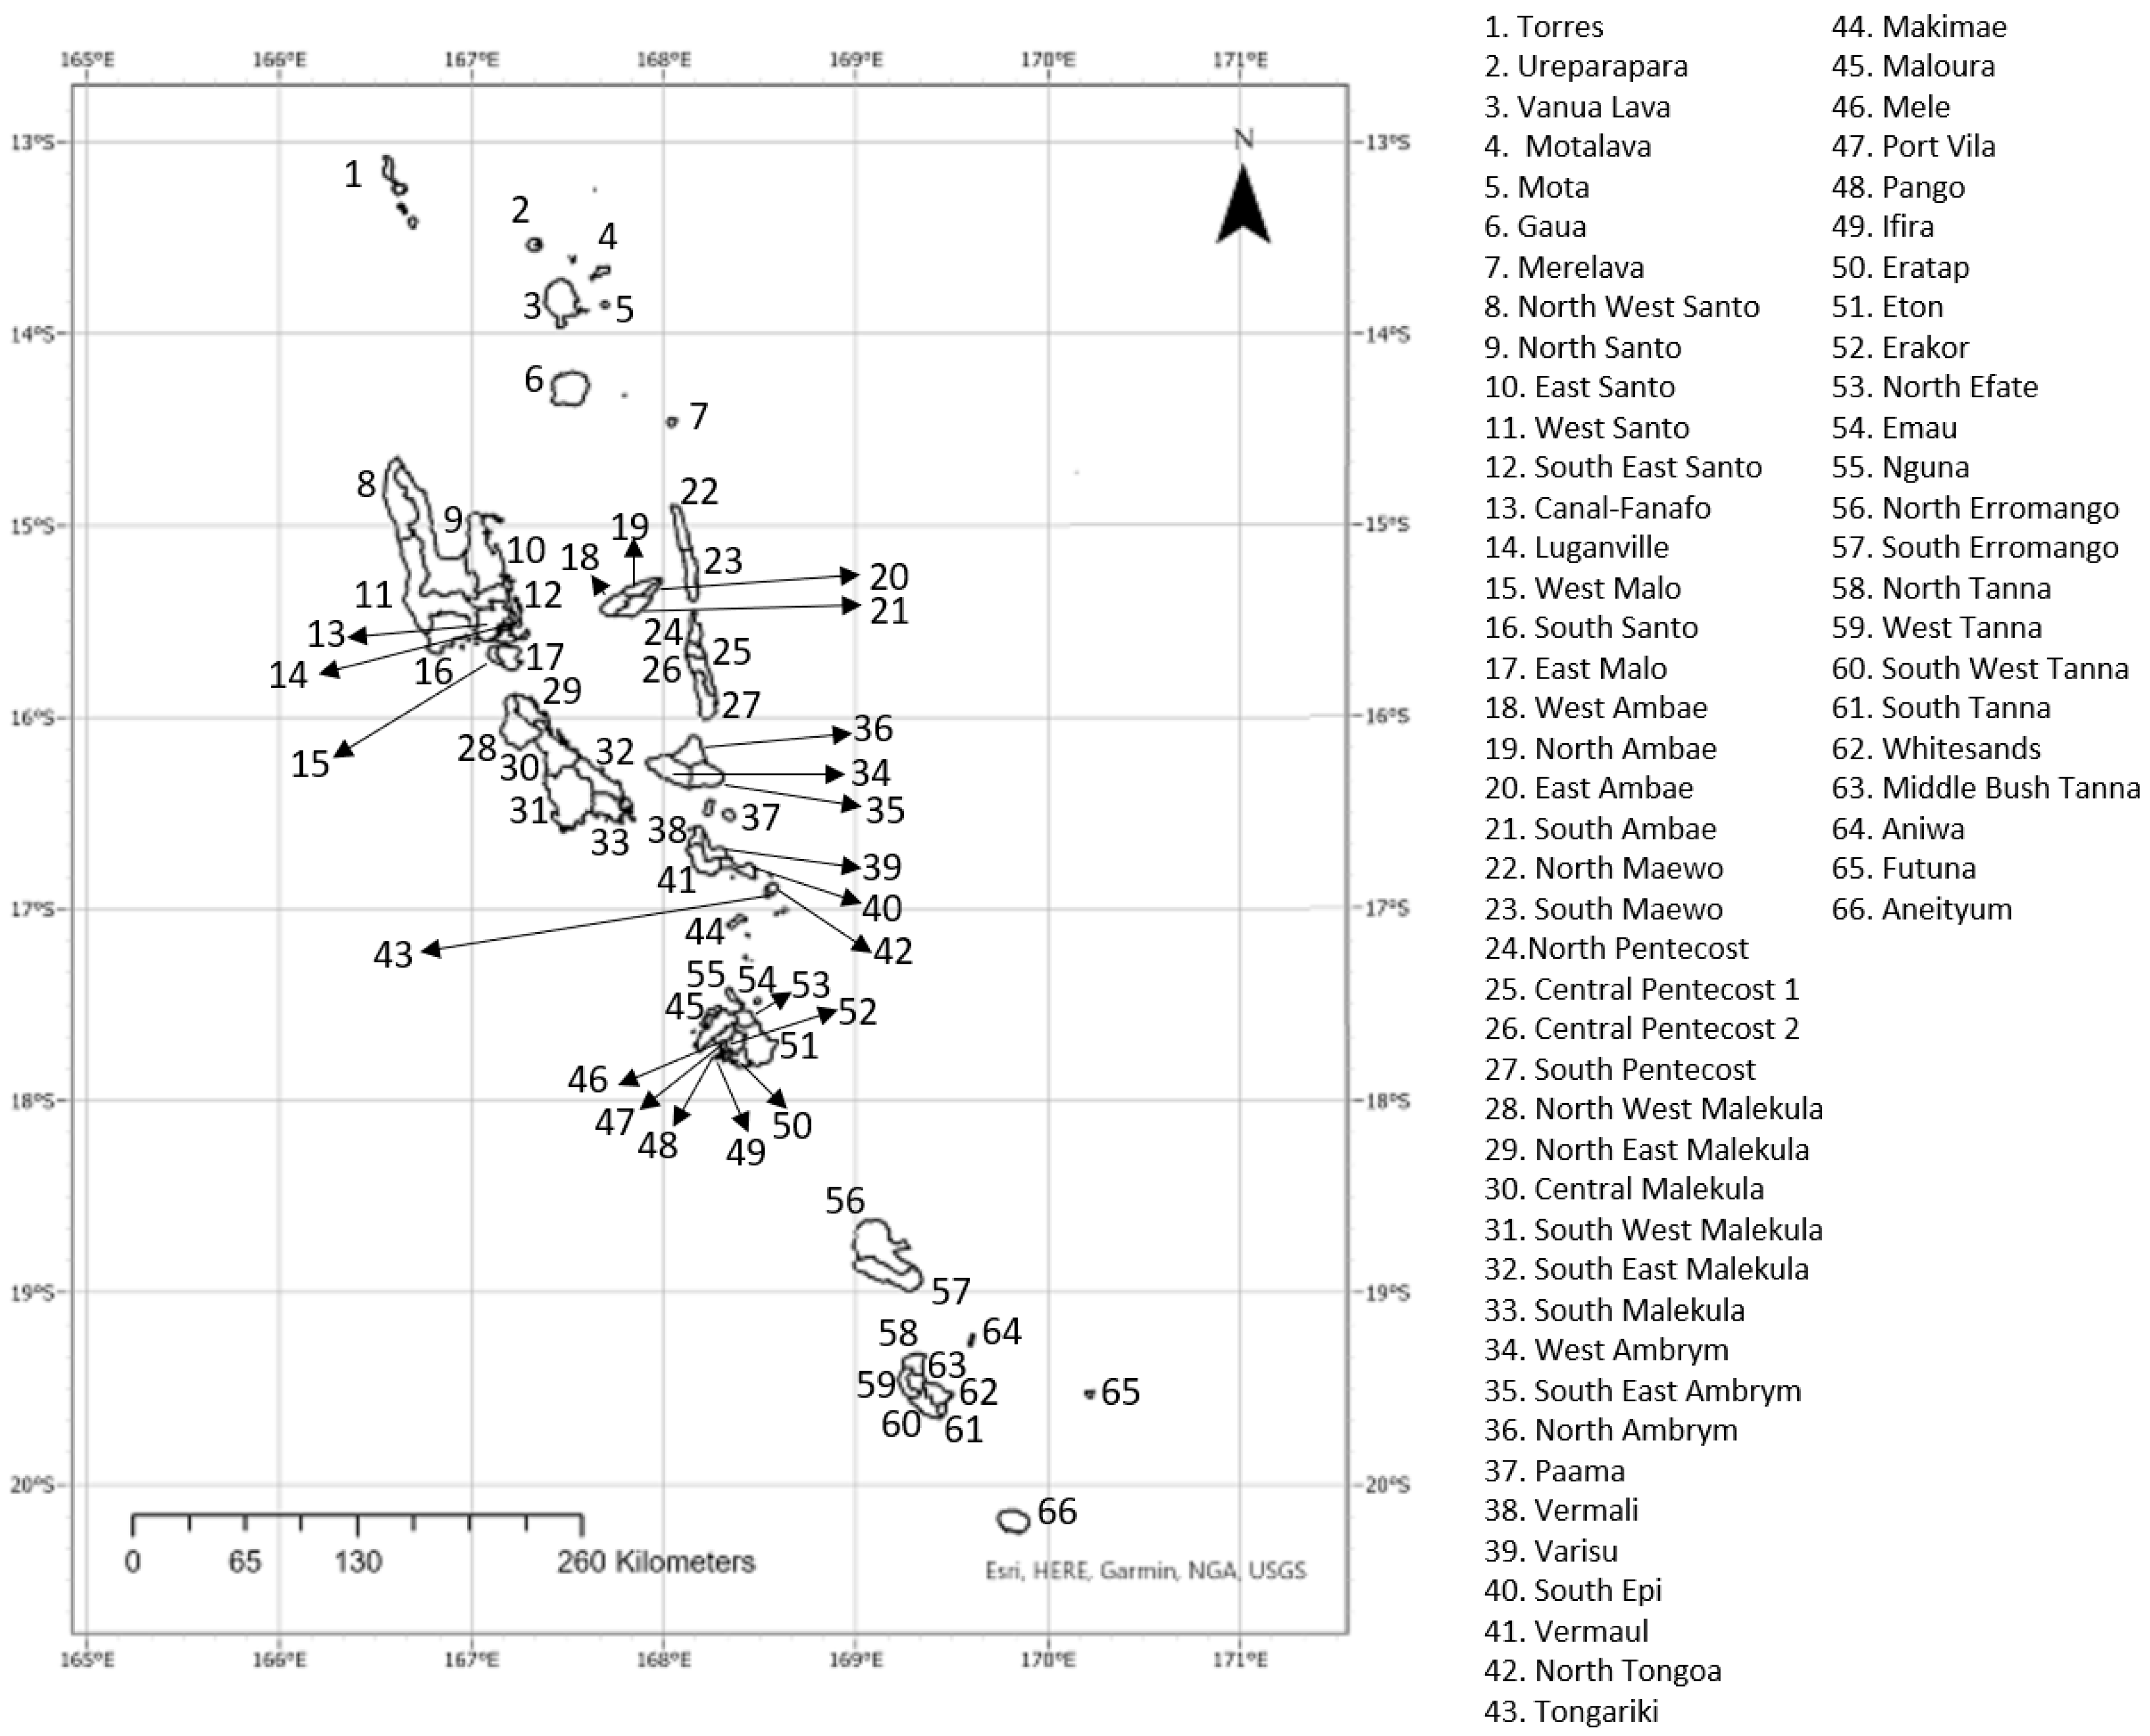
2.1. Study Area
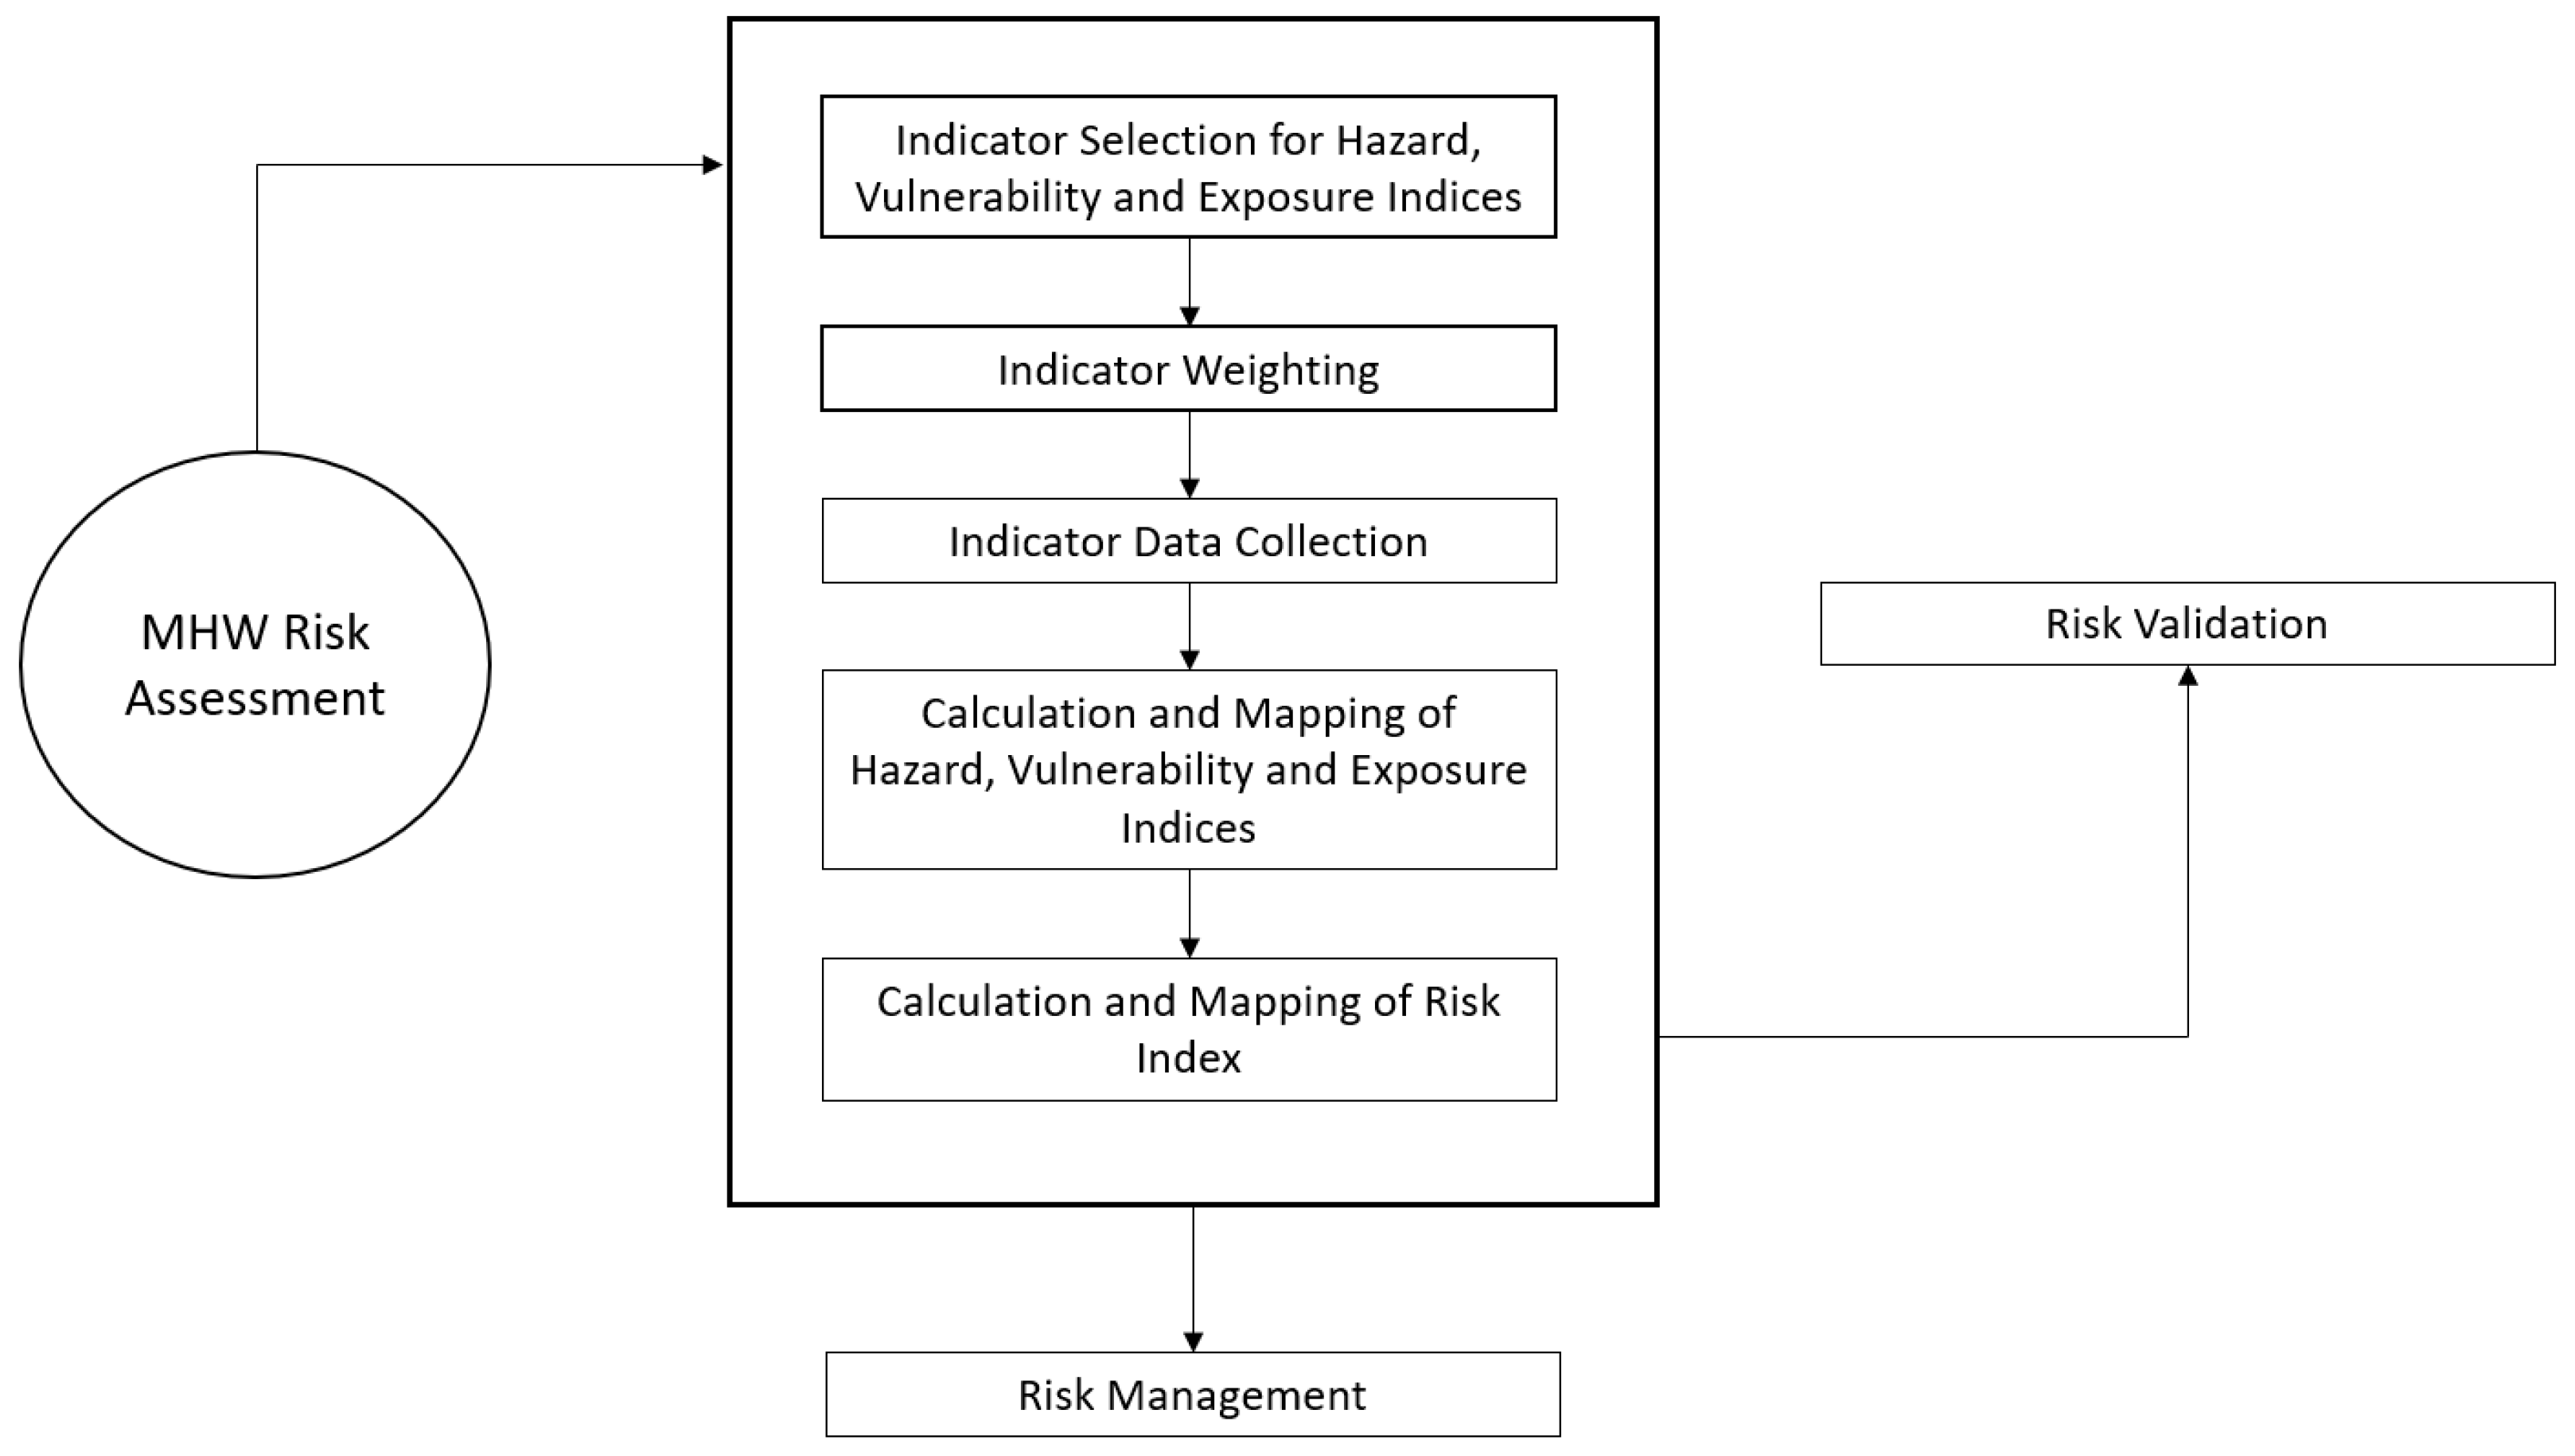
2.2. Study Design
2.2.1. Indicator Data Collection
2.2.2. Calculation and Mapping of Hazard, Vulnerability, and Exposure Indices
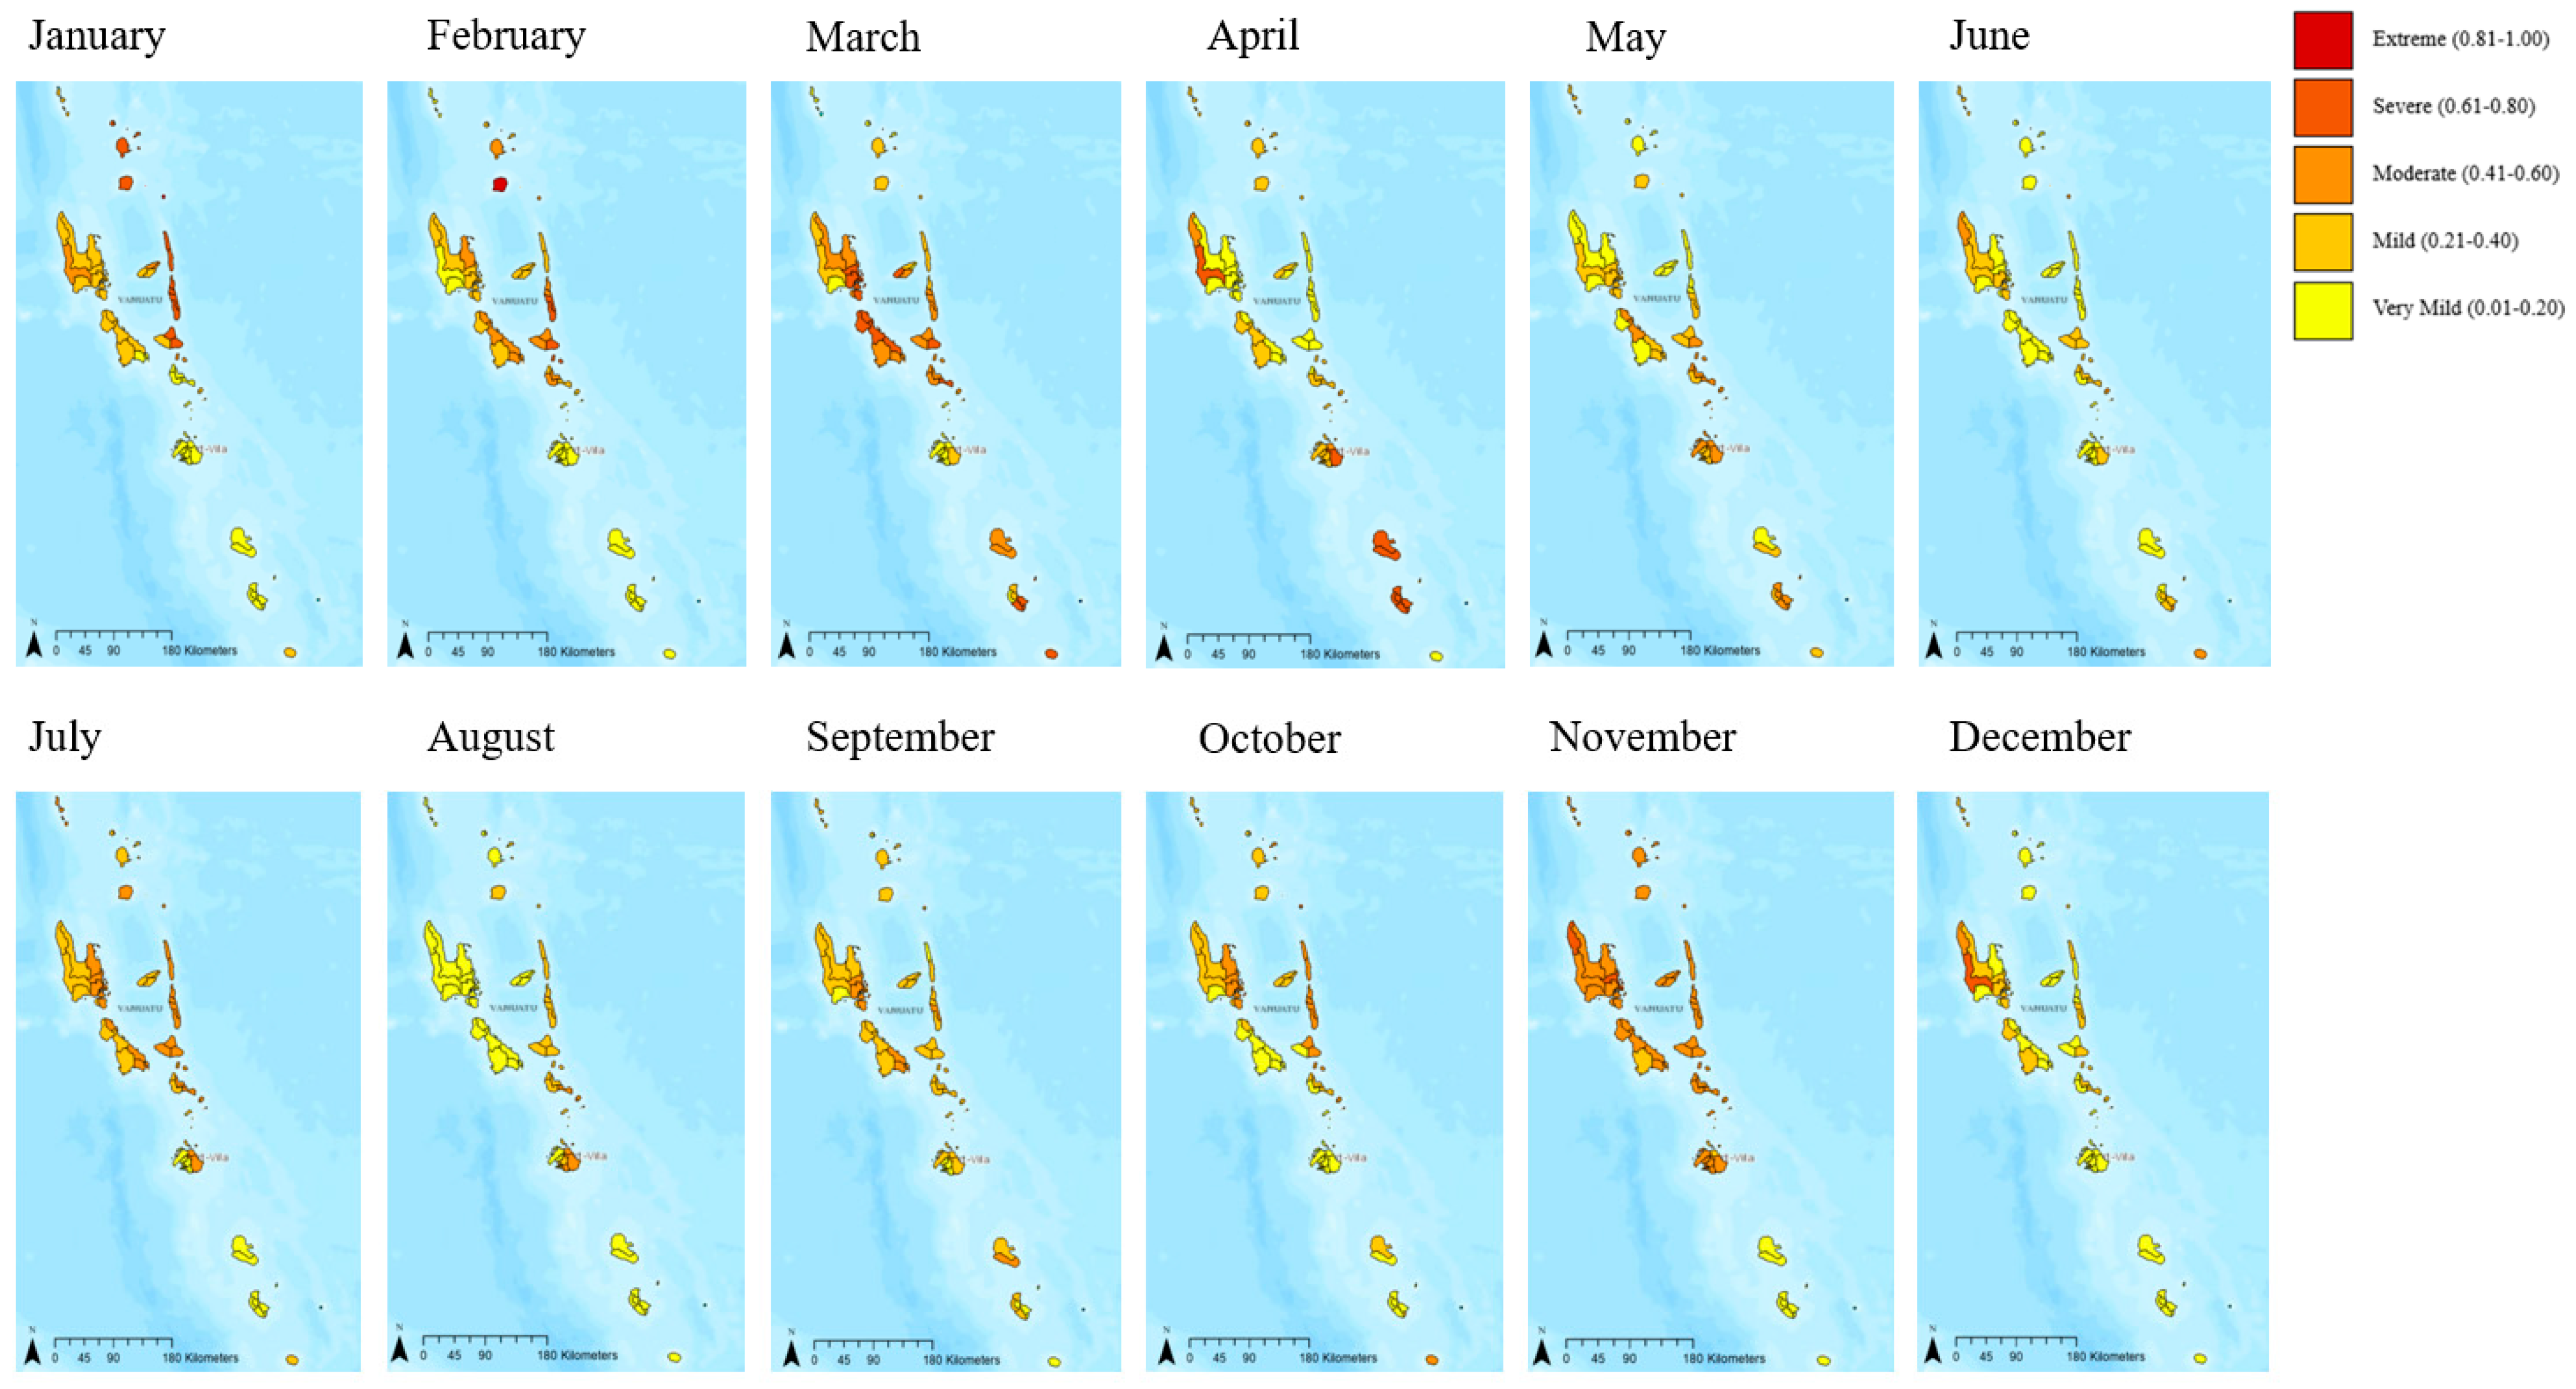
2.2.3. Calculation and Mapping of the MHW Risk Index
- 1.
- Very mild (includes all index values from 0.01–0.20)
- 2.
- Mild (includes all index values from 0.21–0.40)
- 3.
- Moderate (includes all index values from 0.41–0.60)
- 4.
- Severe (includes all index values from 0.61–0.80)
- 5.
- Extreme (includes all index values from 0.81–1.00)
2.2.4. Performance of Sensitivity Analysis
3. Results
3.1. 2015–2017 Case Study Results
3.1.1. Hazard, Vulnerability, and Exposure
3.1.2. Combined Risk
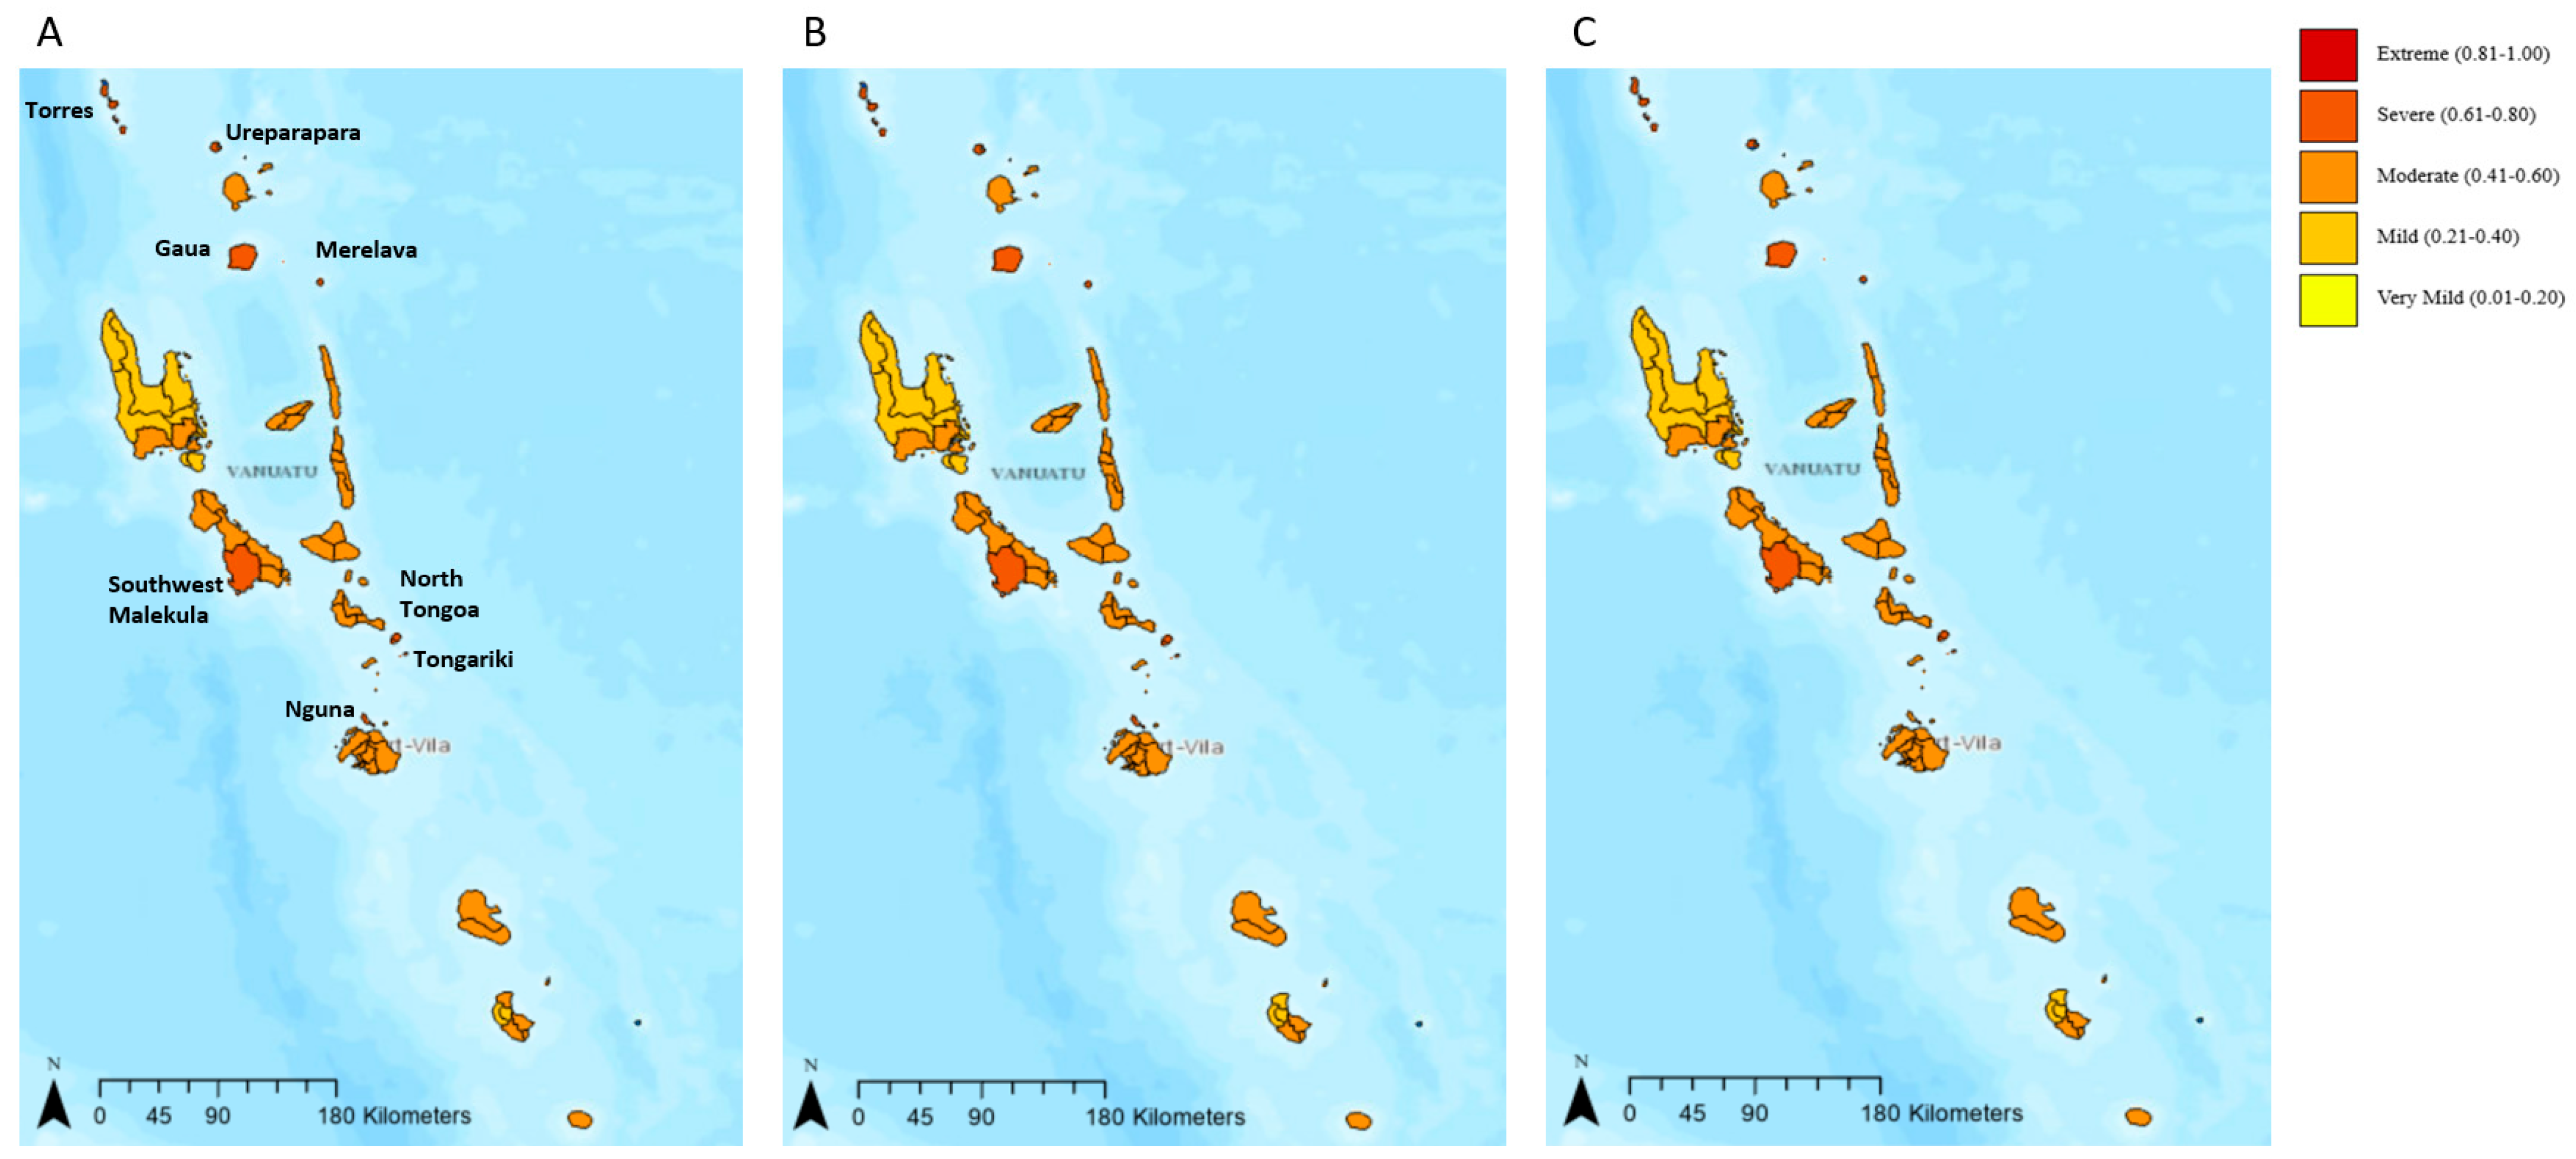
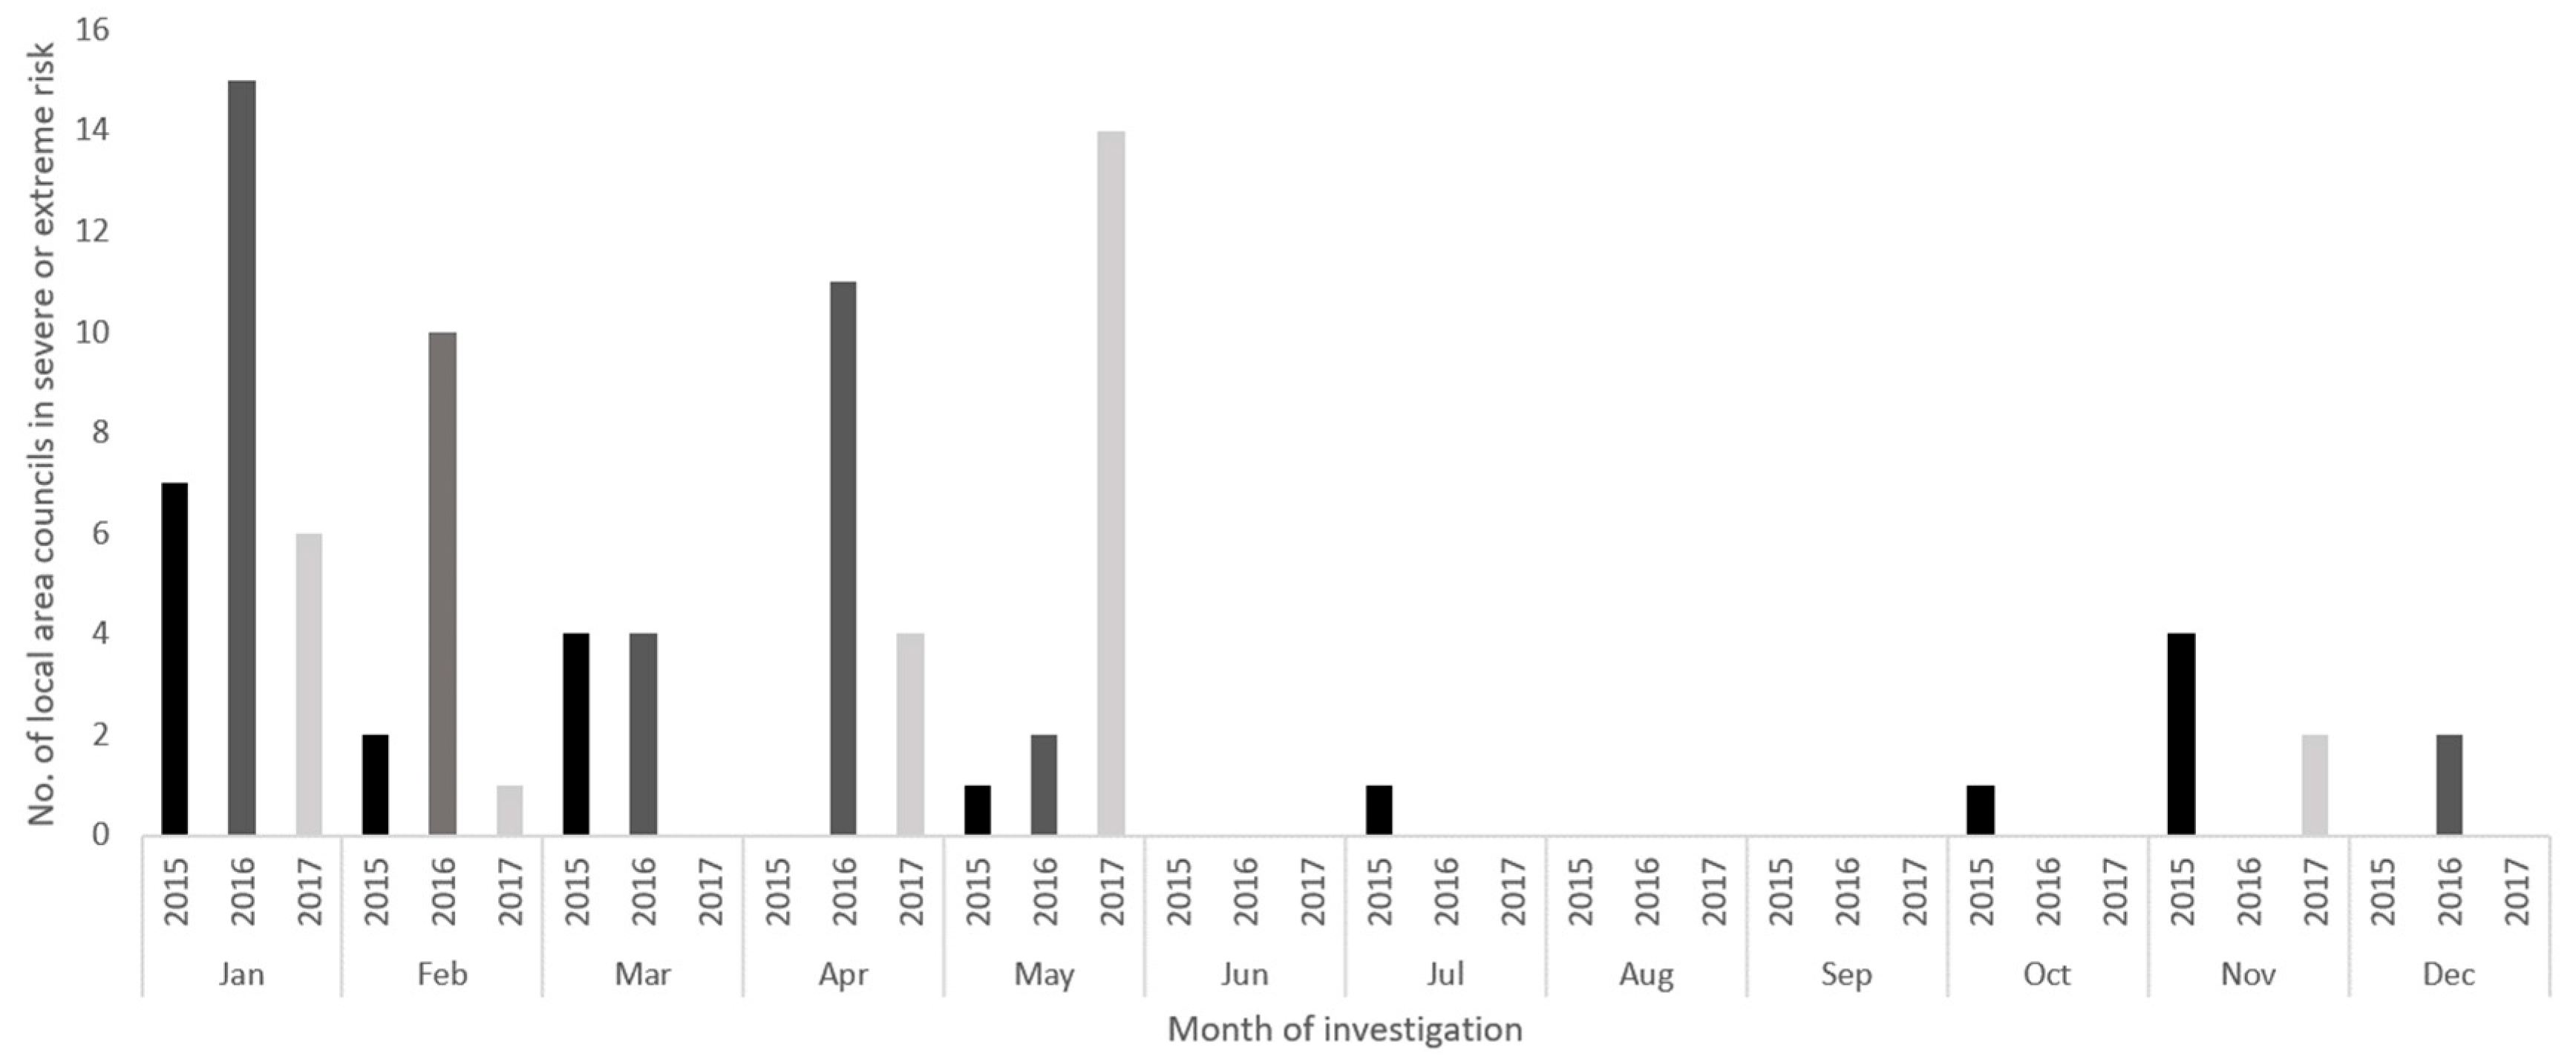
- 11 area councils expressed steadily increasing risk levels.
- One area council (North Maewo) expressed steadily decreasing levels prior to the period of concern in October-November (decreasing from moderate in August to mild in September) and then experienced a sudden spike back up to moderate risk at the beginning of the October–November peak period.
- 14 area councils expressed consistent risk levels, with no change throughout the two months of the neutral period. 11 of these expressed moderate risk throughout the neutral period, which continued throughout the peak period. Two area councils (North Pentecost and Torres) consistently had mild risk levels in the neutral period of August–September but then spiked to moderate levels at the beginning of the October–November period of concern. 1 province (South Maewo) had consistently moderate levels in the neutral period of August–September, but levels jumped to severe risk at the beginning of the period.
3.2. 2020–2022 Case Study Results
3.2.1. Hazard, Vulnerability, and Exposure
3.2.2. Combined Risk
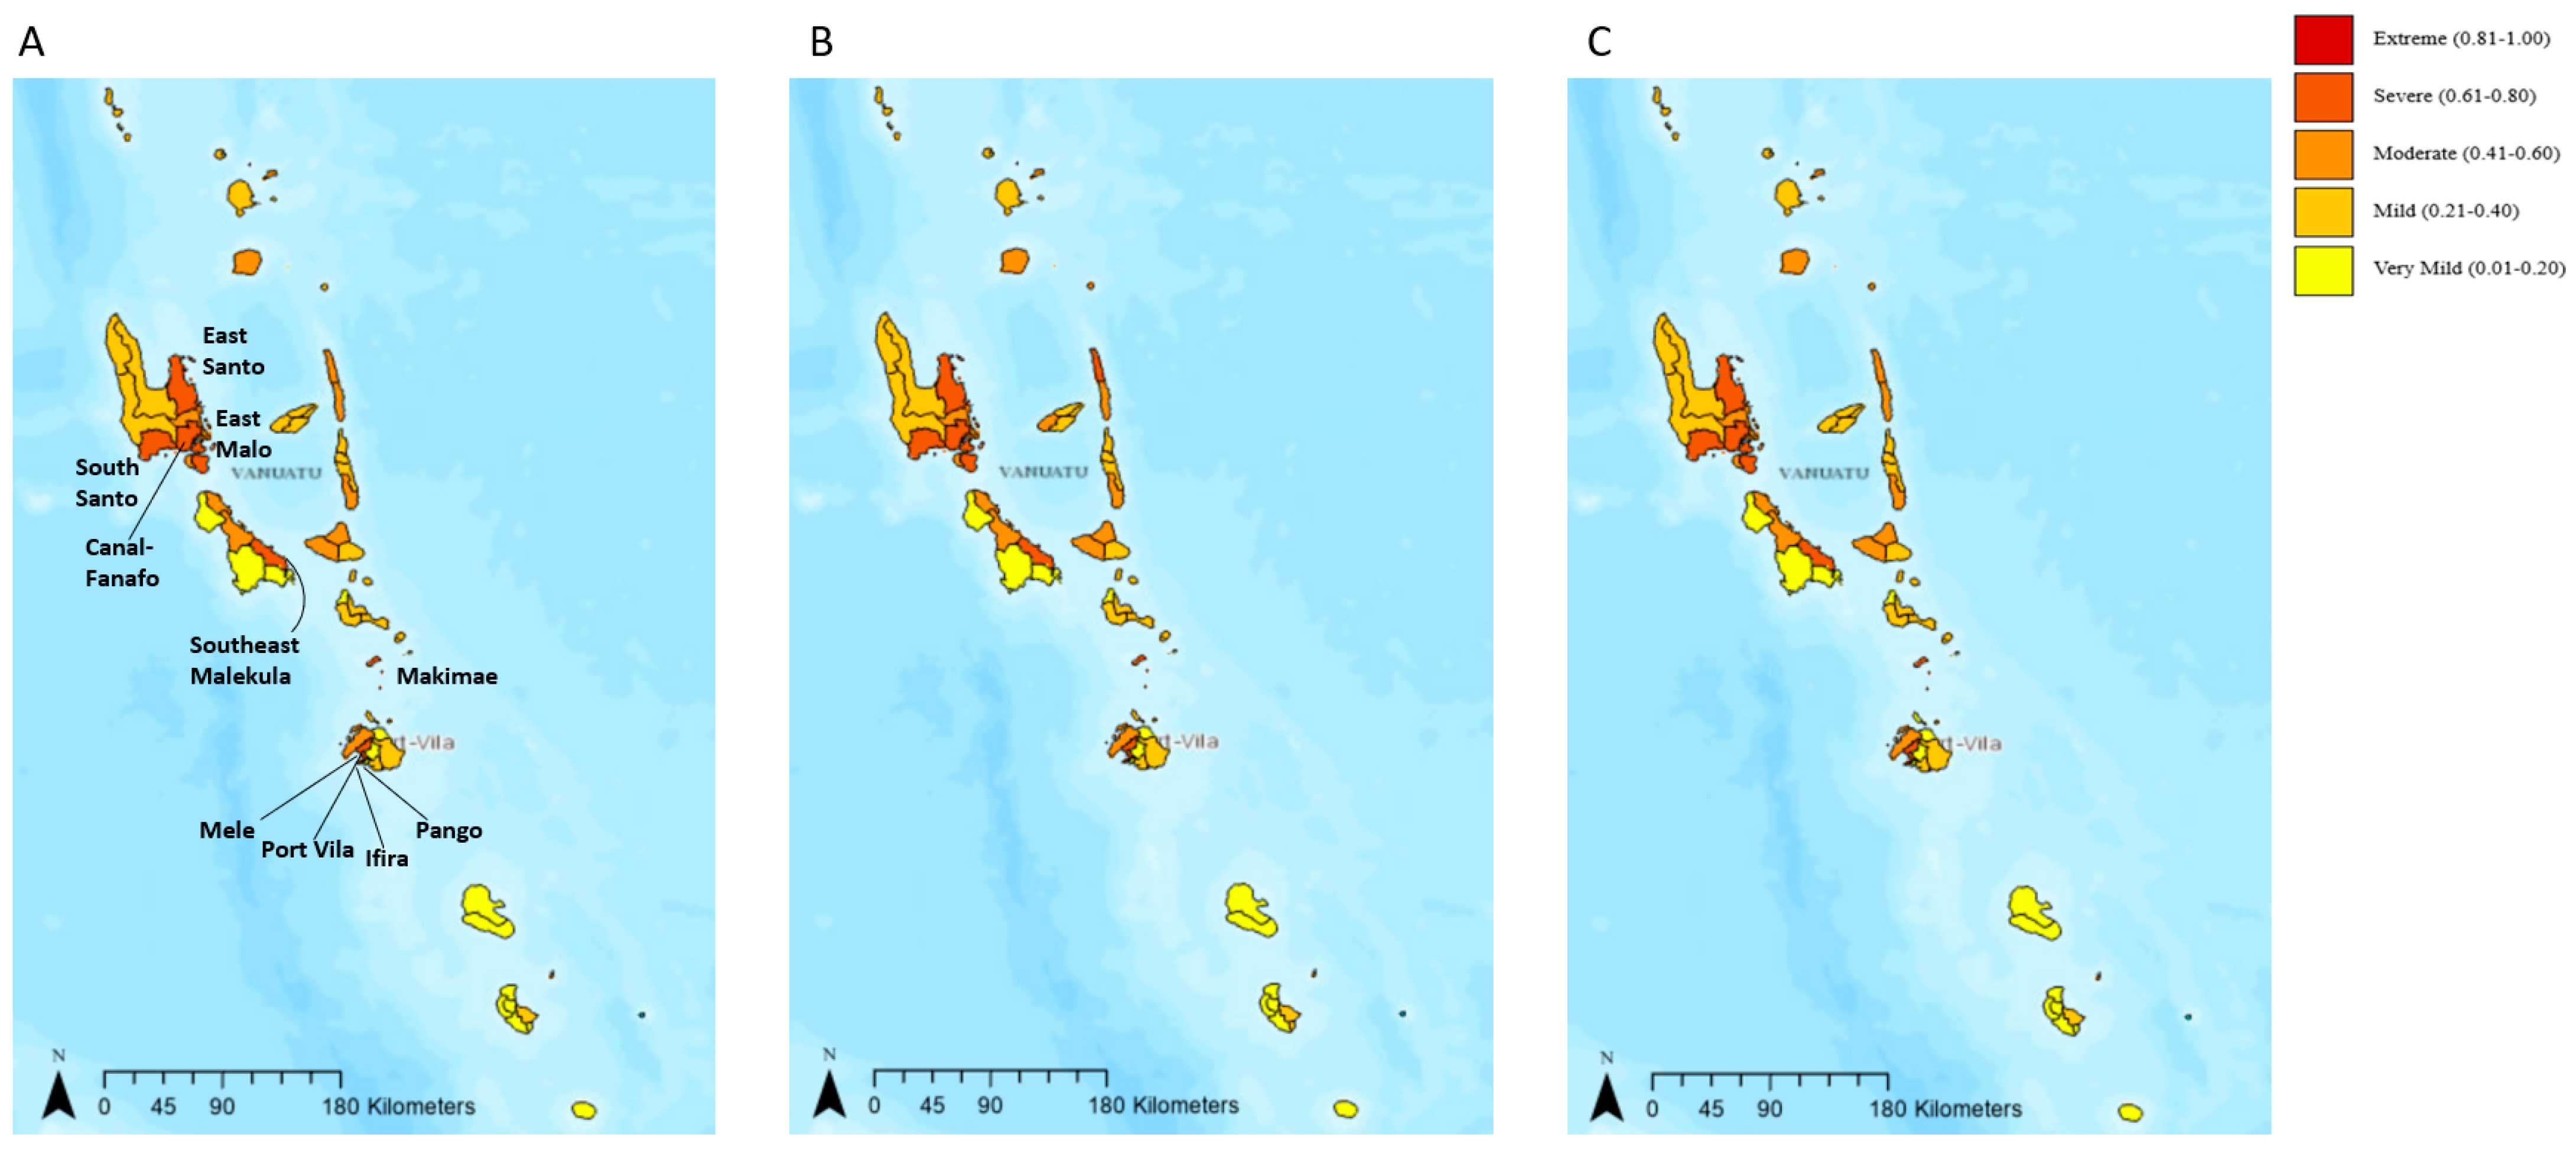
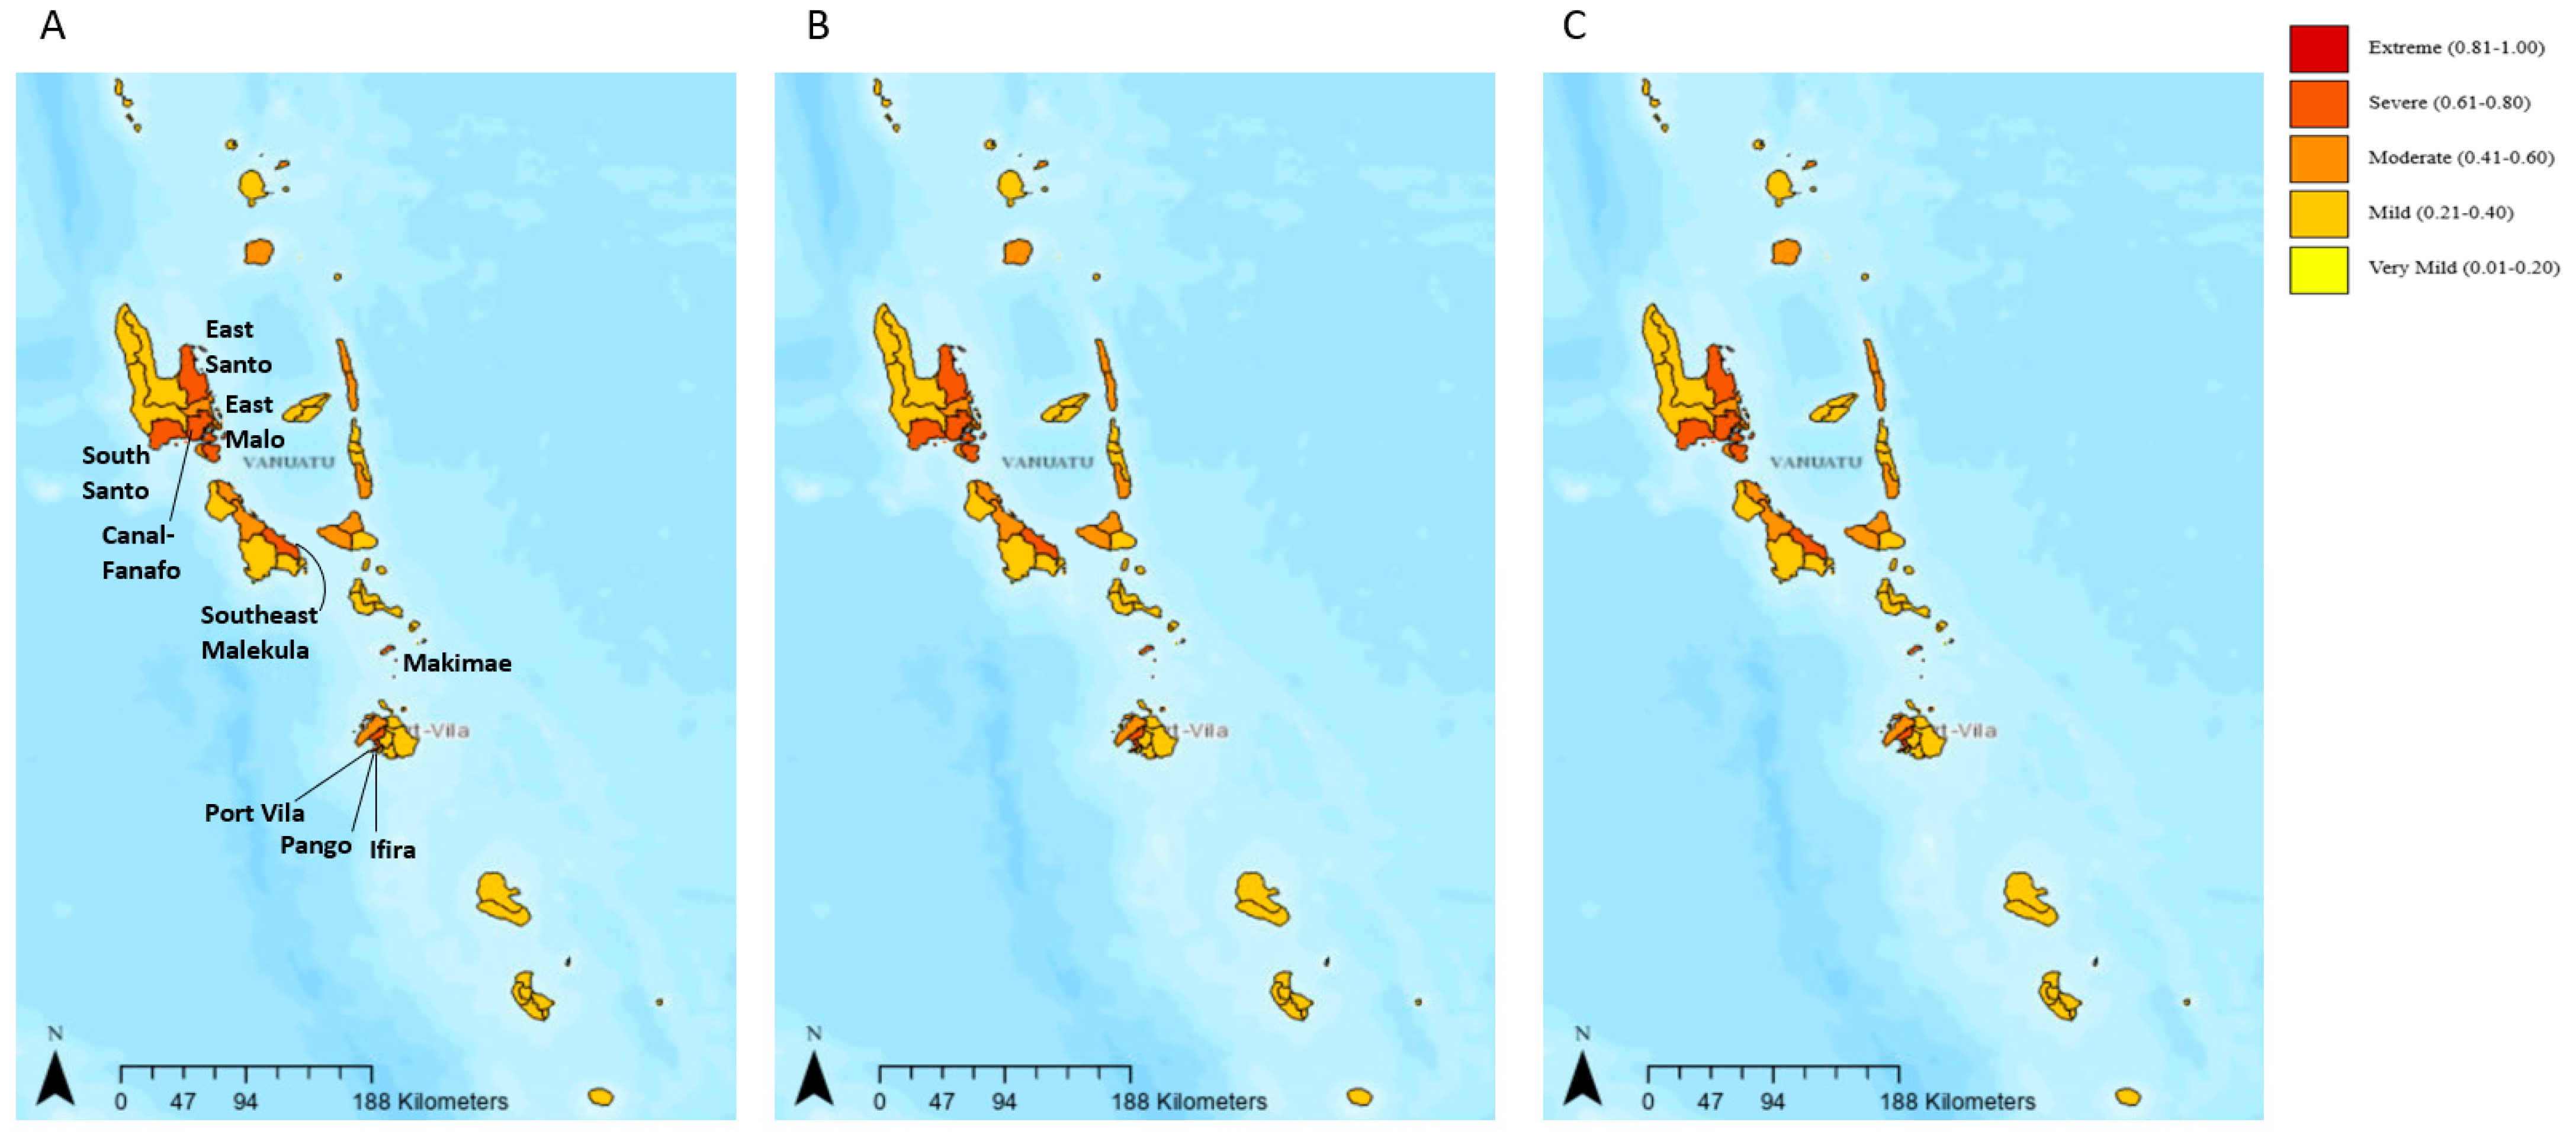
- Some area councils (Ifira, Makimae, Paama, Pango, Port Vila, Southeast Ambrym, Southeast Malekula, South Epi, South Pentecost, South West Malekula, Vermail, Varisu, Vermaul, West Ambrym, and West Malo) displayed a steadily decreasing pattern from the end of the period of concern in January/February 2021 to a specific low point in the neutral period, and then displayed a steady rise from that point to the start of the next peak period in November 2021.
- Some area councils (Erakor, Eton, and South Erromango) displayed steadily decreasing levels from the end of the January/February 2021 period of concern, reaching a low point in October 2021, with a sudden spike occurring to higher levels in November/December 2021, in which the next peak period commenced.
- All other area councils displayed a more random pattern throughout the neutral period, with rising and falling levels observed at many stages throughout March to October 2021.
- Emau jumped from mild risk in October to moderate risk in November, and then spiked rapidly again to reach severe risk in December.
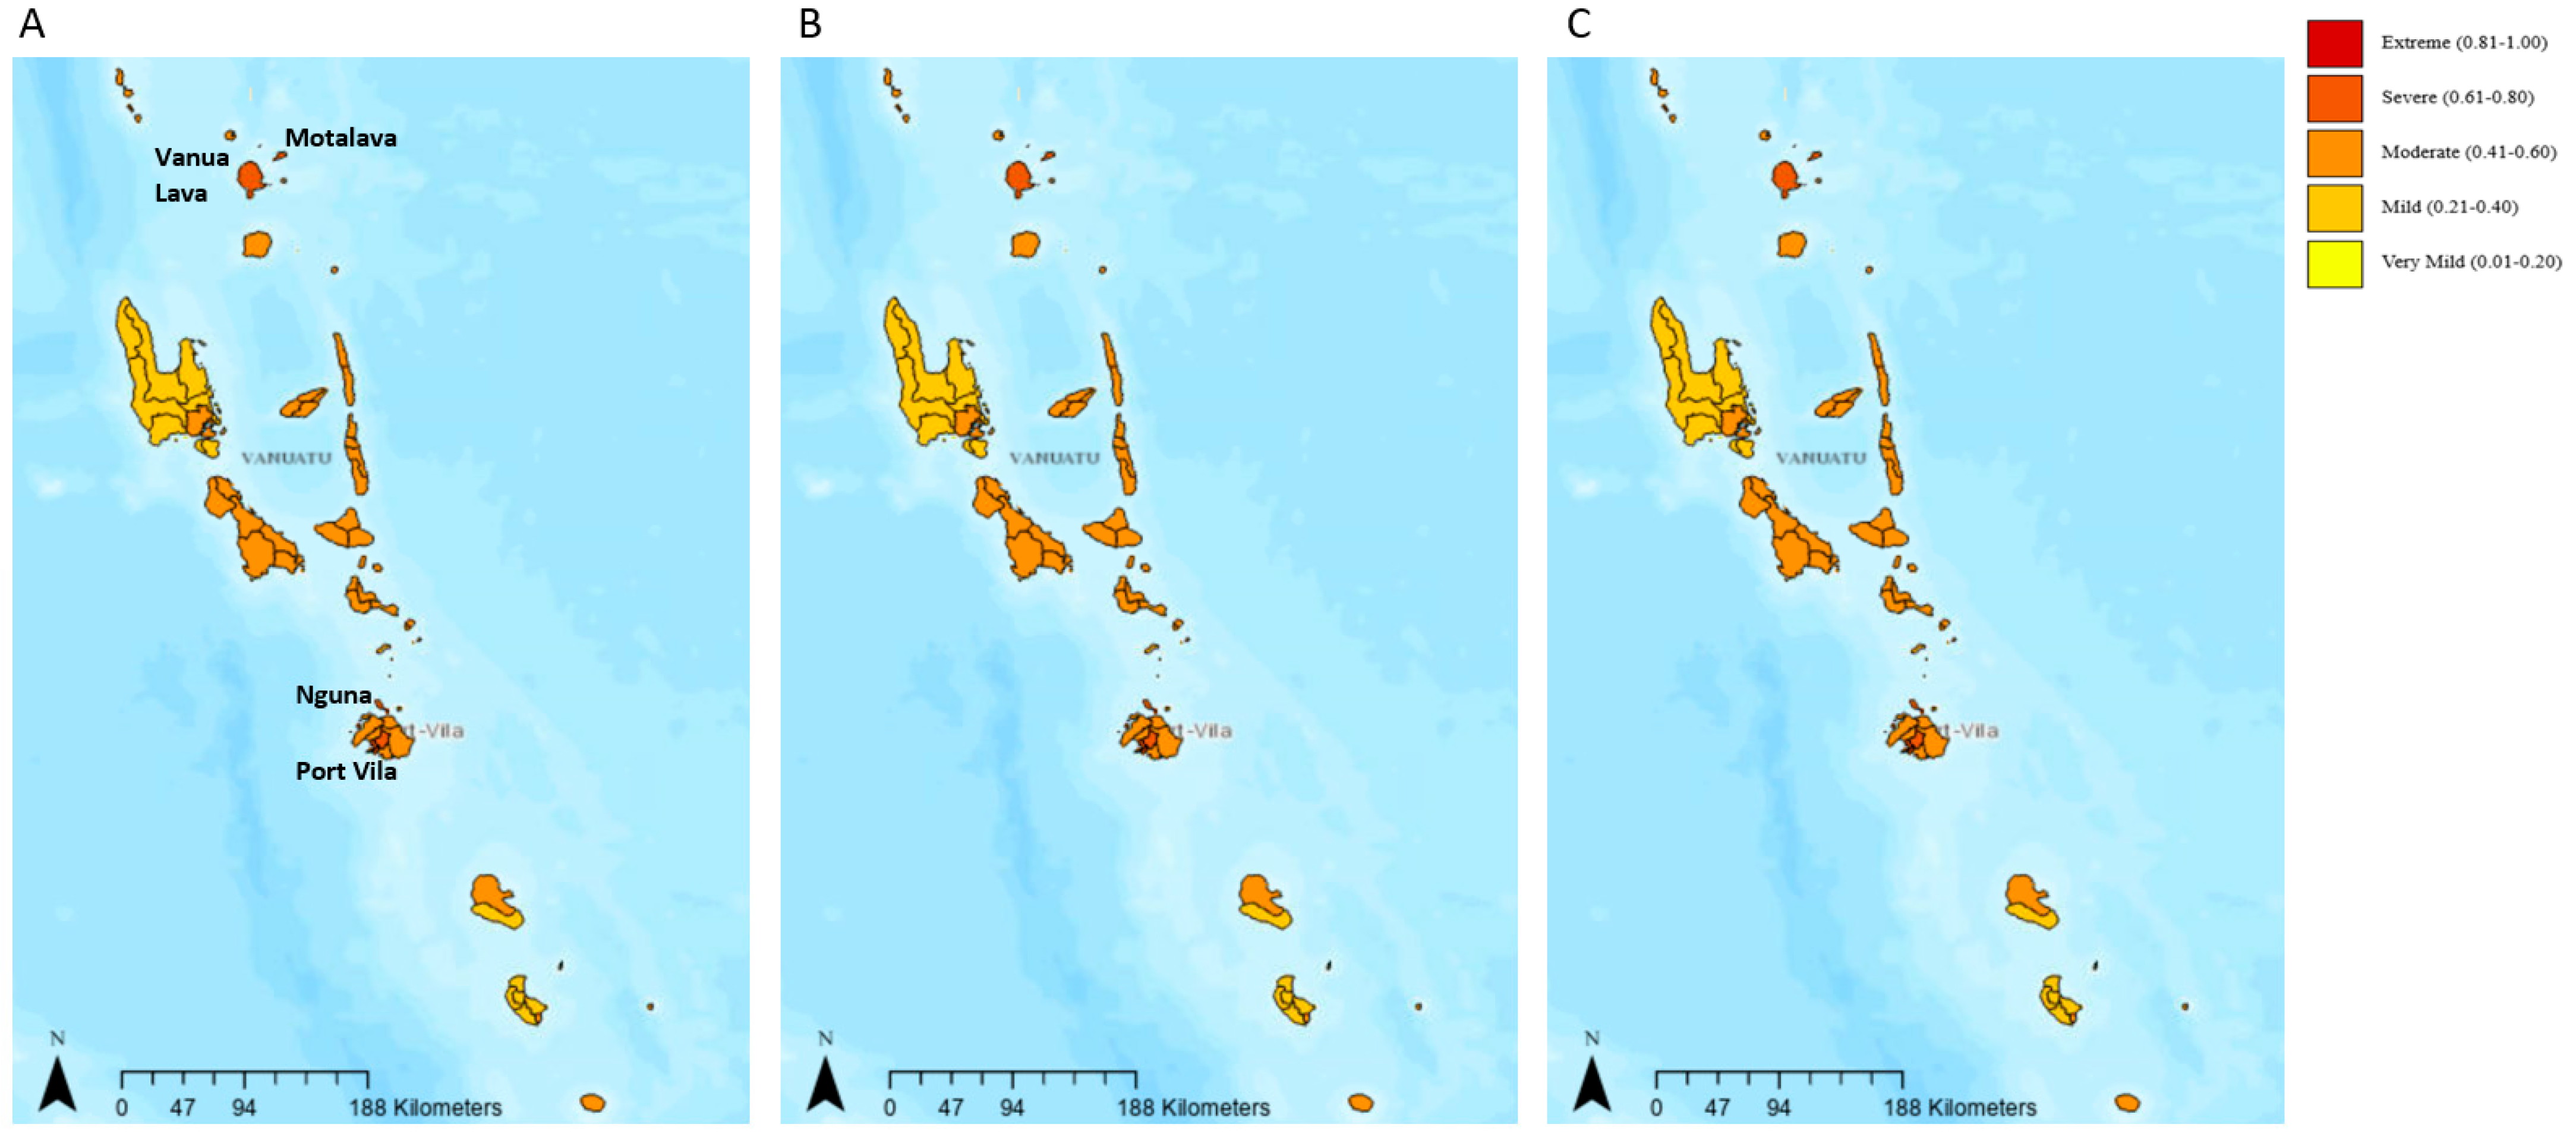
- Ifira rapidly escalated from a mild risk in October to a severe risk in November.
- Mele rapidly escalated from a very mild risk in October to a severe risk in November.
- Nguna jumped from very a mild risk in October to a moderate risk in November.
- Pango jumped from mild risk in October to severe risk in November.
- Port Vila rapidly escalated from a very mild risk in October to a severe in November.
3.3. Sensitivity Analysis
4. Discussion
4.1. Time Periods of Concern, as Indicated by the Risk Assessment
4.2. Areas of Concern as Indicated by the Risk Assessment
4.3. Credibility of Risk Assessment Indicators
4.4. Methodological Limitations and Advances
4.5. Implications for the Future
5. Conclusions
Author Contributions
Funding
Data Availability Statement
Acknowledgments
Conflicts of Interest
Appendix A
| SST Indicator | Hazard Index |
|---|---|
| original | 0.719 |
| 0.1 | 0.309 |
| 0.2 | 0.359 |
| 0.3 | 0.409 |
| 0.4 | 0.459 |
| 0.5 | 0.509 |
| 0.6 | 0.559 |
| 0.7 | 0.609 |
| 0.8 | 0.659 |
| 0.9 | 0.709 |
| 1 | 0.759 |
Appendix B
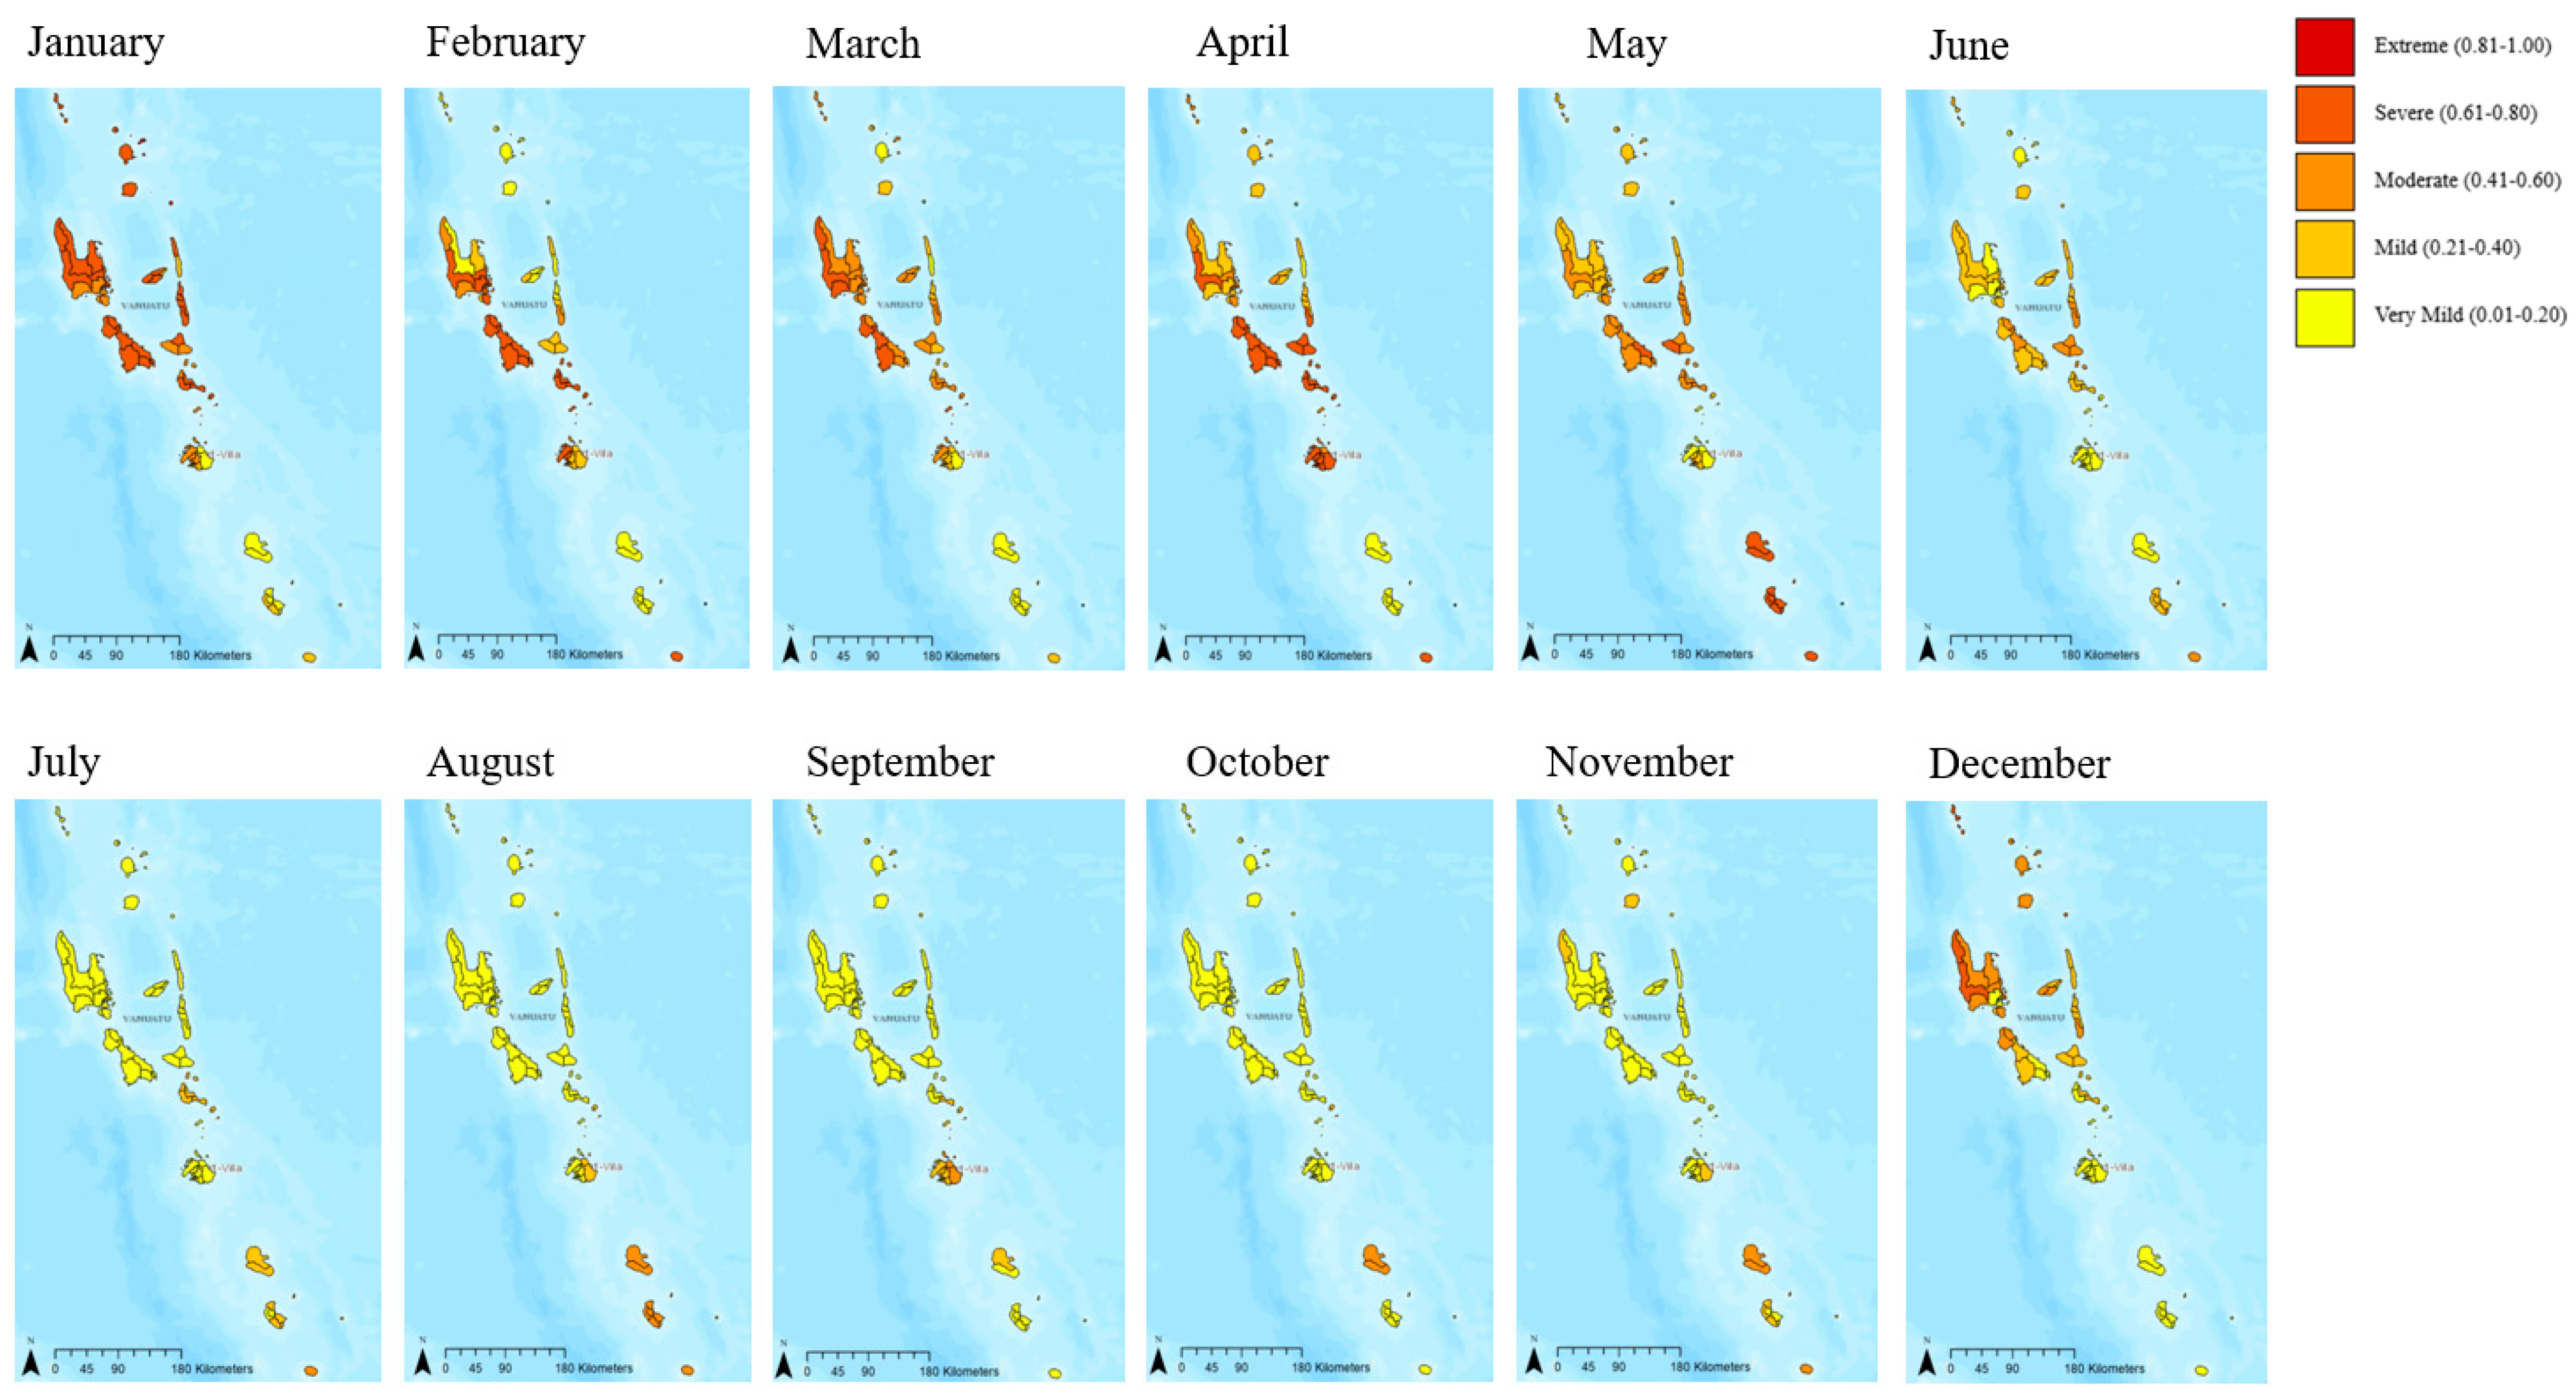
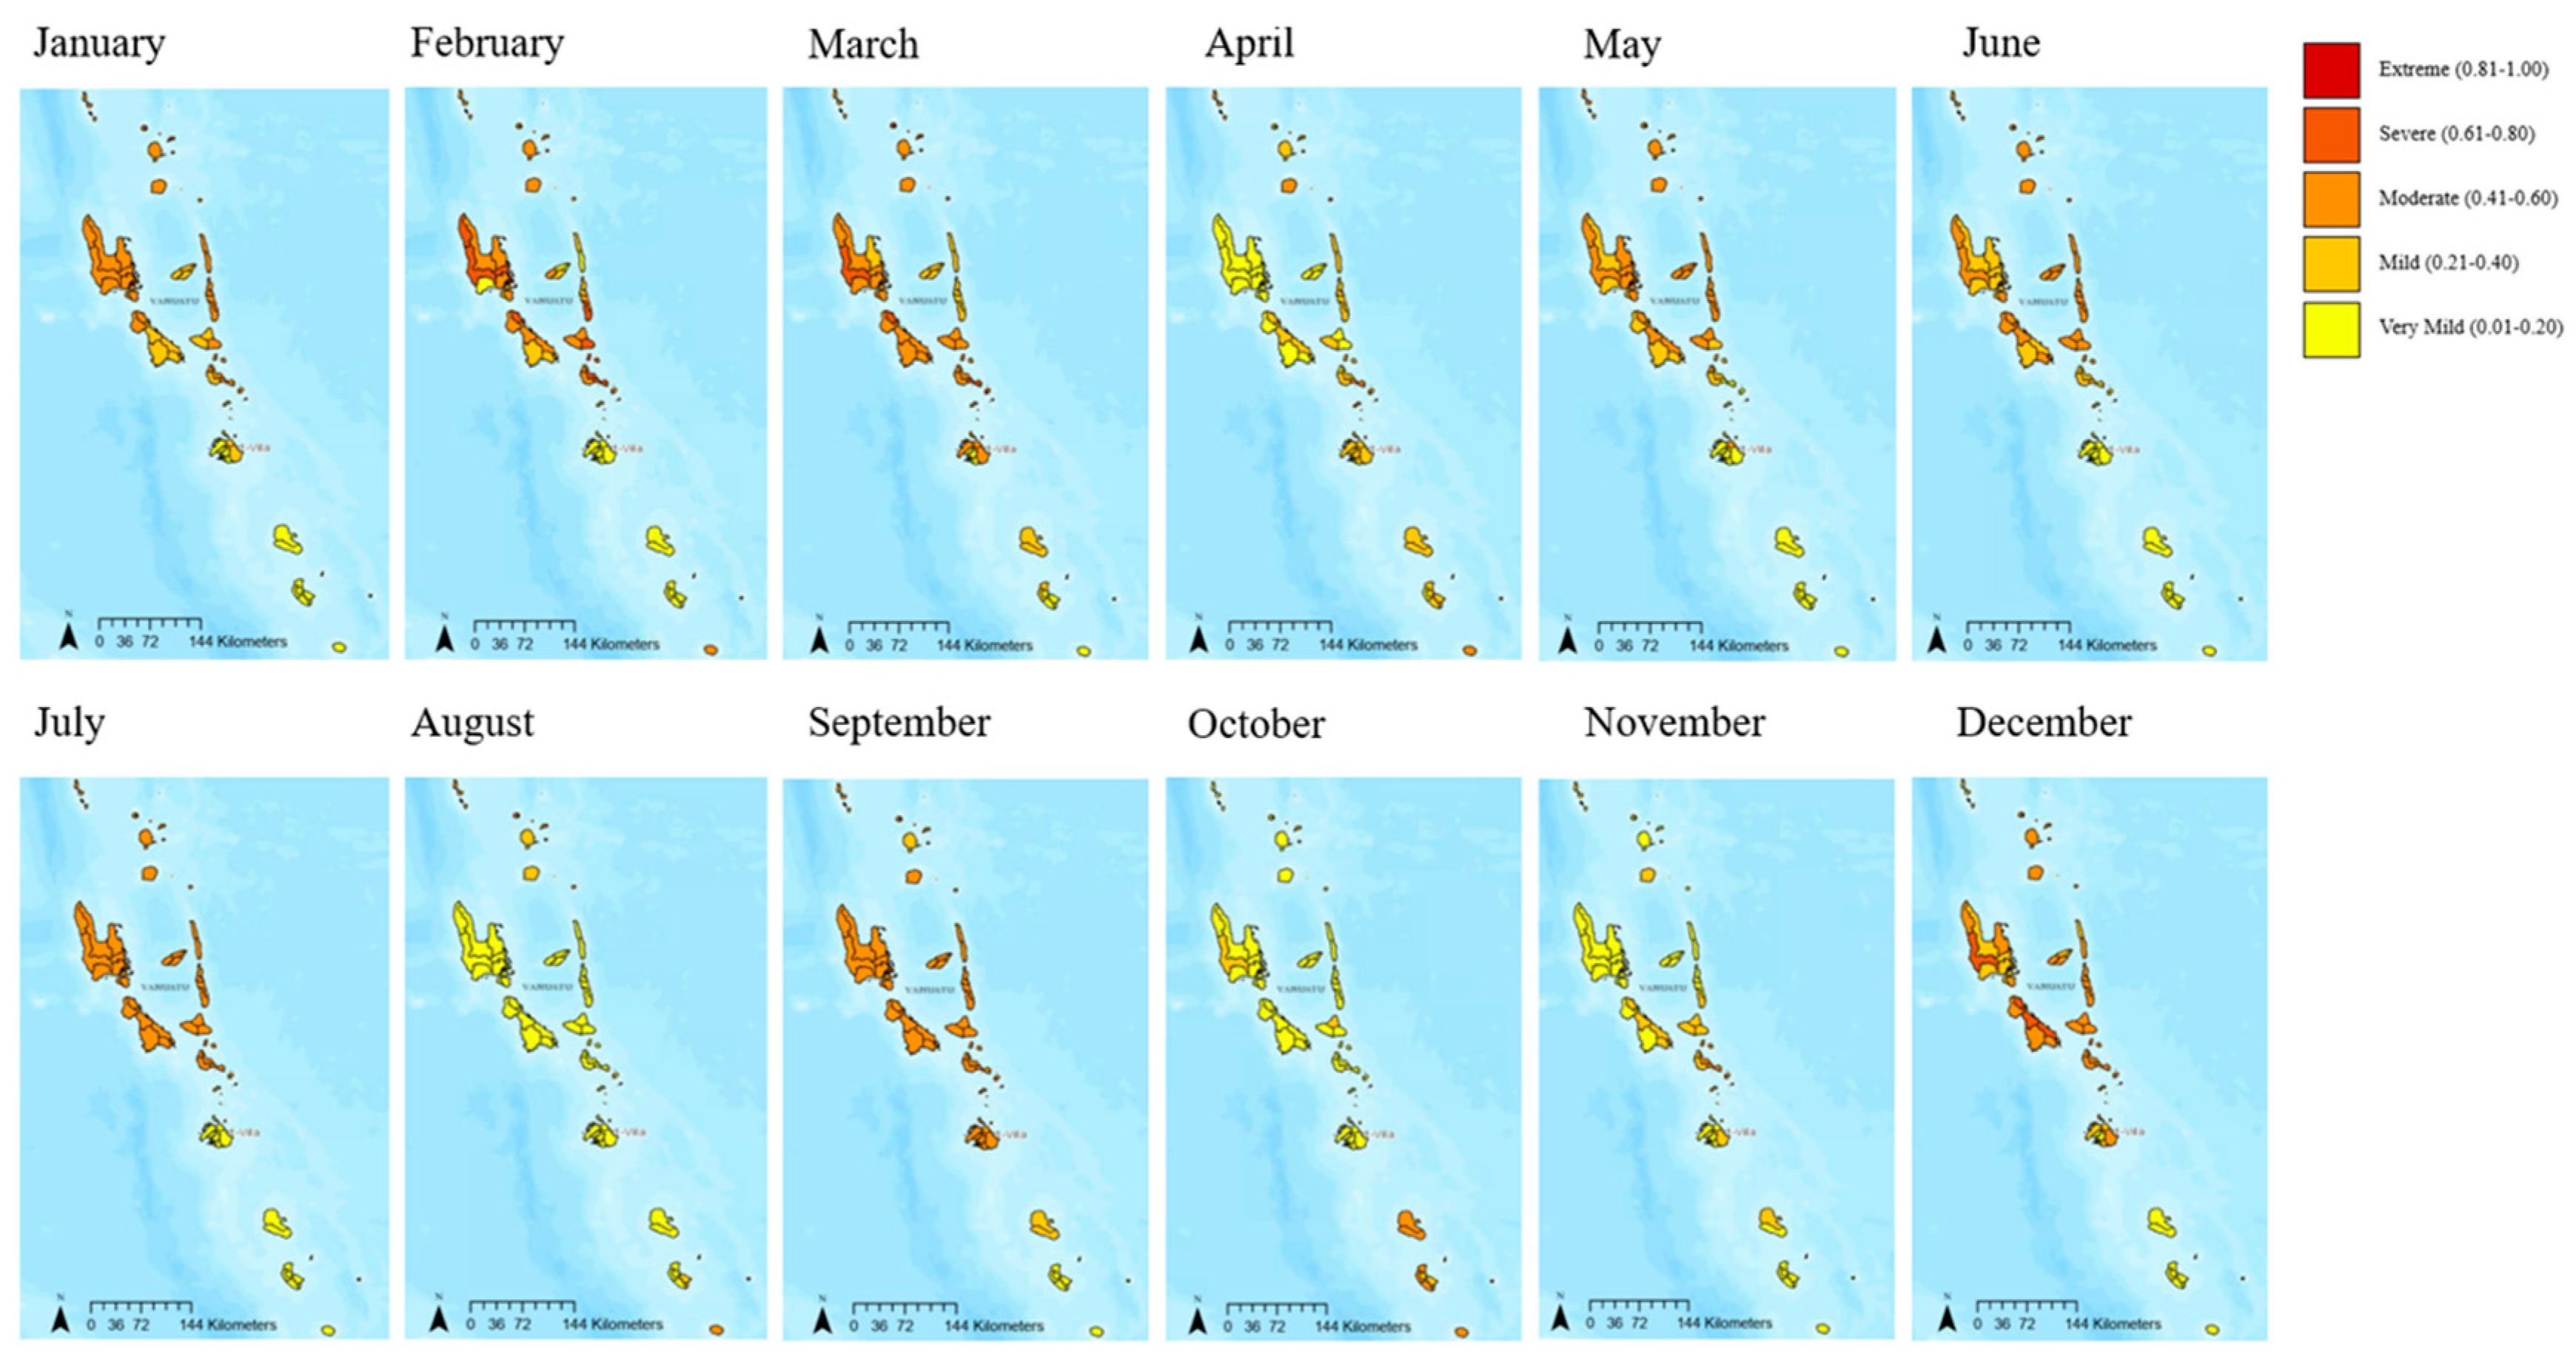
 , Severe (0.61–0.80)
  , Moderate (0.41–0.60)
  , Mild (0.21–0.40)
  , and Very Mild (0.01–0.20)
  .
.
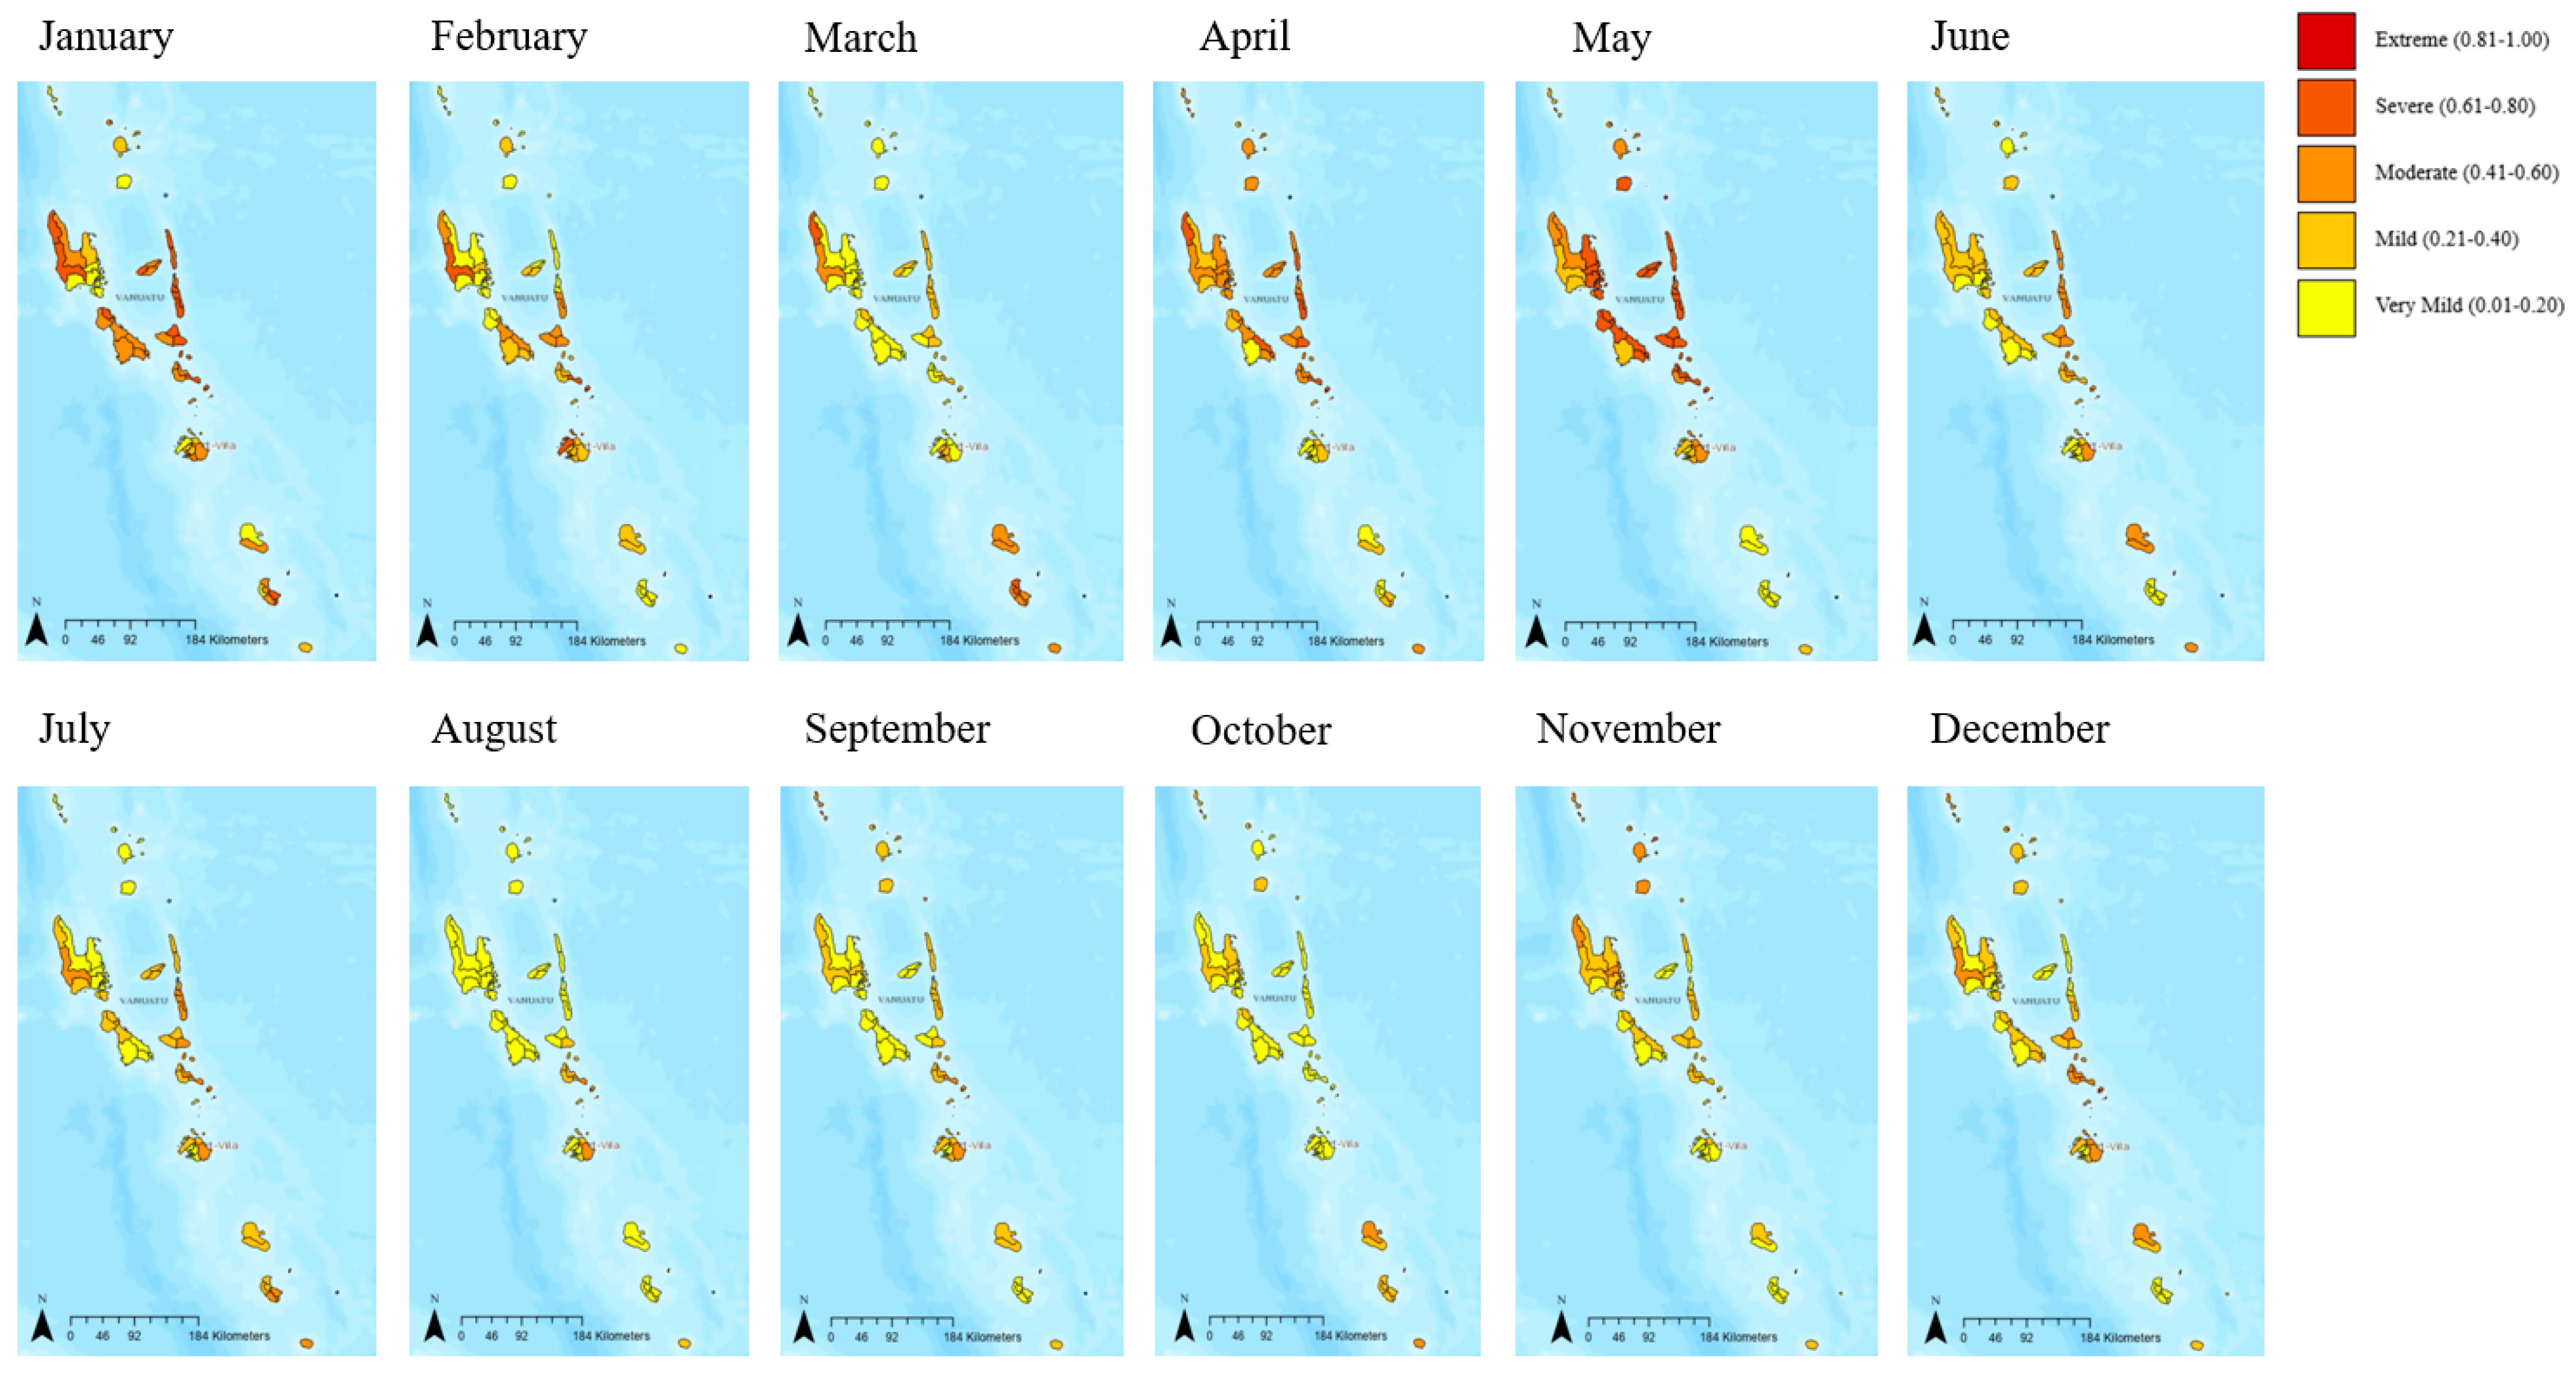
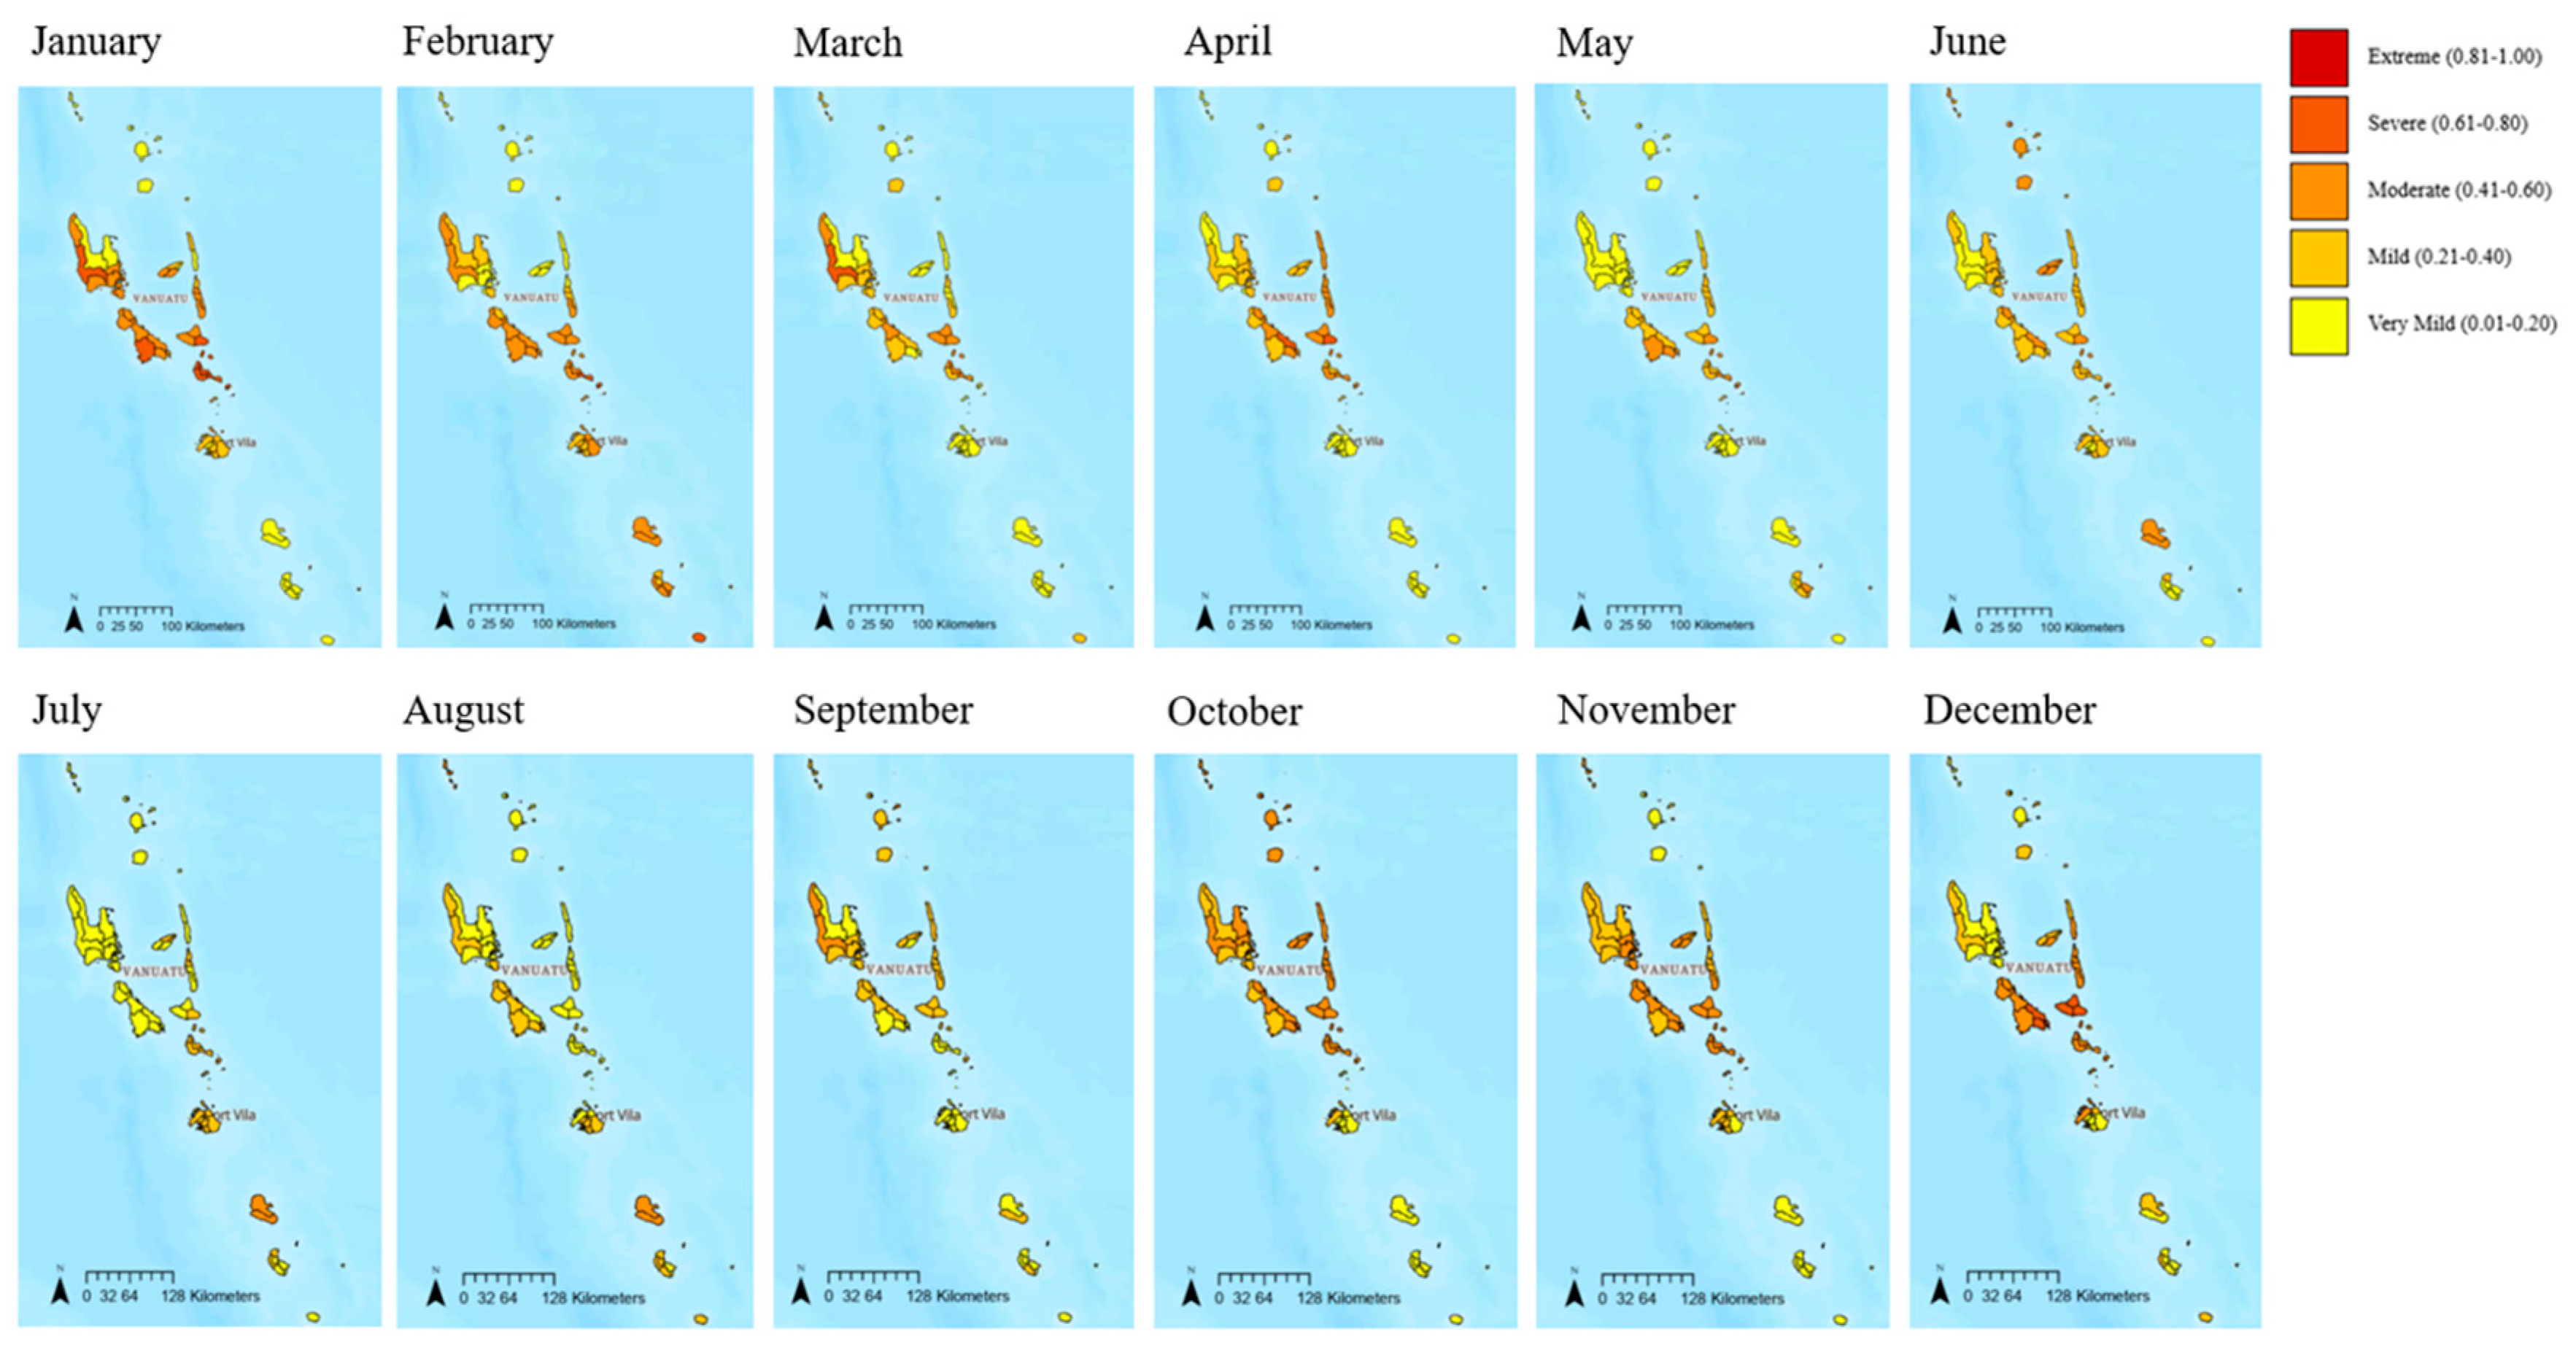
 , Severe (0.61–0.80)
  , Moderate (0.41–0.60)
  , Mild (0.21–0.40)
  , and Very Mild (0.01–0.20)
  .
.| Area Council | Monthly Risk Index Level 2015 | |||||||||||
|---|---|---|---|---|---|---|---|---|---|---|---|---|
| Jan | Feb | Mar | Apr | May | Jun | Jul | Aug | Sep | Oct | Nov | Dec | |
| Aneityum | ||||||||||||
| Aniwa | ||||||||||||
| Canal–Fanafo | ||||||||||||
| Central Malekula | ||||||||||||
| Central Pentecost 1 | ||||||||||||
| Central Pentecost 2 | ||||||||||||
| East Ambae | ||||||||||||
| East Malo | ||||||||||||
| East Santo | ||||||||||||
| Emau | ||||||||||||
| Erakor | ||||||||||||
| Eratap | ||||||||||||
| Eton | ||||||||||||
| Futuna | ||||||||||||
| Gaua | ||||||||||||
| Ifira | ||||||||||||
| Luganville | ||||||||||||
| Makimae | ||||||||||||
| Malorua | ||||||||||||
| Mele | ||||||||||||
| Merelava | ||||||||||||
| Middle Bush Tanna | ||||||||||||
| Mota | ||||||||||||
| Motalava | ||||||||||||
| Nguna | ||||||||||||
| North Ambae | ||||||||||||
| North Ambrym | ||||||||||||
| North East Malekula | ||||||||||||
| North Efate | ||||||||||||
| North Erromango | ||||||||||||
| North Maewo | ||||||||||||
| North Pentecost | ||||||||||||
| North Santo | ||||||||||||
| North Tanna | ||||||||||||
| North Tongoa | ||||||||||||
| North West Malekula | ||||||||||||
| North West Santo | ||||||||||||
| Paama | ||||||||||||
| Pango | ||||||||||||
| Port Vila | ||||||||||||
| South Ambae | ||||||||||||
| Southeast Ambrym | ||||||||||||
| Southeast Malekula | ||||||||||||
| Southeast Santo | ||||||||||||
| South Epi | ||||||||||||
| South Erromango | ||||||||||||
| South Maewo | ||||||||||||
| South Malekula | ||||||||||||
| South Pentecost | ||||||||||||
| South Santo | ||||||||||||
| South Tanna | ||||||||||||
| South West Malekula | ||||||||||||
| South West Tanna | ||||||||||||
| Tongariki | ||||||||||||
| Torres | ||||||||||||
| Ureparapara | ||||||||||||
| Vanua Lava | ||||||||||||
| Varisu | ||||||||||||
| Vermali | ||||||||||||
| Vermaul | ||||||||||||
| West Ambae | ||||||||||||
| West Ambrym | ||||||||||||
| West Malo | ||||||||||||
| West Santo | ||||||||||||
| West Tanna | ||||||||||||
| Whitesands | ||||||||||||
Appendix C
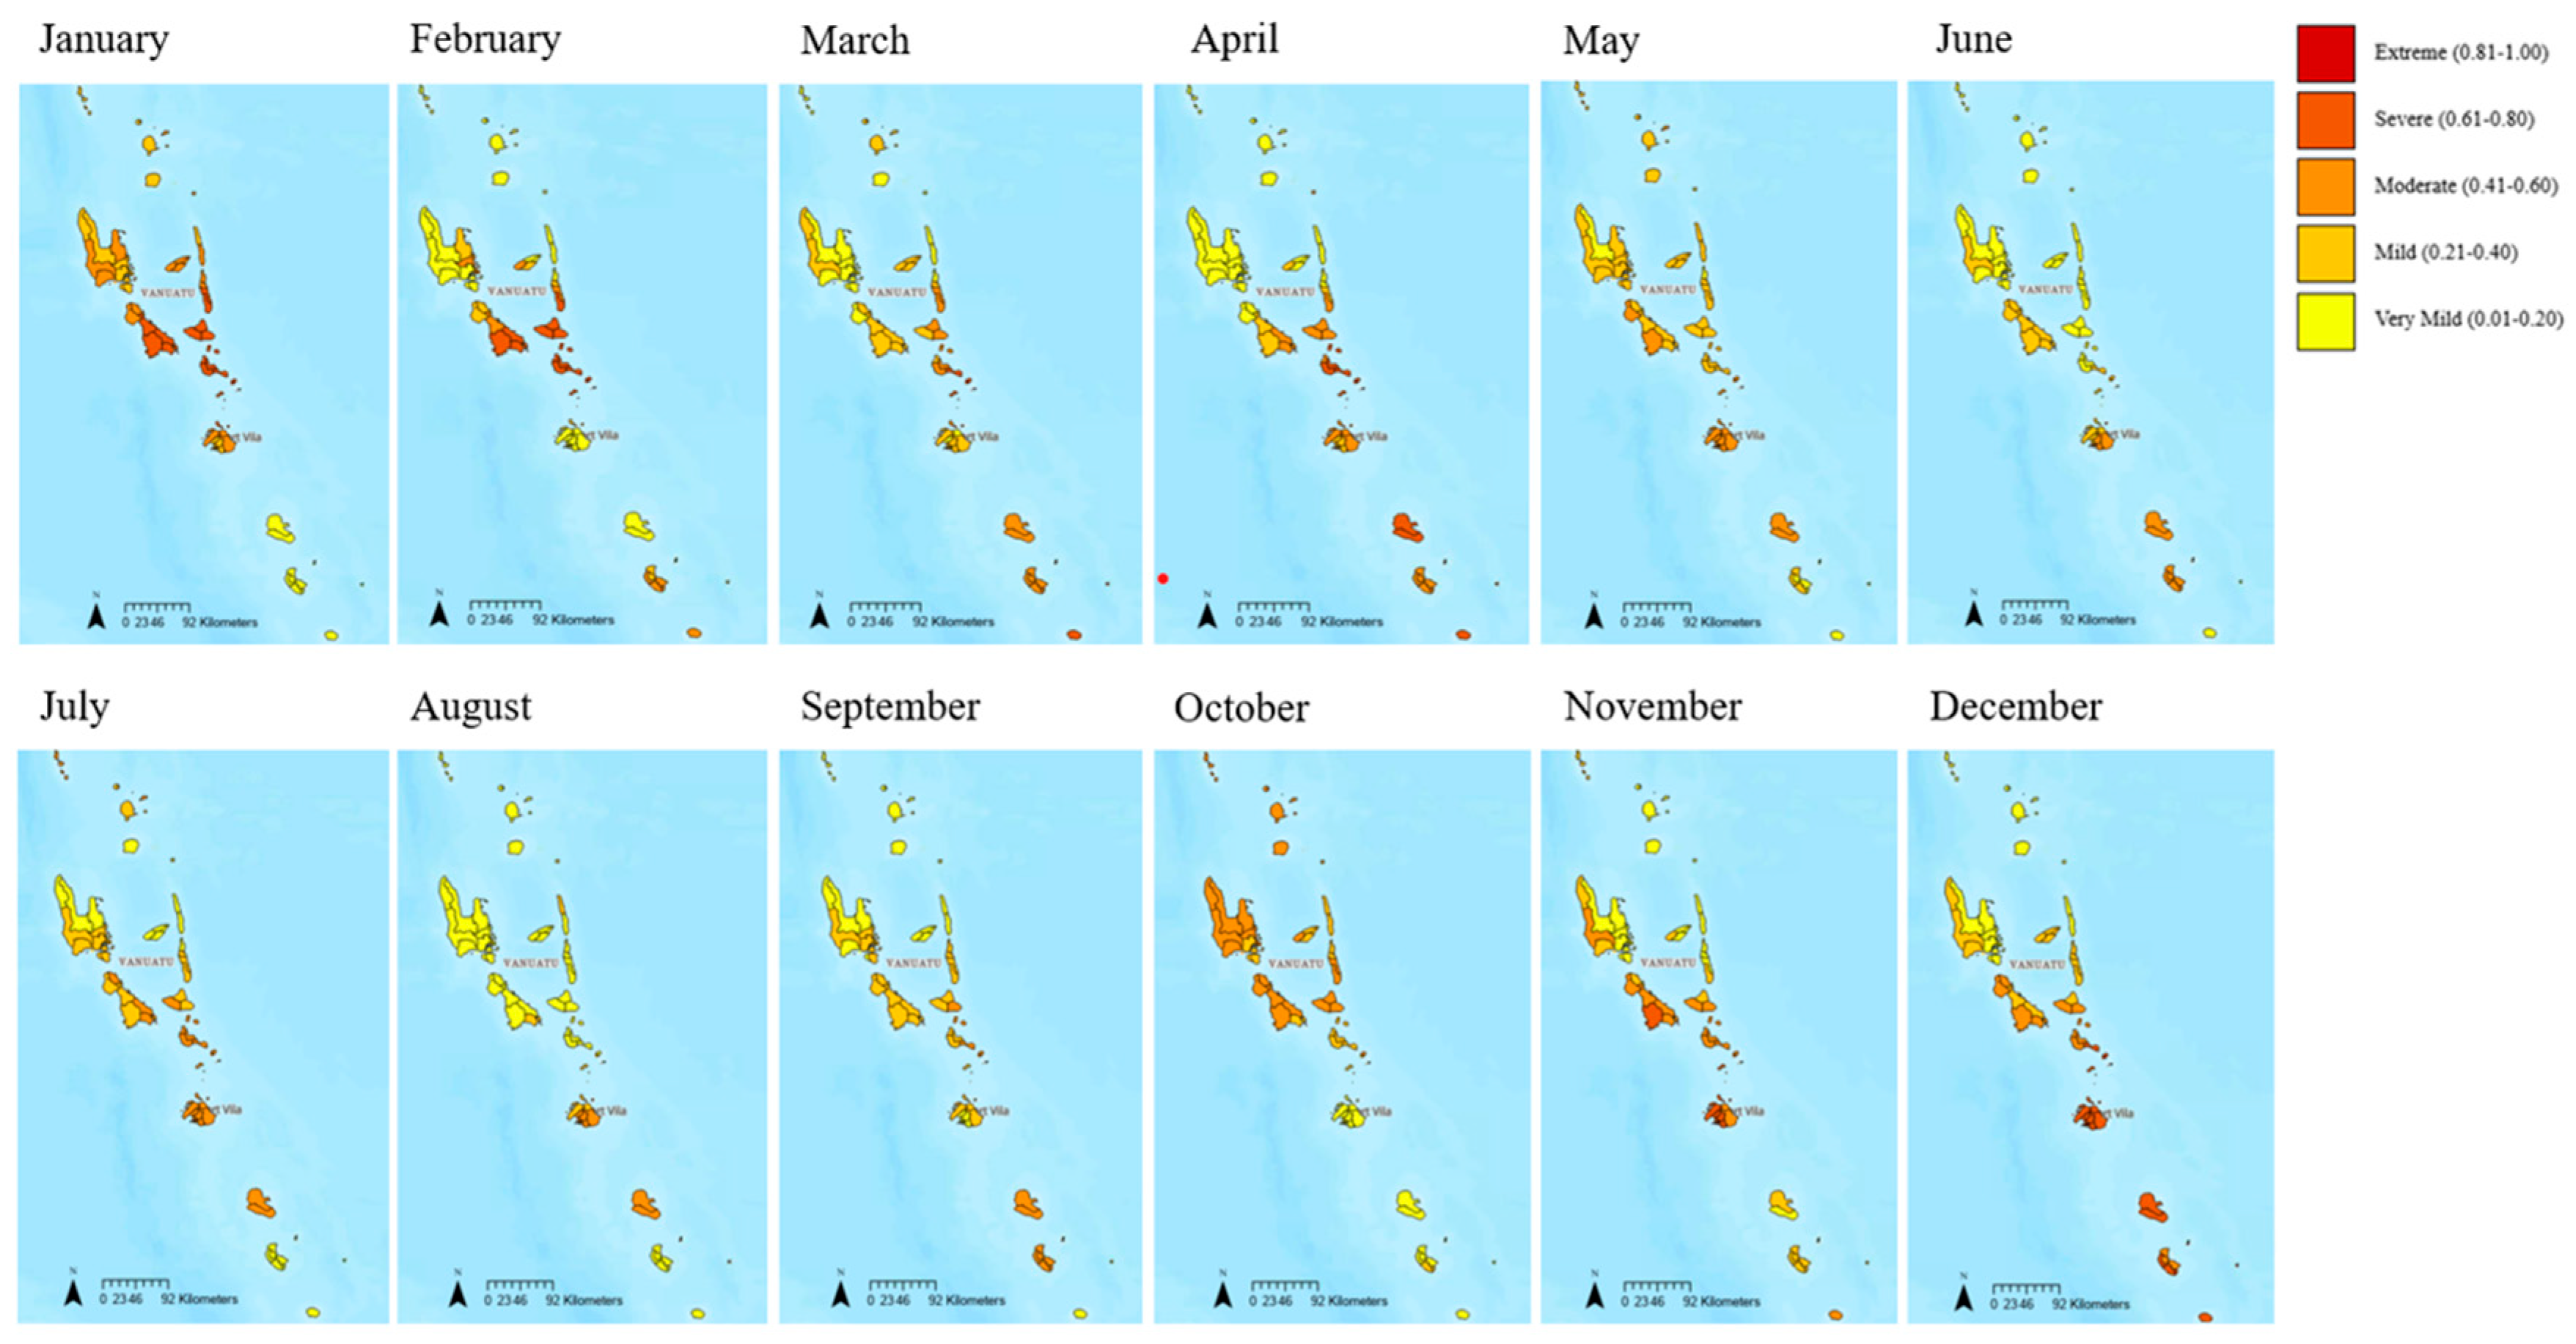
 , Severe (0.61–0.80)
  , Moderate (0.41–0.60)
  , Mild (0.21–0.40)
  , and Very Mild (0.01–0.20)
  .
.
 , Severe (0.61–0.80)
  , Moderate (0.41–0.60)
  , Mild (0.21–0.40)
  , and Very Mild (0.01–0.20)
  .
.| Area Council | Monthly Risk Index Level 2016 | |||||||||||
|---|---|---|---|---|---|---|---|---|---|---|---|---|
| Jan | Feb | Mar | Apr | May | Jun | Jul | Aug | Sep | Oct | Nov | Dec | |
| Aneityum | ||||||||||||
| Aniwa | ||||||||||||
| Canal–Fanafo | ||||||||||||
| Central Malekula | ||||||||||||
| Central Pentecost 1 | ||||||||||||
| Central Pentecost 2 | ||||||||||||
| East Ambae | ||||||||||||
| East Malo | ||||||||||||
| East Santo | ||||||||||||
| Emau | ||||||||||||
| Erakor | ||||||||||||
| Eratap | ||||||||||||
| Eton | ||||||||||||
| Futuna | ||||||||||||
| Gaua | ||||||||||||
| Ifira | ||||||||||||
| Luganville | ||||||||||||
| Makimae | ||||||||||||
| Malorua | ||||||||||||
| Mele | ||||||||||||
| Merelava | ||||||||||||
| Middle Bush Tanna | ||||||||||||
| Mota | ||||||||||||
| Motalava | ||||||||||||
| Nguna | ||||||||||||
| North Ambae | ||||||||||||
| North Ambrym | ||||||||||||
| North East Malekula | ||||||||||||
| North Efate | ||||||||||||
| North Erromango | ||||||||||||
| North Maewo | ||||||||||||
| North Pentecost | ||||||||||||
| North Santo | ||||||||||||
| North Tanna | ||||||||||||
| North Tongoa | ||||||||||||
| North West Malekula | ||||||||||||
| North West Santo | ||||||||||||
| Paama | ||||||||||||
| Pango | ||||||||||||
| Port Vila | ||||||||||||
| South Ambae | ||||||||||||
| Southeast Ambrym | ||||||||||||
| Southeast Malekula | ||||||||||||
| Southeast Santo | ||||||||||||
| South Epi | ||||||||||||
| South Erromango | ||||||||||||
| South Maewo | ||||||||||||
| South Malekula | ||||||||||||
| South Pentecost | ||||||||||||
| South Santo | ||||||||||||
| South Tanna | ||||||||||||
| South West Malekula | ||||||||||||
| South West Tanna | ||||||||||||
| Tongariki | ||||||||||||
| Torres | ||||||||||||
| Ureparapara | ||||||||||||
| Vanua Lava | ||||||||||||
| Varisu | ||||||||||||
| Vermali | ||||||||||||
| Vermaul | ||||||||||||
| West Ambae | ||||||||||||
| West Ambrym | ||||||||||||
| West Malo | ||||||||||||
| West Santo | ||||||||||||
| West Tanna | ||||||||||||
| Whitesands | ||||||||||||
Appendix D
 , Severe (0.61–0.80)
  , Moderate (0.41–0.60)
  , Mild (0.21–0.40)
  , and Very Mild (0.01–0.20)
  .
.
 , Severe (0.61–0.80)
  , Moderate (0.41–0.60)
  , Mild (0.21–0.40)
  , and Very Mild (0.01–0.20)
  .
.| Area Council | Monthly Risk Index Level 2017 | |||||||||||
|---|---|---|---|---|---|---|---|---|---|---|---|---|
| Jan | Feb | Mar | Apr | May | Jun | Jul | Aug | Sep | Oct | Nov | Dec | |
| Aneityum | ||||||||||||
| Aniwa | ||||||||||||
| Canal–Fanafo | ||||||||||||
| Central Malekula | ||||||||||||
| Central Pentecost 1 | ||||||||||||
| Central Pentecost 2 | ||||||||||||
| East Ambae | ||||||||||||
| East Malo | ||||||||||||
| East Santo | ||||||||||||
| Emau | ||||||||||||
| Erakor | ||||||||||||
| Eratap | ||||||||||||
| Eton | ||||||||||||
| Futuna | ||||||||||||
| Gaua | ||||||||||||
| Ifira | ||||||||||||
| Luganville | ||||||||||||
| Makimae | ||||||||||||
| Malorua | ||||||||||||
| Mele | ||||||||||||
| Merelava | ||||||||||||
| Middle Bush Tanna | ||||||||||||
| Mota | ||||||||||||
| Motalava | ||||||||||||
| Nguna | ||||||||||||
| North Ambae | ||||||||||||
| North Ambrym | ||||||||||||
| North East Malekula | ||||||||||||
| North Efate | ||||||||||||
| North Erromango | ||||||||||||
| North Maewo | ||||||||||||
| North Pentecost | ||||||||||||
| North Santo | ||||||||||||
| North Tanna | ||||||||||||
| North Tongoa | ||||||||||||
| North West Malekula | ||||||||||||
| North West Santo | ||||||||||||
| Paama | ||||||||||||
| Pango | ||||||||||||
| Port Vila | ||||||||||||
| South Ambae | ||||||||||||
| Southeast Ambrym | ||||||||||||
| Southeast Malekula | ||||||||||||
| Southeast Santo | ||||||||||||
| South Epi | ||||||||||||
| South Erromango | ||||||||||||
| South Maewo | ||||||||||||
| South Malekula | ||||||||||||
| South Pentecost | ||||||||||||
| South Santo | ||||||||||||
| South Tanna | ||||||||||||
| South West Malekula | ||||||||||||
| South West Tanna | ||||||||||||
| Tongariki | ||||||||||||
| Torres | ||||||||||||
| Ureparapara | ||||||||||||
| Vanua Lava | ||||||||||||
| Varisu | ||||||||||||
| Vermali | ||||||||||||
| Vermaul | ||||||||||||
| West Ambae | ||||||||||||
| West Ambrym | ||||||||||||
| West Malo | ||||||||||||
| West Santo | ||||||||||||
| West Tanna | ||||||||||||
| Whitesands | ||||||||||||
Appendix E
 , Severe (0.61–0.80)
  , Moderate (0.41–0.60)
  , Mild (0.21–0.40)
  , and Very Mild (0.01–0.20)
  .
.
 , Severe (0.61–0.80)
  , Moderate (0.41–0.60)
  , Mild (0.21–0.40)
  , and Very Mild (0.01–0.20)
  .
.| Area Council | Monthly Hazard Index Level 2020 | |||||||||||
|---|---|---|---|---|---|---|---|---|---|---|---|---|
| Jan | Feb | Mar | Apr | May | Jun | Jul | Aug | Sep | Oct | Nov | Dec | |
| Aneityum | ||||||||||||
| Aniwa | ||||||||||||
| Canal–Fanafo | ||||||||||||
| Central Malekula | ||||||||||||
| Central Pentecost 1 | ||||||||||||
| Central Pentecost 2 | ||||||||||||
| East Ambae | ||||||||||||
| East Malo | ||||||||||||
| East Santo | ||||||||||||
| Emau | ||||||||||||
| Erakor | ||||||||||||
| Eratap | ||||||||||||
| Eton | ||||||||||||
| Futuna | ||||||||||||
| Gaua | ||||||||||||
| Ifira | ||||||||||||
| Luganville | ||||||||||||
| Makimae | ||||||||||||
| Malorua | ||||||||||||
| Mele | ||||||||||||
| Merelava | ||||||||||||
| Middle Bush Tanna | ||||||||||||
| Mota | ||||||||||||
| Motalava | ||||||||||||
| Nguna | ||||||||||||
| North Ambae | ||||||||||||
| North Ambrym | ||||||||||||
| North East Malekula | ||||||||||||
| North Efate | ||||||||||||
| North Erromango | ||||||||||||
| North Maewo | ||||||||||||
| North Pentecost | ||||||||||||
| North Santo | ||||||||||||
| North Tanna | ||||||||||||
| North Tongoa | ||||||||||||
| North West Malekula | ||||||||||||
| North West Santo | ||||||||||||
| Paama | ||||||||||||
| Pango | ||||||||||||
| Port Vila | ||||||||||||
| South Ambae | ||||||||||||
| Southeast Ambrym | ||||||||||||
| Southeast Malekula | ||||||||||||
| Southeast Santo | ||||||||||||
| South Epi | ||||||||||||
| South Erromango | ||||||||||||
| South Maewo | ||||||||||||
| South Malekula | ||||||||||||
| South Pentecost | ||||||||||||
| South Santo | ||||||||||||
| South Tanna | ||||||||||||
| South West Malekula | ||||||||||||
| South West Tanna | ||||||||||||
| Tongariki | ||||||||||||
| Torres | ||||||||||||
| Ureparapara | ||||||||||||
| Vanua Lava | ||||||||||||
| Varisu | ||||||||||||
| Vermali | ||||||||||||
| Vermaul | ||||||||||||
| West Ambae | ||||||||||||
| West Ambrym | ||||||||||||
| West Malo | ||||||||||||
| West Santo | ||||||||||||
| West Tanna | ||||||||||||
| Whitesands | ||||||||||||
Appendix F
 , Severe (0.61–0.80)
  , Moderate (0.41–0.60)
  , Mild (0.21–0.40)
  , and Very Mild (0.01–0.20)
  .
.
 , Severe (0.61–0.80)
  , Moderate (0.41–0.60)
  , Mild (0.21–0.40)
  , and Very Mild (0.01–0.20)
  .
.| Area Council | Monthly Hazard Index Level 2021 | |||||||||||
|---|---|---|---|---|---|---|---|---|---|---|---|---|
| Jan | Feb | Mar | Apr | May | Jun | Jul | Aug | Sep | Oct | Nov | Dec | |
| Aneityum | ||||||||||||
| Aniwa | ||||||||||||
| Canal–Fanafo | ||||||||||||
| Central Malekula | ||||||||||||
| Central Pentecost 1 | ||||||||||||
| Central Pentecost 2 | ||||||||||||
| East Ambae | ||||||||||||
| East Malo | ||||||||||||
| East Santo | ||||||||||||
| Emau | ||||||||||||
| Erakor | ||||||||||||
| Eratap | ||||||||||||
| Eton | ||||||||||||
| Futuna | ||||||||||||
| Gaua | ||||||||||||
| Ifira | ||||||||||||
| Luganville | ||||||||||||
| Makimae | ||||||||||||
| Malorua | ||||||||||||
| Mele | ||||||||||||
| Merelava | ||||||||||||
| Middle Bush Tanna | ||||||||||||
| Mota | ||||||||||||
| Motalava | ||||||||||||
| Nguna | ||||||||||||
| North Ambae | ||||||||||||
| North Ambrym | ||||||||||||
| North East Malekula | ||||||||||||
| North Efate | ||||||||||||
| North Erromango | ||||||||||||
| North Maewo | ||||||||||||
| North Pentecost | ||||||||||||
| North Santo | ||||||||||||
| North Tanna | ||||||||||||
| North Tongoa | ||||||||||||
| North West Malekula | ||||||||||||
| North West Santo | ||||||||||||
| Paama | ||||||||||||
| Pango | ||||||||||||
| Port Vila | ||||||||||||
| South Ambae | ||||||||||||
| Southeast Ambrym | ||||||||||||
| Southeast Malekula | ||||||||||||
| Southeast Santo | ||||||||||||
| South Epi | ||||||||||||
| South Erromango | ||||||||||||
| South Maewo | ||||||||||||
| South Malekula | ||||||||||||
| South Pentecost | ||||||||||||
| South Santo | ||||||||||||
| South Tanna | ||||||||||||
| South West Malekula | ||||||||||||
| South West Tanna | ||||||||||||
| Tongariki | ||||||||||||
| Torres | ||||||||||||
| Ureparapara | ||||||||||||
| Vanua Lava | ||||||||||||
| Varisu | ||||||||||||
| Vermali | ||||||||||||
| Vermaul | ||||||||||||
| West Ambae | ||||||||||||
| West Ambrym | ||||||||||||
| West Malo | ||||||||||||
| West Santo | ||||||||||||
| West Tanna | ||||||||||||
| Whitesands | ||||||||||||
Appendix G
 , Severe (0.61–0.80)
  , Moderate (0.41–0.60)
  , Mild (0.21–0.40)
  , and Very Mild (0.01–0.20)
  .
.
 , Severe (0.61–0.80)
  , Moderate (0.41–0.60)
  , Mild (0.21–0.40)
  , and Very Mild (0.01–0.20)
  .
.| Area Council | Monthly Hazard Index Level 2022 | |||||||||||
|---|---|---|---|---|---|---|---|---|---|---|---|---|
| Jan | Feb | Mar | Apr | May | Jun | Jul | Aug | Sep | Oct | Nov | Dec | |
| Aneityum | ||||||||||||
| Aniwa | ||||||||||||
| Canal–Fanafo | ||||||||||||
| Central Malekula | ||||||||||||
| Central Pentecost 1 | ||||||||||||
| Central Pentecost 2 | ||||||||||||
| East Ambae | ||||||||||||
| East Malo | ||||||||||||
| East Santo | ||||||||||||
| Emau | ||||||||||||
| Erakor | ||||||||||||
| Eratap | ||||||||||||
| Eton | ||||||||||||
| Futuna | ||||||||||||
| Gaua | ||||||||||||
| Ifira | ||||||||||||
| Luganville | ||||||||||||
| Makimae | ||||||||||||
| Malorua | ||||||||||||
| Mele | ||||||||||||
| Merelava | ||||||||||||
| Middle Bush Tanna | ||||||||||||
| Mota | ||||||||||||
| Motalava | ||||||||||||
| Nguna | ||||||||||||
| North Ambae | ||||||||||||
| North Ambrym | ||||||||||||
| North East Malekula | ||||||||||||
| North Efate | ||||||||||||
| North Erromango | ||||||||||||
| North Maewo | ||||||||||||
| North Pentecost | ||||||||||||
| North Santo | ||||||||||||
| North Tanna | ||||||||||||
| North Tongoa | ||||||||||||
| North West Malekula | ||||||||||||
| North West Santo | ||||||||||||
| Paama | ||||||||||||
| Pango | ||||||||||||
| Port Vila | ||||||||||||
| South Ambae | ||||||||||||
| Southeast Ambrym | ||||||||||||
| Southeast Malekula | ||||||||||||
| Southeast Santo | ||||||||||||
| South Epi | ||||||||||||
| South Erromango | ||||||||||||
| South Maewo | ||||||||||||
| South Malekula | ||||||||||||
| South Pentecost | ||||||||||||
| South Santo | ||||||||||||
| South Tanna | ||||||||||||
| South West Malekula | ||||||||||||
| South West Tanna | ||||||||||||
| Tongariki | ||||||||||||
| Torres | ||||||||||||
| Ureparapara | ||||||||||||
| Vanua Lava | ||||||||||||
| Varisu | ||||||||||||
| Vermali | ||||||||||||
| Vermaul | ||||||||||||
| West Ambae | ||||||||||||
| West Ambrym | ||||||||||||
| West Malo | ||||||||||||
| West Santo | ||||||||||||
| West Tanna | ||||||||||||
| Whitesands | ||||||||||||
References
- Frölicher, T.L.; Laufkötter, C. Emerging risks from marine heat waves. Nat. Commun. 2018, 9, 650. [Google Scholar] [CrossRef]
- Shultz, J.M.; Cohen, M.A.; Hermosilla, S.; Espinel, Z.; McLean, A. Disaster risk reduction and sustainable development for small island developing states. Disaster Health 2016, 3, 32–44. [Google Scholar] [CrossRef] [PubMed]
- Sen Gupta, A.; Thomsen, M.; Benthuysen, J.A.; Hobday, A.J.; Oliver, E.; Alexander, L.V.; Burrows, M.T.; Donat, M.G.; Feng, M.; Holbrook, N.J.; et al. Drivers and impacts of the most extreme marine heatwaves events. Sci. Rep. 2020, 9, 19359. [Google Scholar] [CrossRef]
- Holbrook, J.; Hernaman, V.; Koshiba, S.; Lako, J.; Kajtar, J.B.; Amosa, P.; Singh, A. Impacts of marine heatwaves on tropical western and central Pacific Island nations and their communities. Glob. Planet. Change 2022, 208, 103–680. [Google Scholar] [CrossRef]
- Eriksson, H.; Albert, J.; Albert, S.; Warren, R.; Pakoa, K.; Andrew, N. The role of fish and fisheries in recovering from natural hazards: Lessons learned from Vanuatu. Environ. Sci. Policy 2017, 76, 50–58. [Google Scholar] [CrossRef]
- Rosegrant, M.W.; Dey, M.M.; Valmonte-Santos, R.; Chen, O.L. Economic impacts of climate change and climate change adaptation strategies in Vanuatu and Timor-Leste. Mar. Policy 2016, 67, 179–188. [Google Scholar] [CrossRef]
- Dunstan, K.; Moore, B.R.; Bell, J.D.; Holbrook, N.J.; Oliver, E.C.J.; Risbey, J.; Foster, S.D.; Hanich, Q.; Hobday, A.; Benner, N.J. How can climate predictions improve sustainability of coastal fisheries in Pacific Small-Island Developing States? Mar. Policy 2018, 88, 295–302. [Google Scholar] [CrossRef]
- Ainsworth, T.D.; Hurd, C.L.; Gates, R.D.; Boyd, P.W. How do we overcome abrupt degradation of marine ecosystems and meet the challenge of heat waves and climate extremes? Glob. Change Biol. 2020, 26, 343–354. [Google Scholar] [CrossRef]
- Spickett, J.T.; Katscherian, D.; McIver, L. Health Impacts of Climate Change in Vanuatu: An Assessment and Adaptation Action Plan. Glob. J. Health Sci. 2013, 5, 42–53. [Google Scholar] [CrossRef]
- Jackson, G.; McNamara, K.; Witt, B.A. Framework for Disaster Vulnerability in a Small Island in the Southwest Pacific: A Case Study of Emae Island, Vanuatu. Int. J. Disaster Risk Sci. 2017, 8, 358–373. [Google Scholar] [CrossRef]
- Aitkenhead, I.; Kuleshov, Y.; Choy, S.; Sun, C. Selecting tailored risk indicators for assessing Marine Heat Wave risk to the fisheries sector in Vanuatu. Estuar. Coast. Shelf Sci. under review.
- Ward, P.J.; Daniell, J.; Duncan, M.; Dunne, A.; Hananel, C.; Hochrainer-Stigler, S.; Tijssen, A.; Torresan, S.; Ciurean, R.; Gill, J.C.; et al. Invited perspectives: A research agenda towards disaster risk management pathways in multi-(hazard-)risk assessment. Nat. Hazards Earth Syst. Sci. 2022, 22, 1487–1497. [Google Scholar] [CrossRef]
- Mosquera-Machado, S.; Dilley, M. A comparison of selected global disaster risk assessment results. Nat. Hazards 2009, 48, 439–456. [Google Scholar] [CrossRef]
- Aubrecht, C.; Fuchs, S.; Neuhold, C. Spatio-temporal aspects and dimensions in integrated disaster risk management. Nat. Hazards 2013, 68, 1205–1216. [Google Scholar] [CrossRef]
- Kouwenhoven, P. Profile of Risks from Climate Change and Geohazards in Vanuatu: Draft Report; CLIMsystems: Hamilton, ON, Canada, 2013; Available online: https://www.nab.vu/sites/default/files/nab/documents/03/04/2014%20-%2012%3A45/risk_profile_report_draft_1.pdf (accessed on 20 October 2022).
- Fekete, A.; Hufschmidt, G.; Kruse, S. Benefits and Challenges of Resilience and Vulnerability for Disaster Risk Management. Int. J. Disaster Risk Sci. 2014, 5, 3–20. [Google Scholar] [CrossRef]
- Asare-Kyei, D.; Renaud, F.G.; Kloos, J.; Walz, Y.; Rhyner, J. Development and validation of risk profiles of West African rural communities facing multiple natural hazards. PLoS ONE 2017, 12, e0171921. [Google Scholar] [CrossRef] [PubMed]
- Twomlow, A.; Grainger, S.; Cieslik, K.; Paul, J.D.; Buytaert, W. A user-centred design framework for disaster risk visualisation’. Int. J. Disaster Risk Reduct. 2020, 77, 103067. [Google Scholar] [CrossRef]
- Barbeaux, S.J.; Holsman, K.; Zador, S. Marine Heatwave Stress Test of Ecosystem-Based Fisheries Management in the Gulf of Alaska Pacific Cod Fishery. Front. Mar. Sci. 2020, 7, 703. [Google Scholar] [CrossRef]
- Chen, K.; Blong, R.; Jacobson, C. Towards an integrated approach to natural hazards risk assessment using GIS: With reference to bushfires. Environ. Manag. 2003, 31, 546–560. [Google Scholar] [CrossRef]
- Bell, J.D.; Reid, C.; Batty, M.J.; Lehodey, P.; Rodwell, L.; Hobday, A.; Johnson, J.E.; Demmke, A. Effects of climate change on oceanic fisheries in the tropical Pacific: Implications for economic development and food security. Clim. Change 2013, 119, 199–212. [Google Scholar] [CrossRef]
- Commonwealth Scientific and Industrial Research Organisation (CSIRO); Secretariat of the Pacific Regional Environment Programme (SPREP). Current and Future Climate for Vanuatu: Enhanced ‘NextGen’ Projections Technical Report; CSIRO Technical Report; Final report to the Australia-Pacific Climate Partnership for the Next Generation Climate Projections for the Western Tropical Pacific project; CSIRO and SPREP: Melbourne, Australia, 2021. [Google Scholar] [CrossRef]
- Wang, Y.; Li, Z.; Tang, Z.; Zeng, G. A GIS-Based Spatial Multi-Criteria Approach for Flood Risk Assessment in the Dongting Lake Region, Hunan, Central China. Water Resour. Manag. 2011, 25, 3465–3484. [Google Scholar] [CrossRef]
- Allen, T.; Taleo, F.; Grave, P.M.; Ichimori, K. Impact of the Lymphatic Filariasis Control Program towards elimination of filariasis in Vanuatu, 1997–2006. Trop. Med. Health 2017, 45, 8. [Google Scholar] [CrossRef] [PubMed]
- Maynard, J.; Heron, S.; van Hooidonk, R.; Tracey, D. Past and Projected Future Impacts of Coral Bleaching on the Reefs of Vanuatu; Report to the Secretariat of the Pacific Regional Environment Programme (SPREP); Secretariat of the Pacific Regional Environment Programme (SPREP): Apia, Samoa, 2018; p. 19. [Google Scholar]
- Léopold, M.; David, G.; Raubani, J.; Kaltavara, J.; Hood, L.; Zeller, D. An Improved Reconstruction of Total Marine Fisheries Catches for the NewHebrides and the Republic of Vanuatu, 1950–2014. Front. Mar. Sci. 2017, 4, 306. [Google Scholar] [CrossRef]
- Environmental Systems Research Institute (ESRI) Inc. ArcGIS Pro, version 10.7.1; Environmental Systems Research Institute (ESRI) Inc.: Redlands, CA, USA, 2019.
- Commonwealth Scientific and Industrial Research Organisation (CSIRO); Secretariat of the Pacific Regional Environment Programme (SPREP); Vanuatu Meteorology and Geo-hazards Department (VMGD). Historical, Current and Future Marine Heatwave Climatology for Vanuatu; A Report to the Van-KIRAP Project; CSIRO Technical Report; CSIRO: Melbourne, Australia, 2023. [Google Scholar]
- Fekete, A. Social Vulnerability (Re-)Assessment in Context to Natural Hazards: Review of the Usefulness of the Spatial Indicator Approach and Investigations of Validation Demands. Int. J. Disaster Risk Sci. 2019, 10, 220–232. [Google Scholar] [CrossRef]
- McKenzie, L.J.; Yoshida, R.L.; Aini, J.W.; Andréfouet, S.; Colin, P.L.; Cullen-Unsworth, L.C.; Hughes, A.T.; Payri, C.E.; Rota, M.; Shaw, C.; et al. Seagrass ecosystem contributions to people’s quality of life in the Pacific Island Countries and Territories. Mar. Pollut. Bull. 2021, 167, 112307. [Google Scholar] [CrossRef] [PubMed]
- Dumas, P.; Moutardier, G.; Ham, J.; Kaku, R.; Gereba, S.; Lefèvre, J.; Adjeroud, M. Timing within the reproduction cycle modulates the efficiency of village-based crown-of-thorns starfish removal. Biol. Conserv. 2016, 204, 237–246. [Google Scholar] [CrossRef]
- Kuleshov, Y.; Inape, K.; Watkins, A.; Bear-Crozier, A.; Chua, Z.-W.; Xie, P.; Kubota, T.; Tashima, T.; Stefanski, R.; Kurino, T. Climate Risk and Early Warning Systems (CREWS) for Papua New Guinea. In Drought—Detection and Solutions; Ondrasek, G., Ed.; IntechOpen: Rijeka, Croatia, 2020. [Google Scholar] [CrossRef]
- Hobday, A.; Alexander, L.V.; Perkins, S.E.; Smale, D.A.; Straub, S.C.; Oliver, E.C.J.; Benthuysen, J.A.; Burrows, M.T.; Donat, M.G.; Feng, M.; et al. A hierarchical approach to defining marine heatwaves. Prog. Oceanogr. 2016, 141, 227–238. [Google Scholar] [CrossRef]
- Aitkenhead, I.; Kuleshov, Y.; Watkins, A.B.; Bhardwaj, J.; Asghari, A. Assessing agricultural drought management strategies in the Northern Murray–Darling Basin. Nat. Hazards 2021, 109, 1425–1455. [Google Scholar] [CrossRef] [PubMed]
- Meza, I.; Eyshi Rezaei, E.; Siebert, S.; Ghazaryan, G.; Nouri, H.; Dubovyk, O.; Gerdener, H.; Herbert, C.; Kusche, J.; Popat, E.; et al. Drought risk for agricultural systems in South Africa: Drivers, spatial patterns, and implications for drought risk management. Sci. Total Environ. 2021, 799, 149505. [Google Scholar] [CrossRef]
- Papathoma-Köhle, M.; Schlögl, M.; Fuchs, S. Vulnerability indicators for natural hazards: An innovative selection and weighting approach. Sci. Rep. 2019, 9, 15026. [Google Scholar] [CrossRef]
- Frischen, J.; Meza, I.; Rupp, D.; Wietler, K.; Hagenlocher, M. Drought Risk to Agricultural Systems in Zimbabwe: A Spatial Analysis of Hazard, Exposure, and Vulnerability. Sustainability 2020, 12, 752. [Google Scholar] [CrossRef]
- Saisana, M.; Saltelli, A.; Tarantola, S. Uncertainty and Sensitivity Analysis Techniques as Tools for the Quality Assessment of Composite Indicators. J. R. Stat. Soc. Ser. A Stat. Soc. 2005, 168, 307–323. [Google Scholar] [CrossRef]
- Farok, G.; Homayouni, S. Foundations of mathematics play the baseline for data exploring, forecasting and analyzing of risks to get an economic decision. Afr. J. Eng. 2018, 6, 25–31. [Google Scholar] [CrossRef]
- Marin, M.; Feng, M.; Bindoff, N.L.; Phillips, H.E. Local Drivers of Extreme Upper Ocean Marine Heatwaves Assessed Using a Global Ocean Circulation Model. Front. Clim. 2022, 4, 788390. [Google Scholar] [CrossRef]
- Gouriou, Y.; Delcriox, T. Seasonal and ENSO variations of sea surface salinity and temperature in the South Pacific Convergence Zone during 1976–2000. J. Geophys. Res. 2002, 107, 12–14. [Google Scholar] [CrossRef]
- Huang, Z.; Feng, M.; Dalton, S.J.; Carroll, A.G. Marine heatwaves in the Great Barrier Reef and Coral Sea: Their mechanisms and impacts on shallow and mesophotic coral ecosystems. Sci. Total Environ. 2024, 908, 168063. [Google Scholar] [CrossRef] [PubMed]
- Chand, S.; Power, S.; Walsh, K.; Holbrook, N.; McInnes, K.; Tory, K.; Ramsay, H.; Hoeke, R.; Kiem, A.S. Climate processes and drivers in the Pacific and global warming: A review for informing Pacific planning agencies. Clim. Change 2023, 176, 5. [Google Scholar] [CrossRef]
- Choi, H.Y.; Park, M.S.; Kim, H.S.; Lee, S. Marine heatwave events strengthen the intensity of tropical cyclones. Commun. Earth Environ. 2024, 5, 69. [Google Scholar] [CrossRef]
- Lavender, S.L.; Hoeke, R.K.; Abbs, D.J. The influence of sea surface temperature on the intensity and associated storm surge of tropical cyclone Yasi: A sensitivity study. Nat. Hazards Earth Syst. Sci. 2018, 18, 795–805. [Google Scholar] [CrossRef]
- Le Dé, L.; Rey, T.; Leone, F.; Gilbert, D. Sustainable livelihoods and effectiveness of disaster responses: A case study of tropical cyclone Pam in Vanuatu. Nat. Hazards 2018, 91, 1203–1221. [Google Scholar] [CrossRef]
- Russell, P.; Horvat, C. Extreme South Pacific Phytoplankton Blooms Induced by Tropical Cyclones. Geophys. Res. Lett. 2023, 50, e2022GL100821. [Google Scholar] [CrossRef]
- van Vloten, S.O.; Cagigal, L.; Rueda, A.; Ripoll, N.; Méndez, J. HyTCWaves: A Hybrid model for downscaling Tropical Cyclone induced extreme Waves climate. Ocean. Model. 2022, 178, 102100. [Google Scholar] [CrossRef]
- Maclellan, N. The Region in Review: International Issues and Events, 2020. Contemp. Pac. 2021, 33, 500–522. [Google Scholar] [CrossRef]
- De Deckker, P. The Indo-Pacific Warm Pool: Critical to world oceanography and world climate. Geosci. Lett. 2016, 3, 20. [Google Scholar] [CrossRef]
- Amos, J. Vanuatu Fishery Resource Profiles; SPREP: Apia, Samoa, 2007; Available online: http://archive.iwlearn.net/sprep.org/att/publication/000557_IWP_PTR49.pdf (accessed on 17 December 2022)ISBN 978-982-04-0372-7.
- Smith, K.E.; Burrows, M.T.; Hobday, A.J.; Sen Gupta, A.; Moore, P.J.; Thomsen, M.; Wernberg, T.; Smale, D.A. Socioeconomic impacts of marine heatwaves: Global issues and opportunities. Science 2021, 374, eabj3593. [Google Scholar] [CrossRef] [PubMed]
- Meza, I.; Siebert, S.; Döll, P.; Kusche, J.; Herbert, C.; Rezaei, E.E.; Nouri, H.; Gerdener, H.; Popat, E.; Frischen, J.; et al. Global-scale drought risk assessment for agricultural systems. Nat. Hazards Earth Syst. Sci. 2020, 20, 695–712. [Google Scholar] [CrossRef]
- Castillo, M.; Mathew, D.; Karmel, M.E.R. Ocean and Climate Synergies: From Ocean Warming to Rising Sea Levels; United Nations ESCAP, Environment and Development Division: Bangkok, Thailand, 2022. [Google Scholar]
- Asadzadeh, A.; Kötter, T.; Zebardast, E. An augmented approach for measurement of disaster resilience using connective factor analysis and analytic network process (F’ANP) model. Int. J. Disaster Risk Reduct. 2015, 14, 504–518. [Google Scholar] [CrossRef]
- Cheung, W.W.L.; Frölicher, T.L. Marine heatwaves exacerbate climate change impacts for fisheries in the northeast Pacific. Sci. Rep. 2020, 10, 6678. [Google Scholar] [CrossRef]
| Index | Indicator |
|---|---|
| Hazard | Sea Surface Temperature (SST) |
| Coral bleaching | |
| Chlorophyll-a concentration | |
| Vulnerability | Terrestrial-based food and income generation |
| Fishing skills and technology | |
| Fishery fish diversity and fishery flexibility | |
| Primary production of commercial fisheries | |
| Exposure | Seagrass population and C content |
| Coral Habitat Health and Crown of Thorns Prevalence | |
| Crab stock health | |
| Fish mortality and fish stock health |
| Index | Proposed Indicator from Aitkenhead et al. [11] | The Actual Indicator Used in This Study | Data Source | Spatial Scale | Temporal Scale |
|---|---|---|---|---|---|
| Hazard | SST | Mean Sea Surface Temperature Anomaly | NOAA THREDDS Server | Averaged satellite-based ocean data to the area council level | Monthly |
| Coral Bleaching | Coral Bleaching Alert Area | NOAA THREDDS Server | Averaged satellite-based ocean data to the area council level | Monthly | |
| Chlorophyll-a Concentration | Chlorophyll-a Concentration | Pacific Ocean Portal | Averaged satellite-based ocean data to the area council level | Monthly | |
| Vulnerability | Terrestrial (land)-based food and income generation | Percentage of households growing crops or owning livestock for food and income generation | Vanuatu National Statistics Office | Area council | Yearly |
| Fishing skills and technology | Number of people required to sufficiently increase fishery skills and technology in each area | Australian Aid Province Skills Plan | Provincial | Yearly | |
| Fishery fish diversity and fishery flexibility | Number of fishery resources fished | Vanuatu National Biodiversity Strategy and Action Plan | Provincial | Yearly | |
| Primary production of commercial fisheries | Commercial fisheries annual added value (USD) | National Marine Ecosystem Service Valuation | Provincial | Yearly | |
| Exposure | Seagrass population and C content | Seagrass species richness (number of observed seagrass species) | McKenzie et al. [30] | Area council | Static |
| Coral Habitat Health and Crown of Thorns Prevalence | Crown of Thorns Prevalence Score (none—0, low—1, medium—2, high—3) | Dumas et al. [31] | Area council | Yearly | |
| Crab stock health | Stock status score for Coconut Crab (0—no noted population, 1—overfished, 2—unstable, 3—stable, 4—underfished) | Vanuatu National Coconut Crab Fishery Management Plan | Area council | Yearly | |
| Fish mortality and fish stock health | Fish catch score (based on the fishing of tuna and billfishes by the fleets of Vanuatu) (1–7 low to high catch) | Food and Agriculture Organisation of the United Nations (FAO) FishStat database [22]. | Area council | Yearly |
| Index | Indicator | No to Mild MHW Risk | Moderate MHW Risk | Severe to Extreme MHW Risk |
|---|---|---|---|---|
| Hazard | Mean Sea Surface Temperature Anomaly | 0 °C and under | 1–2 °C | Above 2 °C |
| Coral Bleaching Alert Area | 0 | 1–2 | 3–4 | |
| Chlorophyll-a Concentration | Above 0.15 | 0.06 to 0.15 | 0 to 0.05 | |
| Vulnerability | Percentage of households growing crops or owning livestock for food and income generation | 90% to 100% | 75% to 90% | Below 75% |
| Number of people required to sufficiently increase fishery skills and technology in each area | 250 and under | 250–450 | 450 and above | |
| Number of fishery resources fished | 20 and above | 15 to 19 | 0 to 14 | |
| Commercial fisheries annual added value | $1,500,001 and above | $1,000,001 to $1,500,000 | 0 to $1,000,000 | |
| Exposure | Seagrass species richness | 7 and above | 4 to 6 | 0 to 3 |
| Crown of Thorns Prevalence Score | 0 | 1 | 2 to 3 | |
| Stock status score for Coconut Crab | 3 to 4 | 2 | 0 to 1 | |
| Fish catch score | 6 to 7 | 4 to 5 | 1 to 3 |
| Index | Indicator | Fuzzy Membership Class |
|---|---|---|
| Hazard | Mean Sea Surface Temperature Anomaly | Large |
| Coral Bleaching Alert Area | Large | |
| Chlorophyll-a Concentration | Small | |
| Vulnerability | Percentage of households growing crops or owning livestock for food and income generation | Small |
| Number of people required to sufficiently increase fishery skills and technology in each area | Large | |
| Number of fishery resources fished | Small | |
| Commercial fisheries annual added value | Small | |
| Exposure | Seagrass species richness | Small |
| Crown of Thorns Prevalence Score | Large | |
| Stock status score for Coconut Crab | Small | |
| Fish catch score | Small |
| Index | Indicator | Proposed Weight |
|---|---|---|
| Hazard | Mean Sea Surface Temperature Anomaly | 0.50 |
| Coral Bleaching Alert Area | 0.30 | |
| Chlorophyll-a Concentration | 0.20 | |
| Vulnerability | Percentage of households growing crops or owning livestock for food and income generation | 0.35 |
| The number of people required to sufficiently increase fishery skills and technology in each area | 0.10 | |
| Number of fishery resources fished | 0.30 | |
| Commercial fisheries annual added value | 0.25 | |
| Exposure | Seagrass species richness | 0.35 |
| Crown of Thorns Prevalence Score | 0.30 | |
| Stock status score for Coconut Crab | 0.10 | |
| Fish catch score | 0.25 |
| Local Area Council Type | Hazard Indicator | SI in Higher Risk Months (Represented in Testing with April 2022 Data) | SI in Lower Risk Months (Represented in Testing with September 2021 Data) |
|---|---|---|---|
| Makimae (representing local area councils commonly at higher risk) | SST | 0.59 | 0.90 |
| BAA | 0.35 | 0.83 | |
| Chlorophyll-a concentration | 0.2 | 0.80 | |
| West Tanna (representing local area councils commonly at lower risk) | SST | 0.86 | 0.90 |
| BAA | 0.36 | 0.56 | |
| Chlorophyll-a concentration | 0.27 | 0.47 |
| Local Area Council Type | Vulnerability Indicator | Sensitivity Index in Higher Risk Years (Represented in Testing with 2016 Data) | Sensitivity Index in Lower Risk Years (Represented in Testing with 2021 Data) |
|---|---|---|---|
| Makimae (representing local area councils commonly at higher risk) | Terrestrial-based food and income generation | 0.41 | 0.42 |
| Fishing skills and technology | 0.16 | 0.16 | |
| Fishery diversity/flexibility | 0.42 | 0.43 | |
| Primary production of commercial fisheries | 0.34 | 0.35 | |
| West Tanna (representing local area councils commonly at lower risk) | Terrestrial-based food and income generation | 0.53 | 0.53 |
| Fishing skills and technology | 0.19 | 0.18 | |
| Fishery diversity/flexibility | 0.51 | 0.52 | |
| Primary production of commercial fisheries | 0.39 | 0.40 |
| Local Area Council Type | Exposure Indicator | Sensitivity Index in Higher Risk Years (Represented in Testing with 2016 Data) | Sensitivity Index in Lower Risk Years (Represented in Testing with 2021 Data) |
|---|---|---|---|
| Makimae (representing local area councils commonly at higher risk) | Seagrass population | 0.41 | 0.42 |
| Crown of thorns prevalence | 0.35 | 0.35 | |
| Crab stock health | 0.12 | 0.12 | |
| Fish stock health | 0.23 | 0.23 | |
| West Tanna (representing local area councils commonly at lower risk) | Seagrass population | 0.80 | 0.81 |
| Crown of thorns prevalence | 0.62 | 0.63 | |
| Crab stock health | 0.41 | 0.41 | |
| Fish stock health | 0.64 | 0.65 |
Disclaimer/Publisher’s Note: The statements, opinions and data contained in all publications are solely those of the individual author(s) and contributor(s) and not of MDPI and/or the editor(s). MDPI and/or the editor(s) disclaim responsibility for any injury to people or property resulting from any ideas, methods, instructions or products referred to in the content. |
© 2024 by the authors. Licensee MDPI, Basel, Switzerland. This article is an open access article distributed under the terms and conditions of the Creative Commons Attribution (CC BY) license (https://creativecommons.org/licenses/by/4.0/).
Share and Cite
Aitkenhead, I.; Kuleshov, Y.; Sun, C.; Choy, S. Conducting a Tailored and Localised Marine Heat Wave Risk Assessment for Vanuatu Fisheries. Climate 2024, 12, 108. https://doi.org/10.3390/cli12080108
Aitkenhead I, Kuleshov Y, Sun C, Choy S. Conducting a Tailored and Localised Marine Heat Wave Risk Assessment for Vanuatu Fisheries. Climate. 2024; 12(8):108. https://doi.org/10.3390/cli12080108
Chicago/Turabian StyleAitkenhead, Isabella, Yuriy Kuleshov, Chayn Sun, and Suelynn Choy. 2024. "Conducting a Tailored and Localised Marine Heat Wave Risk Assessment for Vanuatu Fisheries" Climate 12, no. 8: 108. https://doi.org/10.3390/cli12080108
APA StyleAitkenhead, I., Kuleshov, Y., Sun, C., & Choy, S. (2024). Conducting a Tailored and Localised Marine Heat Wave Risk Assessment for Vanuatu Fisheries. Climate, 12(8), 108. https://doi.org/10.3390/cli12080108


_Sun.png)


