
Harnessing Machine Learning to Decode the Mediterranean’s Climate Canvas and Forecast Sea Level Changes

 , , and
Abstract
:1. Introduction
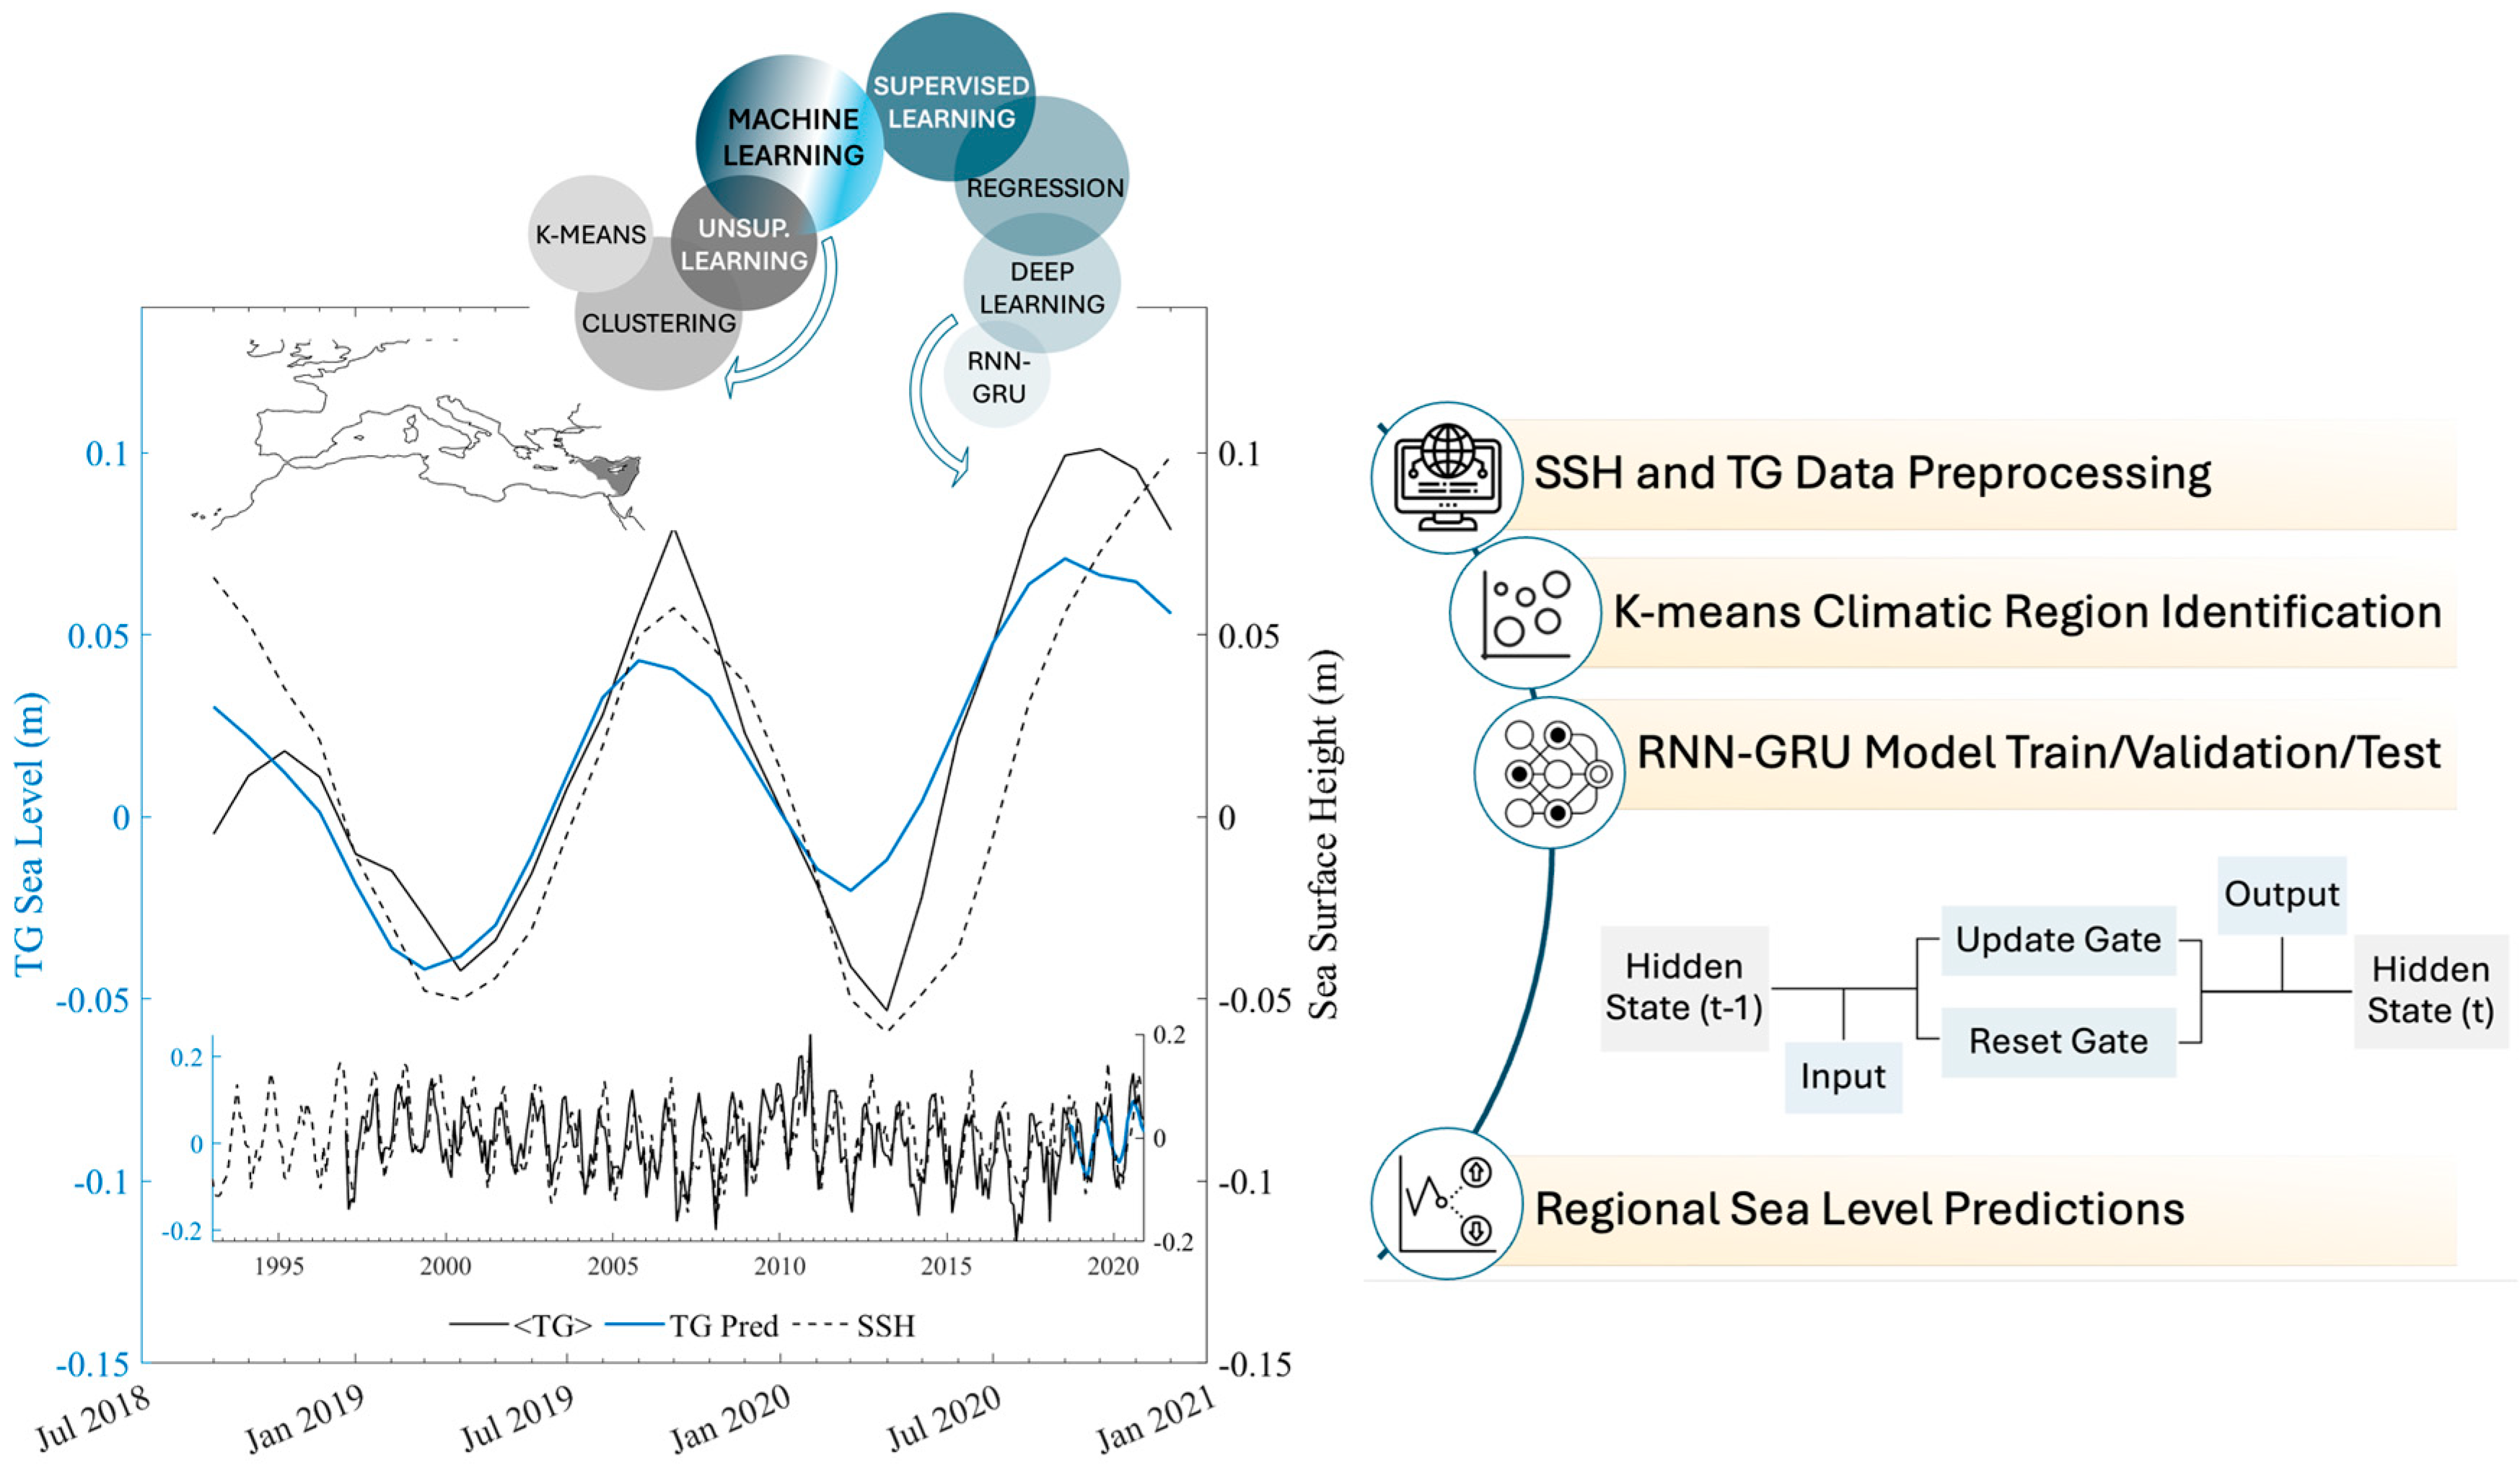
2. Data and Methods
2.1. Data Sources and Preprocessing Steps
2.2. Proposed Hybrid Methodology
2.2.1. Climatic Region Identification in the Mediterranean through SST Clustering
2.2.2. Advanced Neural Network Models for Region-Specific Coastal Sea Level Change Prediction
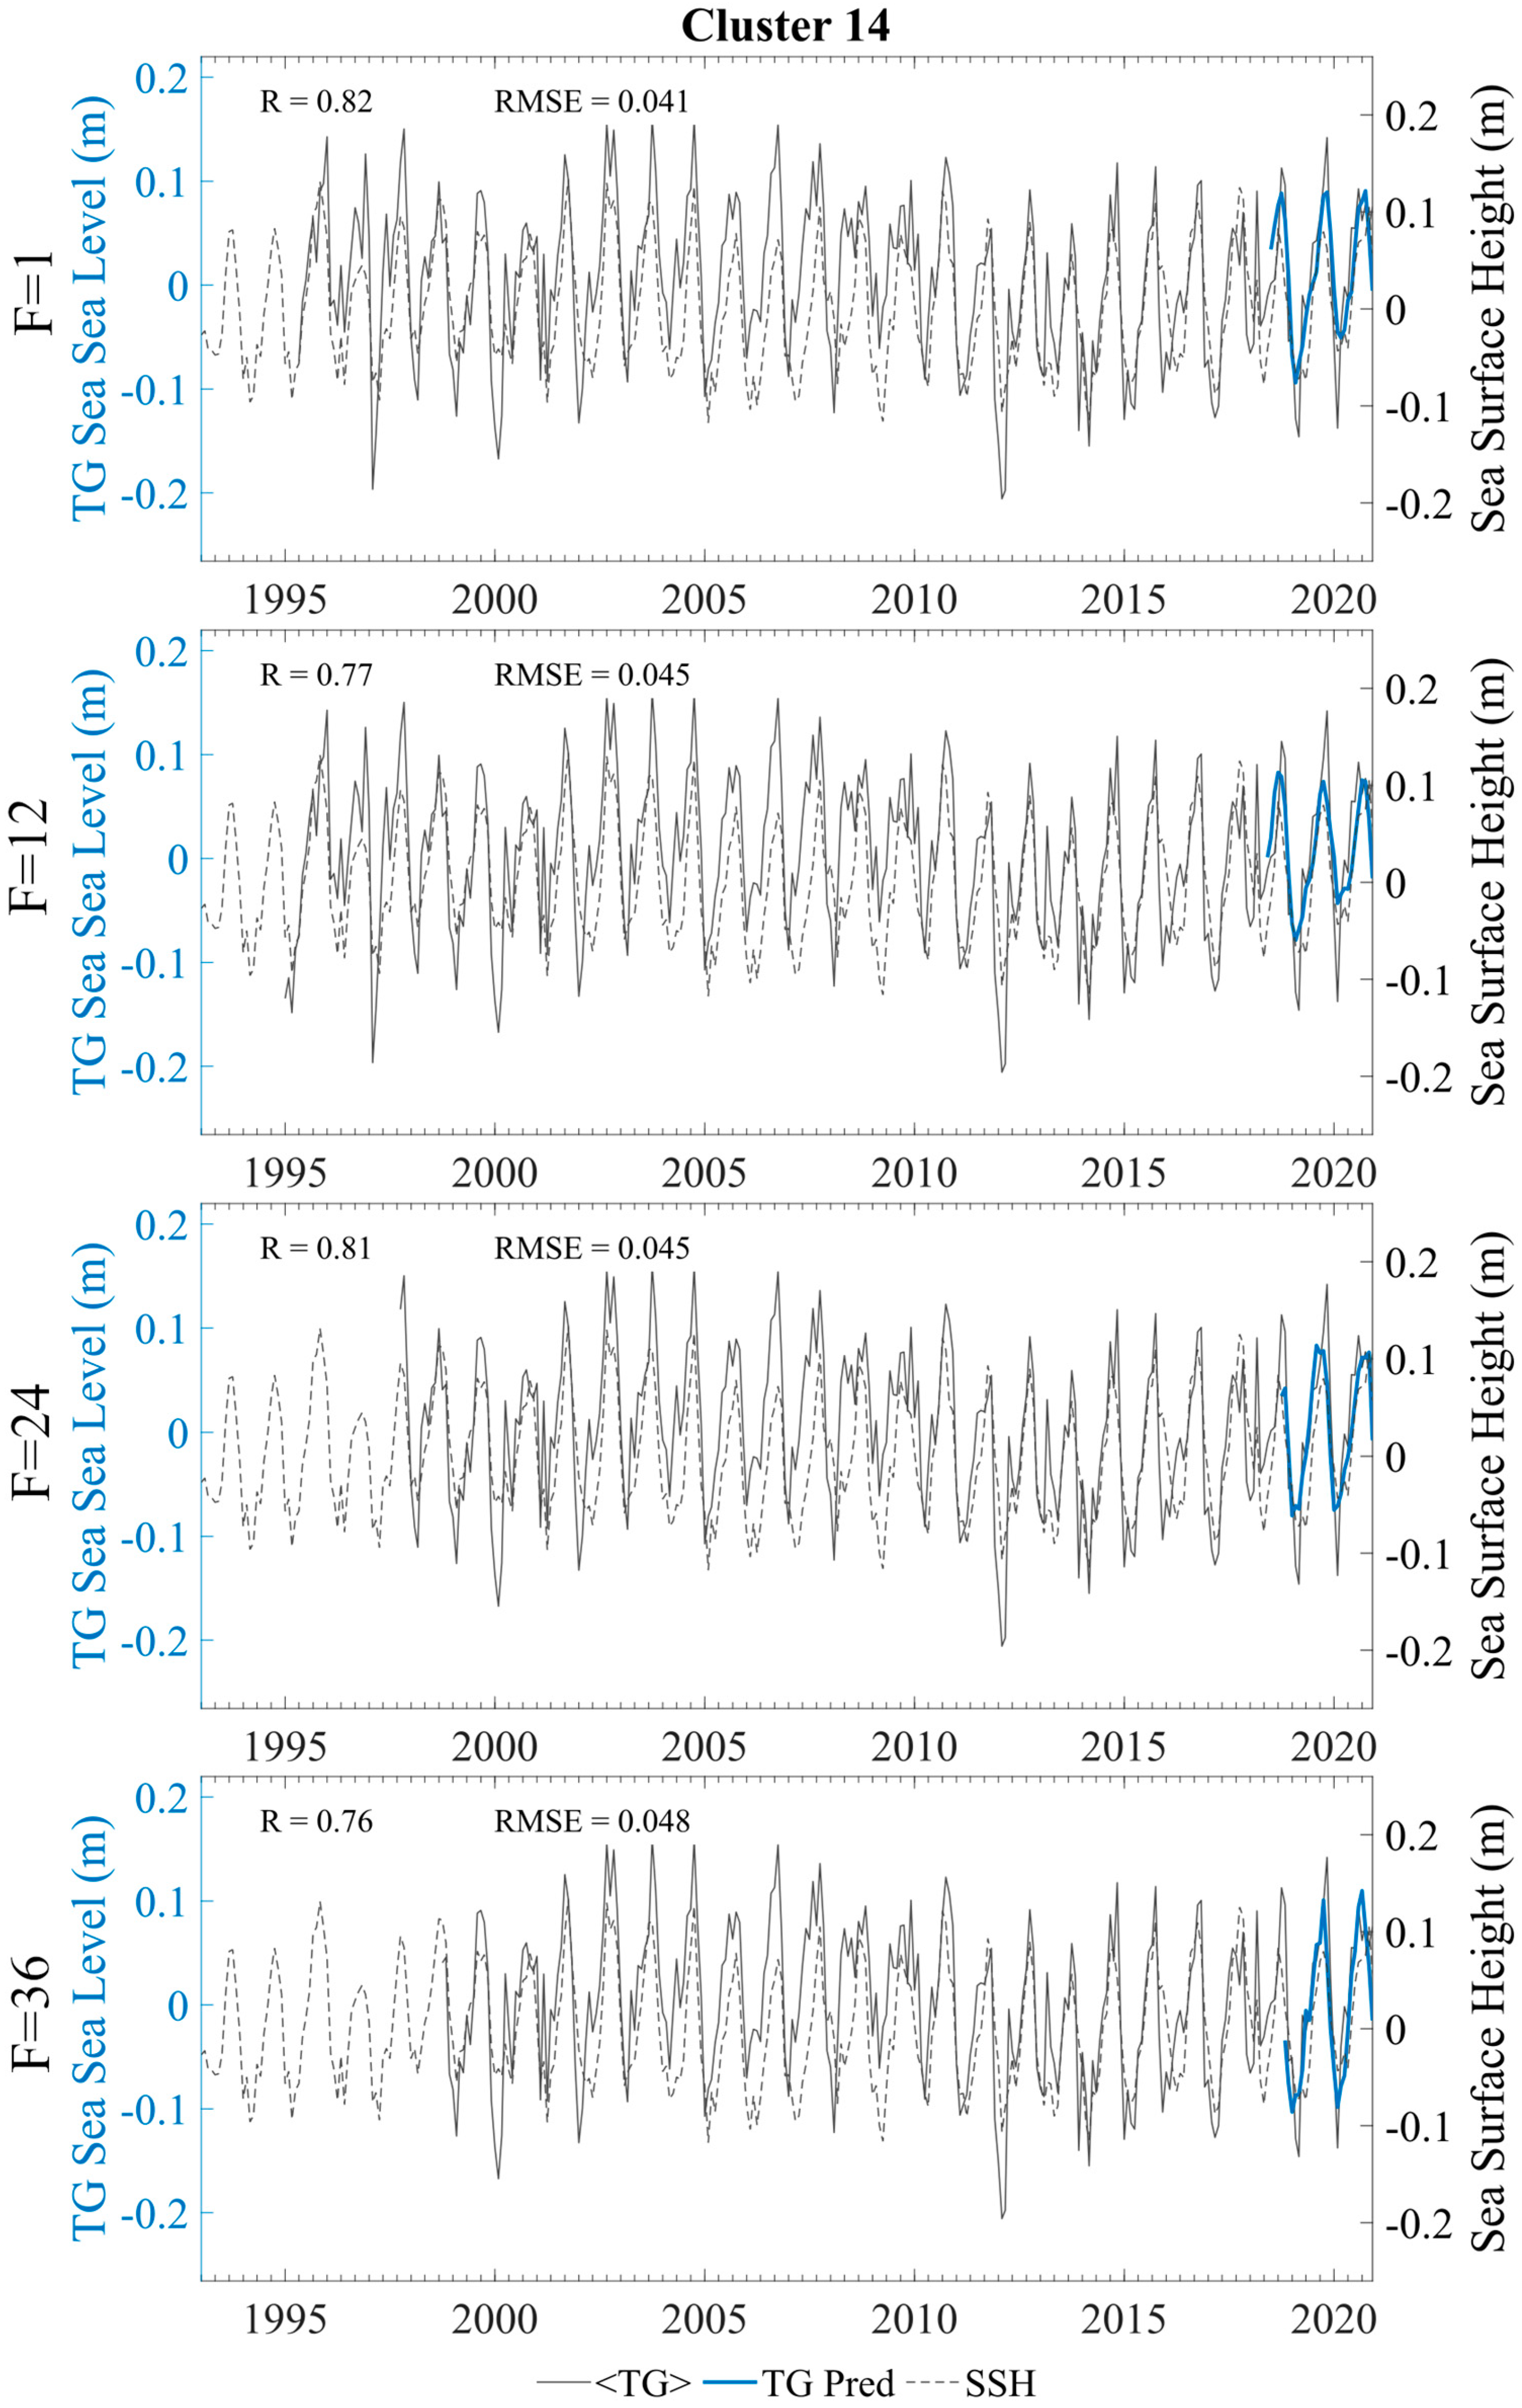
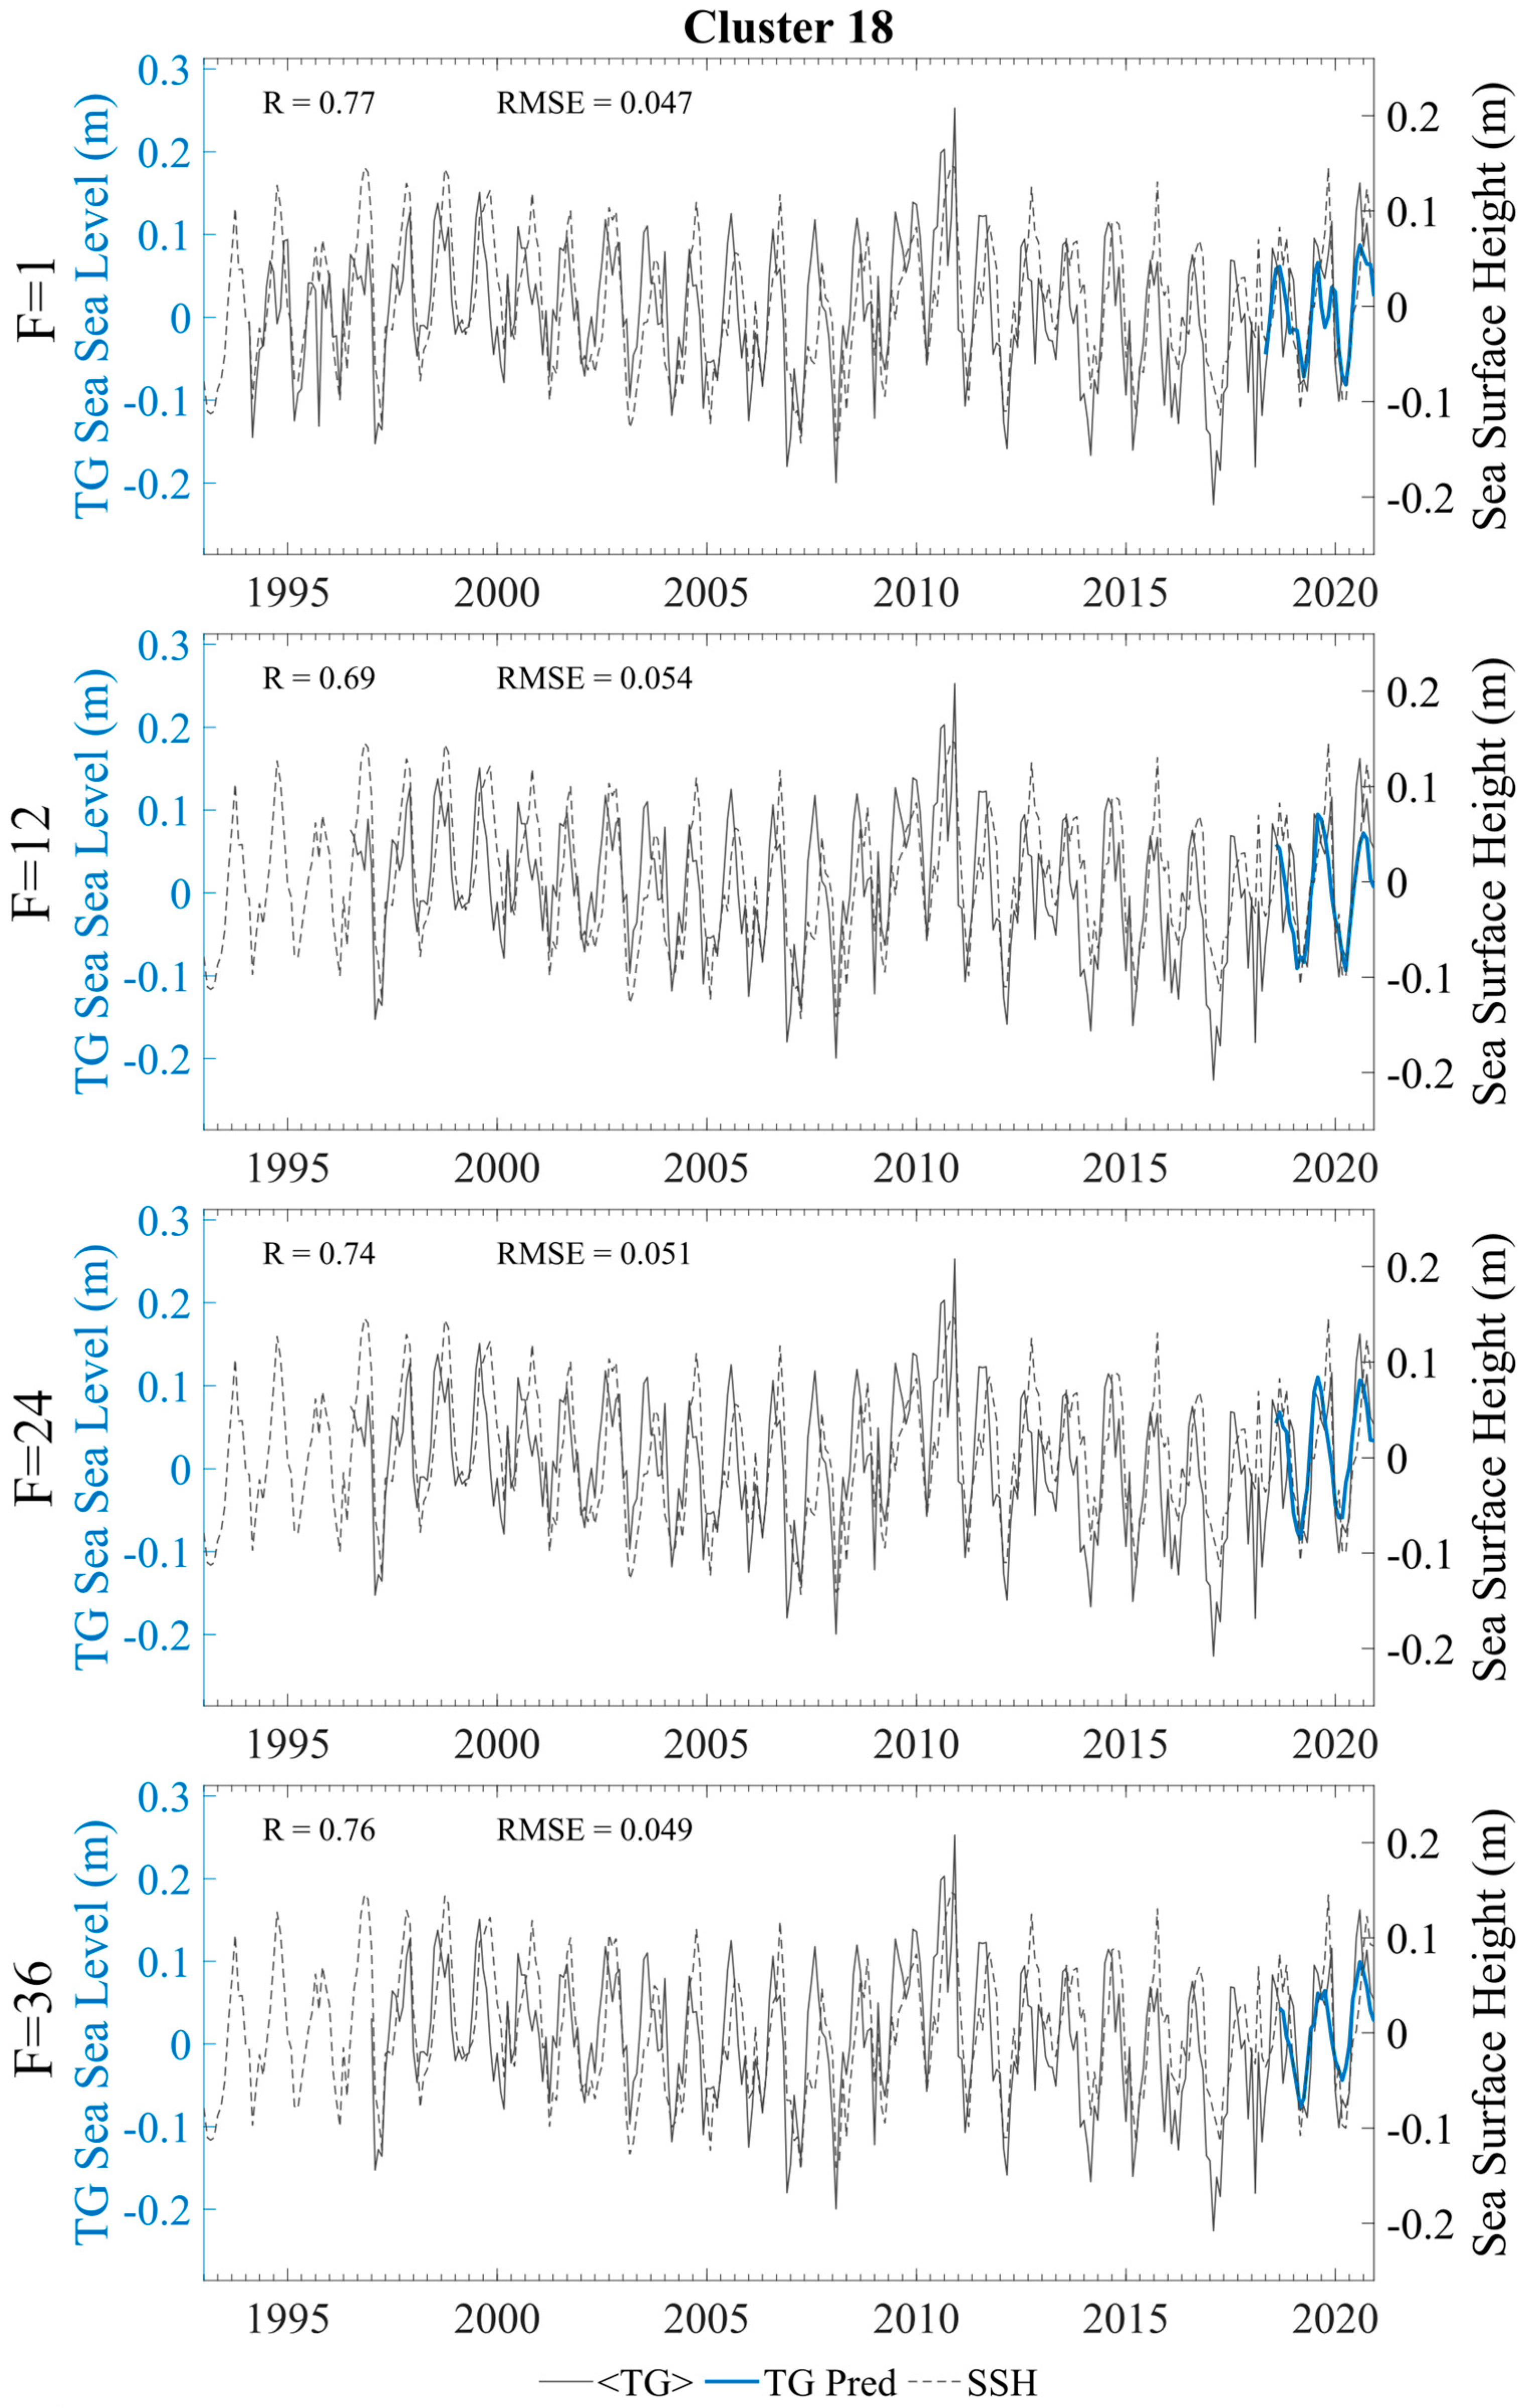
3. Results and Discussion
4. Conclusions
Supplementary Materials
Author Contributions
Funding
Data Availability Statement
Acknowledgments
Conflicts of Interest
References
- Widlansky, M.J.; Long, X.; Schloesser, F. Increase in sea level variability with ocean warming associated with the nonlinear thermal expansion of seawater. Commun. Earth Environ. 2020, 1, 9. [Google Scholar] [CrossRef]
- Slangen, A.B.A.; van de Wal, R.S.W.; Wada, Y.; Vermeersen, L.L.A. Comparing tide gauge observations to regional patterns of sea-level change, (1961–2003). Earth Syst. Dyn. 2014, 5, 243–255. [Google Scholar] [CrossRef]
- Satta, A.; Puddu, M.; Venturini, S.; Giupponi, C. Assessment of coastal risks to climate change related impacts at the regional scale: The case of the Mediterranean region. Int. J. Disaster Risk Reduct. 2017, 24, 284–296. [Google Scholar] [CrossRef]
- Pörtner, H.-O.; Roberts, D.C.; Tignor, M.; Poloczanska, E.S.; Mintenbeck, K.; Alegría, A.; Craig, N.H.; Langsdorf, S.; Löschke, S.; Möller, V.; et al. Climate change 2022: Impacts, adaptation and vulnerability. In Contribution of Working Group II to the Sixth Assessment Report of the Intergovernmental Panel on Climate Change; Cambridge University Press: Cambridge, UK; New York, NY, USA, 2022; p. 3056. [Google Scholar] [CrossRef]
- Vacchi, M.; Joyse, K.M.; Kopp, R.E.; Marriner, N.; Kaniewski, D.; Rovere, A. Climate pacing of millennial sea-level change variability in the central and western Mediterranean. Nat. Commun. 2021, 12, 4013. [Google Scholar] [CrossRef] [PubMed]
- Calafat, F.M.; Frederikse, T.; Horsburgh, K. The Sources of Sea-Level Changes in the Mediterranean Sea Since 1960. J. Geophys. Res. Oceans 2022, 127, e2022JC019061. [Google Scholar] [CrossRef]
- Vignudelli, S.; Birol, F.; Benveniste, J.; Fu, L.-L.; Picot, N.; Raynal, M.; Roinard, H. Satellite Altimetry Measurements of Sea Level in the Coastal Zone. Surv. Geophys. 2019, 40, 1319–1349. [Google Scholar] [CrossRef]
- Adebisi, N.; Balogun, A.L.; Min, T.H.; Tella, A. Advances in estimating Sea Level Rise: A review of tide gauge, satellite altimetry and spatial data science approaches. Ocean Coast. Manag. 2021, 208, 105632. [Google Scholar] [CrossRef]
- García, F.; Vigo, M.I.; García-García, D.; Sánchez-Reales, J.M. Combination of Multisatellite Altimetry and Tide Gauge Data for Determining Vertical Crustal Movements along Northern Mediterranean Coast. Pure Appl. Geophys. 2012, 169, 1411–1423. [Google Scholar] [CrossRef]
- Calafat, F.M.; Gomis, D. Reconstruction of Mediterranean sea level fields for the period 1945–2000. Glob. Planet. Chang. 2009, 66, 225–234. [Google Scholar] [CrossRef]
- Radin, C.; Nieves, V. Unveiling Regional Climate Patterns Through Global Subsurface Ocean Temperature Data: An AI Multi-Layer Analysis Framework. Earth Syst. Environ. 2024. [Google Scholar] [CrossRef]
- Cazenave, A.; Llovel, W. Contemporary Sea Level Rise. Annu. Rev. Mar. Sci. 2010, 2, 145–173. [Google Scholar] [CrossRef]
- Radin, C.; Nieves, V. Machine-Learning Based Reconstructions of Past Regional Sea Level Variability From Proxy Data. Geophys. Res. Lett. 2021, 48, e2021GL095382. [Google Scholar] [CrossRef]
- Nieves, V.; Marcos, M.; Willis, J.K. Upper-ocean contribution to short-term regional coastal sea level variability along the United States. J. Clim. 2017, 30, 4037–4045. [Google Scholar] [CrossRef]
- Mohamed, B.; Abdallah, A.M.; Alam El-Din, K.; Nagy, H.; Shaltout, M. Inter-Annual Variability and Trends of Sea Level and Sea Surface Temperature in the Mediterranean Sea over the Last 25 Years. Pure Appl. Geophys. 2019, 176, 3787–3810. [Google Scholar] [CrossRef]
- MacIntosh, C.R.; Merchant, C.J.; von Schuckmann, K. Uncertainties in Steric Sea Level Change Estimation During the Satellite Altimeter Era: Concepts and Practices. Surv. Geophys. 2017, 38, 59–87. [Google Scholar] [CrossRef] [PubMed]
- Meli, M.; Camargo, C.M.L.; Olivieri, M.; Slangen, A.B.A.; Romagnoli, C. Sea-level trend variability in the Mediterranean during the 1993–2019 period. Front. Mar. Sci. 2023, 10, 1150488. [Google Scholar] [CrossRef]
- Wang, G.; Cheng, L.; Boyer, T.; Li, C. Halosteric Sea Level Changes during the Argo Era. Water 2017, 9, 484. [Google Scholar] [CrossRef]
- Bruneau, N.; Polton, J.; Williams, J.; Holt, J. Estimation of global coastal sea level extremes using neural networks. Environ. Res. Lett. 2020, 15, 074030. [Google Scholar] [CrossRef]
- Naidu, G.; Zuva, T.; Sibanda, E.M. A Review of Evaluation Metrics in Machine Learning Algorithms. In Artificial Intelligence Application in Networks and Systems, CSOC 2023, Lecture Notes in Networks and Systems; Silhavy, R., Silhavy, P., Eds.; Springer: Cham, Switzerland, 2023; Volume 724, pp. 15–35. [Google Scholar] [CrossRef]
- Mahmoudi, S.; Moftakhari, H.; Muñoz, D.F.; Sweet, W.; Moradkhani, H. Establishing flood thresholds for sea level rise impact communication. Nat. Commun. 2024, 15, 4251. [Google Scholar] [CrossRef]
- Nieves, V.; Radin, C.; Camps-Valls, G. Predicting regional coastal sea level changes with machine learning. Sci. Rep. 2021, 11, 122. [Google Scholar] [CrossRef]
- Aparna, S.G.; D’Souza, S.; Arjun, N.B. Prediction of daily sea surface temperature using artificial neural networks. Int. J. Remote Sens. 2018, 39, 4214–4231. [Google Scholar] [CrossRef]
- Fannassi, Y.; Ennouali, Z.; Hakkou, M.; Benmohammadi, A.; Al-Mutiry, M.; Elbisy, M.S.; Masria, A. Prediction of coastal vulnerability with machine learning techniques, Mediterranean coast of Tangier-Tetouan, Morocco. Estuar. Coast. Shelf Sci. 2023, 291, 108422. [Google Scholar] [CrossRef]
- Pastor, F.; Valiente, J.A.; Palau, J.L. Sea Surface Temperature in the Mediterranean: Trends and Spatial Patterns (1982–2016). Pure Appl. Geophys. 2018, 175, 4017–4029. [Google Scholar] [CrossRef]
- Donlon, C.J.; Martin, M.; Stark, J.; Roberts-Jones, J.; Fiedler, E.; Wimmer, W. The Operational Sea Surface Temperature and Sea Ice Analysis (OSTIA) system. Remote Sens. Environ. 2012, 116, 140–158. [Google Scholar] [CrossRef]
- Holgate, S.J.; Matthews, A.; Woodworth, P.L.; Rickards, L.J.; Tamisiea, M.E.; Bradshaw, E.; Foden, P.R.; Gordon, K.M.; Jevrejeva, S.; Pugh, J. New Data Systems and Products at the Permanent Service for Mean Sea Level. J. Coast. Res. 2013, 29, 493–504. [Google Scholar] [CrossRef]
- Marcos, M.; Wöppelmann, G.; Matthews, A.; Ponte, R.M.; Birol, F.; Ardhuin, F.; Coco, G.; Santamaría-Gómez, A.; Ballu, V.; Testut, L.; et al. Coastal Sea Level and Related Fields from Existing Observing Systems. Surv. Geophys. 2019, 40, 1293–1317. [Google Scholar] [CrossRef]
- Papadopoulos, A.; Tsimplis, M.N. Coherent coastal sea-level variability at interdecadal and interannual scales from tide gauges. J. Coast. Res. 2006, 22, 625–639. [Google Scholar] [CrossRef]
- Roch, M.; Brandt, P.; Schmidtko, S. Recent large-scale mixed layer and vertical stratification maxima changes. Front. Mar. Sci. 2023, 10, 1277316. [Google Scholar] [CrossRef]
- Benveniste, J.; Cazenave, A.; Vignudelli, S.; Fenoglio-Marc, L.; Shah, R.; Almar, R.; Andersen, O.; Birol, F.; Bonnefond, P.; Bouffard, J.; et al. Requirements for a coastal hazards observing system. Front. Mar. Sci. 2019, 6, 348. [Google Scholar] [CrossRef]
- Michelangeli, P.A.; Vautard, R.; Legras, B. Weather regimes: Recurrence and quasi stationarity. J. Atmos. Sci. 1995, 52, 1237–1256. [Google Scholar] [CrossRef]
- Levitus, S.; Antonov, J.I.; Boyer, T.P.; Baranova, O.K.; Garcia, H.E.; Locarnini, R.A.; Mishonov, A.V.; Reagan, J.R.; Seidov, D.; Yarosh, E.S.; et al. World ocean heat content and thermosteric sea level change (0–2000 m), 1955–2010. Geophys. Res. Lett. 2012, 39, 1–5. [Google Scholar] [CrossRef]
- Ha, S.; Liu, D.; Mu, L. Prediction of Yangtze River streamflow based on deep learning neural network with El Niño–Southern Oscillation. Sci. Rep. 2021, 11, 11738. [Google Scholar] [CrossRef]
- Parras-Berrocal, I.M.; Vázquez, R.; Cabos, W.; Sein, D.V.; Álvarez, O.; Bruno, M.; Izquierdo, A. Surface and intermediate water changes triggering the future collapse of deep water formation in the North Western Mediterranean. Geophys. Res. Lett. 2022, 49, e2021GL095404. [Google Scholar] [CrossRef]
- Verri, G.; Furnari, L.; Gunduz, M.; Senatore, A.; Santos da Costa, V.; De Lorenzis, A.; Fedele, G.; Manco, I.; Mentaschi, L.; Clementi, E.; et al. Climate projections of the Adriatic Sea: Role of river release. Front. Clim. 2024, 6, 1368413. [Google Scholar] [CrossRef]
- Aydogdu, A.; Miraglio, P.; Escudier, R.; Clementi, E.; Masina, S. The dynamical role of upper layer salinity in the Mediterranean Sea. State Planet 2023, 1, 6. [Google Scholar]
- Millot, C. Circulation in the Western Mediterranean Sea. J. Mar. Syst. 1999, 20, 423–442. [Google Scholar] [CrossRef]
- Sakellariou, D.; Rousakis, G.; Drakopoulou, P.; Tsampouraki-Kraounaki, K.; Morfis, I.; Panagiotopoulos, I.; Livanos, I.; Loukaidi, V.; Kyriakidou, C.; Manta, K.; et al. Geomorphology, Geological Structure, Active Tectonics, and Basin Formation in the Aegean Sea. In The Aegean Sea Environment. The Handbook of Environmental Chemistry; Anagnostou, C.L., Kostianoy, A.G., Mariolakos, I.D., Panayotidis, P., Soilemezidou, M., Tsaltas, G., Eds.; Springer: Cham, Switzerland, 2021; Volume 127. [Google Scholar] [CrossRef]
- Trincardi, F.; Campiani, E.; Correggiari, A.; Foglini, F.; Maselli, V.; Remia, A. Bathymetry of the Adriatic Sea: The legacy of the last eustatic cycle and the impact of modern sediment dispersal. J. Maps 2013, 10, 151–158. [Google Scholar] [CrossRef]


Disclaimer/Publisher’s Note: The statements, opinions and data contained in all publications are solely those of the individual author(s) and contributor(s) and not of MDPI and/or the editor(s). MDPI and/or the editor(s) disclaim responsibility for any injury to people or property resulting from any ideas, methods, instructions or products referred to in the content. |
© 2024 by the authors. Licensee MDPI, Basel, Switzerland. This article is an open access article distributed under the terms and conditions of the Creative Commons Attribution (CC BY) license (https://creativecommons.org/licenses/by/4.0/).
Share and Cite
Radin, C.; Nieves, V.; Vicens-Miquel, M.; Alvarez-Morales, J.L. Harnessing Machine Learning to Decode the Mediterranean’s Climate Canvas and Forecast Sea Level Changes. Climate 2024, 12, 127. https://doi.org/10.3390/cli12080127
Radin C, Nieves V, Vicens-Miquel M, Alvarez-Morales JL. Harnessing Machine Learning to Decode the Mediterranean’s Climate Canvas and Forecast Sea Level Changes. Climate. 2024; 12(8):127. https://doi.org/10.3390/cli12080127
Chicago/Turabian StyleRadin, Cristina, Veronica Nieves, Marina Vicens-Miquel, and Jose Luis Alvarez-Morales. 2024. "Harnessing Machine Learning to Decode the Mediterranean’s Climate Canvas and Forecast Sea Level Changes" Climate 12, no. 8: 127. https://doi.org/10.3390/cli12080127