Abstract
The long instrumental series of precipitation in Pisa, the earliest one in Italy, has been reconstructed after the careful recovery and critical analysis of its history, data, and metadata. Precipitation amounts have been recovered from May 1707 to December 2024, but there are gaps due to lost data. The recovered dataset includes 47.4% of the total daily, 65.0% of monthly, and 77.4% of yearly values. Original observation registers and metadata are scarce or even missing, so a thorough investigation of contemporary sources has been performed to recover as much information as possible concerning observers, instruments, locations, exposures, measuring protocols, and ancient local units. The main features of the precipitation regime in Pisa have been investigated, and the variability in the amount and frequency at different time scales, as well as extreme events, have been analysed. Pisa is characterized by intense precipitation in autumn due to the penetration of Atlantic perturbations, and the most extreme daily events occur mainly in the transition period between the end of summer and the onset of autumn. A small decreasing trend has been found in the anomaly of the yearly amount in the 1867–2024 unbroken period, with the most remarkable month anomalies in summer. The time series of the Standard Precipitation Index indicates that the period around 1945 was particularly dry, and also indicates a slight increase in arid conditions over time, mainly in spring. The most extreme yearly amounts were found in the 18th century, and the series of the daily 90th and 95th percentiles show a small decreasing trend in the 1884–2004 period. The comparison with other contemporary Italian series made it possible to identify the peculiarity of the precipitation regime in Pisa, adding an important piece to the historical research on the climate of the Italian peninsula from a long-term perspective.
1. Introduction
The invention of the rain gauge (1639), the liquid-in-glass thermometer (1641), the barometer (1643), and the first network of regular meteorological observations known as ‘the Medici Network’ (1654–1670) were promoted in Florence by the Grand Duke of Tuscany Ferdinand II and the Academy of Cimento, also funded by the Grand Duke. Pisa University was the official University of Tuscany, where the Grand Duke appointed some of his academicians, among them Evangelista Torricelli (the inventor of the barometer), Vincenzo Viviani (who built the first barometer and made the first experiment), and Alfonso Borelli. Viviani and Borelli were active in the Medici Network, and performed regular sub-daily observations of temperature and pressure from November 1657 to May 1658. The related data and metadata have been already recovered and published [1,2]. This brilliant beginning was interrupted in 1670, when the Grand Duke died. Consequently, the Inquisition was free to interrupt the atmospheric observations considered dangerous for religious doctrine, and dispersed the academicians. The situation of distrust towards science created by Galileo’s trial for heresy in 1633 lasted for several decades, causing meteorological observations to disappear in Italy. Some climate notes were considered acceptable, when finalized to interpret public health, or for agricultural purposes.
At the beginning of the century, scientists started to take meteorological observations not only for health and agricultural purposes, but also to perform investigation of global hydrological balances, including precipitation, water from springs, and river flow and discharge. The early data were collected in different ways, with non-standardized instruments and protocols, and recorded in local units. In addition, no metadata were added to describe instruments, location, and exposure. Extensive research has been devoted to rescuing, recovering, correcting, and interpreting the earliest meteorological observations in Italy, and this paper focuses on precipitation in particular. General issues related to the threshold of early rain gauges and the collecting level has been discussed in other papers [3,4]. The longest precipitation series in Italy are Pisa, Padua, and Bologna.
Pisa is the longest series ever produced. It started in 1707, but unfortunately, it is affected by major gaps. The first observer was Michel Angelo Tilli [5], who put a rain gauge in the Giardino dei Semplici, which was a part of the Botanical Garden of the University of Pisa. In Padua, Poleni observed irregularly from 1713, and regularly from 1725. This series is unbroken, and observations have continued until the present. The dataset has already been fully recovered and analyzed [6,7,8].
Bologna is in third place. Jacopo Bartolomeo Beccari started precipitation measurements in 1723. The series was affected by gaps in the period after Beccari’s death in 1766 up to 1814. The recovery and correction of the century has been completed [9]. The recovery of the century is underway.
It must be said that, in 1545, both the University of Padua and Pisa founded a garden to collect and study herbs and plants. These were the earliest botanical gardens in Europe. The garden of Pisa was born as Giardino dei Semplici (i.e., Garden of Simples), also known as Physic Garden, which in old Tuscan means ‘garden of medical herbs’ [10]. The name means a garden devoted to cultivation and display of medicinal plants that could have immediate therapeutic actions (i.e., simple), without needing further manipulation or transformation. This was a scientific approach to cultivating and studying the medieval herbal remedies cited in monastic manuscripts, i.e., the beginning of modern pharmacology. The Garden of Pisa was relocated in 1563, 1591, and in 1814, when it widened its purposes, beginning to include other types of plants, and was renamed a ‘Botanical Garden’. Later, the BG and its structures (a museum of natural history, and a laboratory for physical and chemical experiments) belonged to the faculty of Botany [11,12,13,14]. The Head of BG was the Professor of Botany. Until 1814 he was named Prefect, and after 1814, Director.
Over time, two other locations in Pisa had started observations, resulting in two sub-series. In 1878, the Royal High School of Agriculture of the Faculty of Botany and Agriculture of the University began observations; in 1874, the Grand Duke of Tuscany Pietro Leopoldo di Lorena, in agreement with the Archbishop Angelo Franceschi, founded the Meteorological Observatory ‘Donati’ in S. Caterina, which was the seat of the Seminary. A further station was located on the countryside, in 1806, nearly 10 km from Pisa. The original registers of these sub-series have been lost. However, some data survived and were only partially rescued. Thorough research has been conducted to rescue more data from these parallel sub-series with the aim of combining these data and reconstructing a sound series.
The state-of-the-art of the Pisa series can be summarized as follows. Only six years of the century have been recovered so far, i.e., 1775–1780, and the last twenty years of the century, while the subsequent period is known. More precisely, Eredia [15] recovered the monthly values of three parallel sub-series collected at the end of century: from 1867 to 1876 at the Botanical Garden; from 1880 to 1915 at the Royal High School of Agriculture; and from 1888 to 1915, at the ‘Donati’ Observatory in S. Caterina. Rapetti and Ruschi [16] recovered and analysed the 1775–1780 period. Rapetti [17] relied on Eredia [15], constructed a short history and analysis of that period, and compared these parallel observations. Most of the early period is known as monthly or yearly averages, with several gaps.
The sub-series of the Royal High School of Agriculture was analysed by Rastrelli [18] for the 1878–1936 period, and then by Moonen et al. [19] for the 1878–1998 period.
The Pisa dataset constitutes an intriguing issue, not only for its contribution to past climate knowledge, but also for making the way of thinking known at the onset of meteorological observations, when instruments and operative protocols were not yet shared, scientifically developed, nor standardized.
The first aim of this study is to improve the knowledge of the origins of this series at Pisa University and its Botanical Garden and recover to the furthest extent possible the missing data (especially daily data) and metadata at the highest time resolution. The second aim is to investigate this precipitation series (e.g., transforming old units into modern ones, assessing its reliability and homogeneity, and applying statistical tests) to analyze climate changes and extreme events over the whole 1707–2024 period. The paper is focused on unexploited Italian data from the and centuries. The parallel Italian records since 1867 are also considered. The interest is not limited to climate, but includes key topics of the history of science.
2. Origin and Problems of the Series of Precipitation in Pisa
2.1. Origin, Data and Metadata
In 1707, William Derham was taking regular observations in Upminster and decided to start an informal small network of weather observations. On behalf of the Royal Society, London, he invited Michel Angelo (MA) Tilli from Pisa and Johannes Ja. Scheuchzer from Zurich to collect regular meteorological observations and send them to him. Collected data were published in Philosophical Transactions [5], that were followed by a short note [20]. This was the origin of a long series of precipitation in Pisa that continued over time at the Faculty of Botany of Pisa University. Especially in the first two centuries, this series was affected by several problems. For instance, the original registers were lost almost completely, and some surviving data, recorded in unusual units, were scattered among several publications. Metadata concerning the instrument, exposure, site, relocations, observational protocol, and sampling rate were poor or missing. In certain periods, the observer too was uncertain, either due to not being mentioned or because the readings were attributed to different people, e.g., the assistant who was charged with reading or the Director. The precipitation was measured with daily frequency. However, only a part of data survived with the original daily frequency; other parts arrived summarized as monthly or yearly amounts.
Lacking original notes or metadata, the interpretation of the readings is particularly difficult. In the early period, MA Tilli sent to Derham the collected amount in local weight units not normalized for the cross section of the funnel, and left out any information about its size. Derham [5,20] tried to interpret these data, and finally published two columns: one with the original units, and another in which he tried to transform these units into English Troy pounds and hundredths of pounds. He had doubts about the conversion that, actually, was formally correct, but with bizarre values. Cirillo [21] also criticized that the precipitation was expressed as a bulk weight, not normalized for the cross section of the particular funnel. When Toaldo [22] published a table comparing the average precipitation in 48 stations over different countries, including those in Europe, North Africa, and North America, he commented that the data by MA Tilli and his co–worker Carlo Taglini in Pisa, Modena and Garfagnana were not credible because the values were too high. Was this a bad measurement indicating that the data had to be rejected, or were the data expressed in badly normalized units and should have been corrected? Luckily, the contemporary Vallisneri [23], who knew how MA Tilli operated, provided the key to interpreting these readings.
From the second half of the century, some scholars started to use the French inch in oder to be understood at international level, or when local data were reported in international publications, e.g., Schouw in his overview of the climate of Italy [24]. In 1799, the French troops led by Napoleon conquered Tuscany, that was annexed to the French Empire from 1808 to 1814. On 17 September 1814, the Grand Duke of Tuscany Ferdinand III returned and re-established the local measurement units. The data taken during this transition period (e.g., the observations by Carmignani from 1806 to 1817) are expressed in inches without further specification. We have recognized that they should be intended as Paris inches.
Most of the observations of the and centuries were published in local magazines which reported the amounts as daily, monthly, seasonal, or yearly values. Sometimes it was mentioned that the data were collected at Botanical Garden (BG), often without specifying who actually made the observations. In the century, there was a further complication because the BG was the fiefdom of a powerful family, where the Director Michel Angelo Tilli brought in his nephew Angelo Attilio Tilli, and later Angelo Attilio did the same with his son Gian Lorenzo Tilli. All these persons had the same family name; when the Christian name was not specified, this generated confusion.
2.2. Measurement Units
In the century, observers used three methods to measure the collected precipitation amount [25]. The first method was related to the weight, using a balance, so the amounts were registered in terms of pounds, ounces, and lines, following the example of Townley in the UK [26] and Philippe de la Hire in France [27]. The weight permitted the ability to deal equally with rain and snow, without needing to melt the latter. The second method was related to the volume, using vessels of different sizes, e.g., Toaldo in Padua [25] and Beccari in Bologna [9]. The third method was related to the depth, using a calibrated rod, e.g., Poleni in Padua [6]. The collected water depends on the funnel volume, which in the earliest period was not specified. The depth measurement is magnified by the ratio between the sections of the funnel and the vessel.
Today, with the metric decimal system, things are easy: given a linear unit of 1 cm, volume unit of 1 cm3, and a weight unit of 1 g, water has density 1 g cm−3, so that the weight of a certain amount of water numerically equals its volume, and dividing the amount (either weight or volume) of collected water by the cross section of the funnel one obtains the precipitation depth. In the century and most of the century, things were different. The linear dimension was referred to as a number of anatomic items, e.g., arm, foot, and inch, that were not simply related to each other; the volume was described using several units referring to the capacity of particular containers traditionally used for specific liquids (e.g., wine and oil had different units) or for grains; the weight was derived from the unit of weight used by ancient Romans. Therefore, the numerical value of the collected water depended on the particular units specific to each method, and the transformation from weight or volume to depth, and the normalization for the cross section, were quite complex. Sometimes, two parallel columns were produced: one for weight and one for depth. Moreover, local units were used, and there were some differences according to the location, e.g., Padua, Bologna, and Pisa had different units of weight, volume, and depth [28]. In addition, the Paris foot and inch were sometimes used.
In this paper, the transformation from the local units used in the Dukedom of Tuscany (including Florence and Pisa) during the century to the international system (SI) is based on the official conversion Tables, approved by the Royal Decree of Victor Emmanuel II of Savoy, No. 8886, dated 20 May 1877, that established the related values in metric units when Italy was unified as a single country [29]. Units of length, volume, and weight, and their transformations, are reported in Appendix A, Table A1.
The collected precipitation amounts were mostly reported in terms of weight, i.e., Florence libra and oncia, or in terms of depth, i.e., braccio, soldo, and denaro. In some publications, the Paris inch was used, i.e., inch, line, point. Another potential source of misunderstanding is that in the century the name oncia was popularly used either for length (i.e., pollice, inch) or for volume (i.e., ounce). In the Roman times, the basic bronze coin was divided into 12 smaller coins named oncia. This memory survived until the Middle Ages and beyond, and the term oncia was equivalent to of a certain unit, irrespective of the unit type, either weight (libra) or length (foot). In Anglo Saxon Countries, the same term was borrowed, but a distinction was made, using ounce for weight and inch for length. In Italy, oncia remained unchanged for both. Moreover, the amounts were reported using a single unit (e.g., weight or length), or two different units (e.g., weight and length), and/or the units used in different locations (e.g., length in Florence and Paris units) in two distinct columns. Sometimes the values in the two columns were measured separately with different methods (e.g., weight and depth), or one was derived from the other through calculations. Small differences could be attributed to approximations in measurement or calculations.
Another source of small departures is due to the fact that some authors transformed the depth in French inches, or expressed the funnel size in Paris units, and rounded digits to these units; this gives slightly different results than rounding to local units, i.e., 3% approximation.
Finally, a note on the dating style. The precipitation collected on behalf of the Royal Society, London, follows the Julian calendar used in the UK. This applies to MA Tilli, who published in Philosophical Transactions [5], and Taglini [30]. Other data are reported using the Gregorian calendar. In this study, all data have been converted to Gregorian calendar.
2.3. Observers
Michel Angelo Tilli (1655–1740) (Figure 1a) was a nobleman, medical doctor, Professor of Botany at the Pisa University from 1685 till his death in 1740, Prefect of the Giardino dei Semplici (i.e., Garden of Simples, part of the Botanical Garden (BG) of the University), and fellow of the Royal Society, London [31,32]. He was an internationally appreciated scientist and his Catalogus Plantarum was frequently cited together with Linnaeus and by Linnaeus himself [33]. In 1707, he started a regular series of observations following Derham’s invitation [5]. However, he sent his data in Florence libra and once, but omitted all metadata, as well as the normalization the collected amount by dividing it by the funnel size. It is likely that given the general mindset of the century, metadata were considered necessary only in the event the author had noticed something unknown, or different from the usual. Therefore, they considered what they did ‘normal’, and found it unnecessary to provide explanations. MA Tilli observed until 1720; following this, he continued to promote observations.

Figure 1.
Leading observers of the Pisa precipitation series. (a) Michel Angelo Tilli (1655–1740); (b) Carlo Taglini (1680–1747); (c) Giorgio Santi (1746–1822); (d) Gaetano Savi (1769–1844); (e) Pietro Savi (1811–1871). All cropped. Credits: (a) Library System of La Sapienza University, Rome; (b) Österreichische Nationalbibliothek, CC-BY; (c) Orto e Museo Botanico, Pisa University; Wikipedia, CC-BY; (d) Wellcome Collection, CC-BY; (e) Deutsches Museum, Archiv. CC-BY-NC-SA 4.0.
Carlo Taglini (1680–1747) (Figure 1b) was Professor of (natural) Philosophy and Physics from 1714 to his death in 1747, and a fellow of the Royal Societies of London and Paris. Taglini was inclined to letters, philosophy, theoretical physics, and field observations. He was not a nobleman; he began his career as an assistant of MA Tilli, and reached high credit based on his own activities. His books were highly renowned [34]. When James Jurin, on behalf of the Royal Society, London, launched a plea to join the novel meteorological network [35], Taglini accepted and published the yearly values of precipitation in Pisa and Livorno from 1721 to 1736 [30]. Taglini was particularly attracted by theoretical studies, and made some calculations regarding the hydrological balance on a wide scale. In 1736, he abandoned meteorological observations and moved on to analysing and discussing the principles on which the meteorological instruments were grounded, and to studying the physics underlying the music of violins and birdsong [36].
Angelo Attilio Tilli (1710–1781) (also named only Angelo, Angiolo, or only Attilio), nephew of Michel Angelo, was a lecturer of Botany from 1732, and when his uncle died, he became full Professor and Prefect of the Garden of Simples, from 1740 to 1781, when he died. His career was favoured by his powerful uncle: he essentially cared for the administration of the Garden, but left no publications, except for short weather summaries published in local magazines. Calvi [31] wrote that he made daily meteorological observations from 1735 to 1757. These ended when the chair of Chemistry was instituted, and the personnel were partitioned between Botany and Chemistry.
Giovan Lorenzo Tilli (unknown birth and death) (also named only Giovanni, Gio, Gian, Lorenzo, or Johannes Laurentius), son of Angelo Attilio, studied a lot and achieved little: he studied medicine, natural history, and botany, was the keeper of the Museum and the Garden, and Assistant of the Professor of Natural History. Giovan Lorenzo frequented the Garden of Simples and in 1766 informally began recording observations, hoping to reach a stable position. He never reached the level of lecturer, although in 1775 he was appointed to informally teach Natural History, show and explain exhibits from the Museum of Natural History, and publish weather observations [31]. However, a few years later, in 1782, the Grand Duke of Tuscany appointed Giorgio Santi as Professor of Natural History and Director of the Garden. With the new Director, Giovan Lorenzo was relegated to the role of assistant and abandoned his observations. He was interested in the relationship between the local climate (i.e., his weather records) and vegetation, but was unable to conclude this study. Like his father, he never published scientific papers, except for tables of precipitation totals in local magazines [32].
Giorgio Santi (1746–1822) (Figure 1c) was a naturalist, chemist, botanist, geologist and zoologist. He was appointed Professor of Natural Sciences from 1782 to 1822, and Director of the Museum of Natural History and prefect of BG from 1782 to 1814. In 1783, when the Societas Meteorologica Palatina’s Mannheim launched the international meteorological network [37], including the recommendation to collect the rain from roofs, Pisa possessed a long history of field experience. However, Giorgio Santi was not interested in meteorological observations, or wanted to put an end to the Tilli’s legacy, and did not join the Palatina Network.
Gaetano Savi (1769–1844) (Figure 1d) studied with Giorgio Santi and Adolfo Targioni Tozzetti. He graduated in medicine in 1795 and became Professor of Physics and Botany at the Pisa University. Savi published some treatises concerning the flora of Tuscany and Italy, and directed the BG from 1814 to 1843 [38,39]. He continued weather observations, but the precise period over which he did so is uncertain. Only some fragments have been discovered.
Vincenzo Carmignani (1779–1859) was a naturalist, medical doctor, and botanist. He was a scholar of mycology and botany [40]. Contemporarily to Gaetano Savi, he made parallel meteorological observations in a locality named Madonna del Piano (MP) to investigate the hydric balance for agricultural purposes. As for Gaetano Savi, only fragments of his observations have survived up until now.
Pietro Savi (1811–1871) (Figure 1e), son of Gaetano Savi, was assistant to his father from 1830 at the chair of Botany at the University and replaced him in lessons from 1834. He became an Adjunct Professor in 1839 and Full Professor in 1844. When his father died, he became Director (from 1843 to 1871). He continued weather observations, after his father.
The history of the Botanical Garden and the activity of the personnel is documented in several papers [11,12,13,14,31,32]. Meteorological observations taken after 1867 at the BG were recovered by Eredia [15] (monthly amounts between 1867 and 1876) and Pitoni [41] (monthly amounts and frequencies from January 1867 to December 1888). After this date, there is no more information about meteorological measurements at BG.
When Italy was unified, Florence became the capital of Italy for a short period, i.e., from 1865 to 1871. With the unification, the meteorological observations were reorganized, and all stations started to follow specific protocols, and were controlled to reach a standard level. These changes generated two new stations.
The Regia Scuola Superiore di Agraria (SA) (i.e., Royal High School of Agriculture) was founded in 1874 and became operative in 1878, and was controlled by the Faculty of Botany and Agriculture of the University, with Director Girolamo Caruso. Monthly data were collected and published by Eredia [15]. In addition, the magazine L’Agricoltura Italiana published the monthly values from December 1877 onwards, and daily values from January 1888 onwards. Measurements have continued until now, and allow the implementation, without gaps, of the precipitation series started at BG.
The Observatory ‘Donati’ in S. Caterina (SC) at the Seminary of Pisa was founded in 1888 with Director Francesco Bardelli. Monthly data were reported in Eredia [15]. However, after 1915, the measurements became irregular; therefore, they have been excluded from this work.
2.4. The Location
Pisa is a city of Tuscany in Central Italy, crossed by the Arno River, just before it empties into the Ligurian Sea (Figure 2a). The sites of the earliest observations are reported in Table 1 and shown in a contemporary map (Figure 2b).
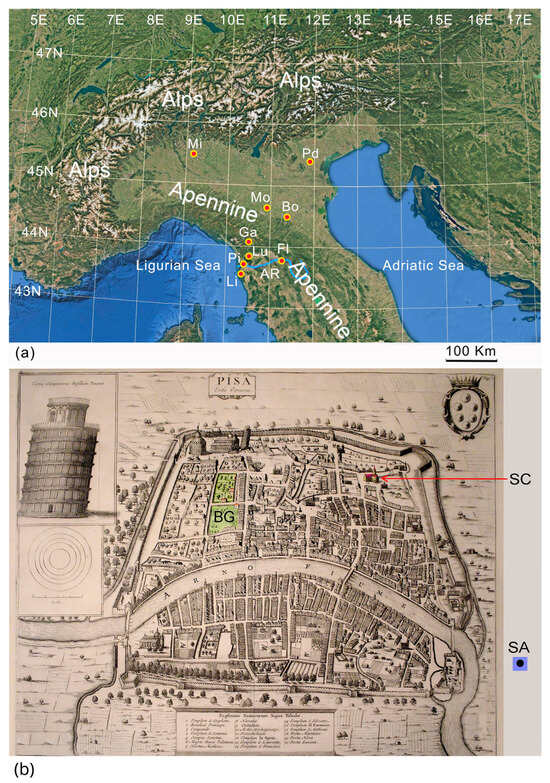
Figure 2.
(a) Map of Northern and Central Italy showing the Arno River and the localities mentioned in this paper: AR: Arno River; Bo: Bologna; Fl: Florence; Ga: Garfagnana; Li: Livorno; Lu: Lucca; Pd: Padua; Pi: Pisa; Mi: Milan; Mo: Modena. (Credits: Google Earth, Landsat, adapted). (b) The three sites of the precipitation observations in a map of Pisa dating 1627–77. BG, highlighted green: Botanical Garden; SC: Meteorological Observatory ‘Donati’ in S. Caterina, where the arrow highlights the adjacent church of S. Lorenzo, later demolished; SA: Royal High School of Agriculture, just outside the border of the map. Credits: Pisa Karte, Wenzel Hollar (engraver), Albertina, Vienna. CC-BY.

Table 1.
Sites where the earliest observations were taken.
Pisa was a small city, and all the urban sites were a short distance apart, i.e., in the map the distance BG–SC km, and SC–SA km. The exact identification of places and buildings has required attention because the city experienced floods, bombing and destruction due to war, and renovations and expansions; in addition, the BG was enlarged over time, and even its buildings were transformed and demolished, and new ones were built.
2.5. Building and Exposure
In Pisa, the contemporary publications were mainly focused on history, scholars, scientific aspects, naturalistic collections, and magnificent drawings of plants and flowers. None of them particularly considered where the rain gauge was placed, at what height, on which building, nor whether it had a clear horizon or not. For the history of the BG, two publications in particular are worth mentioning [14,42].
MA Tilli, in his Catalogue of Plants [43], in addition to the classification of plants and their graphical representation, enclosed two maps of the garden and related buildings, with a detailed legend, including the buildings and the funnel exposure. The first map (Figure 3a) shows two buildings, one with label 15 (our label CL–F) and another with labels 9 and 10 (our label HB). The legend reports the following labels and comments, i.e., «15. Chemical Laboratory, external side facing the Garden. In this building the Anthalia pneumatic machinery is located. On the roof a funnel is located, to collect rain. Dr W. Derham wrote about these measurements in the Transactions [i.e., [5]], as well as in Demonstrations [i.e., [20]]. The external part of the building is decorated with stones, corals, statues… etc.… ».
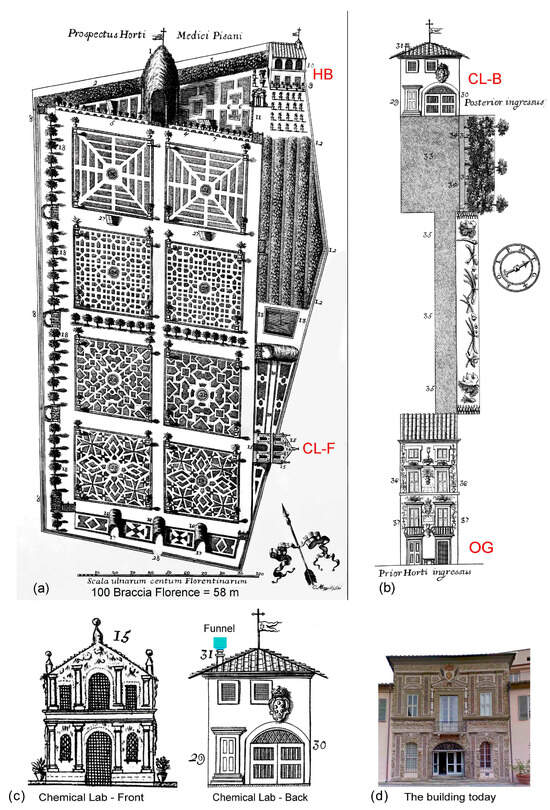
Figure 3.
Instrument configuration in the Botanical Garden. Drawings engraved by Cosimo Mogalli in [43]. (a) Drawing of the Garden with buildings. The rain gauge was in the Chemical Laboratory (CL–F), front view; HB: heated building for overwintering plants vulnerable to cold. Labels composed of small numbers belong to the original drawing; added labels are CL–F and HB. The scale on the bottom is in Florence braccio (in Latin Ulna), . (b) Second drawing with the connection between the Old Gate (OG) from the street to the Garden, now 55–57 S. Maria Street; CLB: Chemical Laboratory from back and further gate to the Garden. (c) Front and back view of the Chemical Lab in the drawing; (d) View of the same building today. Credits: (a–c) Library System of La Sapienza University, Rome. CC-BY-NC-SA 4.0.
The second drawing (Figure 3b) shows detail of the building used as a second entrance (our label OG) and of another, markedly different building as a first entrance (our label CL–B). The description of the parts in building CL–B indicated with numbers are: «29. Door of the Chemical Laboratory, where the Anthalia pneumatic machinery is located, facing the entrance »; «30. Second gate to the public Garden, where the portraits of the leading Botanists are contained»; and «31. On the roof, the funnel to catch rain». From the detailed descriptions, and the decorations mentioned in the text, we can deduce that the buildings CL–F and CL–B are the same building, i.e., the Chemical Lab (CL), seen from the front (CL–F) and from the back (CL–B). The building had several uses, i.e., a furnace, physical and chemical lab, museum of natural exhibits, and director’s residence on the upper floor. A comparison of the front and back views of the chemical lab versus its appearance today is shown in Figure 3c,d. The funnel was located on the chimney of the CL building (label 31). It has been added in cyan color. The OG building was a gate, but also another museum for natural collections and portraits, and a residence for the caretaker.
The two drawings of the BG in Figure 3a,b have a scale in Florence braccia, from which the approximate level of the funnel can be assessed, i.e., 10–12 m above ground level (agl). Today the base of the roof is about 10 m agl, and the top of the roof around 12–13 m. It is very likely that the funnel was situated m agl. The funnel was far from other buildings, and in the early period the BG had small medicinal plants. However, the situation changed in subsequent centuries, when tall trees were planted, and new buildings erected (Figure 4a).

Figure 4.
(a) Aerial view of the Botanical Garden nowadays, with arrows indicating the Chemical Laboratory (CL–F, yellow arrow) and the Old Gate (OG, cyan arrow) (Google Maps). (b) The entrance to the Botanical Garden from Santa Maria Street [43]. Library System of La Sapienza University, Rome. CC-BY-NC-SA 4.0.
The actual position of the building is shown in Figure 4a with an aerial view of the BG. The original drawings were very accurate, as can be recognized by comparing the only building left untouched, i.e., OG, with a current picture (Figure 4b). CL–F is also recognizable, except for the upper part, which has been partially transformed, and the pinnacles that have been abated. As opposed, CL–B is not yet visible, and HB was abated.
The above is confirmed by another independent source, i.e., the German traveller Georg Christoph Martini who described his journey in Italy, where he settled and became the secretary to the ambassador of Lucca in Vienna from 1736 to 1742 when he died. He wrote: «You pass through a long atrium above which there are natural finds including the skeleton of a whale…. Then you cross a small courtyard and enter a small building. Here experiments are done with the pneumatic machine of Boyle or Anthalia. Observations of the annual rain are also made using a copper funnel, one foot square, and placed over a flask. The building’s facade facing the garden is decorated in the Grotesque style with tuff and all sorts of stones…» [44]. From the description, the entrance was the Old Gate, and the small building the Chemical Lab.
In conclusion, the funnel was located on the top of a chimney, on the roof of a two-storey building, near the edge of BG, in the city centre. It must be considered that the Director of the BG lived on the top floor of the Chemical Lab. Like Poleni in Padua and Beccari in Bologna, MA Tilli, his nephew AA Tilli, and his son GL Tilli could measure comfortably staying at home. Conversely, when Giorgio Santi became Director in 1782, he was likely unhappy that an observer entered his house to measure the collected water, and thus stopped the series. When Gaetano Savi became Director, he found the instruments left by the Tilli family in the attic and continued the observations. It is likely that the instruments and location of measurement were the same, because his measurements are compatible with the previous ones.
With the reformation in 1867, the building of the Chemical Lab was named Gabinetto di Fisica (i.e., Laboratory of Physics), and Pitoni [41] specified that the rain gauge was located on the roof at 14.25 m agl. This suggests that the funnel was on the top of the roof, not at mid-level as before. Temperature, pressure, and humidity were measured too, but not wind, because the horizon was disturbed by buildings and trees. Even though the observation station was not located in the best position, it was preserved, keeping homogeneity with the previous records.
2.6. The Instrument
When Taglini wrote his book dealing with atmospheric air and how to measure it [30], he reported an interesting figure (Figure 5a) with the instruments for meteorology, i.e., a Florentine thermometer, a Torricelli barometer, and a rope hygrometer. The latter is composed of a wheel fixed to a wall; an extreme of the rope is fixed to a nail and the other to a ballast. When the rope shrinks or swells, the change is transmitted to a pointer, i.e., the tension of the rope and the friction rotate the wheel with a pointer, and the position is read on a circular scale [3]. Surprisingly, in this book, he reported precipitation data, but not the instrument. It is likely that he was proud of the above instruments, but not of the rain gauge that consisted of a popular funnel for wine in barrels, as we know following Vallisneri, Taglini, Martini, and GL Tilli [23,30,44,45].

Figure 5.
(a) Meteorological instruments illustrated by Taglini [30] (Credit: Österreichische Nationalbibliothek, CC-BY). Title: Measuring everything. Legend: FT: Florentine thermometer; TB: Torricelli barometer; H: rope hygrometer; B: ballast; N: nail to fix the rope; P: pointer; S: circular scale; W: wheel. (CC BY-NC-ND-SA 4.0). (b) An old funnel named pevera, popularly used in Tuscany for wine in barrels (Credit: Museo Etnografico Romagnolo ‘Benedetto Pergoli’ Forlì. CC BY-NC-ND 3.0). (c) Funnel mounted on a roof chimney [46].
MA Tilli started the series using a cubic funnel to pour wine in barrels, locally named pevera (Figure 5b), but omitted any information about the rain gauge and funnel size. However, he specified the exposure, i.e., that the funnel was on the roof of the Chemical Lab as indicated in Figure 3c. An example of how to fix the funnel on a chimney (Figure 5c) can be found in [46]. The medical doctor and naturalist Antonio Vallisneri wrote a book focused on the origin of springs, fountains, and rivers [23]. He reported the yearly precipitation amounts measured by MA Tilli in Pisa for the period 1708–1724 and in Livorno for 1721–1724, as well as the totals measured by Corradi d’Austria in Modena in 1715–1724, and in Garfagnana in 1715–1716. Vallisneri also wrote that the funnel used by MA Tilli had a square cross-section, and the side was Florence braccio, i.e., 29.18 cm, and transformed it in 10 Paris inches and 9 lines, i.e., 29.10 cm, with 3% approximation.
MA Tilli measured the collected water in terms of weight. It must be remembered that he omitted normalization of the collected water, i.e., he reported the bulk weight without dividing it by the funnel cross-section area.
Ten years later, Taglini confirmed that the funnel had a square section, braccio wide, and added that the rainwater was collected in a cubic receptacle with the same cross section [30]. This method penalized the resolution, but made direct depth measurement easy, avoiding the transformation from weight to depth. Martini [44] witnessed that the instrument consisted of a copper funnel, about one foot square, and placed over a flask. As the transformation from weight to depth was quite difficult with the use of the local units, Taglini took the flask from under the funnel, and poured the collected water into a cubic container having the same side as the funnel. Therefore, the level reached by water corresponded to the real precipitation depth, and he could measure it simply by dipping a graduated rod. Very likely, the same funnel and method were used by all the observers in the century, except the first one, MA Tilli, who used the same funnel but measured by weight.
The instrument used by Carmignani in the first half of century was not described. The Nuovo Giornale de’ Letterati published the tables with daily amounts, writing only that the rain was collected during the «natural 24 h», and that the units were inches, lines, and its fractions.
In 1865, the technician Mariano Pierucci published a catalogue of all the instruments that could be built in the Laboratory of Physics of the Pisa University, and their cost [47]. The list of meteorological instruments includes two rain gauges, i.e., Babinet and Mangon. It is likely that these two instruments were at the University, and that the technician could build a replica of them. The Babinet rain gauge was normally produced in Paris, and is shown in Figure 6a [48,49]. It is composed of a funnel, a reservoir, and a drainage. An option is an external graduated glass tube to read the depth. The Hervé–Mangon rain gauge has the same operating principle, but is larger in size (Figure 6b) [50]. In conclusion, in the second half of the century, the rain gauge exposed on the roof of the Laboratory of Physics in the BG was very likely the funnel of a Babinet, or a Hervé–Mangon rain gauge.

Figure 6.
(a) Two models of the Babinet rain gauge, with and without the external graduated tube. With the external tube, rain is read as depth; if rain is collected in the graduated flask, it is measured by volume. From Chevalier [48] and Pietra Santa [49], respectively. (b) Hervé–Mangon rain gauge with graduated tube and graduated flask [50]. CC BY-NC-SA 4.0.
3. Available Data and Gaps
An overview of the survived data rescued in this study is shown in Figure 7. Unfortunately, for most of the early period, only yearly totals are available which makes an analysis of extreme events impossible. The most critical situation is seen for the century. The data for this period are scattered among various sources, most of them local magazines, as shown in Figure 8.
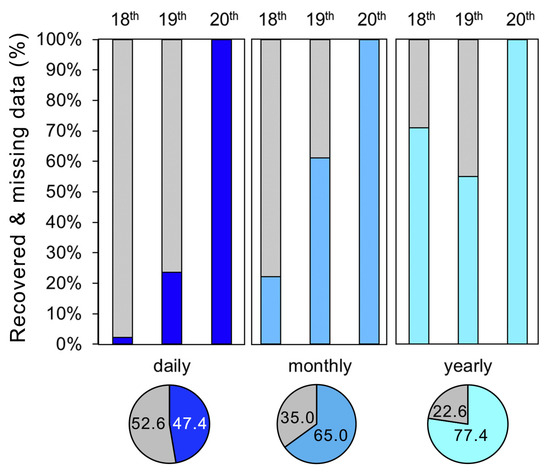
Figure 7.
Overview of the data of the , , and centuries recovered with this study. Column diagrams: dataset by centuries; pie diagrams: the whole dataset. Percentage of recovered data are specified by daily, monthly, and yearly resolution. Grey bars indicate missing data.
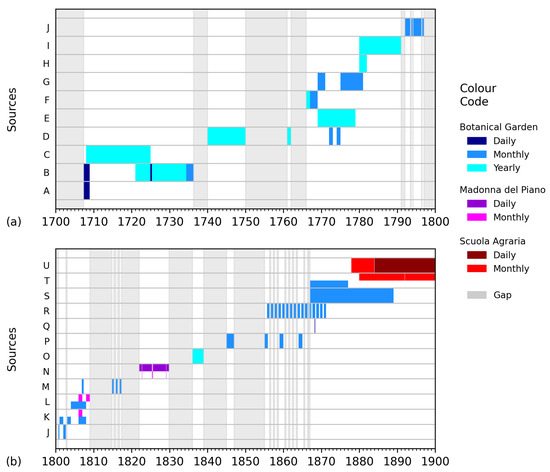
Figure 8.
Overview of the sources and detail of data rescued over the (a) and (b) centuries. Legend of the sources: A [5]; B [30]; C [23]; D [51]; E [52]; F [53]; G [45]; H [54,55]; I: Manuscript Frullani 40; J: Manuscript; K [56,57,58,59]; L: Other Journals; M [60]; N [61]; O [62]; P [63,64,65]; Q [66]; R [67]; S [41]; T [15]; U: Agricoltura Italiana.
In conclusion, starting from January 1707 and spanning to December 2024, 47.4%, 65.0%, and 77.4% of daily, monthly, and yearly amounts have been recovered, respectively. Daily data are available for the last 134 years, but in terms of the early periods, they are available also from May 1707 to December 1708, and from January 1822 to October 1829. Significant monthly data are missing from the century, from which only 22% has been recovered. The situation is better in the next century, where the percentage rises to 61%. Concerning yearly data, the situation is better for the century, with 71% of data recovered, compared to the century with only 55%.
Vincenzo Carmignani published in some scientific magazines of the Grand Dukedom of Tuscany or in the Giornale Astrometeorologico of Toaldo, principally monthly precipitation amounts, frequency, and air temperature. The most interesting observations are in the period 1822–1829, throughout which nearly eight years of daily data were published in tables on the Nuovo Giornale de’ Letterati (from issue No. 2 to No. 19) [24]. These data were organized in tables with daily measurements of temperature, pressure, precipitation amount, wind direction, and weather comments. From these data, it is possible to also quantify the monthly frequency.
Gaetano Savi, like his previous colleagues, was not very interested in the meteorological aspect, and only a few fragments of data have been retained up until the present day: monthly amounts from 1792 to 1796, 1800, and 1802 (manuscripts); a few tables published in some scientific magazines of the Grand Dukedom of Tuscany from 1804 to 1807; and yearly amounts from 1836, 1837, and 1838. He sent his measurements to Toaldo, who published for some years the monthly amounts in his Giornale Astrometeorologico.
Monthly amounts from Pietro Savi’s observations were published in some issues of Il Cimento (1845, 1846), Il Nuovo Cimento (1855, 1859, 1864), and in the Atti della società Toscana di Scienze Naturali (from 1867 to 1888). Daily amounts from 3 to 14 March 1868 have been found in the weekly magazine Gazzetta di Pisa.
4. Data Analysis
4.1. Statistical Tests
Before any data analysis, it was necessary to compose the final series. This was complex; several problems affected the recovered data. Such problems, and their solutions, are described in Section 4.2.
The completion of the series, among other things, required the investigation of the compatibility of the parallel observations made at different sites. To this end, the Student’s t-test was applied. The t-test is one of the most popular statistical techniques used to test whether the mean difference between two groups is statistically significant. The null hypothesis states that both means are statistically equal, whereas the alternative hypothesis states that the means are statistically different from each other [68,69]. The t-test was performed using the Python (3.13.2) statistical package Scipy [70].
Once the series was completed, it was necessary to assess its homogeneity before proceeding with any further analysis. The selected homogeneity tests are listed in Table 2 along with their main features, i.e., their ability to detect one or more change points, in which parts of the series they showed greater sensitivity, and related references, where further details are provided. These tests were performed with the Python package Pyhomogeneity [71]. Absolute tests were used as opposed to relative ones, as not enough contemporary series were available in nearby areas to make a robust comparison. The following absolute tests were applied: the Standard Normal Homogeneity test (SNH), the Buishand U (BU), and the Pettitt test. All these tests suppose, under the null hypothesis, that the values of the dataset are independent and identically distributed. Under the alternative hypothesis, they assume that a change point in the mean is present. In this case, all of them can identify when the change point happens. To verify the null hypothesis, each test calculates a statistical value, a function of the yearly amount of precipitation. If this value is above a critical parameter (threshold), the null hypothesis is rejected. The mathematical formulation of the three tests and the critical parameters can be found in the original works [72,73,74] and in the Appendix A of Wijngaard et al. [75].
Table 2.
Main features of the homogeneity tests used in this study.
Homogeneity tests require a continuous dataset. Since the series of Pisa is affected by several gaps, the time periods corresponding to the gaps have been eliminated, and the end of each sub-series was made to coincide with the beginning of the next one. With this method, a continuous sequence of data was created, which, however, differs from the regular sequence of years in the broken periods. The tests were performed on the continuous dataset composed of all of the existing readings, ordered from the oldest to the most recent ones. Therefore, the main scale in the abscissa of Figure 9 (black color) refers to the position in the continuous sequence of values. A second scale has been added to show the temporal sequence in the unbroken periods (blue color). The vertical red lines indicate the positions where gaps have collapsed.
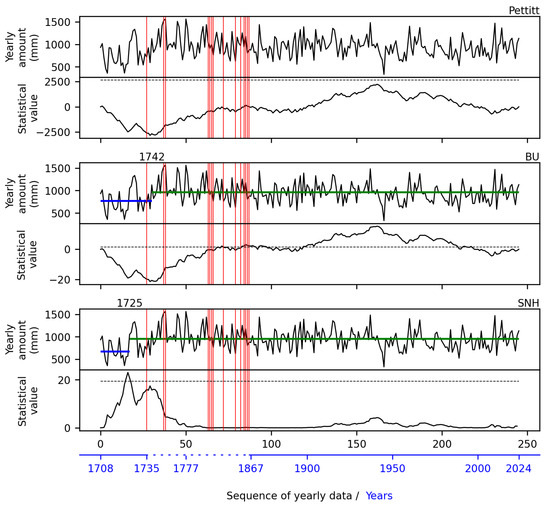
Figure 9.
Homogeneity tests applied to yearly precipitation amounts in Pisa. Data are joined collapsing gaps; red lines are the junction points. Dashed lines are 5% critical values. Blue and green lines are the mean values before and after the change point.
The Pettitt homogeneity test always remains below the threshold (dotted lines in Figure 9), whereas the BU and SNH tests revealed change points at the years 1742 and 1725, respectively. Since only one of the three tests rejected the null hypothesis in 1725 and 1742, the yearly precipitation series was considered homogeneous [75,76,77]. To find additional changing points, these three tests were also applied to sub-series obtained using the data immediately after the two main change points (1725 and 1742). No further discontinuities were found.
The same analysis was also performed on the twelve-monthly series, and no change points were found. Thus, based on the results of the homogeneity tests, it is possible to conclude that the precipitation series of Pisa is homogeneous, and that no correction is needed.
As some tests may not work properly if there is a trend in the series, it is important to check if it is statistically significant and, in such a case, to interpret the results of the homogenization tests critically. Therefore, the non-parametric Mann–Kendall (MK) trend test was used, which does not require any underlying assumption about the normality of the data [78,79]. The MK test is used to determine whether a time series has a monotonic upward or downward trend. A monotonic upward (downward) trend means that the variable increases (decreases) through time, but the trend may or may not be linear. The MK test is a non-parametric (distribution-free) test which does not require that the residuals from the fitted regression line be normally distributed. The null hypothesis for this test is that there is no trend. The test is statistically significant when the p-value is less than 0.05. In this case, the null hypothesis of the test should be rejected, and it should be concluded that a trend is present in the data. The parameter m indicates the slope of the interpolation line, i.e., the value of the trend. A positive value of m indicates an increasing trend; conversely, a negative value indicates a decreasing trend. In the case of no significant trend, the slope has not been estimated. The MK test was performed using the Python statistical package pyMannKendall [80].
4.2. Problems with the Recovered Data
The precipitation in the BG was recorded daily, from May 1707 till December 1888. The first question arises around when MA Tilli took readings, i.e., whether he was following a precise protocol and observing every day at the same hour, or if his observations were event–driven, i.e., once rain had stopped. In the latter case, the daily totals may have included the rain over longer sampling periods, e.g., more than 24 h, or two or more days. This practice is almost irrelevant for the monthly and especially the yearly totals, but diminishes the monthly and yearly frequency of rainy days and increases the incidence rate of extreme precipitation. For instance, this bad practice was applied in Padua from 1812 to 1864 [8].
To recognize the reading protocol used by MA Tilli, the distribution of the subsequent rainy days was checked for the years 1707–08 [5], i.e., how many times precipitation was noted for a single day, preceded and followed by clear days, or occurred for two, three, or four consecutive days. In principle, records with consecutive rainy days are possible even in the bad practice of waiting for the rain to stop, for two basic reasons: the rain was actually stopped and recorded, but the next day the weather worsened with further precipitation; or the collecting flask was full and needed to be emptied.
The situation in 1707–1708 compared with the 1991–2020 reference period is represented in Figure 10. It is evident that the frequency of MA Tilli’s observations of rain occurring in a single day is almost twice the frequency in the reference period, while the frequency of rain lasting for two, three, or more days is highly penalized. This suggests that the daily observations of Tilli were not taken at exactly the same hour of the day, but that sometimes the observer waited for the rain to stop to measure it, or decided to read in the next day the amount of precipitation that started a short time before. In other terms, the observing day was not strictly composed of a 24 h cycle, but was adapted to include precipitation that was started a short time before the beginning of an observing day, or that began near the end of the day. An alternative hypothesis is that the rain gauge had a high threshold, or relevant evaporation losses, and lost light rains. The conclusion is that one or two light rains were missed each month, or that on one or two occasions the water was combined with the next day’s rain. It is very likely that in the century, all observers followed the same protocol, i.e., the same kind of funnel, chimney exposure, and readings in depth units. MA Tilli was the first to start, and used the same funnel and exposure, but measured by weight. This unit was untenable, and was soon abandoned.
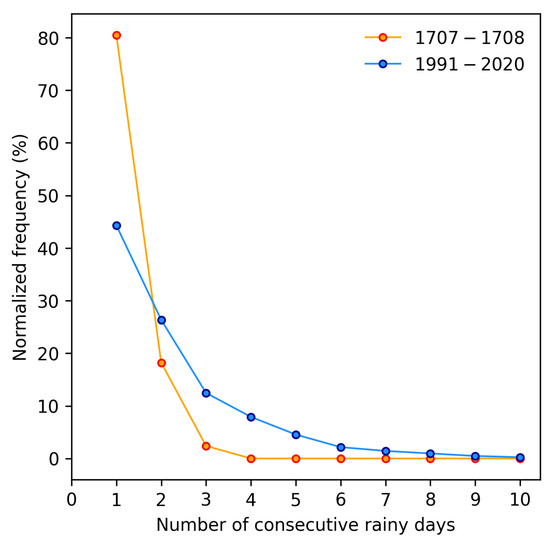
Figure 10.
Frequency of consecutive rainy days in 1707–1708 and in the 1991–2020 reference period.
In the early years of the century, Vincenzo Carmignani measured precipitation contemporary to Gaetano Savi, but unfortunately only monthly data from 1806 have been found for both [81], i.e., not enough to estimate a transfer function from Carmignani’s to Savi’s observations. A direct comparison between the two records shows that the monthly amounts of Carmignani are generally lower than those of Savi, except in summer when the convective activity generates showers with significant local differences. This explains why on the hills Carmignani observed values higher than Savi on the coast. The randomness of these differences suggests that if one wants to use hill data to fill lowland gaps, it is preferable to accept some uncertainty and avoid unreliable corrections. Therefore, the missing daily values from January 1822 to October 1829, and the monthly amounts from 1808, were filled with those of Carmignani.
For some months, i.e., September 1822, May, June, and August 1825, and February 1829, the daily records from Carmignani are missing, and only monthly amounts are available. Monthly frequencies were estimated using Carmignani’s daily weather notes.
In some periods, inconsistencies were found between data published in different articles. When this happened, the choice was based on credibility criteria, e.g., use of a direct or indirect source, and determining the most authoritative and best informed source, as follows:
- The amount from December 1708 was missing [5,30], but it was possible to calculate it from the yearly amount reported by Vallisneri [23];
- Monthly amounts from 1774 and 1775 reported in Magazzino Toscano [82] were exchanged. The right values were also found in Giornale de’ Letterati [83] (monthly amounts from 1774) and Novelle Letterarie [52] (yearly amounts from 1774 and 1775);
- Monthly amounts from 1807 have been found in three different articles [59,60,84]. Savi [84] reported different values for April, May, October, and November compared to Toaldo [59] and Carmignani [60]. It has been ascertained that Toaldo and Carmignani’s publications were more accurate;
- Carmignani [60] reported monthly amounts for six months (from November to April) of the cold seasons of the years 1806–1807, 1814–1815, 1815–1816, and 1816–1817. The data from 1806 and 1807 shows the same precipitation measurements as those by Savi [81,84]. The values published by Carmignani [60] should be recognized to be measured by Savi;
- Monthly amounts of SA were found both in Eredia [15] and in some issues of the journal L’agricoltura italiana, edited by SA. The published data curated by the observer was preferred;
- The monthly amounts from May and June 1887, reported by Pitoni [41] for the BG, seemed to be reversed, i.e., May instead of June and vice-versa (red stars in Figure 11a). This was confirmed by comparing BG with Florence and other stations, and was corrected (red triangles in Figure 11a).
 Figure 11. Comparison of the monthly amounts measured in the BG and SA. (a) BG and SA. Bisector and fitting lines are dashed black and green solid lines, respectively. Red stars and triangles highlight the precipitation amounts exchanged (see text). (b) Distributions of monthly amounts measured in the BG and SA over the common period.
From December 1877 to December 1888, parallel observations were made in BG and SA. A direct comparison over the common period is shown in the scatter plot of Figure 11a. The fitting line (in green) is on the bisector, and indicates good agreement.
The monthly distributions at the two sites have the same general behavior, i.e., an exponential
where the coefficients a (around 18) and b (around ), reported in Figure 11b, are affected by random departures caused by local effects. This has also been confirmed by the cross comparison of the cumulative values of BG versus the cumulative values of SA. The Student’s t-test applied to these monthly series gives 0.05.
In conclusion, the two stations are not far from each other, and provided data whose distributions are very close to each other. Therefore, in the subsequent analysis, from January 1888 until the present, the daily data of SA were used, without needing transformations to homogenize the two periods.
4.3. The Precipitation Regime in Pisa
The precipitation regime in Pisa is characterized by intense rain in autumn due to the penetration of Atlantic perturbations and a dry period in summer, broken up by some thermo–convective activity. The 1991–2020 monthly averages are represented in Figure 12. Following the WMO 2007 [85] and WMO 2017 [86] directives for climate normals, the 1991–2020 monthly values have been used as a reference to compute the precipitation anomalies.
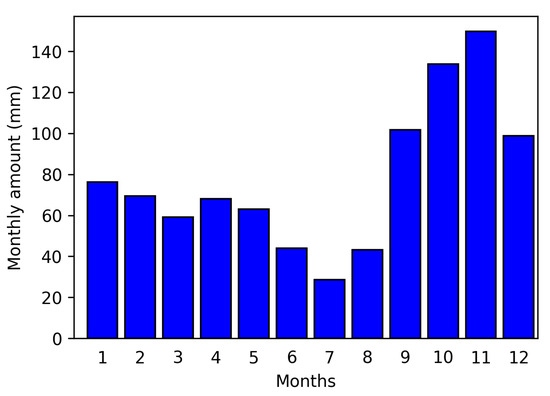
Figure 12.
Monthly precipitation amounts in Pisa during the 1991–2020 reference period.
4.4. The Recovered Series and the Extreme Values Exceeding Selected Percentiles
The recovered daily, monthly, and yearly precipitation amounts are reported in Figure 13. The gaps in the series are highlighted in grey and concern the first half of the series, spanning up until the middle of the century. The scatter of data shows high variability in precipitation over the centuries, without marked differences in the most recent decades. Following IPCC 2014 [87] and WMO 2023 [88], extreme events have been highlighted using horizontal lines, corresponding to some selected percentiles of the upper tail of the distribution of precipitation, according to the extreme value theory (EVT) [89,90,91,92,93].
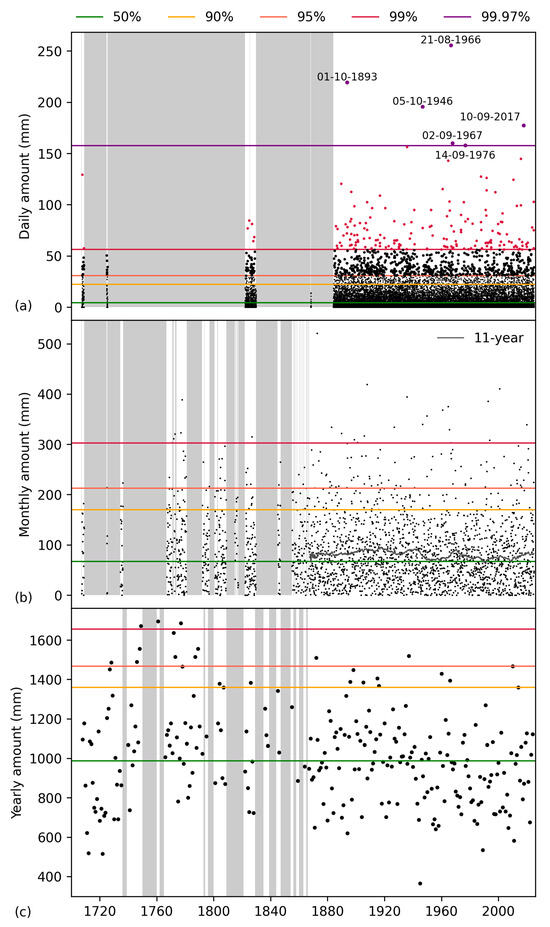
Figure 13.
(a) Daily, (b) monthly, and (c) yearly total amounts recorded in Pisa since May 1707. The following percentiles are highlighted: , , , , . Grey rectangles highlight missing periods.
Selected percentiles of the daily, monthly, and yearly amounts were calculated over the whole series to highlight the rainiest periods (Figure 13). The selected percentiles were: , the median; , defined by IPCC 2014 [87] as the threshold for an extreme event; and , , and . As already noted [92,93], for long daily records, the , , and percentiles have thresholds that are too low to define extreme precipitation due to the return period being too short. Conversely, the percentile corresponds to and a 10-year return period. The most extreme daily events that exceeded the percentile occurred on 1 October 1893, 5 October 1946, 21 August 1966, 2 September 1967, 14 September 1976, and 10 September 2017. The peak was around September, in the transition period between the end of the summer and the onset of autumn. The frequency was higher around the middle of the past century. The most extreme monthly amounts that exceeded the percentile were randomly distributed over the series. The most extreme yearly amounts were found in the century.
The 11-year central moving average (CMA) was applied to the monthly dataset, representing the longest in the series. The 11–year window was preferred because it is related to the sunspot cycle, which is linked to precipitation [94]. It should be noted that the CMA is above the median (i.e., percentile) for the skew distribution. The CMA is characterized by an initially stationary period, followed by swings. Today’s situation is similar to the average level of the second half of the century.
The series of daily and percentiles shows a small decreasing trend in the 1884–2004 period (Figure 14, orange and red lines); the MK test is significant for both of them. The most extreme events ( percentile, brown line in Figure 14) do not show any trend. Extending the trend lines to the 1822–1829 periods, it can be noted that they are in accordance with the percentiles from Carmignani’s measurements.
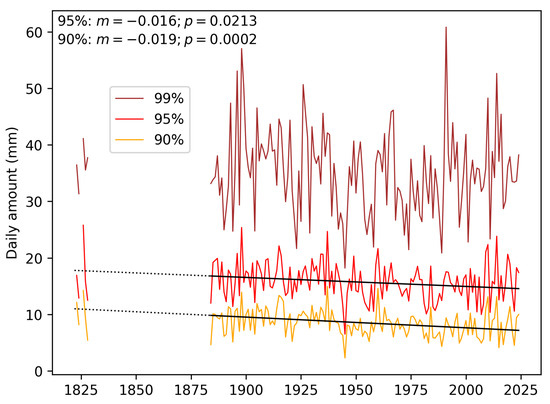
Figure 14.
Trend of selected daily percentiles (i.e., , , ), representative of the most extreme daily precipitation in Pisa, calculated over each available year. m is the slope of the trend lines; p is the p-value of the MK test. The percentile has no significant trend.
Figure 15 shows the comparison between seasonal amounts in Padua and Pisa. The comparison has been made with Padua because this long series has been carefully controlled, corrected and made homogeneous over the whole period, and constitutes an excellent unbroken reference. The four plots show the four hydrological seasons (December–January–February, March–April–May, June–July–August, September–October–November) from the beginning of the century until the present day. The two datasets are in good accordance with each other. In Spring, the precipitation regime of Padua and Pisa are nearly the same because both sites are affected by the penetration of Atlantic disturbances. In Summer, precipitation is governed by local thermo-convective activity and the link becomes weaker, with Pisa being moderately drier than Padua. In Autumn and Winter, Pisa is more exposed to westerly and southerly winds than Padua, and precipitation is more abundant. The 11-year running averages highlight the trends of the two datasets and show that in the most recent years, the difference between the two towns has been decreasing.
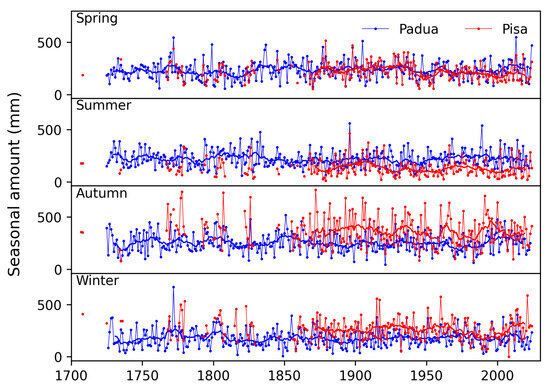
Figure 15.
Comparison of seasonal amounts of the long series of Pisa (red points and thin lines) and Padua (blue points and thin lines). Thick lines represent the 11-year moving averages: for Padua since 1725, and for Pisa since 1866, where the dataset is unbroken.
4.5. Anomalies and Trends
4.5.1. Anomaly and Trend in the Precipitation Amount
An anomaly is the departure of the value of a climatic element from its normal value [95]. The actual 30-year period used as a reference for climate normal is 1991–2020 [86]. The departure of a precipitation amount () can be computed in two ways. The former methodology () is the difference between the current value () and the corresponding value in the reference period (), i.e.,
From this equation, is negative when , null when , and positive when . The second methodology is the normalized anomaly (), obtained by dividing the current value by the reference value, and expressing it as a percentage, i.e.,
The normalized anomaly is always positive.
These two anomalies are related. If the current value is expressed in proportion to , i.e., , then
and
Therefore, substitution gives
i.e., the ratio between the two anomalies increases linearly with and , but not with n. When n is small, i.e., , this ratio is negative and is also negative; when , the ratio is null and ; finally, when , the ratio is positive (and as well), and tends asymptotically to 1. This is shown in Figure 16.
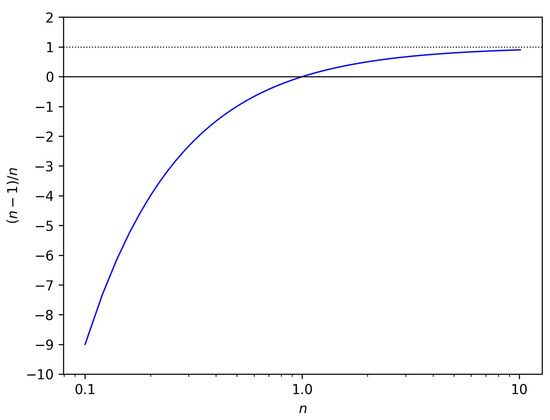
Figure 16.
Behaviour of the ratio versus n (in logarithmic scale).
For instance, from Figure 13, we know that in Pisa, the coefficient n of the monthly amounts ranges between (Figure 13b), while for the yearly amounts, it ranges between (Figure 13c). Both methods have pros and cons. The former gives the actual difference, which may be used to recognize trends in considering that is a constant value. However, sometimes it may be difficult to interpret it because a given amount may be relevant in certain regions or seasons, and irrelevant in others. For instance, in arid regions/months, a small difference may be highly significant, while in rainy regions/months, even apparently large differences may be scarcely significant. Additionally, the anomaly values may be obscure to those who are not familiar with the local climate. Conversely, the normalized values are self-explanatory, e.g., if one says that the rain was one third, half, equal to, or twice the reference value, this is clear to everybody [96]. However, when the reference period has low or high values, the normalization may be misleading. For instance, in summer, when the precipitation is scarce, the small denominator magnifies the departures too much, including the small ones; to this end, a shower may appear to be a deluge. On the other hand, the heavy rains of autumn tend to flatten and minimize the anomaly and the fluctuations of these months, with small departures from 100%. These cases are better recognized without normalization. Therefore, the two methods provide complementary information, and when the precipitation regime is seasonally variable, it is convenient to consider both of them.
As the early period of the series is affected by several gaps, the linear trend analysis and the MK test (see Section 4.1) were performed for the period in which the series was unbroken.
The traditional anomaly, i.e., the difference between the current value and the related reference period (1991–2020) value, is reported in Figure 17. Of course, when the anomaly is expressed as a difference, for each month the level 0 indicates a precipitation amount equal to the 1991–2020 monthly reference shown in Figure 14; negative values indicate amounts less than the reference (i.e., drier periods), and positive values indicate larger amounts (i.e., wetter periods). In the unbroken period, the yearly totals have slightly decreased at a rate of , and this decrease is caused by the contributions of March and June, at rates of and , respectively. The rainiest years occurred around the second half of the century, while the driest year of the series was 1945. The month with the highest precipitation peaks was October. The above results are consistent with Moonen et al. [19], who found a decreasing trend in the yearly totals over the period 1878–1998, and with Vijaya Kumar et al. [97] who found a significant decreasing trend of yearly totals in Pisa by comparing two consecutive 60–year periods (i.e., 1889–1948 and 1949-2008). At a seasonal level, these authors found this trend in all seasons, except autumn.

Figure 17.
Yearly and monthly precipitation anomalies expressed as the difference between the current value and the 1991–2020 reference period. The yearly plot has two scales, i.e., the left–hand scale represents the anomaly, i.e., when , while the right-hand scale represents the series of the actual values . The two scales have the same range and resolution but are shifted by . Blue indicates positive anomaly, red negative.
The anomaly of precipitation amounts presented in normalized form (%) is reported in Figure 18. Of course, when the anomaly is expressed as a percentage, the value of 100% indicates amounts equal to the 1991–2020 reference. Normalized anomalies with values less than 100% are for months (or years) drier than the reference, e.g., 0% is no rain at all, and 50% indicates periods with half the reference value. Values above 100% indicate periods wetter than the reference, e.g., 200% is twice the reference, 300% is three times the reference, and so on.
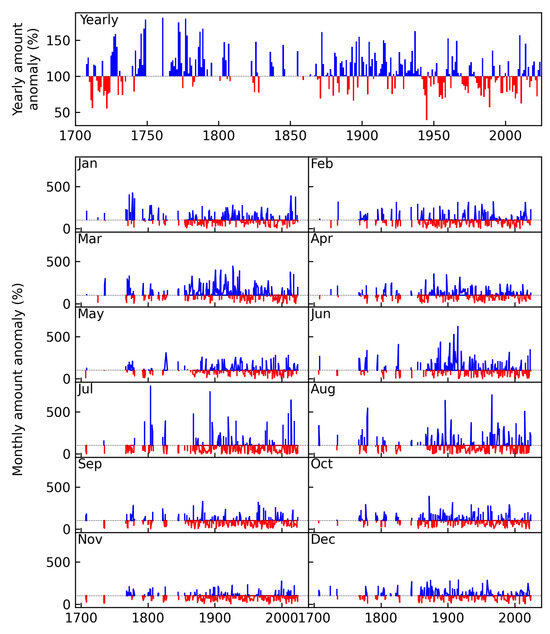
Figure 18.
Precipitation anomalies expressed as the ratio between the current value and the 1991–2020 reference period related value, expressed as a percentage of it. Blue indicates positive anomaly, red negative.
At a yearly level, the precipitation of the rainiest years around the second half of the century had some peaks around 180% (1749 with 178% and 1761 with 181%), while the minimum in 1945 reached only 39% of the reference. In this representation, the most remarkable monthly anomalies, with totals that exceeded more than five times the reference period, were found in summer (June, July and August). It must be said, however, that the summer months are the driest ones and a small normalization reference tends to enhance the ratio, while the autumn period, with the highest precipitation in November, tends to minimize fluctuations, stabilizing the ratio with apparently small fluctuations departing from the reference value, i.e., 100%.
Figure 19 shows the comparison of the yearly percentage anomalies in Pisa and other very long precipitation series, i.e., Padua, Bologna, and Milan, which are located within a radius of 300 km from Pisa. The 11-year moving averages show that Padua and Bologna are nearly in parallel, while Pisa slightly differs from them, and Milan has an independent trend. This is not surprising for the complex geographic features of Italy. The country is divided into eight climatic regions determined by the interactions that the mountain chains (Alps and Apennines) and the surrounding seas have with the general circulation [98]. Pisa lies on the western side of the Apennine Chain, while the other stations are on the eastern side. Pisa faces the Ligurian Sea, while Padua and Bologna are near the coast of the Adriatic Sea. On the other hand, Milan has a continental climate because it lies on the plain, far from the seas, and is shielded by the Alpine Chain on the northern and western sides, and the Apennine Chain on the southern one.
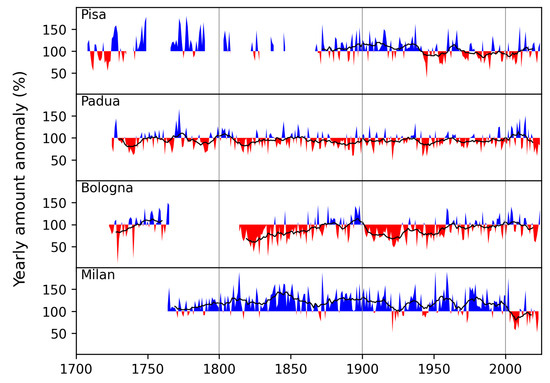
Figure 19.
Yearly percentage anomalies of Pisa, Padua, Bologna and Milan. Blue indicates positive anomaly, red negative. The black lines are the 11–year moving average.
4.5.2. Anomaly and Trend in the Precipitation Frequency
The anomaly in the precipitation frequency, i.e., the difference between the number of rainy days in the current year, or month, and the correspondent value during the 1991–2020 reference period, is reported in Figure 20. It should be said that both Moonen et al. [19] and Vijaya Kumar et al. [97] found a decreasing trend in the number of rainy days when analysing the 1878–1998 and 1889–2008 periods, respectively. However, although trends were detected across shorter periods, if the entire updated 1867–2024 record is considered, the MK test does not confirm the existence of significant trends.
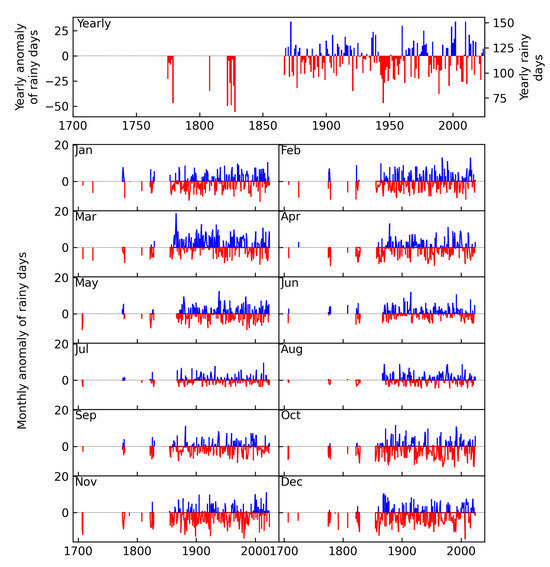
Figure 20.
Anomalies in the precipitation frequency at yearly and monthly level. Blue indicates positive anomaly, red negative.
4.6. Standardized Precipitation Index (SPI)
Among the numerous existing indices for analyzing droughts in different climatic and hydrological regimes, the standard precipitation index (SPI) [99] is one of the most widely used in the case of datasets from the early instrumental period, as it requires only monthly precipitation as an input variable. In this work, SPI was implemented by fitting the distribution of the precipitation totals in Pisa with a gamma probability density function. Then, the index was transformed into a standard normal distribution, so that mean SPI for the target location and period was zero. This rendered SPI comparable to other locations and/or periods. SPI was calculated at a monthly temporal resolution, and the accumulation periods considered were 3 and 12 months, as these represent seasonal and annual series, respectively. Following the nomenclature commonly used in the literature, the index acronym (SPI) was followed by a number indicating the accumulation period, e.g., SPI3 of a certain month is calculated based on the cumulative precipitation over the 3-month period ending in that month. Similarly, SPI12 of a certain month is calculated as the cumulative precipitation over the 1-year period ending in that month. Therefore, seasonal series were defined by considering SPI3 values in February for winter (December–January–February), May for spring (March–April–May), August for summer (June–July–August), and November for autumn (September–October–November), while the annual ones have been set up by selecting the SPI12 values in December of every year. Drought and wet events were classified into seven classes based on SPI values [99] as reported in Table 3. SPI was calculated by using the R package SPEI [100] (R STUDIO Version 2024.12.1-563).
Table 3.
Event classifications based on SPI values [99].
SPI3 and SPI12 time series are shown in Figure 21. The analysis was performed considering the period from 1867 to 2024, for which an unbroken monthly series of precipitation data is available. Long-term trends and significance were evaluated by means of the Theil–Sen (TS) [101,102] and MK tests [78,79]. In non-parametric statistics, the TS estimator is a method for robust linear regression that chooses the median slope among all lines through pairs of two–dimensional sample points. It has several advantages over ordinary least squares regression: it is insensitive to outliers, it can be used for significance tests even when residuals are not normally distributed, it can be significantly more accurate than non-robust simple linear regression for skewed and heteroskedastic data, and it competes well against least squares even for normally distributed data in terms of statistical power. The TS slope was estimated using the R package trend [103].
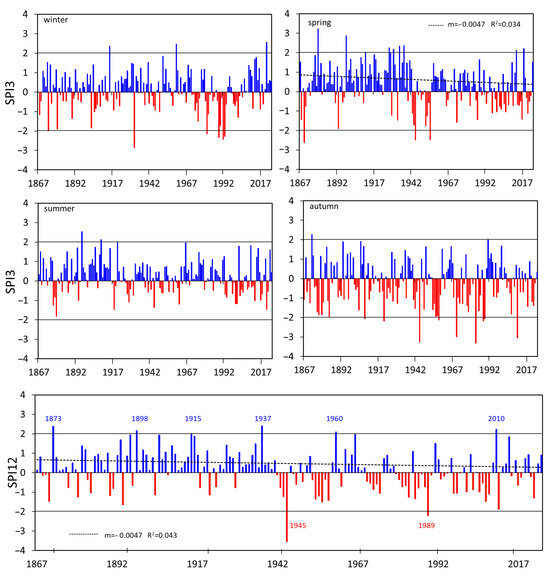
Figure 21.
Seasonal (SPI3) and annual (SPI12) time-series of the Standard Precipitation Index (SPI). Red and blue lines indicate SPI positive and negative values, respectively. Thresholds related to the two extreme classes (−2; 2) are indicated with horizontal grey lines. For SPI12, the years exceeding these thresholds are indicated in text. For SPI3 in spring and SPI12, the linear regressions are indicated with a dashed line, and the slope m and the determination coefficient are reported in the graph.
The MK test output a significant result for SPI12 and for SPI3 only in spring (p-value < 0.05), and the TS test provided a decreasing slope of per year in both cases. A decreasing trend of SPI values and thus an increasing trend of drought events was also observed by Vijaya Kumar et al. [97] in Pisa for the 1889–2008 period. The years belonging to the extreme classes according to the annual and seasonal analysis are shown in Figure 21 and listed in Table 4.
Table 4.
Years belonging to the extreme classes according to SPI3 and SPI12 values.
According to the definition of McKee et al. [99], a drought event starts in the month (included) when the SPI value falls below and ends in the month (not included) when its value returns to positive for at least two consecutive months. Consequently, the duration is the period, expressed in months, from the beginning to the end of a drought event. Drought severity is the sum of SPI values within the period D. The two most remarkable drought events from the whole series, based either on duration (D) or severity (S) are reported in Table 5, according to the SPI3 and SPI12 values, in chronological order. Both the seasonal and annual indices indicate the period around 1945 as the most critical drought period.
Table 5.
Main features of the two most remarkable drought events in term of duration (D) and severity (S) that occurred in the period from 1867 to 2024, based on SPI3 and SPI12 values.
To further investigate the variability of SPI, values were grouped into 30-year periods, starting from 1871 and ending in 2020, to include the 1991–2020 reference period. For each period, the analysis was focused on the four most critical classes, i.e., the extreme and severe wet and dry classes. Figure 22 shows the percentage of yearly SPI12 and seasonal SPI3 values belonging to those classes in each of the 30-year periods.
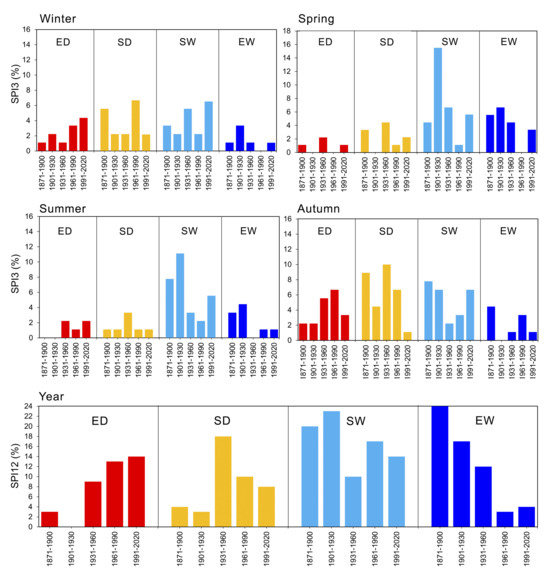
Figure 22.
Percentage of the seasonal SPI3 and yearly SPI12 values belonging to the four most critical classes, i.e., extreme dry, severe dry, severe wet, and extreme wet, for 30-year periods from 1871 to 2020. ED: extreme dry; SD: severe dry; SW: severe wet; EW: extreme wet.
The seasonal analysis revealed a great variability over the different 30-year periods, with no clear trend. The most populated class was ‘severe wet’, with a peak in the 1901–1930 period. Concerning the ‘extreme’ classes, the wet one was found to occur most frequently in spring, and the dry in autumn. From an annual perspective, extreme dry events have increased over subsequent 30-year periods, while extreme wet events have decreased, an outcome in line with ongoing climatic change.
5. Conclusions
This study was performed to reconstruct, to the greatest extent possible, the long series of precipitation in Pisa. The beginning of the century is particularly relevant, because observations were extremely rare, and unfortunately taken without precise protocols and often without previous experience. In addition, all the early observers omitted the reporting of metadata, and this makes data interpretation difficult. The observations in Pisa represent the earliest regular precipitation record in Italy, five years before Poleni in Padua and sixteen years before Beccari in Bologna, and constituted a reference for them, as well as for other scholars. Therefore, the relevance of this work is not only related to the recovery of the Pisa series, but also sheds new light on the other series. These latter series also started at the observers’ home, and the observations were made with a funnel on the roof, specifically on a chimney, and the observers, either Tilli, Poleni, or Beccari, made readings at their convenience. This is explained by the fact that, at that time, meteorology was not a profession, but all the observers had another job, outside their home, and acted at an amateur level. They devoted a few minutes to reading their instruments when they got up in the morning, or when they came to lunch at midday, or in the evening after dinner. Fortunately, in this work, it has been possible to complete some unknown parts in the history of the Pisa series and obtain information about observers, instruments, exposures, locations, and reading protocols.
Taglini made a big step forward when he began to normalize the weight and adopted a receptacle with the same cross section of the funnel, so that it was possible to directly measure the precipitation depth by dipping a graduated rod, avoiding complex calculations starting from the weight of precipitation.
Despite great effort, the mining and rescue of data has been less successful. The original registers were lost, and it was possible to find only some daily values and several monthly or yearly totals scattered across a number of publications and local magazines. The result is that the century has several gaps: only around 56% of this period is known, mostly at yearly resolution; a small fraction is known at monthly resolution, and only two years at daily resolution. Similarly, the first half of the century is known at monthly resolution, with frequent gaps. The series becomes unbroken only from the second half of the century, initially at monthly resolution, and since 1878 at daily resolution. The presence of gaps makes it impossible to extend the statistical analysis over the whole period; however, it has been possible to make some comparisons between the documented periods of the and centuries and the modern context.
The precipitation regime in Pisa is characterized by intense precipitation in autumn due to the penetration of Atlantic perturbations. The most extreme daily amounts have been found randomly distributed over the series, but they occurred mainly in the transition period between the end of the summer and the onset of the autumn.
In the 1867–2024 unbroken period, the yearly precipitation totals were found to be slightly decreasing at rate of , and this decrease is caused by the contributions of March and June. The most remarkable monthly anomalies, with totals that exceeded more than five times the 1991–2020 reference period, weren found in summer.
The MK test applied to the unbroken part of the series did not indicate the existence of a significant trend in the frequency of rainy days. The 11-year central moving average showed some swings in the past. The situation today is similar to the average levels in the second half of the century.
The time-series of the Standard Precipitation Index at annual level, i.e., SPI12, indicates the alternation of dry and wet periods, and identifying the years over the ‘extreme’ thresholds. Both the annual and seasonal SPI pointed out the period around 1945 as particularly dry. The MK test resulted as significant for SPI12 and for SPI3 only in spring, and the TS test provided a decreasing slope of per year in both cases.
Author Contributions
Conceptualization, D.C., F.B. and A.d.V.; methodology, D.C., F.B. and A.d.V.; formal analysis, D.C., F.B. and A.d.V.; investigation, D.C., F.B. and A.d.V.; data curation, D.C., F.B. and A.d.V.; writing—original draft preparation, D.C., F.B. and A.d.V.; writing—review and editing, D.C., F.B. and A.d.V.; supervision, D.C. All authors have read and agreed to the published version of the manuscript.
Funding
This research received no external funding.
Data Availability Statement
The precipitation data presented in this study are openly available in FigShare: https://doi.org/10.6084/m9.figshare.c.7748828.v1.
Acknowledgments
The authors are grateful to Daniele Vergari (‘Accademia dei Georgofili’, Florence), Alfonso Crisci (CNR–Institute for Bioeconomy, Florence), Luca Bindi (Florence University), Anna Camilla Moonen (‘Scuola Universitaria Superiore Sant’Anna’) which helped to recover the data; to the Biblioteca Universitaria Library (Padua), the Library of the ‘Consiglio Regionale del Veneto’ (Venice), the Library of the Mathematics Department ‘Guido Castelnuovo’ (Sapienza University, Rome), and the Pisa University Library for their document consultation. They furthermore thank the ‘Servizio Idrologico Regionale’ of the Toscana Region for the provision of modern data.
Conflicts of Interest
The authors declare no conflicts of interest.
Abbreviations
The following abbreviations are used in this manuscript:
| agl | above ground level |
| Anomaly (as a difference, mm) | |
| Anomaly (normalized, %) | |
| BG | Botanical Garden |
| BU | Buishand U test |
| CMA | Central moving average |
| CV | Current value |
| MK | Mann–Kendall |
| SC | Observatory Donati, in S. Caterina |
| RP | Reference Period |
| SA | Regia Scuola Superiore di Agraria |
| SPI | Standardized precipitation index |
| TS | Theil–Sen |
Appendix A. Conversion Tables
Table A1.
Units used in Pisa in the and centuries (until 1877).
Table A1.
Units used in Pisa in the and centuries (until 1877).
| Unit | Translation | Functional Relation | Metric System |
|---|---|---|---|
| Florence units and sub-units of length | |||
| braccio (da lana) | length of an arm, old unitfor measuring cloth, brachium or ulna in Latin | basic unit | 58.36 cm |
| soldo | from the Latin soldus, the most important coin (e.g., gold, silver) | 1/20 braccio | 2.918 cm |
| denaro | from the Latin denarius, the smallest coin | 1/12 soldo | 0.243167 cm |
| punto | from the Latin punctum, the smallest reference | 1/12 denaro | 0.02026 cm |
| Paris units and sub-units of length | |||
| pollice | Paris inch | basic unit | 2.7069 cm |
| linea | Paris line | 1/12 pollice | 0.22557 cm |
| punto | 1/10 linea | 0.02255 cm | |
| Florence units and sub-units of capacity (i.e., volume) for grains | |||
| sacco | sack | basic unit | 73,088.6 cm3 |
| staio | bushel | 1/3 sacco | 24,362.9 cm3 |
| quartuccio | little quarter | 1/64 staio | 380.7 cm3 |
| Florence units and sub-units of capacity (i.e., volume) for liquids—wine | |||
| barile | barrel | basic unit | 45,584.0 cm3 |
| fiasco | flask | 1/20 barile | 2279.2 cm3 |
| quartuccio | little quarter | 1/8 fiasco | 284.9 cm3 |
| Florence units and sub-units of capacity (i.e., volume) for liquids—oil | |||
| barile | barrel | basic unit | 33,428.9 cm3 |
| fiasco | flask | 1/20 barile | 2089.3 cm3 |
| quartuccio | little quarter | 1/8 fiasco | 261.2 cm3 |
| Florence units and sub-units of weight | |||
| libra | pound | basic unit | 339.54 g |
| oncia | ounce | 1/12 libra | 28.295 g |
| dramma | drachma (Greek coin) | 1/8 oncia | 3.5368 g |
| denaro | from the Latin denarius, the smallest coin | 1/3 dramma | 1.1789 g |
| grano | grain | 1/24 denaro | 0.0491 g |
References
- Camuffo, D.; Bertolin, C.; Jones, P.D.; Cornes, R.; Garnier, E. The earliest daily barometric pressure readings in Italy: Pisa AD 1657–1658 and Modena AD 1694, and the weather over Europe. Holocene 2010, 20, 337–349. [Google Scholar] [CrossRef]
- Camuffo, D.; Bertolin, C. The earliest temperature observations in the world: The Medici Network (1654–1670). Clim. Change 2012, 111, 335–363. [Google Scholar] [CrossRef]
- Camuffo, D. Microclimate for Cultural Heritage—Measurement, Risk Assessment, Conservation, Restoration and Maintenance of Indoor and Outdoor Monuments, 3rd ed.; Elsevier: Amsterdam, The Netherlands, 2019. [Google Scholar] [CrossRef]
- Camuffo, D.; della Valle, A.; Becherini, F. From time frames to temperature bias in long temperature series. Clim. Change 2021, 165, 38. [Google Scholar] [CrossRef]
- Derham, W. Tables of the barometrical altitudes at Zuerich in Switzerland in the year 1708, observed by John James Scheuchzer, F.R.S. and at Upminster in England, observed at the same time by Mr W. Derham, F.R.S., and also the Rain at Pisa in Italy in 1707 and 1708 observed there by Dr Michael Angelo Tilli, F.R.S., and at Zurich in 1708 and at Upminster in all that time. Philos. Trans. 1710, 26, 342–366. [Google Scholar]
- Camuffo, D.; della Valle, A.; Becherini, F.; Zanini, V. Three centuries of daily precipitation in Padua, Italy, 1713–2018: History, relocations, gaps, homogeneity and raw data. Clim. Change 2020, 162, 923–942. [Google Scholar] [CrossRef]
- Camuffo, D.; Becherini, F.; della Valle, A.; Zanini, V. A comparison between different methods to fill gaps in early precipitation series. Environ. Earth Sci. 2022, 81, 345. [Google Scholar] [CrossRef]
- Della Valle, A.; Camuffo, D.; Becherini, F.; Zanini, V. Recovering, correcting, and reconstructing precipitation data affected by gaps and irregular readings: The Padua series from 1812 to 1864. Clim. Change 2023, 176, 9. [Google Scholar] [CrossRef]
- Camuffo, D.; Becherini, F.; della Valle, A. The Beccari series of precipitation in Bologna, Italy, from 1723 to 1765. Clim. Change 2019, 155, 359–376. [Google Scholar] [CrossRef]
- Accademia Crusca. Vocabolario degli Accademici della Crusca; Turrini: Venice, Italy, 1680. [Google Scholar]
- Fabroni, A. Historia Academiae Pisanae; Mugnainio: Pisa, Italy, 1792. [Google Scholar]
- Caruel, T. L’Orto e il Museo Botanico dell’Università di Pisa; Nistri: Pisa, Italy, 1874. [Google Scholar]
- Micheli, E. Storia dell’Università di Pisa dal MDCCXXXVII al MDCCCLIX; Nistri and Co.: Pisa, Italy, 1877. [Google Scholar]
- Garbari, F.; Tongiorgi Tomasi, L.; Tosi, A. Il Giardino dei Semplici. L’Orto botanico di Pisa dal XVI al XX Secolo; Pacin: Pisa, Italy, 1991. [Google Scholar]
- Eredia, F. (Ed.) Osservazioni Pluviometriche Raccolte a Tutto L’Anno 1915; Toscana e Liguria, Ministero Lavori Pubblici—Consiglio Superiore delle Acque: Rome, Italy, 1919. [Google Scholar]
- Rapetti, F.; Ruschi, M. Osservazioni botanico-meteorologiche condotte da Giovanni Lorenzo Tilli presso il Giardino dei Semplici di Pisa (1775-1780). Atti Della Soc. Toscana Sci. Nat. Mem. 2009, 114, 45–59. [Google Scholar]
- Rapetti, F. Dall’archivio meteorologico del Seminario Arcivescovile Santa Caterina d’Alessandria di Pisa un contributo alla conoscenza della storia pluviometrica della cittá dall’inizio del settecento ad oggi. Atti Della Soc. Toscana Sci. Nat. Mem. 2015, 122, 63–73. [Google Scholar] [CrossRef]
- Rastrelli, A. Sul coefficiente di persistenza delle piogge a Pisa. In Bollettino del R. Istituto Superiore Agrario di Pisa Raccolta delle Pubblicazioni del Personale dell’Istituto; Università degli studi, Istituto Superiore Agrario: Pisa, Italy, 1937; p. 137. [Google Scholar]
- Moonen, C.; Masoni, A.; Ercoli, L.; Mariotti, M.; Bonari, E. Long–term changes in rainfall and temperature in Pisa, Italy. Agric. Mediterr. 2001, 131, 66–76. [Google Scholar]
- Derham, W. Physico-Theology: Or, a Demonstration of the Being and Attributes of God, from His Works of Creation; Innys: London, UK, 1713. [Google Scholar]
- Cirillo, N. Lettera al Signor Michel’ Angelo Tilli Professor di Botanica nell’Università di Pisa intorno alla misura della Pioggia e del Barometro. Letter dated 4 April 1716. In Consulti Medici di Niccolò Cirillo, 1738th ed.; Novello de Bonis: Neaples, Italy, 1716; pp. 271–277. [Google Scholar]
- Toaldo, G. Della Vera Influenza degli Astri, delle Stagioni e delle Mutazioni di Tempo, Saggio Meteorologico, 2nd ed.; Stamperia del Seminario: Padua, Italy, 1781. [Google Scholar]
- Vallisneri, A. Lezione Accademica Intorno All’Origine delle Fontane, 2nd ed.; Pietro Poletti: Venice, Italy, 1726; pp. 1–365. [Google Scholar]
- Schouw, J.F. Tableau du climat de la végétation de l’Italie. Résultat de deux voyages en ce pays dans les années 1817–1819 et 1829–1830. In Tableau de la Température et des Pluies de L’Italie; Luno: Copenhagen, Denmark, 1839; Volume 1. [Google Scholar]
- Toaldo, G. Della Vera Influenza degli Astri, delle Stagioni e delle Mutazioni di Tempo, Saggio Meteorologico, 1st ed.; Manfré: Padua, Italy, 1770. [Google Scholar]
- Townley, R. VI. A letter from Richard Townley, of Townley in Lancashire, Esq; containing observations on the quantity of rain falling monthly, for several Years successively: Communicated to the Royal Society. Phil. Trans. R. Soc. 1694, 18, 51–58. [Google Scholar] [CrossRef]
- De la Hire, P. Observations de la quantitè d’eau de la pluie qui est tombée à l’Observatoire pendant l’année 1709 avec létat du Baromètre et du Thermomètre. In Memoires de Mathematique et de Physique de l’Académie Royale des Sciences; Compagnie des Libraires: Paris, France, 1710; pp. 139–143. [Google Scholar]
- Martini, A. Manuale di Metrologia Ossia Misure, Pesi e Monete in Uso Attualmente e Anticamente Presso Tutti i Popoli; Edizione Digitale a Cura di Guido Mura, Milano—Biblioteca Nazionale Braidense (2003) ed.; Loescher: Torino, Italy, 1883. [Google Scholar]
- Ferrati, C. Tavole di Ragguaglio dei Pesi e delle Misure già in Uso Nelle Varie Province del Regno col Peso Metrico Decimale. Tables Approved with Royal Decree 20 May 1877, No. 8886.; Stamperia Reale: Rome, Italy, 1877. [Google Scholar]
- Taglini, C. Libri Duo de Aere Ejusque Natura et Effectis Cum Notis et Animadversionibus; Viviani: Florence, Italy, 1736. [Google Scholar]
- Calvi, G. Commentarium Inserviturum Historiae Pisani Vireti Botanici Academici; Pizzorni: Pisa, Italy, 1777. [Google Scholar]
- Savi, G. Notizie Storiche del Giardino di Pisa; Nistri: Pisa, Italy, 1828. [Google Scholar]
- Linnaeus, C. Species Plantarum; Salvi, Holmiae: Stockholm, Sweden, 1753. [Google Scholar]
- Lami, G. Novelle letterarie dell’anno 1748. In Novelle Letterarie; Stamperia della SS. Annunziata: Firenze, Italy, 1748; Volume 9, p. 81. [Google Scholar]
- Jurin, J. Invitatio ad observationes Meteorologicas communi consilio instituendas a Jacobo Jurin M. D. Soc. Reg Secr et Colleg Med Lond Socio. Philos. Trans. 1723, 379, 422–427. [Google Scholar]
- Taglini, C. Lettere Scientifiche Sopra vari Dilettevoli Argomenti di Fisica; Stamperia all’Insegna d’Apollo: Firenze, Italy, 1747. [Google Scholar]
- Hemmer, J.J. Descriptio instrumentorum meteorologicorum, tam eorum, quam Societas distribuit, quam quibus praeter haec Manheimii utitur. In Ephem Soc Meteorol Palat; Ex Officina Novae Societatis Typographicae: Mannheim, Germany, 1783; Volume 1, pp. 57–90. [Google Scholar]
- Ridolfi, C. Elogio del Prof. Gaetano Savi. Mem. Mat. Fis. Della Soc. Ital. Delle Sci. 1846, 23, 1–24. [Google Scholar]
- Amadei, L. Note sull’Herbarium Horti Pisani: L’origine delle collezioni. Museol. Sci. 1987, 4, 119–129. [Google Scholar]
- Amadei, L.; Baldini, R.; Maccioni, S.; Bedini, G. I manoscritti di Vincenzo Carmignani (1779-1859): Felci della provincia pisana. Atti Soc. Tosc. Sci. Nat. Mem. Ser. B 2012, 119, 9–14. [Google Scholar]
- Pitoni, R. Risultato delle osservazioni meteorologiche fatte dal Gabinetto di Fisica della R. Università di Pisa durante il periodo 1867-88. Atti Soc. Toscana Sci. Nat. Resid. Pisa Process. Verbali 1887, 6, 241–248. [Google Scholar]
- Bedini, G.; Farina, S. A Giraffe in the Botanic Garden of Pisa (Tuscany, Northern Italy). J. Zool. Bot. Gard 2022, 3, 170–176. [Google Scholar] [CrossRef]
- Tilli, M. Catalogus Plantarum Horti Pisani; Tartini & Franchi: Firenze, Italy, 1723. [Google Scholar]
- Martini, G. Reise von Rom, nach Livorno and durch Toskana, III. In Manuscript 106, cc 70–71; Archivio di Stato: Lucca, Italy, 1742. [Google Scholar]
- Tilli, G.L. Osservazioni Botanico–Meteorologiche fatte in Pisa nell’Anno 1776. In Magazzino Toscano; Giuseppe Vanni: Rome, Italy, 1777; Volume 31, pp. 151–186. [Google Scholar]
- Cotte, L. Mémoires sur la Météorologie, Pour Servir de Suite et de Supplément au Traité de Météorologie Publié en 1774; Imprimerie Royale: Paris, France, 1788. [Google Scholar]
- Pierucci, M. Catalogo degl’Istrumenti di Fisica che si Costruiscono nel Laboratorio di Mariano Pierucci Meccanico del r. Stabilimento di Fisica a Pisa; Tipografia Vannucchi: Pisa, Italy, 1865. [Google Scholar]
- Chevalier. Catalogue Explicatif et Illustré des Instruments d’Optique et de Météorologie Usuelles de la Maison Charles Chevalier; Bonaventure et Decessois: Paris, France, 1860. [Google Scholar]
- Pietra Santa de, P. Essai de Climatologie Théorique et Pratique; Ballière et Sons: Paris, France, 1865. [Google Scholar]
- Figuier, L. Les Merveilles de l’Industrie. Industrie Chimiques; Industrie de l’eau, Furne Jouvet et Co.: Paris, France, 1873; Volume 3. [Google Scholar]
- Tilli, A. Nota del Peso e Misura dell’Acqua passata per la Pevera del Giardino de’ Semplici di Pisa nel corso di dieci Anni. In Giornale de’ letterati; Paolo Giovannelli: Firenze, Italy, 1750; Volume VI, p. 264. [Google Scholar]
- Tilli, G.L. Pioggia di Pisa. In Novelle Letterarie; Stamperia di Antonio Benucci: Firenze, Italy, 1780; Volume 11, p. 24. [Google Scholar]
- Tilli, G.L. Nota del peso dell’acqua passata per la Pevera del giardino de’ Semplici di Pisa negli anni 1767 e 1768. In Gazzetta Toscana; Anton–Giuseppe Pagani Stampatore e Libraio: Firenze, Italy, 1769; Volume 3, p. 12. [Google Scholar]
- Lastri, M. Lunario per i contadini della Toscana per l’anno 1782. Ovvero Anno Rustico Nono; Antonio Bonaiuti: Firenze, Italy, 1782. [Google Scholar]
- Lastri, M. Lunario per i contadini della Toscana per l’anno 1783. Ovvero Anno Rustico Decimo; Antonio Bonaiuti: Firenze, Italy, 1783. [Google Scholar]
- Toaldo, G. Pioggie di varj luoghi dell’anno 1801. In Giornale Astrometeorologico per l’Anno 1803; Giacomo Storti: Venice, Italy, 1808; pp. 97–98. [Google Scholar]
- Toaldo, G. Pioggie di varj luoghi dell’anno 1803. In Giornale Astrometeorologico per l’Anno 1806; Giacomo Storti: Venice, Italy, 1805; p. 108. [Google Scholar]
- Toaldo, G. Pioggie di varj luoghi dell’anno 1806. In Giornale Astrometeorologico per l’Anno 1808; Giacomo Storti: Venice, Italy, 1808; p. 99. [Google Scholar]
- Toaldo, G. Pioggie dell’anno 1807. In Giornale Astrometeorologico per l’Anno 1809; Francesco Adreola: Venice, Italy, 1809; p. 89. [Google Scholar]
- Carmignani, V. Dei Foraggj e dei Concj; Sebastiano Nistri: Pisa, Italy, 1819; p. 58. [Google Scholar]
- Carmignani, V. Osservazioni meteorologiche. In Nuovo Giornale de’ Letterati; Sebastiano Nistri: Pisa, Italy, 1822. [Google Scholar]
- Tabani, G. Nuova Guida di Pisa e de’ Suoi Contorni; FF. Nistri Tipografi–Libraj: Pisa, Italy, 1845. [Google Scholar]
- Savi, P. Osservazioni meteorologiche fatte nel Gabinetto di Fisica. In Il Cimento; Tipografia della Minerva: Pisa, Italy, 1845; Volume 1. [Google Scholar]
- Savi, P. Osservazioni meteorologiche fatte nel Gabinetto di Fisica. In Il Cimento; Tipografia della Minerva: Pisa, Italy, 1846; Volume 2. [Google Scholar]
- Savi, P. Osservazioni meteorologiche fatte nel Gabinetto di Fisica. In Il Nuovo Cimento; Tipografia Pieraccini: Pisa, Italy, 1855; Volume 1–2. [Google Scholar]
- Savi, P. Osservazioni meteorologiche. In Gazzetta di Pisa; Tipografia Citi: Pisa, Italy, 1868; Volume 8–15. [Google Scholar]
- Schandein, C. Pisa als klimatischer Curort; Wilhelm Braumüller: Wien, Austria, 1872; Volume 49. [Google Scholar]
- Whitley, E.; Ball, J. Statistics review 5: Comparison of means. Crit. Care 2002, 6, 424. [Google Scholar] [CrossRef]
- Wilks, D.S. Statistical Methods in the Atmospheric Sciences; Academic Press: Cambridge, MA, USA, 2011; Volume 100. [Google Scholar] [CrossRef]
- Virtanen, P.; Gommers, R.; Oliphant, T.E.; Haberland, M.; Reddy, T.; Cournapeau, D.; Burovski, E.; Peterson, P.; Weckesser, W.; Bright, J.; et al. SciPy 1.0: Fundamental Algorithms for Scientific Computing in Python. Nat. Methods 2020, 17, 261–272. [Google Scholar] [CrossRef]
- Shourov, M.H. mmhs013/pyHomogeneity: Tag for Zenodo Release, Version v1.1; Zenodo: Geneva, Switzerland, 2020. [Google Scholar] [CrossRef]
- Alexandersson, H. A homogeneity test applied to precipitation data. J. Climatol. 1986, 6, 661–675. [Google Scholar] [CrossRef]
- Pettitt, A.N. A non-parametric approach to the change-point problem. J. R. Stat. Soc. Ser. C Appl. Stat. 1979, 28, 126–135. [Google Scholar] [CrossRef]
- Buishand, T.A. Some methods for testing the homogeneity of rainfall records. J. Hydrol. 1982, 58, 11–27. [Google Scholar] [CrossRef]
- Wijngaard, J.; Klein Tank, A.; Können, G. Homogeneity of 20th century European daily temperature and precipitation series. Int. J. Climatol. J. R. Meteorol. Soc. 2003, 23, 679–692. [Google Scholar] [CrossRef]
- Schönwiese, C.D.; Rapp, J. Climate Trend Atlas of Europe Based on Observations 1891–1990; Springer Science & Business Media: Berlin/Heidelberg, Germany, 1997. [Google Scholar]
- Kang, H.M.; Yusof, F. Homogeneity tests on daily rainfall series. Int. J. Contemp. Math. Sci. 2012, 7, 9–22. Available online: https://m-hikari.com/ijcms/ijcms-2012/1-4-2012/kangIJCMS1-4-2012.pdf (accessed on 20 March 2025).
- Mann, H.B. Nonparametric Tests Against Trend. Econometrica 1945, 13, 245–259. [Google Scholar] [CrossRef]
- Kendall, M.G. Rank Correlation Methods, 4th ed.; Charles Griffin: London, UK, 1975. [Google Scholar]
- Hussain, M.M.; Mahmud, I. pyMannKendall: A python package for non parametric Mann Kendall family of trend tests. J. Open Source Softw. 2019, 4, 1556. [Google Scholar] [CrossRef]
- Savi, G.; Carmignani, V. Osservazioni meteorologiche. In Giornale Pisano di Letteratura Scienze ed Arti; Stamperia del Giornale: Pisa, Italy, 1807; Volume 6, p. 148. [Google Scholar]
- Tilli, G.L. Osservazioni Botanico–Meteorologiche fatte in Pisa nell’Anno 1775. In Magazzino Toscano; Giuseppe Vanni: Rome, Italy, 1776; Volume 26, pp. 113–152. [Google Scholar]
- Tilli, G.L. Nota del peso e misura dell’acqua passata per la Pevera del Giardino de’ Semplici di Pisa nell’anno 1774. In Giornale de’ Letterati; Fratelli Pizzorni: Novi Ligure, Italy, 1775; Volume 17, pp. 299–304. [Google Scholar]
- Savi, G. Osservazioni meteorologiche fatte in Pisa nel 1807. In Giornale Pisano di Letteratura Scienze ed Arti; Stamperia del Giornale: Pisa, Italy, 1808; Volume 8, p. 258. [Google Scholar]
- World Meteorological Organization. The Role of Climatological Normals in a Changing Climate; Vol. WMO/TD-No. 1377; World Meteorological Organization: Geneva, Switzerland, 2007; Available online: https://library.wmo.int/idurl/4/52499 (accessed on 20 March 2025).
- World Meteorological Organization. WMO Guidelines on the Calculation of Climate Normals; Vol. WMO-No. 1203; World Meteorological Organization: Geneva, Switzerland, 2017; Available online: https://library.wmo.int/idurl/4/55797 (accessed on 20 March 2025).
- Mach, K.; Meyer, L.; Pachauri, R.; Planton, S.; von Stechow, C. Annex II: Glossary. Contribution of Working Groups I, II and III to the Fifth Assessment Report of the Intergovernmental Panel on Climate Change. In Climate Change 2014: Synthesis Report; IPCC: Geneva, Switzerland, 2014; Available online: https://www.ipcc.ch/report/ar5/syr/ (accessed on 11 February 2025).
- World Meteorological Organization. Guidelines on the Definition and Characterization of Extreme Weather and Climate Events; Vol. WMO-No. 1310; World Meteorological Organization: Geneva, Switzerland, 2007; Available online: https://library.wmo.int/idurl/4/58396 (accessed on 20 March 2025).
- Gumbel, E.J. Statistics of Extremes; Columbia University Press: New York, NY, USA, 1958. [Google Scholar]
- Tiago de Oliveira, J. Extreme values and meteorology. Theor. Appl. Climatol. 1986, 37, 184–193. [Google Scholar] [CrossRef]
- Coles, S.; Bawa, J.; Trenner, L.; Dorazio, P. An Introduction to Statistical Modeling of Extreme Values; Springer: Berlin/Heidelberg, Germany, 2001; Volume 208. [Google Scholar] [CrossRef]
- Camuffo, D.; della Valle, A.; Becherini, F. A critical analysis of the definitions of climate and hydrological extreme events. Quat. Int. 2020, 538, 5–13. [Google Scholar] [CrossRef]
- Camuffo, D.; Becherini, F.; della Valle, A. Relationship between selected percentiles and return periods of extreme events. Acta Geophys. 2020, 68, 1201–1211. [Google Scholar] [CrossRef]
- Laurenz, L.; Lüdecke, H.J.; Lüning, S. Influence of solar activity changes on European rainfall. J. Atmos. Sol.–Terr. Phys. 2019, 185, 29–42. [Google Scholar] [CrossRef]
- World Meteorological Organization. International Meteorological Vocabulary; Vol. WMO No. 182; World Meteorological Organization: Geneva, Switzerland, 1992; Available online: https://community.wmo.int/en/bookstore/international-meteorological-vocabulary (accessed on 20 March 2025).
- Camuffo, D.; Bertolin, C.; Diodato, N.; Cocheo, C.; Barriendos, M.; Dominguez-Castro, F.; Garnier, E.; Alcoforado, M.J.; Nunes, M. Western Mediterranean precipitation over the last 300 years from instrumental observations. Clim. Change 2013, 117, 85–101. [Google Scholar] [CrossRef]
- Vijaya Kumar, P.; Bindi, M.; Crisci, A.; Maracchi, G. Detection of variations in precipitation at different time scales of twentieth century at three locations of Italy. Weather. Clim. Extrem. 2013, 2, 7–15. [Google Scholar] [CrossRef]
- Cantù, V. The Climate of Italy. In World Survey of Climatology—Climates of Central and Southern Europe; Landsberg, H., Ed.; Elsevier: Amsterdam, The Netherlands, 1977; Volume 7, pp. 127–183. [Google Scholar]
- McKee, T.B.; Doesken, N.J.; Kleist, J. The relationship of drought frequency and duration to time scales. In Proceedings of the 8th Conference on Applied Climatology, Boston, MA, USA, 17–22 January 1993; Volume 17, pp. 179–183. [Google Scholar]
- Package ‘SPEI’. Available online: https://cran.r-project.org/web/packages/SPEI/SPEI.pdf (accessed on 10 February 2025).
- Sen, P.K. Estimates of the Regression Coefficient Based on Kendall’s Tau. J. Am. Stat. Assoc. 1968, 63, 1379–1389. [Google Scholar] [CrossRef]
- Theil, H. A rank-invariant method of linear and polynomial regression analysis. North-Holland Publishing Company: Amsterdam, The Netherlands, 1950; Volume 53, pp. 386–392. [Google Scholar]
- Pohlert, T. Trend: The Non-Parametric Trend Tests and Change-Point Detection. 2023. Available online: https://CRAN.R-project.org/package=trend (accessed on 10 February 2025).
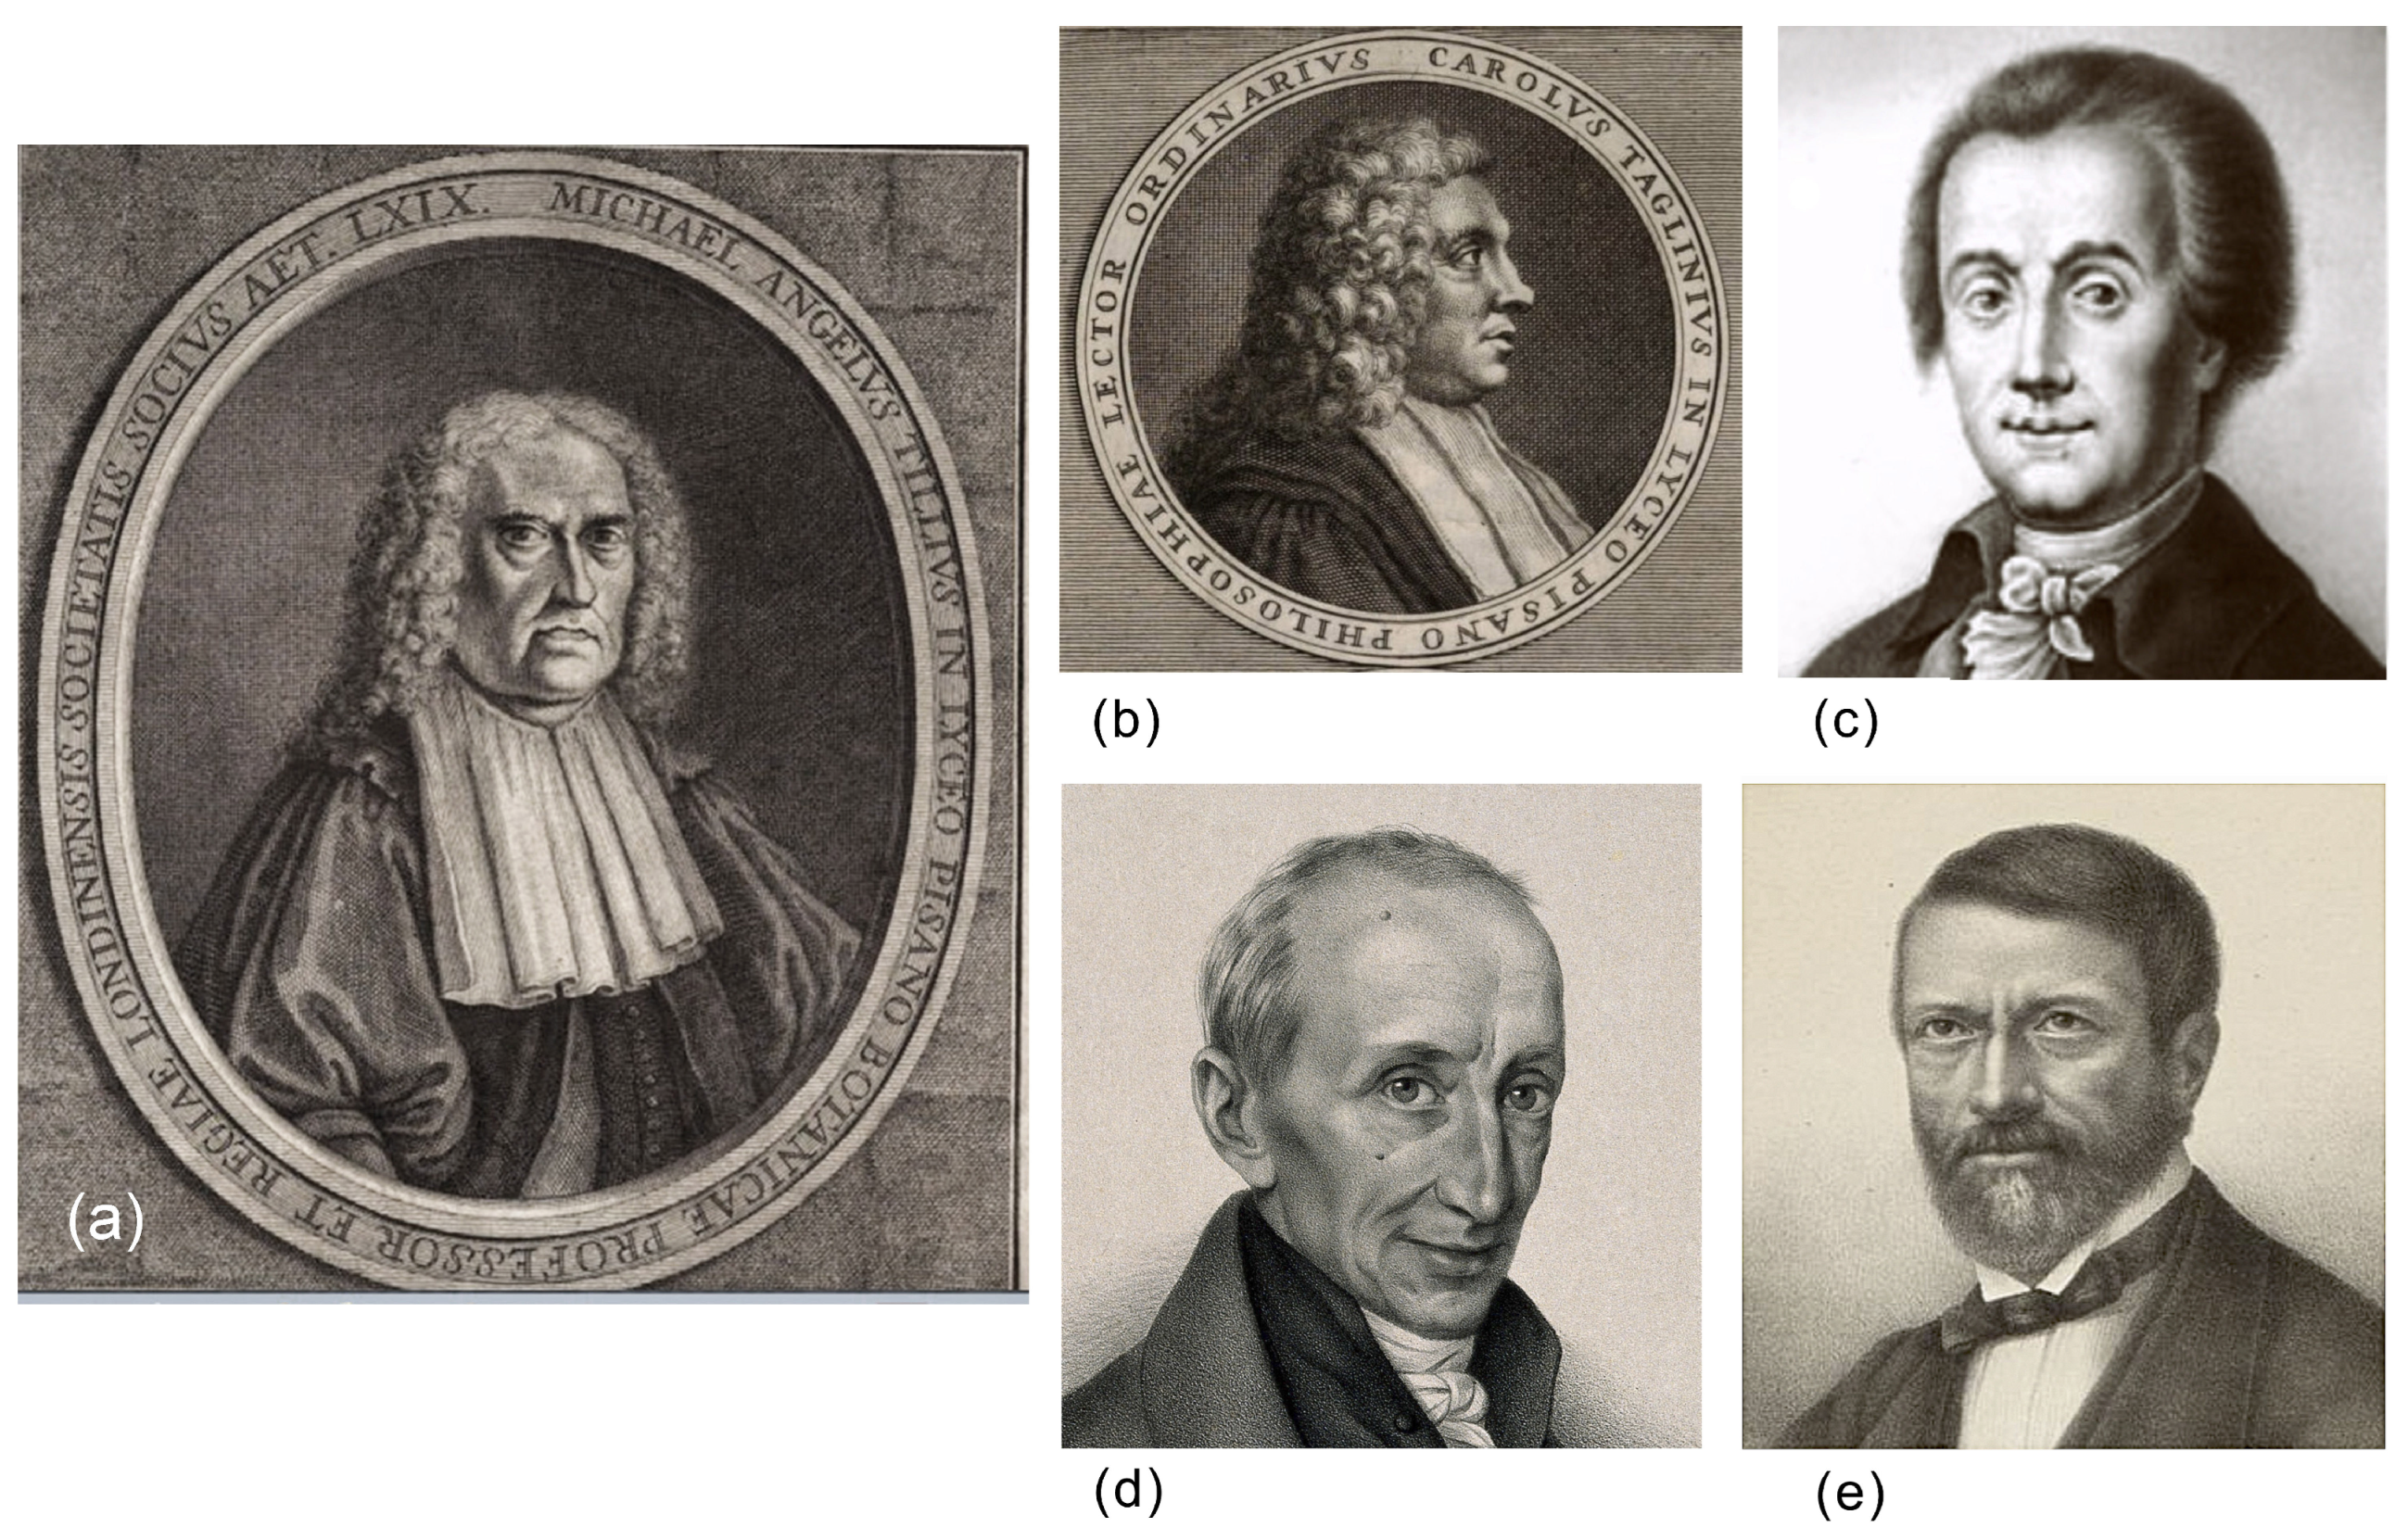
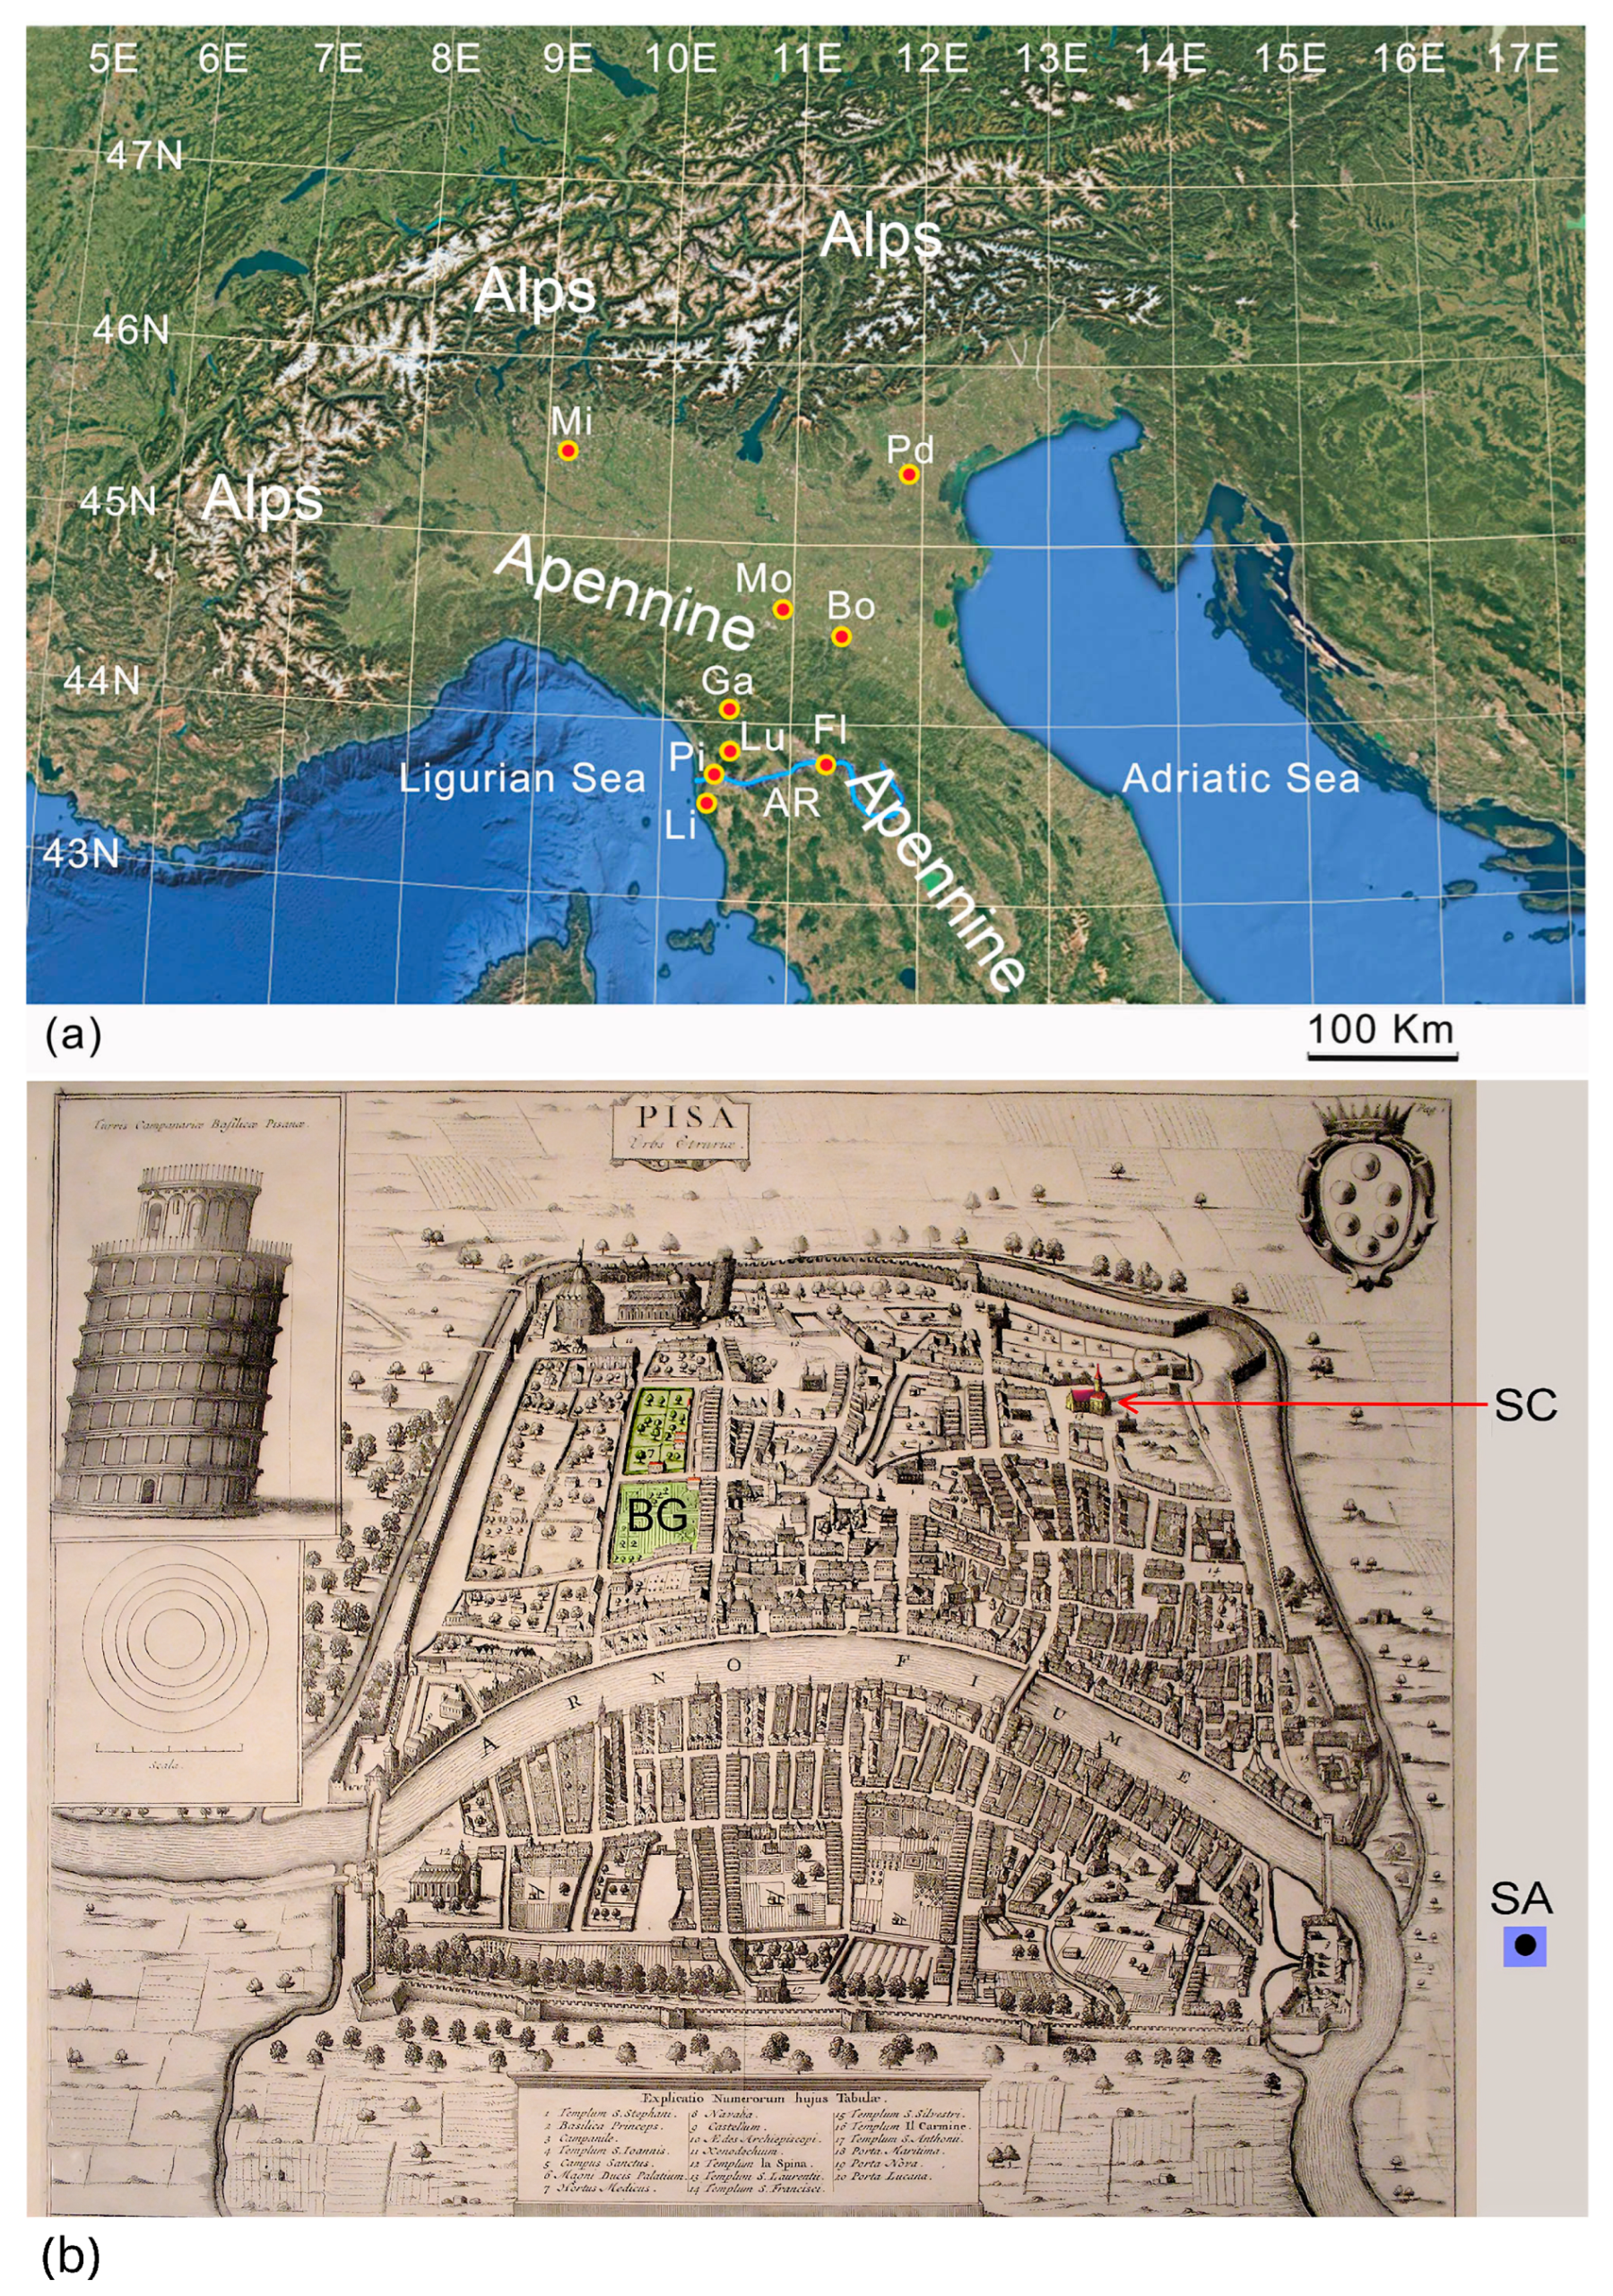

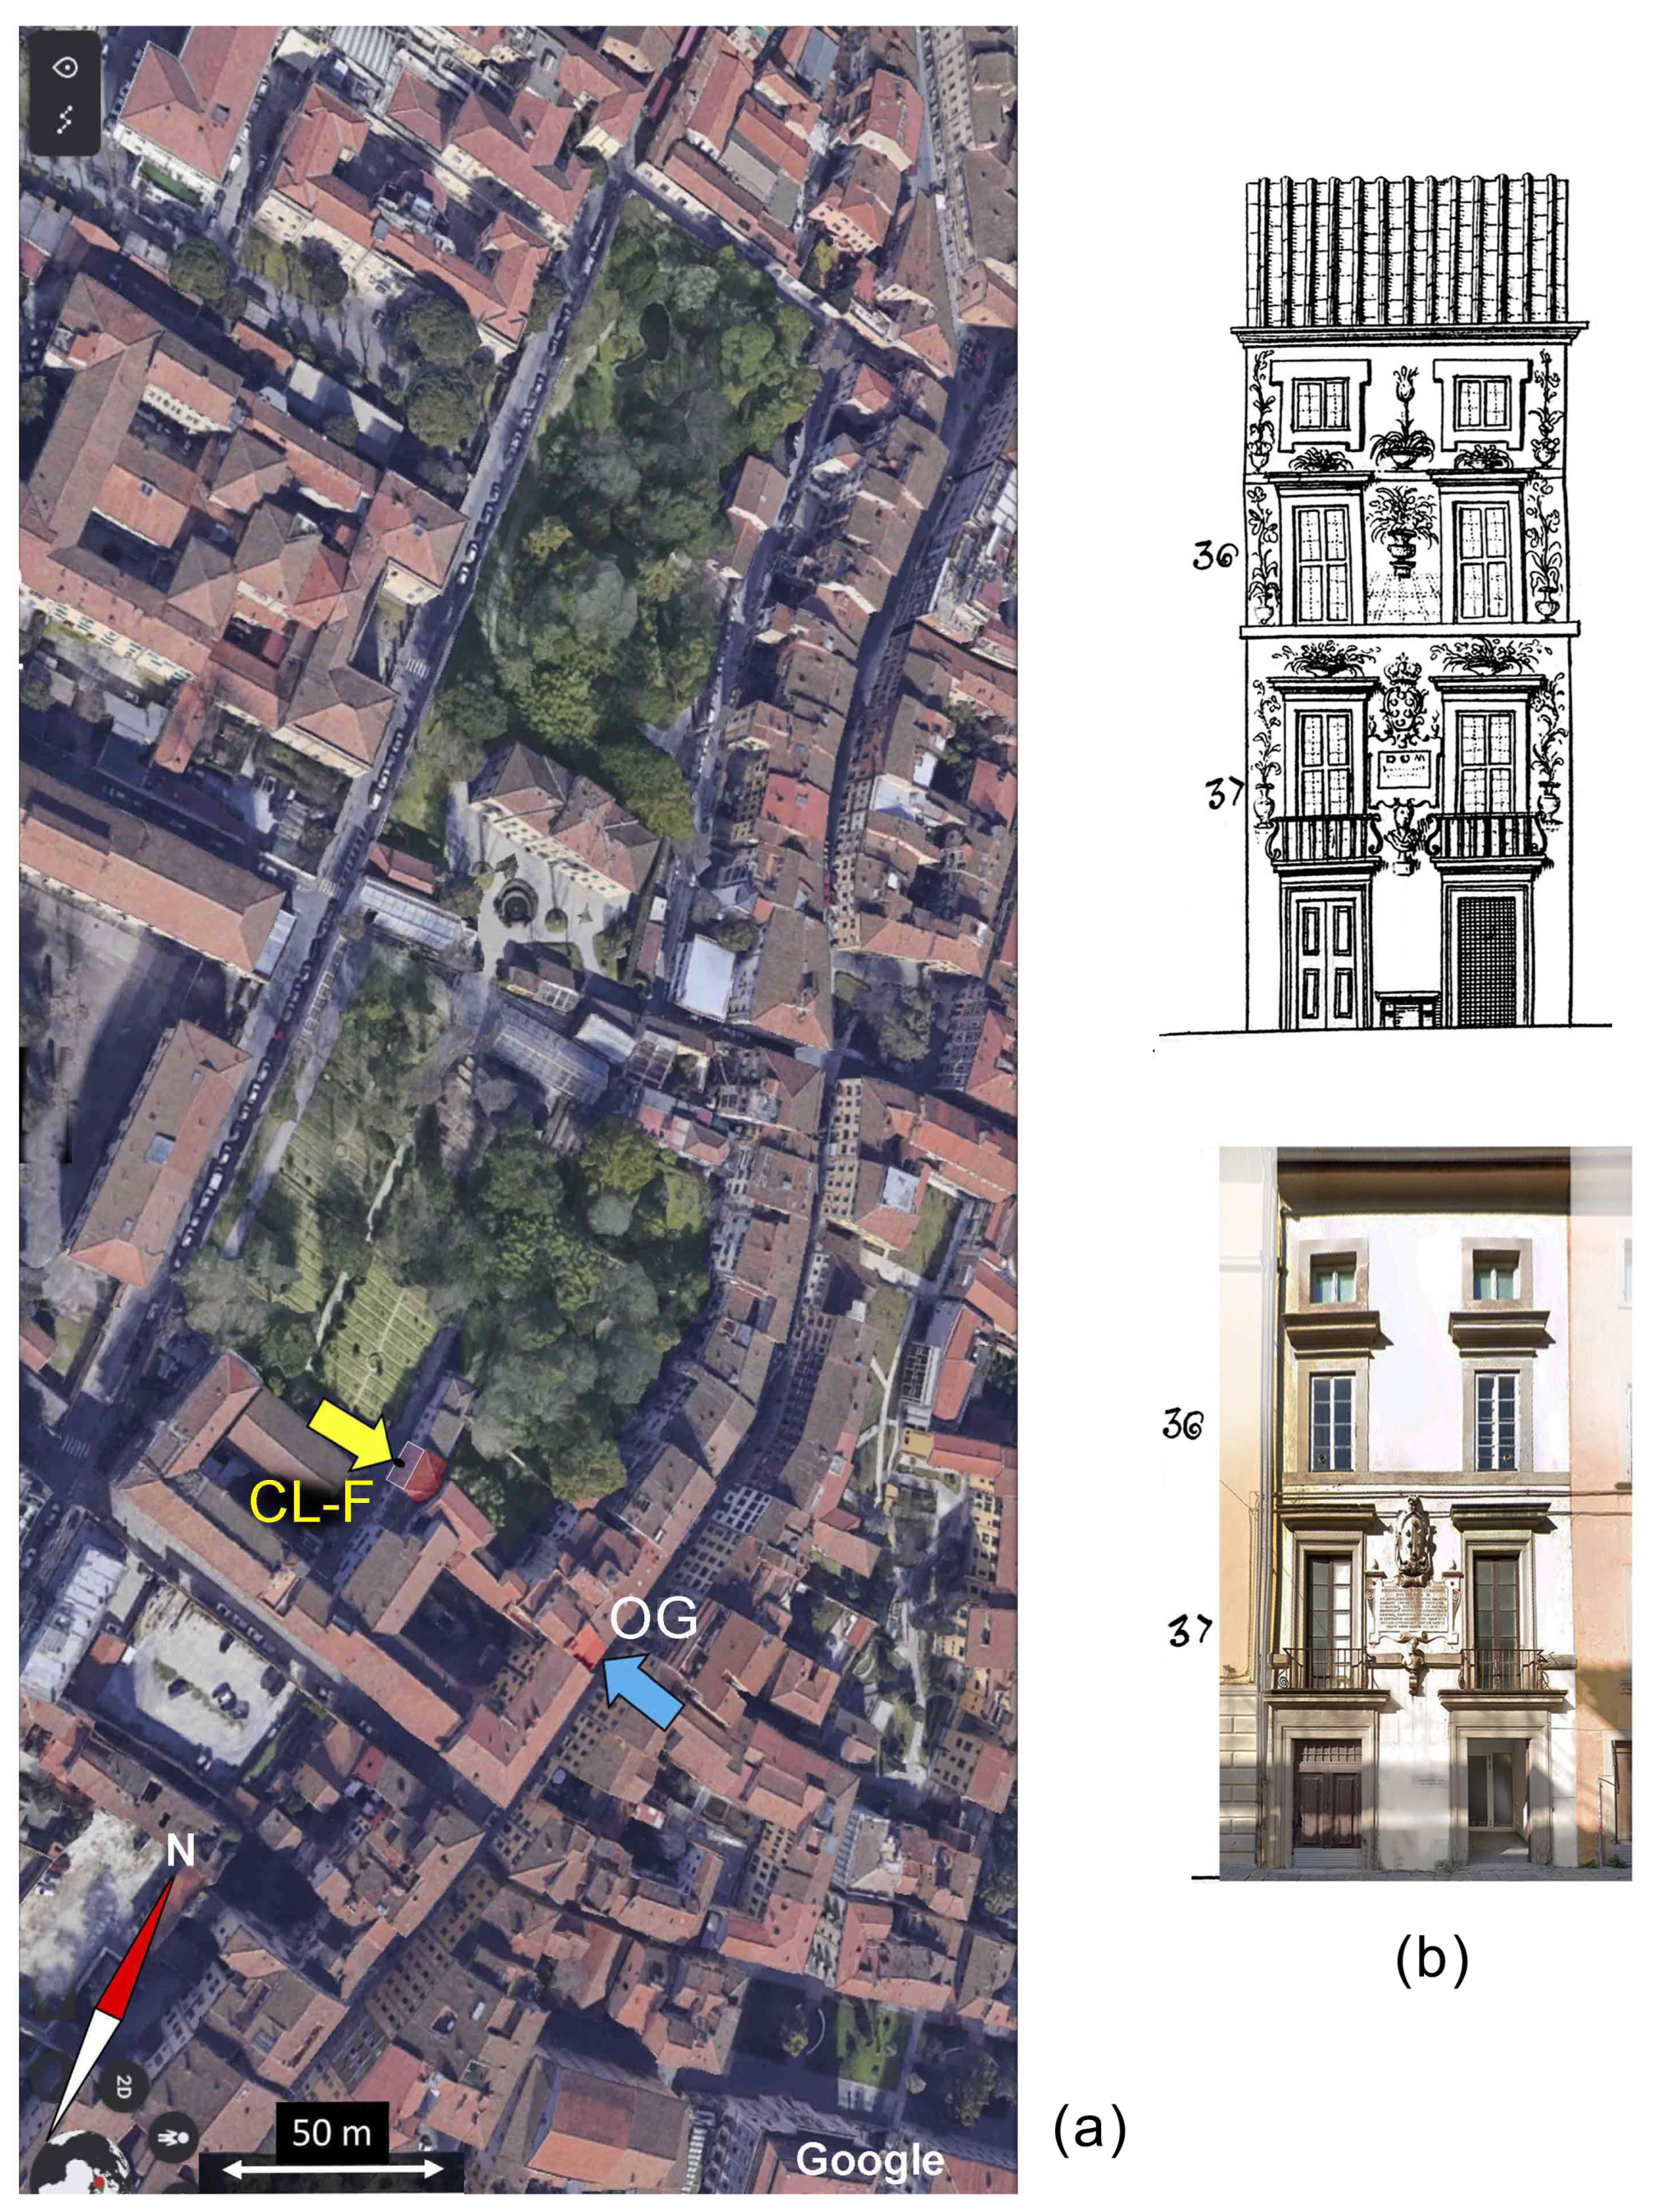
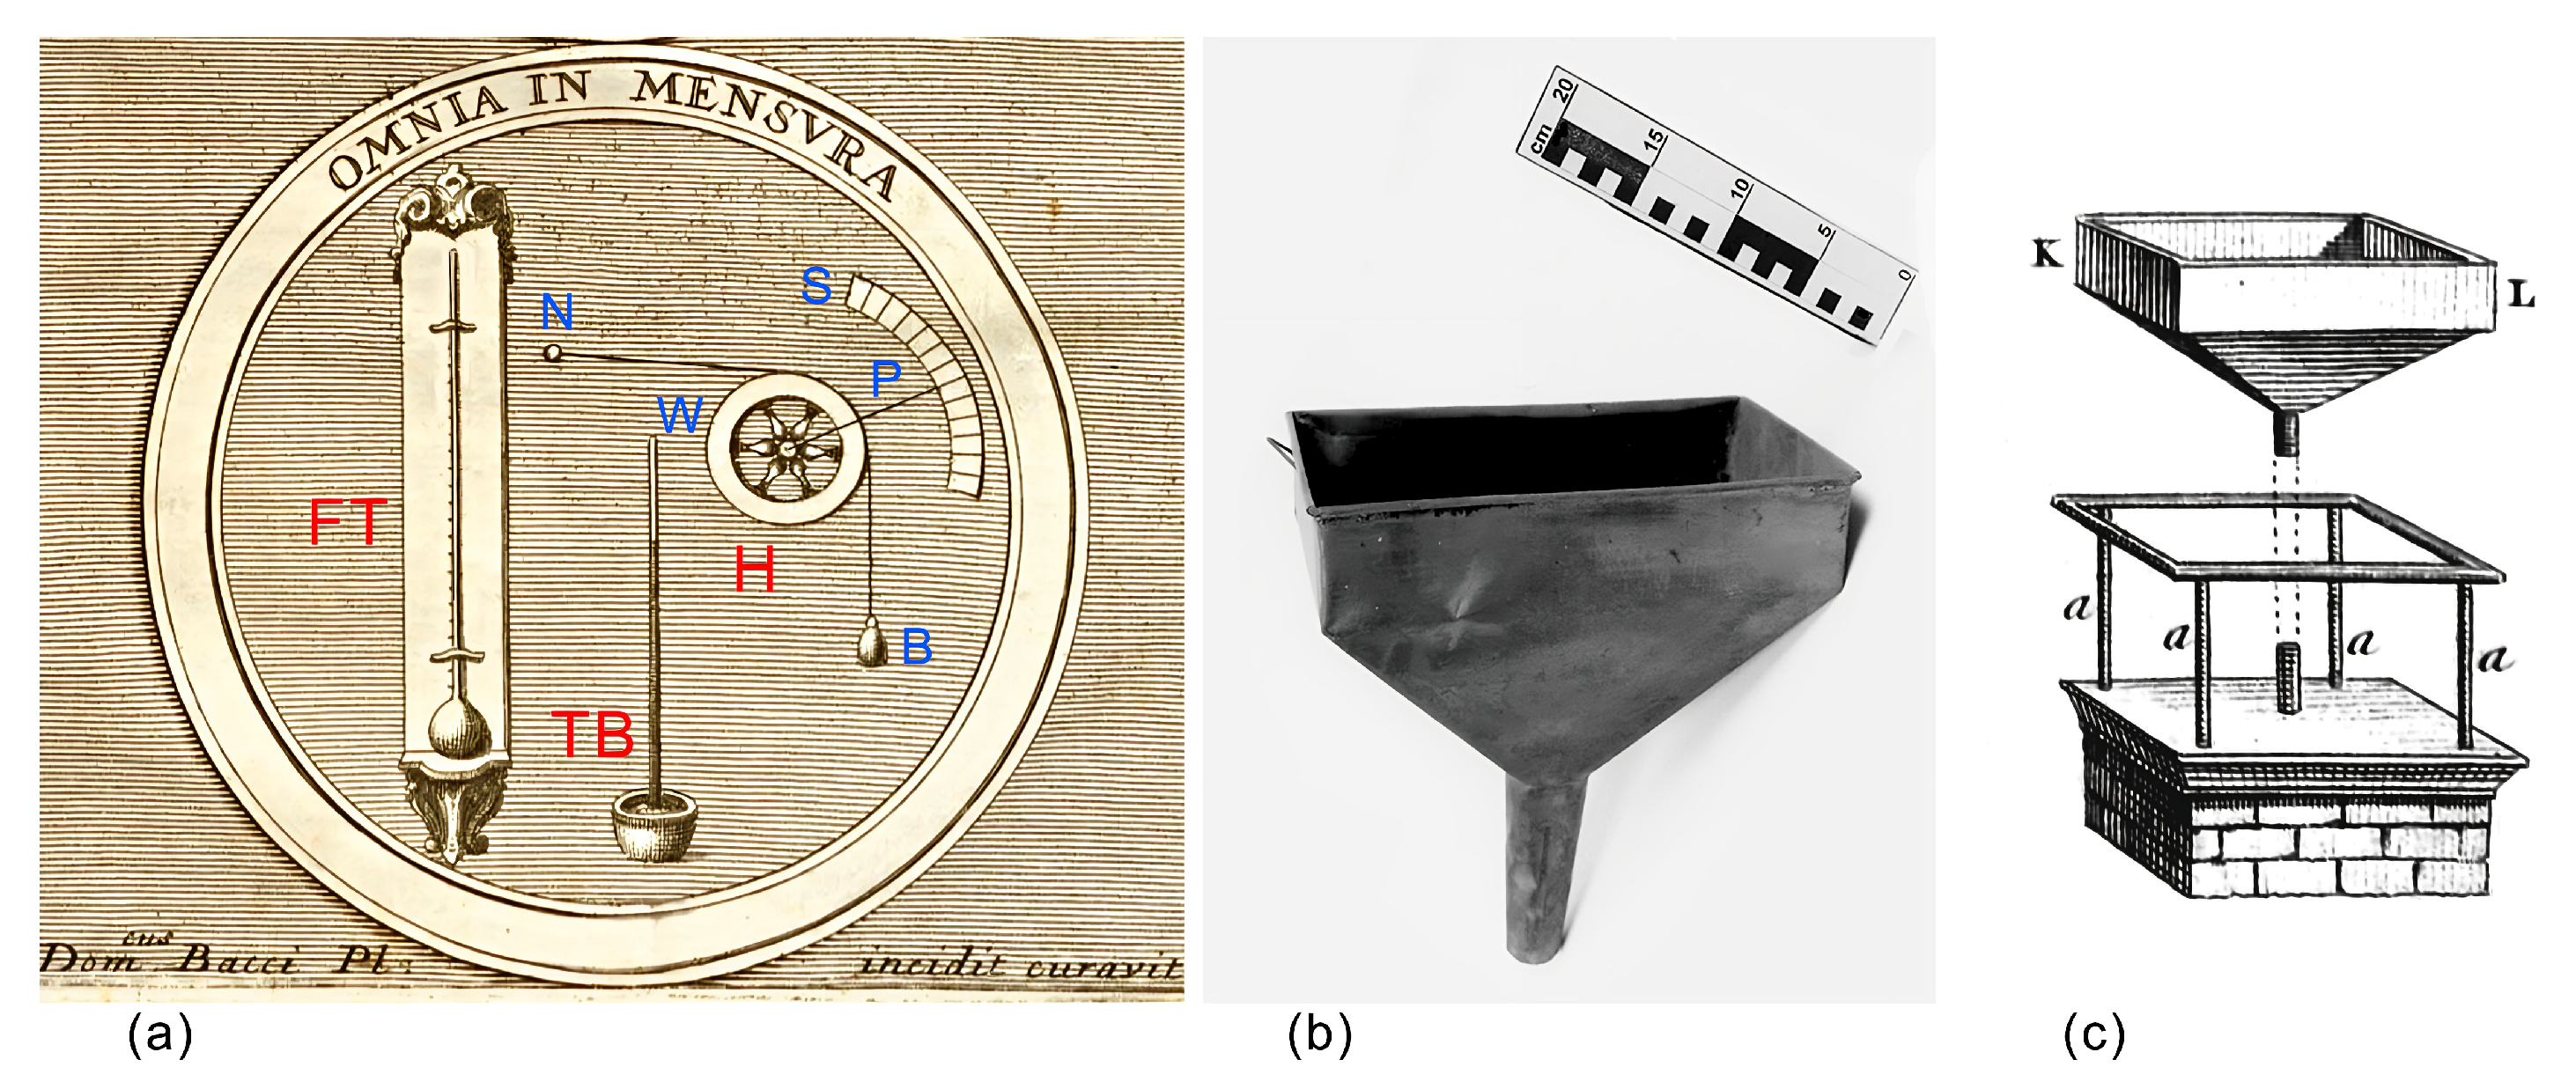
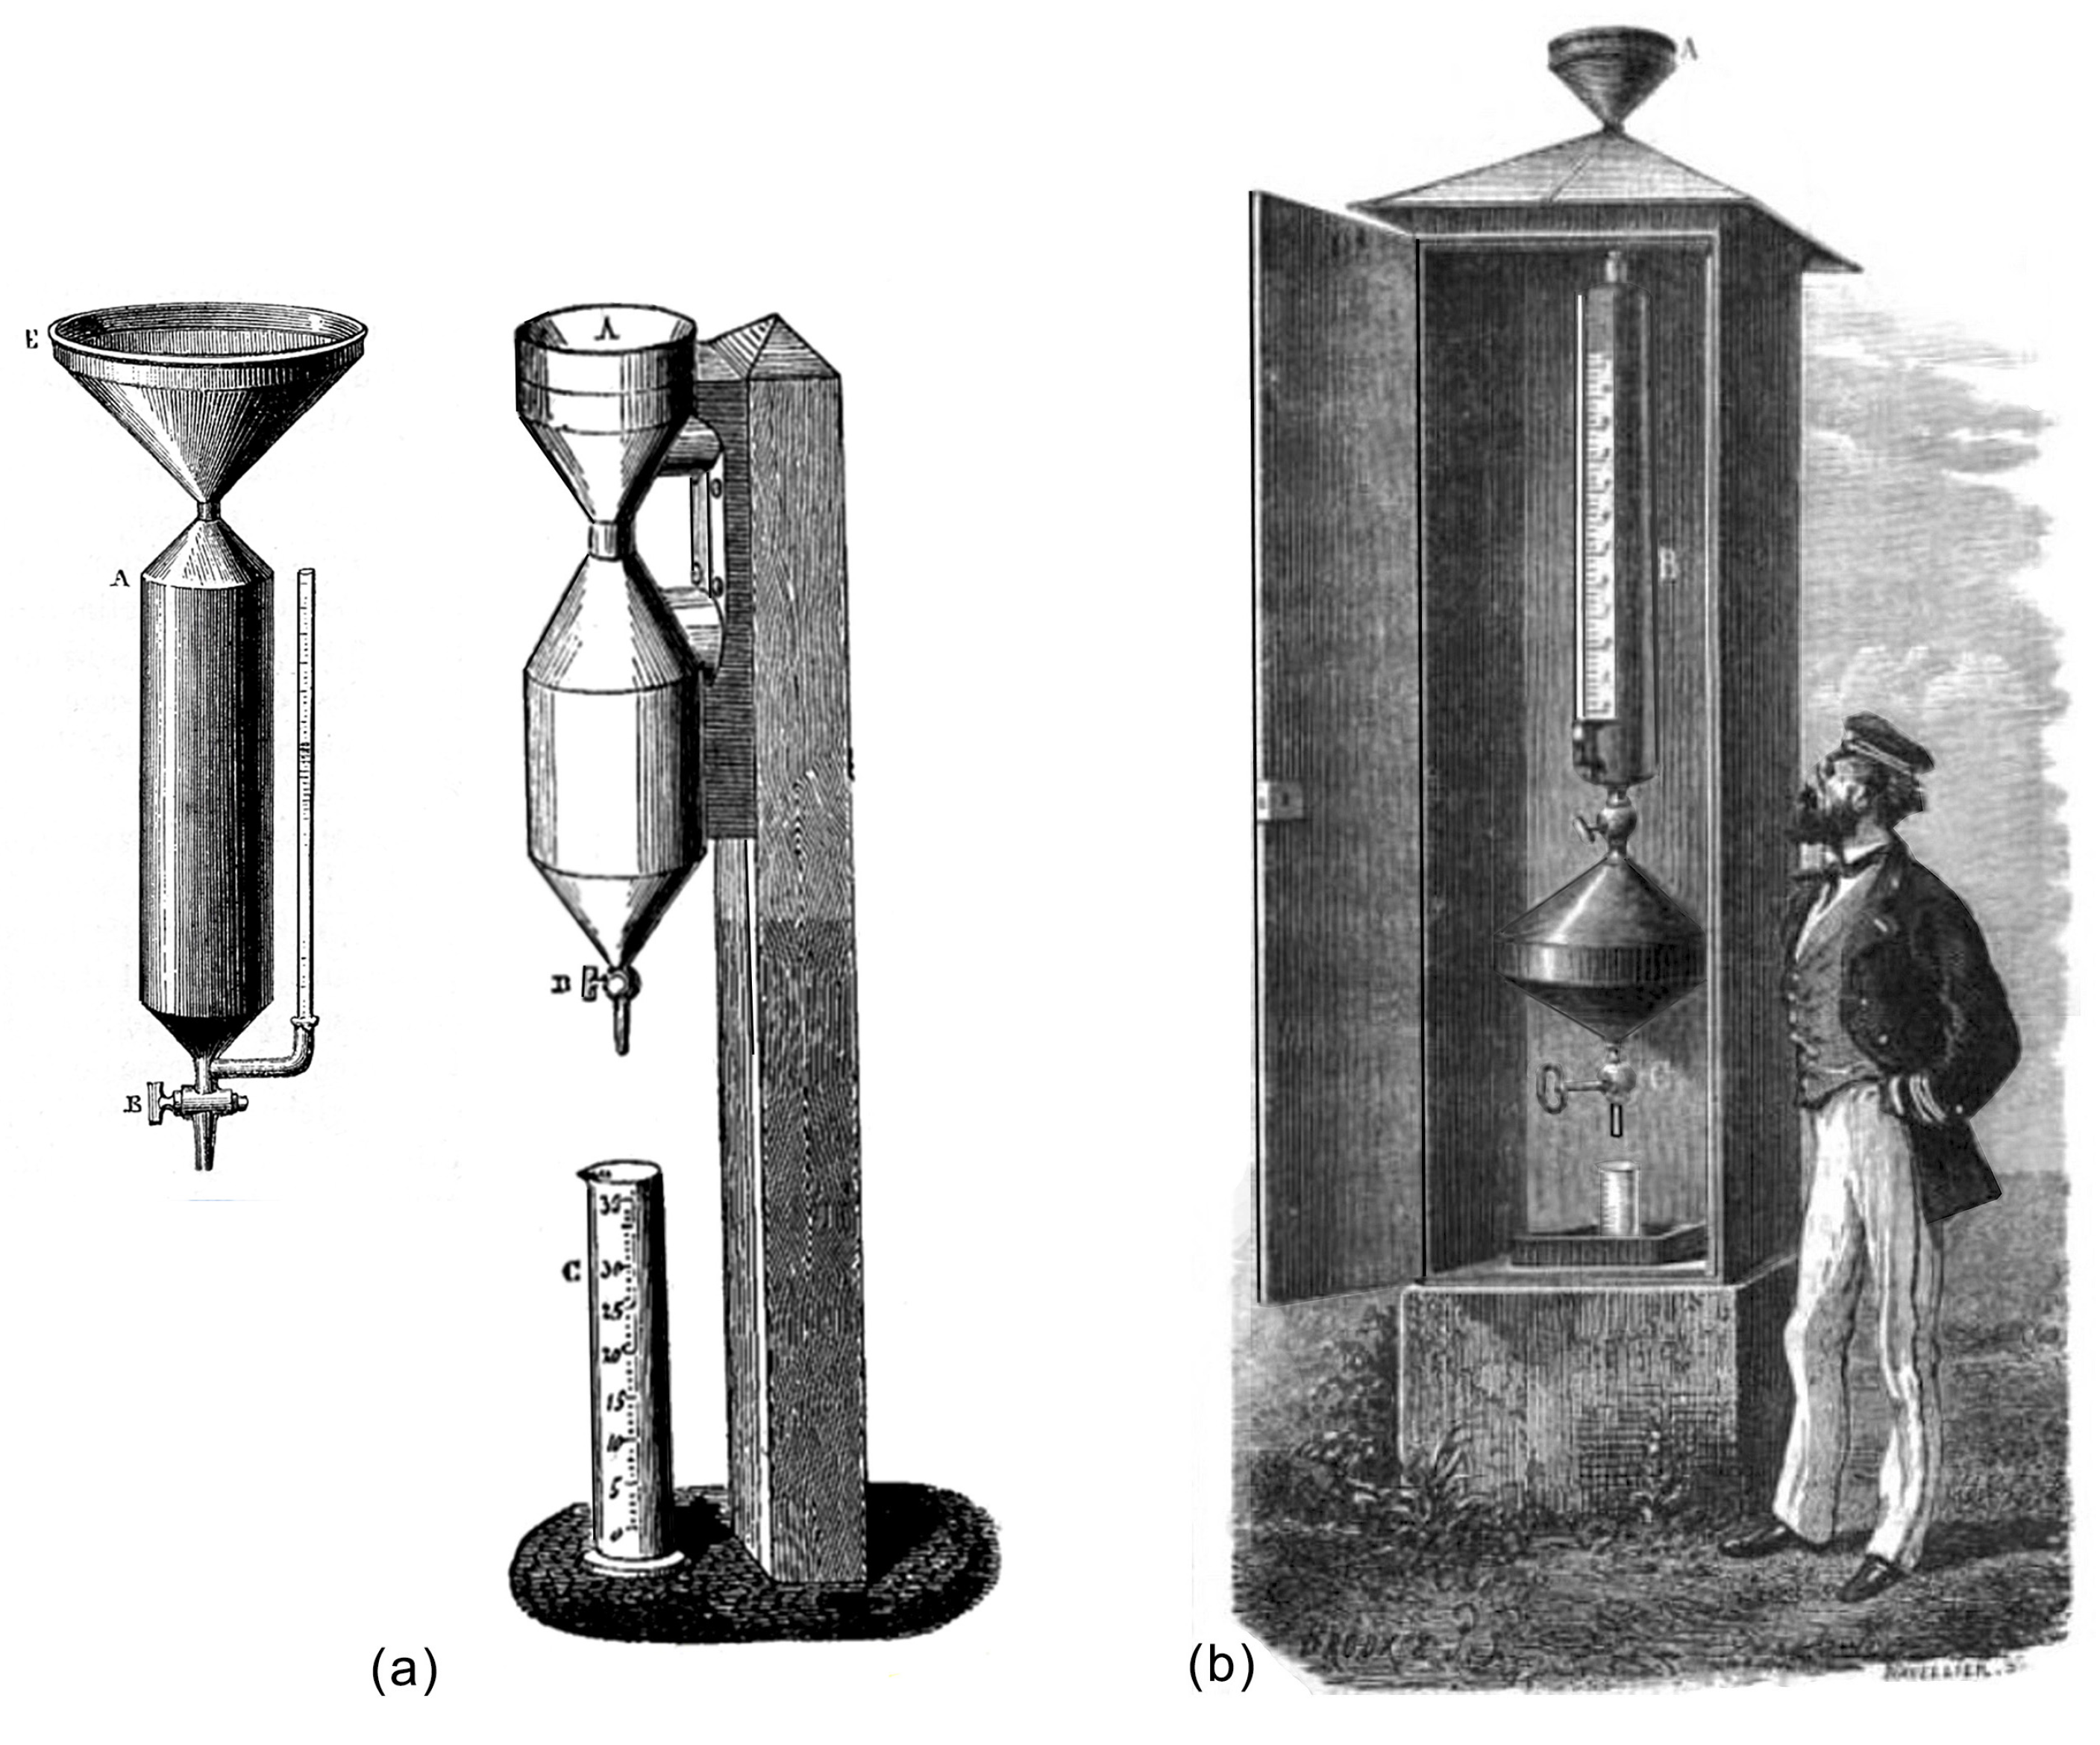
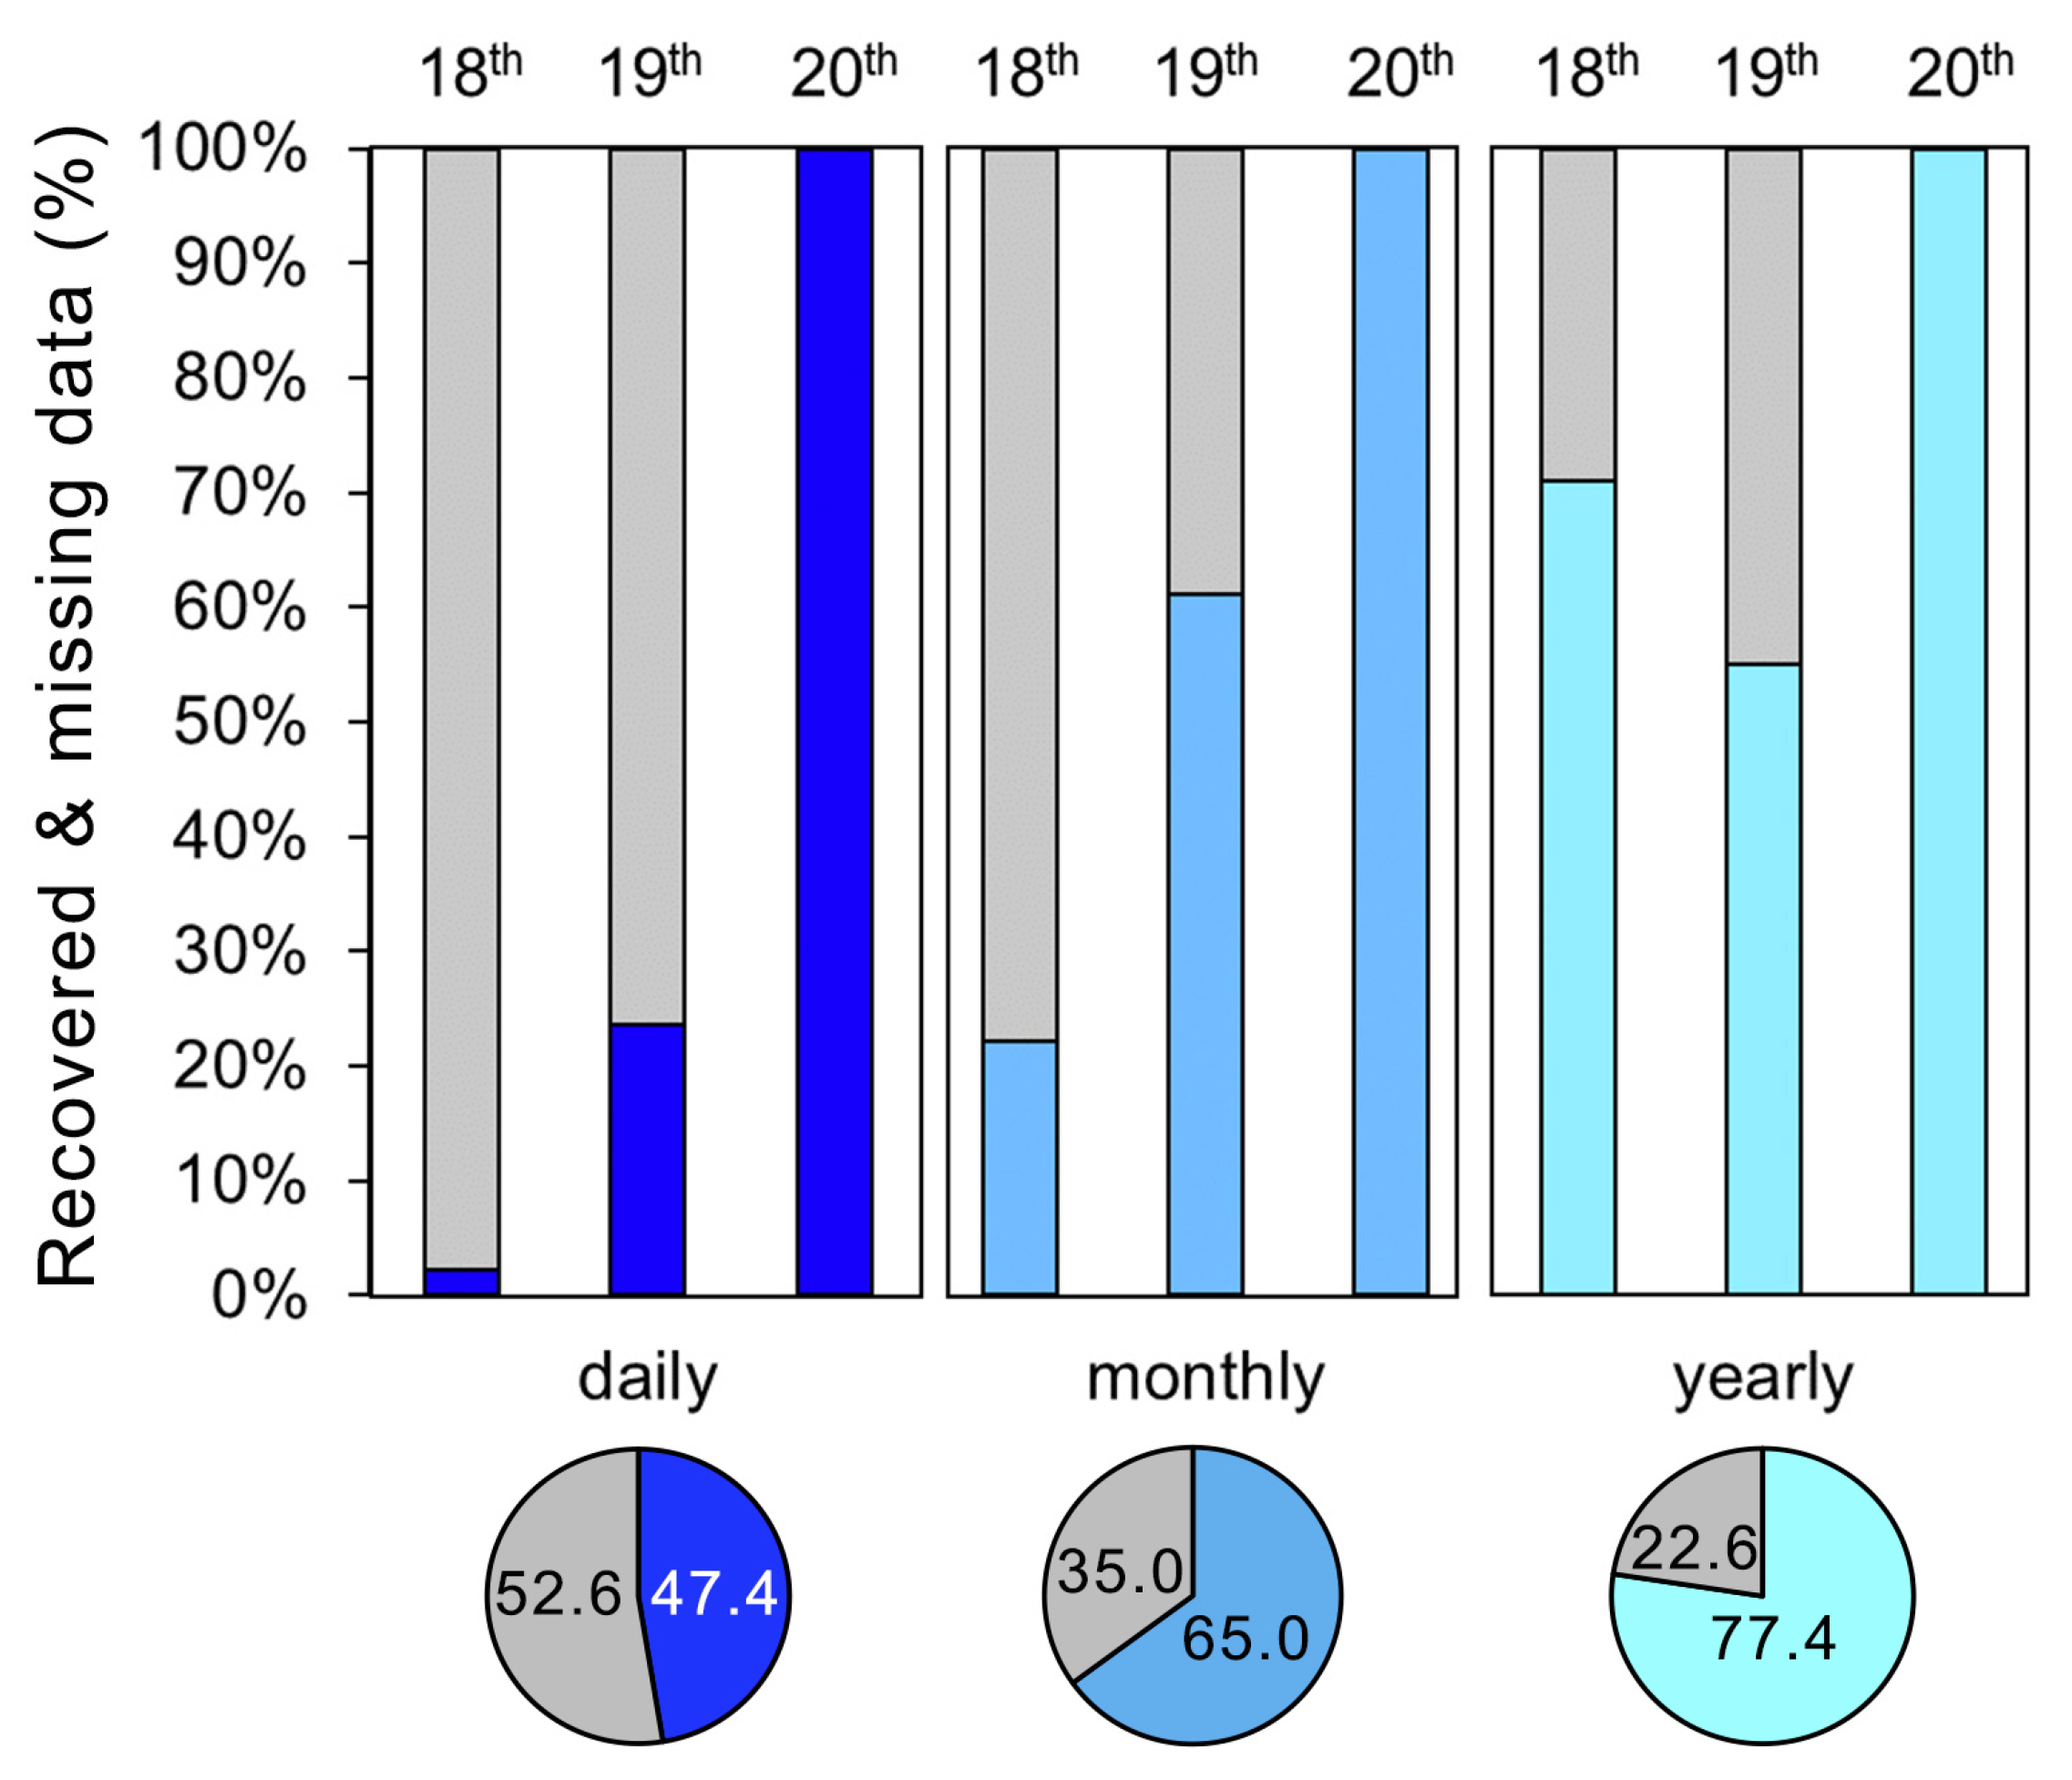
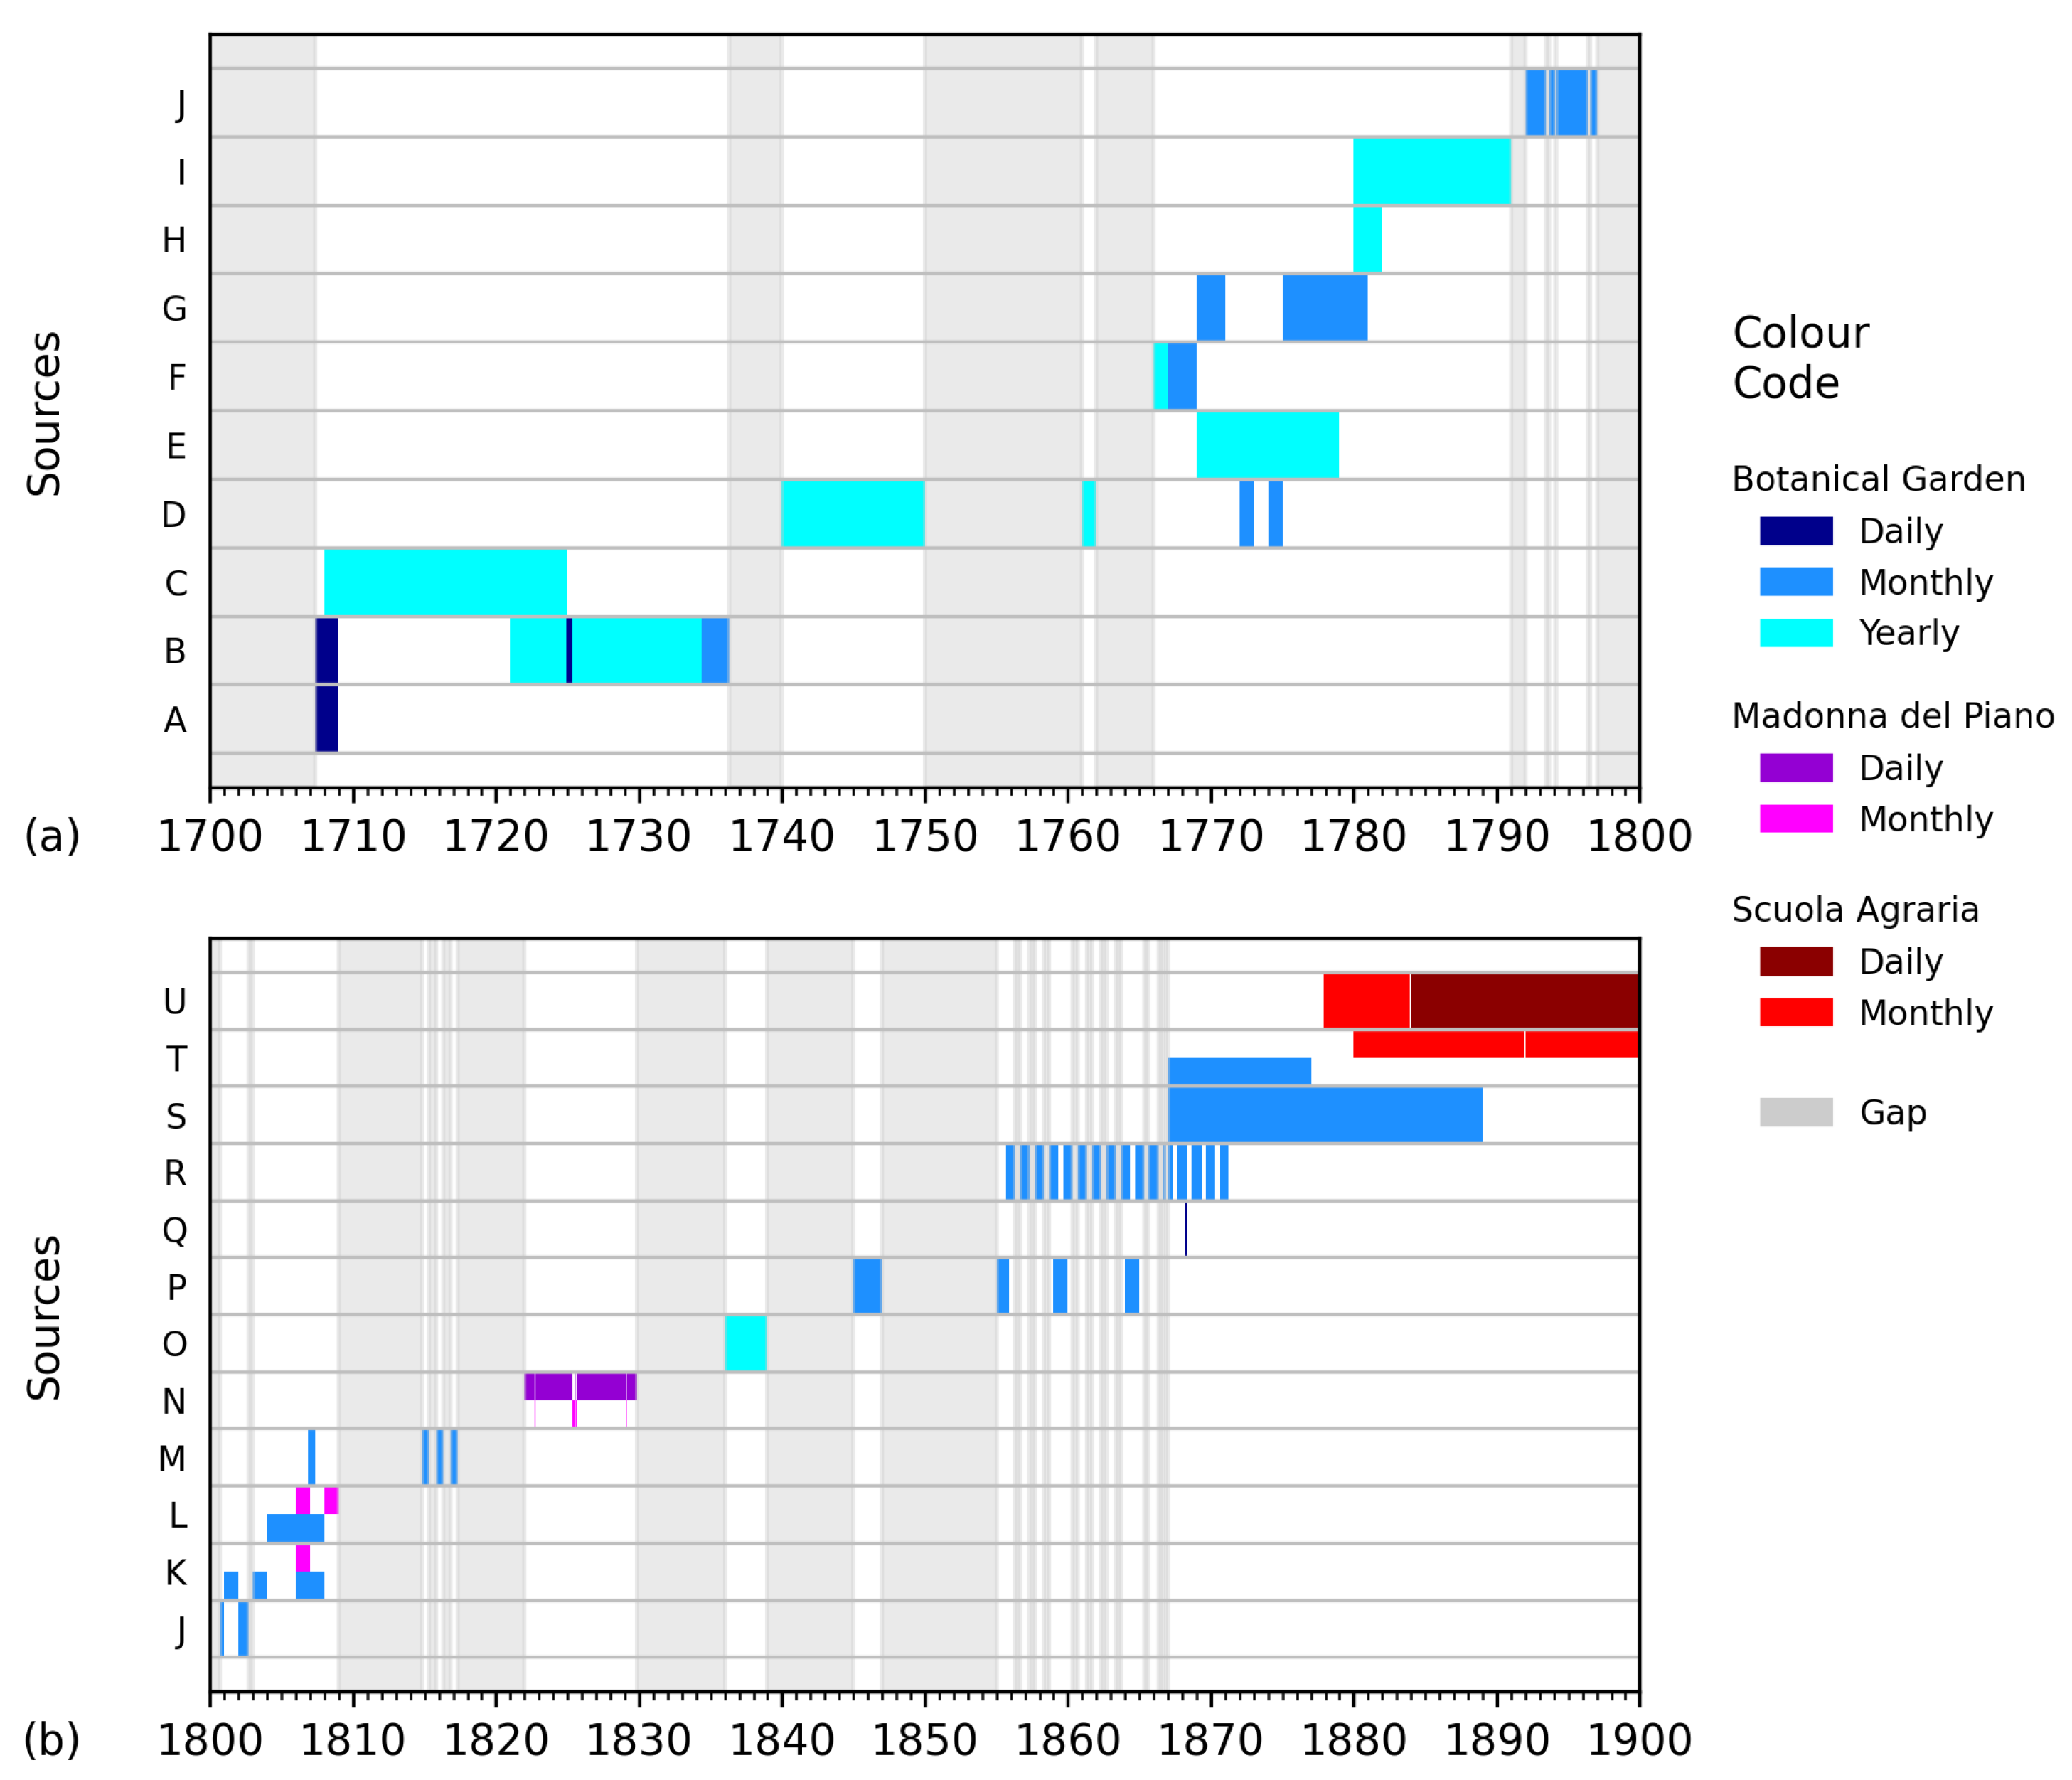
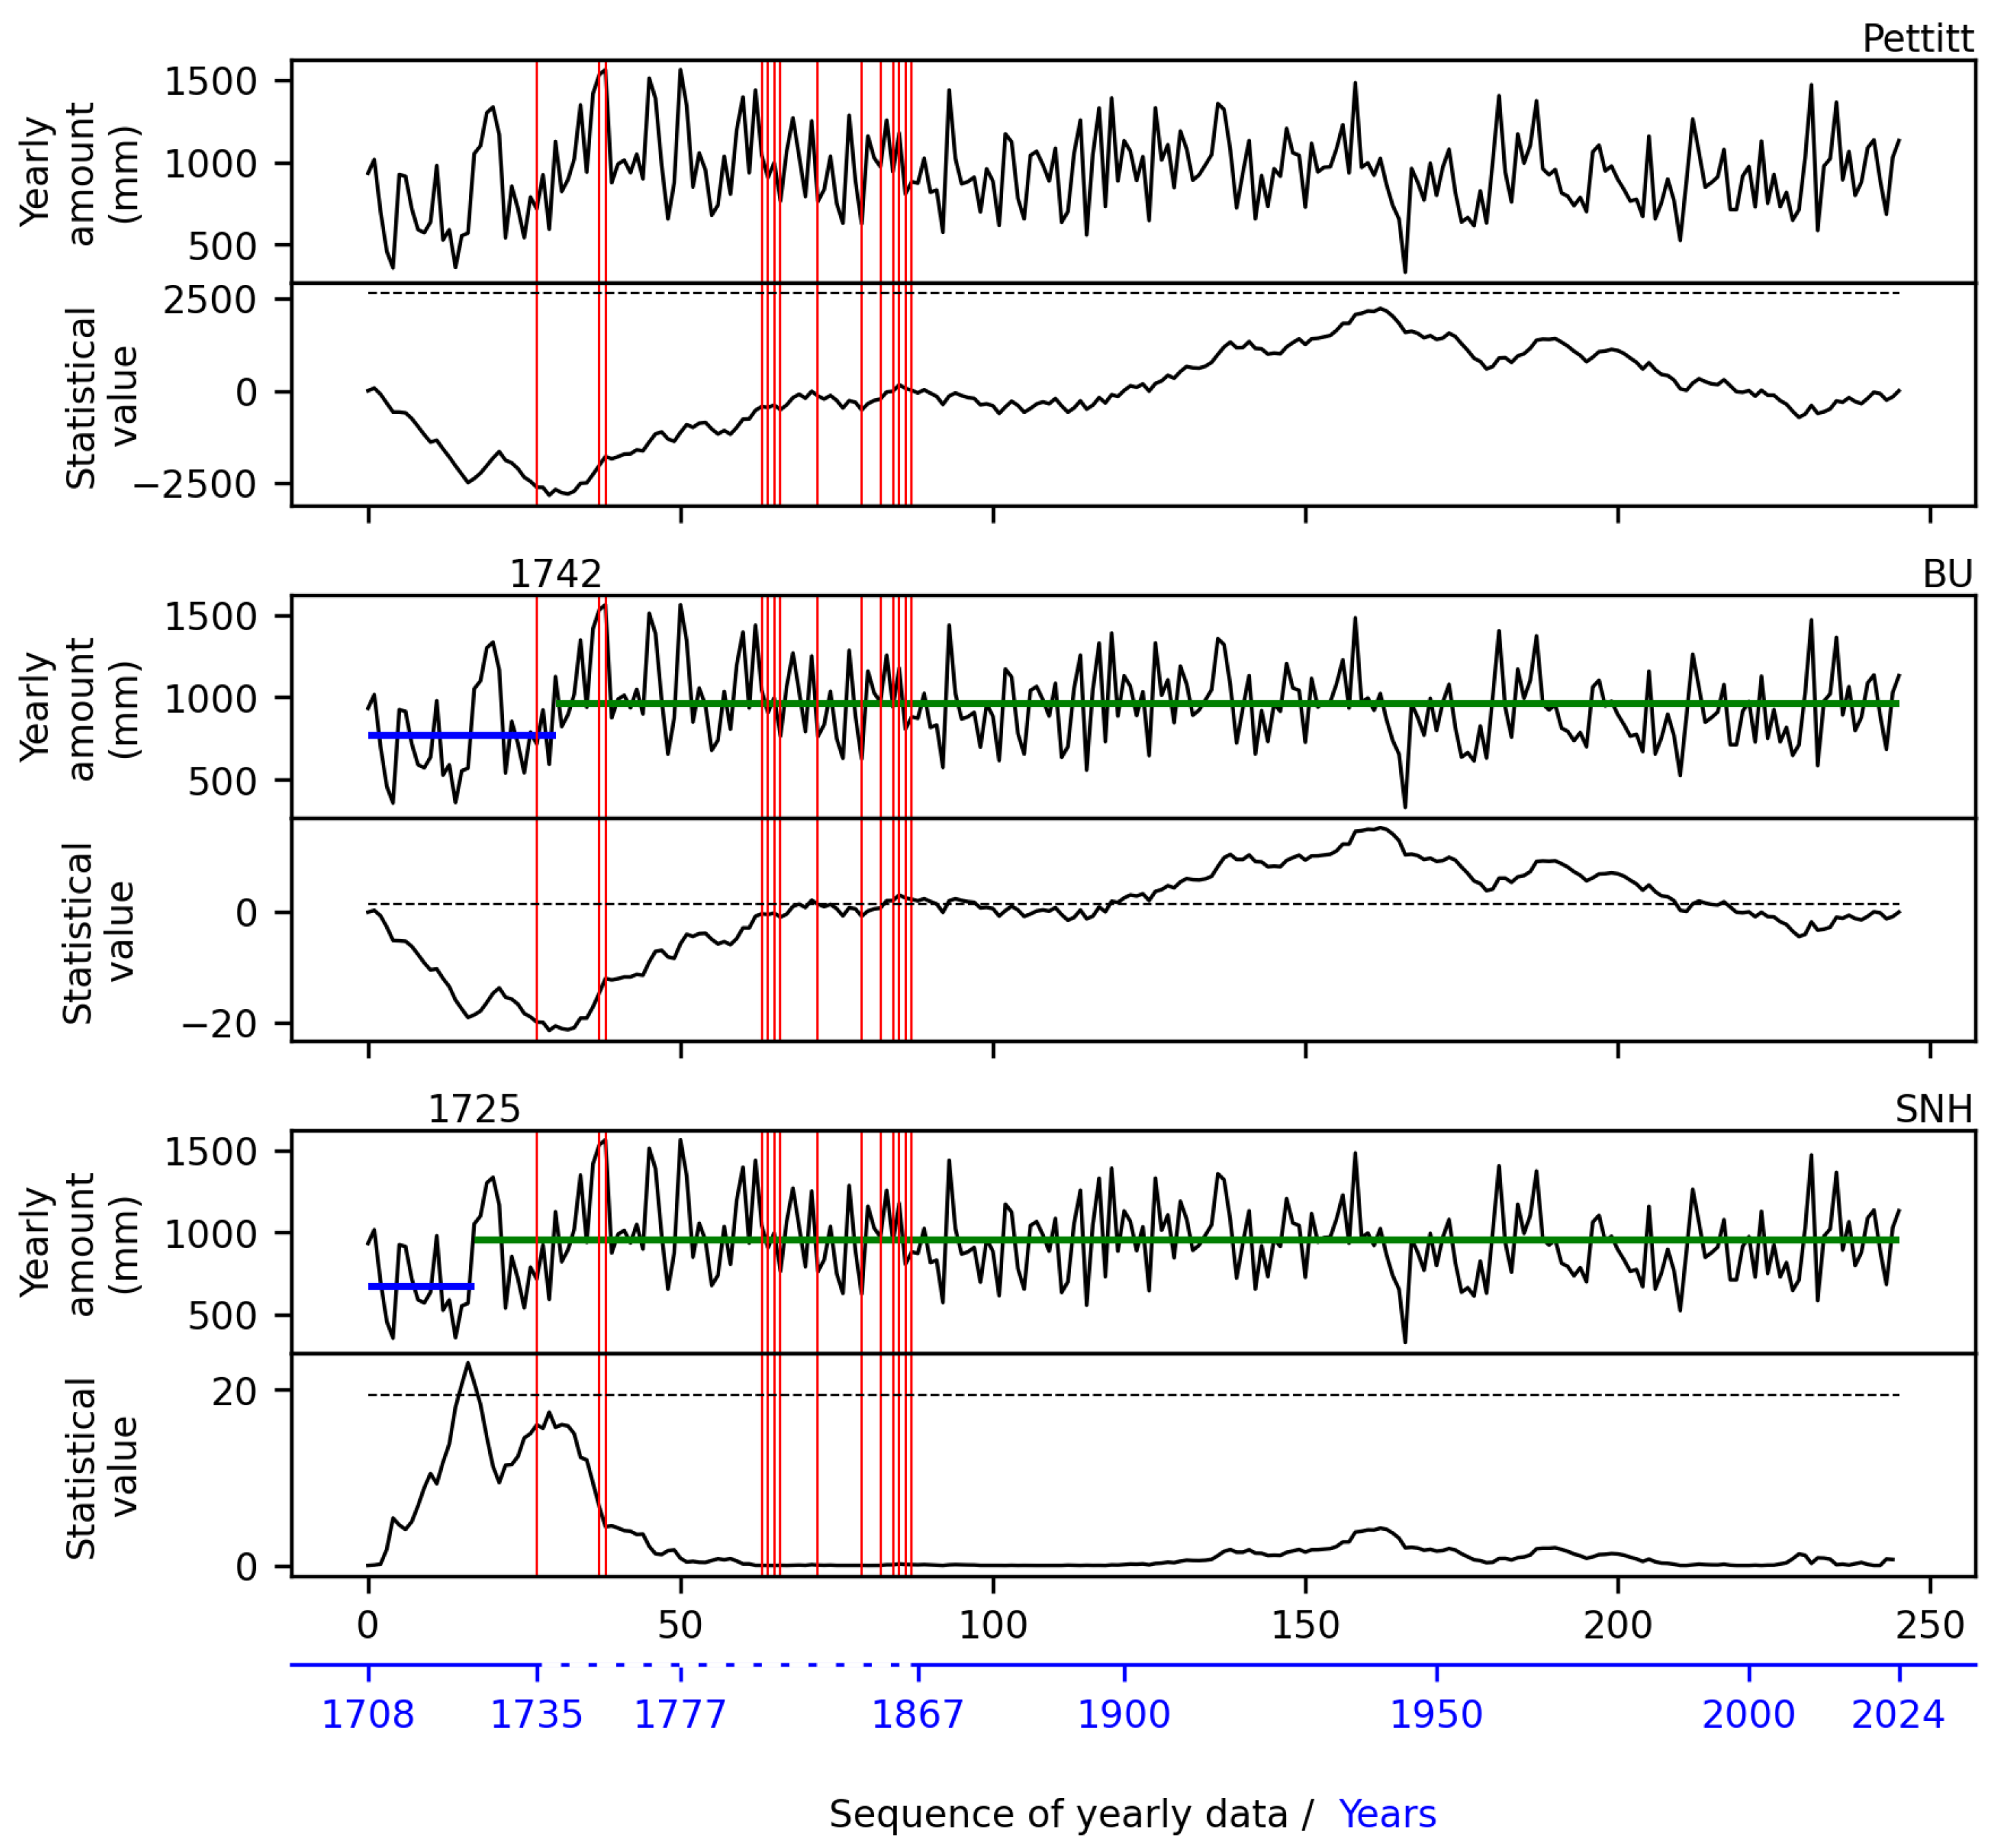

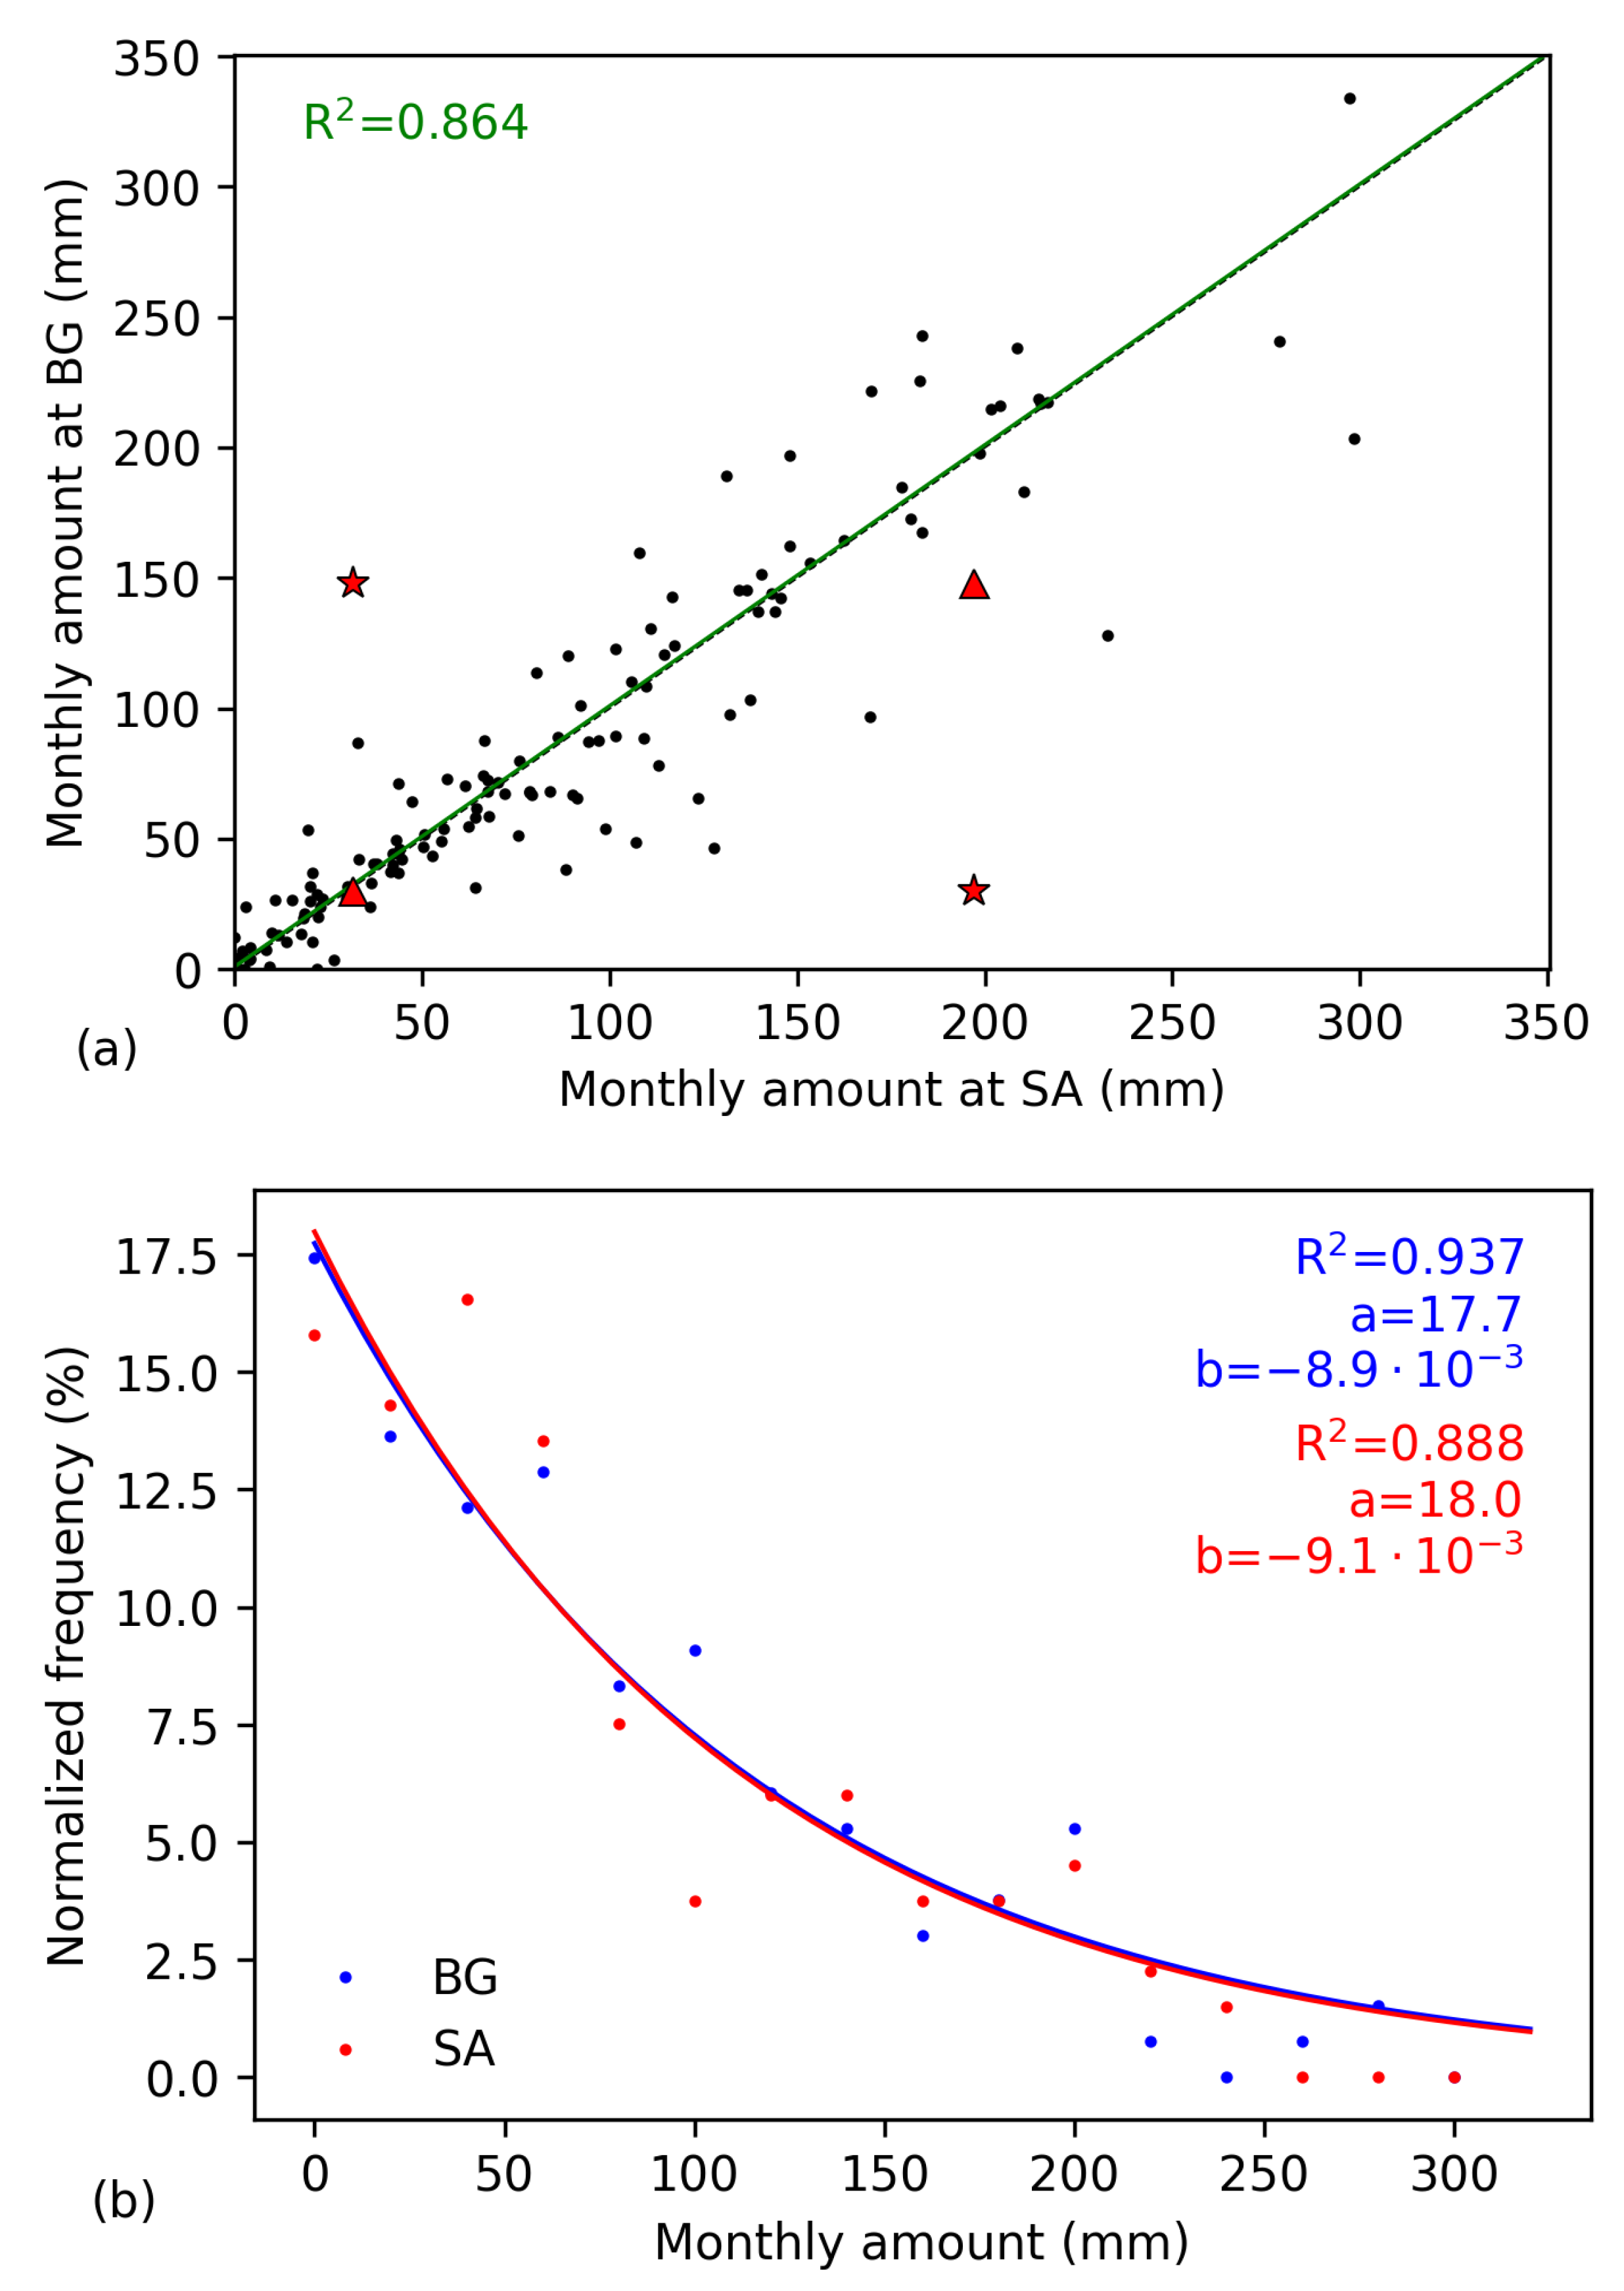

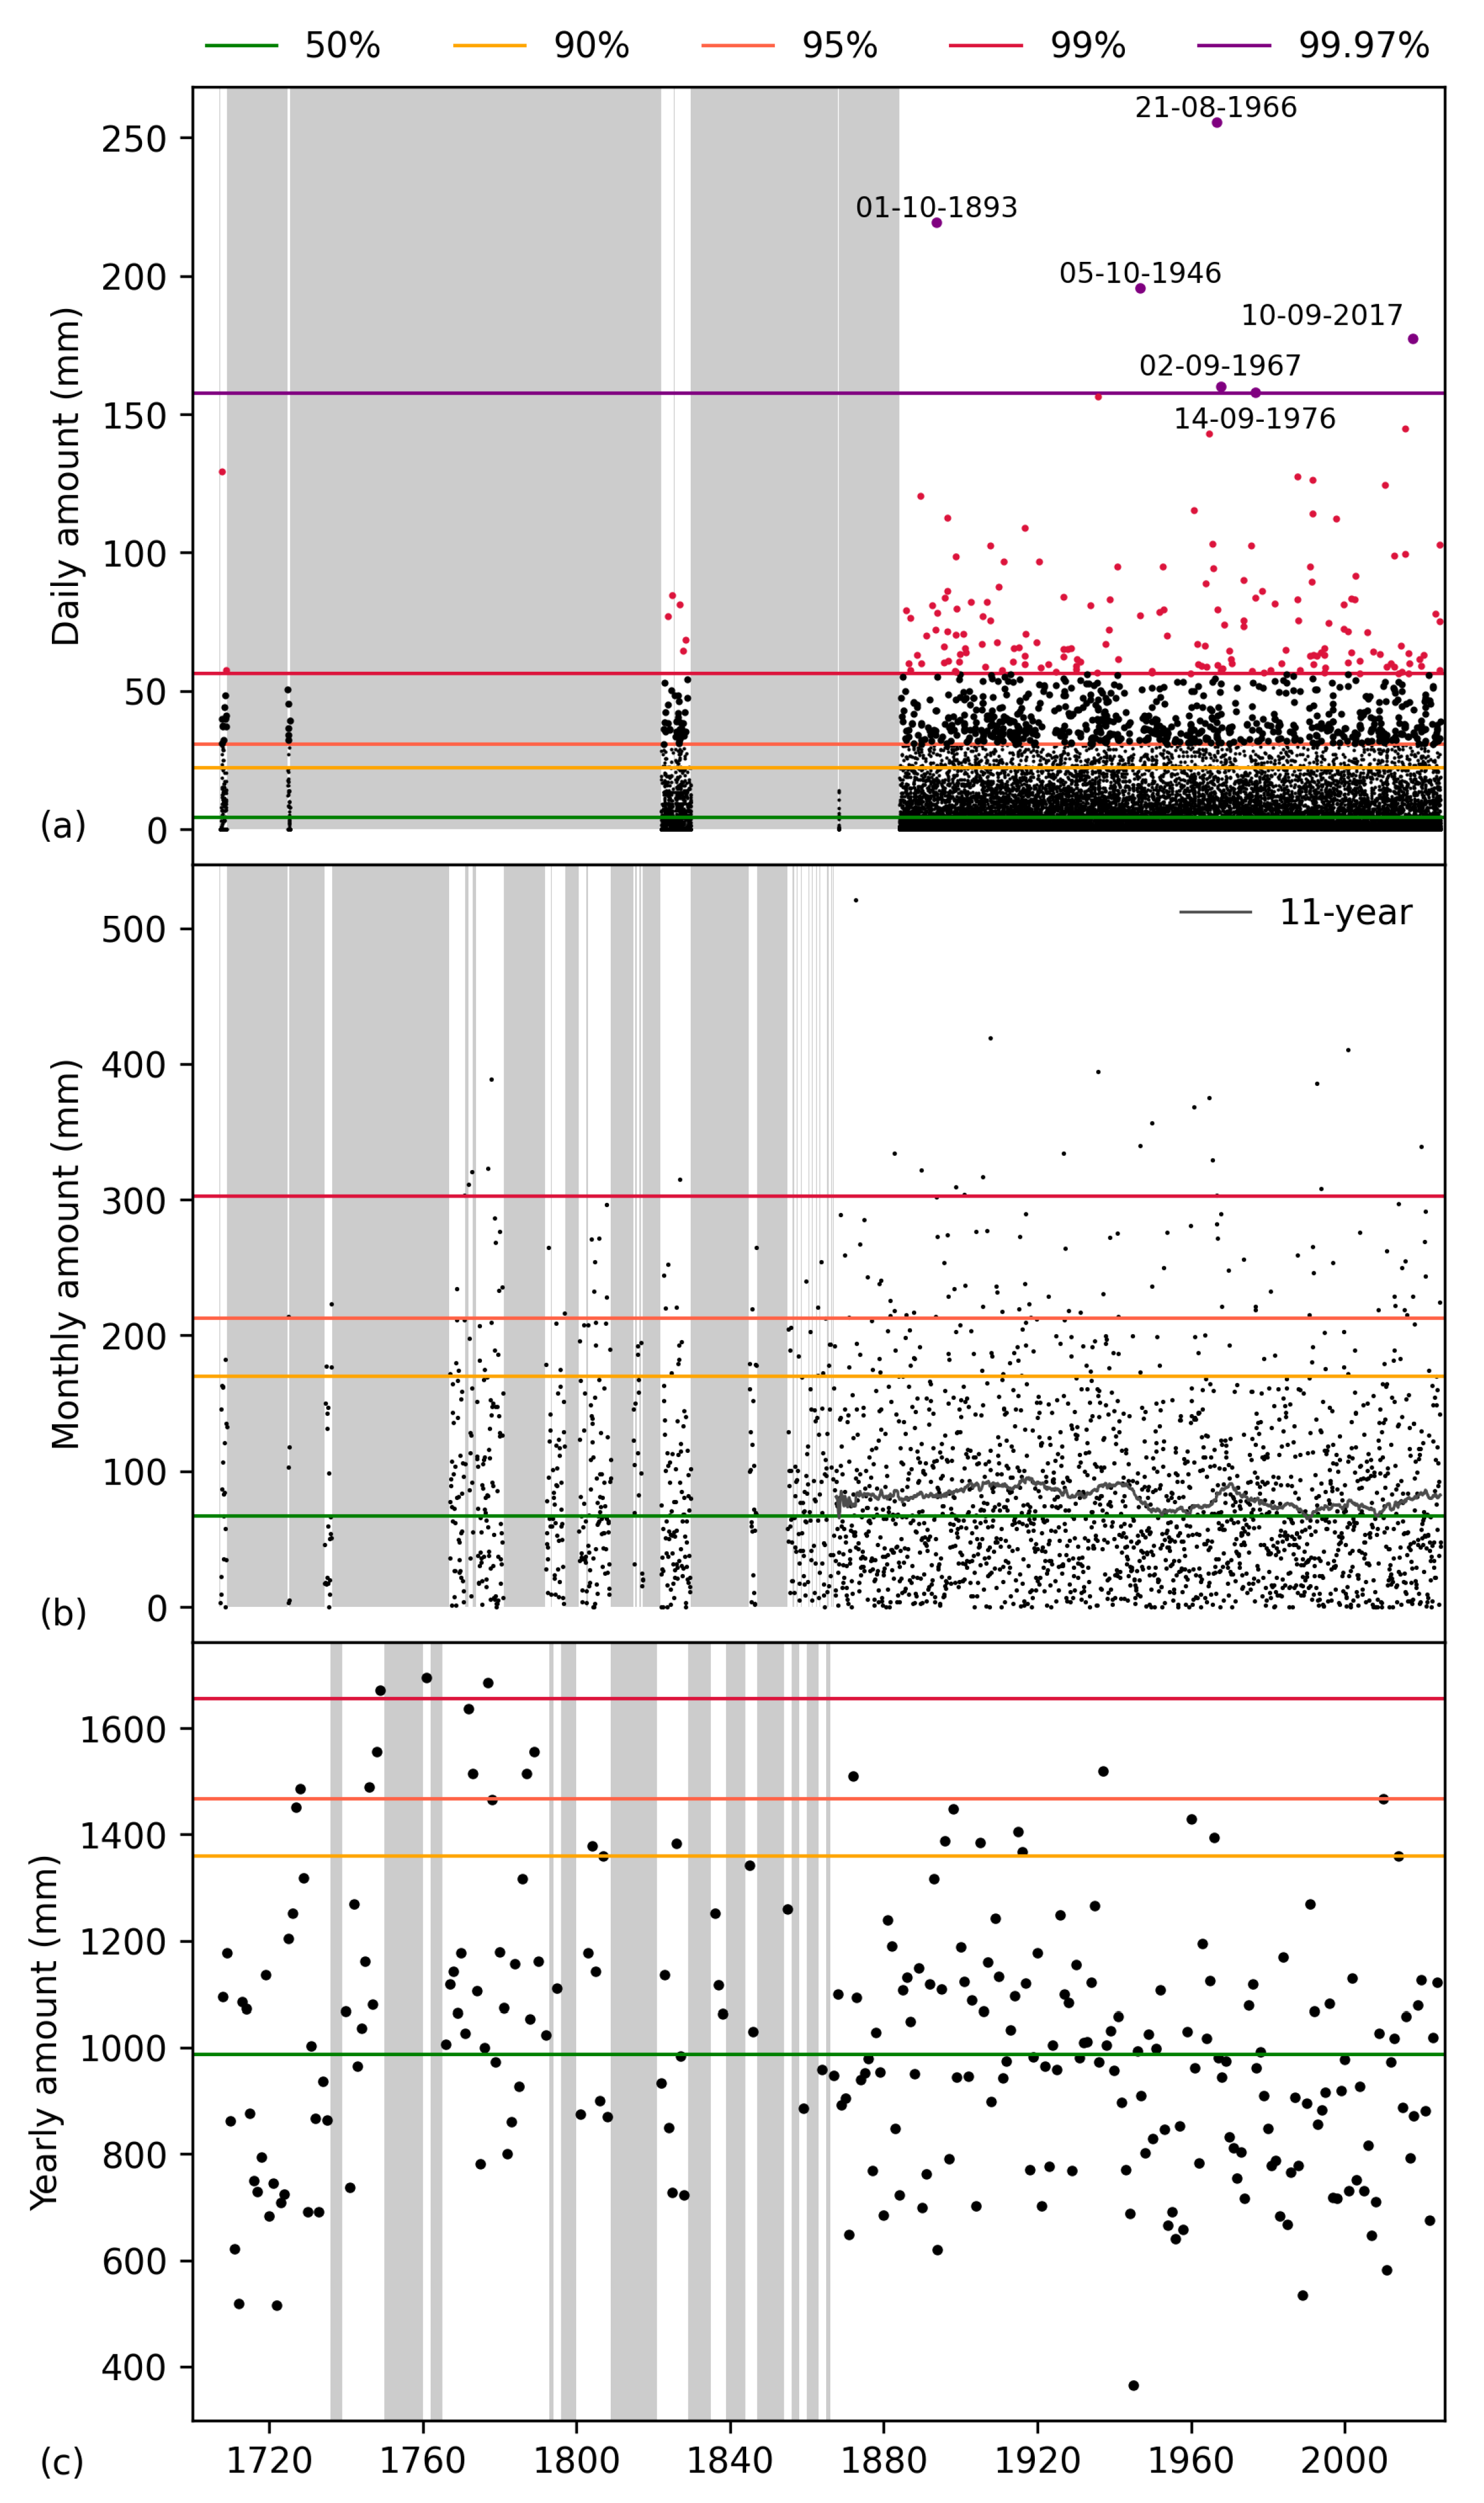

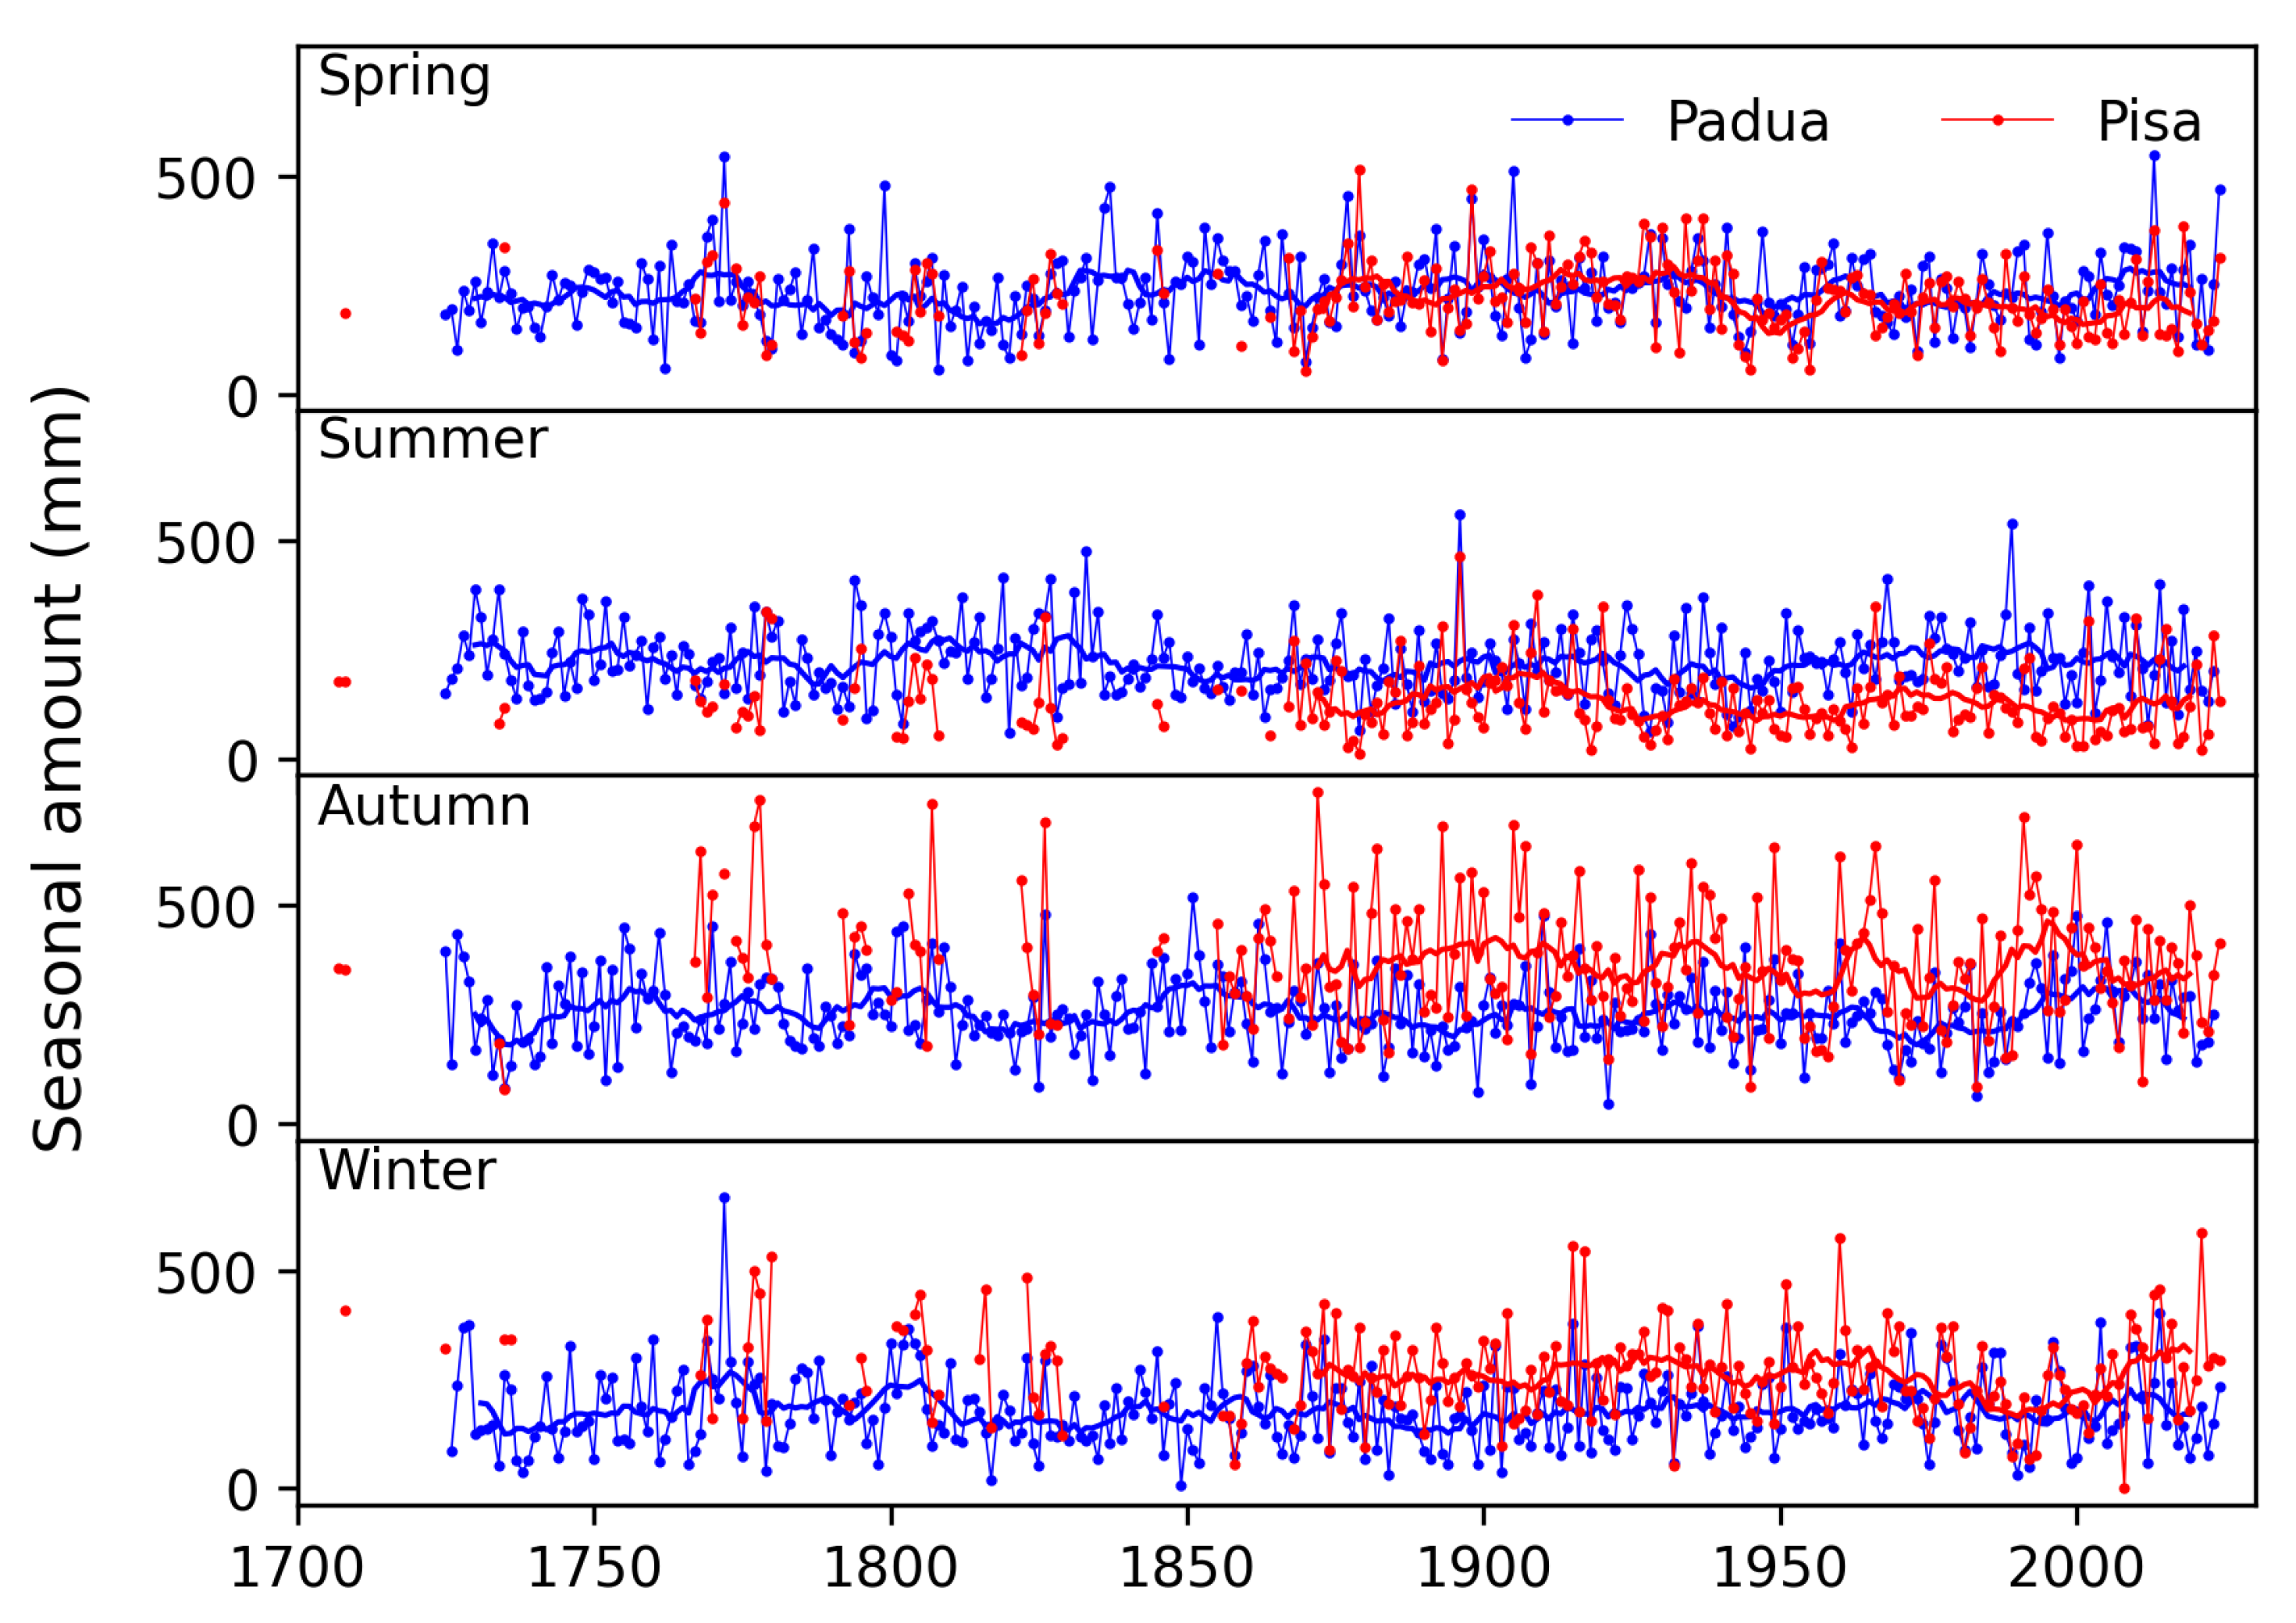
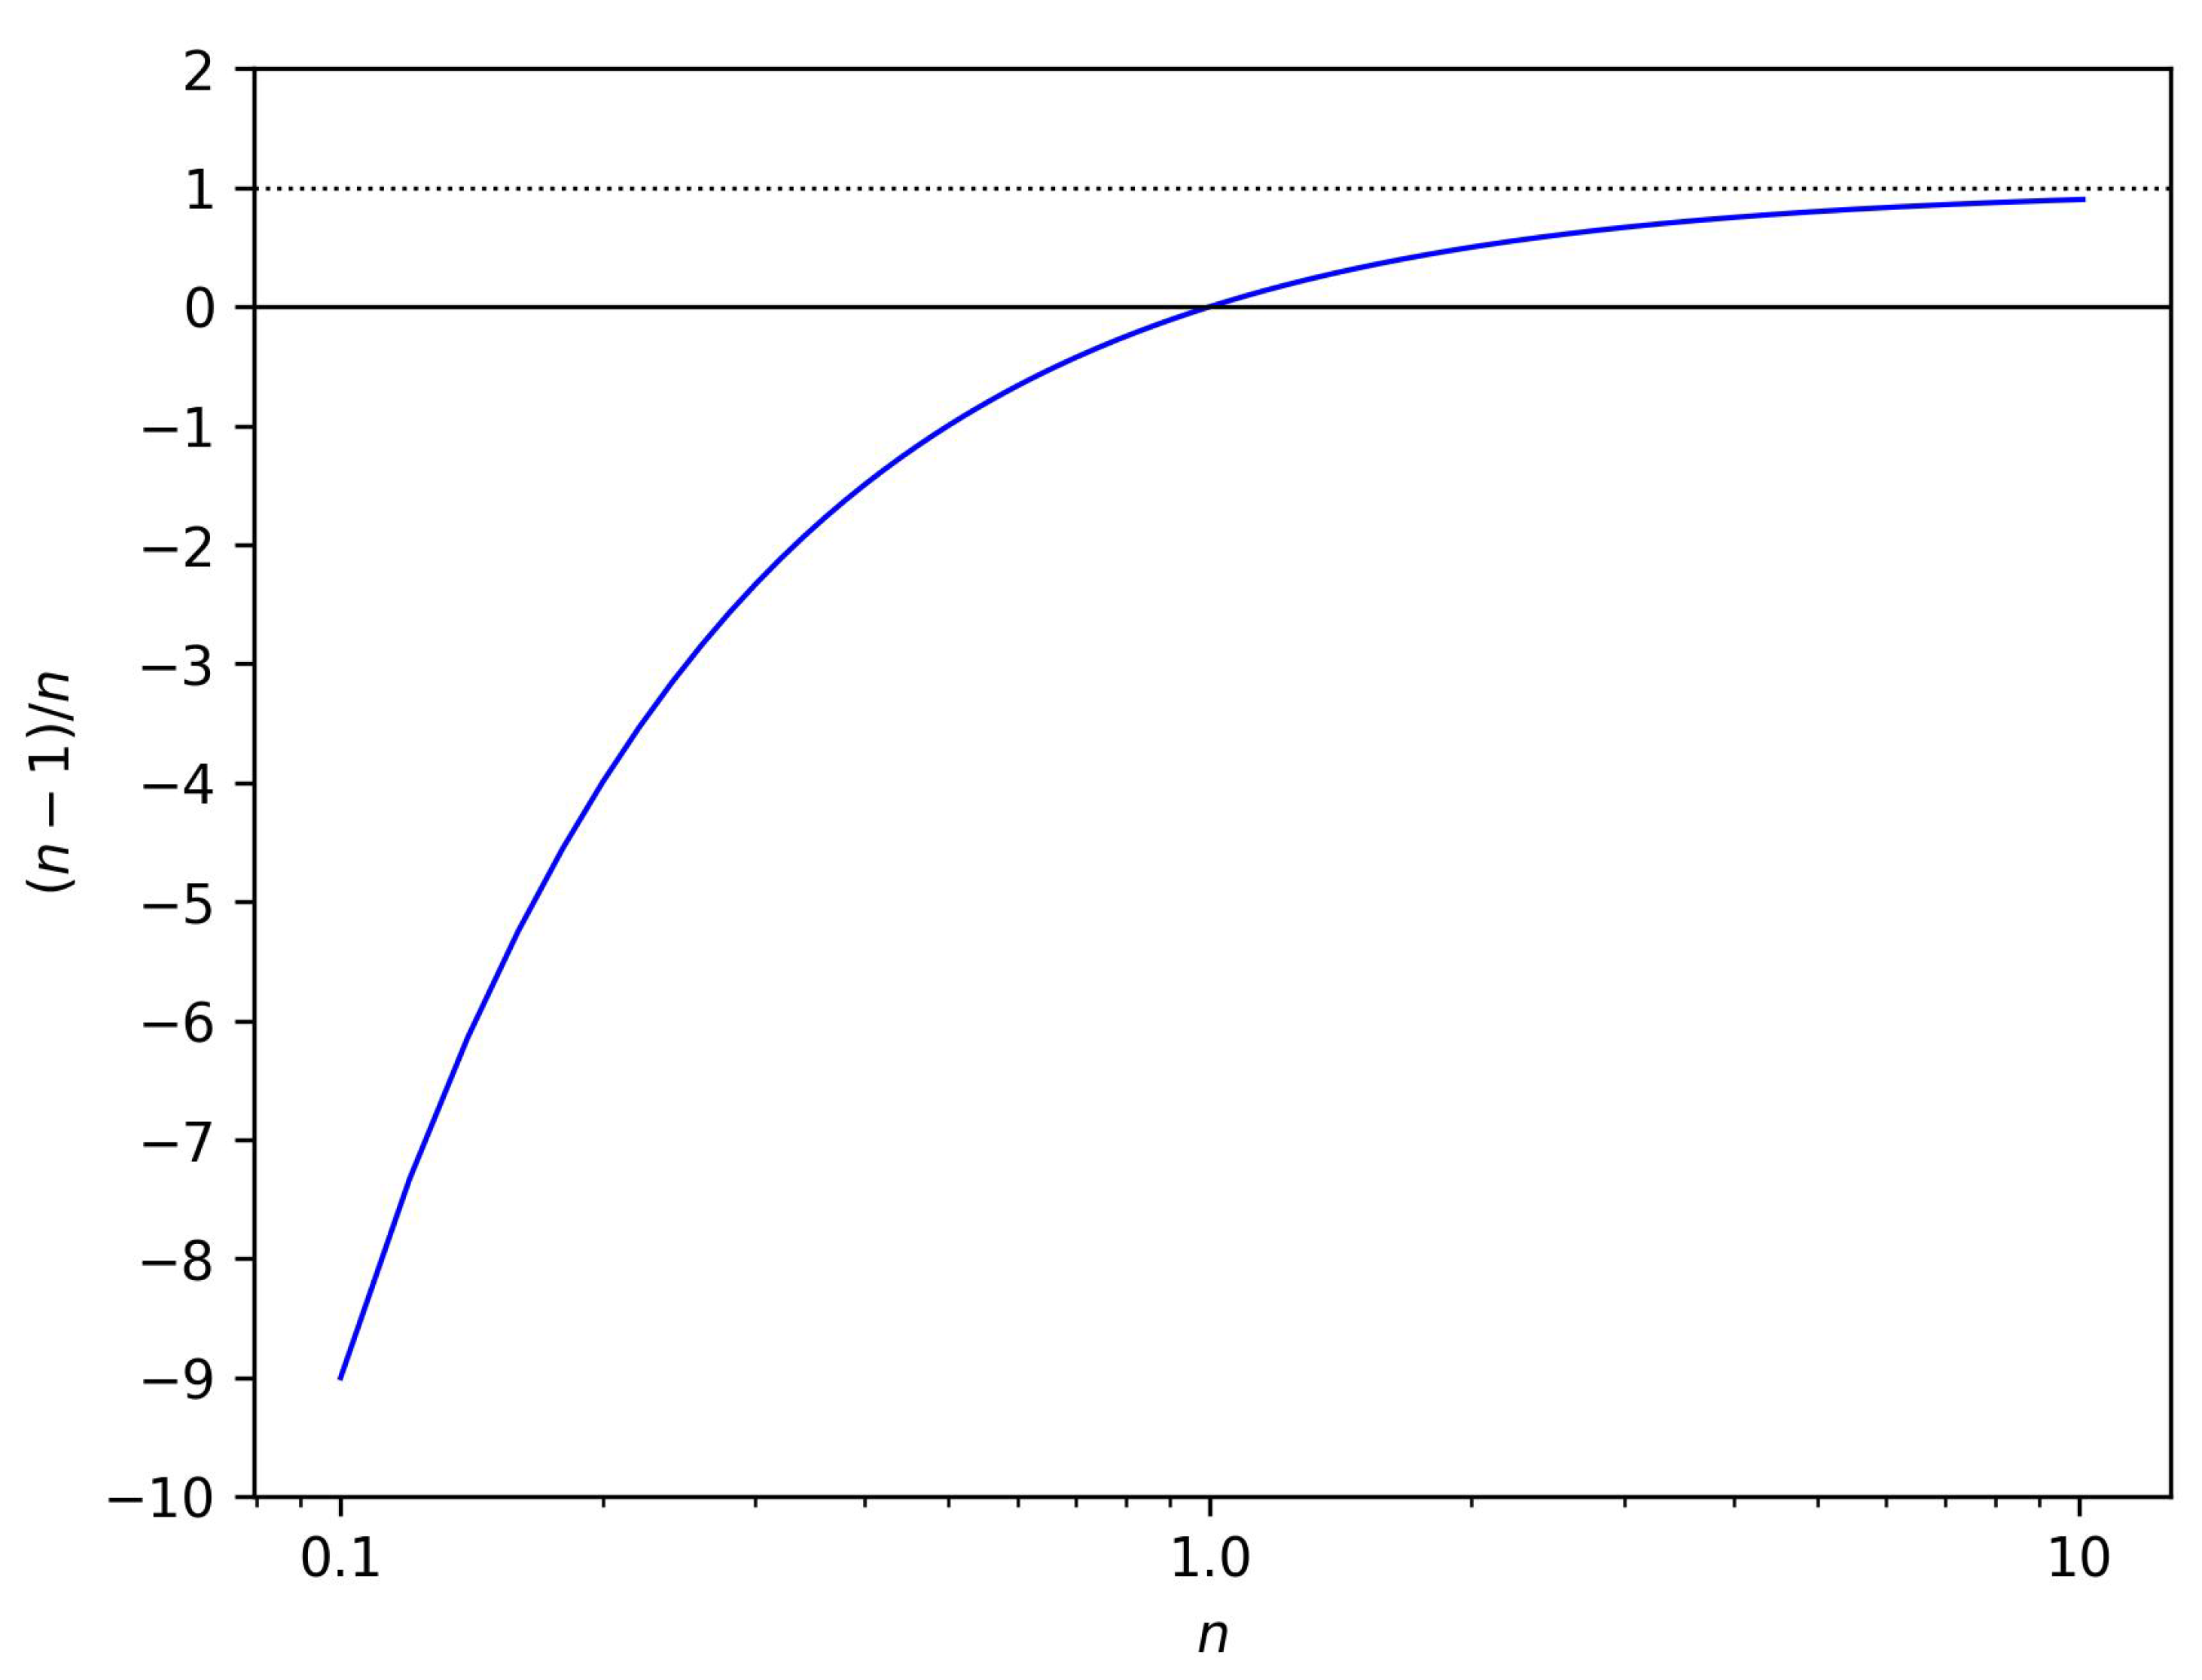
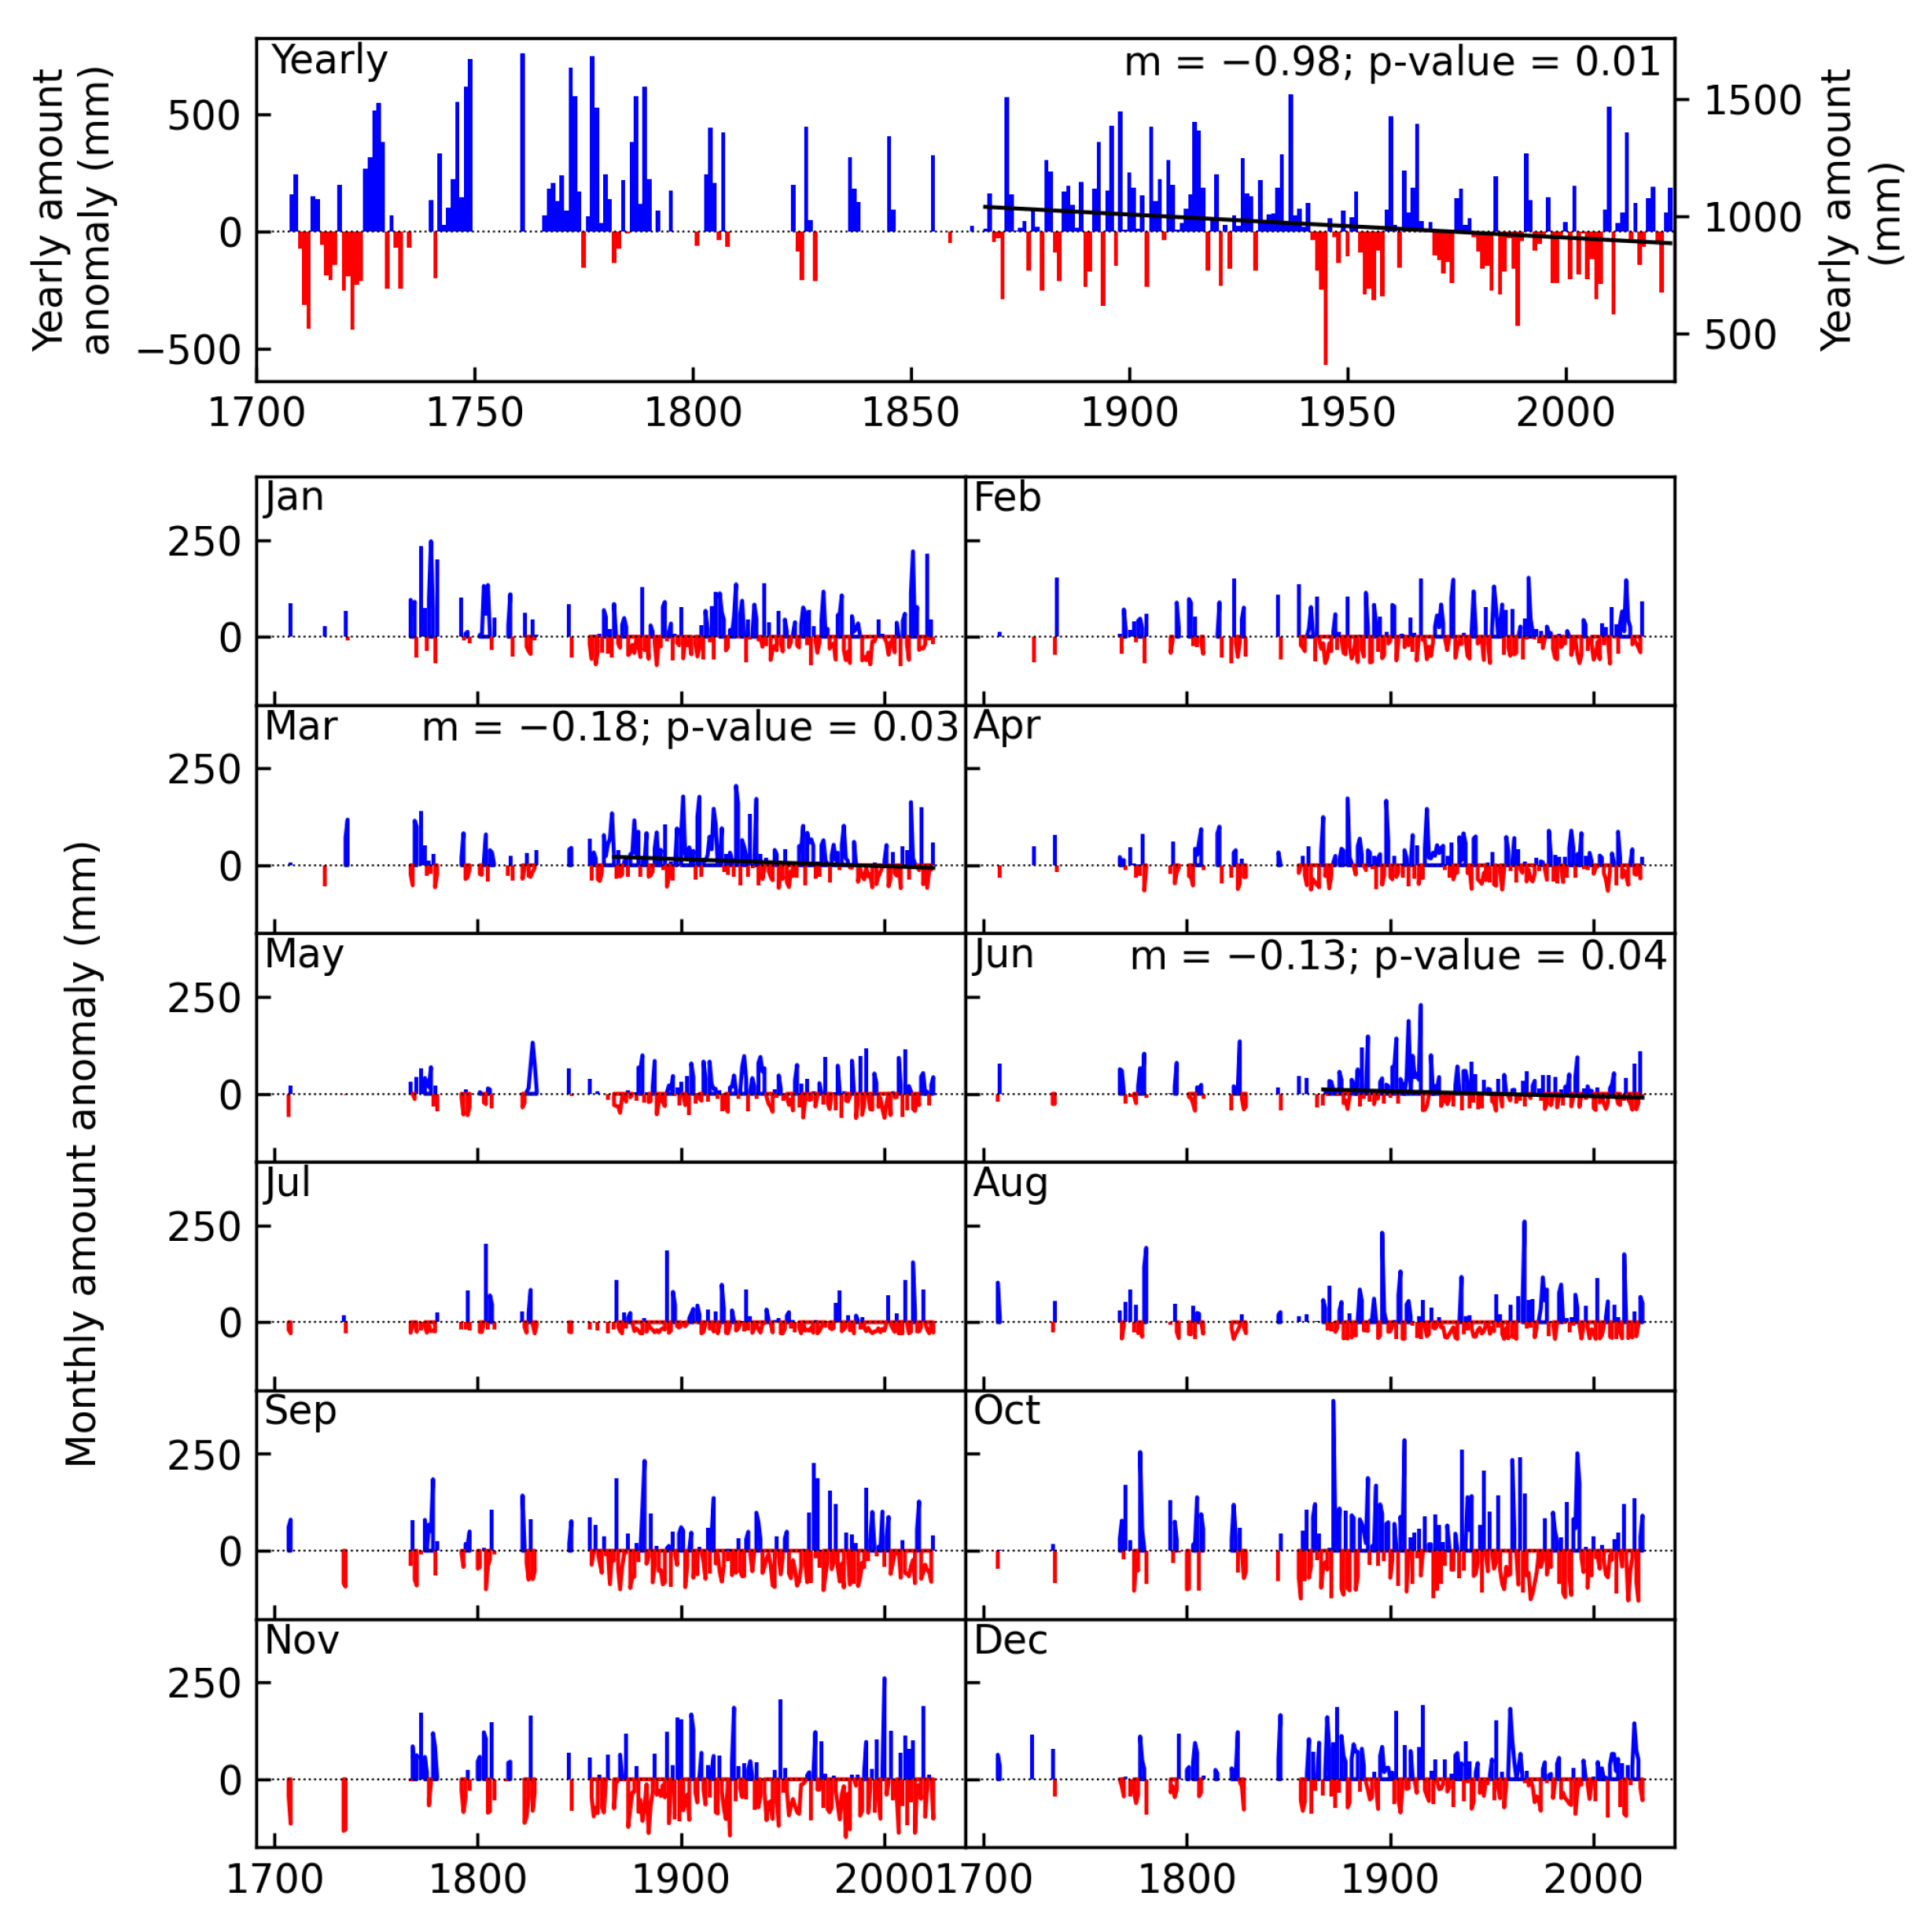
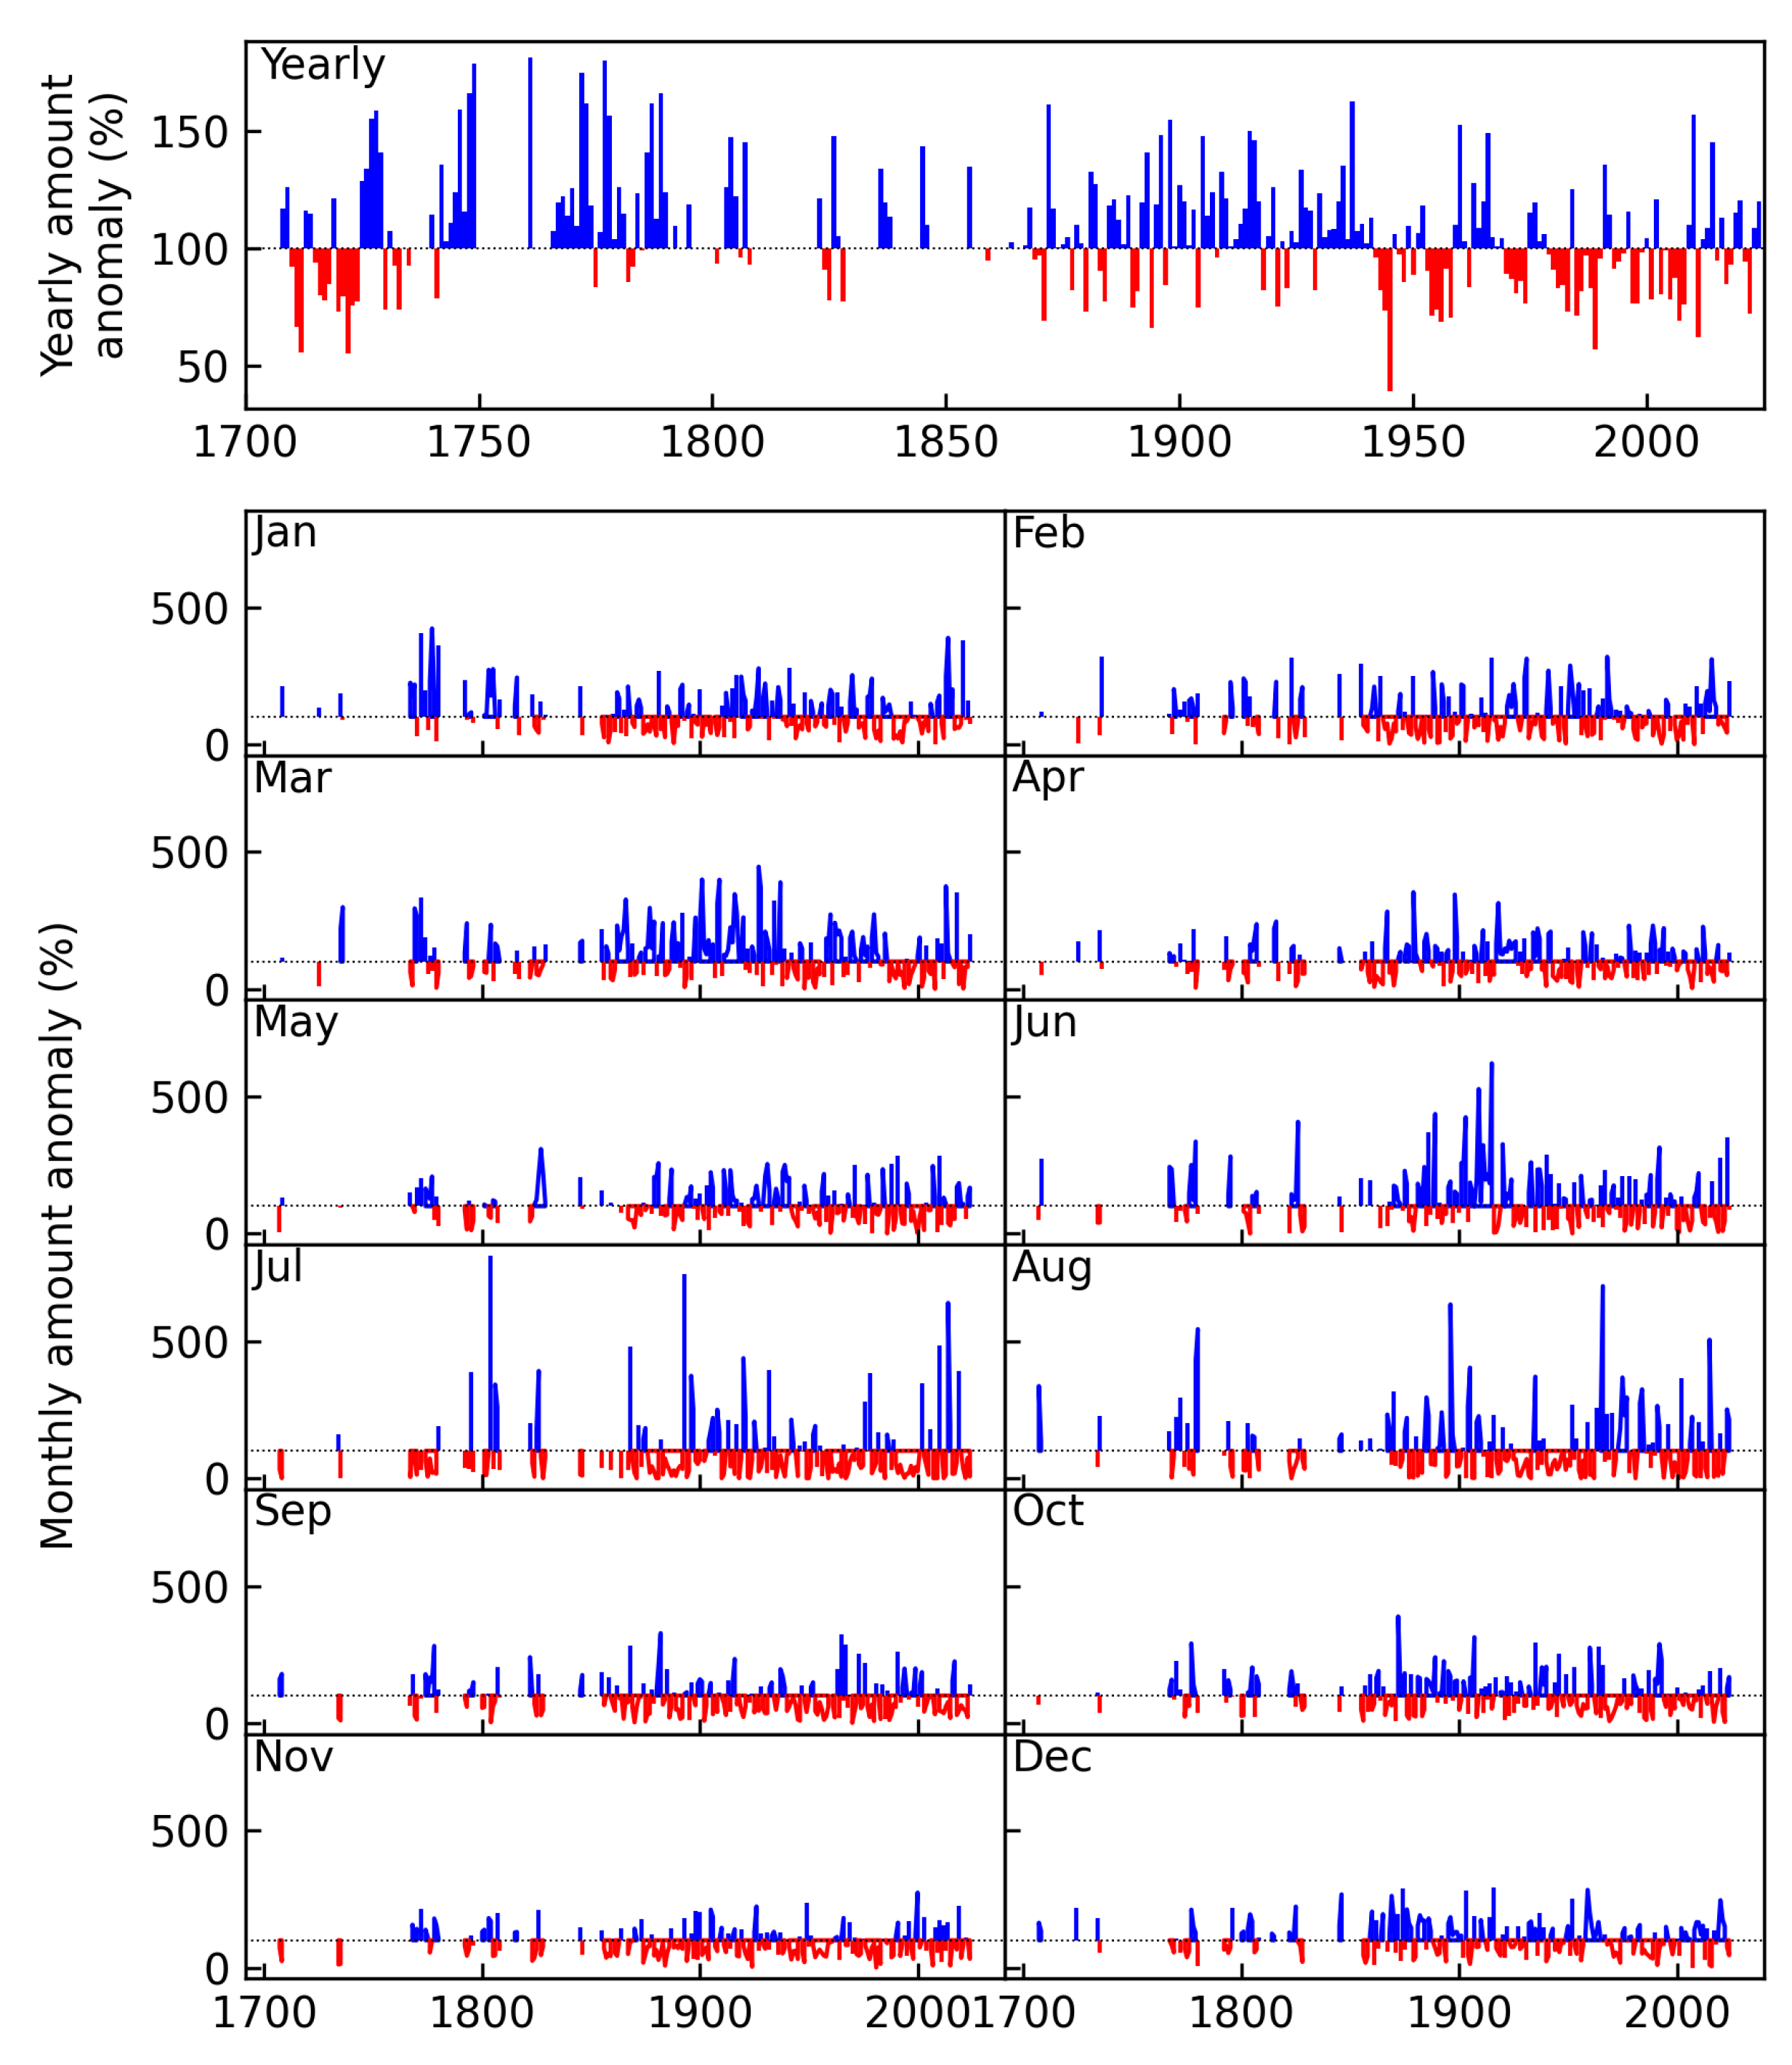
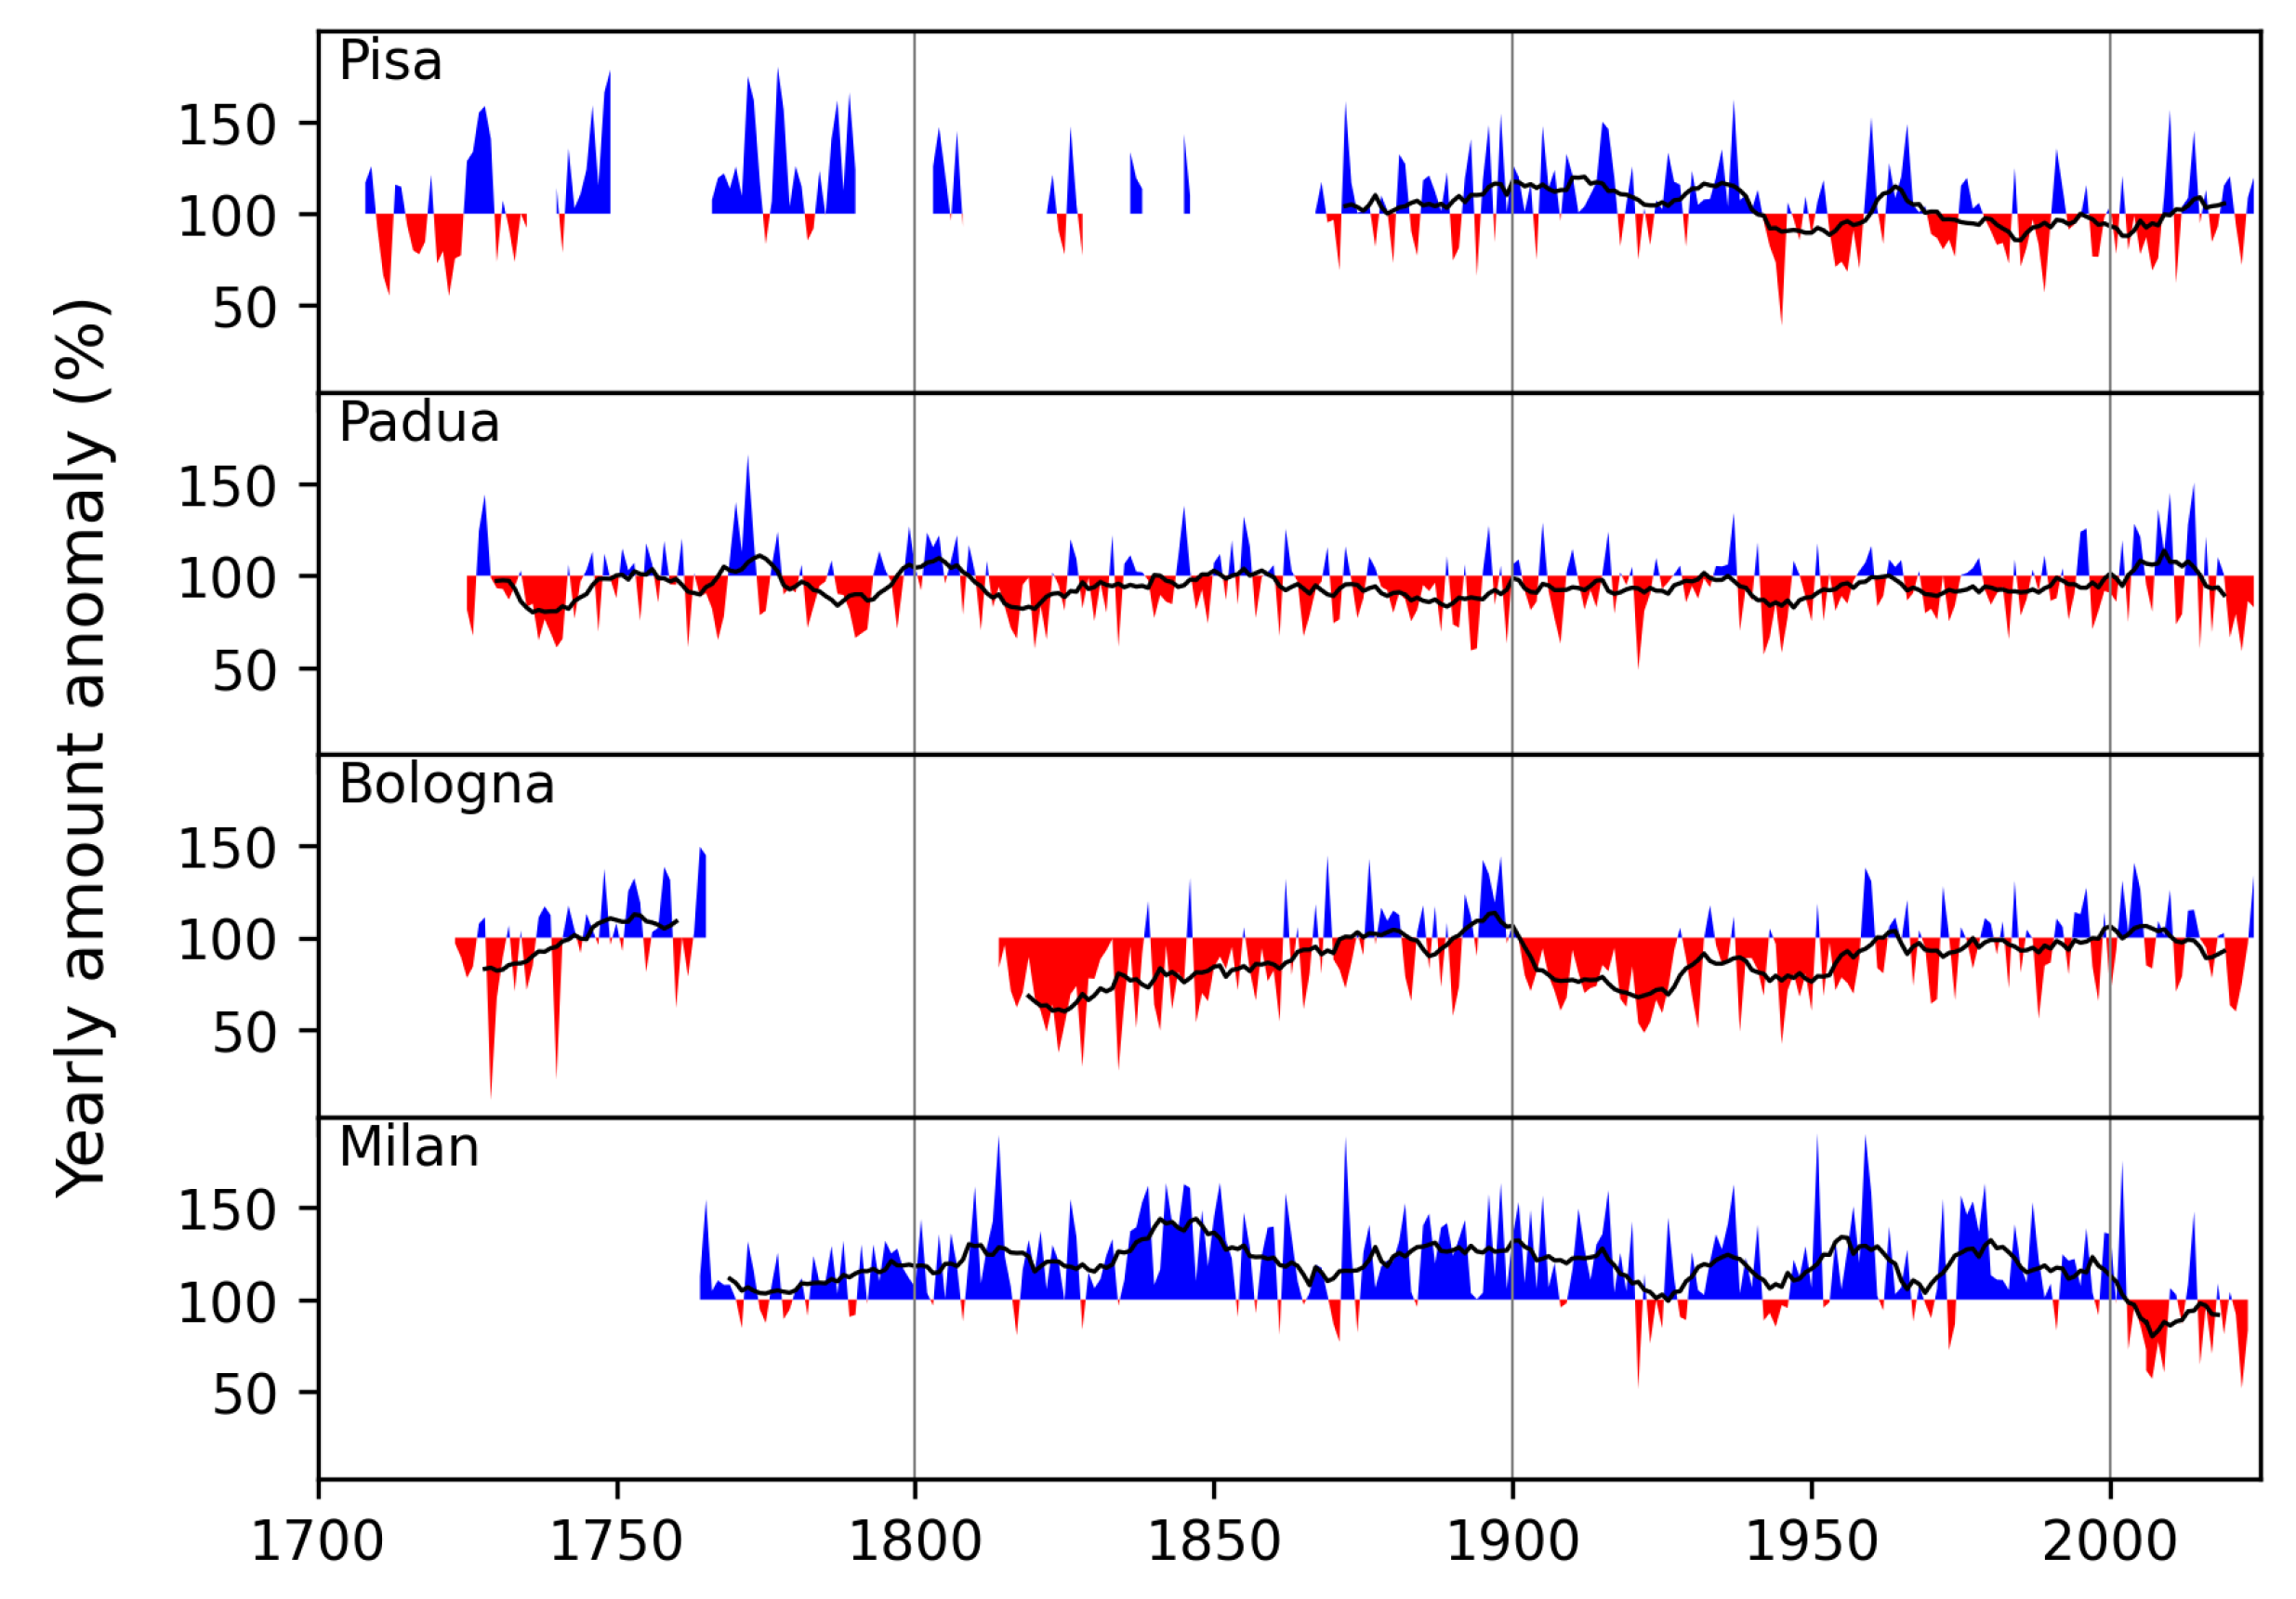
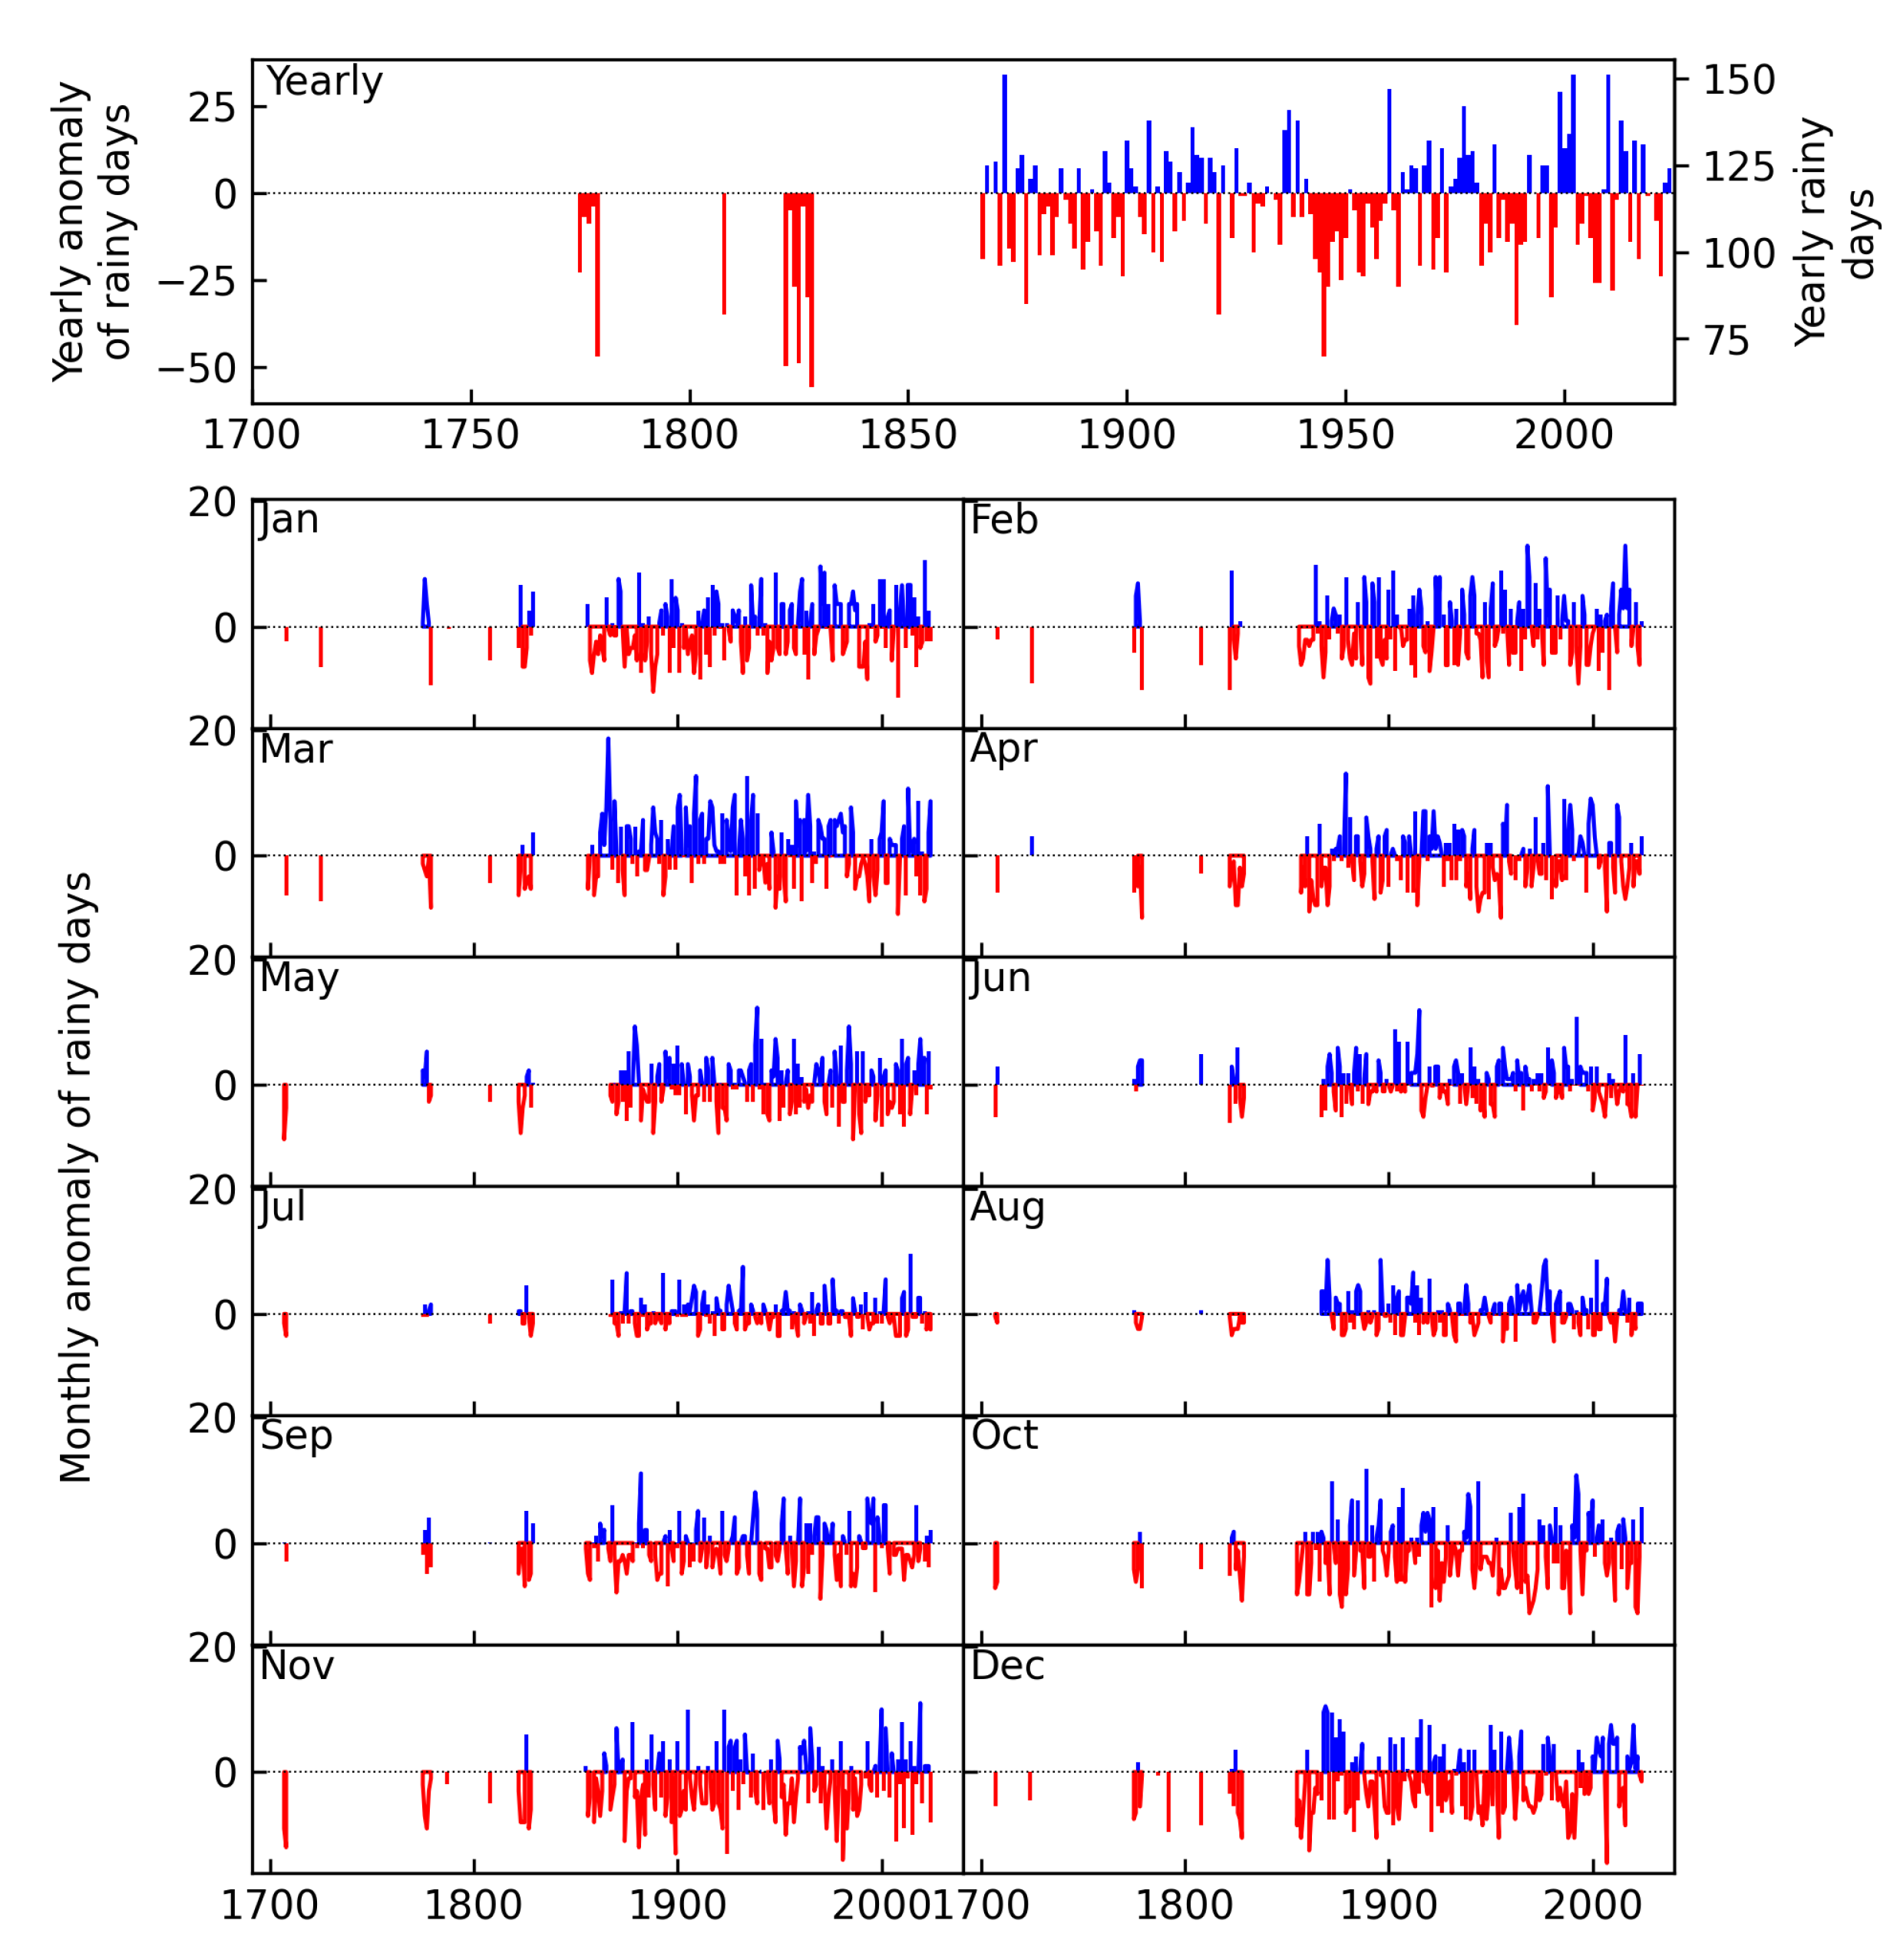
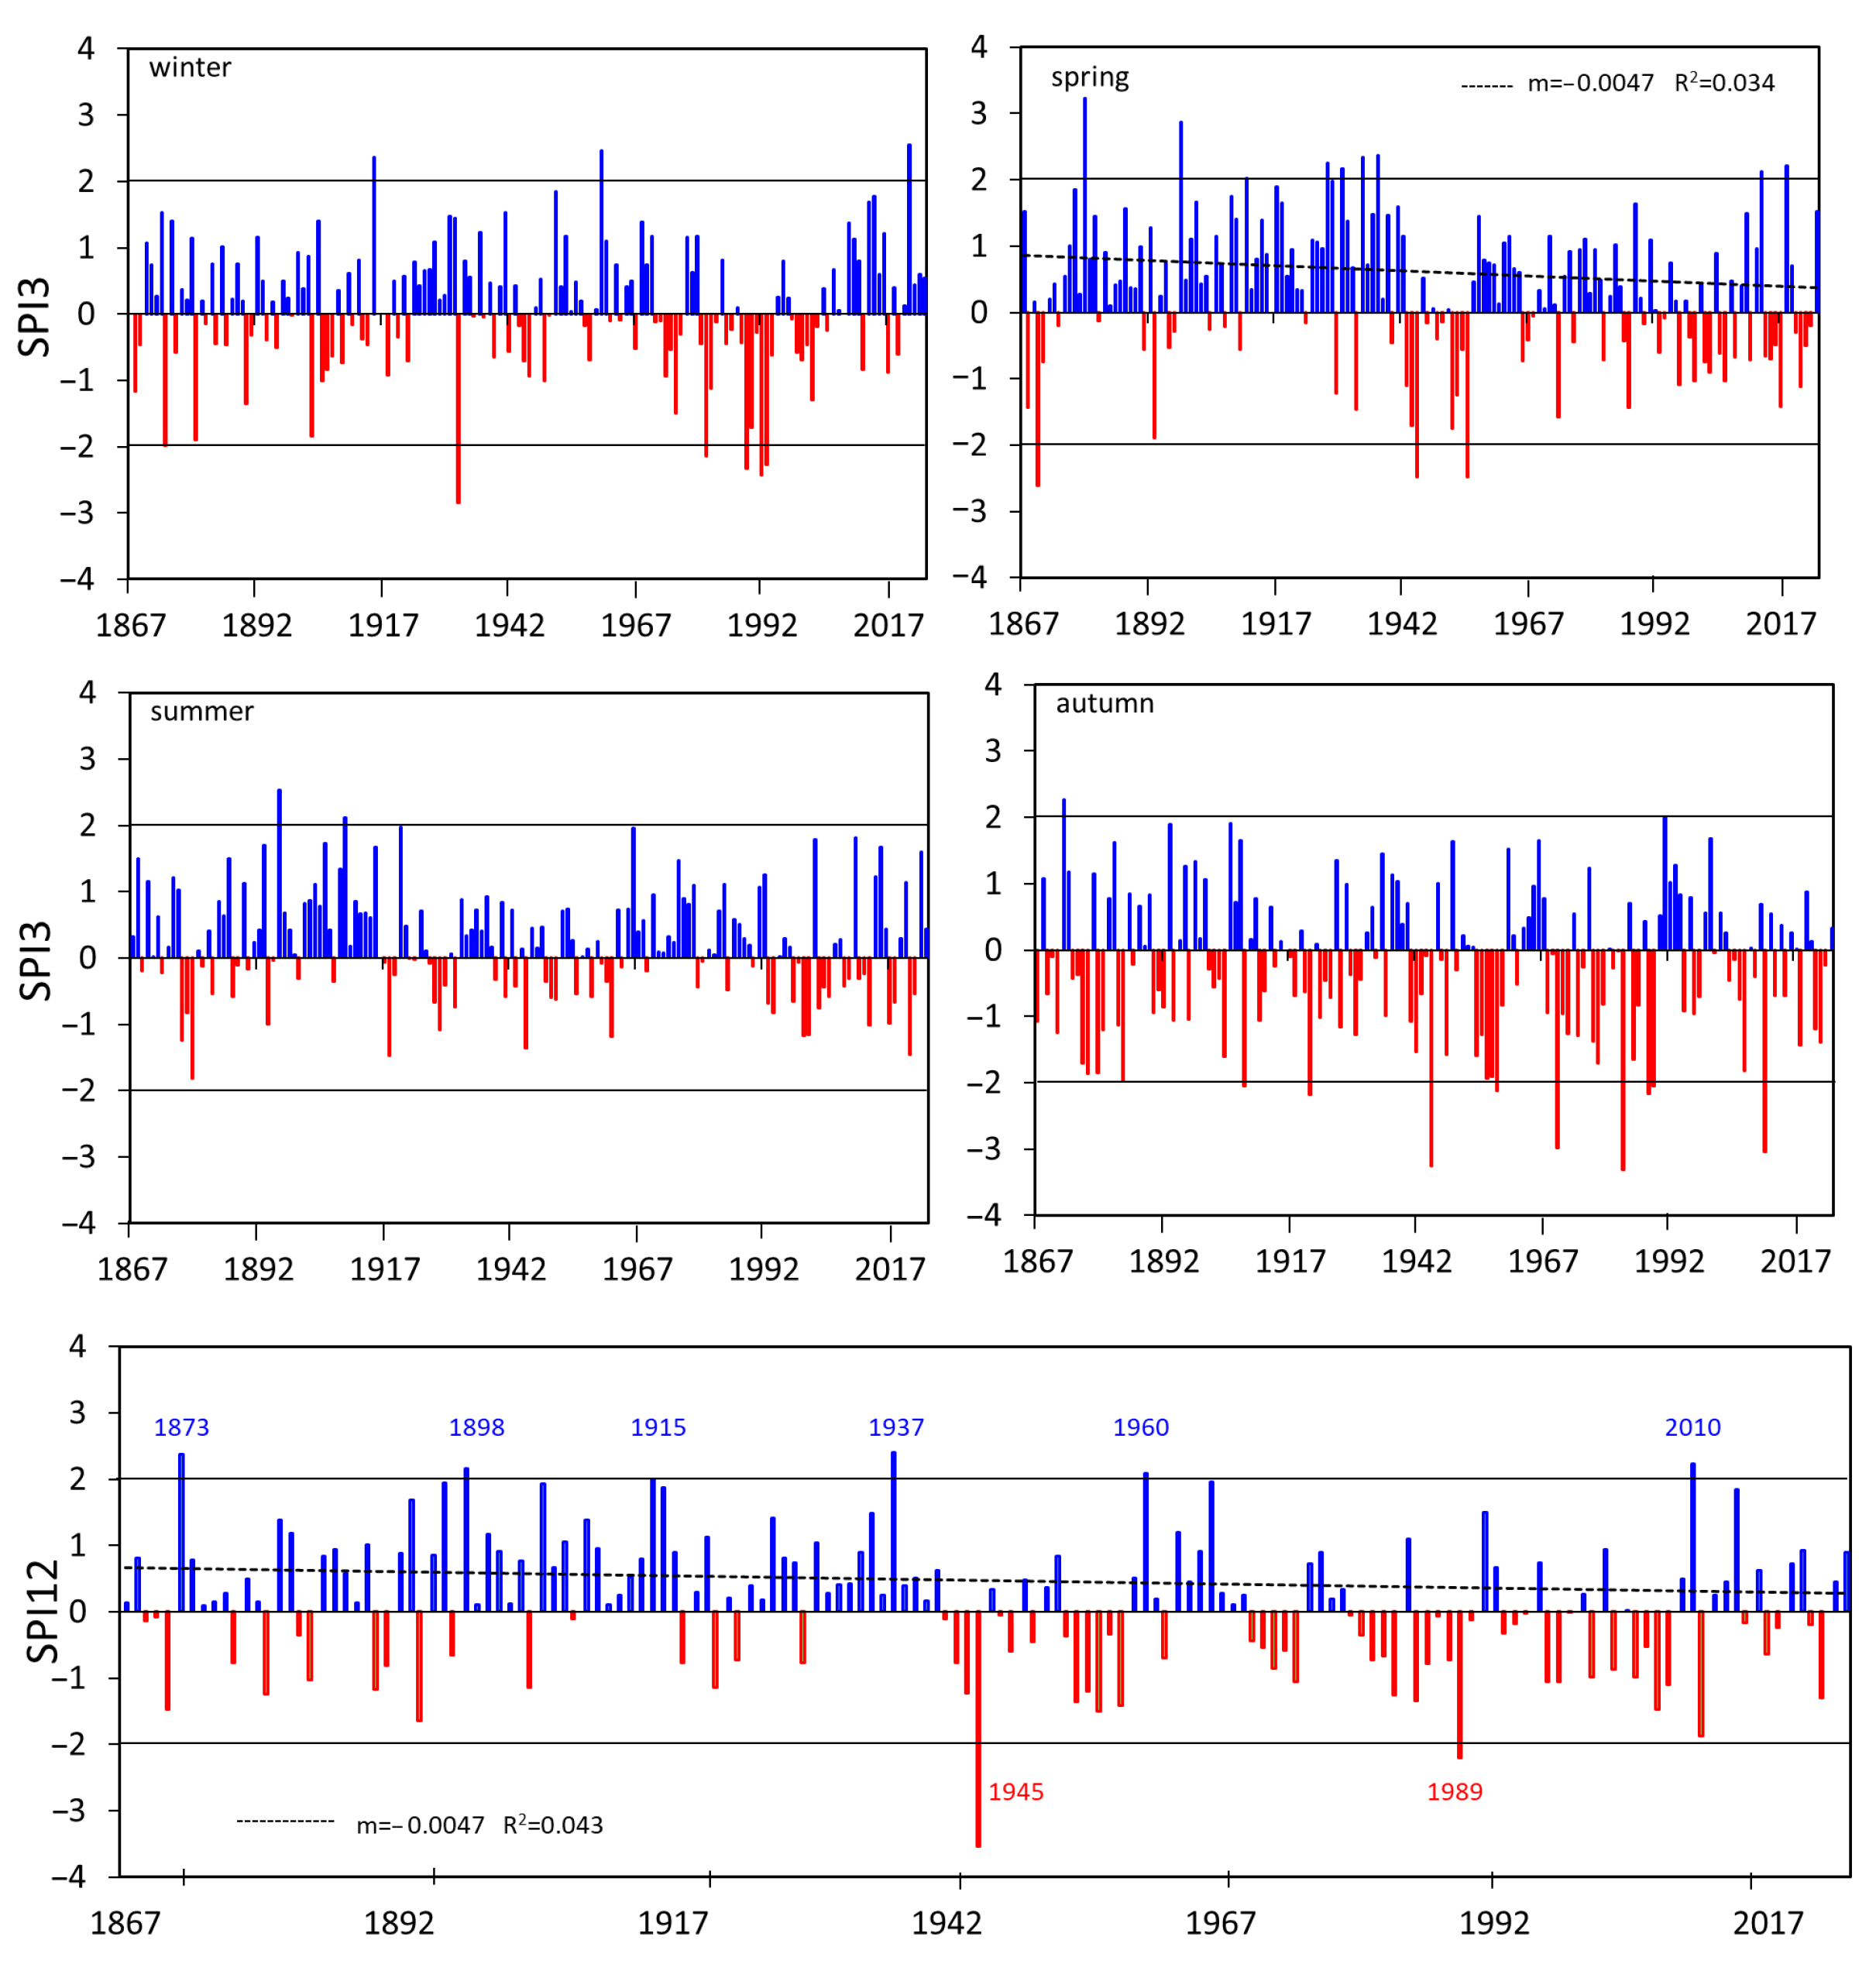

Disclaimer/Publisher’s Note: The statements, opinions and data contained in all publications are solely those of the individual author(s) and contributor(s) and not of MDPI and/or the editor(s). MDPI and/or the editor(s) disclaim responsibility for any injury to people or property resulting from any ideas, methods, instructions or products referred to in the content. |
© 2025 by the authors. Licensee MDPI, Basel, Switzerland. This article is an open access article distributed under the terms and conditions of the Creative Commons Attribution (CC BY) license (https://creativecommons.org/licenses/by/4.0/).