
Trends in Extreme Precipitation and Associated Natural Disasters in China, 1961–2021


Abstract
1. Introduction
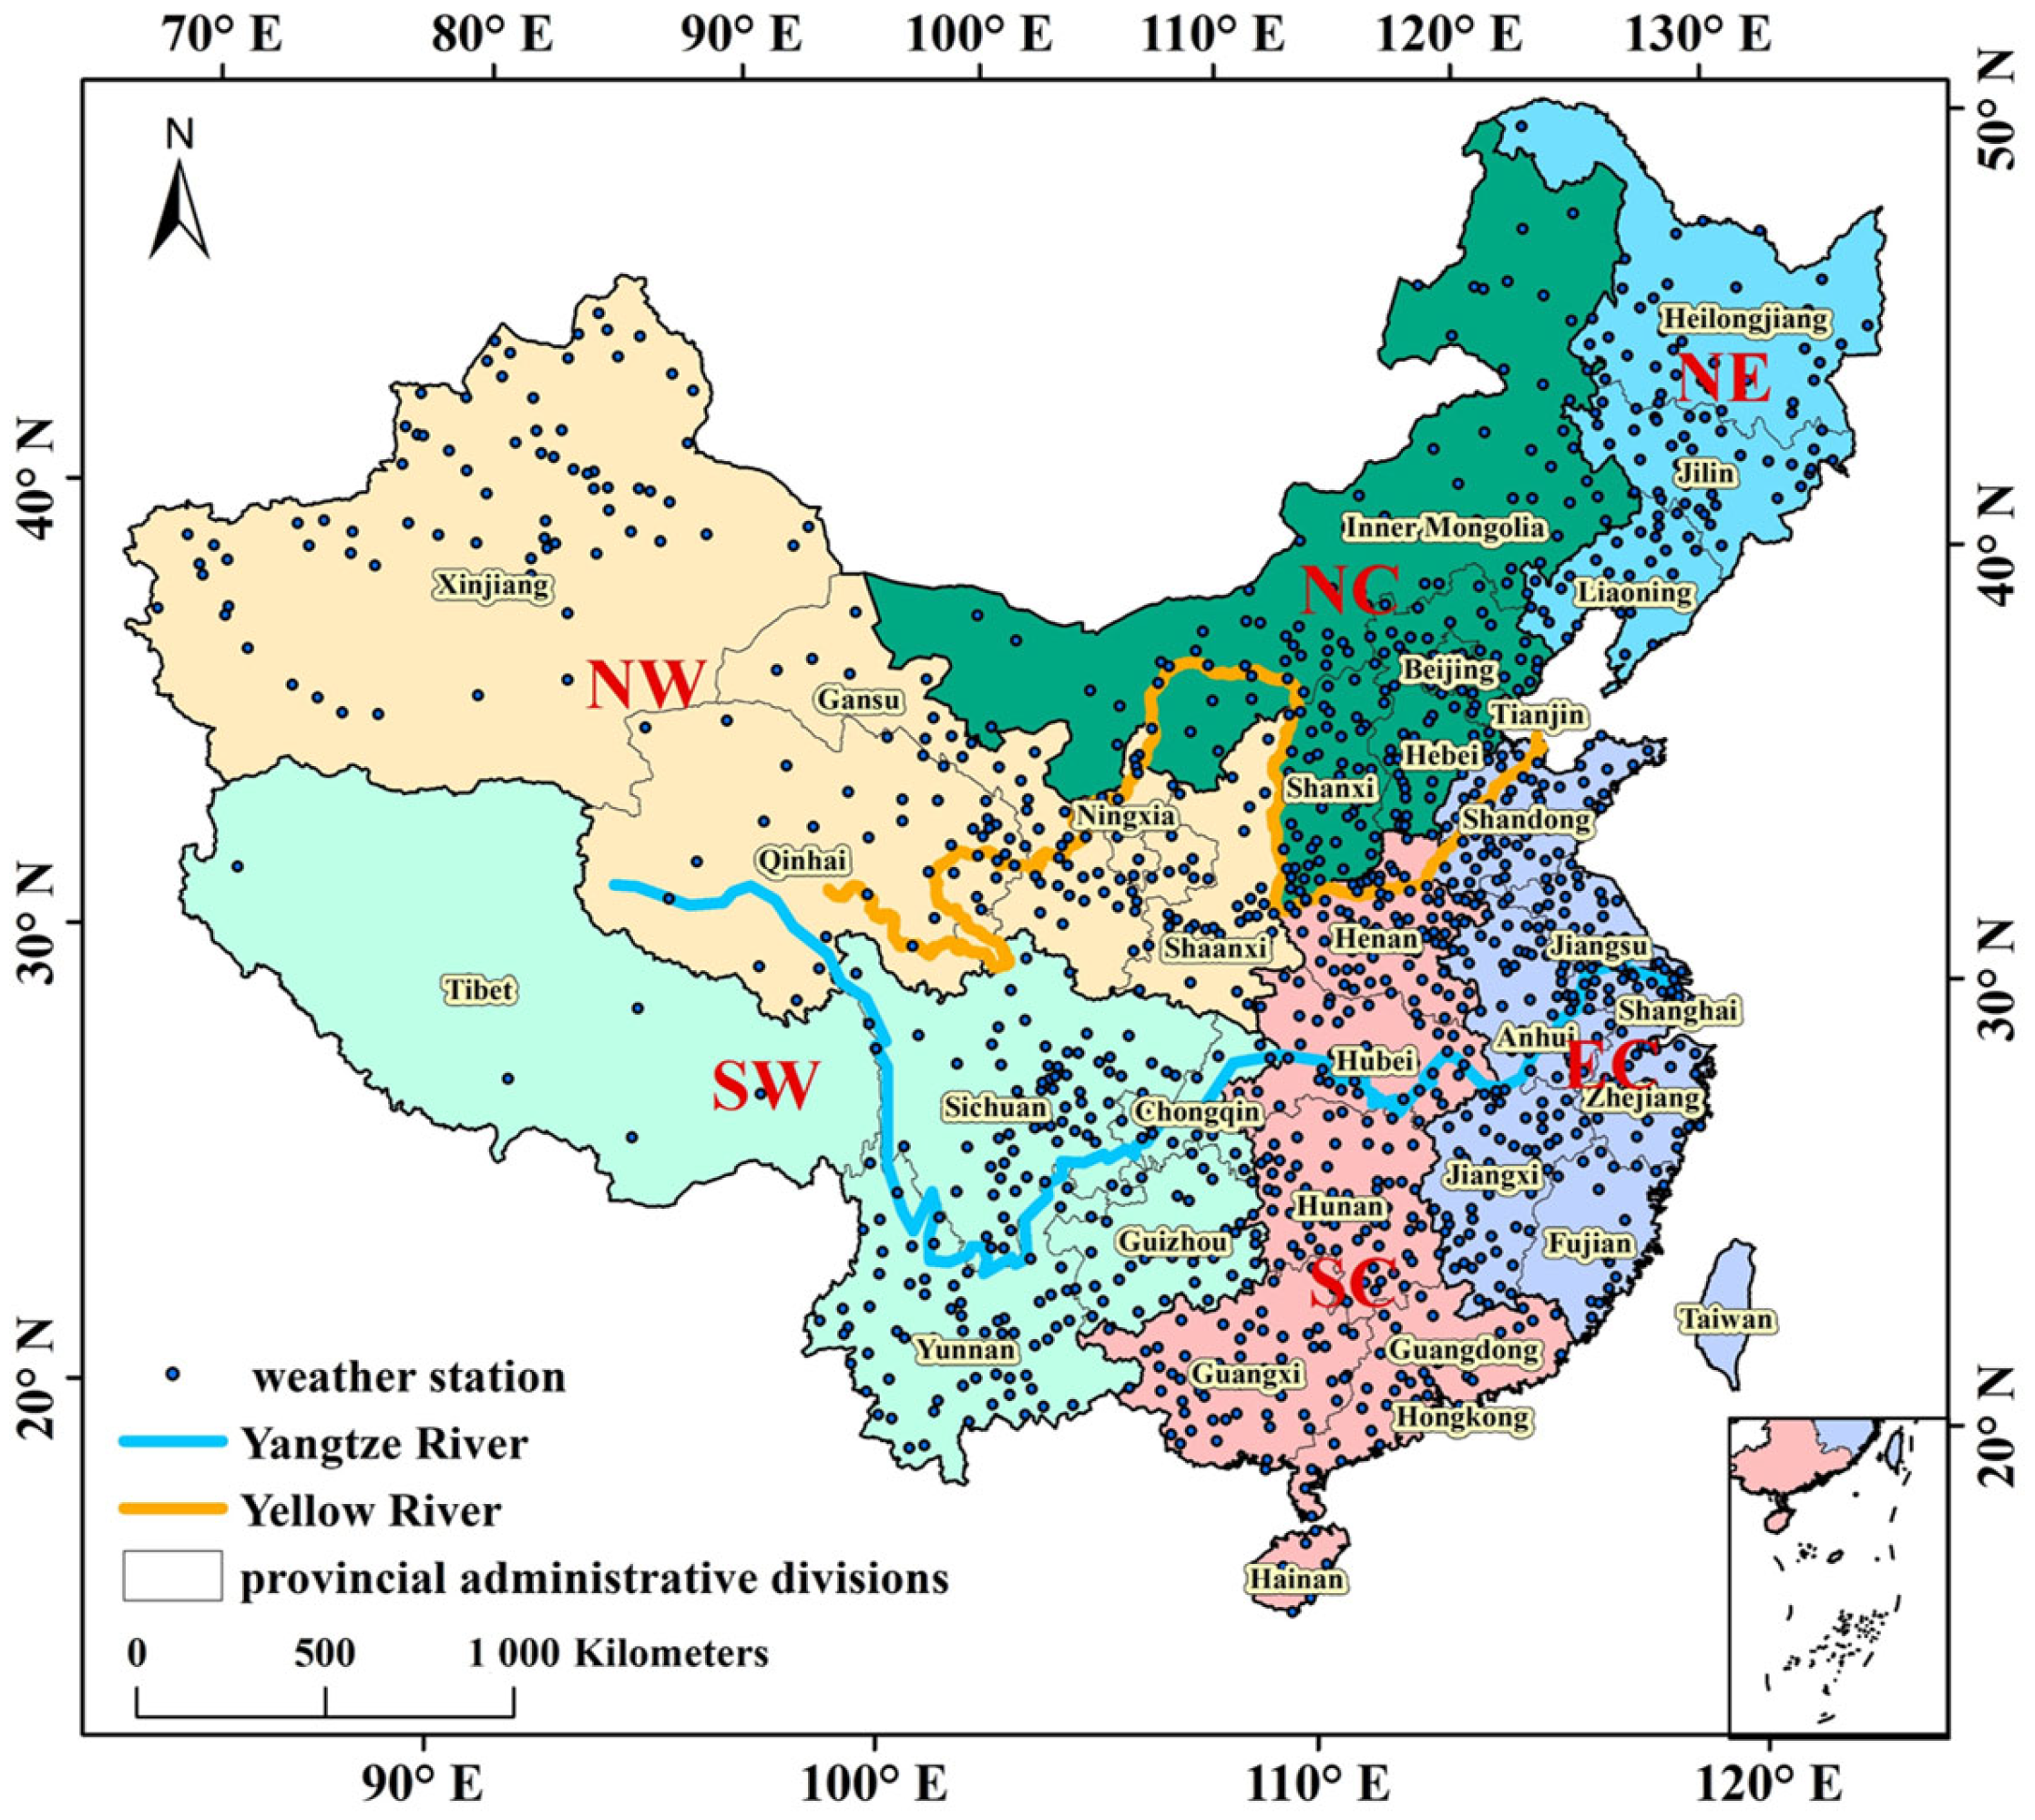
2. Data and Method
2.1. Data
2.2. Method
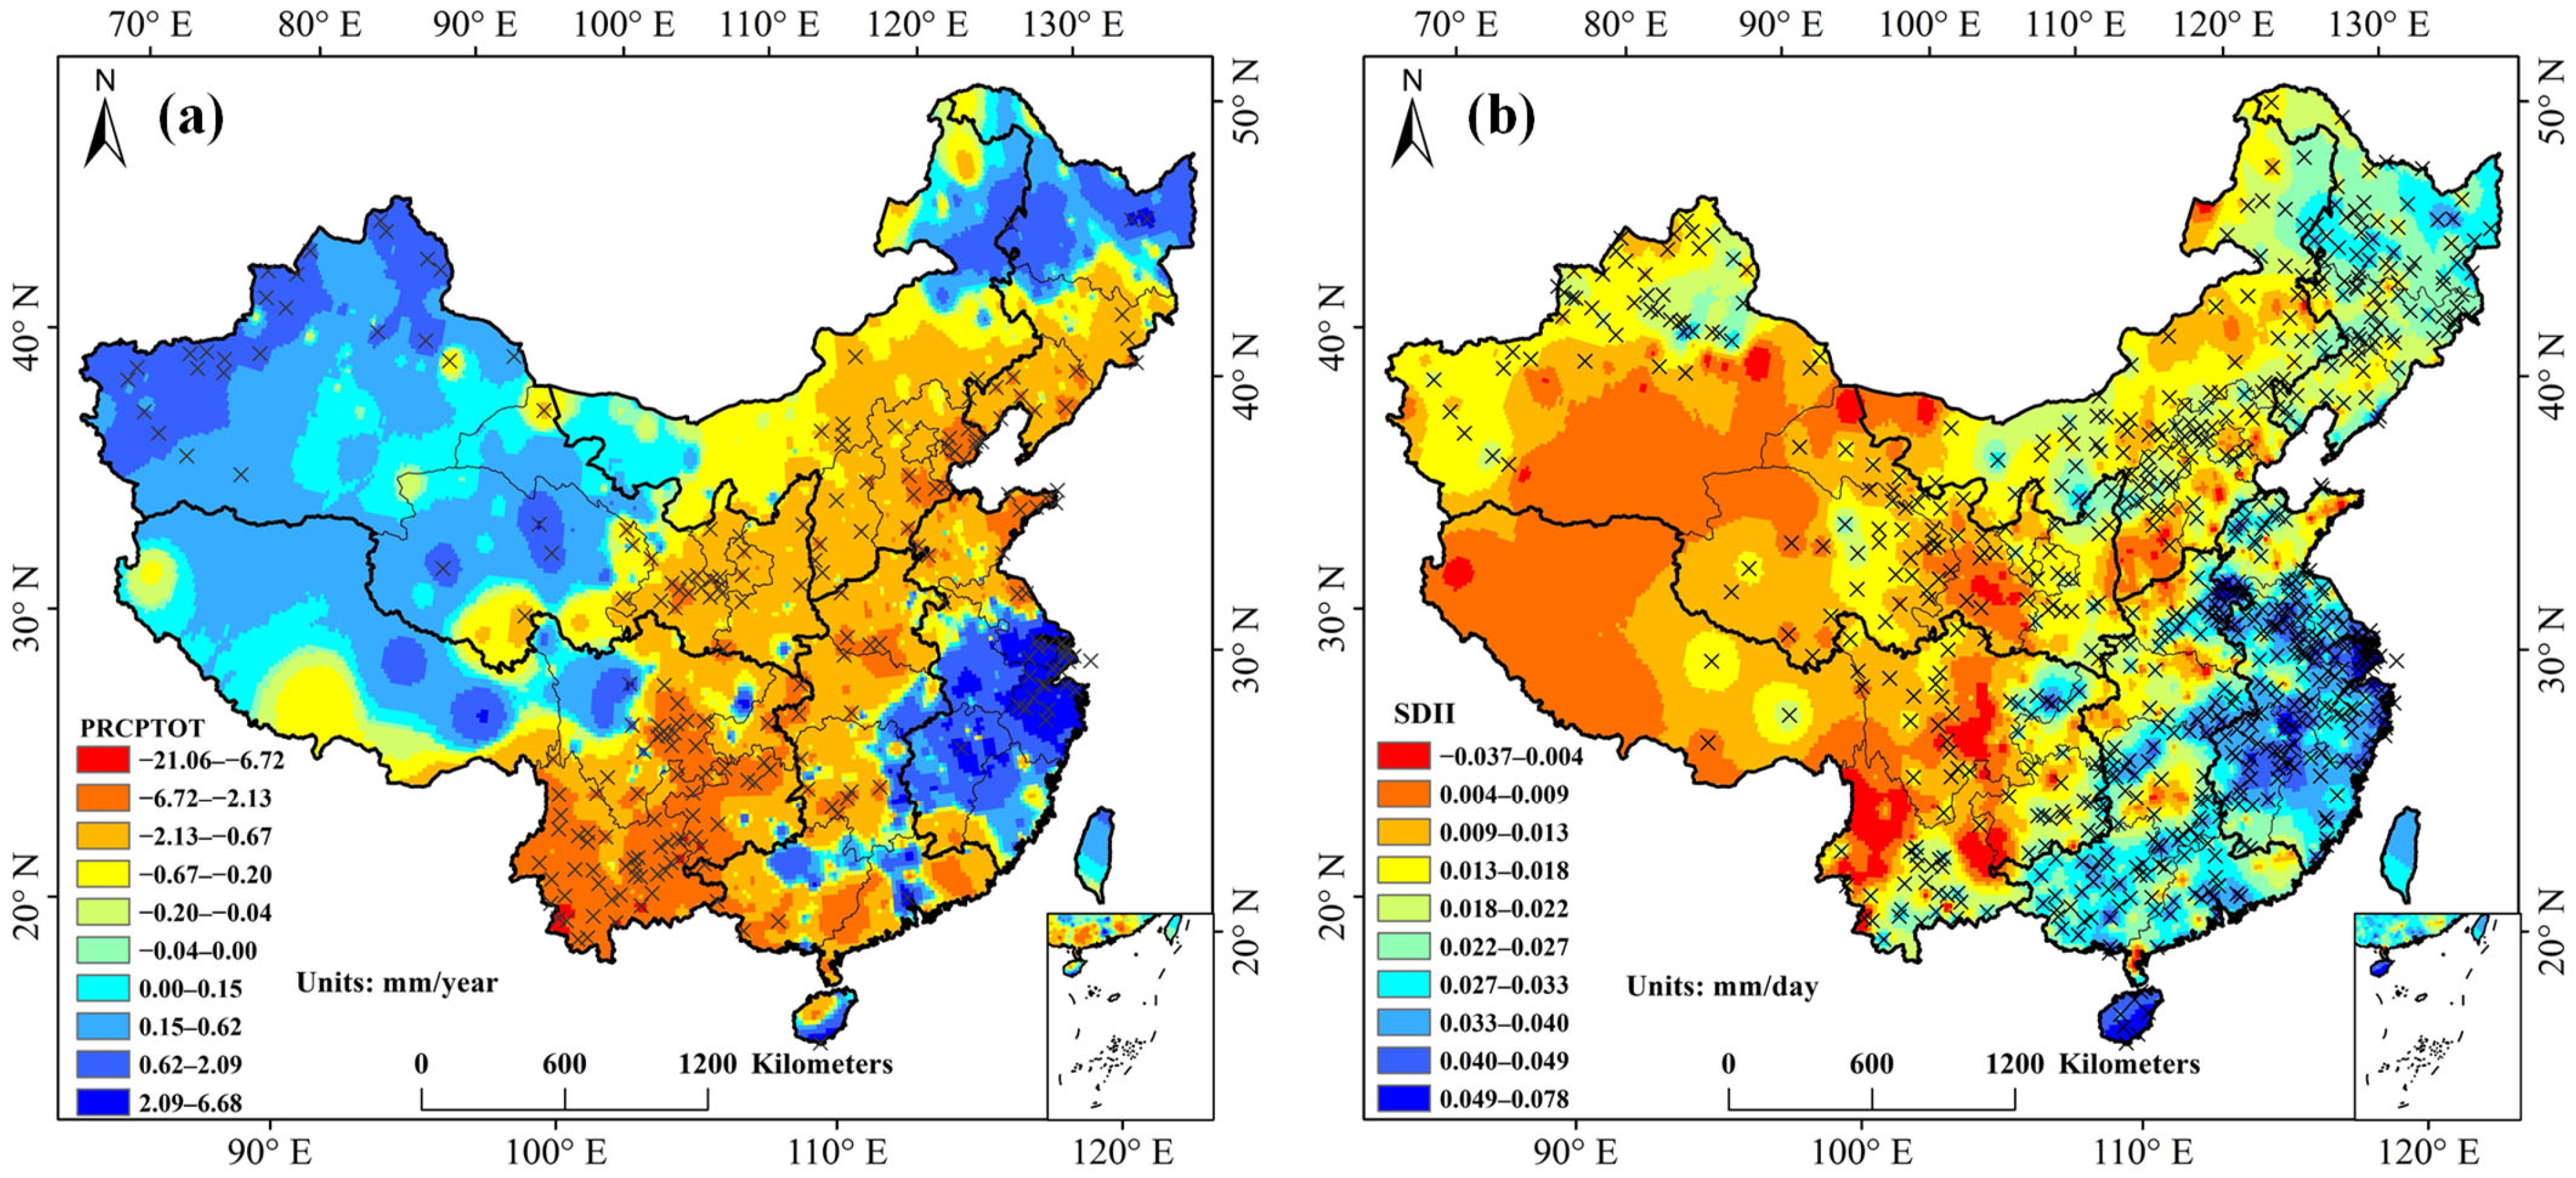
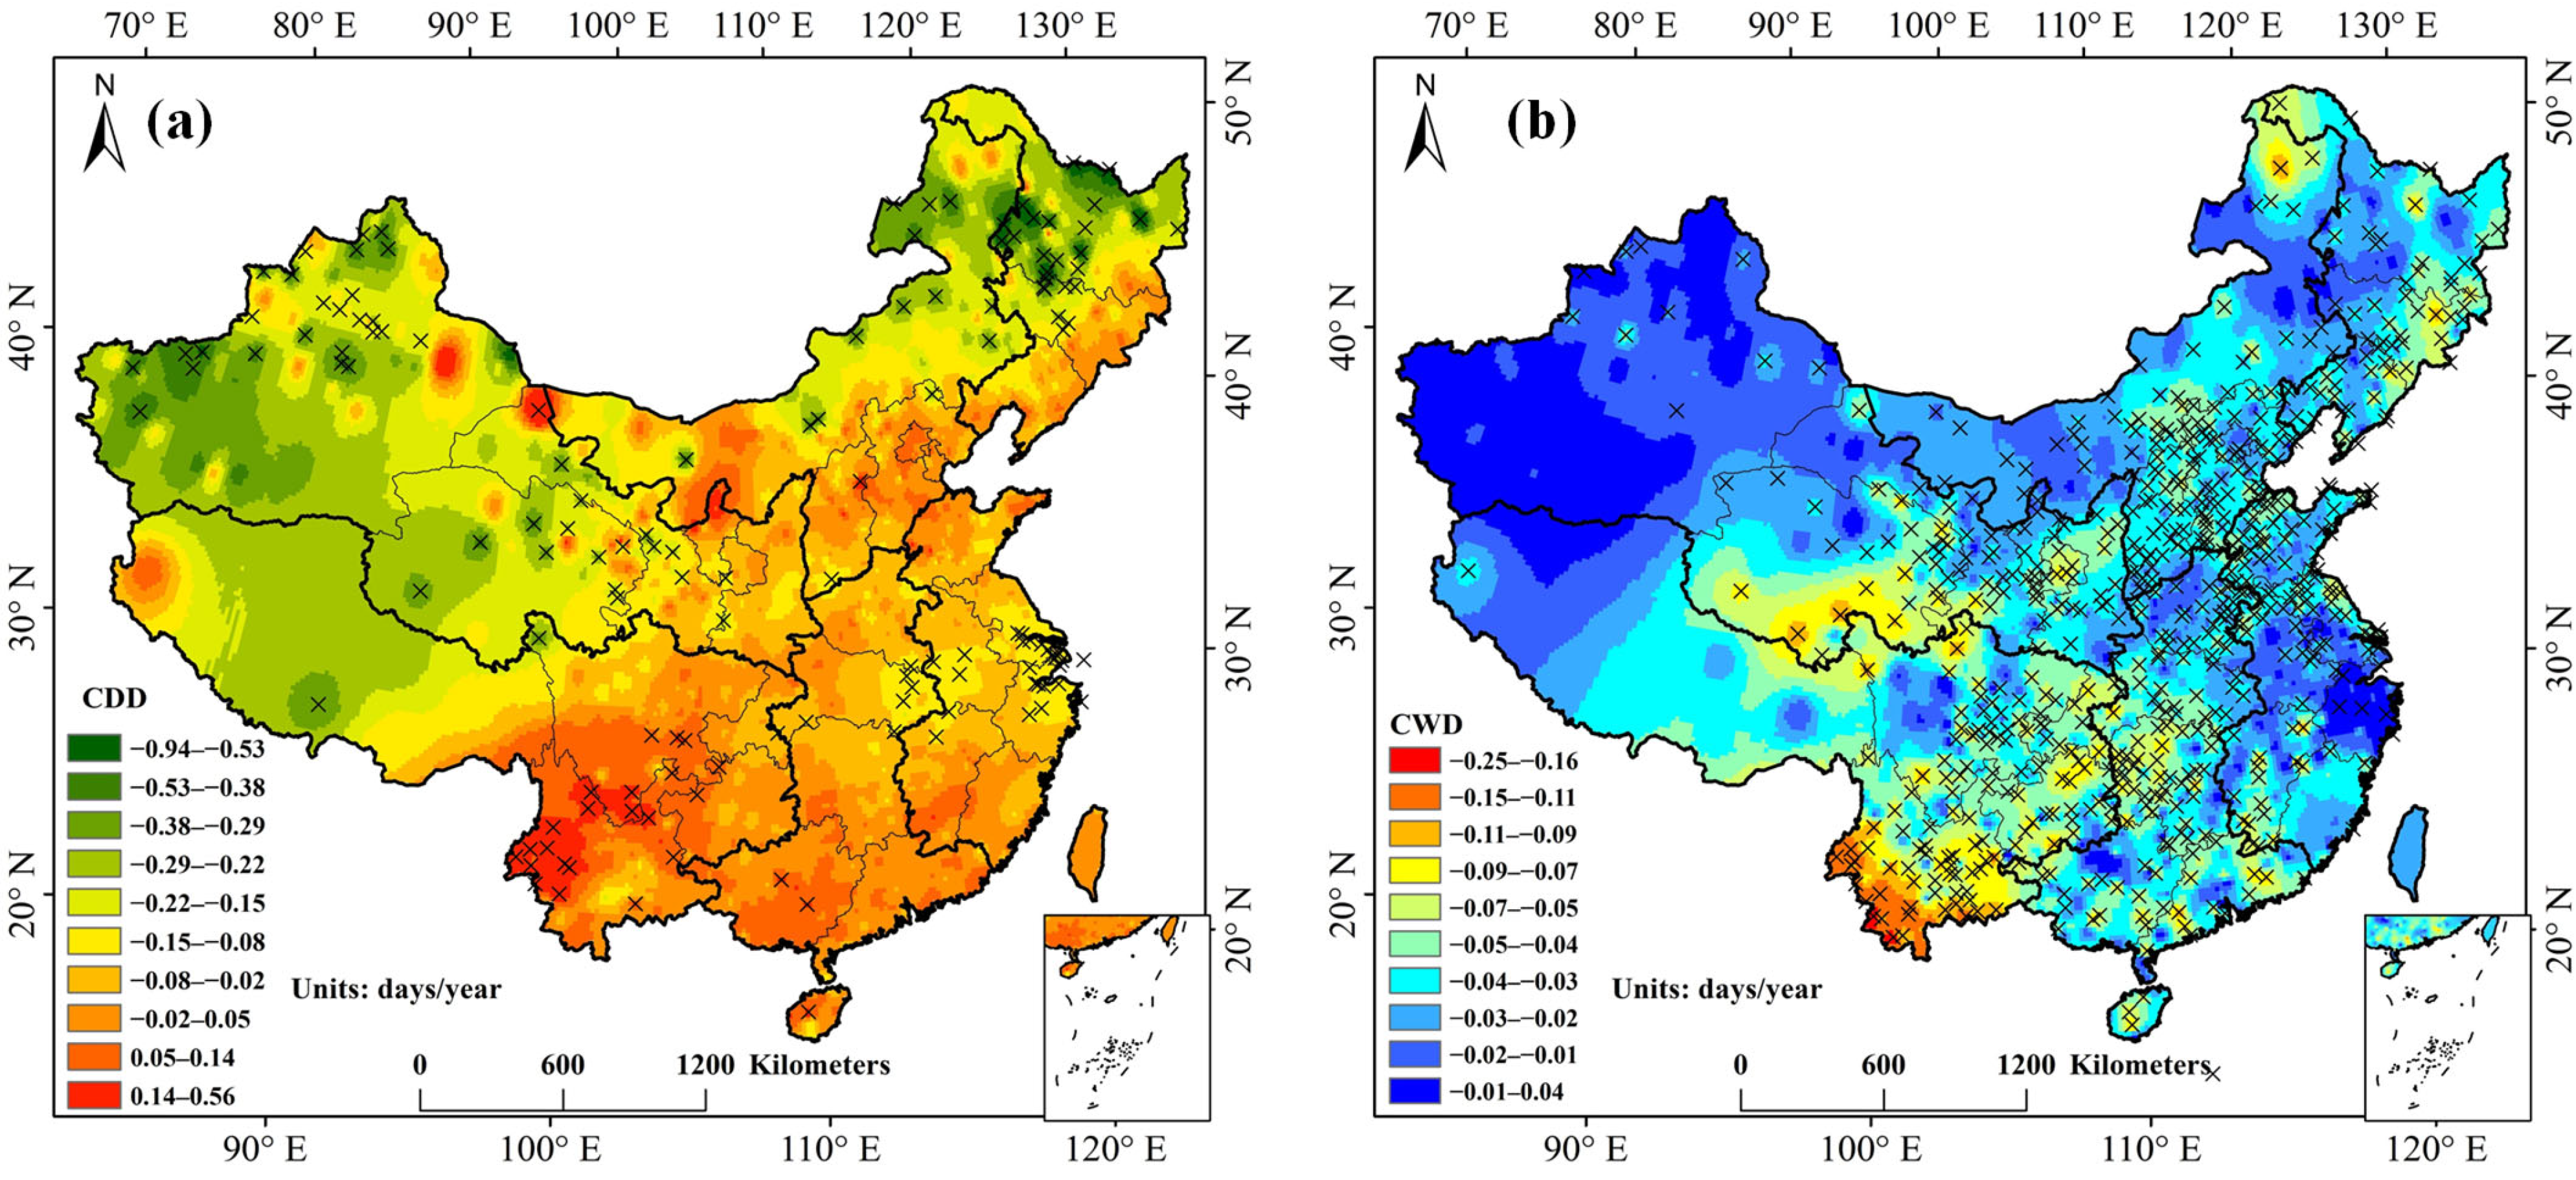
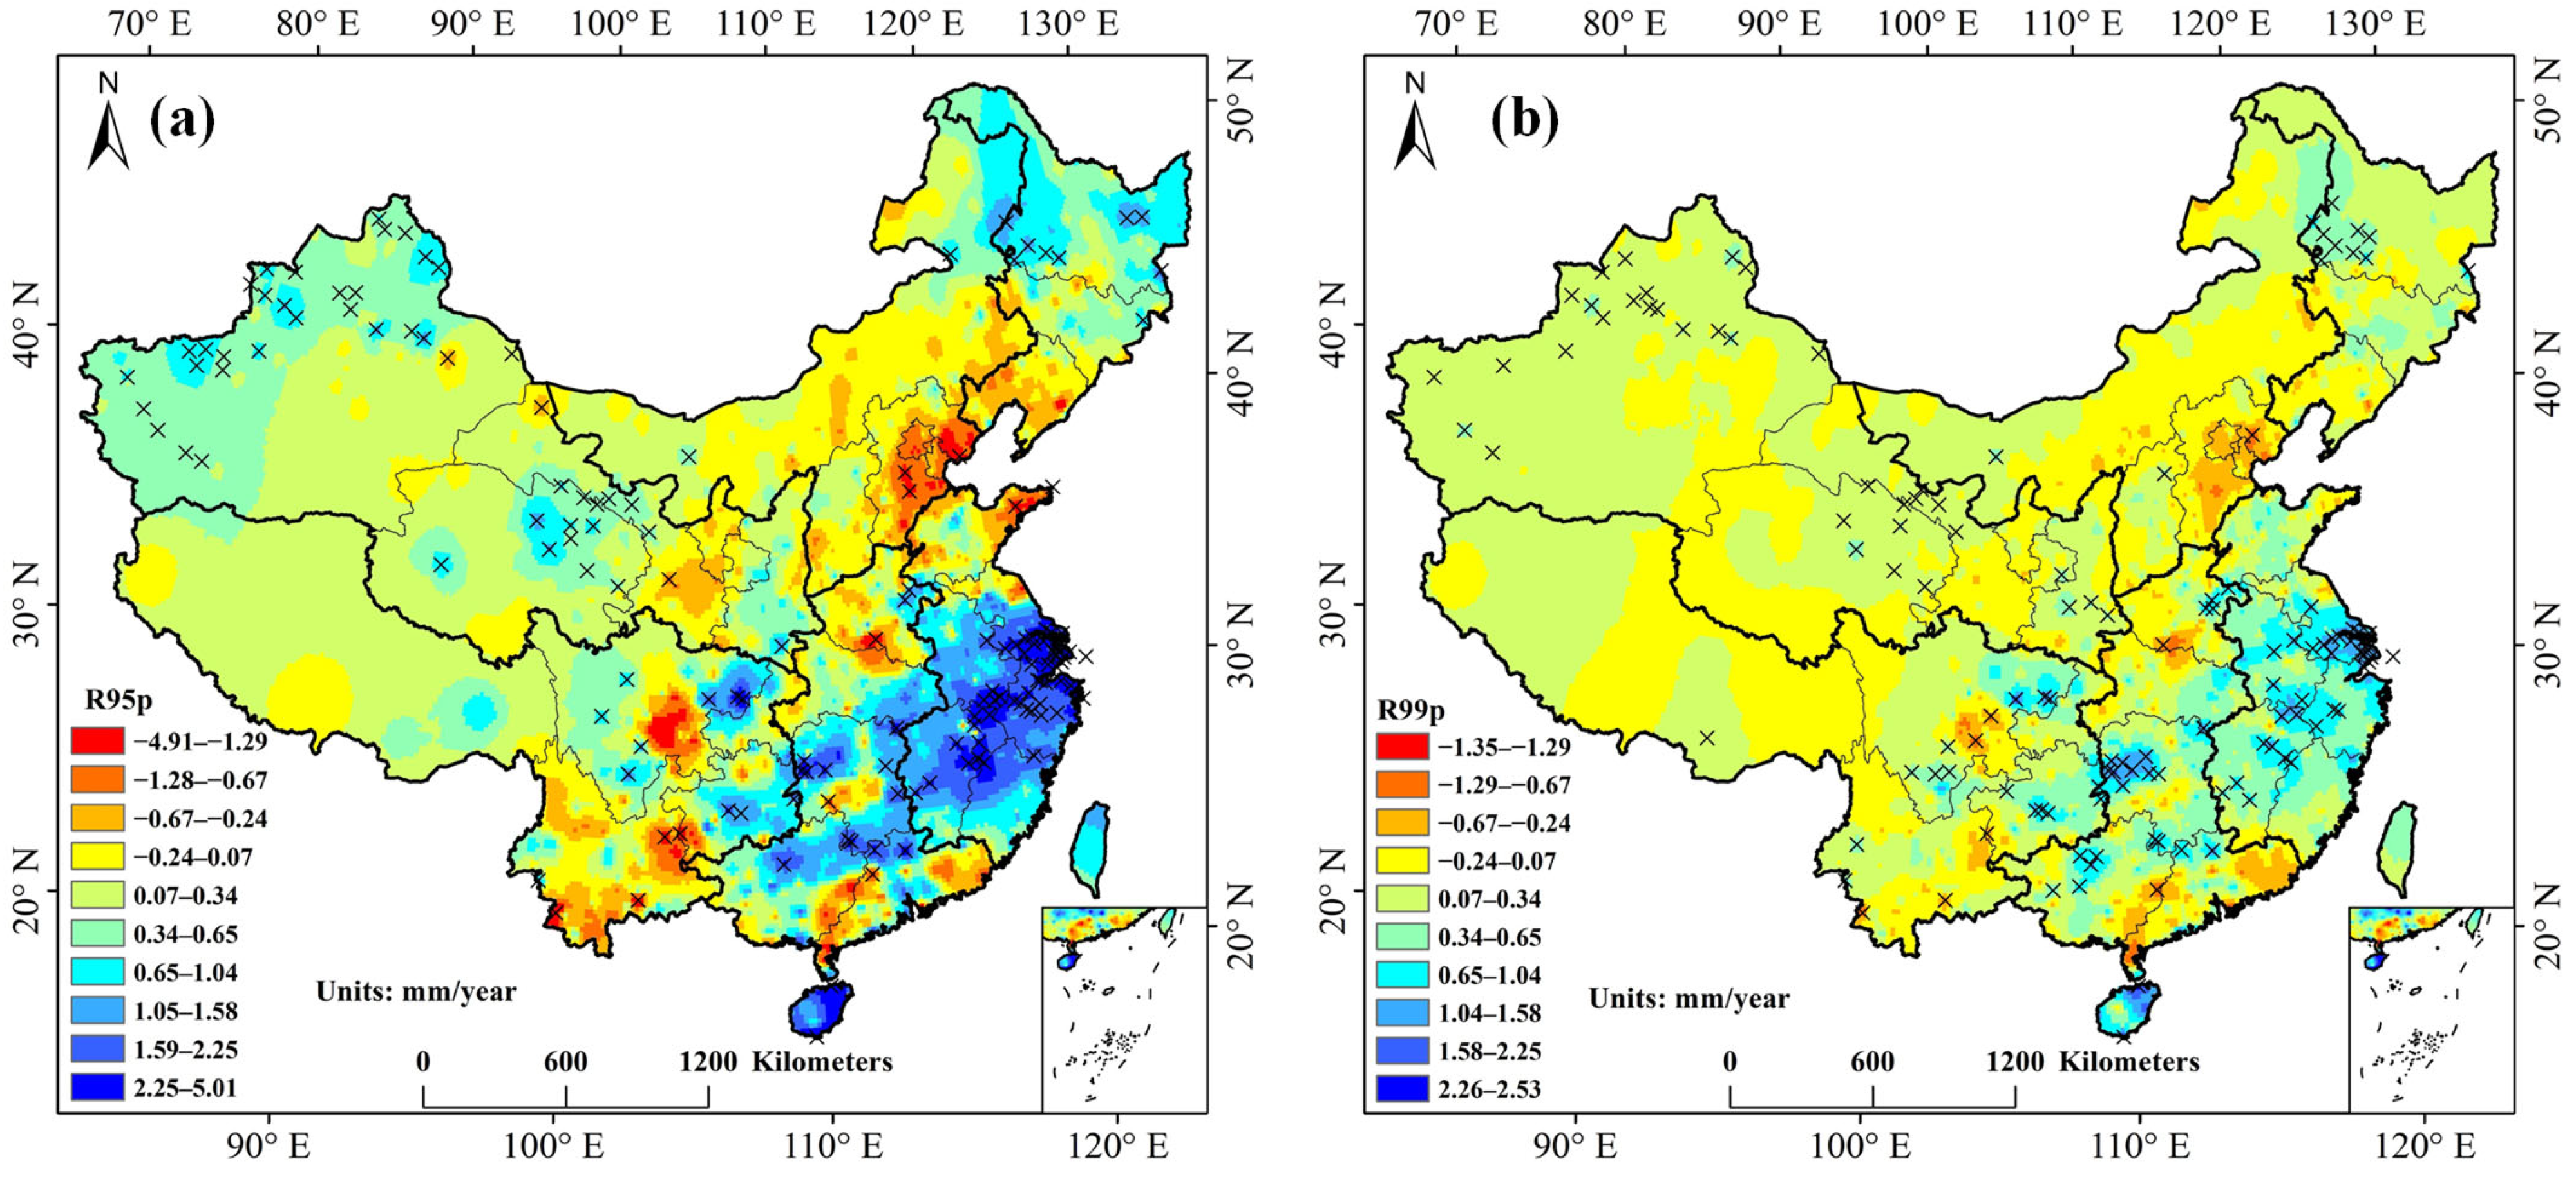
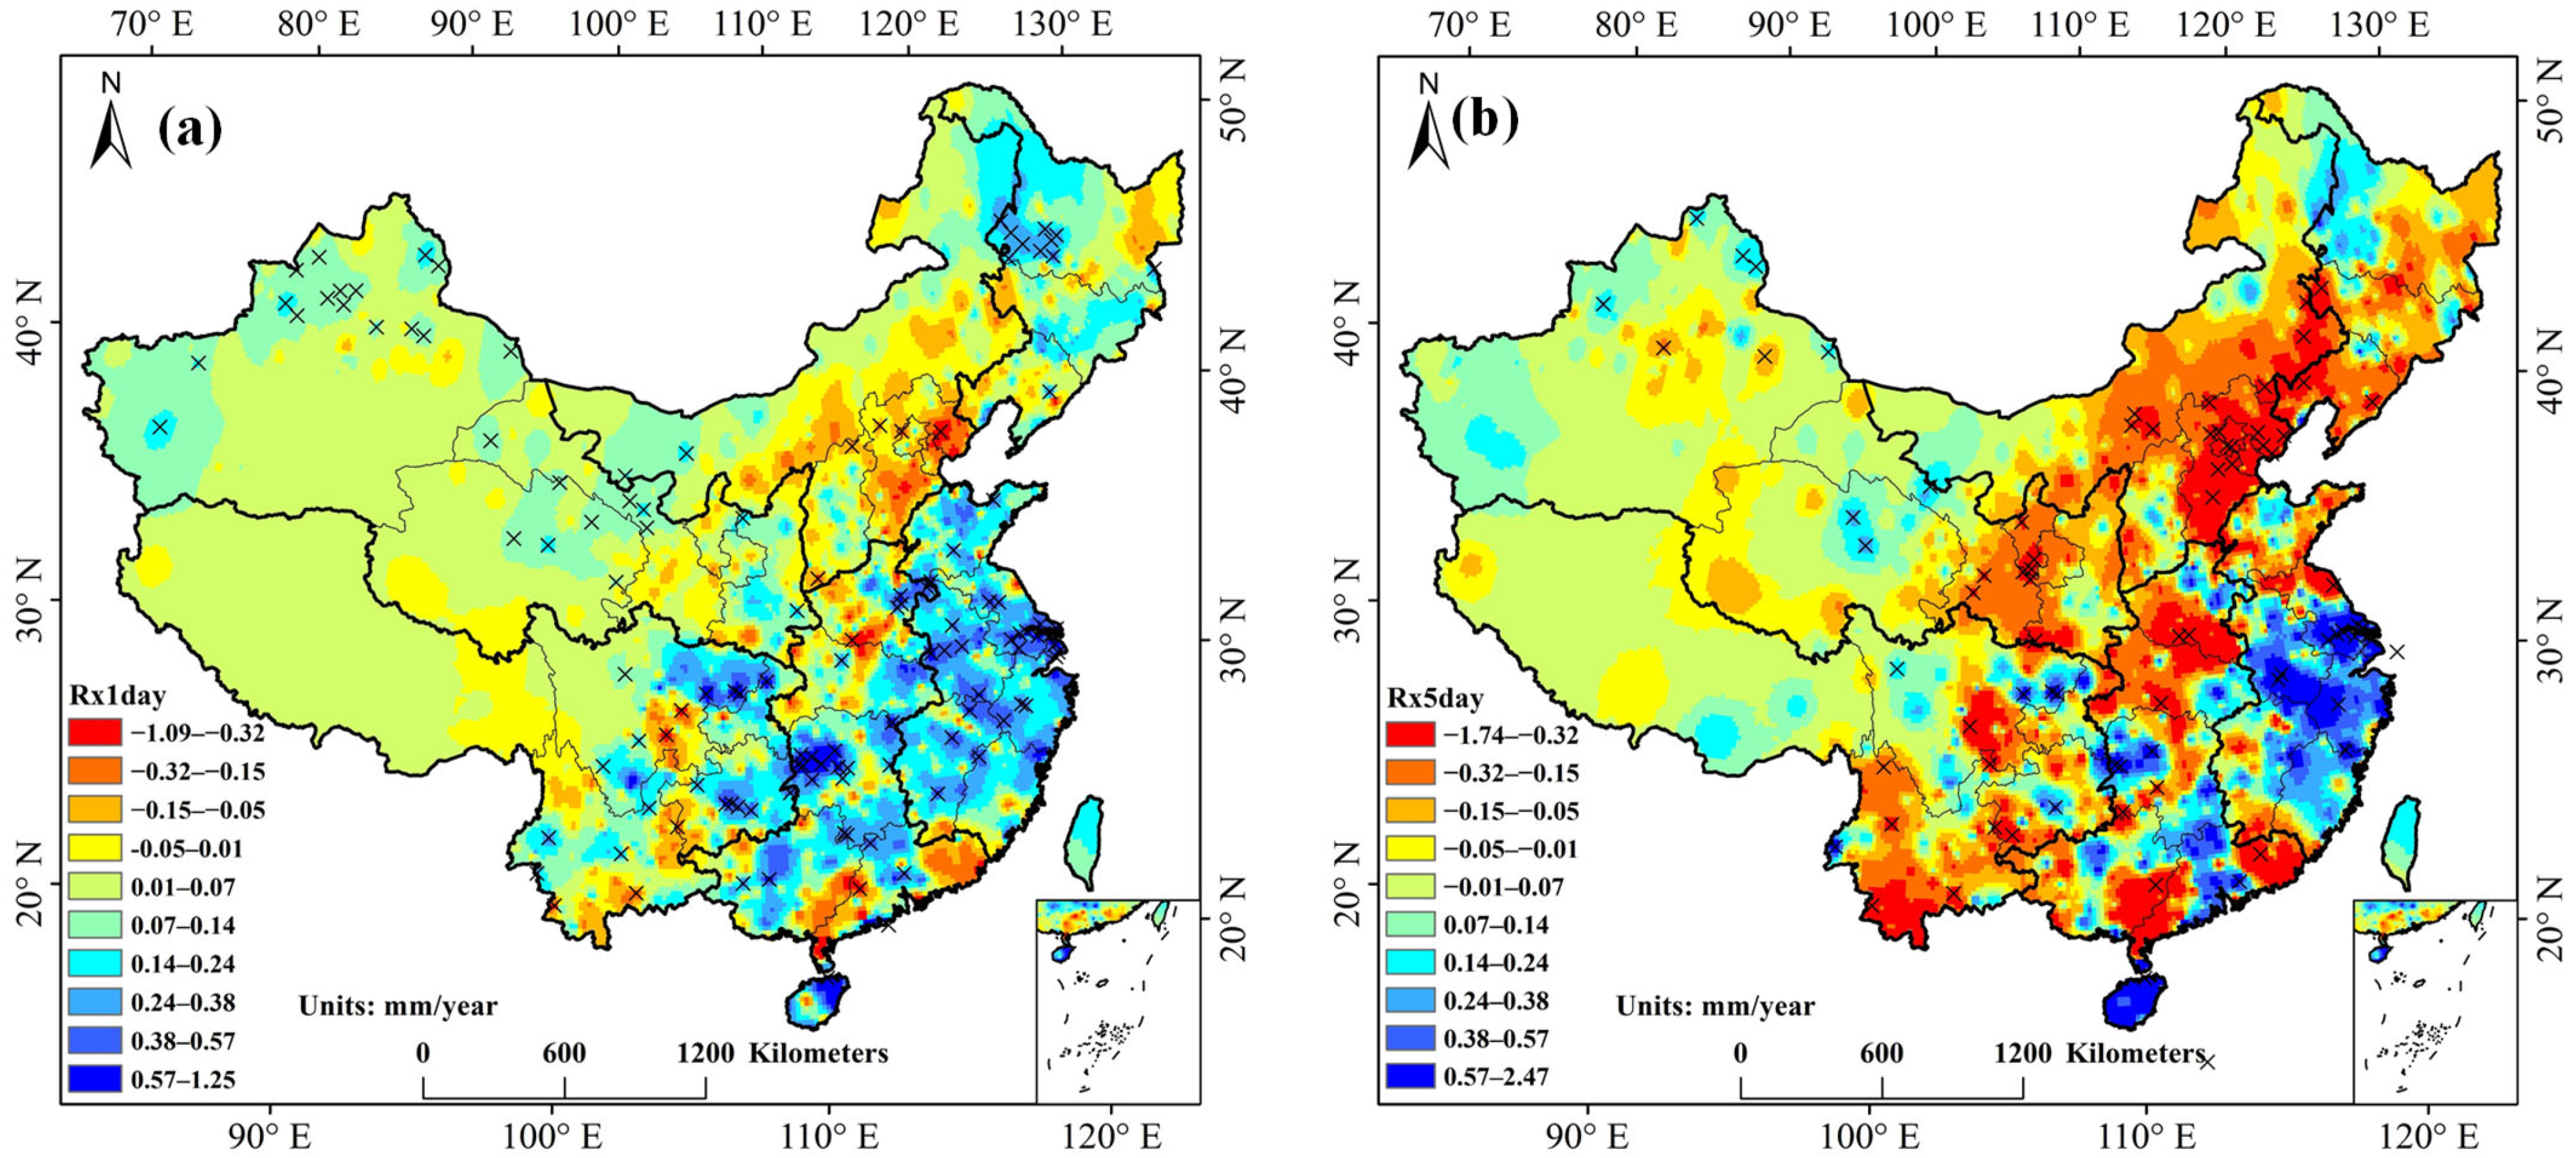
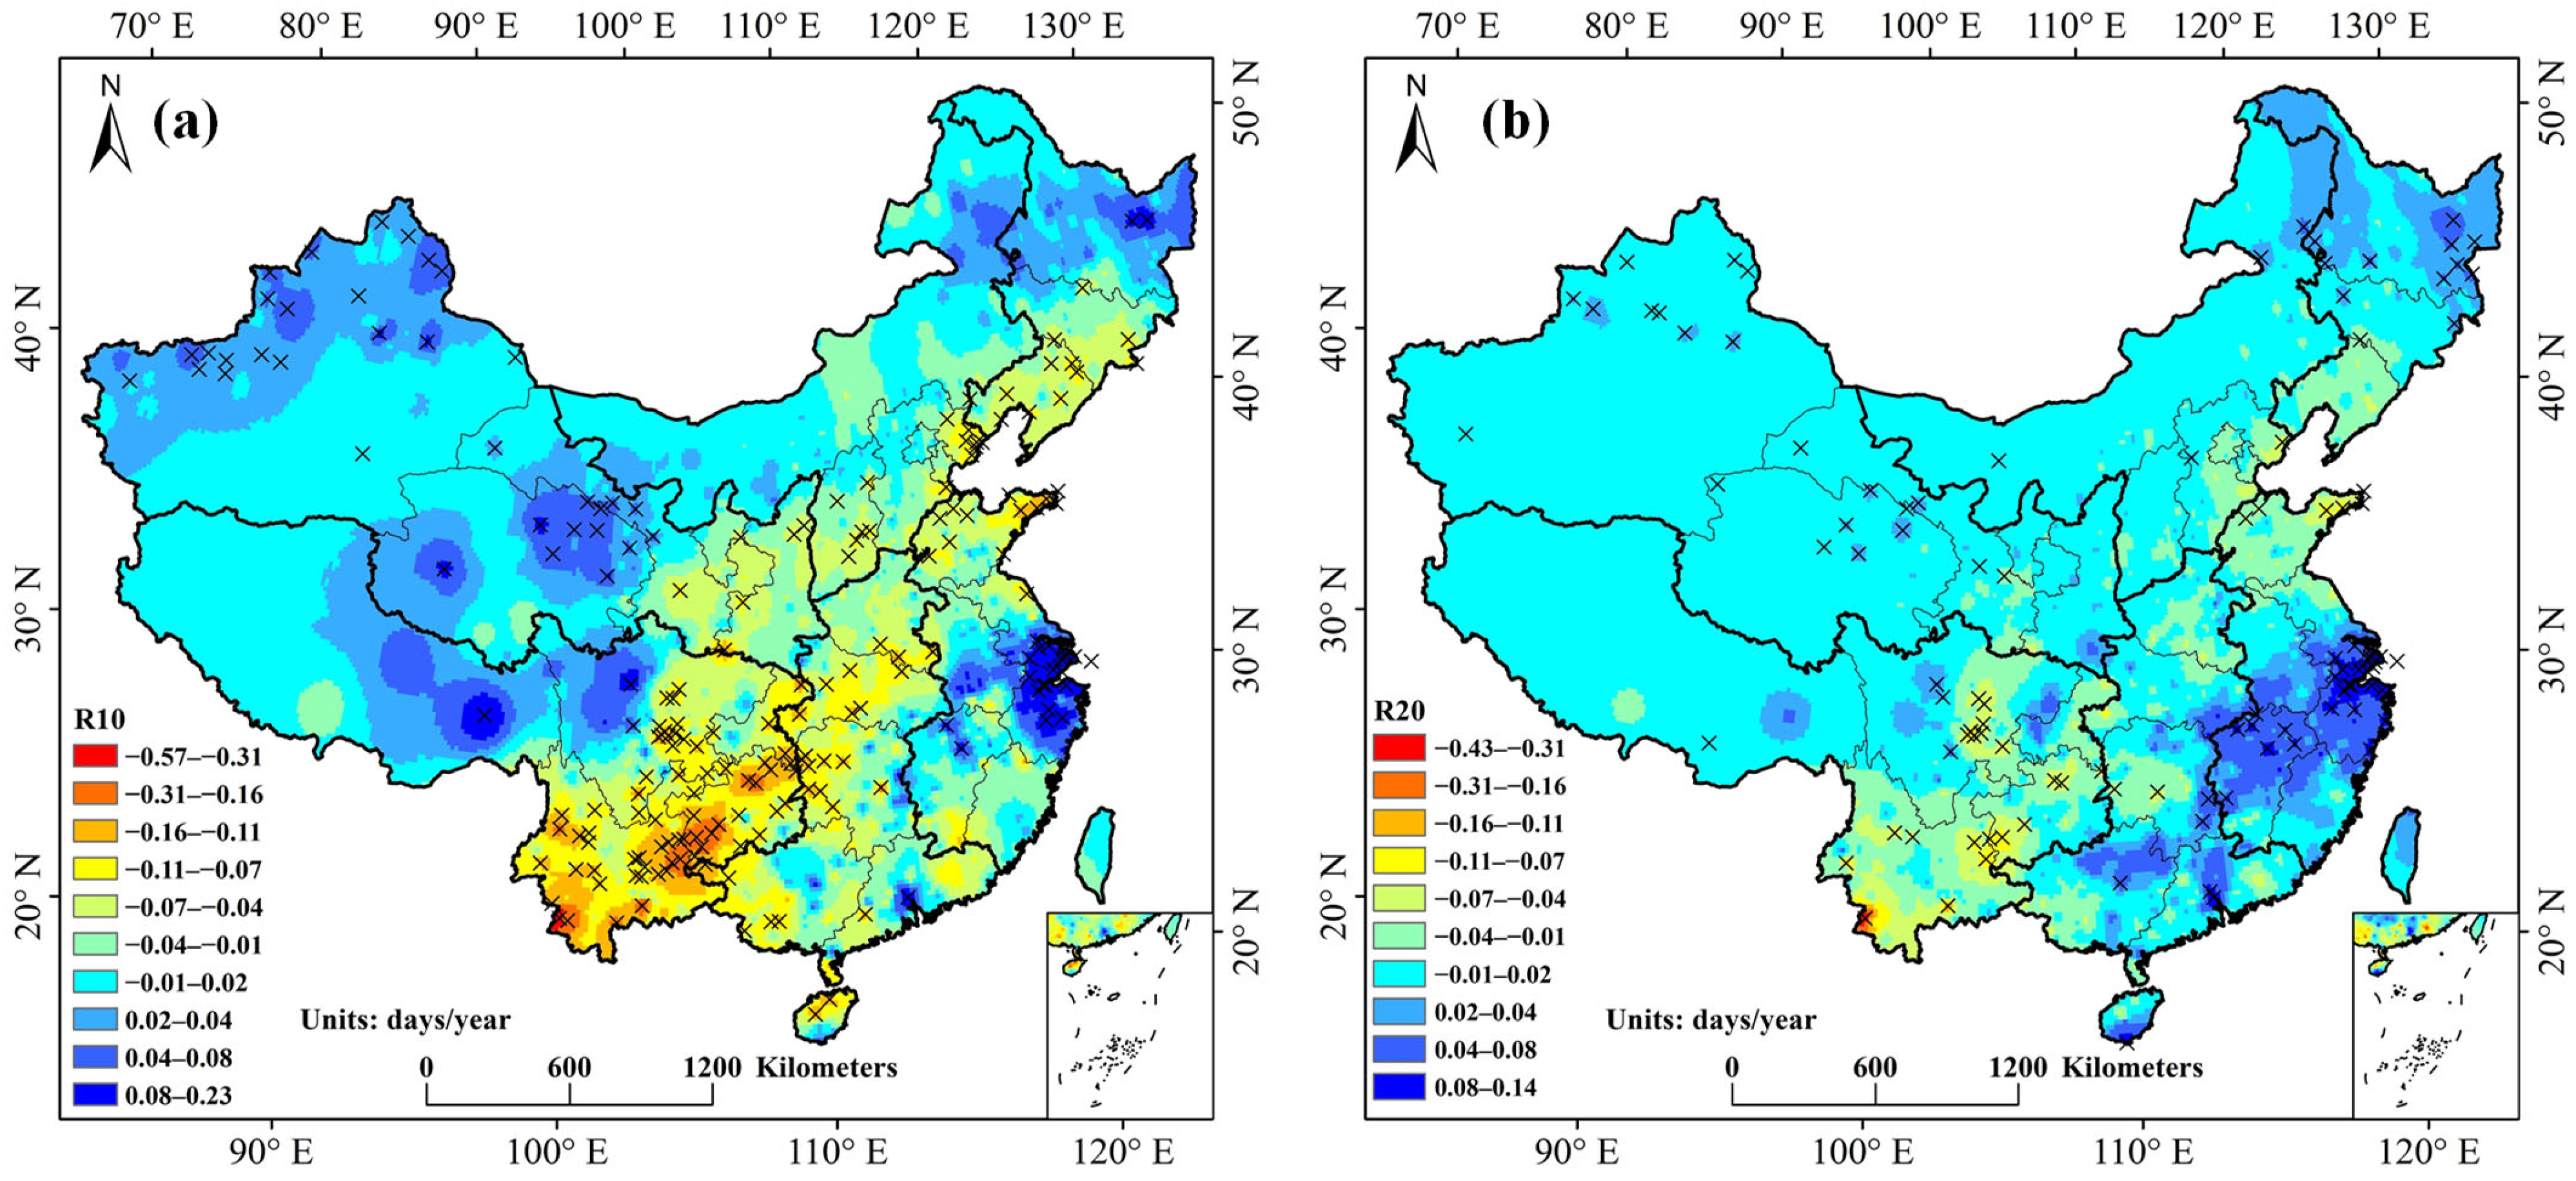
3. EPIs Trend Analysis
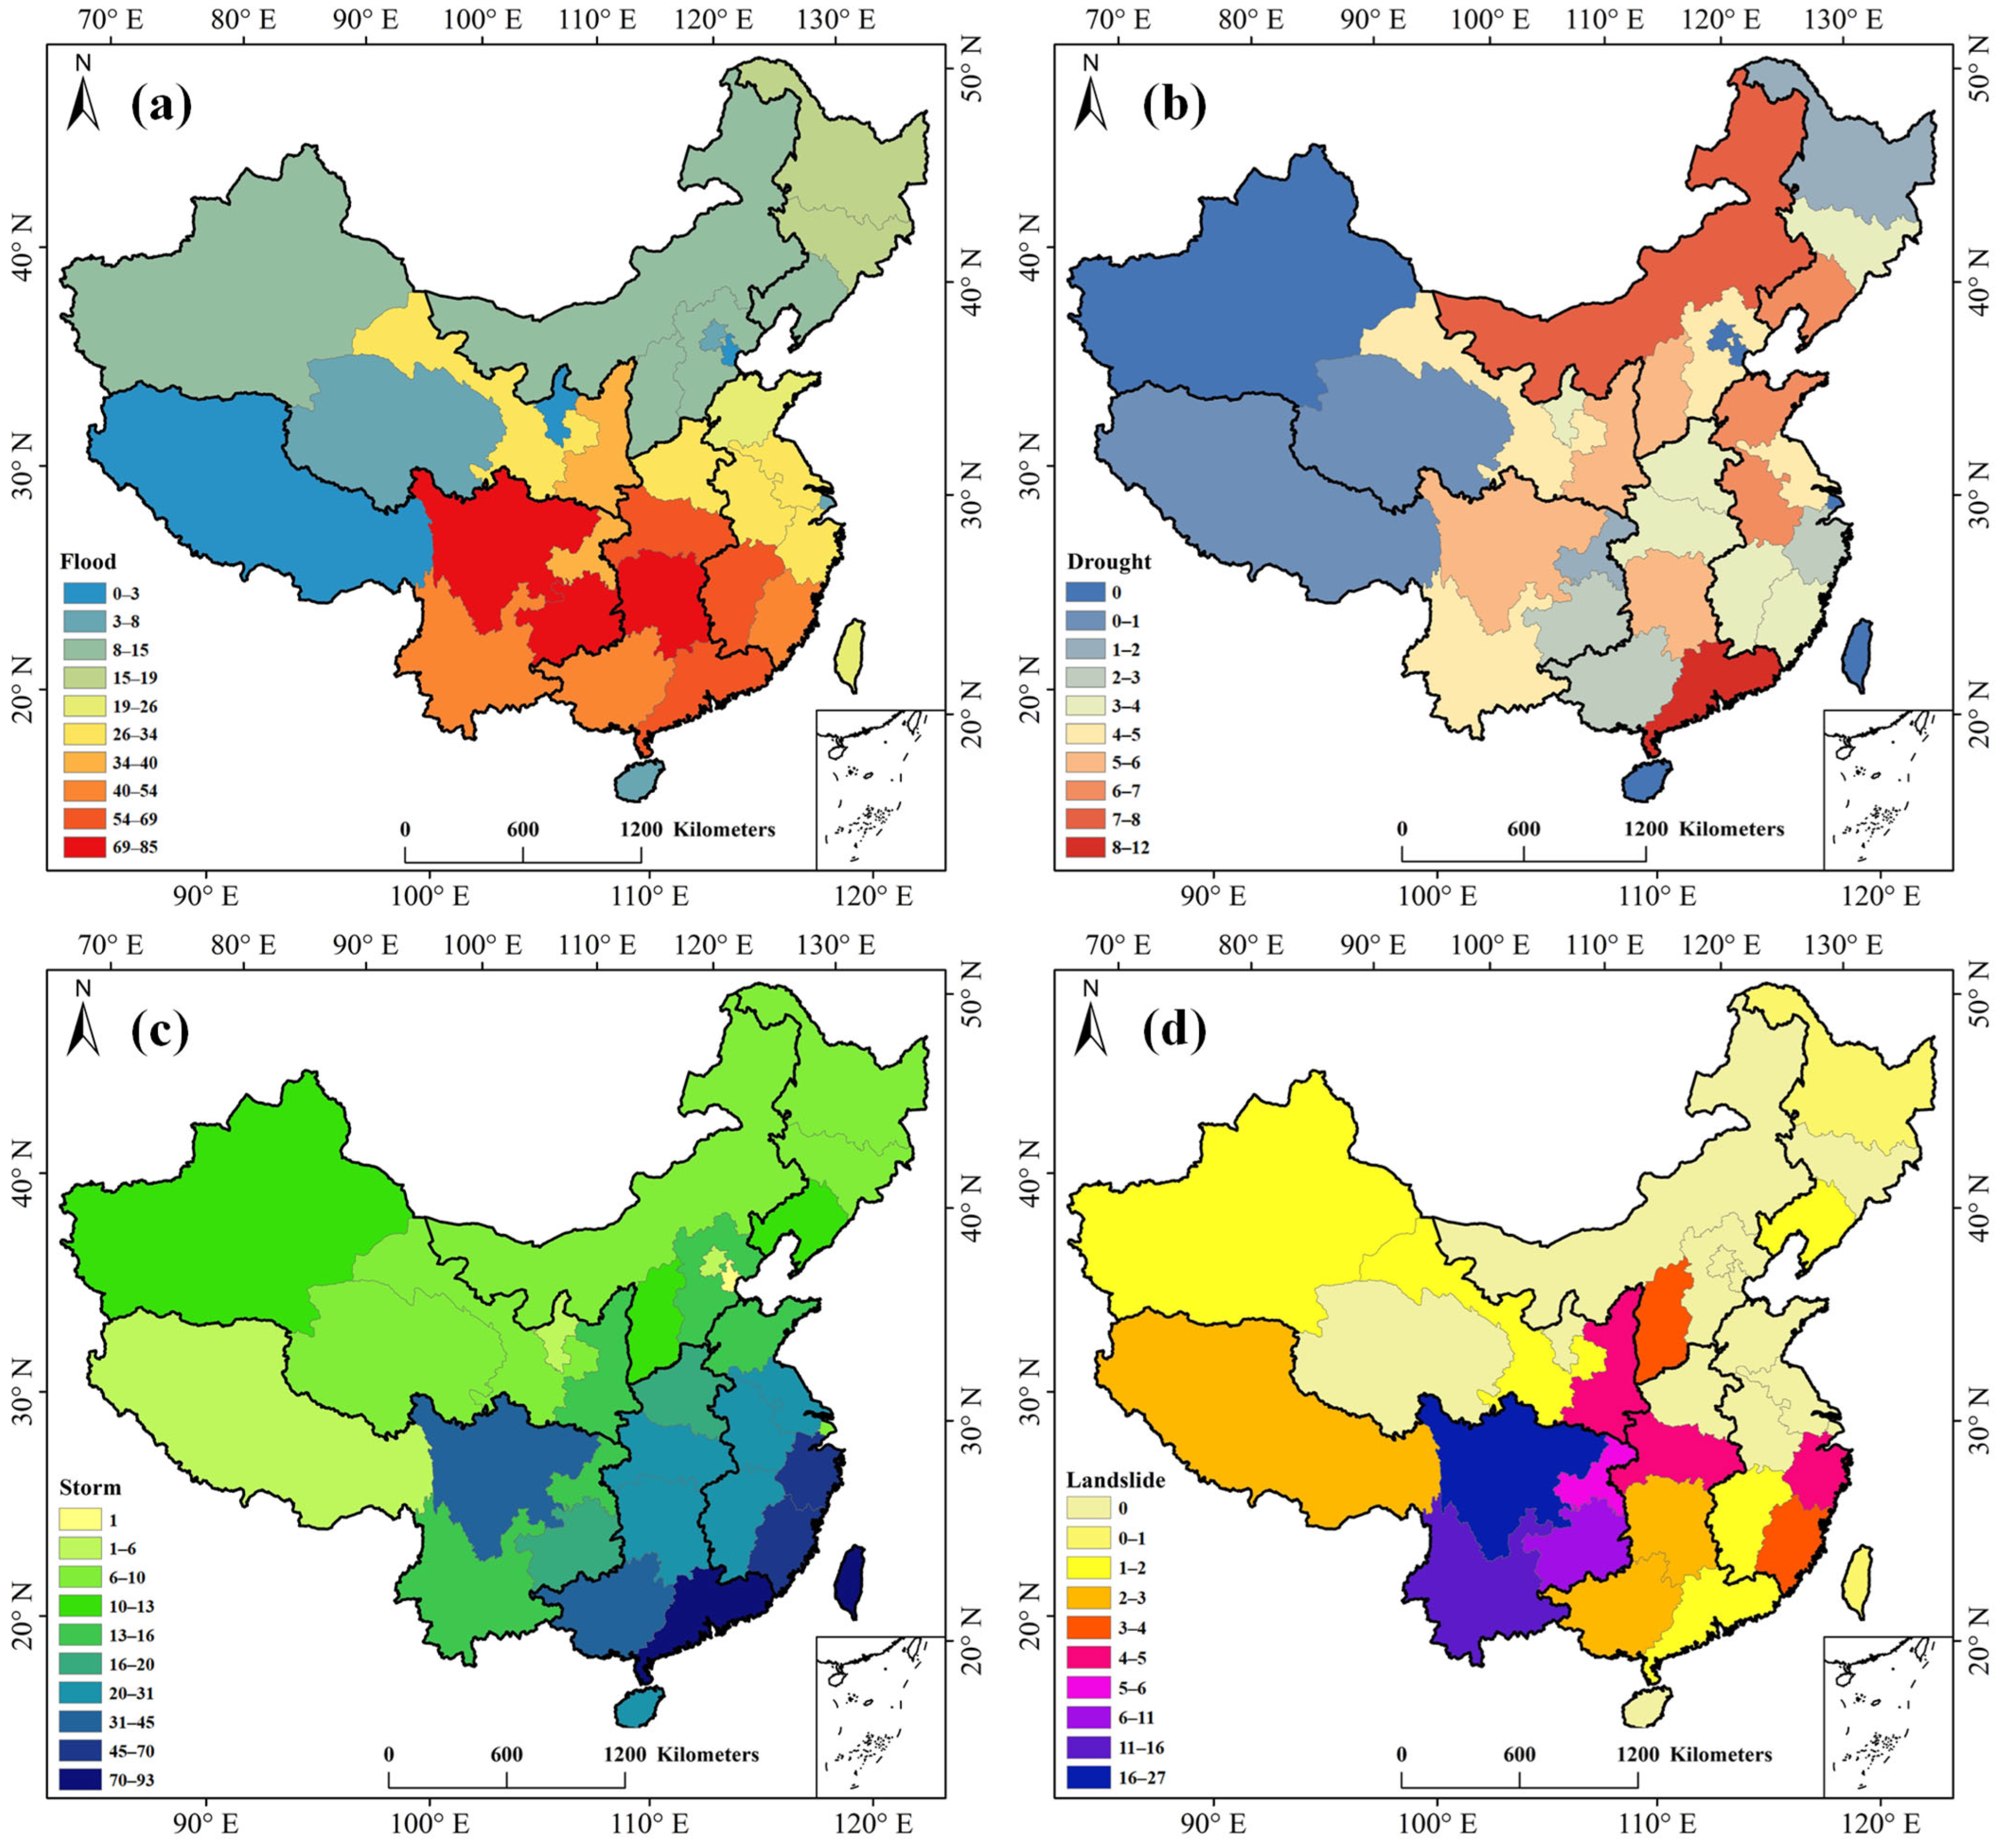
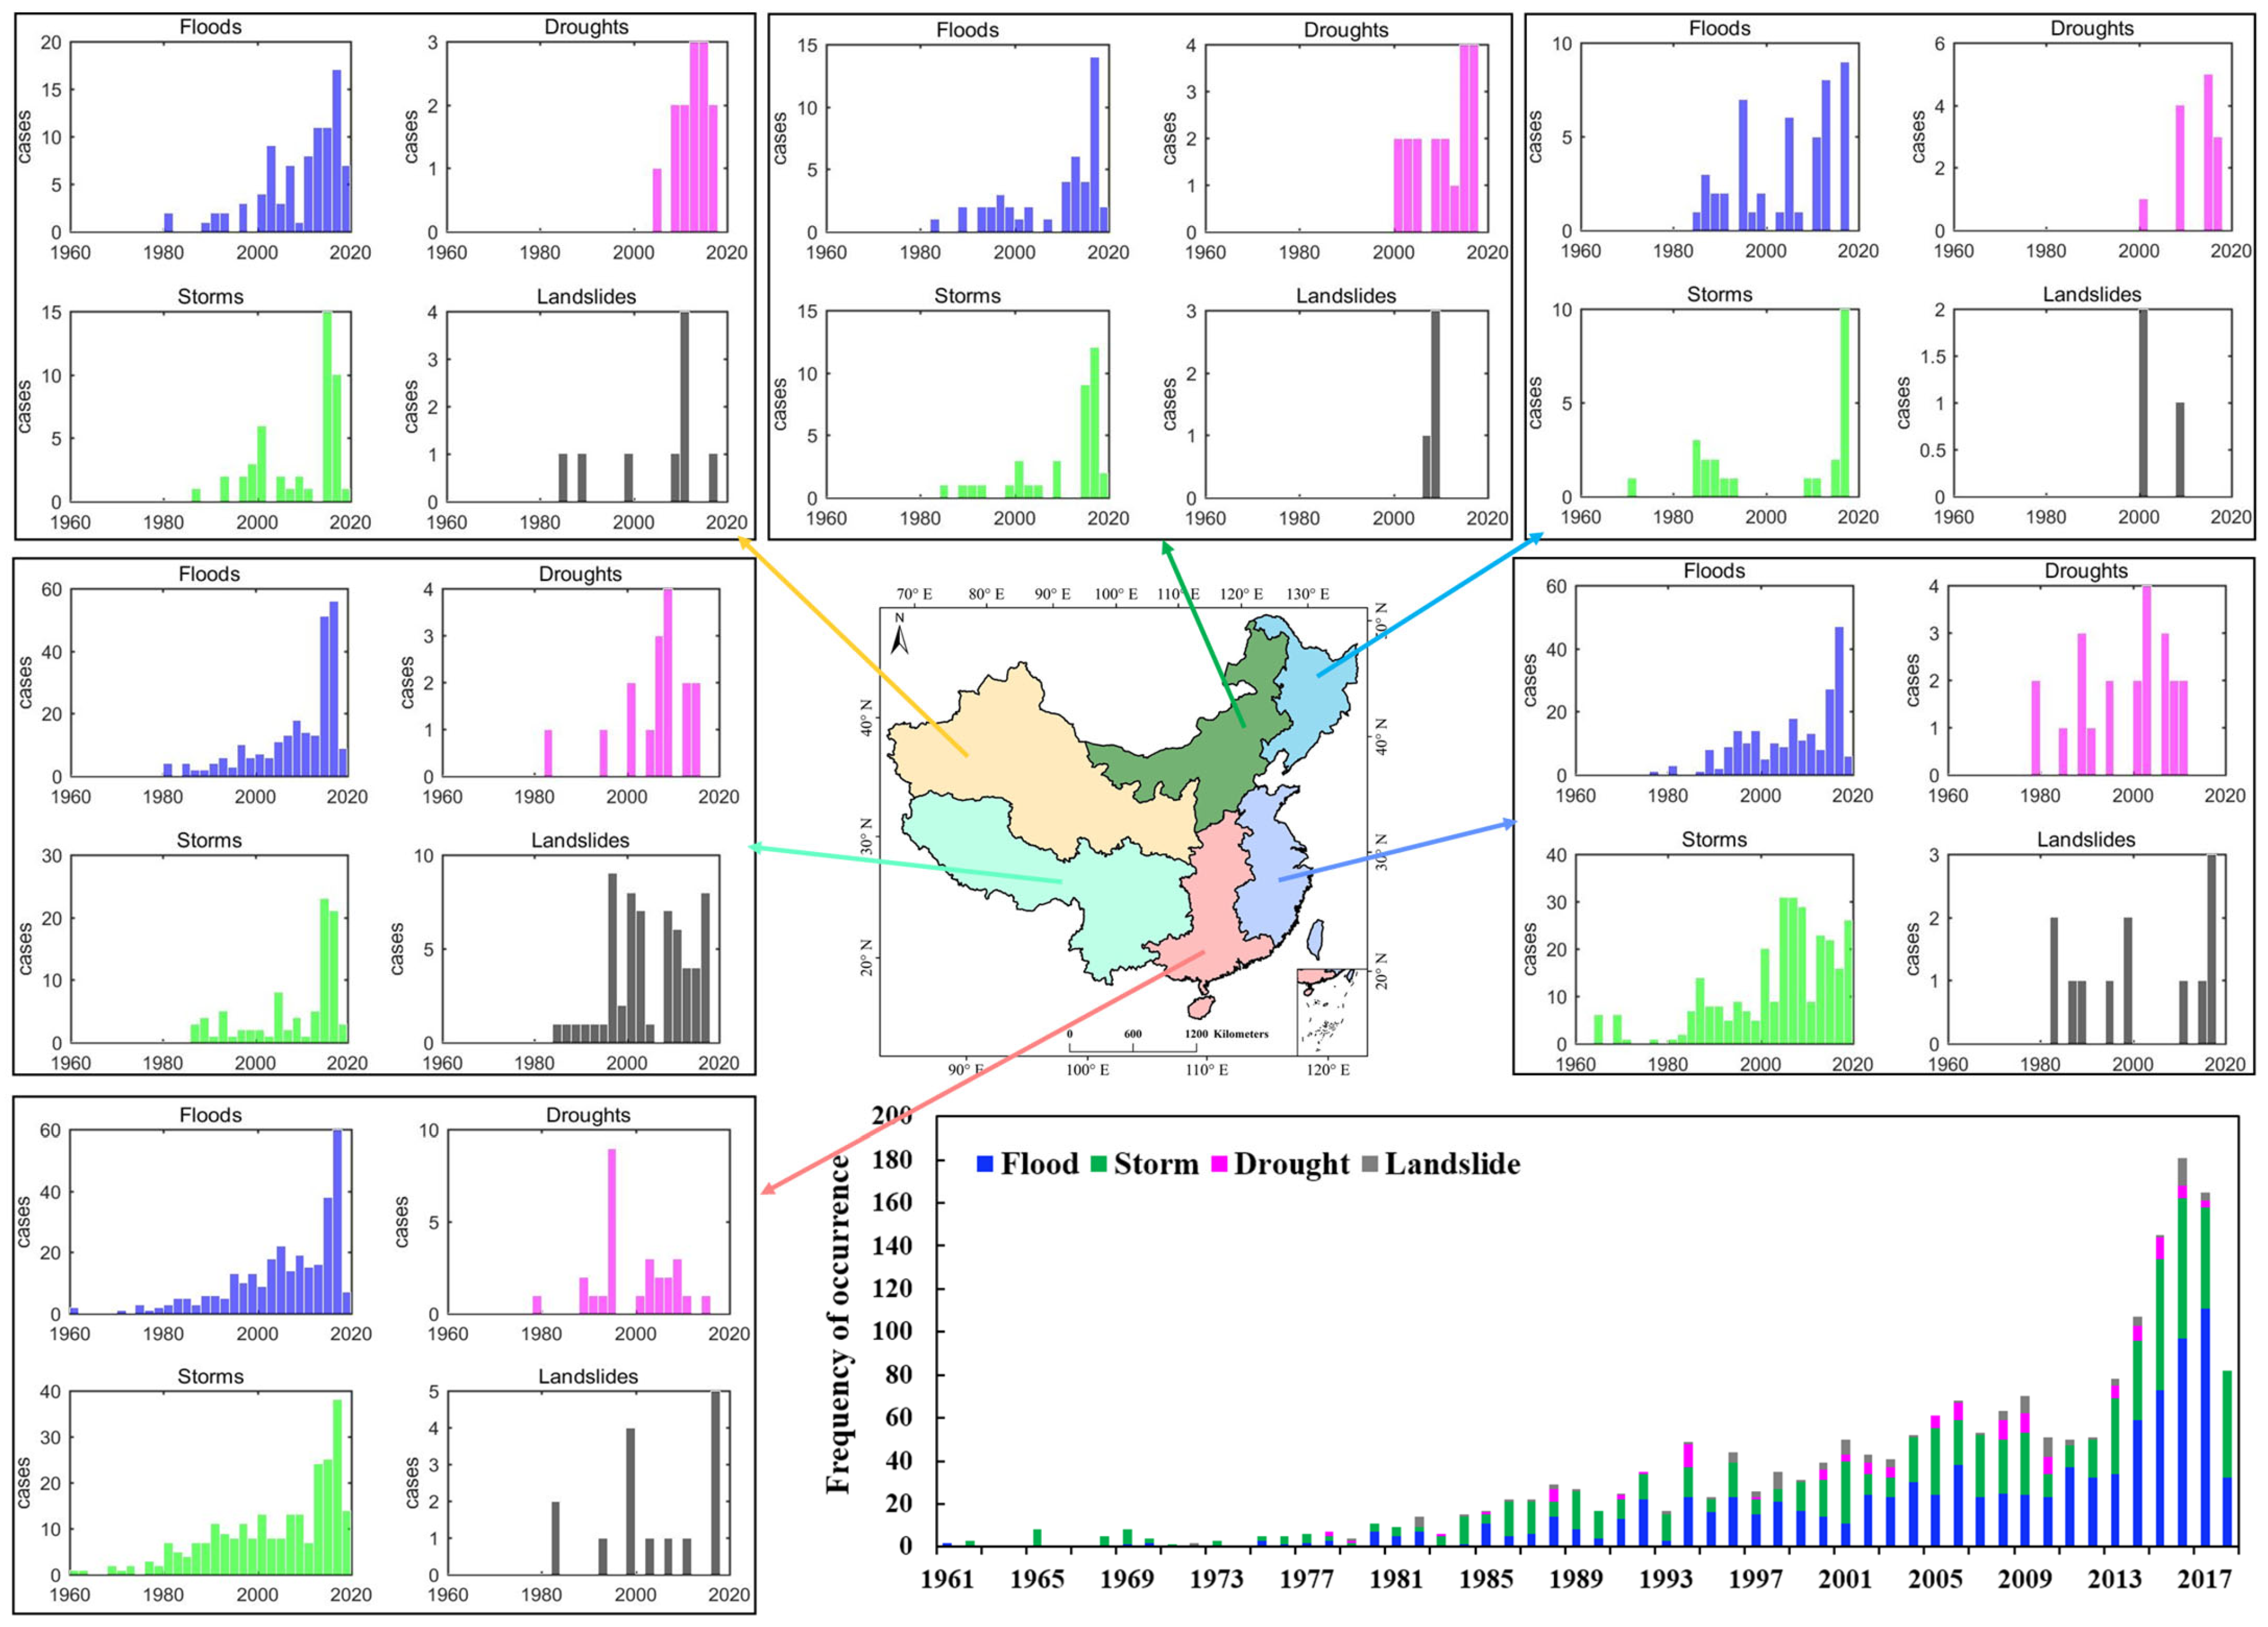
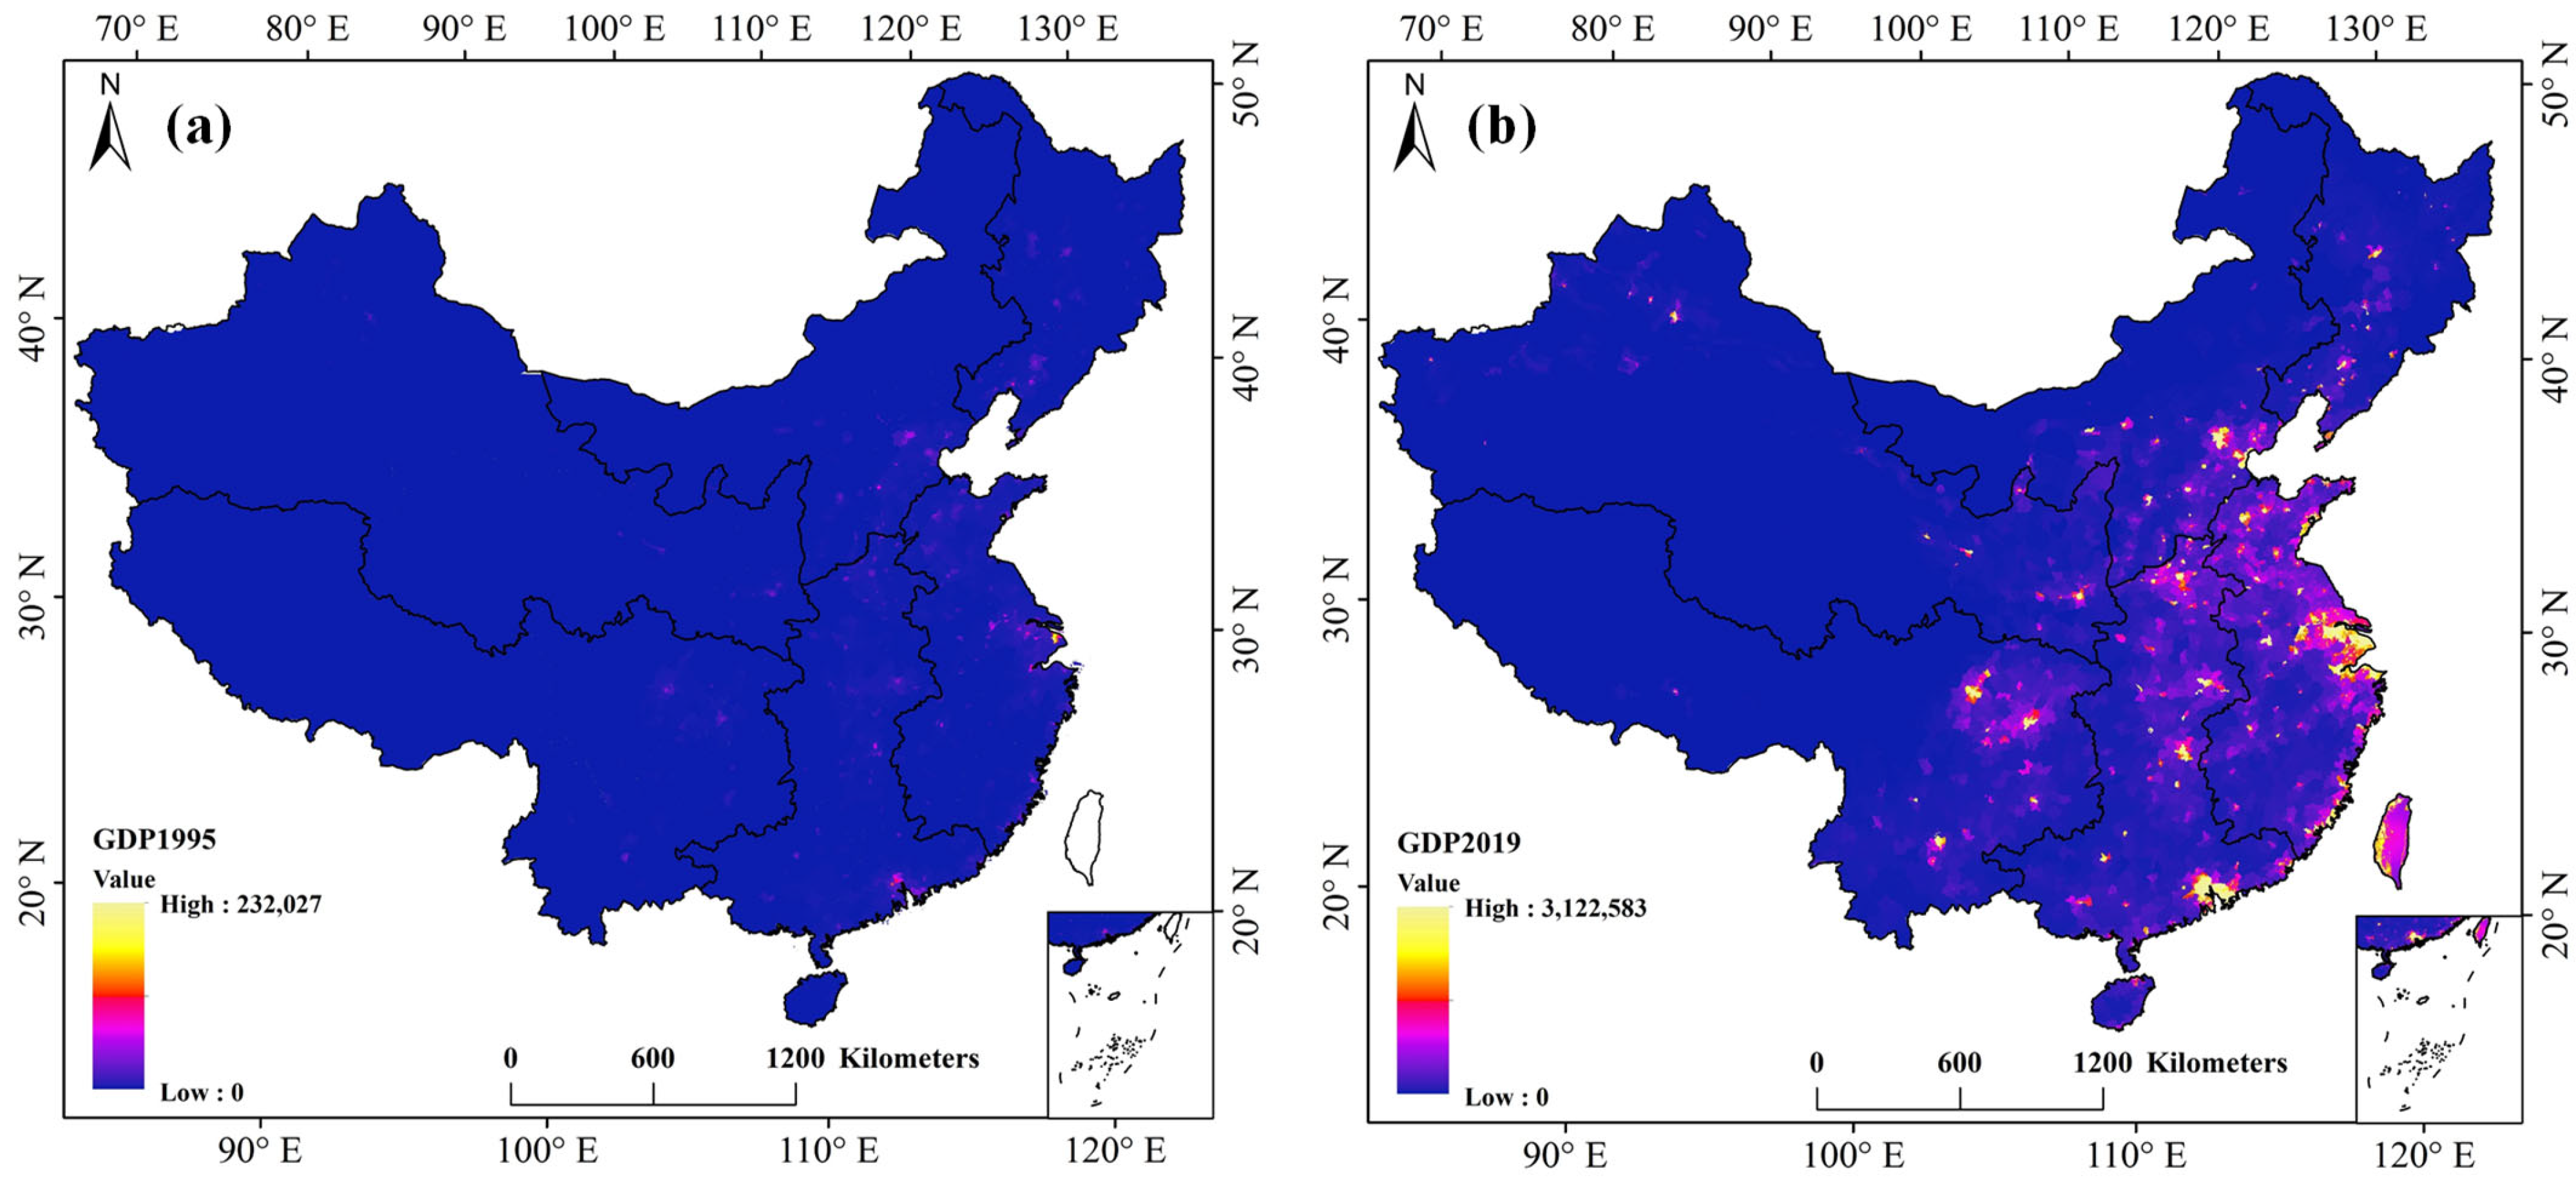
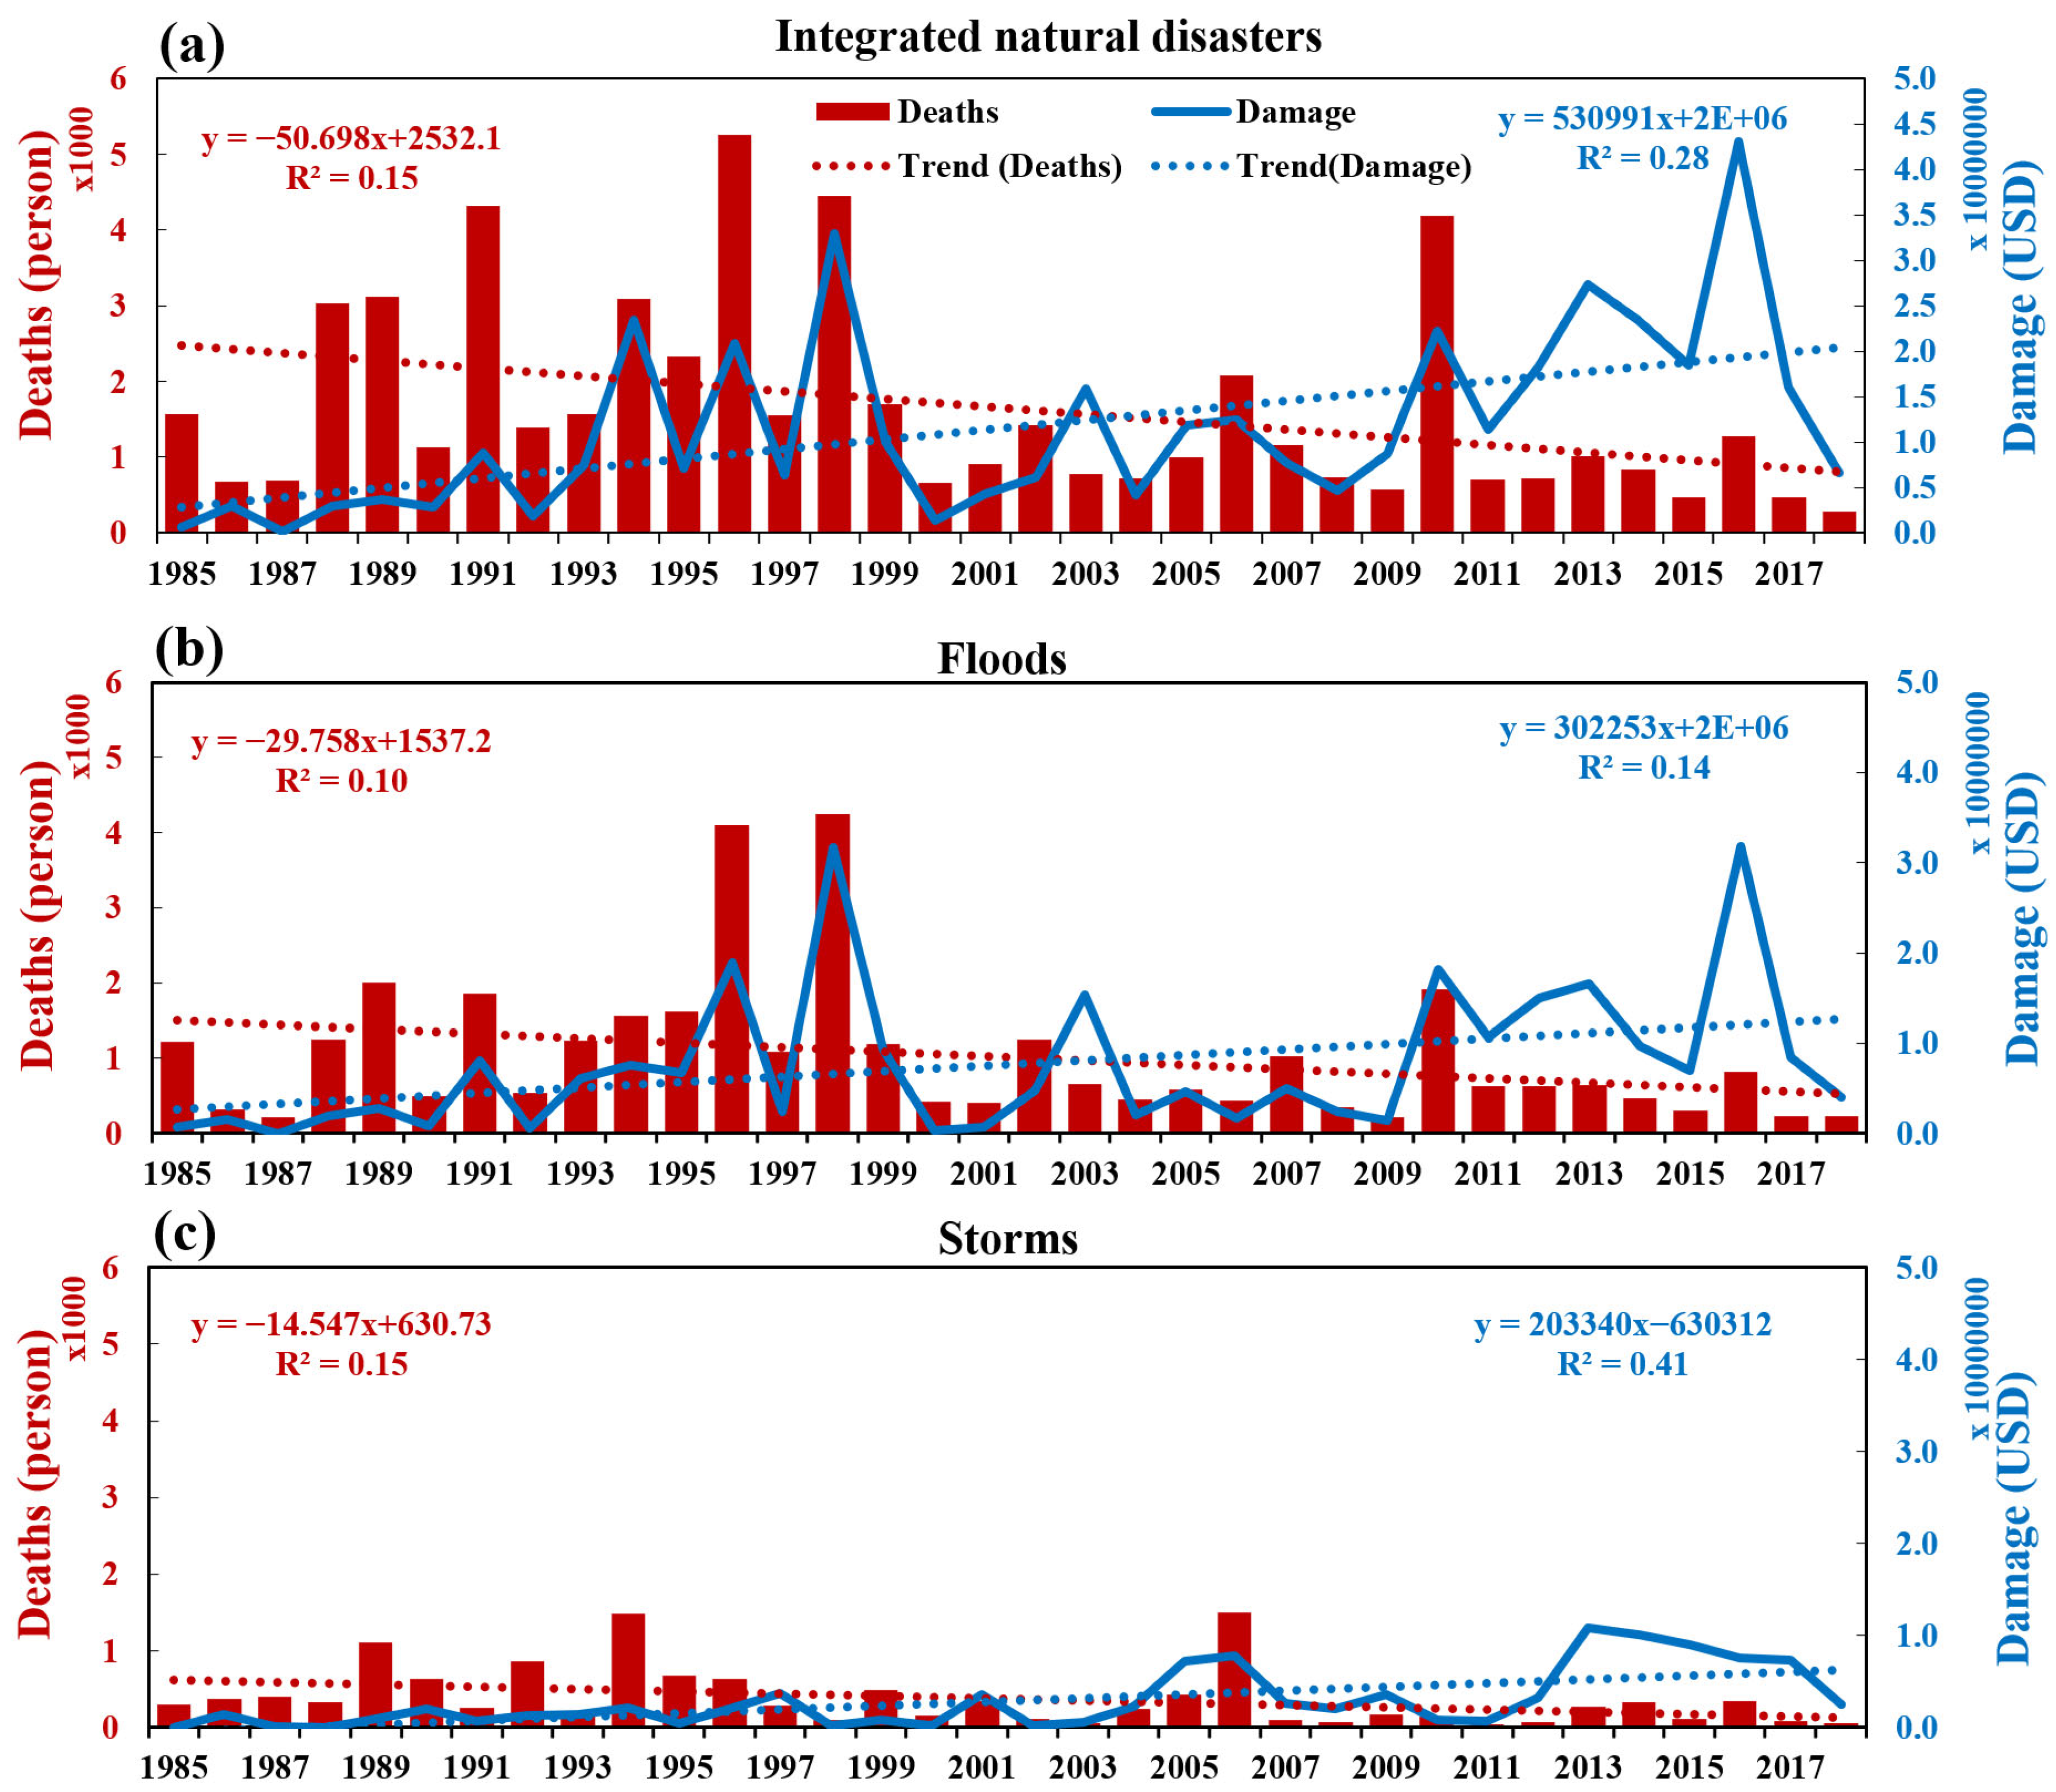
4. Associations of Trends to Natural Hazards
5. Discussion
6. Conclusions
Author Contributions
Funding
Data Availability Statement
Acknowledgments
Conflicts of Interest
References
- Wang, X.; Hou, X.; Wang, Y. Spatiotemporal variations and regional differences of extreme precipitation events in the Coastal area of China from 1961 to 2014. Atmospheric Res. 2017, 197, 94–104. [Google Scholar] [CrossRef]
- Rodrigues, D.T.; Gonçalves, W.A.; Spyrides, M.H.C.; Andrade, L.d.M.B.; de Souza, D.O.; de Araujo, P.A.A.; da Silva, A.C.N.; e Silva, C.M.S. Probability of occurrence of extreme precipitation events and natural disasters in the city of Natal, Brazil. Urban Clim. 2021, 35, 100753. [Google Scholar] [CrossRef]
- Wei, H.; Yu, T.; Tu, J.; Ke, F. Detection and evaluation of flood inundation using CYGNSS data during Extreme precipitation in 2022 in Guangdong province, China. Remote Sens. 2023, 15, 297. [Google Scholar] [CrossRef]
- WMO, CCI/CLIVAR, ETCCDMI. Report of the First CCI/ CLIVAR Expert Team on Climate Change Detection, Monitoring and Indices; WMO, CCI/CLIVAR, ETCCDMI: Norwich, UK, 2004. [Google Scholar]
- Li, L.; Zou, Y.; Li, Y.; Lin, H.; Liu, D.L.; Wang, B.; Yao, N.; Song, S. Trends, change points and spatial variability in extreme precipitation events from 1961 to 2017 in China. Hydrol. Res. 2020, 51, 484–504. [Google Scholar] [CrossRef]
- Ojara, M.; Yunsheng, L.; Babaousmail, H.; Wasswa, P. Trends and zonal variability of extreme precipitation events over East Africa during 1960–2017. Nat. Hazards 2021, 109, 33–61. [Google Scholar]
- Wang, X.; Li, Y.; Yan, M.; Gong, X. Changes in temperature and precipitation extremes in the arid regions of China during 1960–2016. Front. Ecol. Evol. 2022, 10, 902813. [Google Scholar] [CrossRef]
- Cui, H.; Jiang, S.; Ren, L.; Xiao, W.; Yuan, F.; Wang, M.; Wei, L. Dynamics and potential synchronization of regional precipitation concentration and drought-flood abrupt alternation under the influence of reservoir climate. J. Hydrol. Reg. Stud. 2022, 42, 101147. [Google Scholar] [CrossRef]
- Fang, Y.P.; Zhu, F.B.; Qiu, X.P.; Zhao, S. Effects of natural disasters on livelihood resilience of rural residents in Sichuan. Habitat Int. 2018, 76, 19–28. [Google Scholar] [CrossRef]
- Zhou, X.; Zhang, Y.; Wang, W.; Li, X.; Yang, H.; Sun, Y. Social vulnerability assessment under different extreme precipitation scenarios: A case study in Henan Province, China. PLoS ONE 2024, 19, e0299956. [Google Scholar] [CrossRef]
- AghaKouchak, A.; Chiang, F.; Huning, L.S.; Love, C.A.; Mallakpour, I.; Mazdiyasni, O.; Moftakhari, H.; Papalexiou, S.M.; Ragno, E.; Sadegh, M. Climate extremes and compound hazards in a warming world. Annu. Rev. Earth Planet. Sci. 2020, 48, 519–548. [Google Scholar] [CrossRef]
- Zhang, Y.; You, Q.; Ullah, S.; Chen, C.; Shen, L.; Liu, Z. Substantial increase in abrupt shifts between drought and flood events in China based on observations and model simulations. Sci. Total Environ. 2023, 876, 162822. [Google Scholar] [CrossRef] [PubMed]
- Wang, J.; Chen, Y.; Nie, J.; Yan, Z.; Zhai, P.; Feng, J. On the role of anthropogenic warming and wetting in the July 2021 Henan record-shattering rainfall. Sci. Bull. 2022, 67, 2055–2059. [Google Scholar] [CrossRef]
- Zang, Z.; Luo, J.; Ha, Y. Interdecadal increase in summertime extreme precipitation over East China in the late 1990′s. Front. Earth Sci. 2022, 10, 969853. [Google Scholar] [CrossRef]
- Yao, Y.; Zhang, W.; Kirtman, B. Increasing impacts of summer extreme precipitation and heatwaves in eastern China. Clim. Change 2023, 176, 131. [Google Scholar] [CrossRef]
- Wu, X.; Wang, L.; Niu, Z.; Jiang, W.; Cao, Q. More extreme precipitation over the Yangtze River Basin, China: Insights from historical and projected perspectives. Atmospheric Res. 2023, 292, 106883. [Google Scholar] [CrossRef]
- Zhao, Y.; Zou, X.; Cao, L.; Xu, X. Changes in precipitation extremes over the Pearl River Basin, southern China, during 1960–2012. Quat. Int. 2014, 333, 26–39. [Google Scholar] [CrossRef]
- Zhang, J.; Shen, X.; Wang, B. Changes in precipitation extremes in Southeastern Tibet, China. Quat. Int. 2015, 380, 49–59. [Google Scholar] [CrossRef]
- Chen, F.; Chen, H.; Yang, Y. Annual and seasonal changes in means and extreme events of precipitation and their connection to elevation over Yunnan Province, China. Quat. Int. 2015, 374, 46–61. [Google Scholar] [CrossRef]
- Sun, W.; Mu, X.; Song, X.; Wu, D.; Cheng, A.; Qiu, B. Changes in extreme temperature and precipitation events in the Loess Plateau (China) during 1960–2013 under global warming. Atmos. Res. 2016, 168, 33–48. [Google Scholar] [CrossRef]
- Wang, L.; Wu, Z.; He, H.; Wang, F.; Du, H.; Zong, S. Changes in summer extreme precipitation in Northeast Asia and their relationships with the East Asian summer monsoon during 1961–2009. Int. J. Clim. 2017, 37, 25–35. [Google Scholar] [CrossRef]
- Zheng, J.; Fan, J.; Zhang, F. Spatiotemporal trends of temperature and precipitation extremes across contrasting climatic zones of China during 1956–2015. Theor. Appl. Clim. 2019, 138, 1877–1897. [Google Scholar] [CrossRef]
- Shi, J.; Cui, L.; Wang, J.; Du, H.; Wen, K. Changes in the temperature and precipitation extremes in China during 1961–2015. Quat. Int. 2019, 527, 64–78. [Google Scholar] [CrossRef]
- Tao, Y.; Wang, W.; Song, S.; Ma, J. Spatial and Temporal Variations of Precipitation Extremes and Seasonality over China from 1961~2013. Water 2018, 10, 719. [Google Scholar] [CrossRef]
- Bi, X.; Fan, Q.; He, L.; Zhang, C.; Diao, Y.; Han, Y. Analysis and evaluation of extreme precipitation trends and geological hazards risk in the lower Jinshajiang river. Appl. Sci. 2023, 13, 4021. [Google Scholar] [CrossRef]
- Zhan, M.; Wu, Q.; Zhan, L.; Xin, J. Change in extreme precipitation events: Exposure and vulnerability in the Poyang Lake Basin, China. Front. Earth Sci. 2023, 11, 1125837. [Google Scholar] [CrossRef]
- Gu, X.; Ye, L.; Xin, Q.; Zhang, C.; Zeng, F.; Nerantzaki, S.D.; Papalexiou, S.M. Extreme precipitation in China: A review on statistical methods and applications. Adv. Water Resour. 2022, 163, 104144. [Google Scholar] [CrossRef]
- Akter, T.; Quevauviller, P.; Eisenreich, S.J.; Vaes, G. Impacts of climate and land use changes on flood risk management for the Schijn River, Belgium. Environ. Sci. Policy 2018, 89, 163–175. [Google Scholar] [CrossRef]
- Alberico, I.; Iavarone, R.; Petrosino, P. A procedure for the resilience mapping in urban systems exposed to natural hazard: The Ischia Island (southern Italy) test area. Int. J. Disaster Risk Reduct. 2020, 50, 101893. [Google Scholar] [CrossRef]
- He, F.; Gu, L.; Wang, T.; Zhang, Z. The synthetic geo-ecological environmental evaluation of a coastal coal-mining city using spatiotemporal big data: A case study in Longkou, China. J. Clean. Prod. 2017, 142, 854–866. [Google Scholar] [CrossRef]
- AghaKouchak, A.; Huning, L.S.; Chiang, F.; Sadegh, M.; Vahedifard, F.; Mazdiyasni, O.; Moftakhari, H.; Mallakpour, I. How do natural hazards cascade to cause disasters? Nature 2018, 561, 458–460. [Google Scholar] [CrossRef]
- Klomp, J.; Valckx, K. Natural disasters and economic growth: A meta-analysis. Glob. Environ. Change 2014, 26, 183–195. [Google Scholar] [CrossRef]
- Cavallo, E.; Galiani, S.; Noy, I.; Pantano, J. Catastrophic natural disasters and economic growth. Rev. Econ. Stat. 2013, 95, 1549–1561. [Google Scholar]
- Guan, Y.; Zhang, X.; Zheng, F.; Wang, B. Trends and variability of daily temperature extremes during 1960–2012 in the Yangtze River Basin, China. Glob. Planet. Change 2015, 124, 79–94. [Google Scholar] [CrossRef]
- Zhong, K.; Zheng, F.; Wu, H.; Qin, C.; Xu, X. Dynamic changes in temperature extremes and their association with atmospheric circulation patterns in the Songhua River Basin, China. Atmos. Res. 2017, 190, 77–88. [Google Scholar] [CrossRef]
- Wang, L.; Chen, S.; Zhu, W.; Ren, H.; Zhang, L.; Zhu, L. Spatiotemporal variations of extreme precipitation and its potential driving factors in China’s North-South transition zone during 1960–2017. Atmos. Res. 2021, 252, 105429. [Google Scholar] [CrossRef]
- Rosvold, E.L.; Buhaug, H. GDIS, a global dataset of geocoded disaster locations. Sci. Data 2021, 8, 61. [Google Scholar] [CrossRef]
- Zhou, Y.; Li, N.; Wu, W.; Wu, J. Assessment of provincial social vulnerability to natural disasters in China. Nat. Hazards 2014, 71, 2165–2186. [Google Scholar] [CrossRef]
- de Oliveira Roza, M.P.; Cecílio, R.A.; Zanetti, S.S.; Abreu, M.C.; Lyra, G.B.; Reis, G.B. Natural disasters related to rainfall trends in Espírito Santo, southeastern Brazil. Theor. Appl. Climatol. 2024, 155, 1451–1466. [Google Scholar]
- Onyutha, C.; Tabari, H.; Taye, M.T.; Nyandwaro, G.N.; Willems, P. Analyses of rainfall trends in the Nile River Basin. J. Hydro-Environ. Res. 2016, 13, 36–51. [Google Scholar] [CrossRef]
- Li, X.; Zhang, K.; Gu, P.; Feng, H.; Yin, Y.; Chen, W.; Cheng, B. Changes in precipitation extremes in the Yangtze River Basin during 1960–2019 and the association with global warming, ENSO, and local effects. Sci. Total Environ. 2021, 760, 144244. [Google Scholar] [CrossRef]
- Du, H.; Xia, J.; Yan, Y.; Lu, Y.; Li, J. Spatiotemporal Variations of Extreme Precipitation in Wuling Mountain Area (China) and Their Connection to Potential Driving Factors. Sustainability 2022, 14, 8312. [Google Scholar] [CrossRef]
- Cui, D.; Wang, C.; Santisirisomboon, J. Characteristics of extreme precipitation over eastern Asia and its possible connections with Asian summer monsoon activity. Int. J. Clim. 2019, 39, 711–723. [Google Scholar] [CrossRef]
- Zhang, L.; Wang, C.; Li, X.; Zhang, H.; Li, W.; Jiang, L. Impacts of agricultural expansion (1910s–2010s) on the water cycle in the songneng plain, Northeast China. Remote Sens. 2018, 10, 1108. [Google Scholar] [CrossRef]
- Du, C.; Chen, J.; Nie, T.; Dai, C. Spatial–temporal changes in meteorological and agricultural droughts in Northeast China: Change patterns, response relationships and causes. Nat. Hazards 2022, 110, 155–173. [Google Scholar]
- Liu, X.; Pan, Y.; Zhu, X.; Yang, T.; Bai, J.; Sun, Z. Drought evolution and its impact on the crop yield in the North China Plain. J. Hydrol. 2018, 564, 984–996. [Google Scholar] [CrossRef]
- Wang, F.; Wang, Z.; Yang, H.; Di, D.; Zhao, Y.; Liang, Q. Utilizing GRACE-based groundwater drought index for drought characterization and teleconnection factors analysis in the North China Plain. J. Hydrol. 2020, 585, 124849. [Google Scholar] [CrossRef]
- Chen, N.; Li, R.; Zhang, X.; Yang, C.; Wang, X.; Zeng, L.; Tang, S.; Wang, W.; Li, D.; Niyogi, D. Drought propagation in Northern China Plain: A comparative analysis of GLDAS and MERRA-2 datasets. J. Hydrol. 2020, 588, 125026. [Google Scholar] [CrossRef]
- Zhang, C.; Duan, Q.; Yeh, P.J.-F.; Pan, Y.; Gong, H.; Moradkhani, H.; Gong, W.; Lei, X.; Liao, W.; Xu, L.; et al. Sub-regional groundwater storage recovery in North China Plain after the South-to-North water diversion project. J. Hydrol. 2021, 597, 126156. [Google Scholar] [CrossRef]
- Lei, C.; Yu, Z.; Sun, X.; Wang, Y.; Yuan, J.; Wang, Q.; Han, L.; Xu, Y. Urbanization effects on intensifying extreme precipitation in the rapidly urbanized Tai Lake Plain in East China. Urban Clim. 2023, 47, 101399. [Google Scholar] [CrossRef]
- Zhang, Q.; Yang, J.; Wang, W.; Ma, P.; Lu, G.; Liu, X.; Yu, H.; Fang, F. Climatic warming and humidification in the arid region of Northwest China: Multi-scale characteristics and impacts on ecological vegetation. J. Meteorol. Res. 2021, 35, 113–127. [Google Scholar] [CrossRef]
- Li, Y.; Wang, Z.; Zhang, Y.; Li, X.; Huang, W. Drought variability at various timescales over Yunnan Province, China: 1961–2015. Theor. Appl. Clim. 2019, 138, 743–757. [Google Scholar] [CrossRef]
- Lan, T.; Yan, X. Analysis of Drought Characteristics and Causes in Yunnan Province in the Last 60 Years (1961–2020). J. Hydrometeorol. 2024, 25, 177–190. [Google Scholar] [CrossRef]
- Sun, Y.; Ge, Y.; Chen, X.; Zeng, L.; Liang, X. Risk assessment of debris flow along the northern line of the Sichuan-Tibet highway. Geomatics, Nat. Hazards Risk 2023, 14, 2195531. [Google Scholar] [CrossRef]
- Li, Y.; Wang, W.; Chang, M.; Wang, X. Impacts of urbanization on extreme precipitation in the Guangdong-Hong Kong-Macau Greater Bay Area. Urban Clim. 2021, 38, 100904. [Google Scholar] [CrossRef]
- Zhang, D. Rapid urbanization and more extreme precipitation events. Sci. Bull. 2020, 65, 516–518. [Google Scholar]
- Leite-Filho, A.T.; Costa, M.H.; Fu, R. The southern Amazon rainy season: The role of deforestation and its interactions with large-scale mechanisms. Int. J. Clim. 2020, 40, 2328–2341. [Google Scholar] [CrossRef]
- Leite-Filho, A.T.; Soares-Filho, B.S.; Davis, J.L.; Abrahão, G.M.; Börner, J. Deforestation reduces rainfall and agricultural revenues in the Brazilian Amazon. Nat. Commun. 2021, 12, 2591. [Google Scholar] [CrossRef]
- Smith, C.; Baker, J.C.A.; Spracklen, D.V. Tropical deforestation causes large reductions in observed precipitation. Nature 2023, 615, 270–275. [Google Scholar] [CrossRef]
- Martinez-Villalobos, C.; Neelin, J.D. Regionally high risk increase for precipitation extreme events under global warming. Sci. Rep. 2023, 13, 5579. [Google Scholar] [CrossRef]
- Diffenbaugh, N.S.; Singh, D.; Mankin, J.S.; Horton, D.E.; Swain, D.L.; Touma, D.; Charland, A.; Liu, Y.; Haugen, M.; Tsiang, M.; et al. Quantifying the influence of global warming on unprecedented extreme climate events. Proc. Natl. Acad. Sci. USA 2017, 114, 4881–4886. [Google Scholar] [CrossRef]
- Colvin, R.; Crimp, S.; Lewis, S.; Howden, M. Implications of climate change for future disasters. In Natural Hazards and Disaster Justice: Challenges for Australia and Its Neighbours; Springer: Berlin/Heidelberg, Germany, 2020; pp. 25–48. [Google Scholar]
- Dai, A. Increasing drought under global warming in observations and models. Nat. Clim. Change 2013, 3, 52–58. [Google Scholar] [CrossRef]
- Trenberth, K.E.; Dai, A.; Van Der Schrier, G.; Jones, P.D.; Barichivich, J.; Briffa, K.R.; Sheffield, J. Global warming and changes in drought. Nat. Clim. Change 2014, 4, 17–22. [Google Scholar] [CrossRef]
- Chiou-Wei, S.Z.; Chen, C.-F.; Zhu, Z. Economic growth and energy consumption revisited—Evidence from linear and nonlinear Granger causality. Energy Econ. 2008, 30, 3063–3076. [Google Scholar] [CrossRef]
- World Bank. World Development Indicators 2016; The World Bank: Washington, DC, USA, 2016. [Google Scholar]
- Kellenberg, D.; Mobarak, A. Does rising income increase or decrease damage risk from natural disasters? J. Urban Econ. 2008, 63, 788–802. [Google Scholar] [CrossRef]
- Klomp, J. Economic development and natural disasters: A satellite data analysis. Glob. Environ. Change 2016, 36, 67–88. [Google Scholar] [CrossRef]


| Indices Categories | Indices Abbreviation | Name | Definition | Units |
|---|---|---|---|---|
| Frequency-based indices | R10 | Days of heavy precipitation | Annual total days when precipitation ≥10 mm | days |
| R20 | Days of very heavy precipitation | Annual total days when precipitation ≥20 mm | days | |
| Duration-based indices | CDD | Consecutive dry days | Maximum length of consecutive dry days (daily precipitation <1 mm) | days |
| CWD | Consecutive wet days | Maximum length of consecutive wet days (daily precipitation ≥1 mm) | days | |
| Intensity-based indices | Rx1day | Maximum 1-day precipitation | Annual maximum 1-day precipitation | mm |
| Rx5day | Maximum 5-day precipitation | Annual maximum consecutive 5-day precipitation | mm | |
| SDII | Simple daily intensity index | Annual total wet-day precipitation divided by the number of wet days (daily precipitation ≥1 mm) | mm/day | |
| R95p | Precipitation in very wet days | Annual total precipitation when daily precipitation >95th percentile | mm | |
| R99p | Precipitation in extremely wet days | Annual total precipitation when daily precipitation >99th percentile | mm | |
| PRCPTOT | Annual total wet day precipitation | Annual total precipitation on wet days (daily precipitation ≥1 mm) | mm |
| Floods | Droughts | Storms | Landslides | |
|---|---|---|---|---|
| NE | R20 | PRCPTOT, R95p | ||
| NC | R95p, R99p, Rx1day, Rx5day, PRCPTOT | Rx1day | SDII | |
| EC | R95p | PRCPTOT | Rx1day, R20 | PRCPTOT, R95p, R20 |
| SC | R95p, Rx1day | PRCPTOT | CDD, R20 | PRCPTOT, R95p |
| SW | R95p, Rx1day | PRCPTOT, R10 | PRCPTOT, CDD, R10 | |
| NW | PRCPTOT, CWD | PRCPTOT, CDD | PRCPTOT |
Disclaimer/Publisher’s Note: The statements, opinions and data contained in all publications are solely those of the individual author(s) and contributor(s) and not of MDPI and/or the editor(s). MDPI and/or the editor(s) disclaim responsibility for any injury to people or property resulting from any ideas, methods, instructions or products referred to in the content. |
© 2025 by the authors. Licensee MDPI, Basel, Switzerland. This article is an open access article distributed under the terms and conditions of the Creative Commons Attribution (CC BY) license (https://creativecommons.org/licenses/by/4.0/).
Share and Cite
Han, X.; Chen, Q.; Fu, D. Trends in Extreme Precipitation and Associated Natural Disasters in China, 1961–2021. Climate 2025, 13, 74. https://doi.org/10.3390/cli13040074
Han X, Chen Q, Fu D. Trends in Extreme Precipitation and Associated Natural Disasters in China, 1961–2021. Climate. 2025; 13(4):74. https://doi.org/10.3390/cli13040074
Chicago/Turabian StyleHan, Xinlei, Qixiang Chen, and Disong Fu. 2025. "Trends in Extreme Precipitation and Associated Natural Disasters in China, 1961–2021" Climate 13, no. 4: 74. https://doi.org/10.3390/cli13040074
APA StyleHan, X., Chen, Q., & Fu, D. (2025). Trends in Extreme Precipitation and Associated Natural Disasters in China, 1961–2021. Climate, 13(4), 74. https://doi.org/10.3390/cli13040074