Article

Beneficial Analysis of the Effect of Precipitation Enhancement on Highland Barley Production on the Tibetan Plateau Under Different Climate Conditions

1
State Key Laboratory of Severe Weather, Institute of Agro-Meteorology, Chinese Academy of Meteorological Sciences, Beijing 100081, China
2
Key Laboratory of Cloud-Precipitation Physics and Weather Modification, Weather Modification Centre, China Meteorological Administration, Beijing 100081, China
3
NSW Department of Primary Industries, Wagga Wagga Agricultural Institute, PMB, Wagga Wagga, NSW 2650, Australia
4
Climate Change Research Centre, University of New South Wales, Sydney, NSW 2052, Australia
5
Gulbali Institute (Agriculture, Water and Environment), Charles Sturt University, Locked Bag 588, Wagga Wagga, NSW 2678, Australia
6
Tibet Institute of Plateau Atmospheric and Environmental Research, Tibet Autonomous Meteorological Administration, Lhasa 850001, China
7
State Key Laboratory of Soil Erosion and Dryland Farming on the Loess Plateau, Institute of Water and Soil Conservation, Northwest A&F University, Xianyang 712100, China
*
Authors to whom correspondence should be addressed.
Climate 2025, 13(5), 83; https://doi.org/10.3390/cli13050083 (registering DOI)
Submission received: 17 March 2025 / Revised: 23 April 2025 / Accepted: 24 April 2025 / Published: 26 April 2025

Abstract

:
While highland barley on the Tibetan Plateau is adversely affected by water stress during its growth period, precipitation enhancement could potentially mitigate this issue. Accurate assessment of the benefits obtained through precipitation enhancement is crucial for local governments to develop policies for sustainable agriculture. To quantify these benefits, the WOFOST model was employed to evaluate the effects under four different precipitation enhancement scenarios. The model demonstrated strong performance, with a Nash–Sutcliffe Efficiency (NSE) of 0.93 and a root mean square error (RMSE) of 3.66. Using the calibrated WOFOST model, yield increases were simulated under three meteorological drought conditions classified by the Standardized Precipitation Evapotranspiration Index (SPEI). The results showed that yield increases were minimal during years with less rainfall, primarily due to a lower leaf area index under extreme meteorological drought conditions. Additionally, the impact of precipitation enhancement on yield increases was nonlinear. An enhancement of 5% had negligible effects, while enhancements greater than 10% led to significant increases. Specifically, precipitation enhancement during the reproductive stage resulted in regional yield increases of 170.7, 325.5, 465.9, and 580.5 kg/ha for enhancements of 5%, 10%, 15%, and 20%, respectively, surpassing yield increases from enhancements during the vegetative stage. This greater yield increase is attributed to highland barley’s sensitivity to water stress at critical growth stages and the unique climate conditions of the Tibetan Plateau. For Longzi—the largest base for highland barley production, with a planting area of 3440 ha in 2024—a 10% enhancement at the reproductive stage could yield an economic benefit of CNY 9.8 million. Under climate change scenarios, the decreasing trends in highland barley yields could be effectively offset by precipitation enhancement, highlighting the applicability of precipitation enhancement as an effective tool for mitigating climate change in Tibet. Future studies should integrate crop models with weather numerical models to better address uncertainties.

1. Introduction

Agricultural development enabled humans to adapt to the harsh conditions of the Tibetan Plateau as early as 5200 years ago [1]. Highland barley, with its diploid nature and adaptability to diverse environments, has become a staple food for Tibetans and is crucial for human habitation on the Tibetan Plateau [2]. However, the growth of highland barley is significantly constrained by water availability, as precipitation often falls short of the crop’s water demand in this high-elevation region [3]. In addition, climate change is presently posing a great threat to agricultural production and food security [4]. To address these issues, weather modification techniques, such as precipitation enhancement through cloud seeding, could be effective in increasing water availability for highland barley production [5]. Recent advancements, including the use of large unmanned aerial vehicles for cloud seeding over the Tibetan Plateau, highlight the need for accurate evaluation of the benefits brought by weather modification to guide sustainable agricultural policies. Accurate evaluation of weather modification-related benefits can provide basic information for the local government, which is important for making plans to achieve sustainable agriculture on the Tibetan Plateau.
Modern weather modification concepts were first introduced by Vincent Schaefer in the early 20th century [6]. Subsequent research and developments, including the use of dry ice and silver iodide for ice nucleation, have demonstrated the effectiveness of cloud seeding in enhancing precipitation [7]. The World Meteorological Organization (WMO) announced that an increasing number of countries are now planning or actually conducting weather modification activities [8]. In 2018, WMO experts confirmed that weather modification could effectively enhance precipitation in convective clouds, which is significant for regions such as the Tibetan Plateau, where convective clouds dominate [9].
Given that weather modification can affect areas as large as 50 km2 [5], traditional field experiments are often impractical for evaluating its effects on crop yields. Empirical models, such as those used by Huff et al. [10] to assess weather modification impacts on corn and soybeans, have limitations due to their lack of mechanistic detail. However, with increasing government investment in weather modification in China [11], there is a pressing need for accurate evaluations of the benefits of weather modification. Crop growth models, which simulate crop growth based on environmental factors and soil conditions [12], offer a promising approach for large-scale assessments of weather modification impacts.
The first crop growth model was developed in Wageningen [13] and has evolved significantly over the decades [14]. Modern crop models, such as WOFOST [15,16,17], DSSAT [18,19,20], and APSIM [21,22,23], are widely used to simulate the growth and yield of crops under varying conditions [12]. WOFOST, in particular, has demonstrated robustness and efficiency in simulating crop yields under diverse conditions [24,25]. It has been successfully applied to crops such as wheat [26,27,28], maize [29,30,31], potato [32,33,34], and so on, and has shown promise in simulating highland barley yields under challenging conditions on the Tibetan Plateau [35]. While previous assessments of the benefits of weather modification in Tibet were based on subjective speculation, in this study, the WOFOST model was used to quantitatively evaluate the benefits to provide more accurate information for the local government. This type of evaluation will enhance the relevant knowledge for a beneficial assessment of precipitation enhancement.
The Lhasa and Longzi regions, located in the southeastern Tibetan Plateau, are major highland barley production areas in China due to their unique climate conditions [35]. Longzi, with the largest highland barley production area in China, has seen several weather modification operations since 2020, aimed at enhancing precipitation for higher barley yields. However, a quantitative assessment of the benefits of these operations is still lacking and is urgently needed by local authorities.
In this study, based on four assumed scenarios of precipitation enhancement, the WOFOST model was calibrated and used to investigate the effects of weather modification on crop yields and economic benefits in Tibet, especially in the Longzi region. This study aims to (1) develop a methodology to quantitatively evaluate the benefits of weather modification on highland barley production over the Tibetan Plateau and (2) identify optimal weather modification strategies to maximize net profits and support sustainable agricultural development in these regions.

2. Materials and Methods

2.1. Study Area

The study area encompasses the Lhasa and Longzi regions in the Tibet Autonomous Region. These are key production areas for highland barley in China. Located in the southeastern part of the Tibet Autonomous Region (27–31° N, 89–95° E), this region features a diverse climate due to its extensive altitude range, from 100 to 7600 m above sea level (m a.s.l.) (Figure 1). In Tibet, highland barley is usually cultivated at an elevation of 2500–4500 m a.s.l. [36], with Longzi County being the largest production base, covering 3440 ha in 2024. Detailed weather station information is provided in Table 1.
Highland barley is usually sown in March. The flowering dates are usually in June and July, and the maturity dates are in late July and August. The water demand for highland barley is 389 mm [3]. For most of the eight stations, the local precipitation during the growth period is much lower than the water demand (Table 1). The variety used in this study is Dongqing, a cold-resistant variety widely used in Tibet. Dongqing is especially sensitive to drought, making irrigation essential during its growth periods, especially at the reproductive stage from June to August.

2.2. Data Collection and Processing

The experiments were conducted in Lhasa and Naidong agro-meteorological stations. The highland barley was sown in March and harvested in August. According to the local irrigation pattern, the first irrigation was carried out at the emerging stage, and the second irrigation was carried out at the jointing stage. The third irrigation was conducted at the flowering stage and is believed to be critical for yield formation. Phenological data and crop yield records are critical for calibrating and validating crop growth models. Phenological data were collected from Lhasa and Naidong as per the China Meteorological Administration (CMA) requirements. Related experiments were conducted in the period of 1980–1998. Several ecological indices, including the sowing date, the emerging date, the flowering date, and the maturity date, were strictly observed according to the relevant guidelines of the CMA. The biases in observation are no more than 3 days, according to the requirements of the CMA. Yield data for highland barley in Lhasa and Longzi were obtained from agricultural statistical reports. These datasets were randomly divided into two subsets: one for model calibration and the other for validation.
The historical daily meteorological variables, including solar radiation, sunshine hours, maximum and minimum temperatures, wind speed, and precipitation, were collected from weather stations from 1991 to 2020. The related data were provided by the National Meteorological Information Center (NMIC) in the China Meteorological Administration (CMA). As data quality plays a very important role in the research, the NMIC developed the TianQin Platform, a comprehensive meteorological data control system to ensure high data quality. Solar radiation, a key input for the WOFOST model, was only measured at Lhasa. Consequently, daily solar radiation was estimated using empirical equations based on the relationship between solar radiation and sunshine hours [37].
To preliminarily evaluate the benefits of precipitation enhancement under climate change conditions, climate data from global climate models (GCMs) under SSP245 and SSP585 were used as two typical climate change scenarios. As discrepancies might exist between different GCMs, multiple GCMs are regularly applied to reduce the related uncertainties. In this study, outputs from 22 GCMs were used; the detailed information on the GCMs is described in Table 2. The outputs of GCMs were downscaled to daily values for Longzi station according to the methods of Liu et al. [38,39]. First, the period from 1961 to 1990 was set as the base period, and the monthly data from GCMs were downscaled to Longzi station using the inverse distance weighted interpolation method. Then, bias correction was applied to the monthly values of climatic elements, and a stochastic weather generator was used to produce daily climate variables for Longzi station. Detailed information on the downscaling processes was described by Liu et al. [38]. The downscaled daily data from different GCMs for SSP245 and SSP585 climate change scenarios were validated against the baseline observations from 1961 to 1990; then, downscaled daily data were used to drive the WOFOST model to simulate yields of highland barley under different climate conditions.
Based on the previous operations of precipitation enhancement in Tibet, the most optimistic estimate was that the precipitation could be enhanced by 20%, while the most likely enhancement was believed to be 10%. Thus, four precipitation enhancement scenarios were simulated: 5%, 10%, 15%, and 20%. The effects of precipitation enhancement during different growth periods were examined by adding these enhancements to rainy days with multiplication factors of 0.05, 0.10, 0.15, and 0.20. The WOFOST model was first run using actual meteorological data and then with data modified to include precipitation enhancements. Yield increases were calculated as the difference between yields from these two simulations.

2.3. Description of the WOFOST Model

The WOFOST model is a dynamic crop simulation model that incorporates physiological processes such as phenological development, CO2 assimilation, growth and maintenance respiration, and assimilation allocation [24]. It simulates dry matter accumulation as a function of crop properties and environmental conditions, including soil water balance, which is influenced by precipitation, soil evaporation, plant evapotranspiration, surface runoff, and ponding. WOFOST is widely recognized for its ability to simulate crop growth and yield under water-limited conditions [25,31,40]. For more detailed information, refer to Boogaard et al. [16].

2.4. Calculation of SPEI

SPEI combines precipitation and potential evapotranspiration to assess meteorological drought conditions spatially and temporally [41]. As SPEI considers the comprehensive effects of both precipitation and evapotranspiration, it is sensitive to the variations in both precipitation and temperature under climate change scenarios. Thus, SPEI is widely used as an effective tool for identifying meteorological drought conditions under different climate backgrounds [41,42,43]. According to the relevant definition [42], the difference Dj between the monthly precipitation and potential evapotranspiration of month j is calculated as
D j = P j P E T j
where Dj and PETj are precipitation and potential evapotranspiration in month j, respectively. The accumulated difference D i , j k at the k-month time scale for year i can be expressed as follows:
D i , j k = l = 13 k + j 12 D i 1 , l + l = 1 j D i , l           j < k l = j k + 1 j D i , l                               j k
The probability distribution function of D series can be expressed as
F x = 1 + α x γ β 1
where α, β, and γ are the scale, shape, and origin parameters of the distribution function, respectively. Let P = 1 − F(x). When P ≤ 0.5, the value of SPEI can be calculated as
W = 2 ln P
S P E I = W C 0 + C 1 W + C 2 W 2 1 + d 1 W + d 2 W 2 + d 3 W 3
When P > 0.5, SPEI can be estimated by
W = 2 ln 1 P
  S P E I = C 0 + C 1 W + C 2 W 2 1 + d 1 W + d 2 W 2 + d 3 W 3 W
where the parameters of C0, C1, C2, d1, d2, and d3 are 2.515517, 0.802853, 0.010328, 1.432788, 0.189269, and 0.001308, respectively. For a detailed explanation of the method for SPEI calculation, one can refer to the relevant materials [42,43]. Because a 90-day (3-month) time scale for SPEI has been shown to adequately monitor soil moisture and agriculture drought [43], the daily SPEI data were calculated over a 3-month time scale in this study.

2.5. Beneficial Analysis

Various factors, such as government investment, farmer input, and local agricultural technology, significantly influence economic benefits. However, accounting for all these factors would complicate the analysis and make it difficult to isolate the benefits of precipitation enhancement. To simplify the analysis, the economic benefits from precipitation enhancement were defined as
                      B n = A p × Y c × P r C  
where Bn is the economic benefit from precipitation enhancement, Ap is the planting area (ha), Yc is the yield increase (kg/ha), Pr is the price of highland barley (CNY/kg), and C is the cost of precipitation enhancement operations (CNY). It was assumed that precipitation enhancement operations occurred three times during the growing period, with six rockets launched each time. The cost of each rocket was set as CNY 3000, based on 2024 prices, and the price of highland barley was set as 6 CNY/kg. The yield increase was derived from the simulation results. Thus, the economic benefit was modeled as a linear function of the planting area.

2.6. Statistical Analysis

NSE and RMSE were used to evaluate the performance of the WOFOST model [35,44].
N S E = 1 i = 1 n O i S i 2 i = 1 n O i O ¯ 2
R M S E = 1 n i = 1 n O i S i 2 1 / 2  
where Oi is the observed value, Si is the estimated value, O ¯ is the average of the observed value, and n is the sample number of observations. Higher NSE and lower RMSE mean better model performance.
Trends in time series of SPEI were estimated by the nonparametric Theil–Sen estimator [45].
β = M e d i a n X j X i j i , i < j
where Xi and Xj are the SPEI values for year i and j, respectively. The trend significance was tested by Mann–Kendall method. For detailed information on calculating the standardized test statistic (z) for the MK method, one can refer to the relevant descriptions [46,47]. In addition, the Hurst exponent index was also used to analyze potential future changes in SPEI; information on the Hurst exponent index can be found in the relevant reference [48].

3. Results

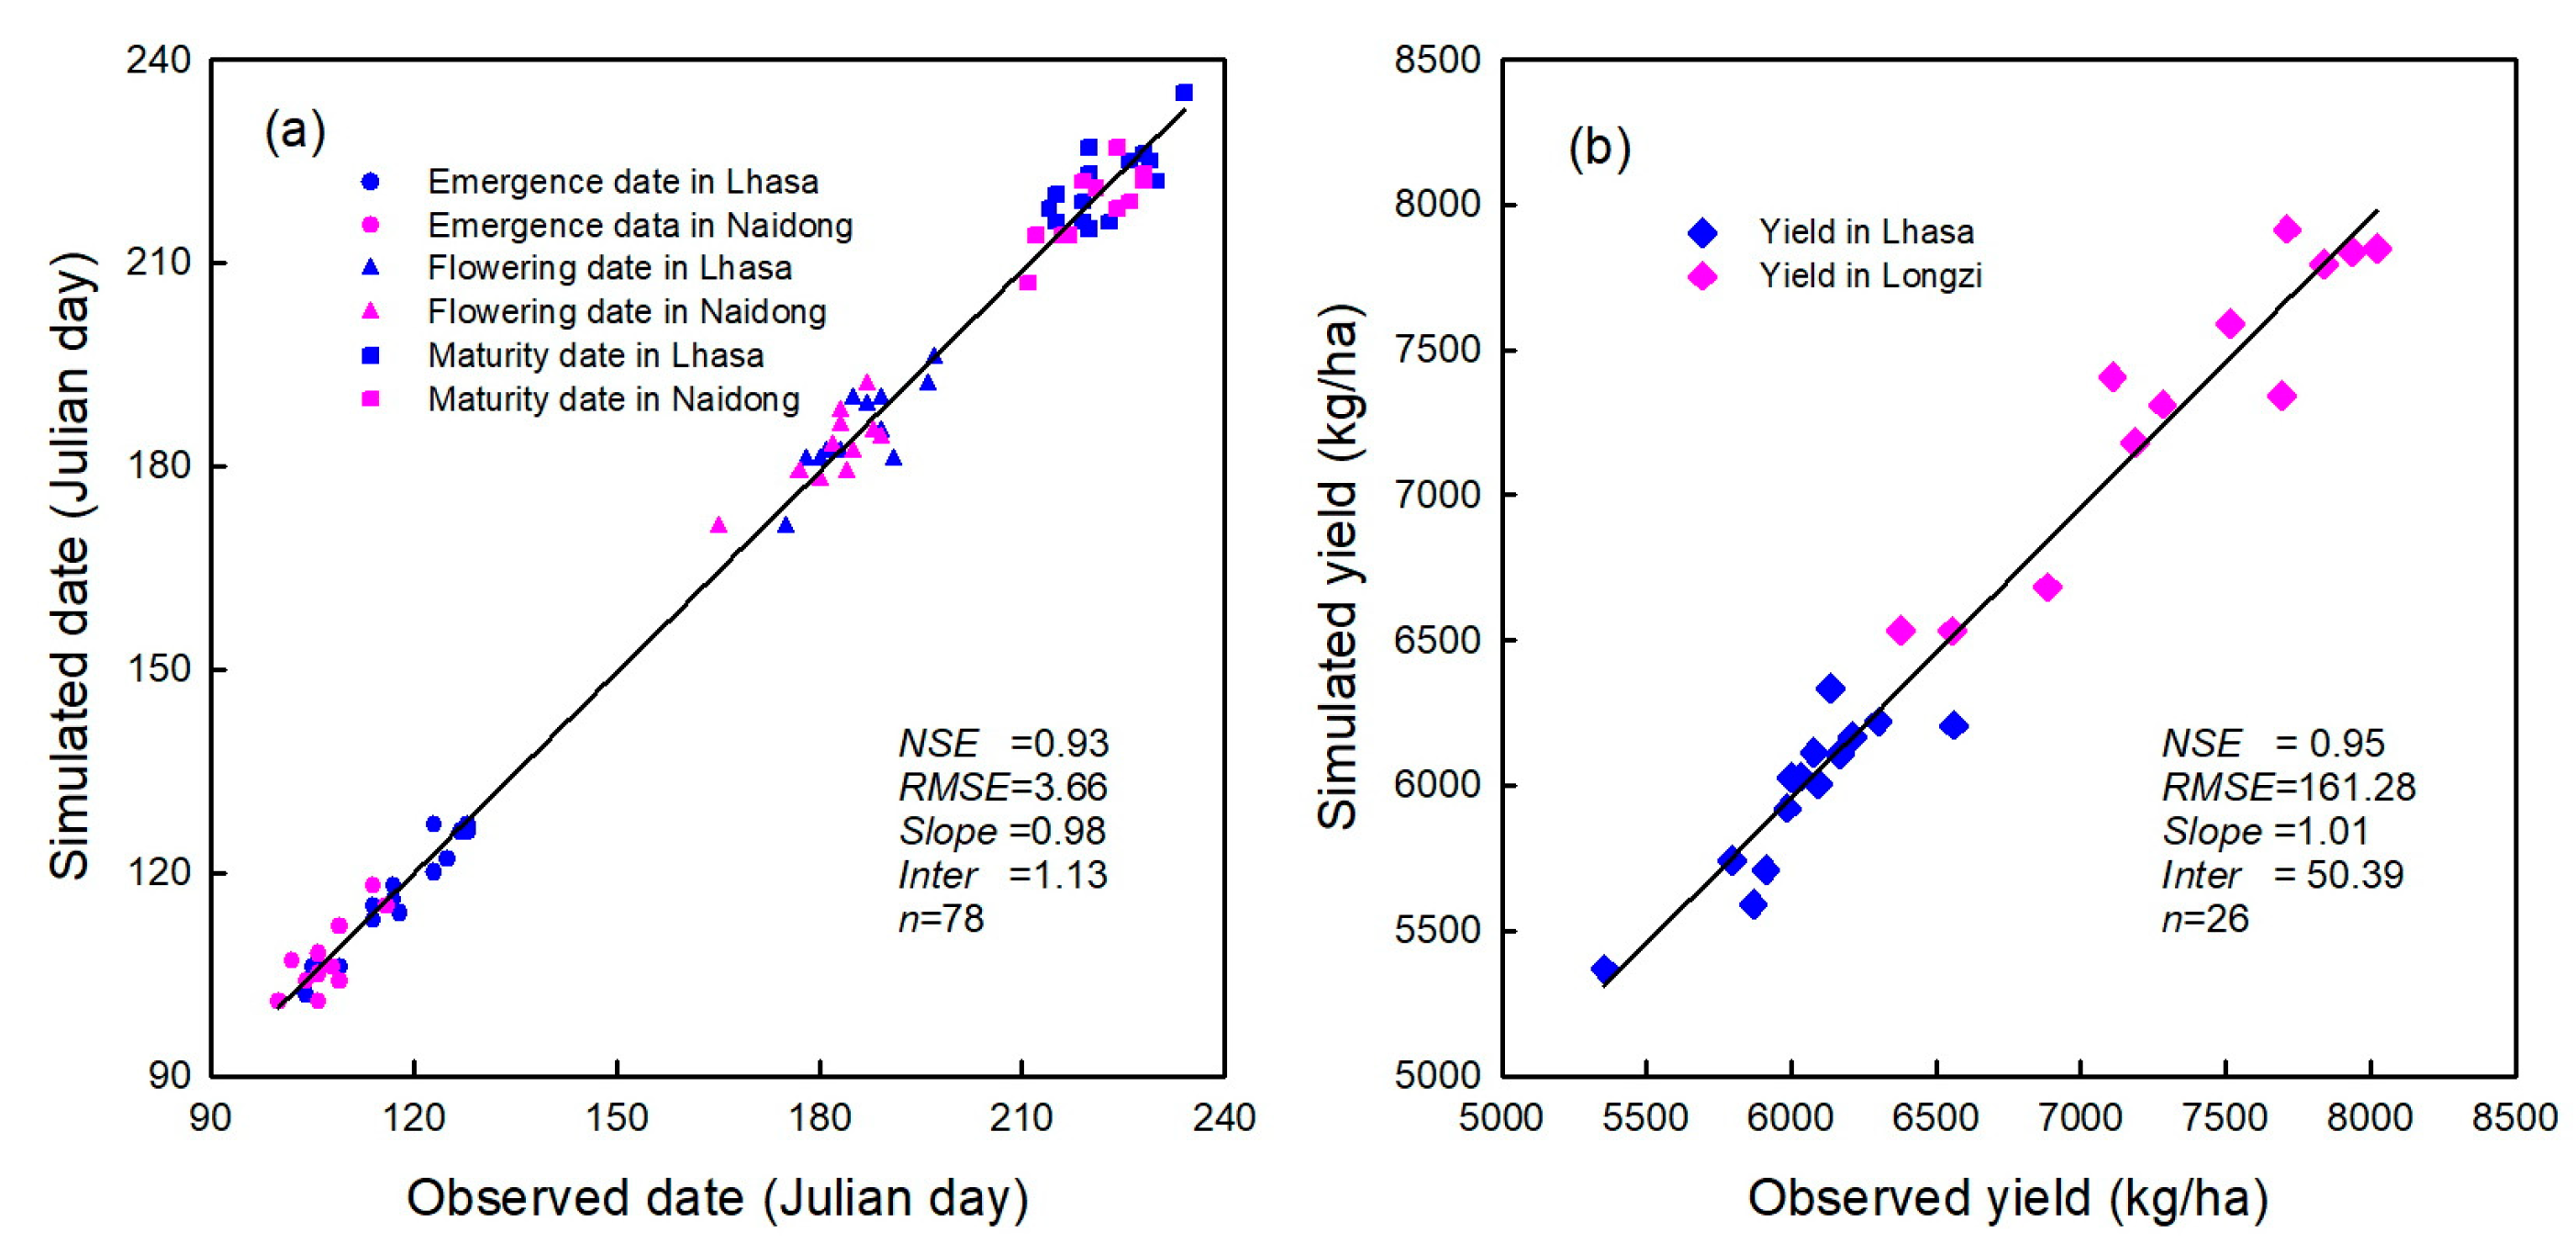
3.1. Calibration and Validation of the WOFOST Model

The WOFOST model was calibrated using phenological data from Lhasa and Naidong through a trial-and-error approach. Key parameters for emergence were established, with the low threshold temperature set at 0 °C and the maximum effective temperature set at 30 °C. Three critical temperature sums for crop growth—sowing to emergence, emergence to anthesis, and anthesis to maturity—were determined by the trial-and-error approach as 96.9, 1067.4, and 578.6 °C, respectively. The calibrated model was then validated using independent datasets, with results presented in Figure 2.
In the study area, highland barley is typically sown in March, with emergence occurring between early April and early May, anthesis in July, and maturity from late July to August. The calibrated WOFOST model accurately captured these phenological stages (Figure 2a), achieving an NSE of 0.93 and an RMSE of 3.66. The regression analysis between observed and simulated dates yielded a slope of 0.98, close to the ideal value of 1, and an intercept of just 1.13, indicating strong model accuracy. These results confirm the model’s effective calibration with local phenological data.
The model also demonstrated excellent performance in simulating yield differences influenced by water availability. As Longzi generally receives more water from irrigation than Lhasa during the anthesis-to-maturity period, higher yields are typically observed in Longzi. This pattern was well represented in the simulation results (Figure 2b), reflecting the model’s ability to account for water conditions under the Tibetan Plateau’s climate. Validation metrics for yield simulations included an NSE of 0.95 and an RMSE of 161.28 kg/ha; the average yield of highland barley in the experiment was 6638.27 kg/ha, and the relative error was only 2.4%, demonstrating the WOFOST model’s robust capacity to simulate highland barley yields in the Lhasa and Longzi regions.

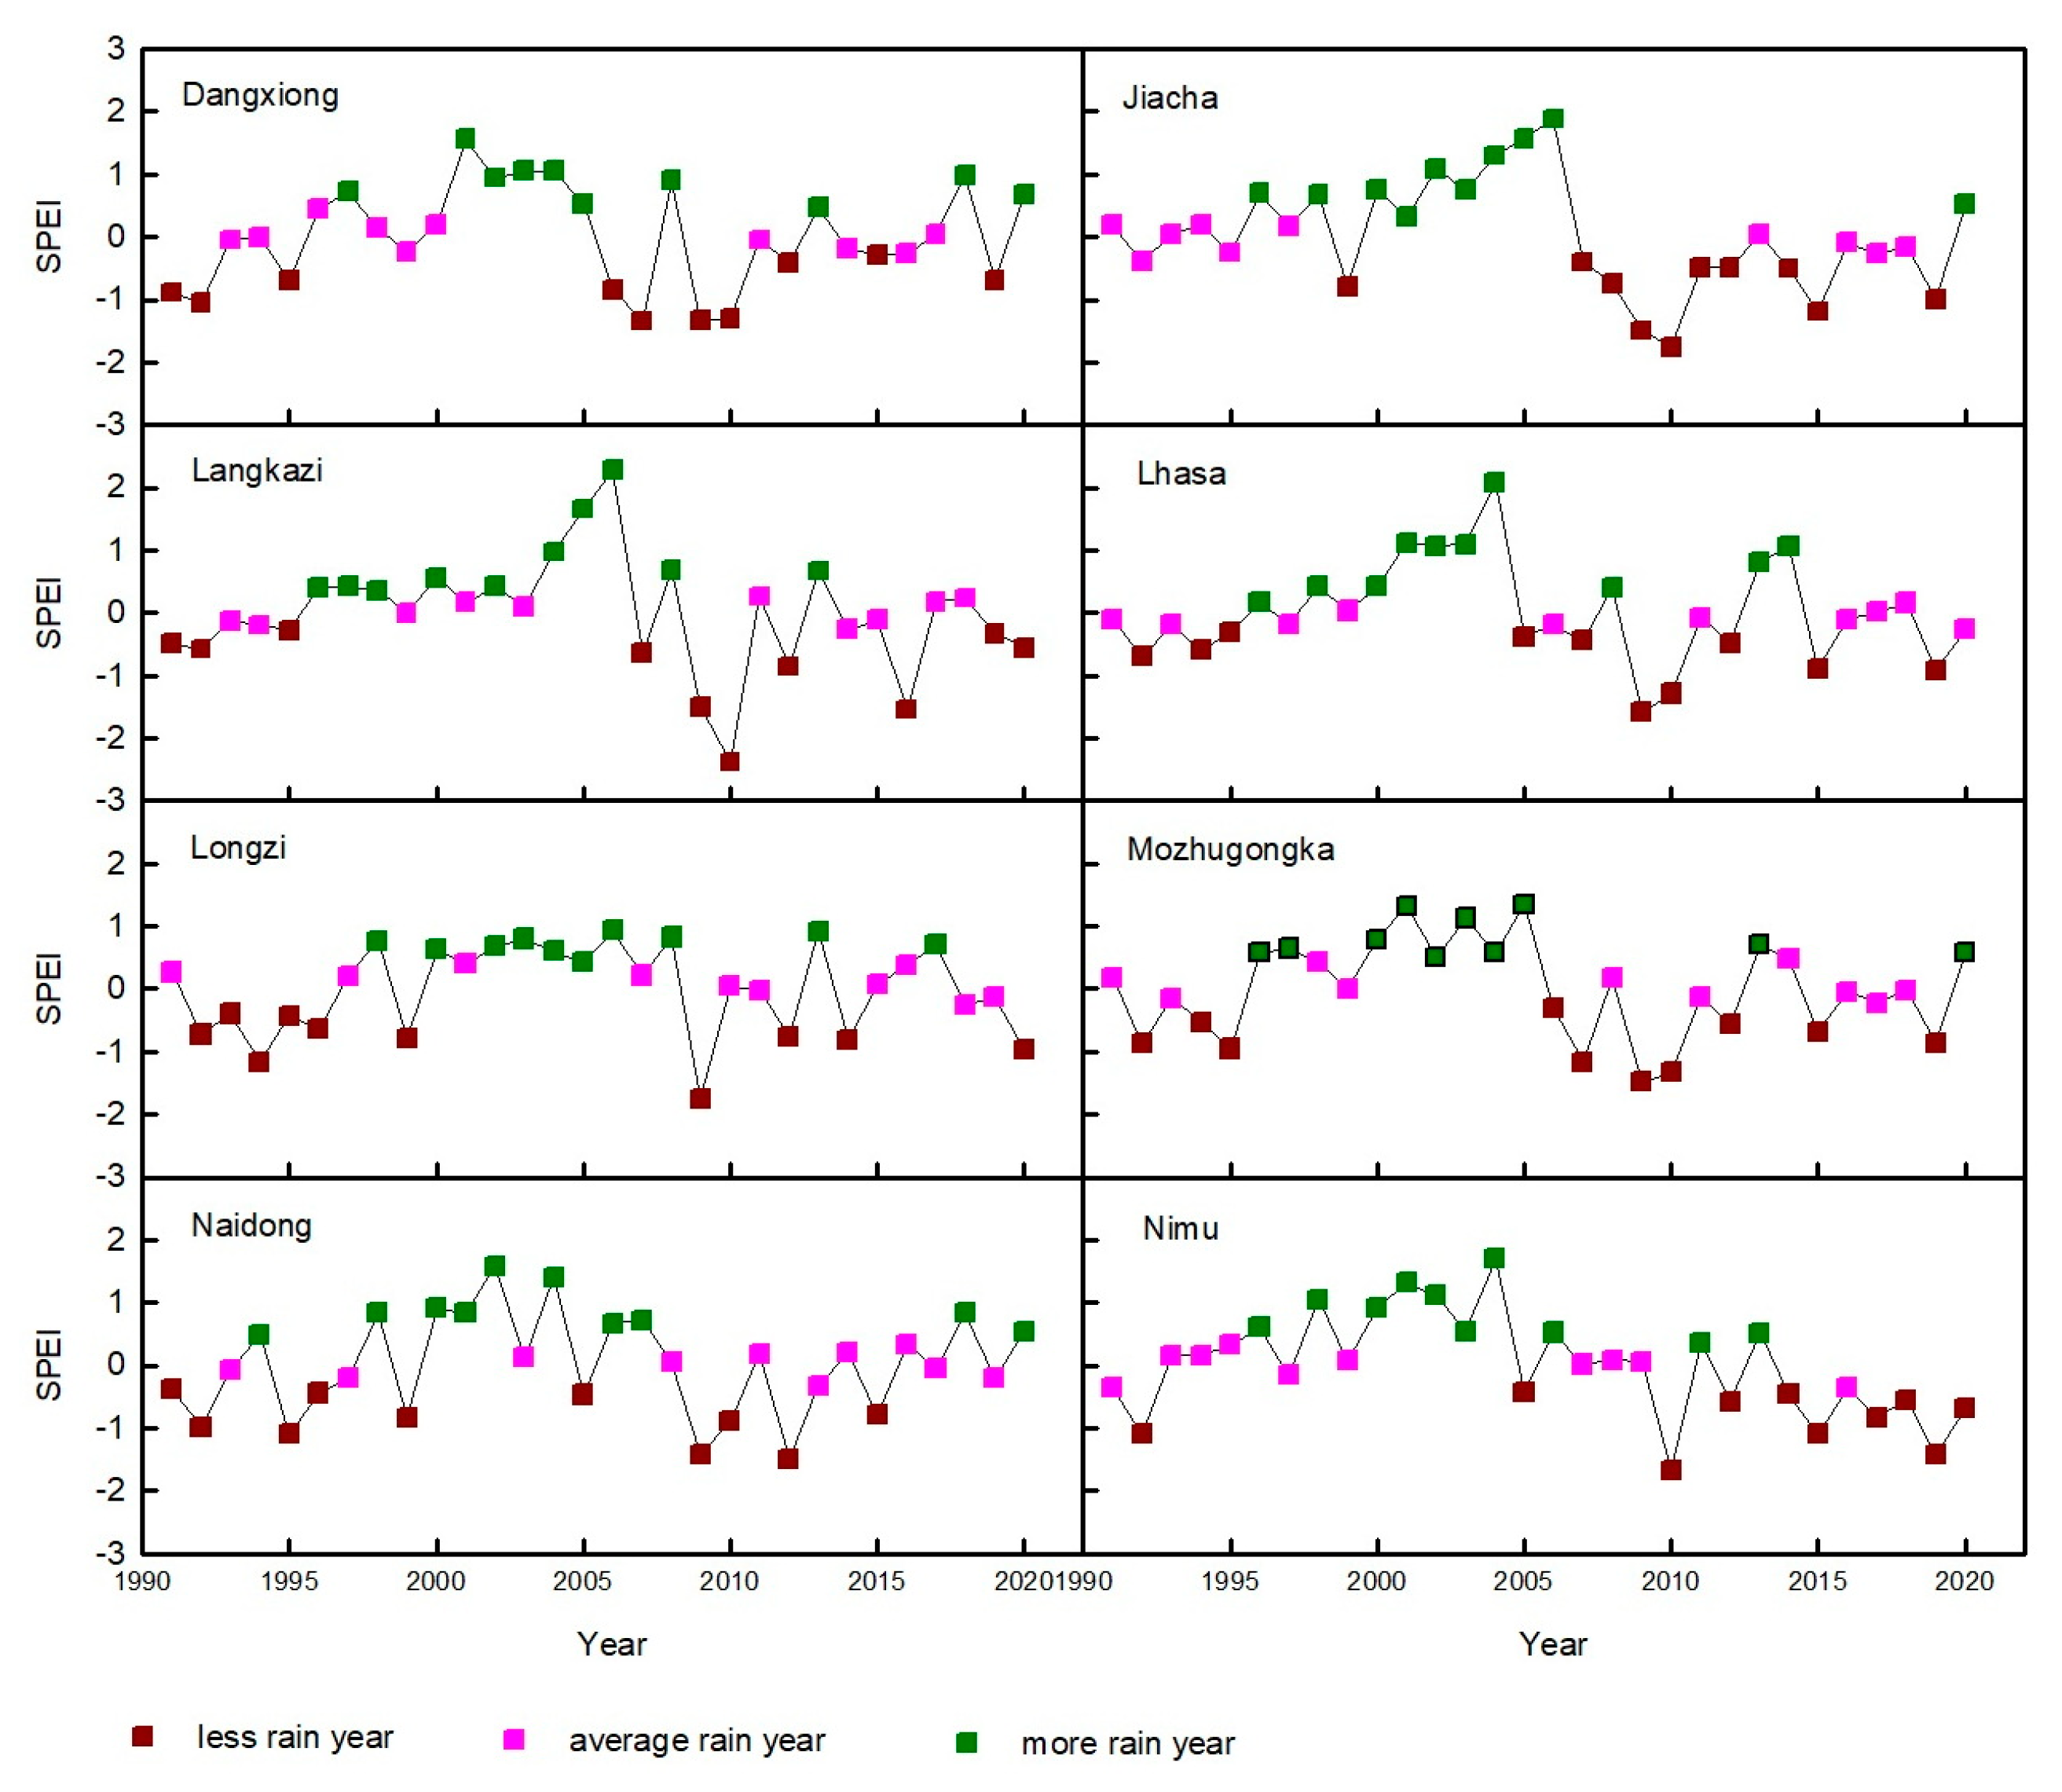
3.2. Analysis of Drought Conditions by SPEI Index

Changes in SPEI reflect variations in meteorological drought. Monthly SPEI values at a three-month scale were calculated for the period from January 1991 to December 2020 (Figure 3), revealing distinct patterns of meteorological drought across the stations, albeit with varying intensities. No extreme droughts (SPEI ≤ −3) were recorded at Dangxiong, Longzi, Naidong, or Nimu. In contrast, one extreme drought was observed in Jiacha (March 1999) and Mozhugongka (March 2006), two in Langkazi (January 2001 and March 2010), and three in Lhasa (March 2006, March 2016, and July 2018). The SPEI variations in Longzi were notably different from those in Lhasa, where more frequent extreme droughts and pronounced fluctuations in SPEI were identified.
Highland barley’s main growing period in Lhasa and Longzi spans April to August. During this period, monthly SPEI values were averaged to assess drought severity. Annual classifications were then assigned based on SPEI values: drought year, normal year, and moisture year. It is essential to note that these classifications reflect meteorological drought conditions without accounting for crop water demand. In Lhasa and Longzi, available water for crop growth often falls short of crop requirements, resulting in annual agricultural droughts of varying severity. To avoid confusion, the classifications were renamed as “less rain year”, “average rain year”, and “more rain year”, respectively. Compared to the monthly SPEI, the growth-period SPEI showed reduced variation, with no extreme droughts observed at any station (Figure 4).
Trend analysis of annual SPEI indicated a worsening drought trend over the past three decades at all stations except Longzi (Table 3). Significant decreases in SPEI were observed at Lhasa, Jiacha, and Nimu, with absolute Z values of 1.945 (90% confidence level), 2.212 (95% confidence), and 3.104 (99% confidence), respectively. Hurst exponent analysis suggested that these decreasing trends are likely to persist in the near future.
In contrast, growth-period SPEI trends differed from annual SPEI trends. Decreasing trends in growth-period SPEI were identified at only five of the eight stations, with a significant decrease observed solely at Nimu. This discrepancy highlights that climatic trend analysis of annual SPEI may have limited applicability for agricultural purposes. Evaluating drought trends during critical growth periods is more relevant for informing agricultural decision-making.

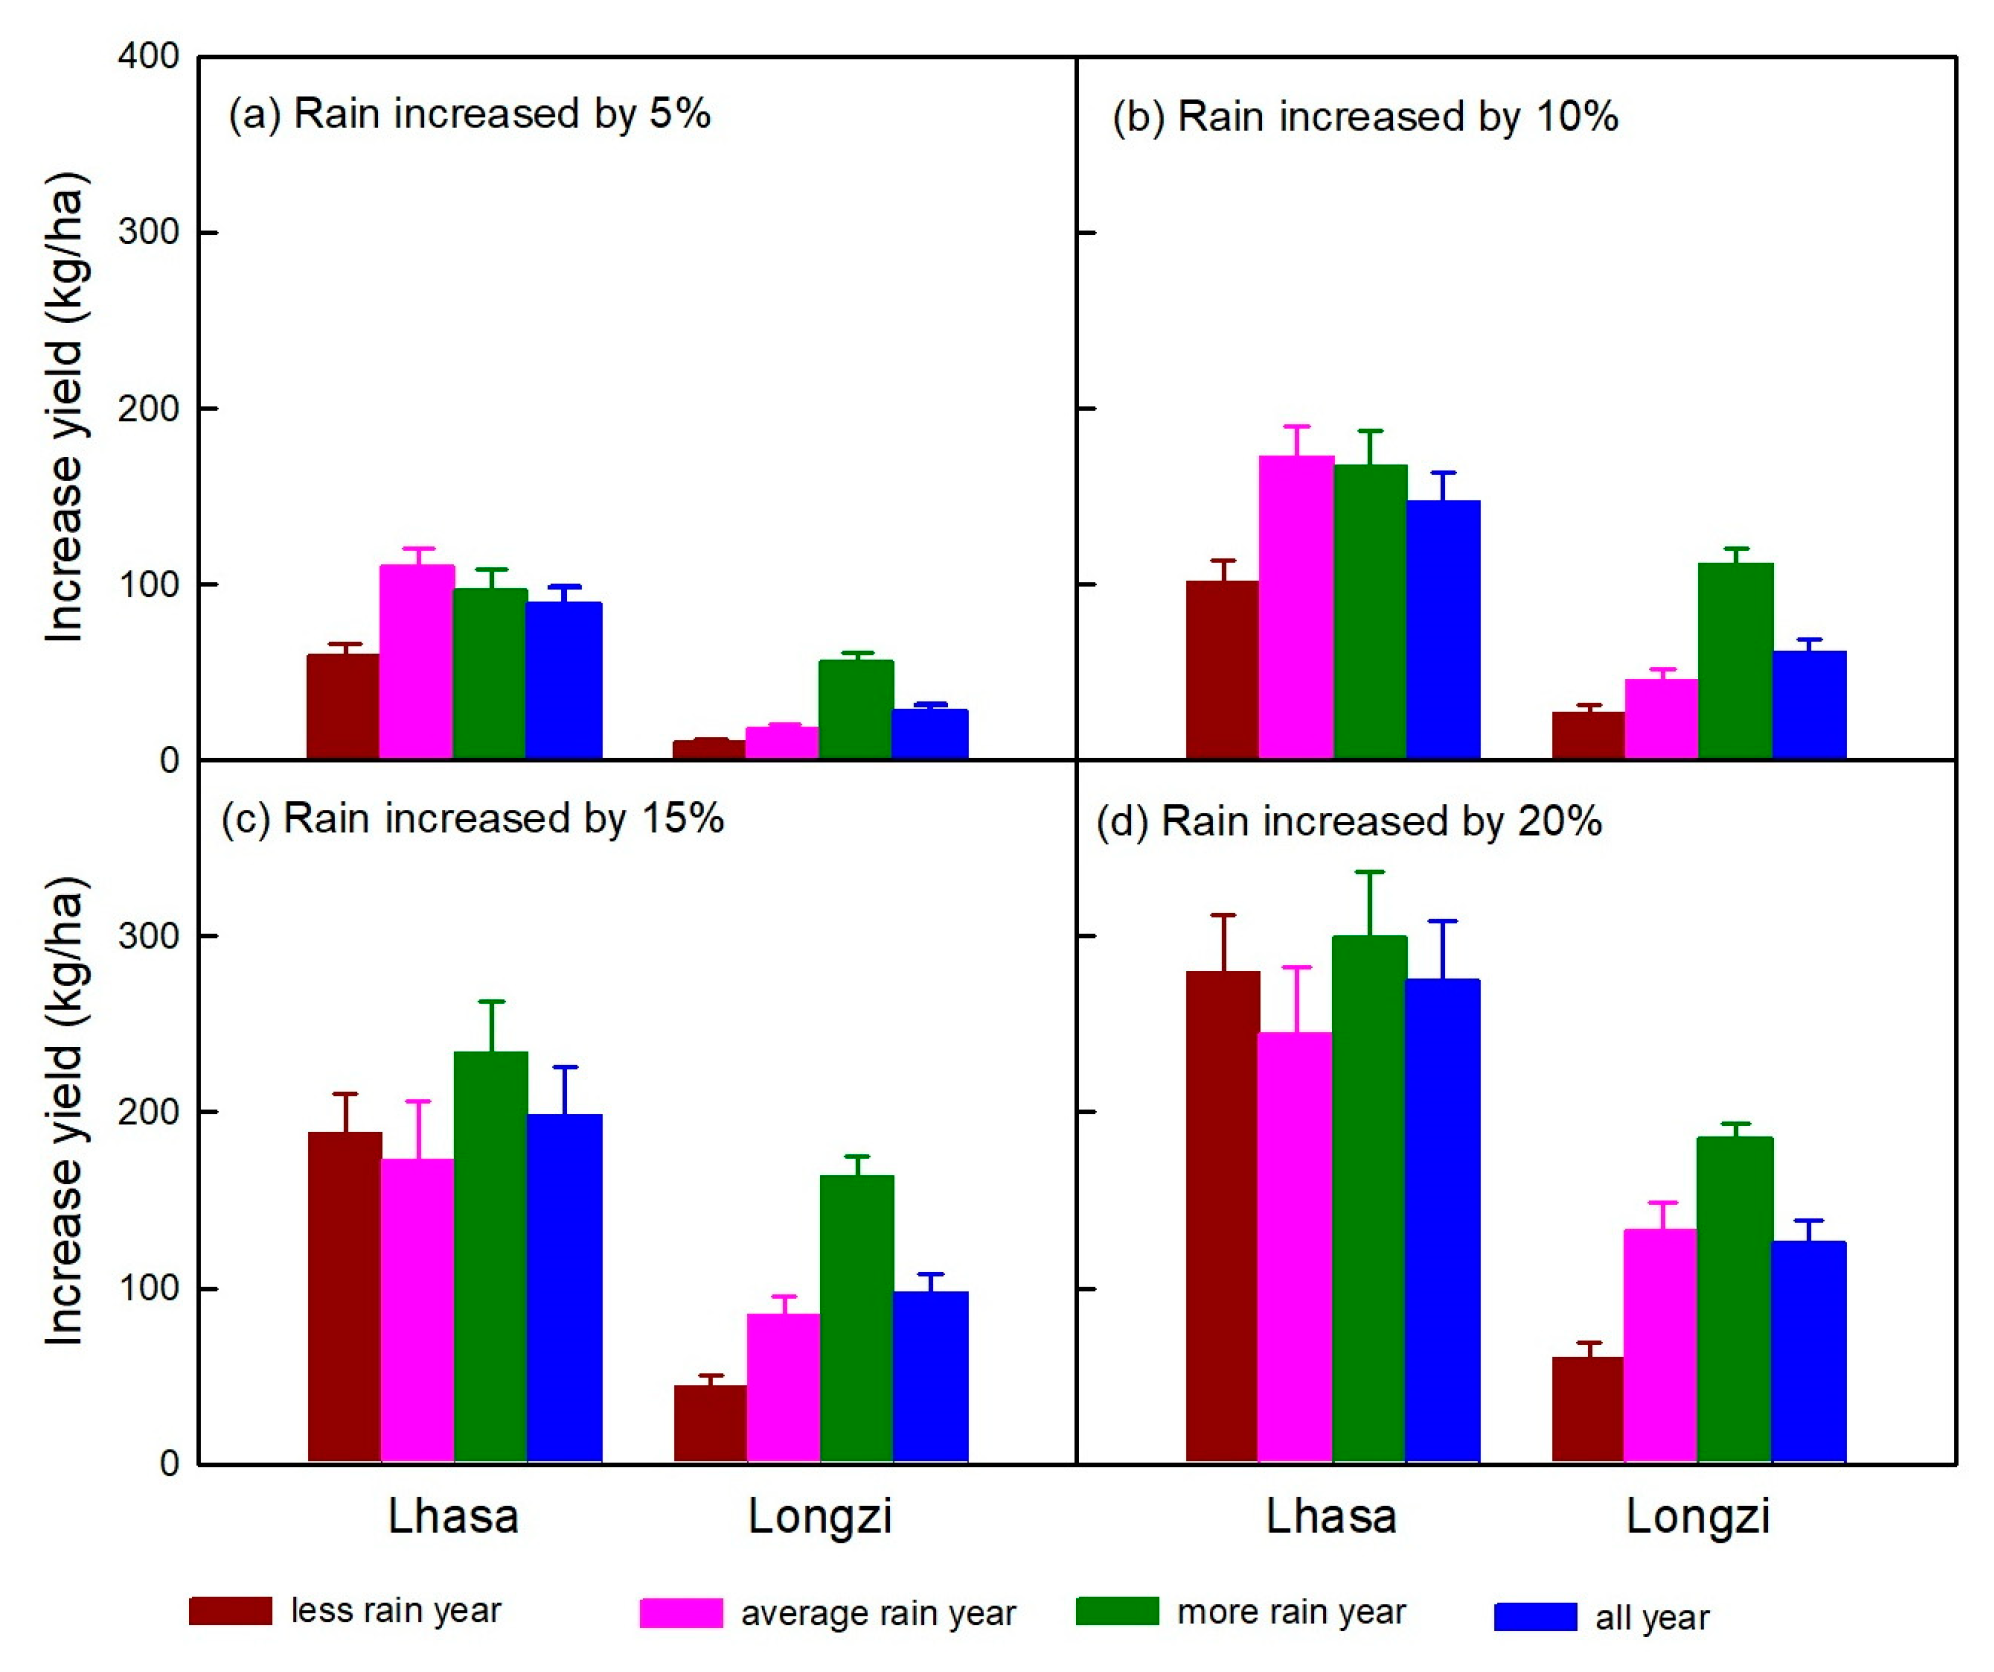
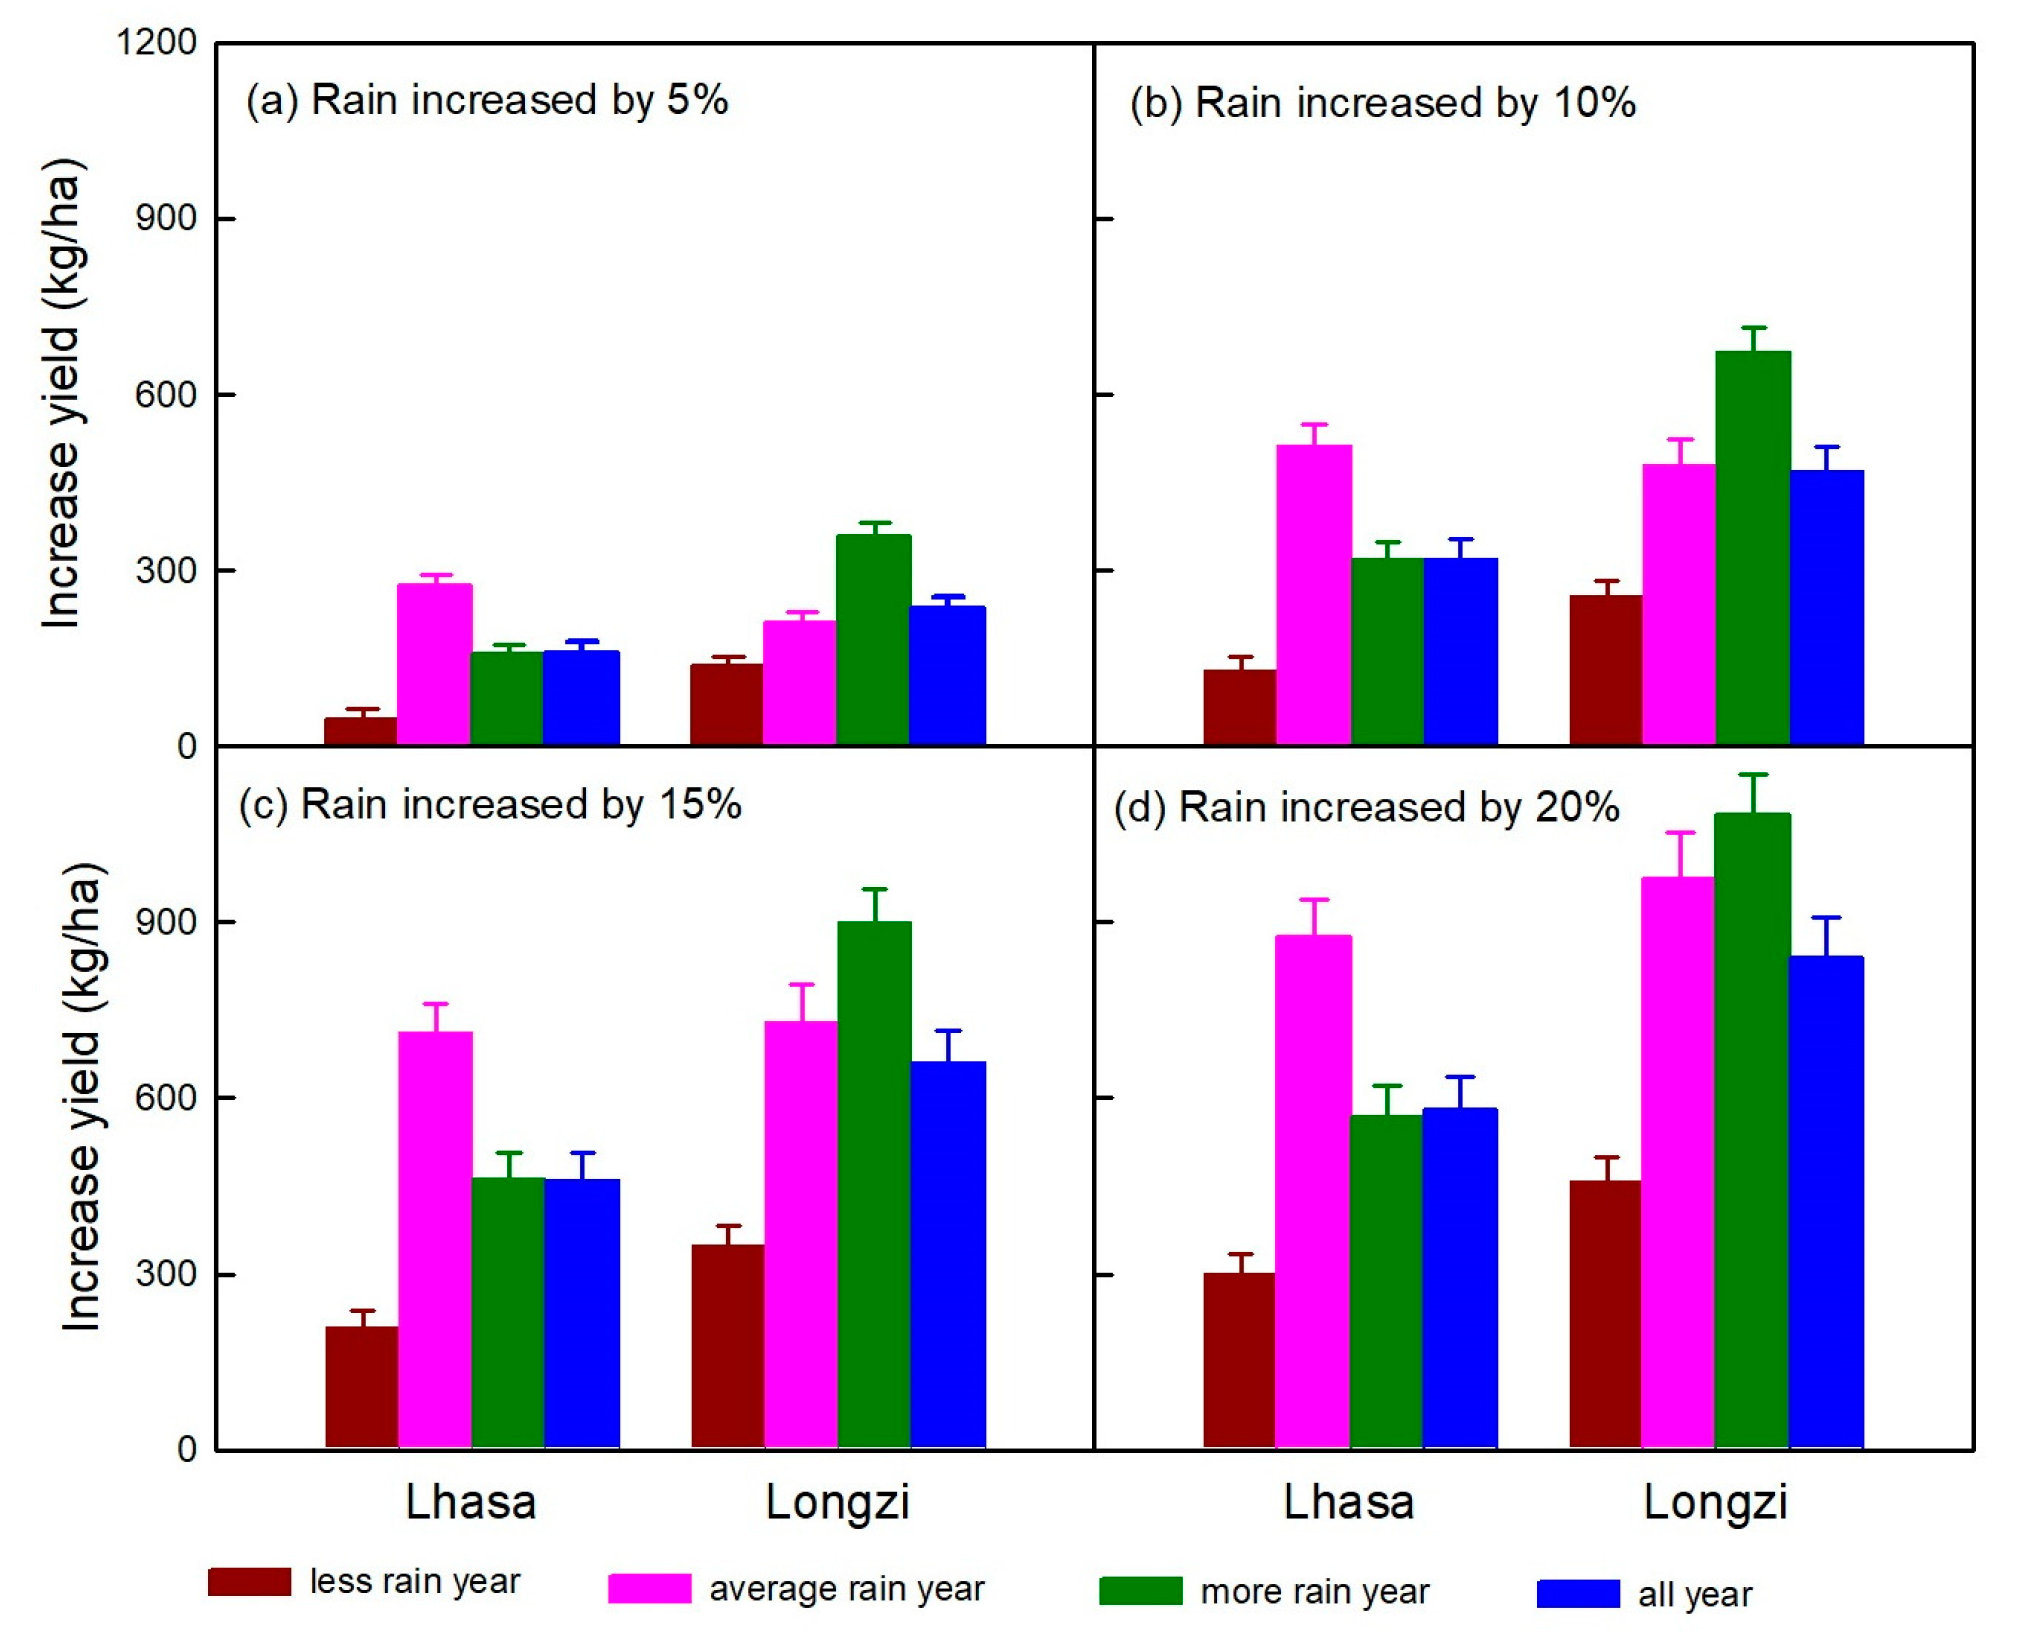
3.3. Effect of Precipitation Enhancement on Highland Barley Yields Under Different Drought Conditions

To assess the impact of precipitation enhancement on highland barley yields during different growth stages, precipitation increases were simulated separately for the vegetative and reproductive stages. Given the distinct drought characteristics of Lhasa and Longzi, these stations were selected for analysis under varying drought conditions.
When precipitation was enhanced during the vegetative period, highland barley yields increased in both Lhasa and Longzi under all drought scenarios. Generally, the yield gains became more pronounced with higher levels of precipitation enhancement (Figure 5). However, the yield responses varied depending on drought conditions and enhancement scenarios. For example, in Longzi, yield increases in less rain years exceeded those in average rain years under 15% and 20% precipitation enhancements. Conversely, under 5% and 10% enhancement scenarios, yield increases in less rain years were lower than those in average rain years. In Lhasa, the relationship between different meteorological drought conditions and yield increases was more straightforward. Across all precipitation enhancement scenarios, the smallest yield increases occurred in less rain years, while the largest yield increases were observed in more rain years. On average, yield increases in Lhasa ranged from 89.1 to 274.7 kg/ha, with an average standard deviation of 15.75 kg/ha, whereas in Longzi, they ranged from 28.1 to 126.3 kg/ha, with an average standard deviation of 6.03 kg/ha.
Precipitation enhancements during the reproductive stage also led to yield increases across all drought conditions and enhancement scenarios, with patterns similar to those observed during the vegetative stage (Figure 6). In Longzi, the smallest yield increases occurred in less rain years, while the largest increases were observed in average rain years. In Lhasa, the response of yield increases to different meteorological drought conditions remained consistent with the vegetative stage, with the lowest increases in less rain years and the highest in more rain years. Notably, yield increases resulting from precipitation enhancements during the reproductive stage were significantly larger than those during the vegetative stage. On average, yield increases in Lhasa ranged from 160.1 to 581.3 kg/ha, with an average standard deviation of 29.25 kg/ha, while in Longzi, they ranged from 235.9 to 839.3 kg/ha, with an average standard deviation of 36.50 kg/ha. These findings highlight the critical role of precipitation during the reproductive stage in improving highland barley yields, particularly under the variable climatic conditions of the Tibetan Plateau.

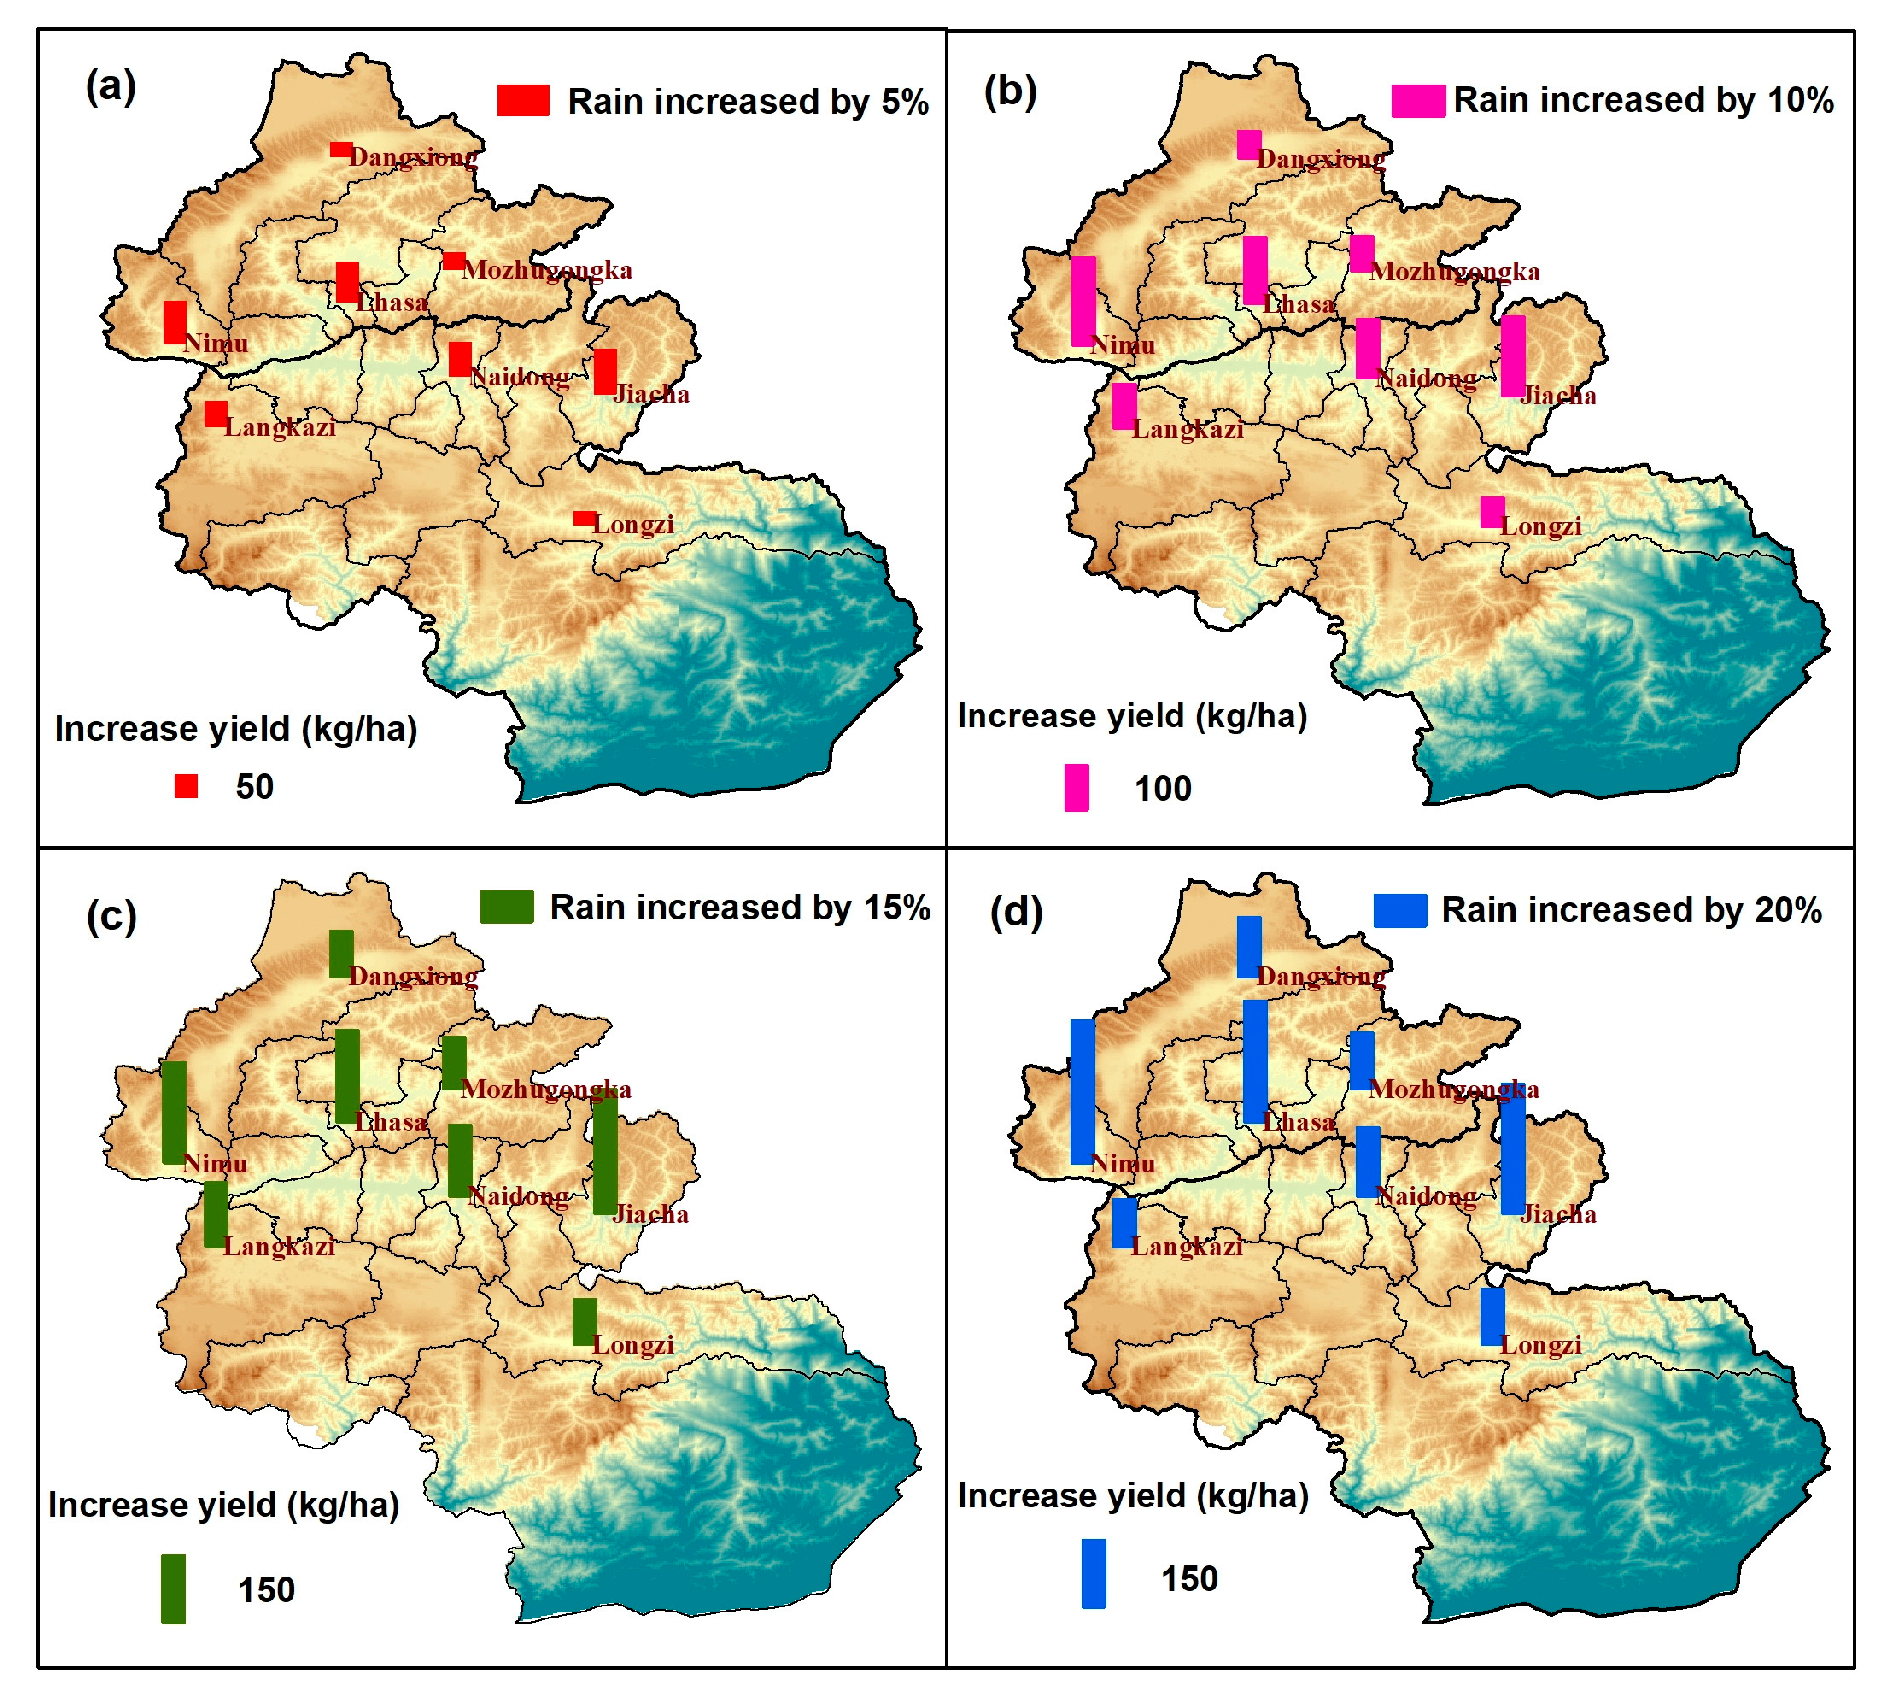
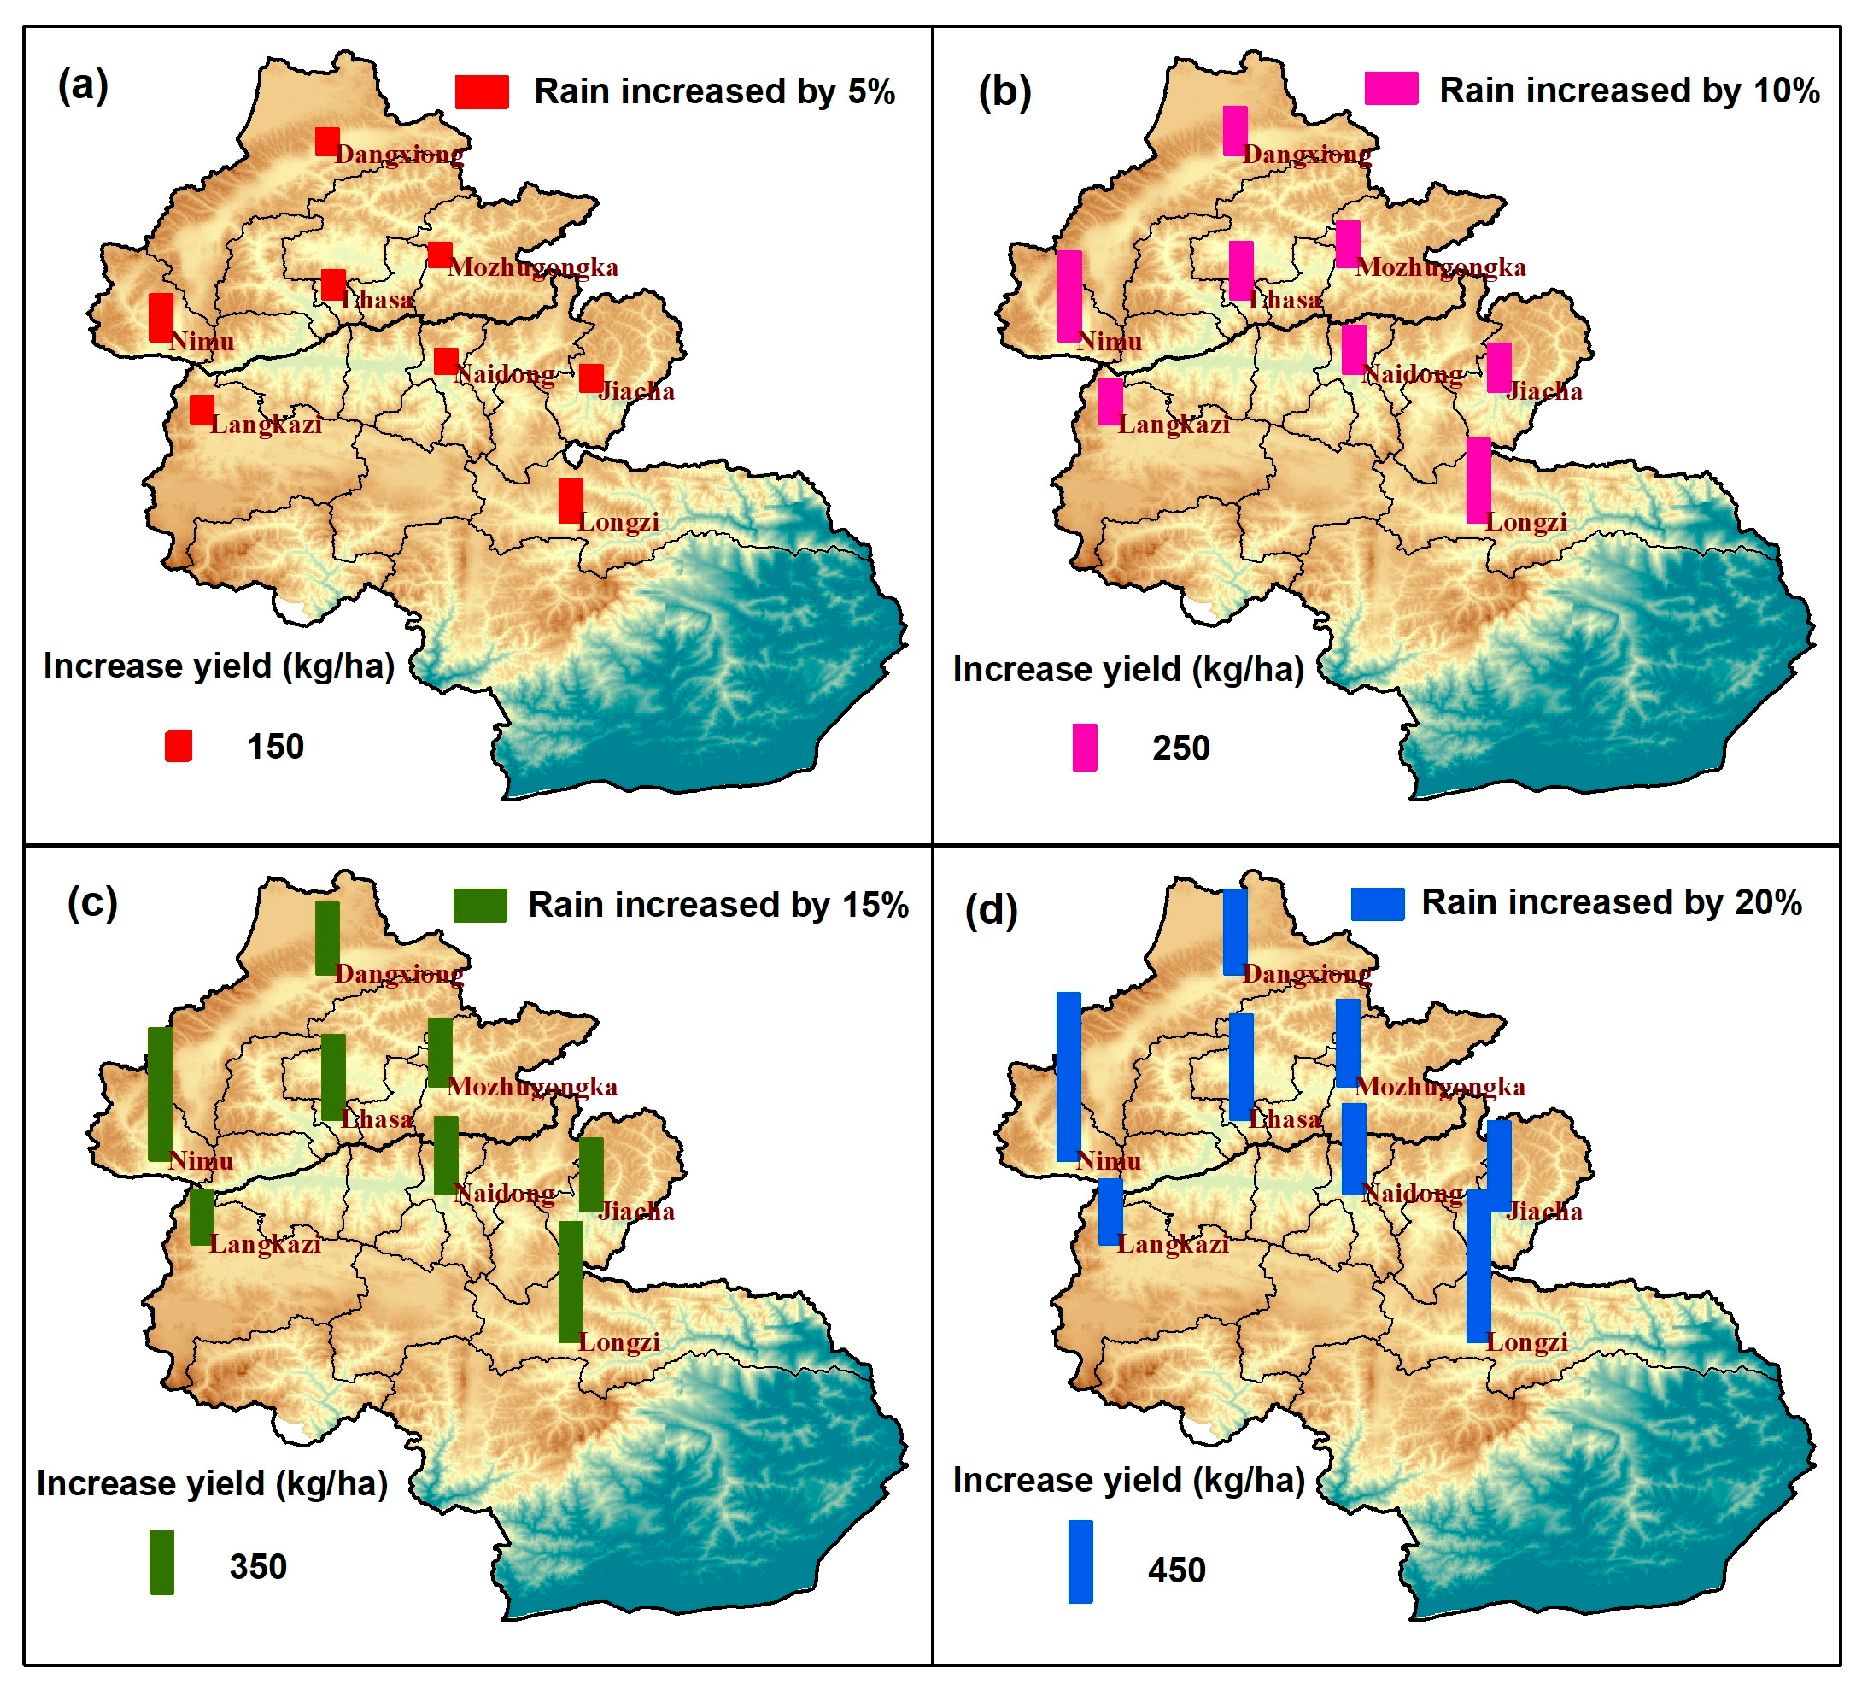
3.4. Spatial Distribution of Yield Increase Under Different Precipitation Enhancement Scenarios

When precipitation was enhanced during the vegetative stage, highland barley yields increased across all locations under all precipitation enhancement scenarios (Figure 7). Under the 5% precipitation enhancement scenario, yield increases were modest, ranging from 30.5 kg/ha in Dangxiong to 99.4 kg/ha in Jiacha, with an average regional increase of 63.6 kg/ha (Figure 7a). In contrast, with a 10% precipitation enhancement, yields increased significantly, ranging from 62.2 kg/ha in Longzi to 195.6 kg/ha in Nimu, with an average regional increase of 118.5 kg/ha (Figure 7b). Further precipitation enhancements resulted in continued but smaller increases. The regional average yield increases were 161.9 kg/ha and 193.8 kg/ha for 15% and 20% enhancements, respectively (Figure 7c,d).
During the reproductive stage, precipitation enhancement led to even higher yield increases across all stations, surpassing the increases gained during the vegetative stage (Figure 8). For instance, under the 5% precipitation enhancement scenario, yield increases ranged from 131.9 kg/ha to 260.8 kg/ha, substantially higher than the corresponding increases during the vegetative stage. Additionally, the average regional yield increases were 170.7 kg/ha, 325.5 kg/ha, 465.9 kg/ha, and 580.5 kg/ha under the 5%, 10%, 15%, and 20% enhancement scenarios, respectively. Unlike the vegetative stage, there was no decrease in the rate of yield increase with higher precipitation enhancements at the reproductive stage.
These findings indicate that precipitation enhancements during the reproductive stage have a significantly greater impact on highland barley yields, highlighting the critical importance of this growth phase for yield improvement.

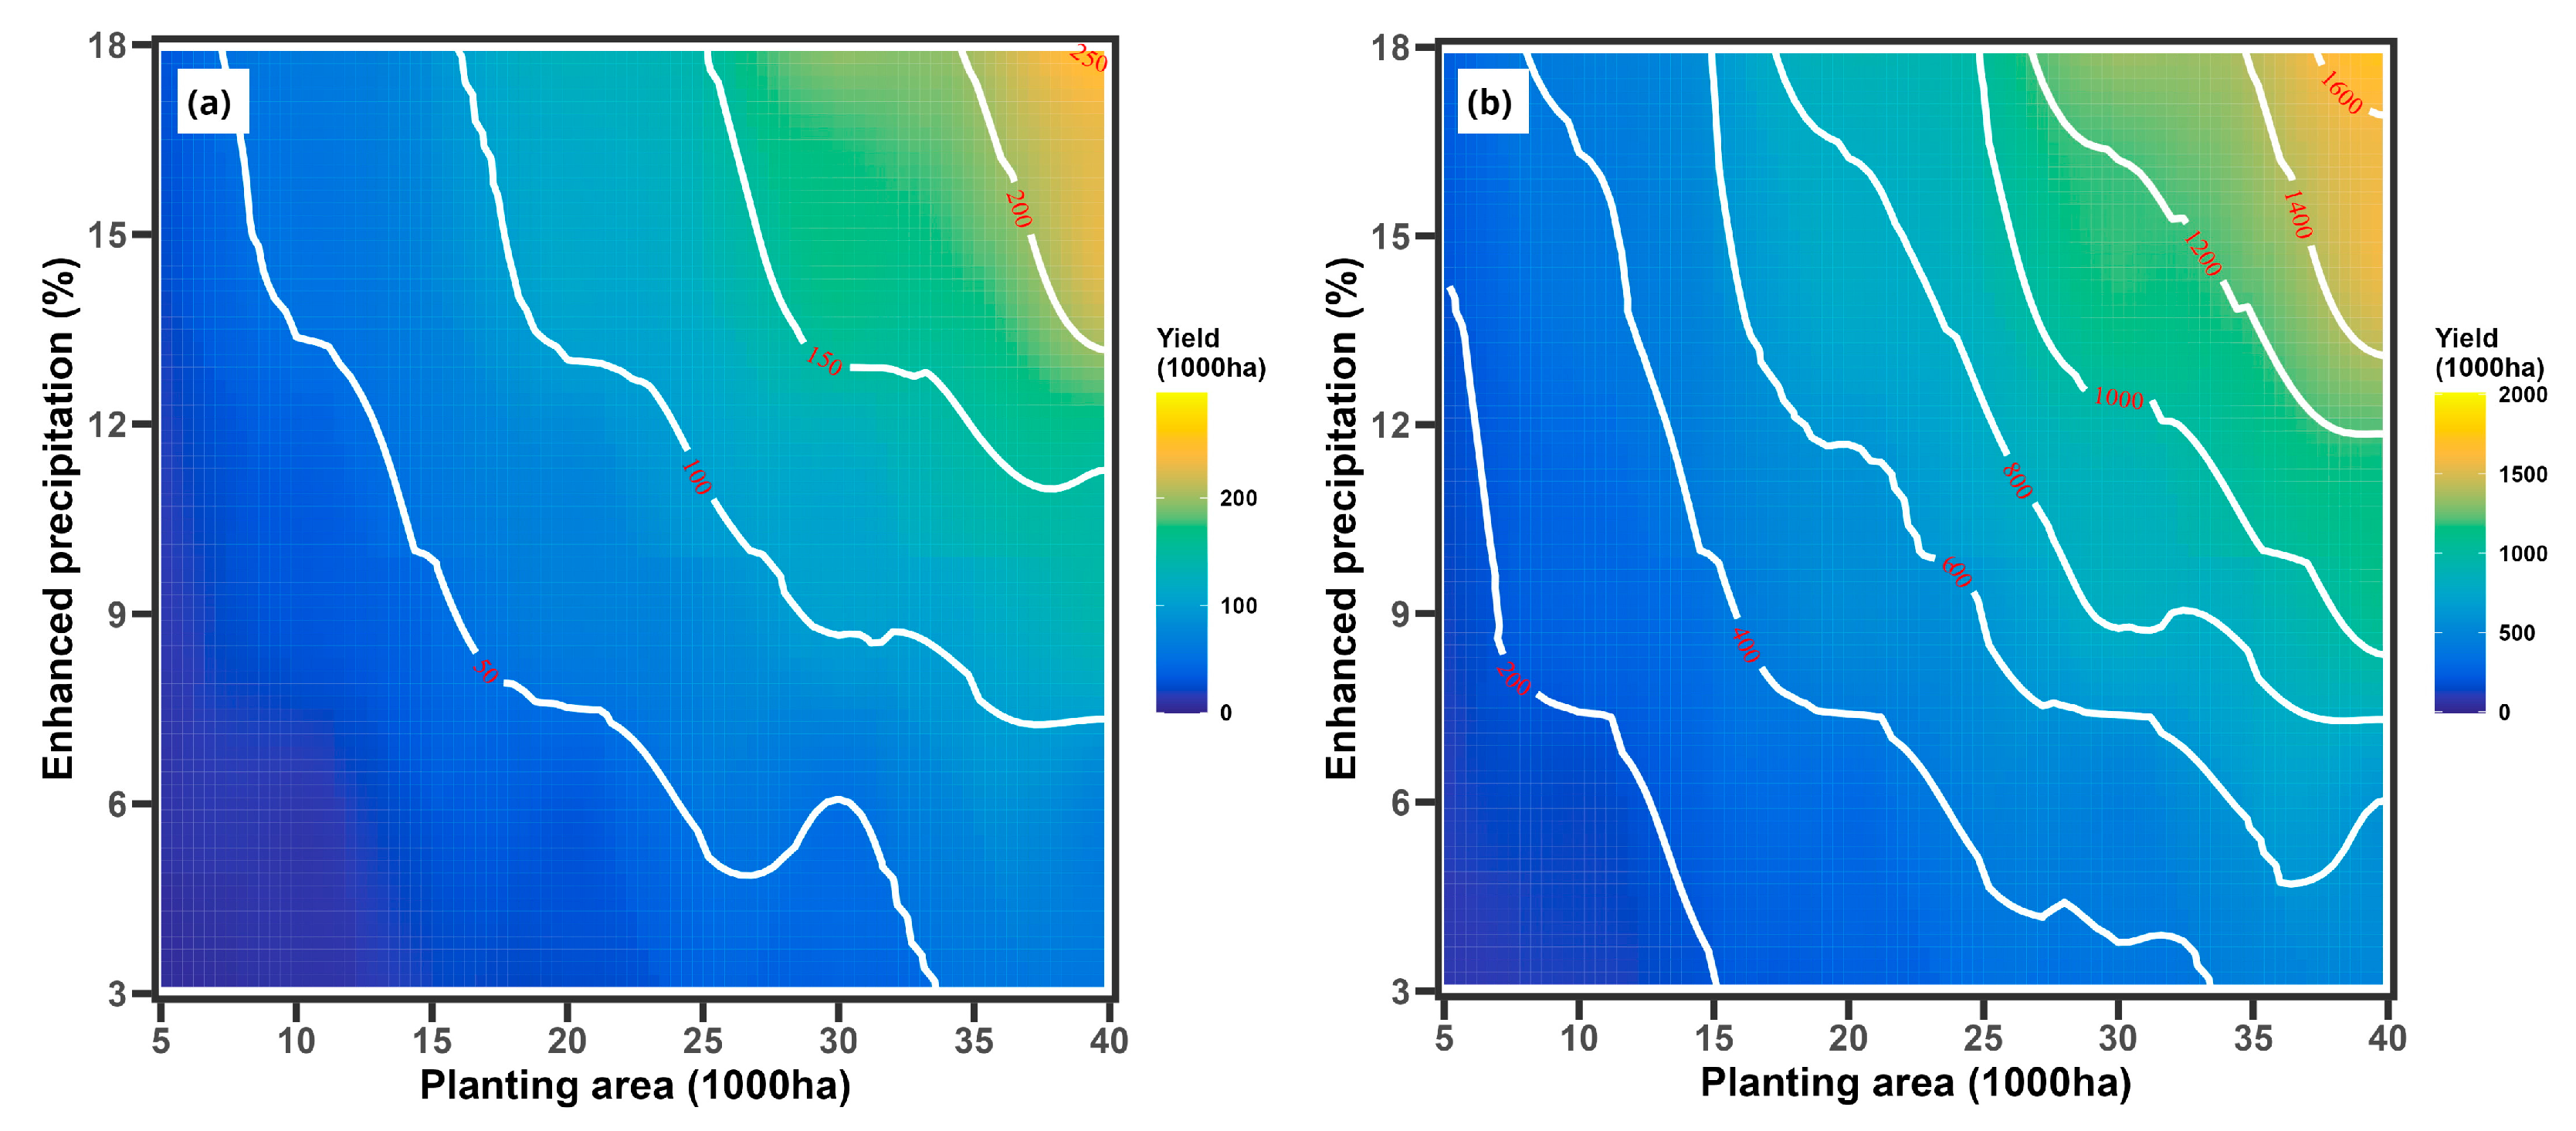
3.5. Analysis of the Economic Benefits of Precipitation Enhancement

Longzi, with the largest highland barley planting area on the Tibetan Plateau, was selected as the representative region for analyzing the economic benefits of precipitation enhancement. The regional yield increases were strongly affected by both precipitation enhancement and planting area. During the vegetative stage, the yield increase became greater with larger enhanced precipitation and planting area (Figure 9a). The yield increase showed a very similar pattern during the reproductive stage but with much higher values (Figure 9b).
According to Equation (8), when precipitation was enhanced during the vegetative period, economic benefits were lowest in less rain years and highest in more rain years (Figure 10). Under the 5% precipitation enhancement scenario, the average economic benefit was approximately CNY 520,000 in 2023, with a planting area of 3440 ha. The benefit rapidly increased to CNY 1,230,000 under a 10% enhancement. As precipitation was further increased by 15% and 20%, the rate of benefit increase slowed, reaching CNY 1,967,000 and CNY 2,553,000, respectively.
In contrast, economic benefits were much higher when precipitation was enhanced during the reproductive stage (Figure 11). Even under the 5% enhancement scenario, the economic benefit rose to CNY 4,815,000, significantly higher than the CNY 520,000 gained during the vegetative period. Unlike the vegetative period, the rate of increase remained stable at higher enhancement levels. Specifically, the economic benefit of CNY 4,815,000 under a 5% enhancement steadily increased to CNY 9,882,000, CNY 13,597,000, and CNY 17,269,000 under 10%, 15%, and 20% enhancements, respectively. Given that a 10% precipitation enhancement is considered more plausible than the higher scenarios, an economic benefit of CNY 9,882,000 is viewed as the most likely outcome under precipitation enhancement during the reproductive stage.

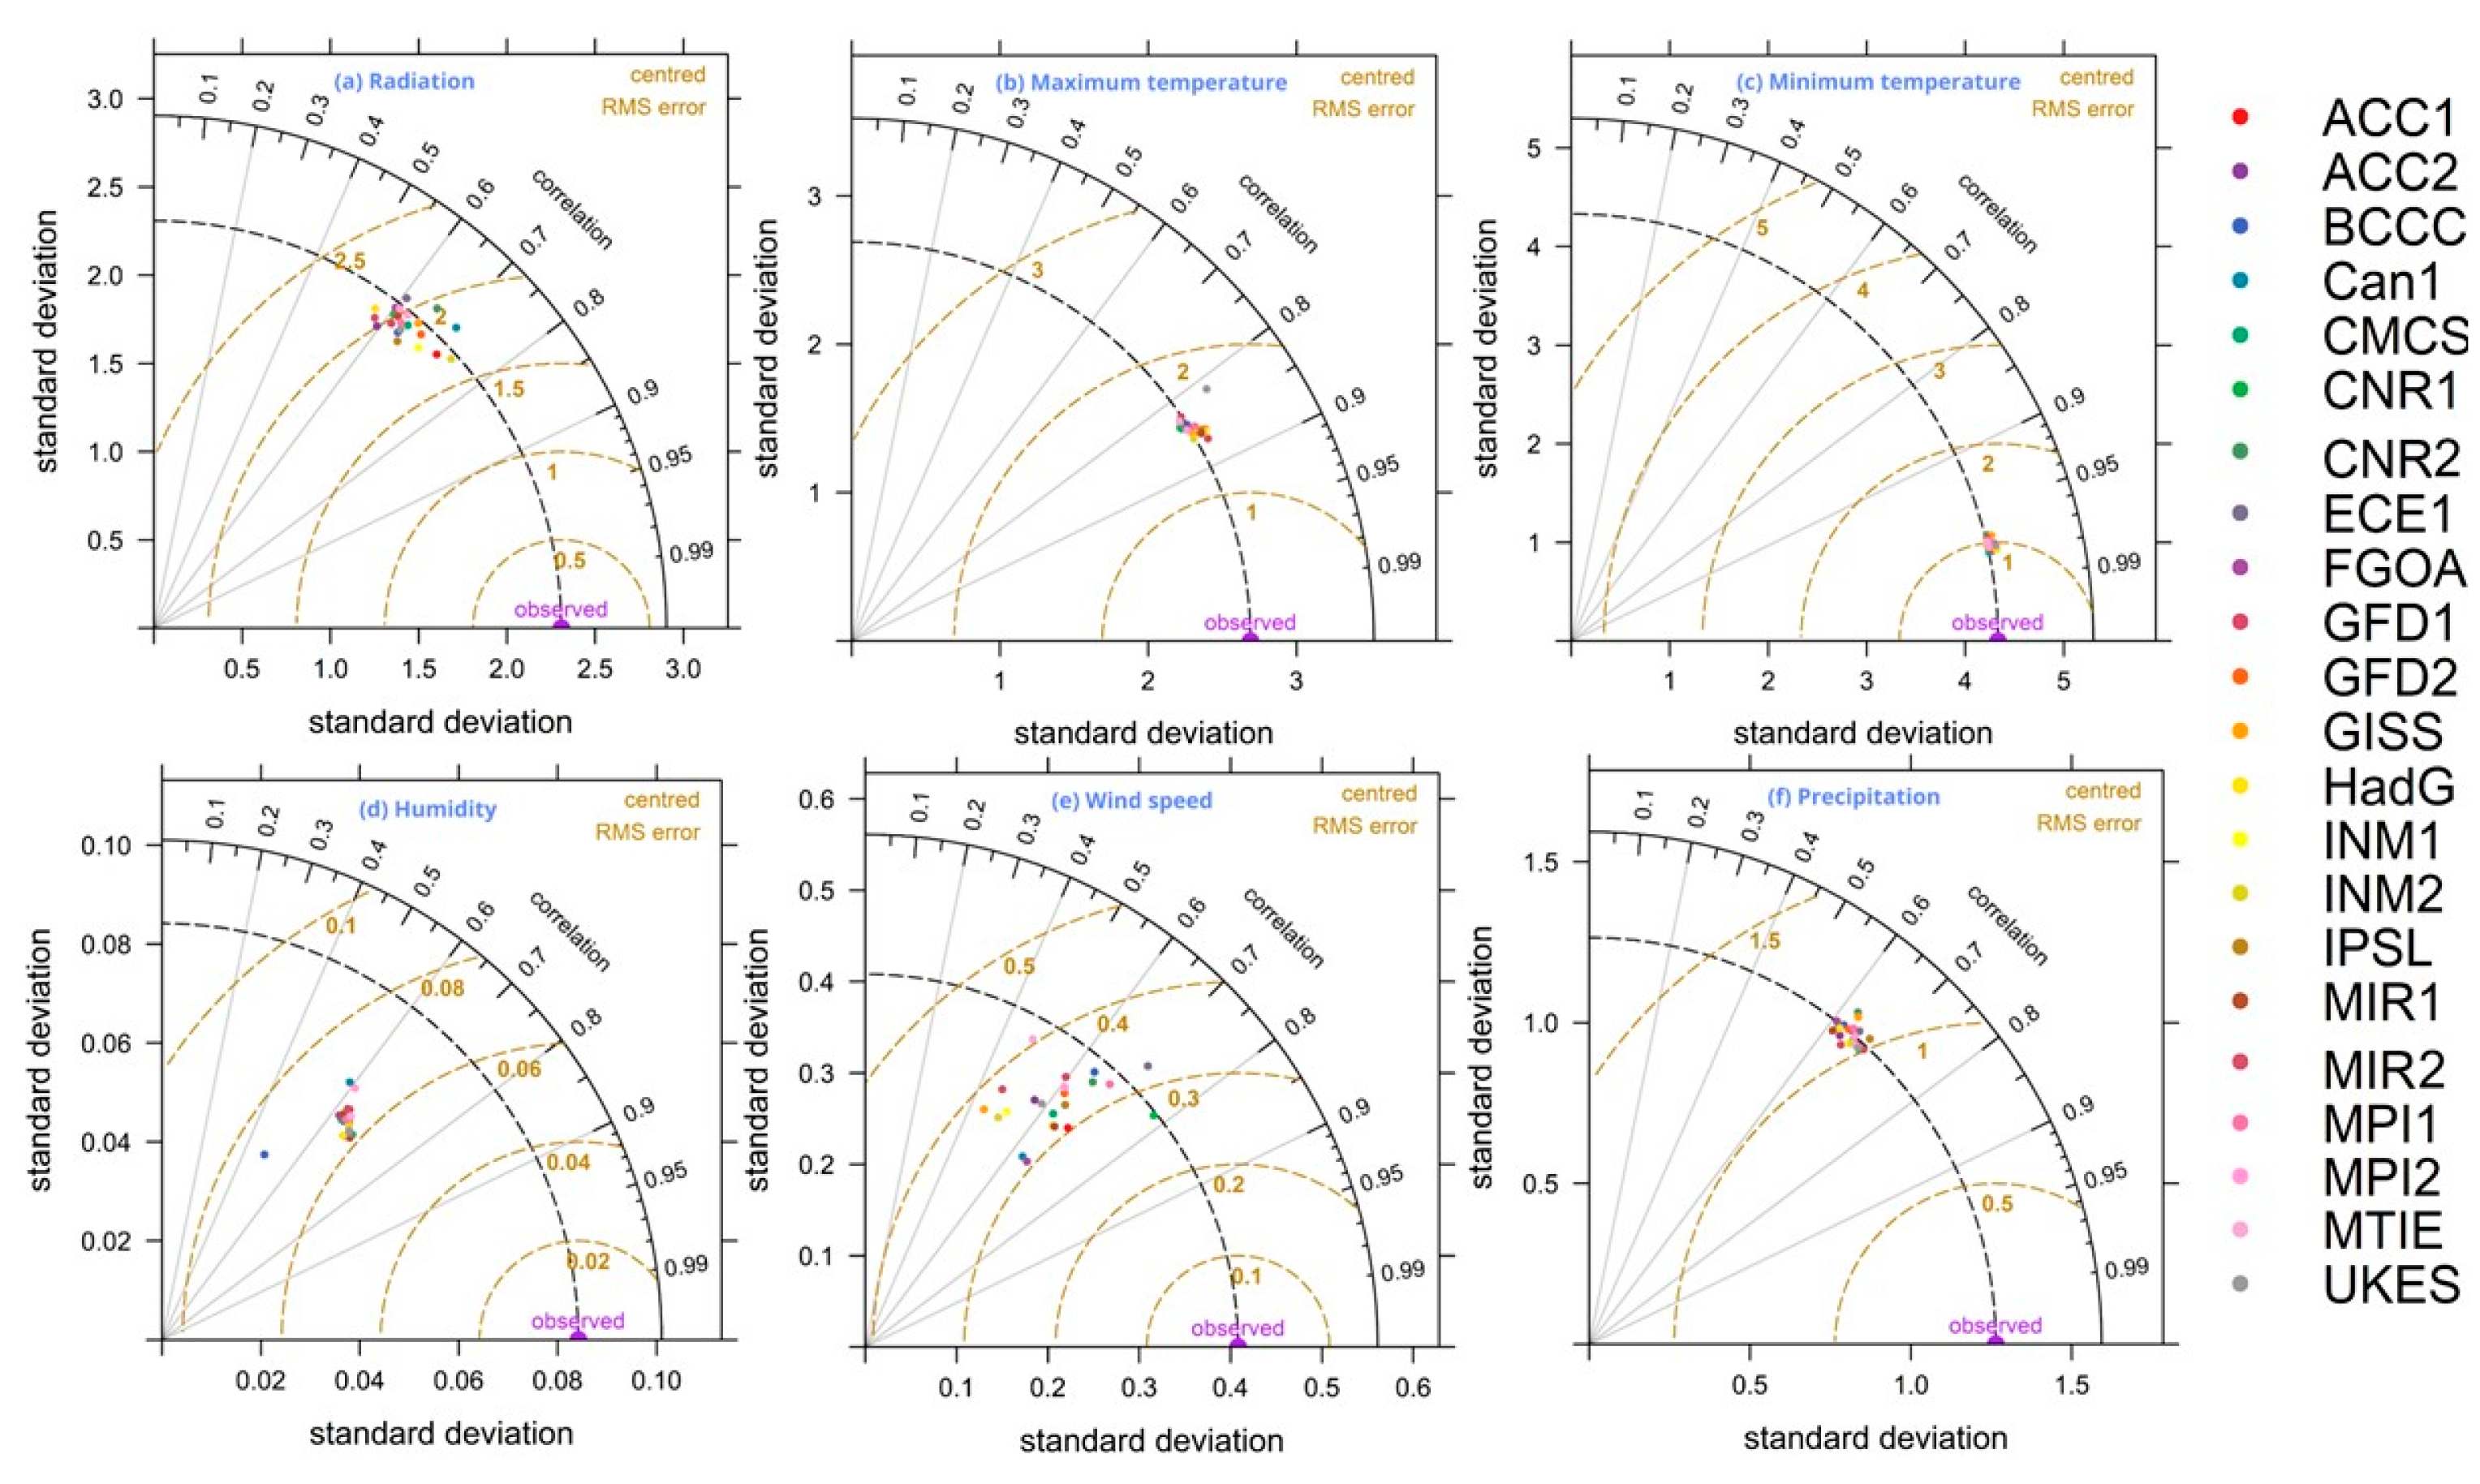
3.6. Preliminary Analysis of the Benefits of Precipitation Enhancement Under Climate Change Conditions

The Taylor figures showed that the models performed best in simulating minimum temperature (Figure 12c), with all RMSE values less than 1.2 and all correlation coefficients higher than 0.95. All of the GCMs performed worse in simulating wind speed, with RMSE values ranging from 0.28 to 0.40 and correlation coefficients ranging from 0.42 to 0.76, respectively (Figure 12e).
Under an SSP245 climate change scenario, the yield of highland barley showed a slightly decreasing trend with the passage of time, but the decreasing trend can be effectively offset by the benefit from precipitation enhancement in the productive period (Figure 13a). Under an SSP585 climate change scenario, the simulated yields were generally lower than those under the SSP245 climate scenario but showed a similar decreasing trend and obvious benefits from precipitation enhancement (Figure 13b).

4. Discussion

In recent years, investment in precipitation enhancement has increased rapidly in China [5,11], and local governments are keen to understand the economic benefits of these investments. Previous assessments of these benefits were largely based on subjective speculations. This study establishes a quantitative evaluation method supported by a crop growth model to assess the benefits of precipitation enhancement on highland barley yields. The findings and their implications for sustainable agriculture in Tibet are discussed as follows.

4.1. Reliability of the WOFOST Model for Simulation of the Highland Barley Yields over the Tibetan Plateau

Unlike empirical yield-environment models [49,50], crop growth models such as WOFOST incorporate physiological mechanisms, enabling a more realistic simulation of crop growth [51,52]. The WOFOST model, a typical model of the Wageningen series, emphasizes these mechanisms [24,25,53] and has been validated as a dynamic and accurate tool for simulating crop growth under various conditions in China [28,54,55].
In this study, WOFOST demonstrated high performance, with an NSE of 0.95 and a relative error of 2.4%, for simulating highland barley yields in Lhasa and Longzi (Figure 2b). These results are consistent with its use in other regions, such as the Three Rivers Region of the Tibetan Plateau [35]. In addition, the WOFOST model even showed good performance for simulating the yields of highland barley over the Tibetan Plateau when it was calibrated by the local observations [56], which further supports its reliability as a tool for simulating crop growth and yield formation processes over the Tibet Plateau.

4.2. Complex Effects of Precipitation Enhancement Under Different Drought Conditions

Previous studies on the effects of precipitation enhancement on crop yields, such as those carried out by Huff et al. [10], have highlighted both positive and negative effects of precipitation enhancement. These effects can vary based on different scenarios and climatic conditions. For example, in Illinois, adverse effects were noted when precipitation was increased in some scenarios, leading to waterlogging or severe soil drainage constraints [57,58]. In contrast, the Tibetan Plateau’s water availability for highland barley is consistently lower than crop demand [3], reducing the likelihood of negative effects from precipitation enhancement. In addition, the soil type in the study area (sandy loam with low plant available water capacity) exacerbates water stress during simulations [16,59]. Consequently, added precipitation generally benefits highland barley production over the Tibetan Plateau. The large discrepancy between the crop’s high water requirements and the region’s low precipitation, coupled with the soil’s low water capacity, ensures that precipitation enhancement is consistently beneficial for highland barley production over the Tibetan Plateau.
Precipitation enhancement exhibited a non-linear effect on yield increases. Under extreme drought conditions, a 5% increase in precipitation had minimal impact due to a low leaf area index. In such cases, enhanced precipitation could lead to higher evapotranspiration and exacerbated water stress, occasionally resulting in reduced yields. However, enhancements exceeding 10% generally yielded significant positive effects (Figure 5, Figure 6, Figure 7 and Figure 8).

4.3. Impact of Precipitation Enhancement at Different Growth Stages

The yield of barley can be seriously reduced by water stress in the growth period [60], especially in a critical stage, for example, in the grain filling period [61]. For most of the stations in Tibet, precipitation during the growth period (see Table 1) is lower than the corresponding water demand of 389 mm [3], meaning that drought inevitably occurs in this highland area. The drought was also identified by variations in SPEI in recent years (Figure 3). Thus, precipitation enhancement always showed positive effects on highland barley at both vegetative and reproductive stages (Figure 5, Figure 6, Figure 7 and Figure 8).
However, crop sensitivity to water stress varies across different growth stages. Drought reduces barley yield depending not only on the severity of water stress, but also on the growth period at which the stress was imposed [62]. Barley grain filling rate can be reduced by 40% under drought stress at the reproductive stage [61], meaning that enhanced precipitation during this period would play a significant positive role in highland barley production. This study found that precipitation enhancement during the reproductive stage resulted in greater yield increases compared to enhancements during the vegetative stage (Figure 5, Figure 6, Figure 7 and Figure 8). This aligns with previous research emphasizing the importance of alleviating water stress during critical developmental stages [61,62,63].

4.4. Uncertainties and Future Research

Previously, benefits from precipitation enhancement were often assessed subjectively. This study’s quantitative evaluation, supported by a crop growth model, offers a more scientific approach. Nonetheless, a great many uncertainties still exist regarding precipitation enhancement effects [64]. These uncertainties led to the assumption of various precipitation enhancement scenarios, which complicates precise benefit estimation for local policymakers. Moreover, the assumption of regionally homogeneous precipitation enhancement does not reflect the heterogeneous nature of real enhancements [65]. At present, numerical weather models are used for simulating precipitation enhancement with high spatiotemporal resolution [65,66,67], which presents opportunities to reduce these uncertainties by integrating these models with crop growth models in future research.
The simulated yield of highland barley only decreased slightly under both SSP245 and SSP585 climate change scenarios. Previous research has identified that potential yields under no-water conditions would decrease significantly under warming conditions due to shortened critical growth periods [35]. However, this negative effect can be offset by more precipitation under climate change conditions [68,69], and the comprehensive effect of both temperature and precipitation led to slightly decreasing trends in the highland barley yields (Figure 13). Future studies should focus on using attribution analysis to reveal the leading factor in decreasing yields under climate change scenarios. Though decreasing trends in highland barley were caused by comprehensive elements with many uncertainties, it is fairly clear that decreasing trends can be effectively offset by precipitation enhancement (Figure 13), highlighting the applicability of precipitation enhancement as an effective tool for mitigating climate change in Tibet.
At present, most crop models—including WOFOST—assume a simplified soil profile and do not take into account the dynamic simulation of extreme weather events [16]. Due to this limitation, these models may not fully capture complex plant–soil–atmosphere interactions. Thus, multiple crop models, including WOFOST, APSIM, DSSAT, and so on, should be used simultaneously to obtain more accurate and objective assessments in future studies. In addition, while precipitation enhancement showed a positive effect on highland barley in Tibet, this conclusion should be cautiously applied to other regions. Barley is relatively sensitive to excess moisture [70], with 20–25% yield losses occurring under waterlogging conditions worldwide [71]. In addition to yield loss caused by hypoxic stress [70], excess water can also result in yield loss through deficient conditions for the absorption of nutrients such as nitrogen, phosphorus, potassium, and so on [72,73]. In addition to these negative effects, increased rainfall and humidity may create favorable conditions for many pathogenic fungi and bacteria, which can play a negative role in barley production [74,75].

5. Conclusions

The WOFOST model performed well in terms of the validation results, showing NSE values of 0.93 and 0.95 for phenological dates and yields, respectively. The relative error for estimated yields of highland barley was 2.4%, showing that it can effectively assess the impacts of precipitation enhancement on highland barley yields in the Lhasa and Longzi regions over the Tibetan Plateau.
The simulation results, classified by SPEI into three meteorological drought conditions, revealed that yield increases were minimal under extreme drought conditions; this was due to a low leaf area index. Precipitation enhancement demonstrated a non-linear effect, with significant yield increases occurring at enhancements greater than 10%.
Regional yield increases averaged 63.6 to 193.8 kg/ha at the vegetative stage and 170.7 to 580.5 kg/ha at the reproductive stage. The larger yield increases during the reproductive stage highlight the importance of mitigating water stress during critical growth phases, enhanced by the unique climate of the Tibetan Plateau.
In Longzi, with its 3440 ha of highland barley, precipitation enhancement at the reproductive stage could yield economic benefits ranging from CNY 4.8 to 17.3 million, with a most probable benefit of CNY 9.8 million for a 10% enhancement. Under climate change scenarios, the yields of highland barley would decrease slightly due to the comprehensive effects of both temperature and precipitation, but the decreasing trends can be effectively offset by precipitation enhancement.
Future studies should integrate crop models with advanced numerical weather models to reduce uncertainties caused by the assumption of homogeneity in this study. In addition, multiple crop models should be applied in the future to increase the reliability of the assessments. It should also be noted that our conclusion regarding the positive effects of precipitation enhancement in Tibet should be cautiously applied to other regions, as precipitation might have a negative effect on barley production under waterlogging conditions.

Author Contributions

Conceptualization, J.L., F.W., D.L.L., J.D., R.W., H.D., F.S. and Q.Y.; methodology, J.L., F.W., D.L.L., J.D., R.W., H.D., F.S. and Q.Y.; software, J.L.; validation, R.W., D.L.L. and F.S.; formal analysis, J.L.; writing—original draft preparation, J.L.; writing—review and editing, Q.Y. and D.L.L. All authors have read and agreed to the published version of the manuscript.

Funding

This research was funded by the National Key R&D Program of China (2024YFF1308200), the National Key Research and Development Program of China (2023YFD2302700), and the CMA Innovative and Development Program (CXFZ2023J035).

Data Availability Statement

The original contributions presented in the study are included in the article; further inquiries can be directed to the corresponding author. For scientists who show interest in the relevant research and who ensure that the data will be used only for research work, the authors can provide the data for their work under the permission of the China Meteorological Administration.

Acknowledgments

The authors would like to express a great appreciation to the observers at Lhasa and Naidong weather stations for their experiments conducted under extremely harsh environments on the Tibetan Plateau. We also acknowledge support from the CMA Key Innovation Team (CMA2022ZD10) and the WMC Innovation Team (WMC2023IT03). The authors also would like to express a great deal of gratitude to the reviewers for their valuable comments.

Conflicts of Interest

The authors declare no conflicts of interest.

References

  1. Chen, F.H.; Dong, G.H.; Zhang, D.J.; Liu, X.Y.; Jia, X.; An, C.B.; Jones, M.K.; Ma, M.M.; Xie, Y.W.; Barton, L.; et al. Agriculture facilitated permanent human occupation of the Tibetan Plateau after 3600 BP. Science 2015, 347, 248–250. [Google Scholar] [CrossRef] [PubMed]
  2. Zeng, X.; Long, H.; Wang, Z.; Zhao, S.; Tang, Y.; Huang, Z.; Tashi, N.; Wang, Y.; Xu, Q.; Mao, L.; et al. The draft genome of Tibetan hulless barley reveals adaptive patterns to the high stressful Tibetan Plateau. Proc. Natl. Acad. Sci. USA 2015, 112, 1095–1100. [Google Scholar] [CrossRef] [PubMed]
  3. Liu, Z.F.; Yao, Z.J.; Yu, C.Q.; Zhong, Z.M. Assessing crop water demand and deficit for the growth of spring highland barley in Tibet, China. J. Integr. Agric. 2013, 12, 541–551. [Google Scholar] [CrossRef]
  4. Bigolin, T.; Talamini, E. Impacts of climate change scenarios on the corn and soybean double-cropping system in Brazil. Climate 2024, 12, 42. [Google Scholar] [CrossRef]
  5. Dong, X.; Zhao, C.; Huang, Z.; Mai, R.; Lv, F.; Xue, X.; Zhang, X.; Hou, S.; Yang, Y.; Sun, Y. Increase of precipitation by cloud seeding observed from a case study in November 2020 over Shijiazhuang, China. Atmos. Res. 2021, 262, 105766. [Google Scholar] [CrossRef]
  6. Schaefer, V.J. The production of ice crystals in a cloud of supercooled water droplets. Science 1946, 104, 457–459. [Google Scholar] [CrossRef]
  7. Vonnegut, B. The nucleation of ice formation by silver iodide. J. Appl. Phys. 1947, 18, 593–595. [Google Scholar] [CrossRef]
  8. Flossmann, A.I.; Manton, M.; Abshaev, A.; Bruintjes, R.; Murakami, M.; Prabhakaran, T.; Yao, Z. Review of advances in precipitation enhancement research. Bull. Am. Meteorol. Soc. 2019, 100, 1465–1480. [Google Scholar] [CrossRef]
  9. Flossmann, A.I.; Manton, M.J.; Abshaev, A.; Bruintjet, R.; Murakami, M.; Prabhakaran, T.; Yao, Z. Peer Review Report on Global Precipitation Enhancement Activities; WMO: Geneva, Switzerland, 2018; pp. 113–115. [Google Scholar]
  10. Huff, F.A.; Changnon, S.A., Jr. Evaluation of potential effects of weather modification on agriculture in Illinois. J. Appl. Meteorol. Climatol. 1972, 11, 376–384. [Google Scholar] [CrossRef]
  11. Guo, X.L.; Fang, C.G.; Lu, G.X.; Lou, X.F.; Su, Z.J.; Yu, Z.P.; Yang, Z.H. Progresses of weather modification technologies and applications in China from 2008 to 2018. J. Appl. Meteorol. Sci. 2019, 30, 641–650. [Google Scholar]
  12. Holzworth, D.P.; Snow, V.; Janssen, S.; Athanasiadis, I.N.; Donatelli, M.; Hoogenboom, G.; White, J.W.; Thorburn, P. Agricultural production systems modelling and software: Current status and future prospects. Environ. Model. Softw. 2015, 72, 276–286. [Google Scholar] [CrossRef]
  13. de Wit, C.T. Photosynthesis of leaf canopies. In Agricultural Research Report No. 663; PUDOC: Wageningen, The Netherlands, 1965. [Google Scholar]
  14. Sinclair, T.R.; Seligman, N.A.G. Crop modeling: From infancy to maturity. Agron. J. 1996, 88, 698–704. [Google Scholar] [CrossRef]
  15. Bouman, B.A.M.; Van Keulen, H.; Van Laar, H.H.; Rabbinge, R. The ‘School of de Wit’crop growth simulation models: A pedigree and historical overview. Agric. Syst. 1996, 52, 171–198. [Google Scholar] [CrossRef]
  16. Boogaard, H.L.; Van Diepen, C.A.; Rötter, R.P.; Cabrera, J.M.C.A.; Van Laar, H.H. User’s guide for the WOFOST 7.1 crop growth simulation model and WOFOST control center 1.5. In Technical Document 52; Winand Staring Centre: Wageningen, The Netherlands, 1998; 144p. [Google Scholar]
  17. Supit, I.; Van Diepen, C.A.; de Wit, A.J.W.; Kabat, P.; Baruth, B.; Ludwig, F. Recent changes in the climatic yield potential of various crops in Europe. Agric. Syst. 2010, 103, 683–694. [Google Scholar] [CrossRef]
  18. Jones, J.W.; Hoogenboom, G.; Porter, C.H.; Boote, K.J.; Batchelor, W.D.; Hunt, L.A.; Wilkens, P.W.; Singh, U.; Gijsman, A.J.; Ritchie, J.T. The DSSAT cropping system model. Eur. J. Agron. 2003, 18, 235–265. [Google Scholar] [CrossRef]
  19. Bhatia, V.S.; Singh, P.; Wani, S.P.; Chauhan, G.S.; Rao, A.K.; Mishra, A.K.; Srinivas, K. Analysis of potential yields and yield gaps of rainfed soybean in India using CROPGRO-Soybean model. Agric. For. Meteorol. 2008, 148, 1252–1265. [Google Scholar] [CrossRef]
  20. Gardi, M.W.; Memic, E.; Zewdu, E.; Graeff-Hönninger, S. Simulating the effect of climate change on barley yield in Ethiopia with the DSSAT-CERES-Barley model. Agron. J. 2022, 114, 1128–1145. [Google Scholar] [CrossRef]
  21. Keating, B.A.; Carberry, P.S.; Hammer, G.L.; Probert, M.E.; Robertson, M.J.; Holzworth, D.; Smith, C.J.; Huth, N.I.; Hargreaves, J.N.; Meinke, H.; et al. An overview of APSIM, a model designed for farming systems simulation. Eur. J. Agron. 2003, 18, 267–288. [Google Scholar] [CrossRef]
  22. Innes, P.J.; Tan, D.K.Y.; Van Ogtrop, F.; Amthor, J.S. Effects of high-temperature episodes on wheat yields in New South Wales, Australia. Agric. For. Meteorol. 2015, 208, 95–107. [Google Scholar] [CrossRef]
  23. Vogeler, I.; Cichota, R.; Langer, S.; Thomas, S.; Ekanayake, D.; Werner, A. Simulating water and nitrogen runoff with APSIM. Soil Tillage Res. 2023, 227, 105593. [Google Scholar] [CrossRef]
  24. de Wit, A.; Boogaard, H.; Fumagalli, D.; Janssen, S.; Knapen, R.; van Kraalingen, D.; Supit, I.; van der Wijngaart, R.; van Diepen, K. 25 years of the WOFOST cropping systems model. Agric. Syst. 2019, 168, 154–167. [Google Scholar] [CrossRef]
  25. Dewenam, L.E.F.; Er-Raki, S.; Ezzahar, J.; Chehbouni, A. Performance evaluation of the WOFOST model for estimating evapotranspiration, soil water content, grain yield and total above-ground biomass of winter wheat in Tensift Al Haouz (Morocco): Application to yield gap estimation. Agronomy 2021, 11, 2480. [Google Scholar] [CrossRef]
  26. Shekhar, C.; Singh, D.; Singh, R.; Rao, V. Prediction of wheat growth and yield using WOFOST model. J. Agrometeorol. 2008, 10, 400–402. [Google Scholar]
  27. Berghuijs, H.N.; Silva, J.V.; Reidsma, P.; de Wit, A.J. Expanding the WOFOST crop model to explore options for sustainable nitrogen management: A study for winter wheat in the Netherlands. Eur. J. Agron. 2024, 154, 127099. [Google Scholar] [CrossRef]
  28. Li, X.; Tan, J.; Wang, X.; Han, G.; Qian, Z.; Li, H.; Wang, L.; Niu, G. Responses of spring wheat yield and growth period to different future climate change models in the yellow river irrigation area based on CMIP6 and WOFOST models. Agric. For. Meteorol. 2024, 353, 110071. [Google Scholar] [CrossRef]
  29. Wolf, J.; Van Diepen, C.A. Effects of climate change on grain maize yield potential in the European Community. Clim. Change 1995, 29, 299–331. [Google Scholar] [CrossRef]
  30. Pohlert, T. Use of empirical global radiation models for maize growth simulation. Agric. For. Meteorol. 2004, 126, 47–58. [Google Scholar] [CrossRef]
  31. Li, X.; Guo, Q.; Gong, L.; Jiang, L.; Zhai, M.; Wang, L.; Wang, P.; Zhao, H. Impact assessment of maize cold damage and drought cross-stress in Northeast China based on WOFOST model. Int. J. Plant Prod. 2024, 18, 1–12. [Google Scholar] [CrossRef]
  32. Dua, V.K.; Minhas, J.S.; Rawal, S.; Singh, S.P.; Singh, S.K.; Kumar, P.; Pathania, R.; Kapoor, T.; Sharma, J.; Chakrabarti, S.K.; et al. Calibration and validation of WOFOST model for seven potato (Solanum tuberosum) cultivars in India. Indian J. Agron. 2018, 63, 357–365. [Google Scholar]
  33. Kulig, B.; Skowera, B.; Klimek-Kopyra, A.; Kołodziej, S.; Grygierzec, W. The use of the WOFOST model to simulate water-limited yield of early potato cultivars. Agronomy 2020, 10, 81. [Google Scholar] [CrossRef]
  34. ten Den, T.; van de Wiel, I.; de Wit, A.; van Evert, F.K.; van Ittersum, M.K.; Reidsma, P. Modelling potential potato yields: Accounting for experimental differences in modern cultivars. Eur. J. Agron. 2022, 137, 126510. [Google Scholar] [CrossRef]
  35. Liu, J.; Du, J.; Liu, D.L.; Linderholm, H.W.; Zhou, G.; Song, Y.; Shen, Y.; Yu, Q. Spatial and temporal variations in the potential yields of highland barley in relation to climate change in Three Rivers Region of the Tibetan Plateau from 1961 to 2020. Sustainability 2022, 14, 7719. [Google Scholar] [CrossRef]
  36. Ma, W.; Jia, W.; Su, P.; Feng, X.; Liu, F.; Wang, J.A. Mapping highland barley on the Qinghai–Tibet combing Landsat OLI data and Object-Oriented classification method. Land 2021, 10, 1022. [Google Scholar] [CrossRef]
  37. Li, H.; Ma, W.; Lian, Y.; Wang, X.; Zhao, L. Global solar radiation estimation with sunshine duration in Tibet, China. Renew. Energy 2011, 36, 3141–3145. [Google Scholar] [CrossRef]
  38. Liu, D.L.; Zuo, H. Statistical downscaling of daily climate variables for climate change impact assessment over New South Wales, Australia. Clim. Change 2012, 115, 629–666. [Google Scholar] [CrossRef]
  39. Thrasher, B.; Wang, W.; Michaelis, A.; Melton, F.; Lee, T.; Nemani, R. NASA global daily downscaled projections, CMIP6. Sci. Data 2022, 9, 262. [Google Scholar] [CrossRef]
  40. Wu, S.; Yang, P.; Ren, J.; Chen, Z.; Li, H. Regional winter wheat yield estimation based on the WOFOST model and a novel VW-4DEnSRF assimilation algorithm. Remote Sens. Environ. 2021, 255, 112276. [Google Scholar] [CrossRef]
  41. Okkan, U.; Fistikoglu, O.; Ersoy, Z.B.; Noori, A.T. Analyzing the uncertainty of potential evapotranspiration models in drought projections derived for a semi-arid watershed. Theor. Appl. Clim. 2024, 155, 2329–2346. [Google Scholar] [CrossRef]
  42. Vicente-Serrano, S.M.; Beguería, S.; López-Moreno, J.I. A multiscalar drought index sensitive to global warming: The standardized precipitation evapotranspiration index. J. Clim. 2010, 23, 1696–1718. [Google Scholar] [CrossRef]
  43. Wang, Q.; Shi, P.; Lei, T.; Geng, G.; Liu, J.; Mo, X.; Li, X.; Zhou, H.; Wu, J. The alleviating trend of drought in the Huang-Huai-Hai Plain of China based on the daily SPEI. Int. J. Clim. 2015, 35, 3760–3769. [Google Scholar] [CrossRef]
  44. Hans, V.S.; Francos, W.Z. Statistical Analysis in Climate Research; Cambridge University Press: Cambridge, UK, 1999. [Google Scholar]
  45. Fernandes, R.; Leblanc, S.G. Parametric (modified least squares) and non-parametric (Theil–Sen) linear regressions for predicting biophysical parameters in the presence of measurement errors. Remote Sens. Environ. 2005, 95, 303–316. [Google Scholar] [CrossRef]
  46. Mann, H.B. Nonparametric tests against trend. Econom. J. Econom. Soc. 1945, 13, 245–259. [Google Scholar] [CrossRef]
  47. Yan, Y.; Wang, D.; Yue, S.; Qu, J. Trends in summer air temperature and vapor pressure and their impacts on thermal comfort in China. Theor. Appl. Clim. 2019, 138, 1445–1456. [Google Scholar] [CrossRef]
  48. Mielniczuk, J.; Wojdyllo, P. Estimation of Hurst exponent revisited. Comput. Stat. Data Anal. 2007, 51, 4510–4525. [Google Scholar] [CrossRef]
  49. Liu, H.; Xiong, W.; Mottaleb, K.A.; Krupnik, T.J.; Burgueño, J.; Pequeno, D.N.; Wu, W. Contrasting contributions of five factors to wheat yield growth in China by process-based and statistical models. Eur. J. Agron. 2021, 130, 126370. [Google Scholar] [CrossRef]
  50. Butler, E.E.; Mueller, N.D.; Huybers, P. Peculiarly pleasant weather for US maize. Proc. Natl. Acad. Sci. USA 2018, 115, 11935–11940. [Google Scholar] [CrossRef]
  51. Priya, S.; Shibasaki, R. National spatial crop yield simulation using GIS-based crop production model. Ecol. Model. 2001, 136, 113–129. [Google Scholar] [CrossRef]
  52. Bulatewicz, T.; Jin, W.; Staggenborg, S.; Lauwo, S.; Miller, M.; Das, S.; Andresen, D.; Peterson, J.; Steward, D.R.; Welch, S.M. Calibration of a crop model to irrigated water use using a genetic algorithm. Hydrol. Earth Syst. Sci. 2009, 13, 1467–1483. [Google Scholar] [CrossRef]
  53. Abebe, G.; Tadesse, T.; Gessesse, B. Assimilation of leaf Area Index from multisource earth observation data into the WOFOST model for sugarcane yield estimation. Int. J. Remote Sens. 2022, 43, 698–720. [Google Scholar] [CrossRef]
  54. Huang, J.; Jia, S.; Ma, H.; Hou, Y.; He, L. Dynamic simulation of growth process of winter wheat in main production areas of China based on WOFOST model. Trans. Chin. Soc. Agric. Eng. 2017, 33, 222–228. [Google Scholar]
  55. Xu, X.; Shen, S.; Xiong, S.; Ma, X.; Fan, Z.; Han, H. Water stress is a key factor influencing the parameter sensitivity of the WOFOST model in different agro-meteorological conditions. Int. J. Plant Prod. 2021, 15, 231–242. [Google Scholar] [CrossRef]
  56. Zhang, Z.; Lu, C. Assessing Influences of Climate Change on Highland Barley Productivity in the Qinghai-Tibet Plateau during 1978–2017. Sci. Rep. 2022, 12, 7625. [Google Scholar] [CrossRef] [PubMed]
  57. Shabala, S. Physiological and cellular aspects of phytotoxicity tolerance in plants: The role of membrane transporters and implications for crop breeding for waterlogging tolerance. New Phytol. 2011, 190, 289–298. [Google Scholar] [CrossRef]
  58. Kaur, G.; Singh, G.; Motavalli, P.P.; Nelson, K.A.; Orlowski, J.M.; Golden, B.R. Impacts and management strategies for crop production in waterlogged or flooded soils: A review. Agron. J. 2020, 112, 1475–1501. [Google Scholar] [CrossRef]
  59. Yang, Y.; Liu, D.L.; Anwar, M.R.; Zuo, H.; Yang, Y. Impact of future climate change on wheat production in relation to plant-available water capacity in a semiarid environment. Theor. Appl. Clim. 2014, 115, 391–410. [Google Scholar] [CrossRef]
  60. Samarah, N.H. Effects of drought stress on growth and yield of barley. Agron. Sustain. Dev. 2005, 25, 145–149. [Google Scholar] [CrossRef]
  61. Sánchez-Díaz, M.; García, J.L.; Antolín, M.C.; Araus, J.L. Effects of soil drought and atmospheric humidity on yield, gas exchange, and stable carbon isotope composition of barley. Photosynthetica 2002, 40, 415–421. [Google Scholar] [CrossRef]
  62. Szira, F.; Bálint, A.F.; Börner, A.; Galiba, G. Evaluation of drought-Related traits and screening methods at different developmental stages in spring barley. J. Agron. Crop Sci. 2008, 194, 334–342. [Google Scholar] [CrossRef]
  63. Samarah, N.H.; Alqudah, A.M.; Amayreh, J.A.; McAndrews, G.M. The effect of late-terminal drought stress on yield components of four barley cultivars. J. Agron. Crop Sci. 2009, 195, 427–441. [Google Scholar] [CrossRef]
  64. Wu, X.; Yan, N.; Yu, H.; Niu, S.; Meng, F.; Liu, W.; Sun, H. Advances in the evaluation of cloud seeding: Statistical evidence for the enhancement of precipitation. Earth Space Sci. 2018, 5, 425–439. [Google Scholar] [CrossRef]
  65. Curic, M.; Lompar, M.; Romanic, D.; Zou, L.; Liang, H. Three-dimensional modelling of precipitation enhancement by cloud seeding in three different climate zones. Atmosphere 2019, 10, 294. [Google Scholar] [CrossRef]
  66. Yoshida, Y.; Murakami, M.; Kurumizawa, Y.; Kato, T.; Hashimoto, A.; Yamazaki, T.; Haneda, N. Evaluation of snow augmentation by cloud seeding for drought mitigation. J. Jpn. Soc. Hydrol. Water Resour. 2009, 22, 209–222. [Google Scholar] [CrossRef]
  67. Chu, X.; Geerts, B.; Xue, L.; Pokharel, B. A case study of cloud radar observations and large-eddy simulations of a shallow stratiform orographic cloud, and the impact of glaciogenic seeding. J. Appl. Meteorol. Clim. 2017, 56, 1285–1304. [Google Scholar] [CrossRef]
  68. Liu, J.; Du, J.; Wang, F.; Liu, D.L.; Tang, J.; Lin, D.; Tang, Y.; Shi, L.; Yu, Q. Optimal methods for estimating shortwave and longwave radiation to accurately calculate reference crop evapotranspiration in the high-altitude of central Tibet. Agronomy 2024, 14, 2401. [Google Scholar] [CrossRef]
  69. Li, T.; Jiang, Z.; Zhao, L.; Li, L. Multi-model ensemble projection of precipitation changes over China under global warming of 1.5 and 2 °C with consideration of model performance and independence. J. Meteor. Res. 2021, 35, 184–197. [Google Scholar] [CrossRef]
  70. Luan, H.; Shen, H.; Pan, Y.; Guo, B.; Lv, C.; Xu, R. Elucidating the hypoxic stress response in barley (Hordeum vulgare L.) during waterlogging: A proteomics approach. Sci. Rep. 2018, 8, 9655. [Google Scholar] [CrossRef]
  71. de San Celedonio, R.P.; Abeledo, L.G.; Miralles, D.J. Identifying the critical period for waterlogging on yield and its components in wheat and barley. Plant Soil 2014, 378, 265–277. [Google Scholar] [CrossRef]
  72. Pang, J.; Zhou, M.; Mendham, N.; Shabala, S. Growth and physiological responses of six barley genotypes to waterlogging and subsequent recovery. Aust. J. Agric. Res. 2004, 55, 895–906. [Google Scholar] [CrossRef]
  73. Ylivainio, K.; Jauhiainen, L.; Uusitalo, R.; Turtola, E. Waterlogging severely retards P use efficiency of spring barley (Hordeum vulgare). J. Agron. Crop Sci. 2018, 204, 74–85. [Google Scholar] [CrossRef]
  74. Hossain, M.M.; Sultana, F.; Rubayet, M.T.; Khan, S.; Mostafa, M.; Mishu, N.J.; Al Sabbir, A.; Akter, N.; Kabir, A.; Mostofa, M.G. White Mold: A Global Threat to Crops and Key Strategies for Its Sustainable Management. Microorganisms 2024, 13, 4. [Google Scholar] [CrossRef]
  75. Kumar, D.; Mukhopadhyay, R. Climate change and plant pathogens: Understanding dynamics, risks and mitigation strategies. Plant Pathol. 2025, 74, 59–68. [Google Scholar] [CrossRef]
Figure 1. Locations of the experimental sites and distribution of weather stations in the study.
Climate 13 00083 g001
Figure 2. Validation of the WOFOST model against (a) the phenological date and (b) grain yield in Lhasa, Nandong, and Longzi.
Climate 13 00083 g002
Figure 3. Variations in monthly SPEI at 3-month scale in different locations from 1991 to 2020.
Climate 13 00083 g003
Figure 4. Classification of meteorological drought conditions by the averaged SPEI in the growth period of highland barley.
Climate 13 00083 g004
Figure 5. Effects of precipitation enhancement at vegetation stage on yield increases of highland barley under different drought conditions.
Climate 13 00083 g005
Figure 6. Effects of precipitation enhancement at reproductive stage on yield increases of highland barley under different drought conditions.
Climate 13 00083 g006
Figure 7. Spatial distribution of yield increases under different precipitation enhancement scenarios at vegetative stage.
Climate 13 00083 g007
Figure 8. Spatial distribution of yield increases under different precipitation enhancement scenarios at reproductive stage.
Climate 13 00083 g008
Figure 9. Response of increased yield to both planting area and enhanced precipitation in Longzi under different stages: (a) the vegetative stage; (b) the reproductive stage.
Climate 13 00083 g009
Figure 10. Economic benefits from precipitation enhancement at vegetation stage in Longzi under different drought conditions.
Climate 13 00083 g010
Figure 11. Economic benefits from precipitation enhancement at reproductive stage in Longzi under different drought conditions.
Climate 13 00083 g011
Figure 12. Performance of GCMs in Longzi under baseline conditions.
Climate 13 00083 g012
Figure 13. Simulated yields under different climate change scenarios. (a) Yields under SSP245 scenario; (b) yields under SSP585 scenario.
Climate 13 00083 g013
Table 1. Detailed information on the weather stations used in this study.
StationLatitude/NLongitude/EAltitude/mPrecipitation in Growth Period/mm
Dangxiong30.48391.1004200.0382.2
Jiacha29.15092.5833260.0378.1
Langkazi28.96790.4004431.7312.2
Lhasa29.66791.1333648.9376.3
Longzi28.41792.4673860.0241.8
Mozhugongka29.85091.7333804.0432.1
Naidong29.25091.7673551.7332.0
Nimu29.43390.1673809.4291.1
Table 2. Information on 22 global climate models (GCMs) used in this study.
Model No.Name of GCMAbbreviation of GCMInstituteCountry
1ACCESS-CM2ACC1ACCESSAustralia
2ACCESS-ESM1-5ACC2ACCESSAustralia
3BBC-CSM2-MRBCCCBCC, CMAChina
4CanESM5Can1CCCMACanada
5CMCC-CM2-SR5CMCSCMCCItaly
6CNRM-ESM2-1CNR1CNRM-CERFACSFrance
7CNRM-CM6-1CNR2CNRM-CERFACSFrance
8EC-Earth3ECE1EC-Earth ConsortiumEurope
9FGOALS-g3FGOAIAP, CASChina
10GFDL-CM4GFD1GFDLUSA
11GFDL-ESM4GFD2GFDLUSA
12GISS-E2-1-GGISSNASA-GISSUSA
13HadGEM3-GC31-LLHadGMOHCUK
14INM-CM4-8INM1INMRussia
15INM-CM5-0INM2INMRussia
16IPSL-CM6A-LRIPSLIPSLFrance
17MIROC6MIR1MIROCJapan
18MIROC-ES2LMIR2MIROCJapan
19MPI-ESM1-2-HRMPI1MPIGermany
20MPI-ESM1-2-LRMPI2MPIGermany
21MRI-ESM2-0MTIEMRIJapan
22UKESM1-0-LLUKESMOHCUK
Table 3. Trend analysis of annual SPEI and SPEI in the growth periods of highland barley.
StationAnnual SPEISPEI in the Growth Periods
Trend Z ValueHurst ValueTrendZ ValueHurst Value
Dangxiong−0.019−1.1960.7050.0070.2850.613
Jiacha−0.032−2.2120.685−0.020−1.2850.677
Langkazi−0.021−1.5000.651−0.007−0.3930.626
Lhasa−0.025−1.9450.632−0.002−0.2500.608
Longzi0.0000.0010.5280.0020.0710.612
Mozhugongka−0.022−1.2130.653−0.010−0.4640.661
Naidong−0.015−1.4990.6590.0080.4280.584
Nimu−0.055−3.1040.716−0.040−2.3550.680
Disclaimer/Publisher’s Note: The statements, opinions and data contained in all publications are solely those of the individual author(s) and contributor(s) and not of MDPI and/or the editor(s). MDPI and/or the editor(s) disclaim responsibility for any injury to people or property resulting from any ideas, methods, instructions or products referred to in the content.

