1. Introduction
As understanding and awareness of global climate changes have become more widespread, the local context of climate change has become an increasingly important issue for local governments, communities and institutions concerned about water supply, extreme weather events, and the economic and social consequences of changes in seasonal climate conditions and variability. In addition to large-scale global and regional drivers, there is an increasing body of literature that demonstrates that land use and land cover changes (LULCC) associated with anthropogenic activities such as urbanization and deforestation can impact local climates [
1,
2,
3,
4,
5,
6,
7].
The effects of urbanization on local climate were first observed in Europe centuries ago (as cited in [
8]) leading to the recognition of what is now known as the Urban Heat Island (UHI) effect. Although there has been considerable interest in evaluating temperature differences between urban areas and their rural surroundings [
3,
9,
10,
11,
12,
13,
14], studies of variations in long-term precipitation due to urbanization [
6,
15,
16] or other changes in land use and land cover (LULC), such as deforestation/afforestation, are limited [
4]. Deforestation can result in albedo increases, reduction of evapotranspiration (which changes sensible and latent heat partitioning), and rainfall interception [
15]. Such changes resulting from deforestation have been linked to reductions in cloud cover and cloud formation height that could reduce precipitation [
4,
15]. On the other hand, afforestation (the creation of forests in places where they did not previously exist), although considered desirable in some respects, may lead to unintended results depending on local conditions and processes [
4]. This reinforces the importance of studying climate responses to LULCC in a variety of environmental settings.
Much of the existing work examining the impacts of LULCC on local climates has focused on mid-latitude continental sites. However, the complex dynamics of LULCC-climate mechanisms vary from place to place and between land-cover classes [
4]. Further, it is known that similar land cover changes induce different climate feedbacks at different latitudes [
17,
18]. There is comparatively little climate research in tropical settings and on small tropical islands [
15,
19]. Such work is particularly challenging because of a typical scarcity of long-term data and low data densities [
19]. Further, the traditional coarse resolution grids designed for climate assessment in continental settings, including generalized assumptions of similar vegetation and land cover types, are not well suited for studying the scale and heterogeneity of small regions. However, LULCC may be an important component of climate change on small tropical islands, particularly given widespread historical vegetation changes associated with agricultural transitions and rapid urbanization, including coastal development related to tourism. However, the weather and climate of tropical islands is also affected by strong maritime influences as well as synoptic scale phenomena, such as El Niño and the North Atlantic Oscillation.
Fortunately, the existence of long-term databases and a relatively high density of observation stations in Puerto Rico may provide unique opportunities to assess climate variations on a small tropical island and to detect and isolate any regional drivers of local climate conditions. A variety of climate studies have been undertaken in Puerto Rico addressing temperature regionalization [
20,
21], precipitation regionalization [
20,
21,
22,
23,
24,
25], rainfall classification [
22,
26,
27], regional synoptic influences [
24], urban heat islands [
8,
12], and using observation and numerical experiments [
8,
12,
28] (
Table 1). The work presented here characterizes precipitation patterns in Puerto Rico and provides a first attempt to assess in detail the question of whether long-term spatial and temporal changes in precipitation reflect variations related to local land use and land cover changes. We discuss how global and regional synoptic phenomena influence Puerto Rico’s climate and then analyze a century of data with a range of methods to test hypotheses relating LULCC to precipitation changes and differences.
Table 1.
Summary of previous published precipitation research for Puerto Rico.
Table 1.
Summary of previous published precipitation research for Puerto Rico.
| Article | # Stations | Period | Method | Remarks |
|---|
| Ray, 1933 [29] | 46 | 1899–1932 | % departures from normal | The smaller the average the greater the year by year variation and vice versa. Gradual decrease in precipitation preceded drought years. Wet years come in pairs |
| Ewel and Whitmore, 1973 [20] | 143 | 1900–1969 | Holdridge Ecological Life Zones | Microclimate classification based on biotemperature, humidity and precipitation. Various lengths of data, longest individual period 15 years |
| Pagan-Trinidad, 1984 [26] | 10 | 1971–1983 | Statistics, frequencies, probability | Spatial and temporal variability of storm rainfall (storm duration, rain intensity) Geographic consideration |
| Carter and Elsner, 1996 [22] | 22 | 1973–1988 | EOF | Diurnal rainfall regionalization (6 regions), No land cover change considered. The eastern part showed low hourly variability while the western part showed high hourly variability. |
| Carter and Elsner, 1997 [23] | 22 | 1973–1988 | EOF, Statistical Classification Tree | Regionalization (6 regions), No land cover considered |
| Malmgren et al., 1998 [30] | 5 | 1901–1995 | Station data, SOI and NAO indexes, Burnaby test | Regional synoptic phenomena rainfall and temperature influence over PR |
| Malmgren and Winter 1999 [24] | 18 | 1960–1990 | Rotated PCA and Neural Networks | Seasonal Rainfall Regionalization (4 zones) In three zones precipitation increased consecutively at each season and peaked in the Fall, in one zone it peaked in the summer. |
| Larsen 2000 [31] | 12 | 1900–2000 | Drought Index, rainfall vs. stream flow comparison | Interregional and intraregional analysis. Precipitation decreasing in the Caribbean and PR |
| Comarazamy, 2001 [32] | 15 | April 1998 | Mesoscale model | April 1998 wind and rainfall simulation San Juan city precipitation was under predicted, The most accurate results occurred at higher elevations were uplift from northeasterly winds interacts with steeper slopes |
| Van der Molen, 2002 [17] | 1 portable + various on site instruments | May 1997–May 1998 | Field observations, mesoscale model | Analyzed deforested areas, measured forest reservation forests, Urban land cover not considered |
| Chen and Taylor 2002 [33] | >100 | January 1921–December 1986 | EOF/COLA AGCM | EOF first mode from Caribbean early precipitation strongly correlates with ENSO +1 |
| Daly et al., 2003 [21] | 47 Temp; 108 Precip. | 1963–1995 | PRISM | No land cover change considered. Spatial variation of rainfall was associated to elevation, upslope exposure to winds carrying moisture and distance to coastline. |
| Neelin et al., 2006 [14] | Gridded data | 1970–2003
1950–2002
1951–2000 | Satellite databases, gridded station data, Precipitation models | Higher model agreement in the Caribbean and Central American of Summer drying trend and increase in heavy rain events |
| Ramírez-Beltrán et al., 2007 [27] | 6 | 1901–2001 | Statistical models | Logistic Regression; Categorical Classification of precipitation events, no land cover considered |
| Jury et al., 2007 [25] | 35 regional (7 from PR) | 1951–1981 | Factor Analysis | Caribbean basin rainfall regionalization |
| Nyberg et al., 2007 [34] | 4 cores (paleo study) | 1730–2005 | Coral cores, wind shear records, artificial neural networks | Historical Caribbean basin hurricane activity |
| Comarazamy and González, 2008 [28] | 15 | 1993 and 1998 | Mesoscale model | Early wet season simulation, No land cover change considered |
| Harmsen et al., 2009 [35] | 3 | 1960–2000 | GCM downscaling, trends, linear regression | Precipitation deficits scenarios resulted in crop yield reduction and wetter wet seasons and drier dry seasons |
| Jury, 2009 [36] | Interpolated data from 17,000 Caribbean stations to grids | 1979–2000 | Observations, Reanalysis, Satellite, and Coupled Model Data | Evaluated ability of different products to represent mean annual Caribbean rainfall. Caribbean rainfall is projected to decline around 20% over the next 100 years. |
| Jury and Sanchez, 2009 [37] | 60 (rain gages) | 1979–2005 | NCAR, statistics of daily rainfall | Most flood events in Puerto Rico occurred in May, August and September |
| Comarazamy et al., 2010 [38] | N/A Atlas Mission Observations | 10–20 February 2004 | Mesoscale model | Mixed Urban and Natural adjustments yielded more accurate results. U-R temperature up to 2.5° C difference. Increased precipitation downwind Southwest San Juan |
| Angeles et al., 2010 [39] | NOAA data at 1°, NCEP 2.5° reanalysis data, and NOAA-NCEP CPC merged analysis (Xie-Arkin) dataset | Climatology 1983–2004
Simulated
July 2002 and July 2003 | RAMS | Built a Caribbean Bimodal index. Mid-Summer Drought over Puerto Rico related to Saharan dust aerosol particles and vertical wind shear. |
| Comarazamy and Gonzalez, 2011 [40] | NCEP 2.5° reanalysis data, 5 surface stations | April–June 1955–1959 and April–June 2000–2004 | RAMS | Larger scale climate impacts induce changes in wind magnitude and direction, cloud base heights, and total column liquid water content resulting in total surface accumulated precipitation changes. |
2. Study Area
Puerto Rico is the smallest of the Greater Antilles located at 18°N latitude and 66°W longitude in the eastern part of the Caribbean basin, and one of the world’s biodiversity hotspots [
41]. Puerto Rico is 160 km long by 50 km wide and includes several smaller islands [
42]. The main island has a Central Mountain Range running east west, the Luquillo Mountains in the northeast and karst topography dominates in the northwest. Fifty-three percent of the island’s terrain is mountainous, 25% are plains and 20% hills [
42]. Wetter regions occur on the northern side of mountains that shield the southern drier region from Atlantic moisture. Precipitation in Puerto Rico shows a yearly cycle with a bimodal distribution (two maxima) peaking first in May as the wet season starts followed by the “Mid Summer Drought” [
43] and then a second and biggest peak in October-November, consistent with patterns across Central America and the Caribbean Basin [
25,
33,
36,
39,
44,
45]. Mean annual temperatures range from 22 °C to 25 °C [
42]
. Six distinctive Holdridge Ecological Lifezones (HELZ; [
46]) are found in Puerto Rico (HELZ are defined by humidity, annual precipitation and potential evapotranspiration) ranging from Rain Forest (precipitation over 4000 mm/year) to Dry Forest (precipitation below 900 mm/year) [
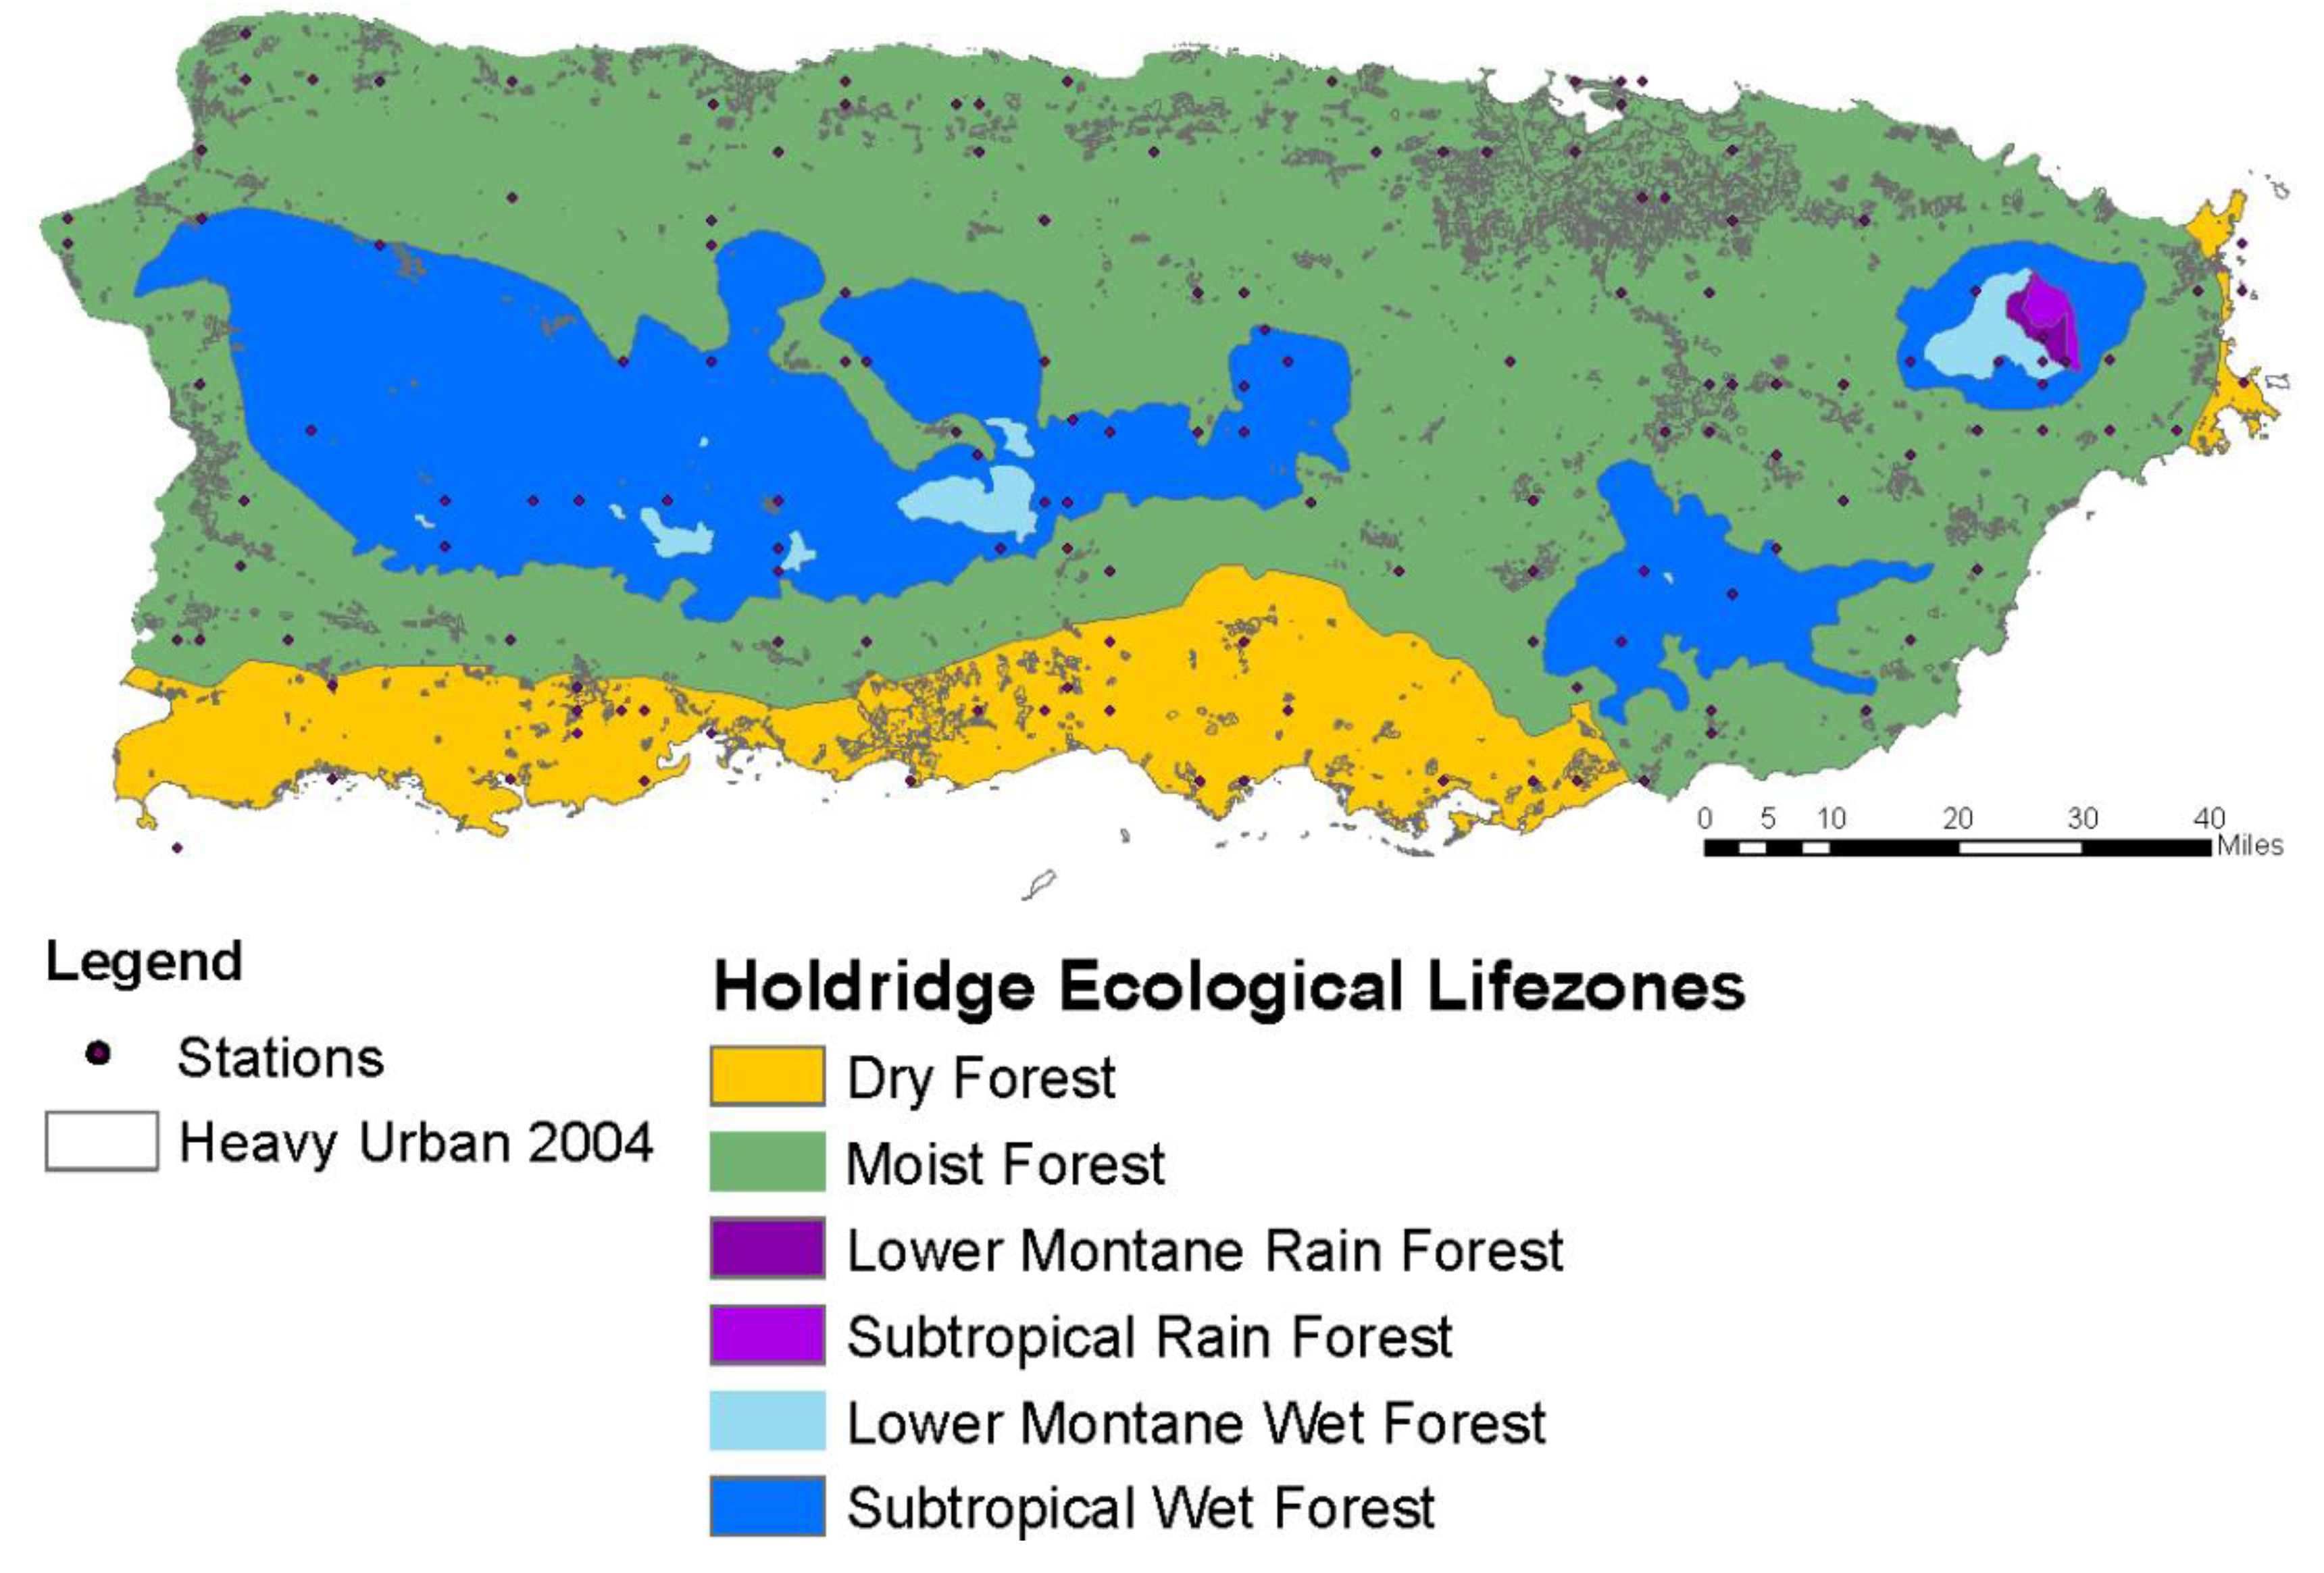
30]; however 99% of the island is covered by Moist Forest, Dry Forest, and Wet Forest HELZ (
Figure 1). Seasonal temperature trends and long-term trends in mean annual temperature in Puerto Rico generally track equivalent trends in Global Land and Sea Surface Temperatures [
11].
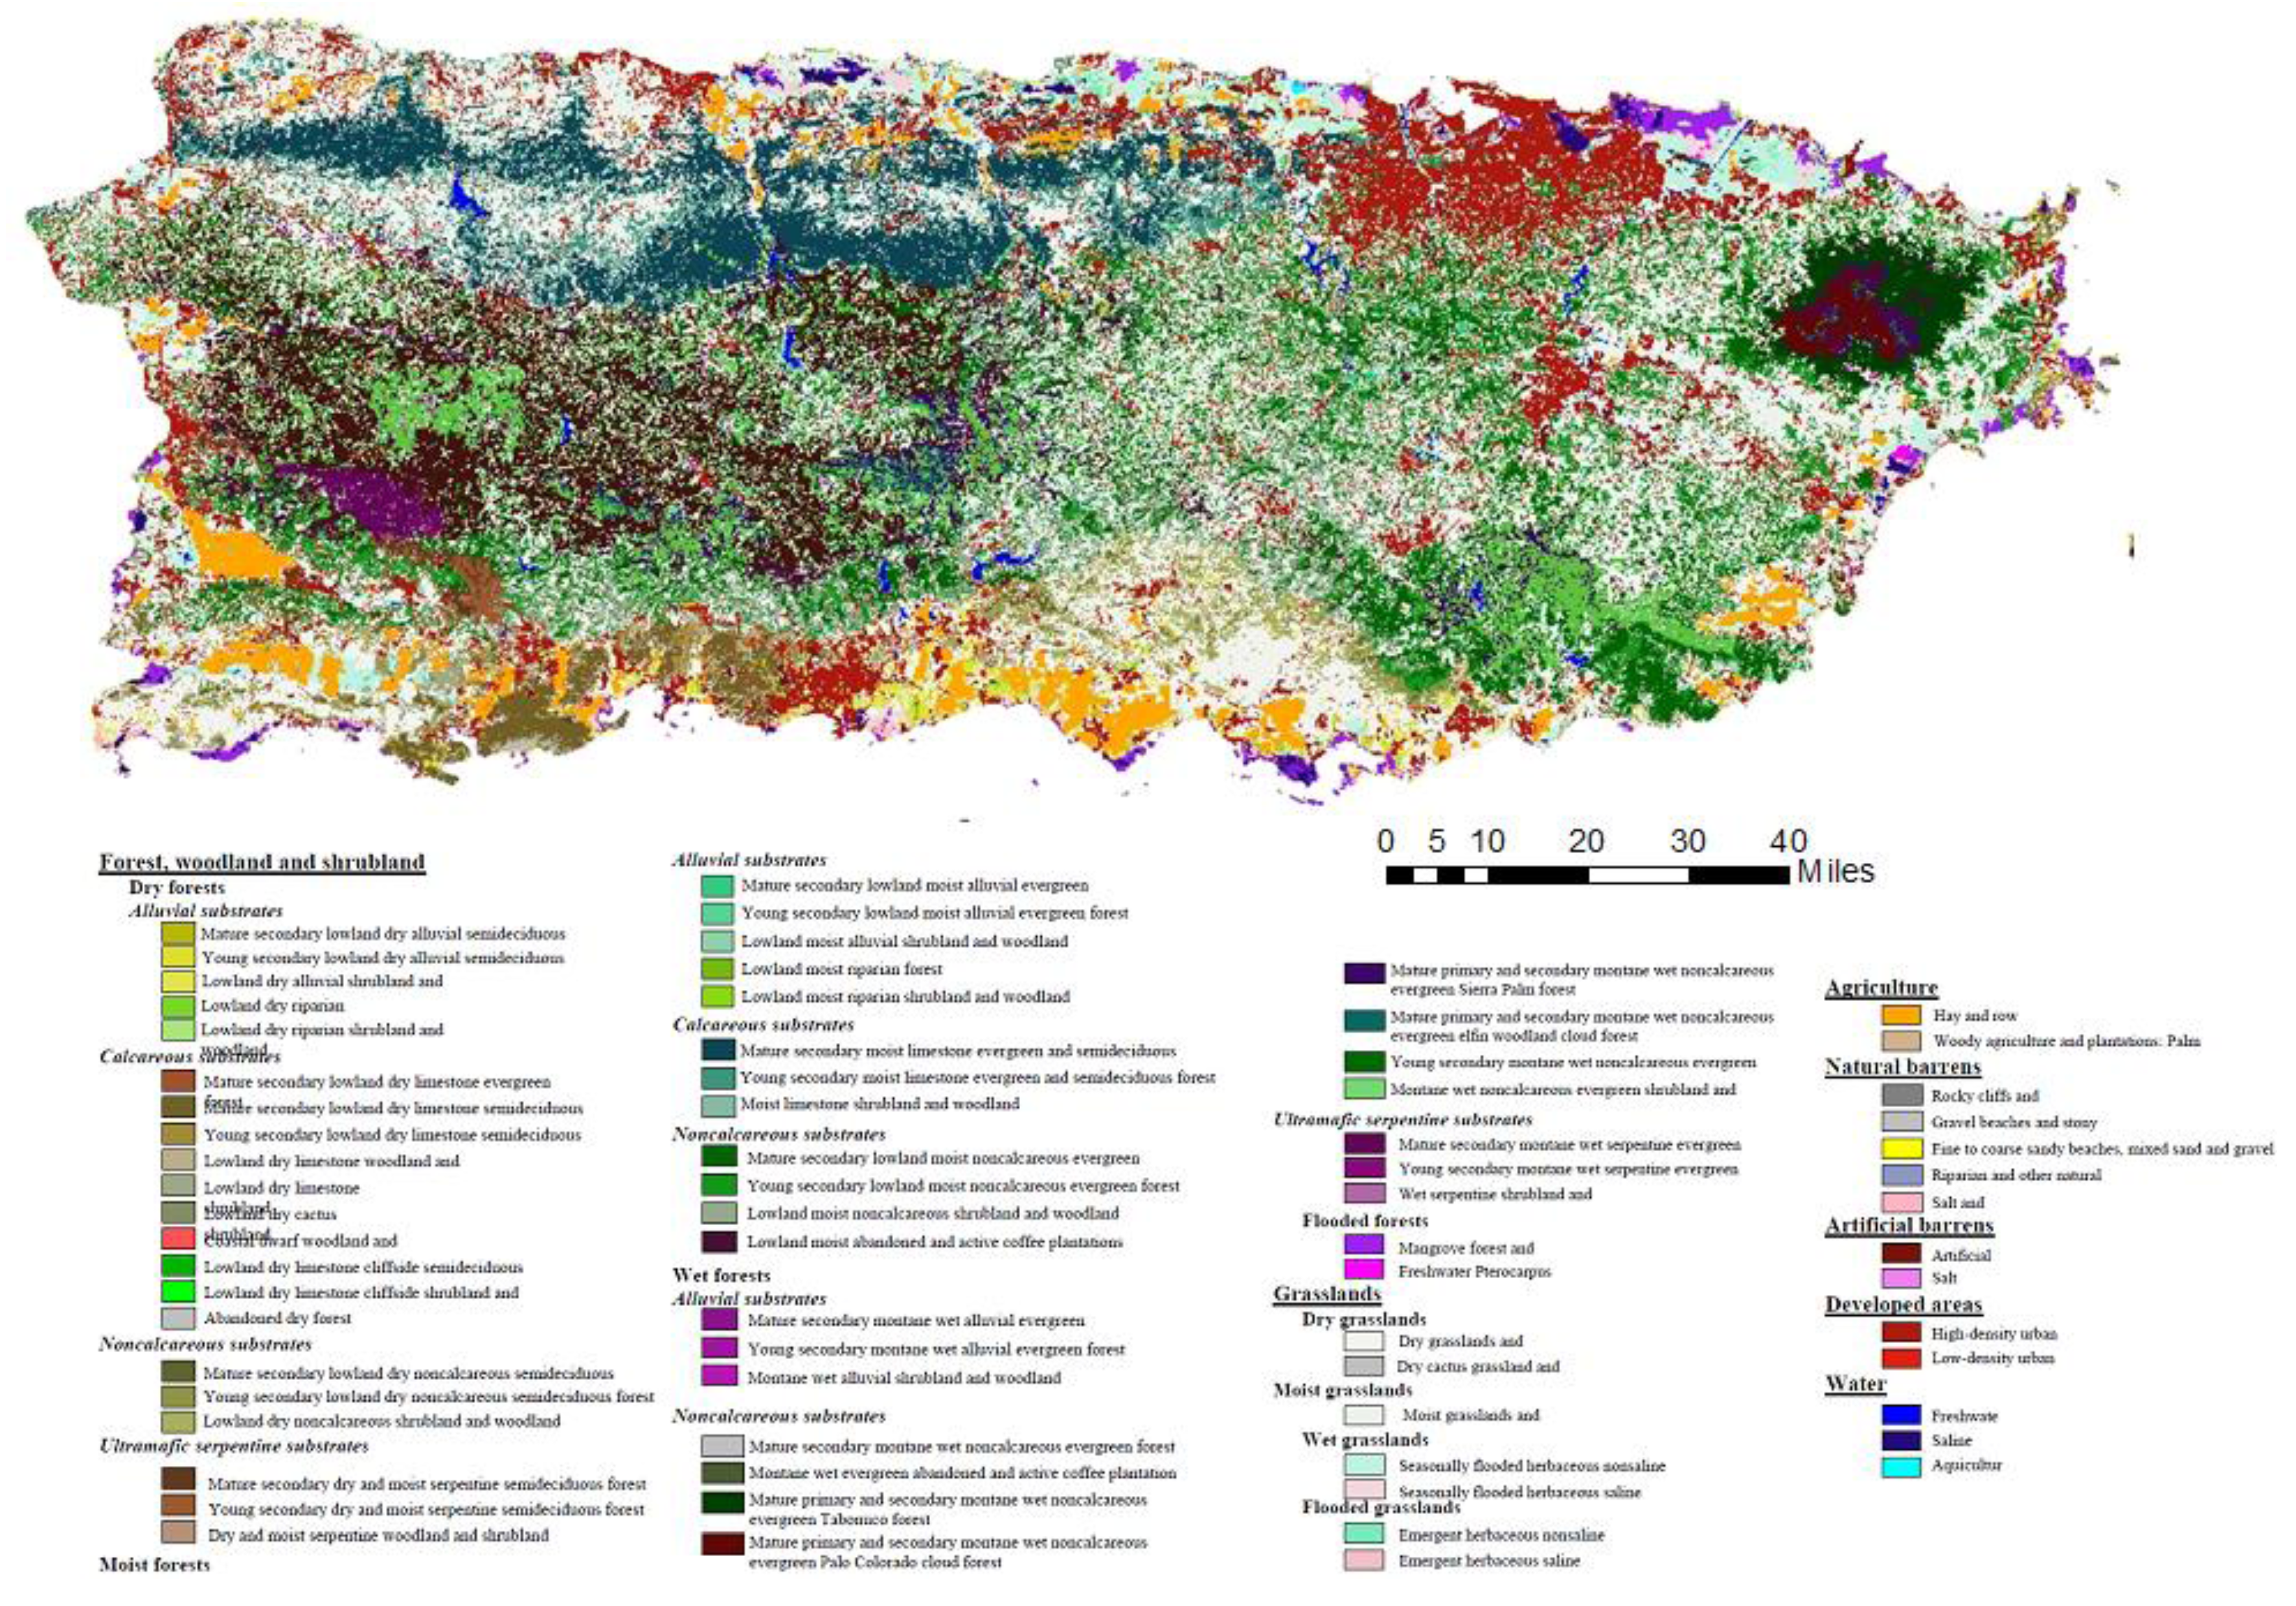
Figure 1.
Puerto Rico’s Holdridge Ecological Lifezones, Areas of Interest, and Weather stations. HELZ data from US Forest Service, urban areas data from Puerto Rico GAP 2004, weather stations data from NOAA Historical Climate Network.
Figure 1.
Puerto Rico’s Holdridge Ecological Lifezones, Areas of Interest, and Weather stations. HELZ data from US Forest Service, urban areas data from Puerto Rico GAP 2004, weather stations data from NOAA Historical Climate Network.
Pagán-Trinidad [
26] identified several major forcings for precipitation in Puerto Rico that are a function of season and location:
Orographic—related to mechanical uplift of air caused by mountains. Mostly associated with persistent easterly Trade Winds in Eastern Puerto Rico during the Dry Season.
Convection—caused by differential land heating, including triggering by urban landscapes
Tropical Systems—easterly waves and synoptic scale systems bring precipitation for all or most of the island, especially during Hurricane season (July–November)
Cold fronts—westerly systems from northern latitudes dominate Western Puerto Rico during late Wet Season and Dry Season
This basic classification is useful for understanding the primary synoptic settings for precipitation episodes that underlie spatial and temporal variations in precipitation. In addition, other land biological, chemical and physical features or processes can affect variables such as temperature, humidity, surface roughness and aerosols that are related to precipitation. Temperatures affect vertical velocity and convective potential related to cloud formation and rain intensity. Aerosols affect water droplet formation and cloud formation potential. Surface roughness can increase convergence and cloud formation potential, inducing local precipitation. Land processes such as evapotranspiration, energy fluxes and cloud formation can also drive local precipitation, and evapotranspiration, water content, and humidity affect the availability of water for cloud formation [
40].
4. Data and Methods
The purpose of this study was to assess whether LULC and LULCC have a significant impact on long-term precipitation statistics in Puerto Rico over the past century. Within this scope, a primary research question was whether urban impacts could be detected in long-term monthly precipitation records in Puerto Rico. Precipitation data for LULC types of key local interest, such as “urban” and “regenerated forest” areas, were evaluated against data for nonurban areas within the same Holdridge Ecological Life Zone (HELZ) (
Figure 2 and
Figure 3); comparing data within HELZ was found to be a useful approach in understanding LULCC impacts on temperature [
13] and, thus, it is reasonable to apply a similar approach for the study of precipitation. To examine how various climate study methods help in understanding the role of LULCC on precipitation we used both simple and more sophisticated research methods, including descriptive and inferential statistics (Analysis of Variance; ANOVA), traditional climate research methods like trends analysis, and Geographic Information Systems (GIS).
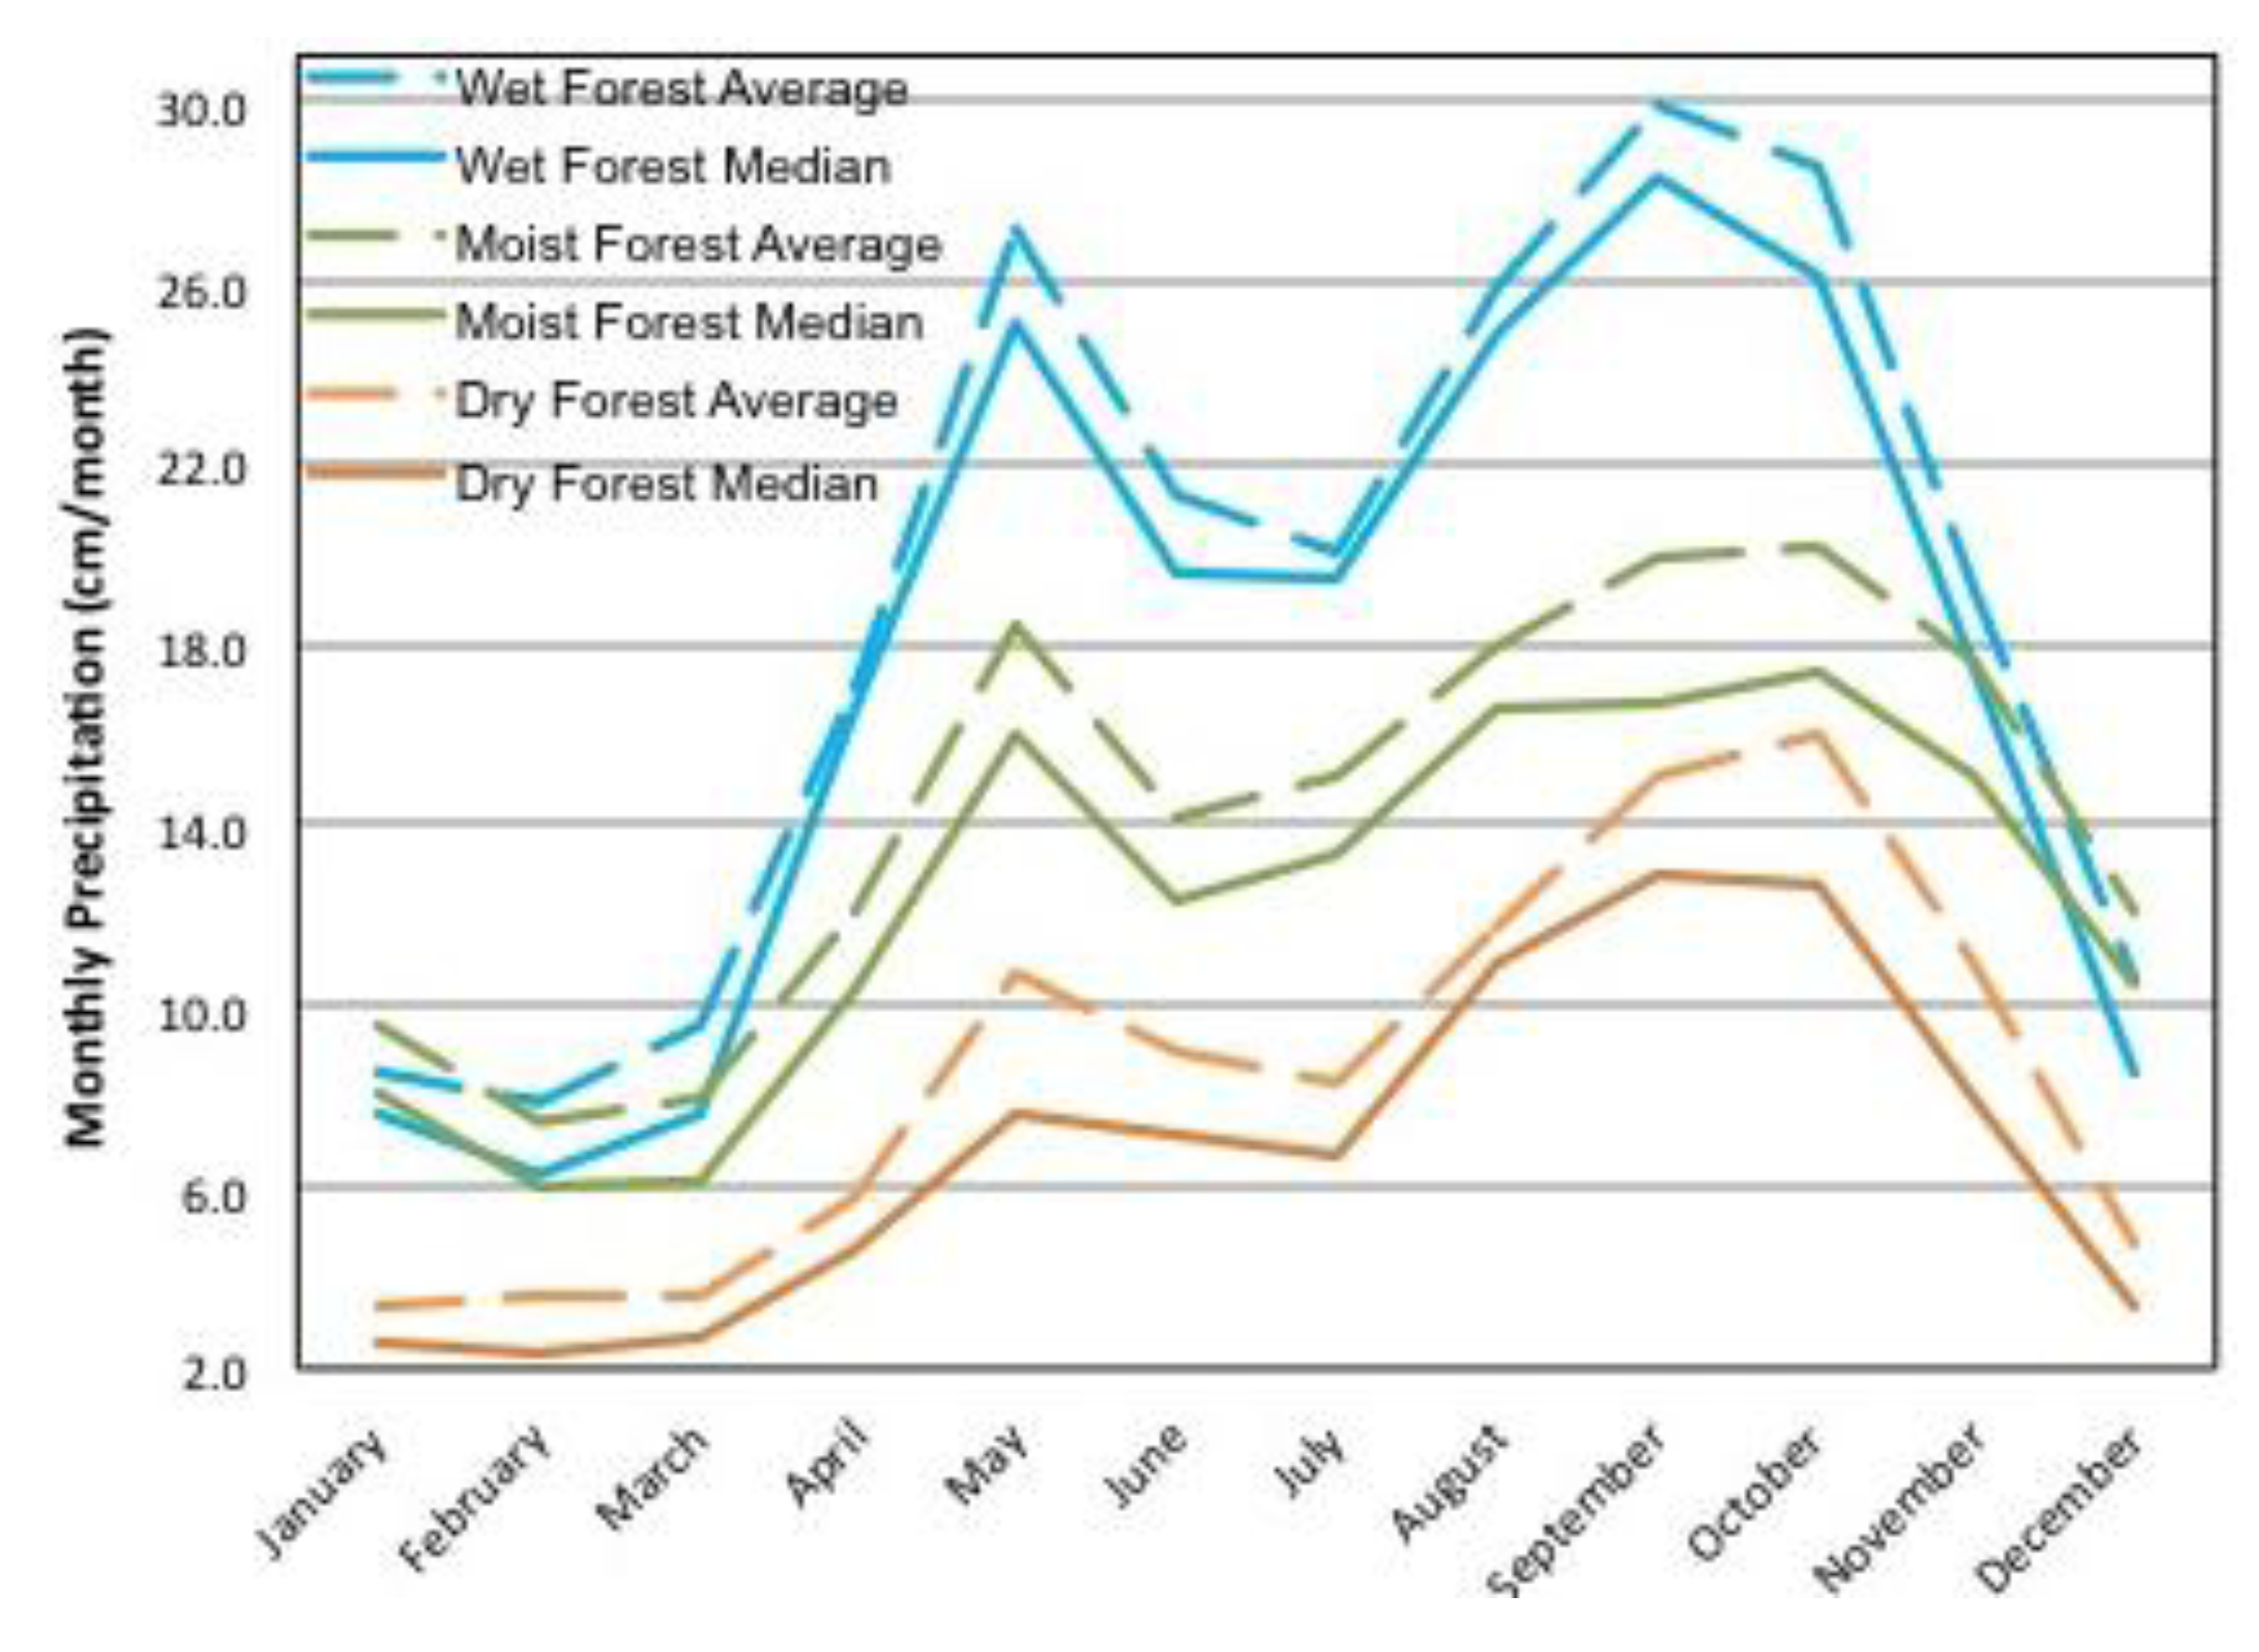
Figure 2.
Average and Median Precipitation by Month for Puerto Rico’s HELZ, 1900–2007.
Figure 2.
Average and Median Precipitation by Month for Puerto Rico’s HELZ, 1900–2007.
4.1. Precipitation and Land Use/Land Cover Data
Monthly raw total precipitation observation data for 1900–2007 from 139 stations in Puerto Rico were provided by NOAA and were used for geographical analysis. The Helmer
et al. [
41] Puerto Rico Forest Type and Land Cover digitized map (for 1992) and the Puerto Rico Gap Analysis Project map from Gould
et al. [
42] (for 2004) were provided by the United States Forest Service’s Institute of Tropical Forestry in Puerto Rico. The 1992 Map used 30 m grid spacing and 33 land use/cover classes while the 2004 Map used 15 m grid spacing and 72 land use/cover classes. Separate analysis about Urban
vs. Non Urban precipitation was done independently on each map to assess differences at current conditions. As urban land cover definition was different for each map, only internal differences were analyzed and no direct comparisons were made between the 1992 and 2004 maps.
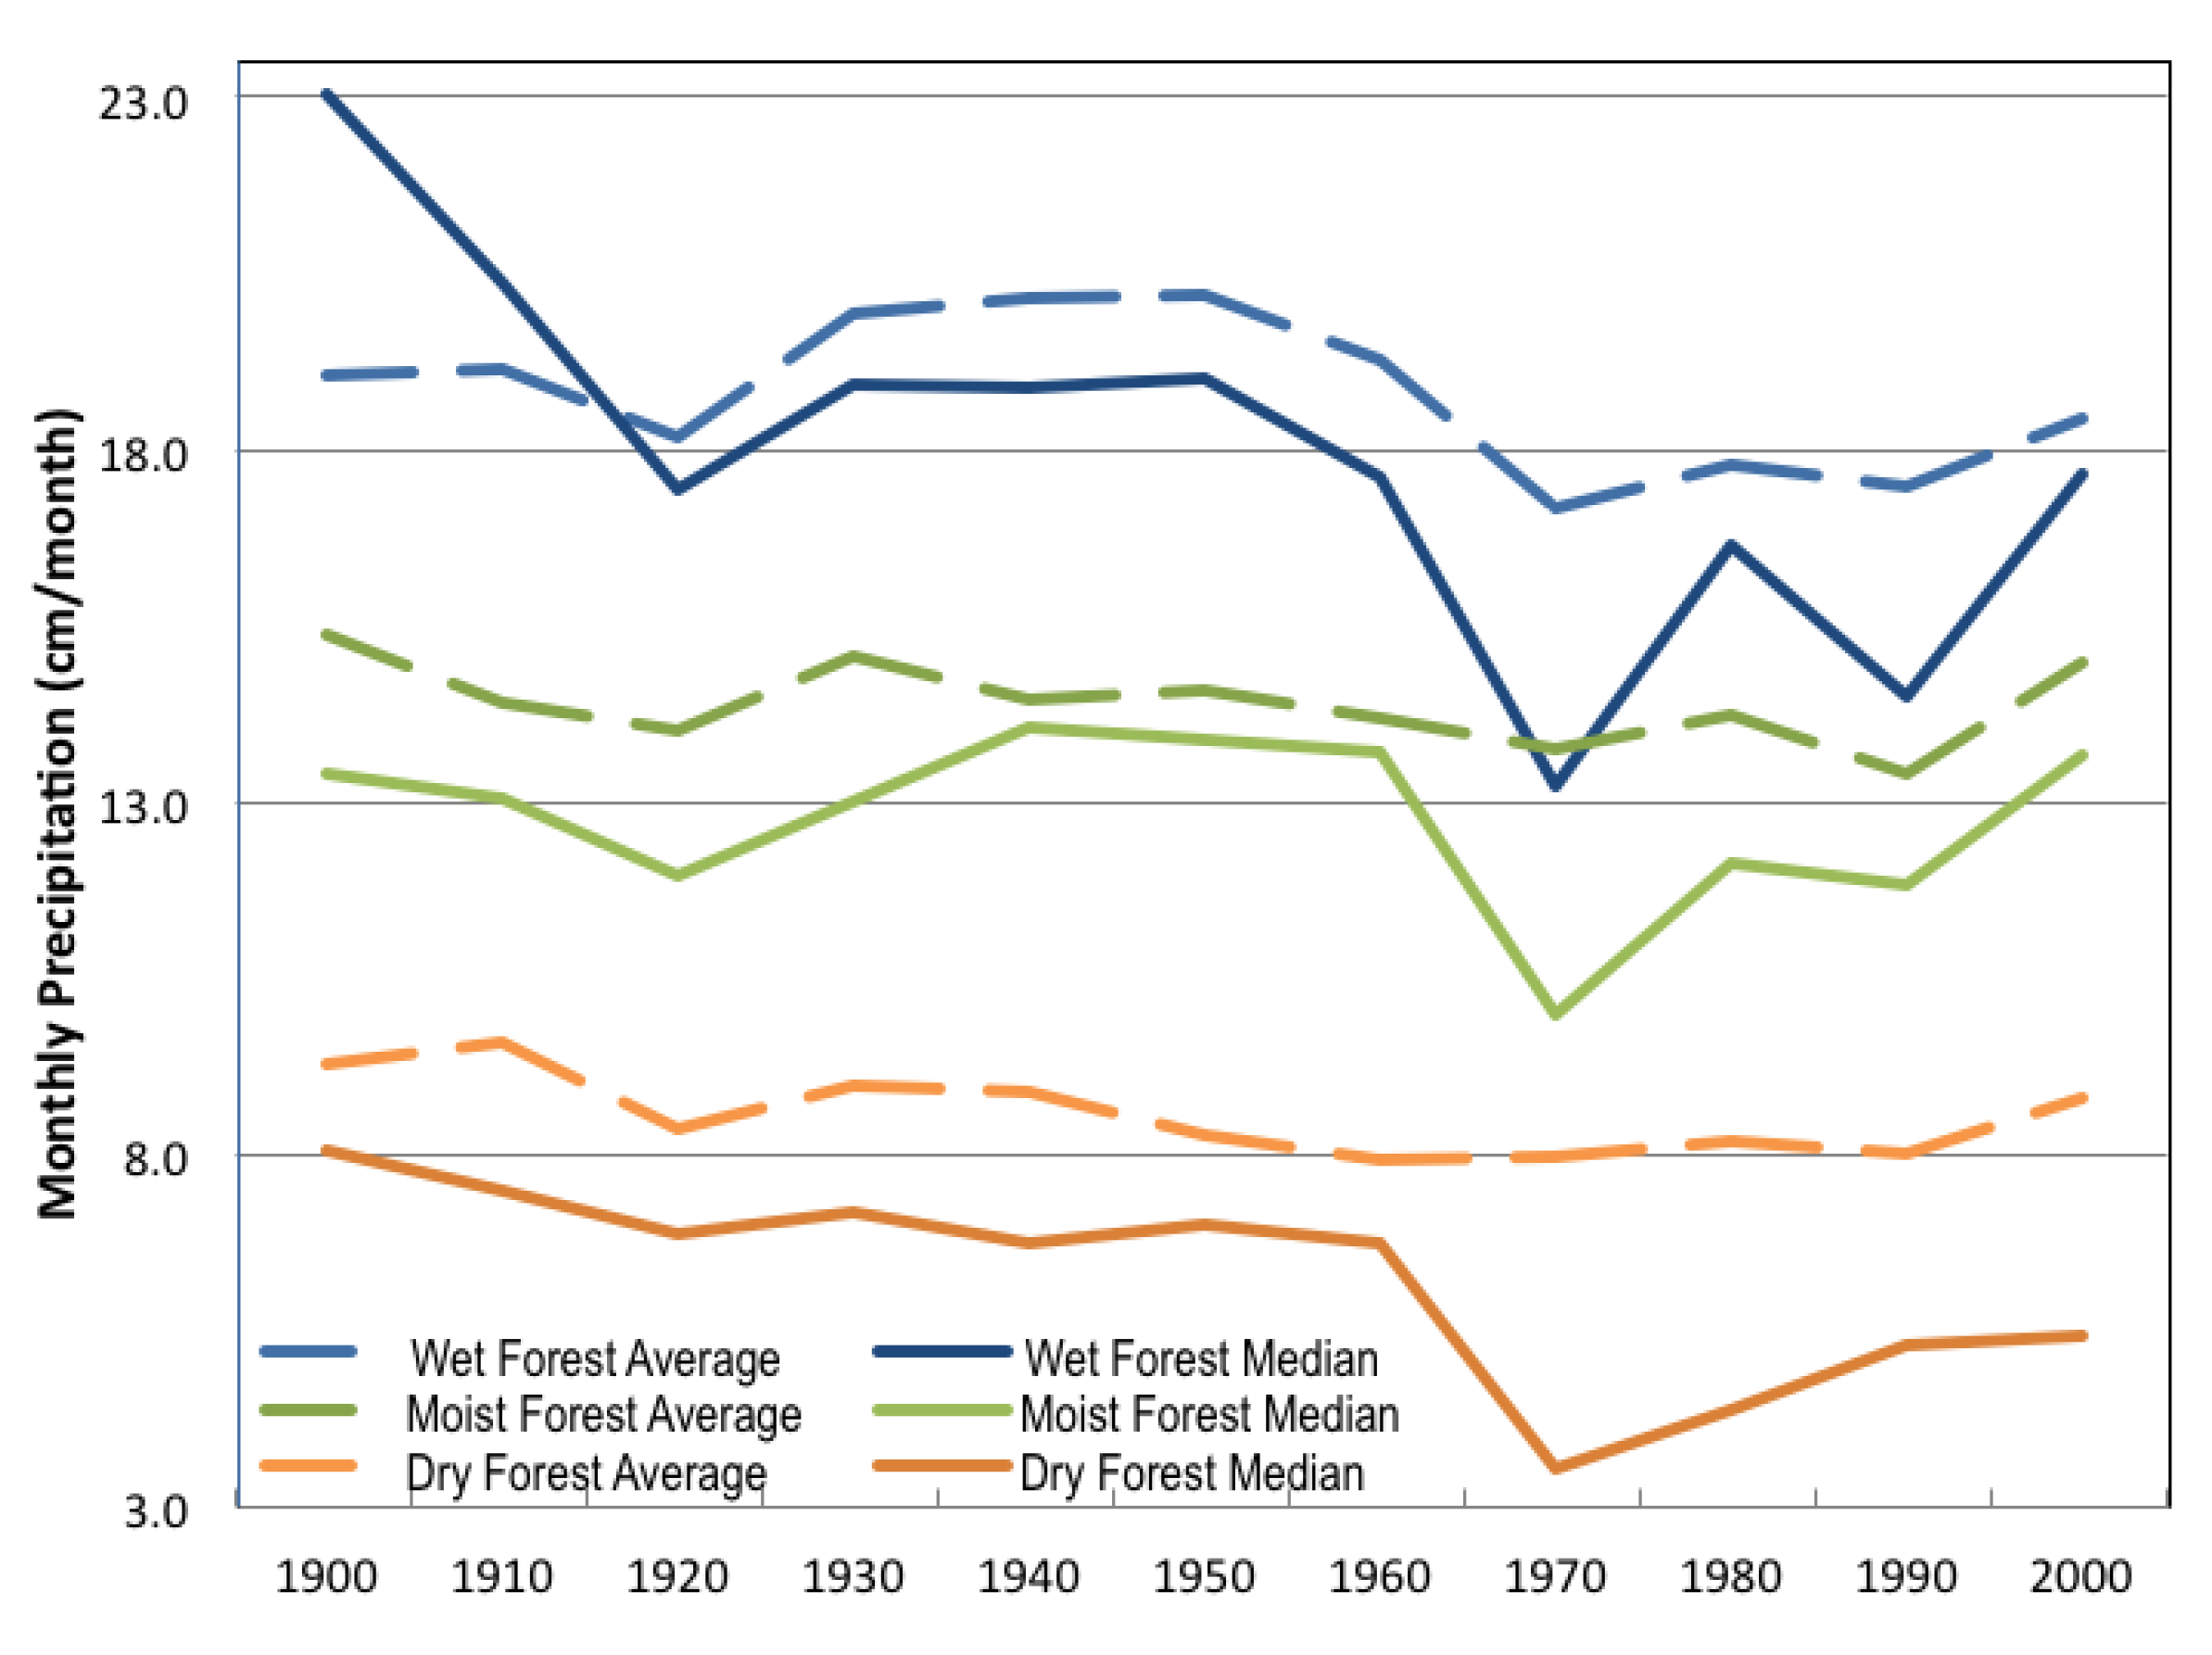
Figure 3.
Decadal trends in Average and Median Monthly Precipitation for Puerto Rico’s HELZ.
Figure 3.
Decadal trends in Average and Median Monthly Precipitation for Puerto Rico’s HELZ.
4.2. Puerto Rico Holdridge Ecological Lifezones Data
The US Forest Service’s Institute of Tropical Forestry in Puerto Rico provided Puerto Rico HELZ digital maps from the Puerto Rico Gap Analysis Project [
42] that were used in this study. There are six HELZs in Puerto Rico; Subtropical Dry Forest (DF), Subtropical Moist Forest (MF), Subtropical Wet Forest (WF), Subtropical Lower Montane Wet Forest (LMWF), Subtropical Lower Montane Rain Forest (LMRF), and Subtropical Rain Forest (RF). The main three HELZ are DF, WF and MF, which together cover 99% of the island. The DF is the smallest of the main HELZs, covering 14% of the island and has the highest temperatures and lowest precipitation. The MF is the largest HELZ and covers 62% of the island and has medium level temperatures and precipitation. The WF covers 23% of the island and has the lowest temperatures and highest precipitation. The remaining three HELZ cover less than 1% of the island and are mostly limited to the Rain Forest reservation. For simplification and convenience they were not analyzed as independent regions but considered part of the Rain Forest Reserve or the Wet Forest HELZ, however, all station data were used for map creation.
4.3. Statistical Methods
Since average quantities are heavily influenced by extreme values, average and median precipitation curves were plotted together to track occurrence of higher precipitation periods. We expect average and median curves to be very similar if data follows a symmetric distribution; however if higher precipitation periods dominate the frequency of periods then the median would be well above the average and if lower precipitation periods dominate the median would be well below the average.
Statistical analyses of the observational data focused on testing for precipitation differences between HELZ and between LULC classes within HELZ. To examine for possible precipitation differences associated with HELZ or land use, ANOVA was used to detect monthly, seasonal and decadal differences between regions. Digital maps were generated from individual station records by interpolating values and provided a visual representation of spatial patterns of precipitation.
In addition, the coefficient of variation, CV (standard deviation divided by mean) for each station was computed for different time periods. The CV estimates the variability of the data relative to its magnitude and is a useful tool to find spatial patterns of variability and change. The C V was mapped using Arc Map 10 Spatial Analyst Tool using the Inverse Distance Weighted (IDW) interpolation method to assess spatial patterns of change. The IDW method interpolates spatial values as a function of the inverse of the distance between stations and suitable for climate mapping. Preliminary test maps were generated using different settings of the IDW tool to assess its reliability to represent the broad island wide patterns of rainfall already known in Puerto Rico, such as the regions with the highest and lowest precipitation. IDW settings were kept at default values and we tested different grid sizes to find the best match with the highest resolution layer at 15 m by 15 m. Due to processing power limitations the grid sizes used in the analysis were set at 270 m and 100 m.
Simple linear regression was used to analyze precipitation time series linear trends in different time periods using a linear least squares fit model, given that the data fits a normal distribution. Data were analyzed in different time periods; the entire record of over a century of data (1900–2007); 30 year periods (1900–1929, 1930–1959, 1960–1989, and 1990–2007), PRISM (1963–1995) and Reanalysis (1979–2005). The later period of 1990–2007 is shorter including only the data available for a full year at the beginning of this study, the PRISM period is frequently used for studies because of the high amount of station/year data and the Reanalysis period is when atmospheric grid became available until the latest year available at the beginning of this study. We considered PRISM and Reanalysis periods to evaluate how quantitatively distinctive they are from the other periods and how selecting them could have altered our results. However, only the 30-year periods were considered for ANOVA although all periods were analyzed for trends.
4.4. GIS Methods
ARC MAP GIS 9.2 was used to select climate stations inside the HELZs and specific land use classes using the 1992 and 2004 LULC maps. Only stations located inside the main three HELZ were considered for regional ANOVA analysis but all (139) stations were used to generate GIS interpolated maps. From the 1992 LULC map, the “urban and barren” land cover class was considered as “urban” while in the 2004 LULC map, the “High Density Urban” land cover class was selected as “urban” (
Figure 4 and
Figure 5). Different biomes respond differently to impervious surfaces and so ecological contexts are important [
11]. To control for any local ecological variation, “urban” regions were analyzed in their HELZ against their respective “non urban” areas to avoid any misinterpretation of the results due to stations located in different HELZ. The two urban land covers from the 1992 and the 2004 maps were coded for the corresponding HELZ as U[HELZ]92 and U[HELZ]04 respectively.
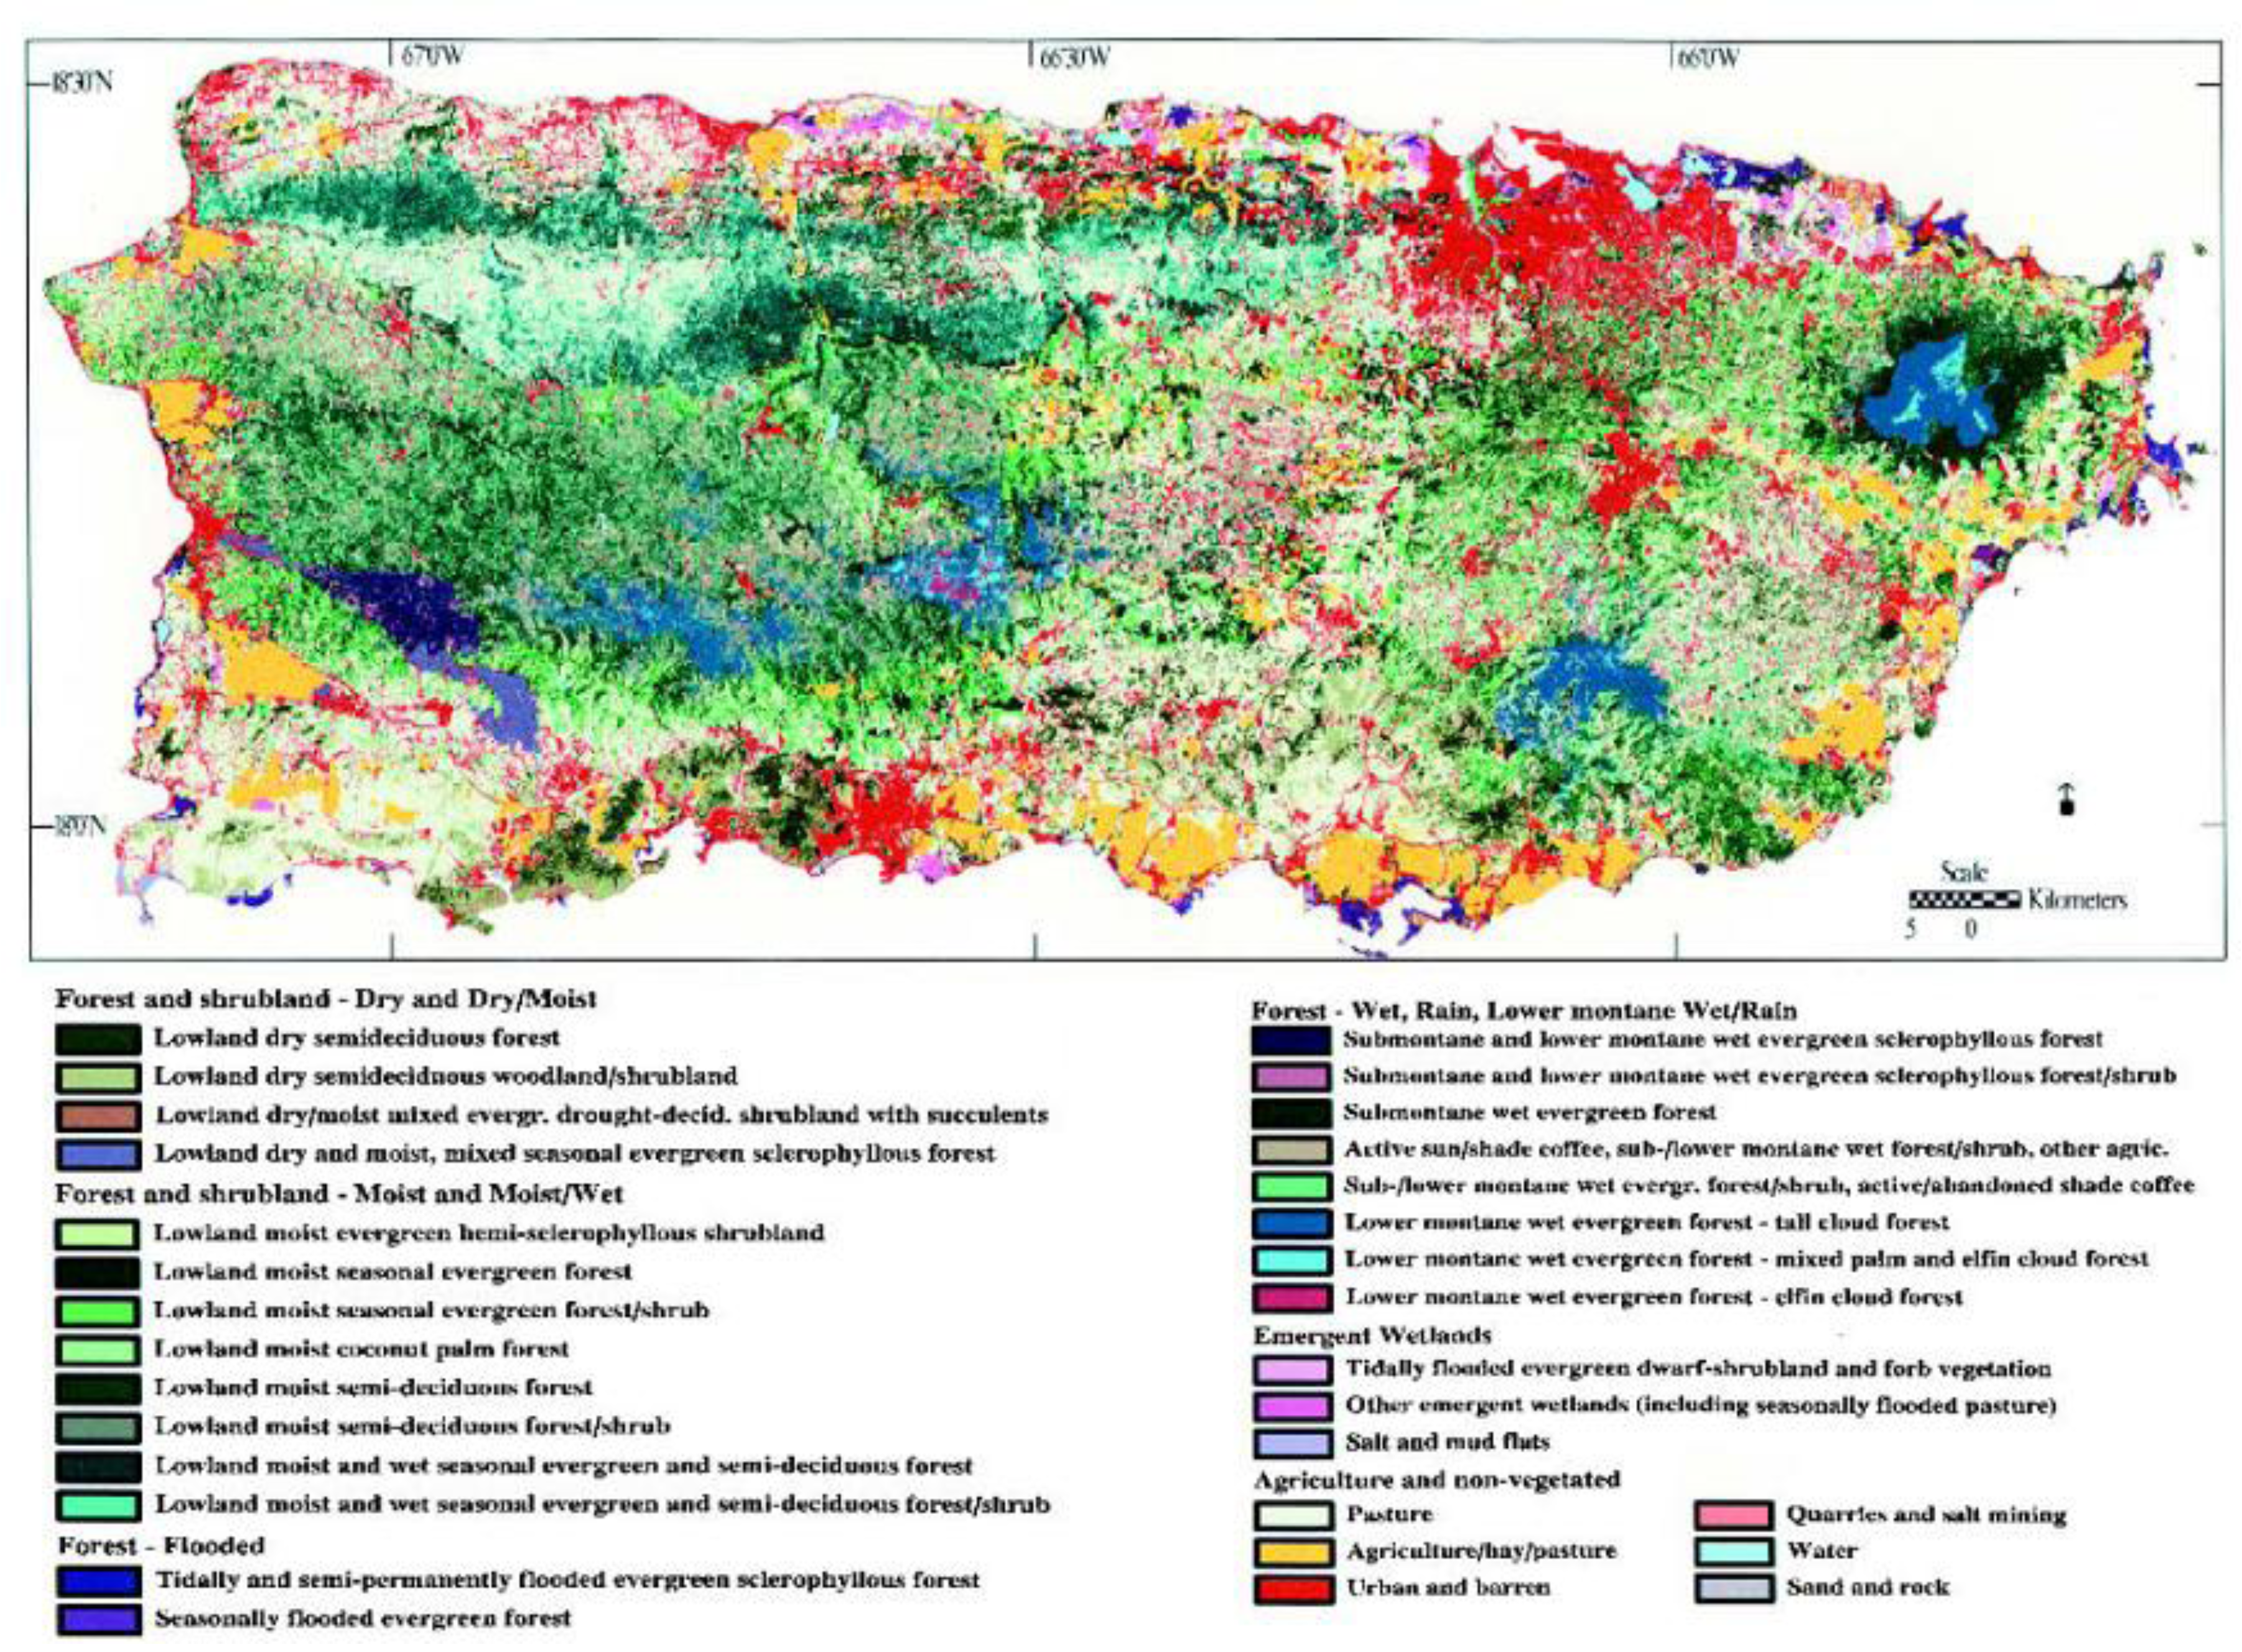
Figure 4.
Puerto Rico 1992 Land Cover Map from Helmer
et al. [
41].
Figure 4.
Puerto Rico 1992 Land Cover Map from Helmer
et al. [
41].
Reproduced by permission of the College of Arts and Sciences, University of Puerto Rico at Mayagüez.
Several data subsets were used for the analysis of urban regions because of the use of two different station regional selection methods (Type A and Type B). Each data subset was statistically analyzed in separate groups to meet statistical independence assumption criteria. The ARC MAP GIS 9.2 default “intersect” data selection method considered only stations contained inside the urban LULC and was classified as “Type A Selection”, the other method (Type B Selection) used 30, 60, and 90 m radius buffers around each station. Urban areas from A selection were coded 1992 A (U1992A) and 2004 A (U2004A), urban areas from the B selection were coded 1992 B (U1992B) and 2004 B (U2004B). As the number of urban stations increased by the increased buffer size, they were subtracted from the Non Urban counterpart and new averages were computed for both, the new urban region with additional stations and the new non-urban station with subtracted stations (
Table 3 and
Table 4).
The DF was subdivided into Urban Dry Forest by LULC map and Selection type into (UDF92A, UDF92B, UDF04A and UDF04B) which included all urban stations from the DF and Dry Forest Non Urban (DFNU92A, DFNU92B, DFNU04A, and DFNU04B), which excluded all urban stations from the DF. The MF was subdivided into Moist Forest (MF) consisting of all stations including those selected as “urban” for analysis purposes between the three HELZ, the Moist Forest Non Urban Selection A (MFNUA) and B (MFNUB) excluded urban stations for each and 1992 and 2004 LULC maps coded by selection type A or B (MFNU92A, MFNU92B, MFNU04A, and MFNU04B). The WF was subdivided into Wet Forest Reserve (WFR) located at the base of the Rain Forest Reserve, the Unregenerated Wet Forest at the east (URWF) and the Regenerated Wet Forest in the West (RWF), where natural reforestation has occurred.
Figure 5.
Puerto Rico GAP 2004 Land Cover Map from Gould
et al. [
42]. (Figure courtesy of the U.S. Geological Survey).
Figure 5.
Puerto Rico GAP 2004 Land Cover Map from Gould
et al. [
42]. (Figure courtesy of the U.S. Geological Survey).
Table 3.
Number of stations by Selection Type and Analyzed HELZ and Land Cover for the 1992 Puerto Rico Land Cover Map.
Table 3.
Number of stations by Selection Type and Analyzed HELZ and Land Cover for the 1992 Puerto Rico Land Cover Map.
| 1992 Puerto Rico Land Cover Map Stations by Analyzed Selection Type and Study Regions |
|---|
| HELZ | Total Stations | HELZ Subdivisions | Selection A | Selection B 30 m | Selection B 60 m | Selection B 90 m |
|---|
| U | NU | U | U | NU | NU | NU | NU |
|---|
| Wet Forest | 27 | Regenerated | 0 | 22 | 0 | 22 | 4 | 18 | 7 | 15 |
| Unregenerated | 0 | 3 | 0 | 3 | 0 | 3 | 0 | 3 |
| Rain Forest Reserve | 0 | 2 | 0 | 2 | 0 | 2 | 0 | 2 |
| Moist Forest | 75 | N/A | 13 | 62 | 21 | 54 | N/A | N/A | N/A | N/A |
| Dry Forest | 24 | N/A | 2 | 22 | 4 | 20 | 11 | 13 | N/A | N/A |
Table 4.
Number of stations by Selection Type and Analyzed HELZ and Land Cover for the 2004 Puerto Rico Gap Map.
Table 4.
Number of stations by Selection Type and Analyzed HELZ and Land Cover for the 2004 Puerto Rico Gap Map.
| 2004 Puerto Rico GAP Map # of Stations by Analyzed Selection Type and Study Regions |
|---|
| HELZ | Total Stations | HELZ Subdivisions | Selection A | Selection B 30 m | Selection B 60 m |
|---|
| U | NU | U | NU | U | NU |
|---|
| Wet Forest | 27 | Regenerated | 0 | 22 | 0 | 22 | 0 | 22 |
| Unregenerated | 0 | 3 | 0 | 3 | 0 | 3 |
| Rain Forest Reserve | 0 | 2 | 0 | 2 | 0 | 2 |
| Moist Forest | 75 | N/A | 7 | 68 | 11 | 64 | 15 | 60 |
| Dry Forest | 24 | N/A | 3 | 21 | 4 | 20 | 5 | 19 |
Monthly total average, median and average total precipitation for each year were computed directly from the monthly data to statistically evaluate decadal, monthly and seasonal differences. The summarized data were computed by averaging all stations inside the HELZs, the subdivided HELZs and the urban areas from the 1992 and 2004 LULC maps. The averages represent total averages for each month, and the medians represent the median of the median values for total precipitation for each month respectively throughout the 1900–2007 period. Monthly summary data were computed by averaging or identifying the median precipitation values for each month for the period 1900 to 2007 for each region. Seasonal precipitation was computed by averaging monthly totals corresponding to the local Dry Season from December to April and the Wet Season from May to November [
24]. Finally, ARC MAP 10.1 IDW interpolation tool was used to create precipitation maps for each period to later extract and assess urban
vs. non-urban magnitudes with statistical methods.
5. Results and Discussion
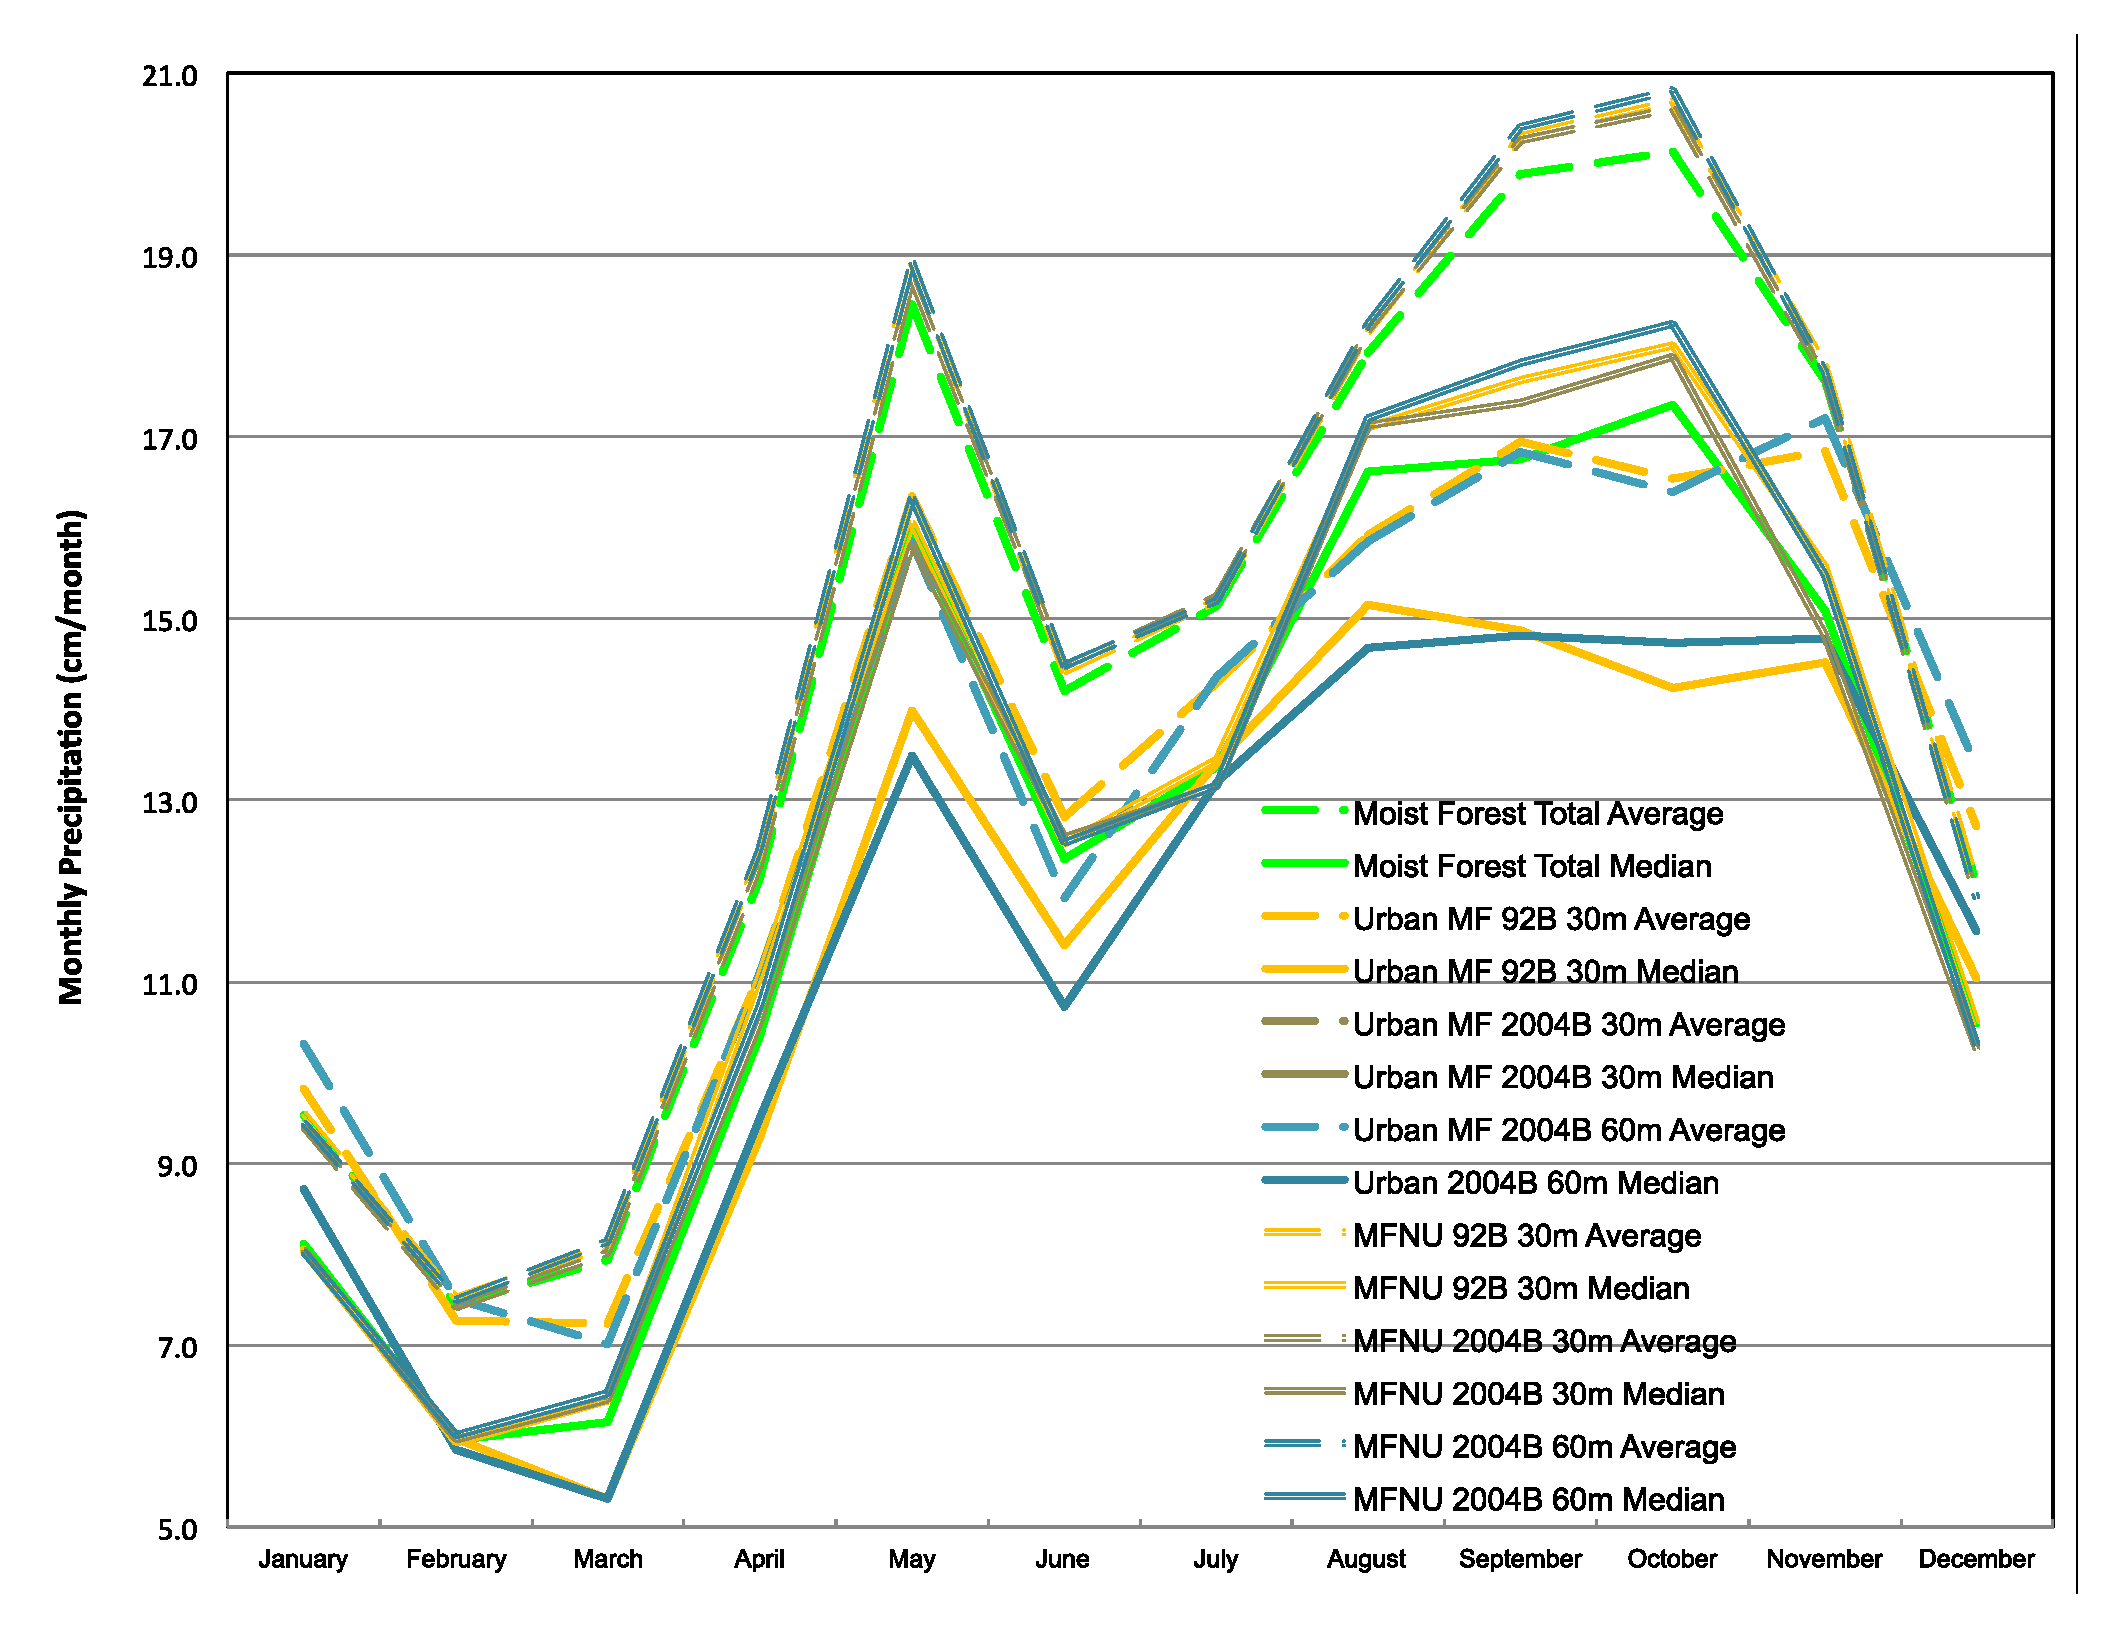
In Puerto Rico there are two statistically distinctive (α = 0.05), periods of rainfall: the Dry Season or Winter (December to April) and the Wet Season or Summer (May to November). Wet months and wet places show higher rainfall variation while dry months and drier places show less rainfall variation (
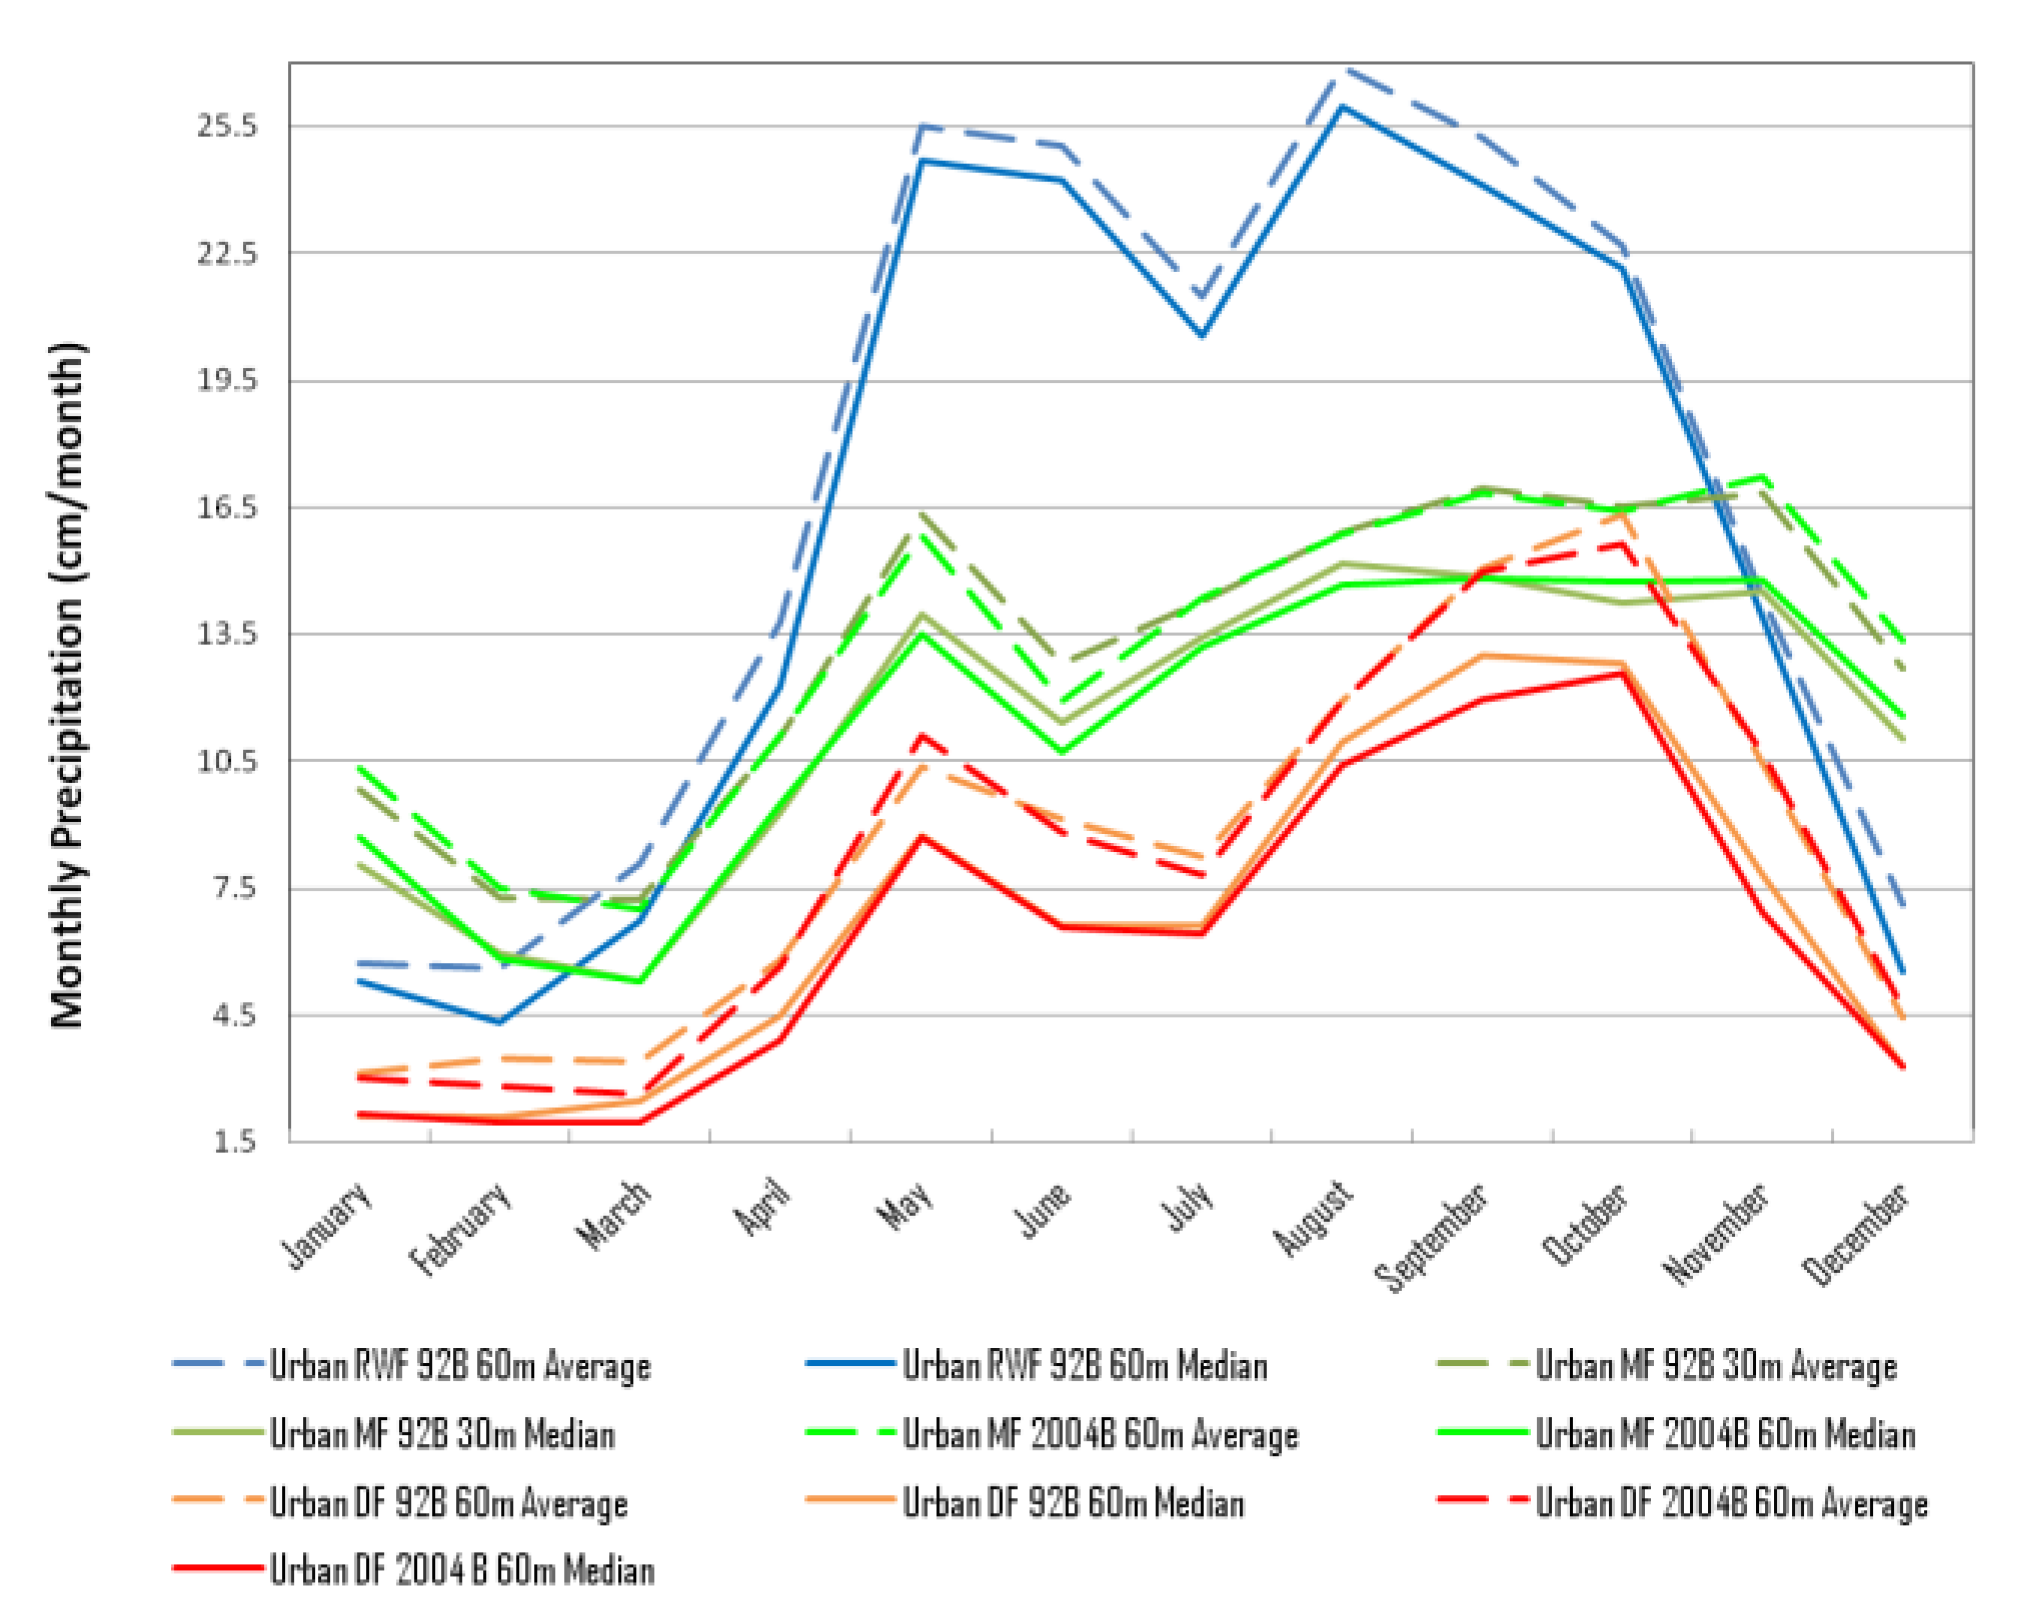
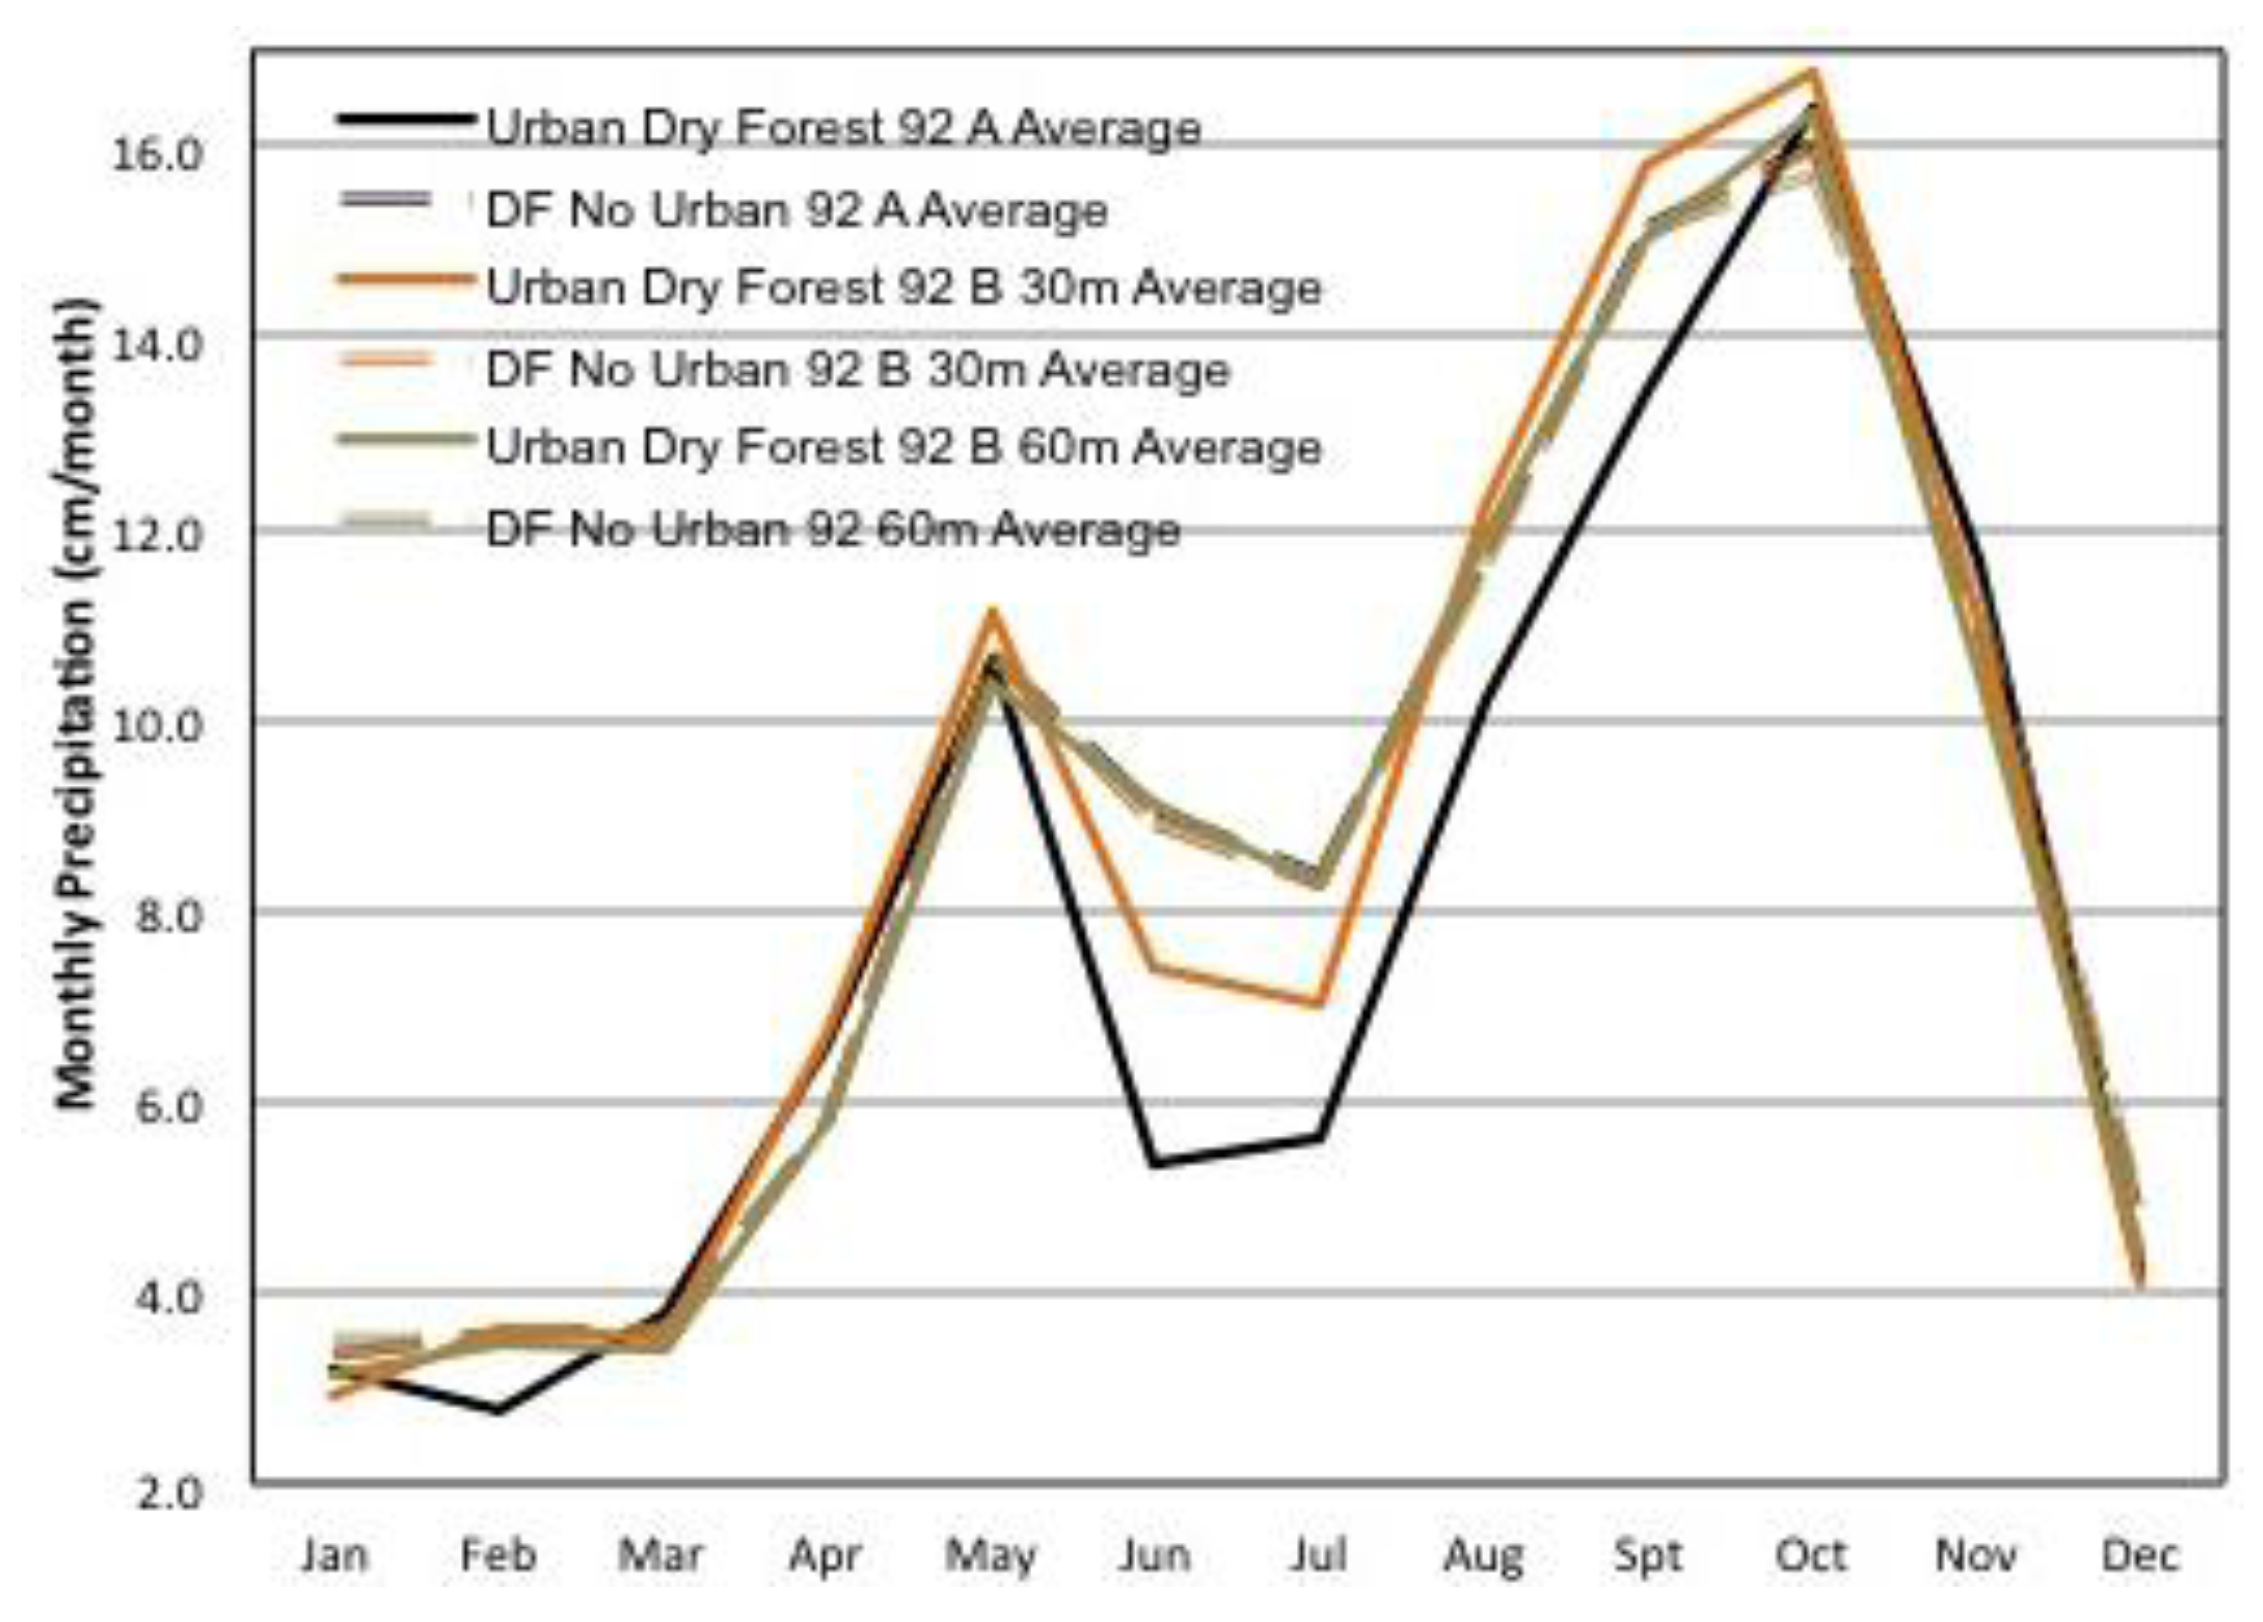
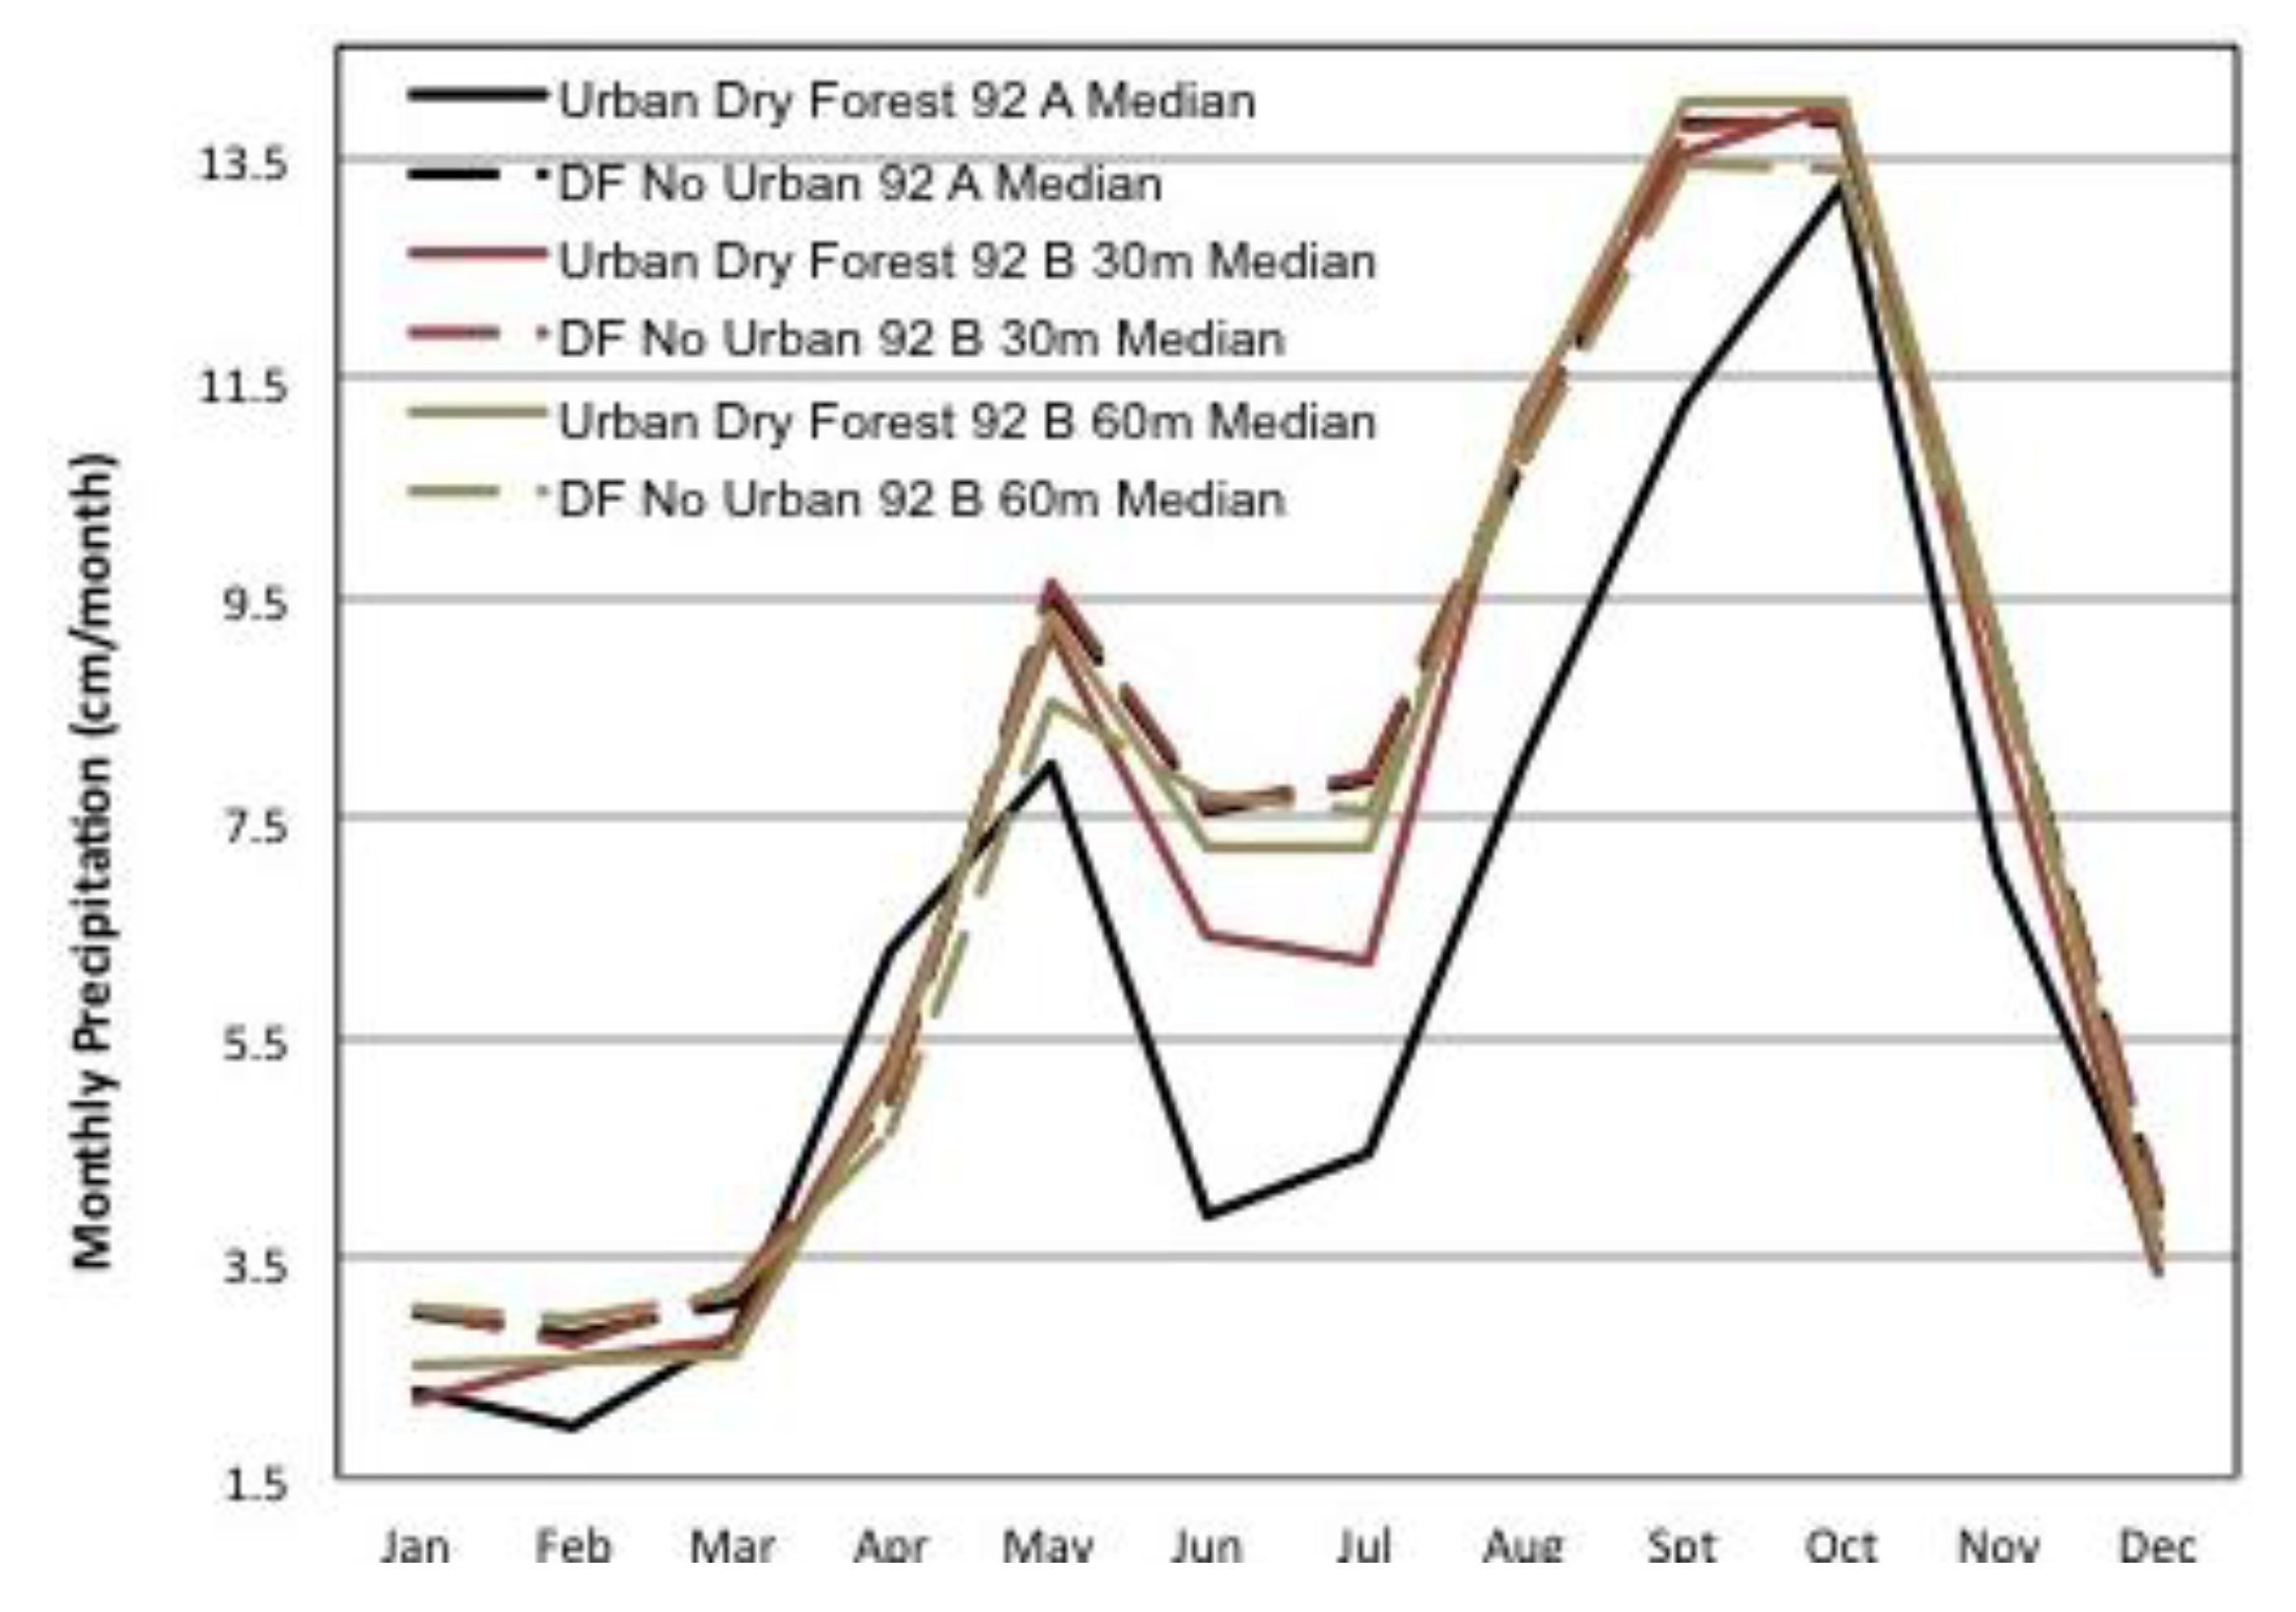
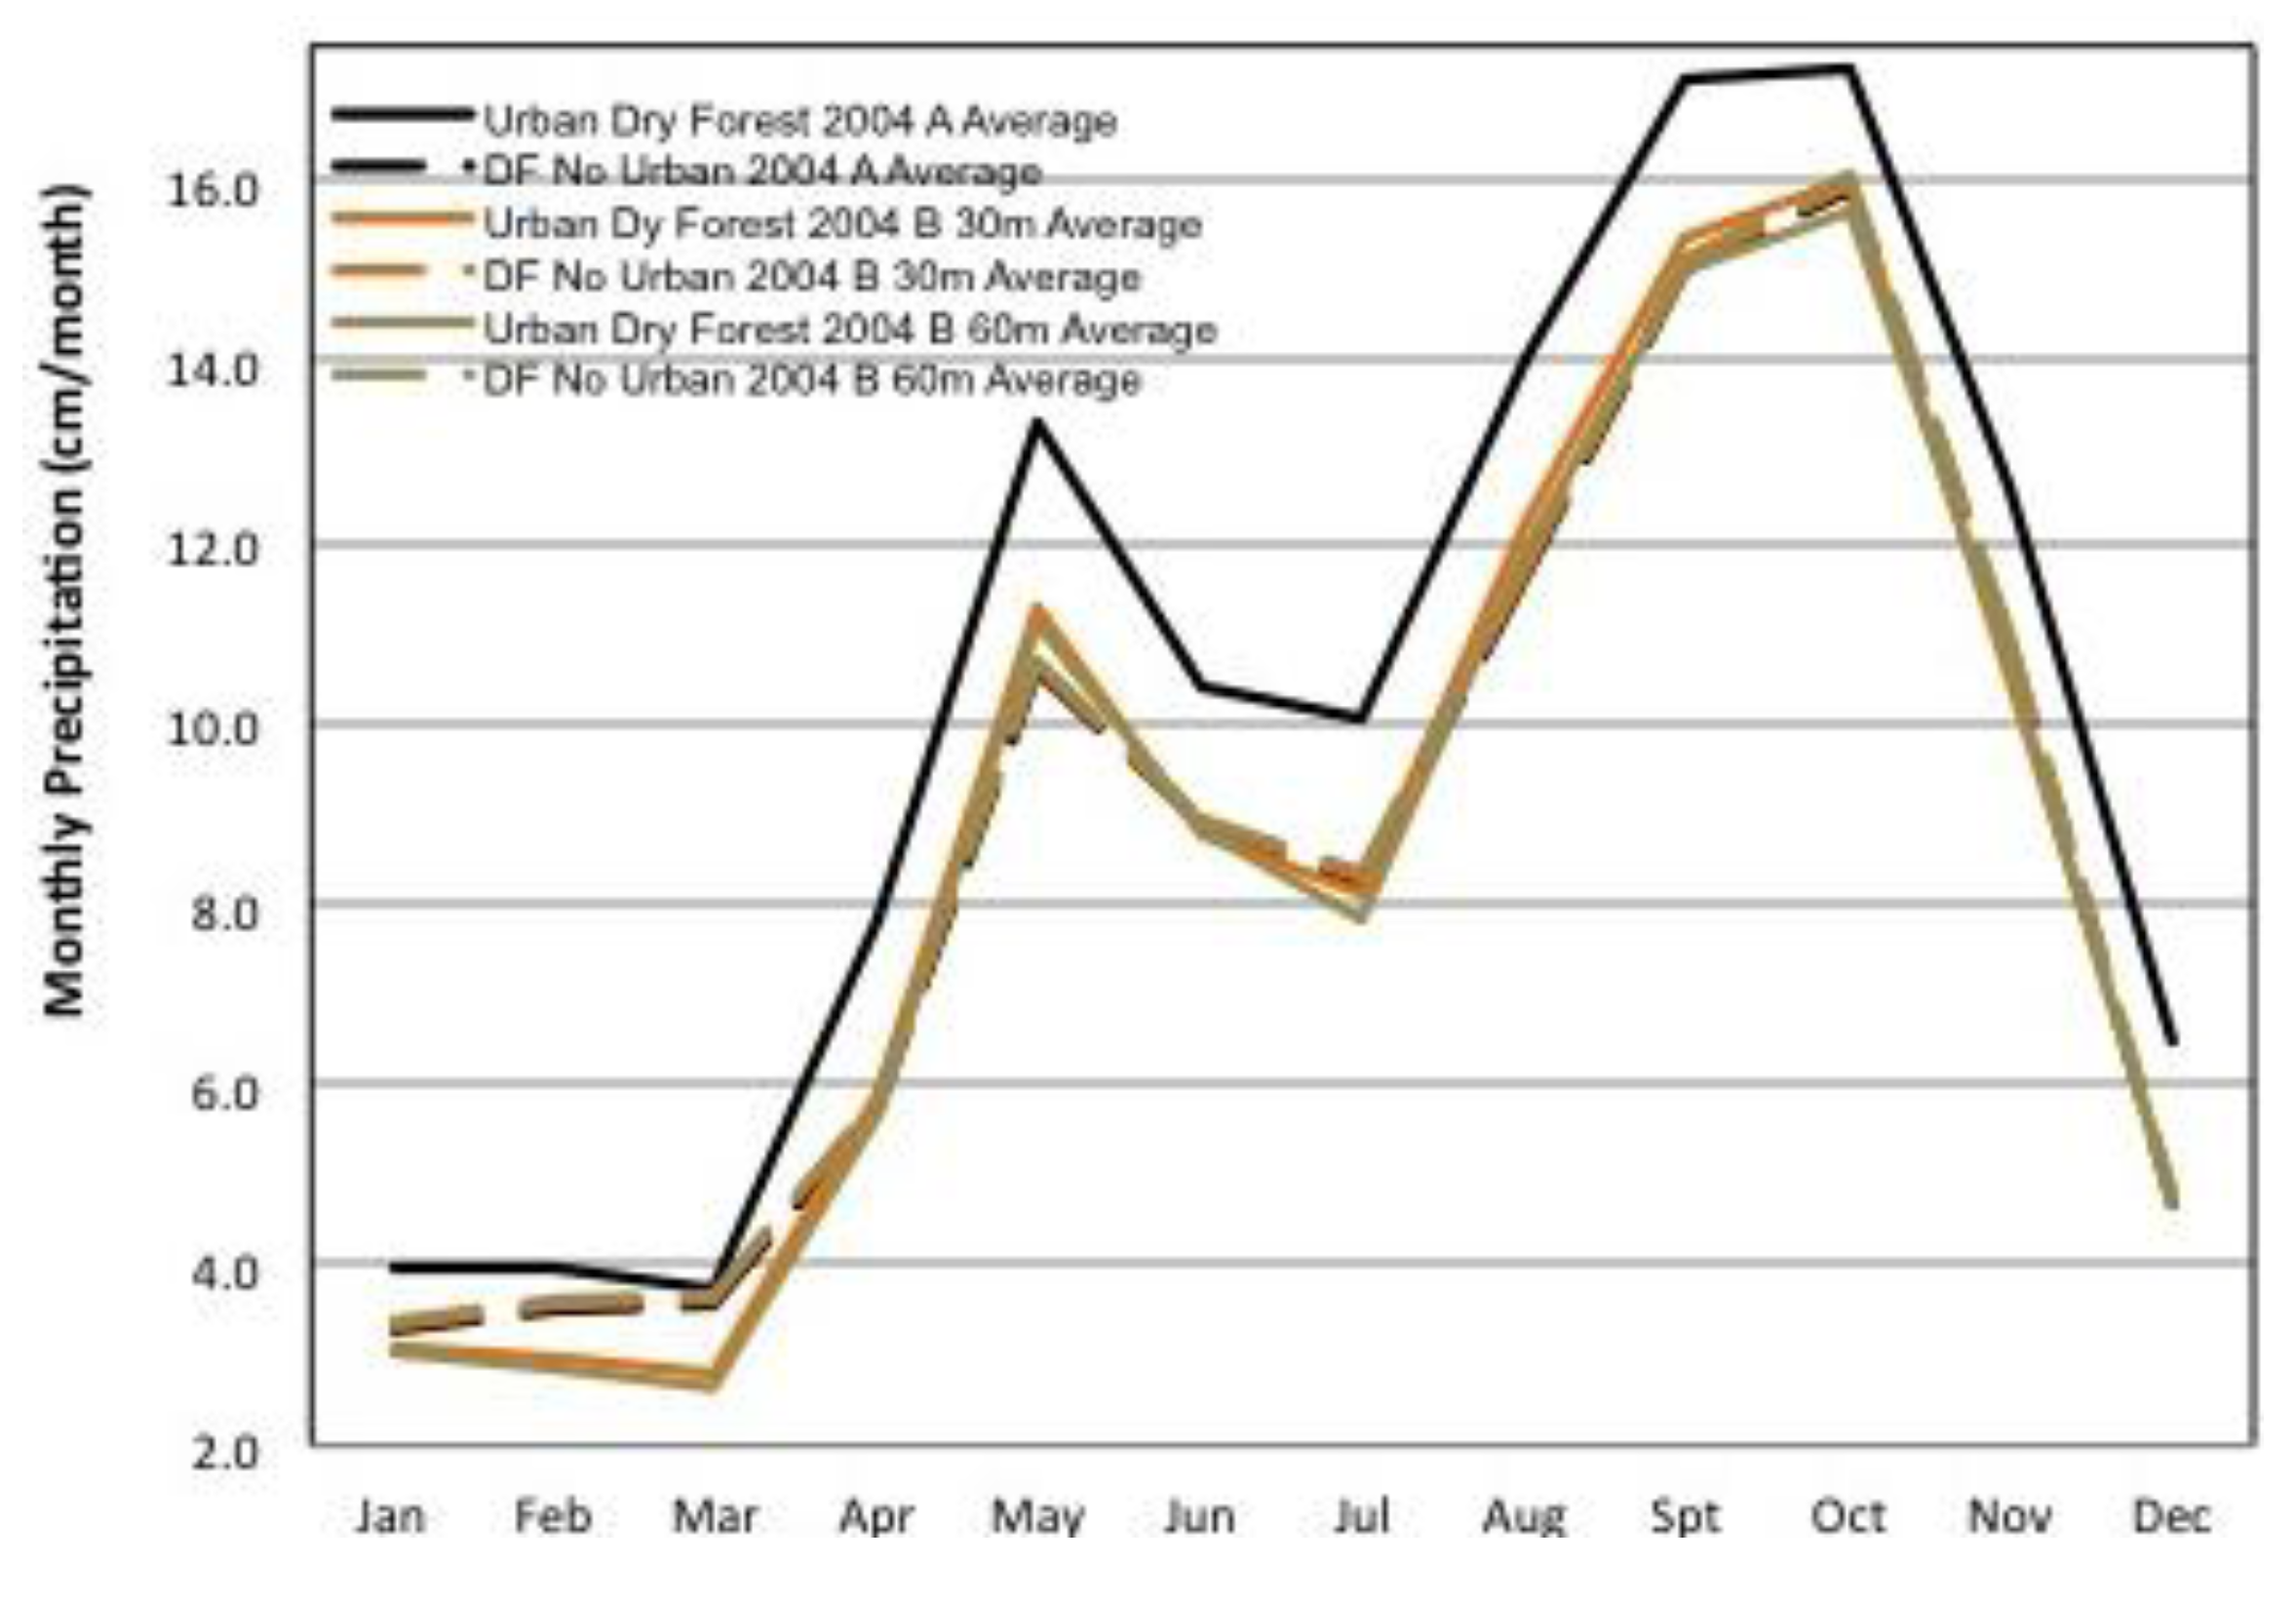
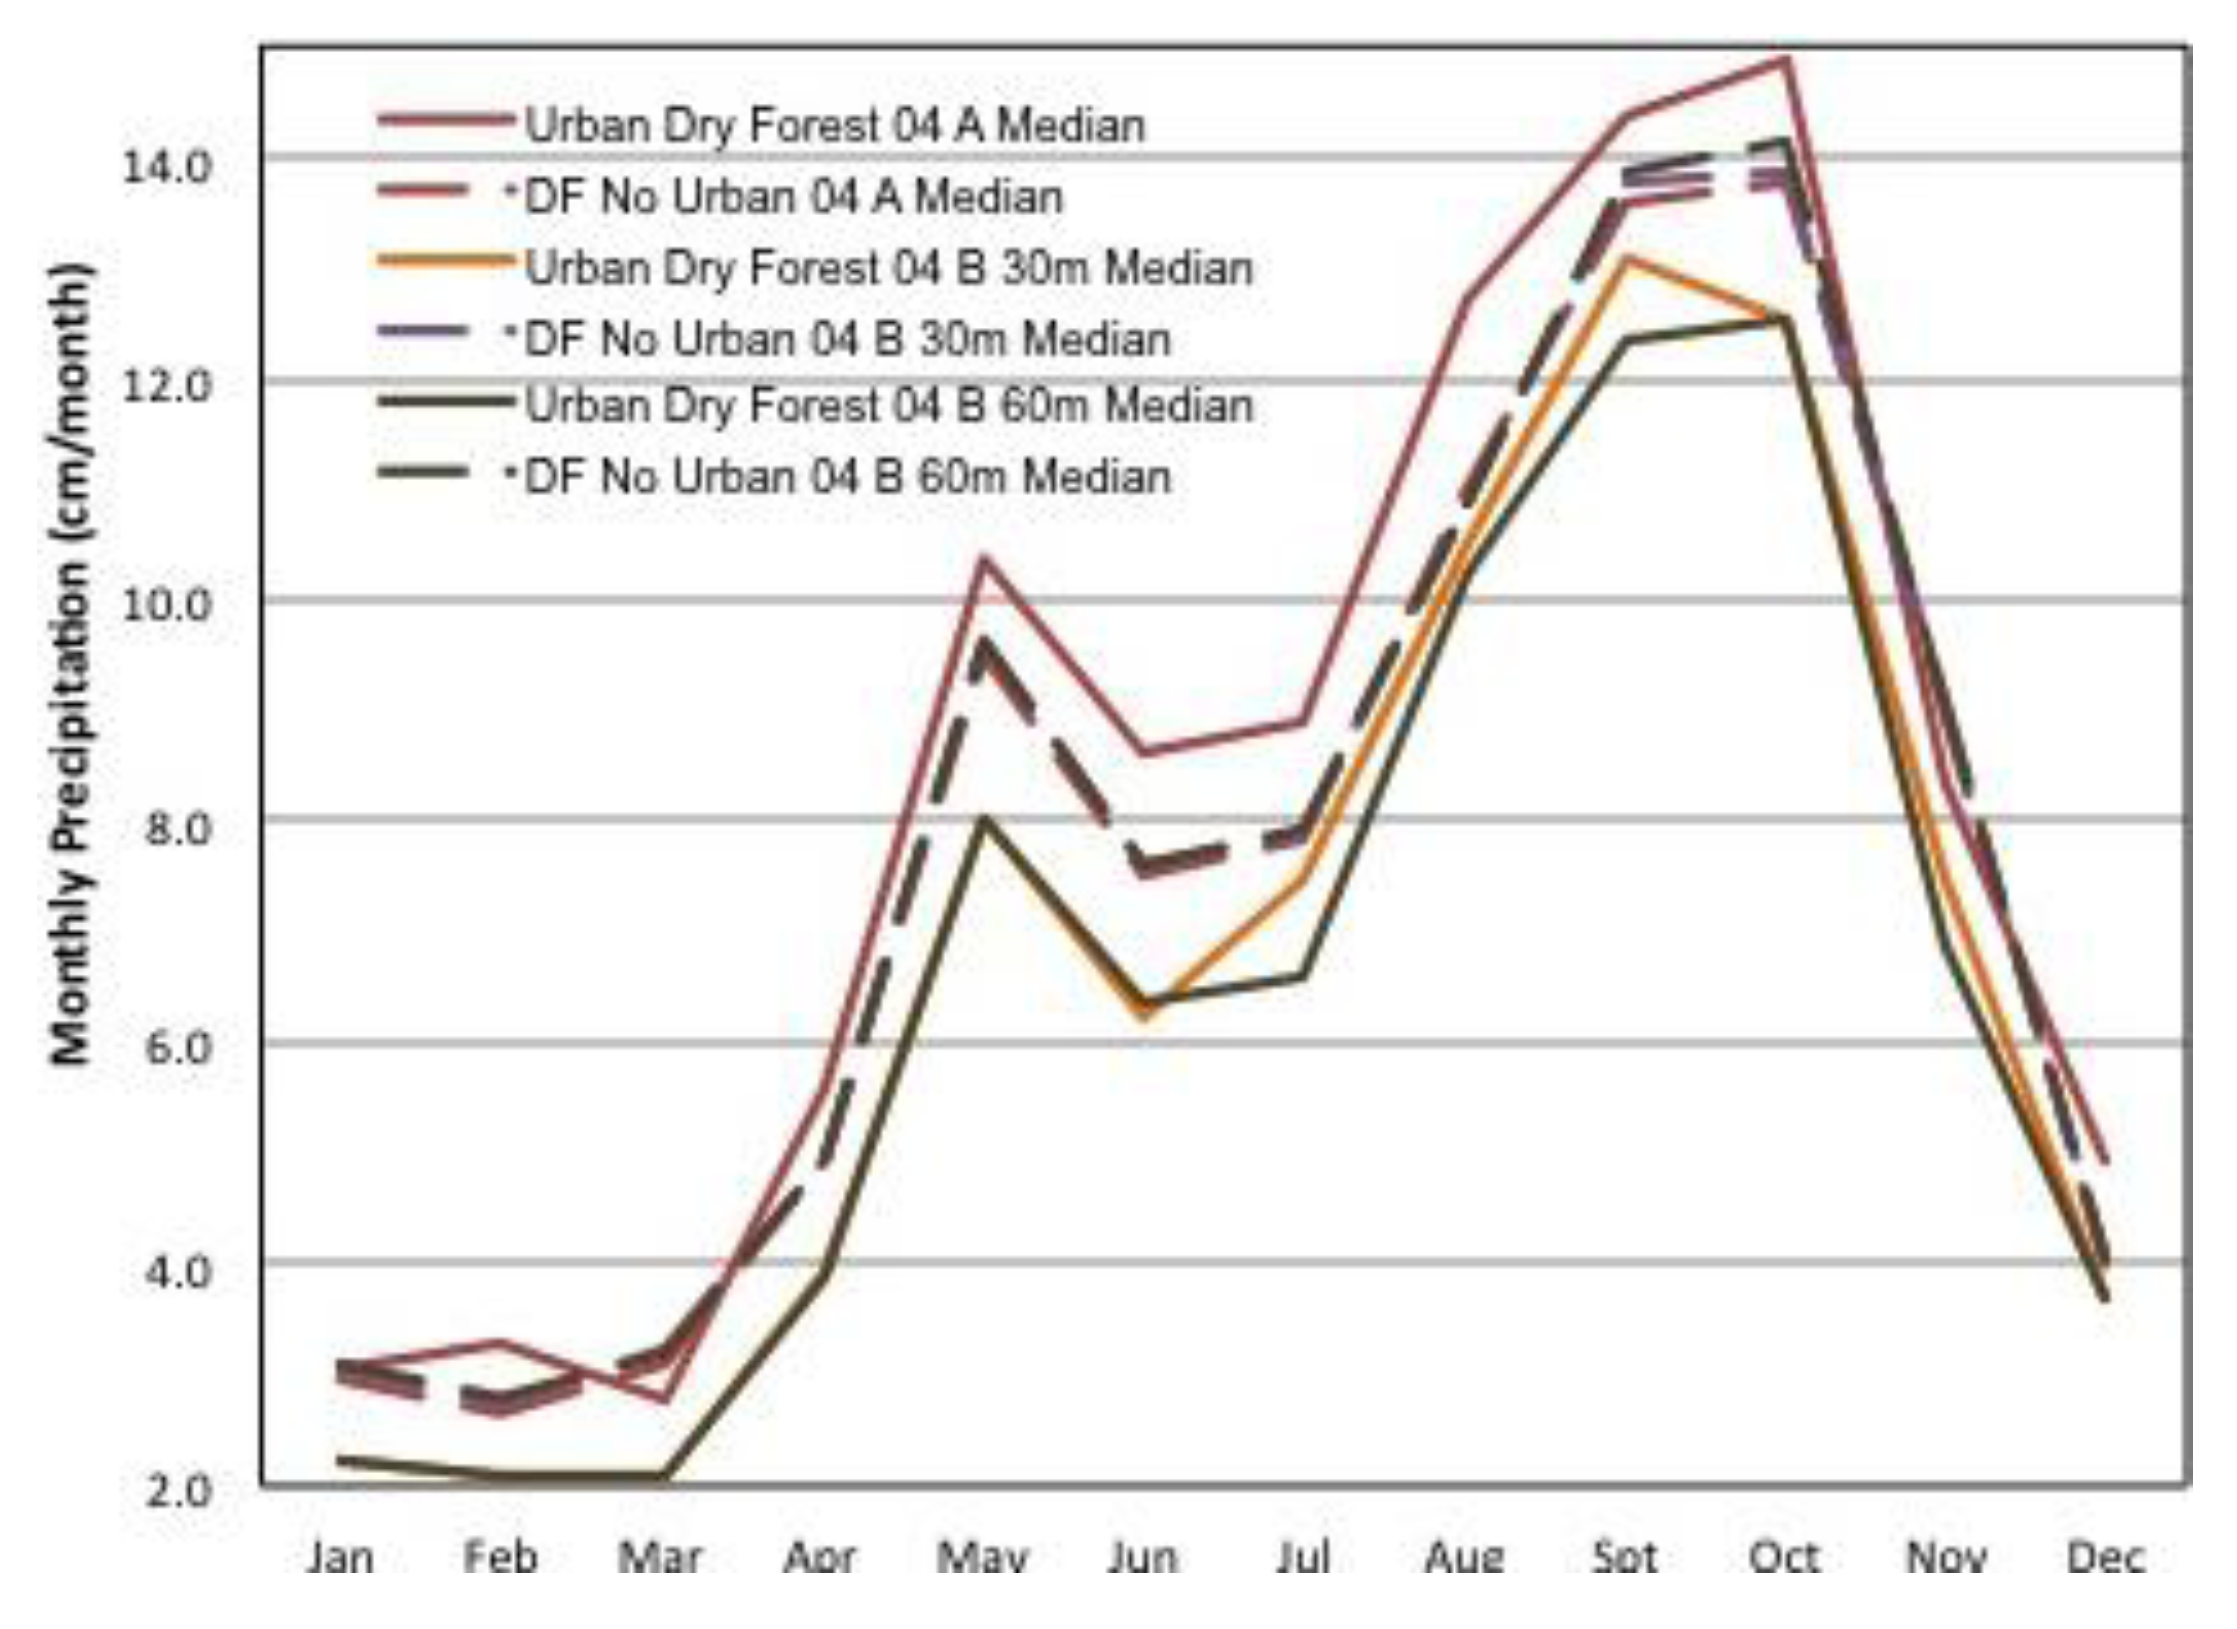
Figure 6). Median and average annual cycle curves tend to separate late in the wet season as a result of larger rainfall events at the end of the summer months. During the annual cycle a small variation at urban stations seem to occur as they receive less rainfall during the Wet Season and in general slightly more precipitation falls in the non-urban region, in particular this is true for the Wet Forest and Moist Forest HELZs, however the Dry Forest showed a different pattern in some selection method samples by registering more precipitation in urban stations than in non-urban. (
Figure 7,
Figure 8,
Figure 9,
Figure 10,
Figure 11,
Figure 12 and
Figure 13).
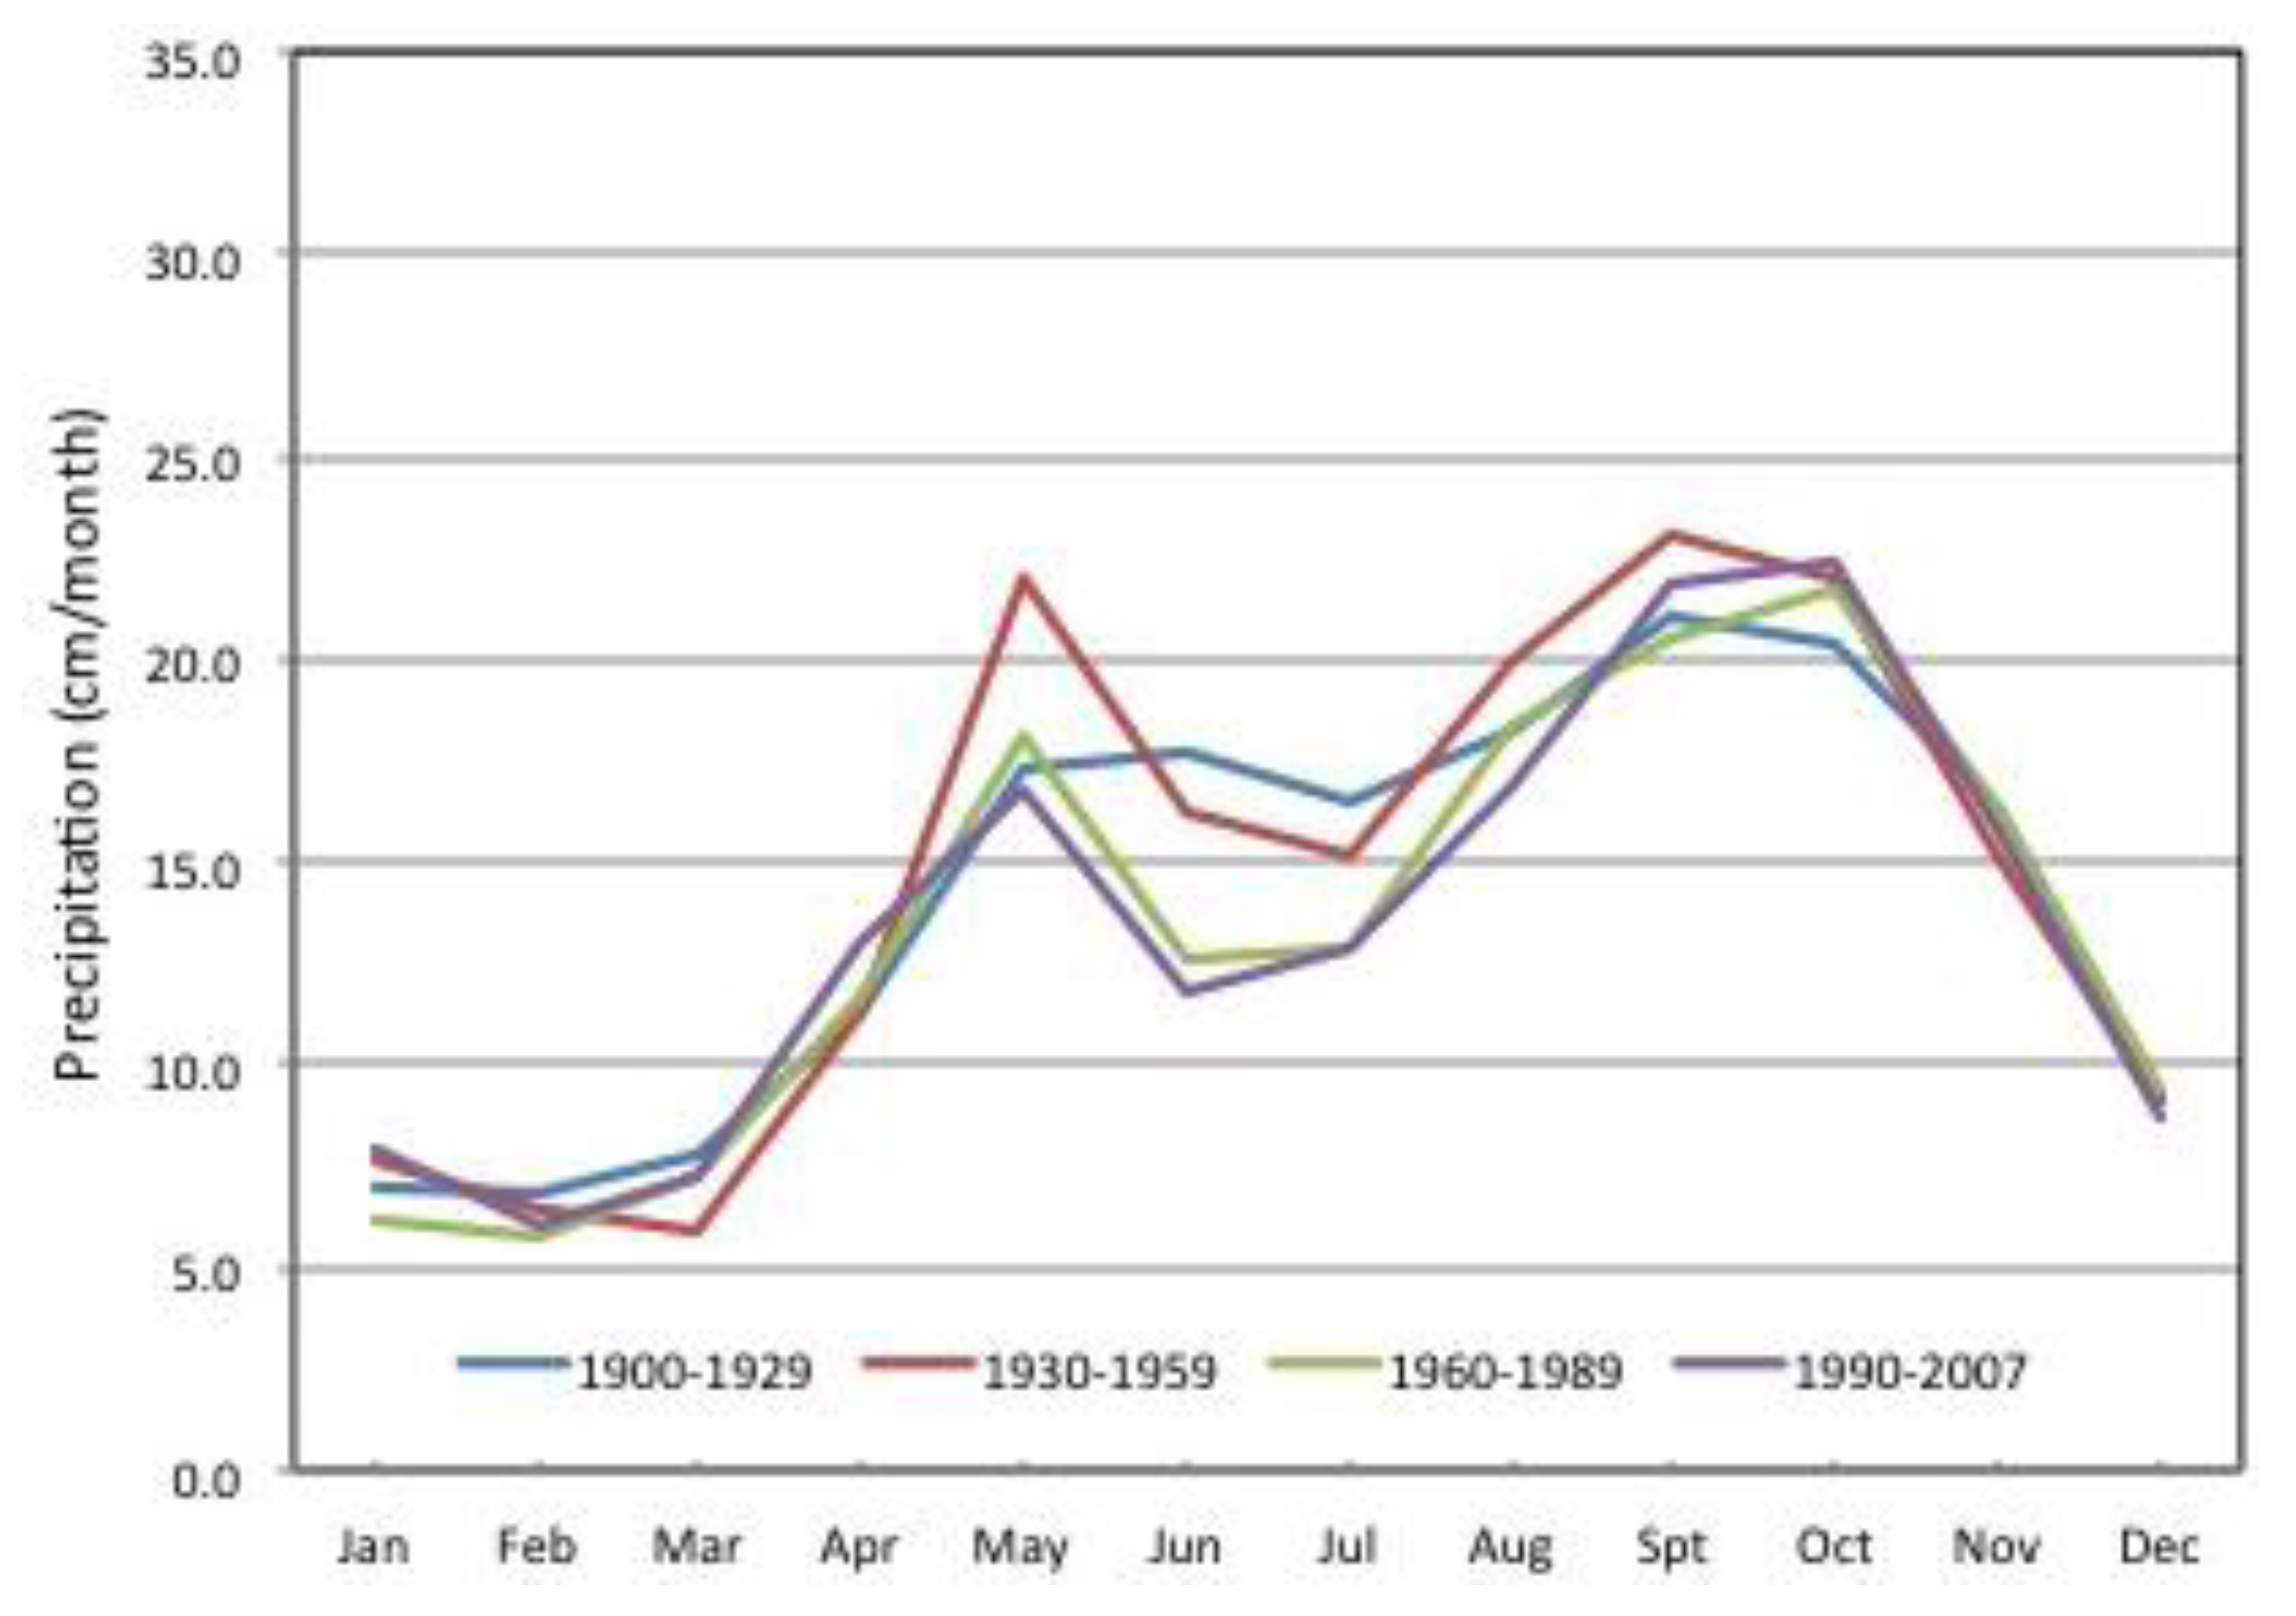
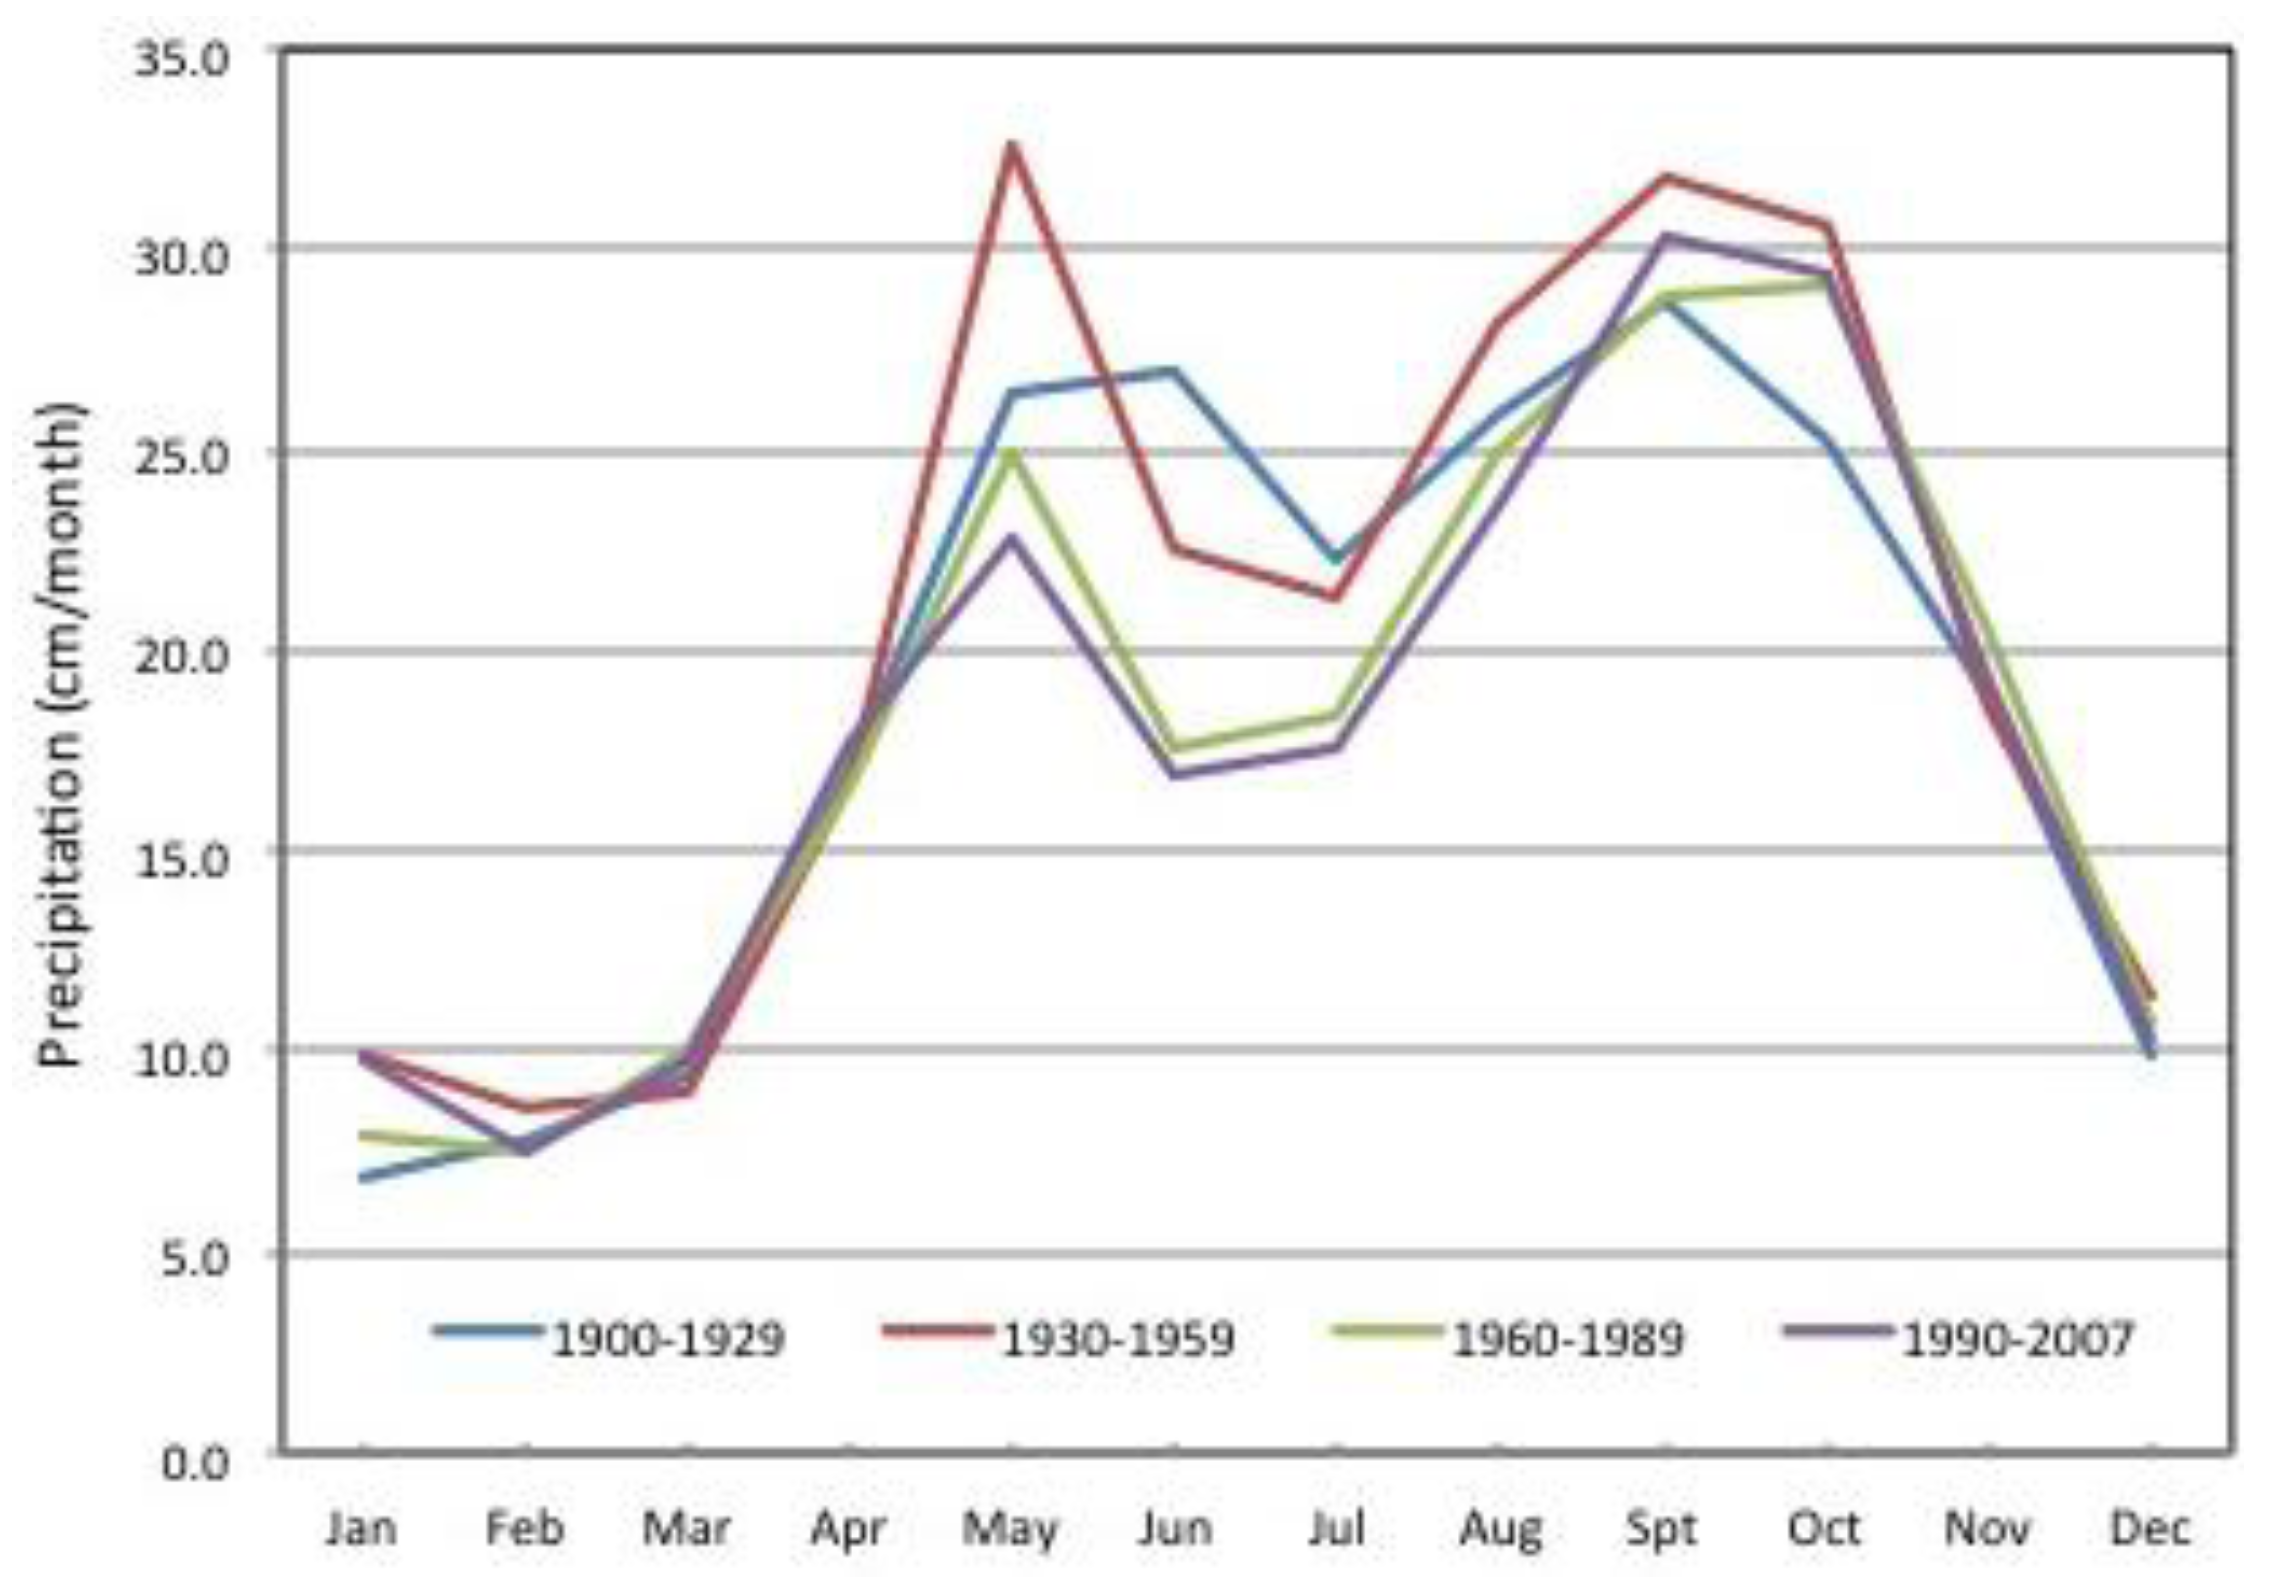
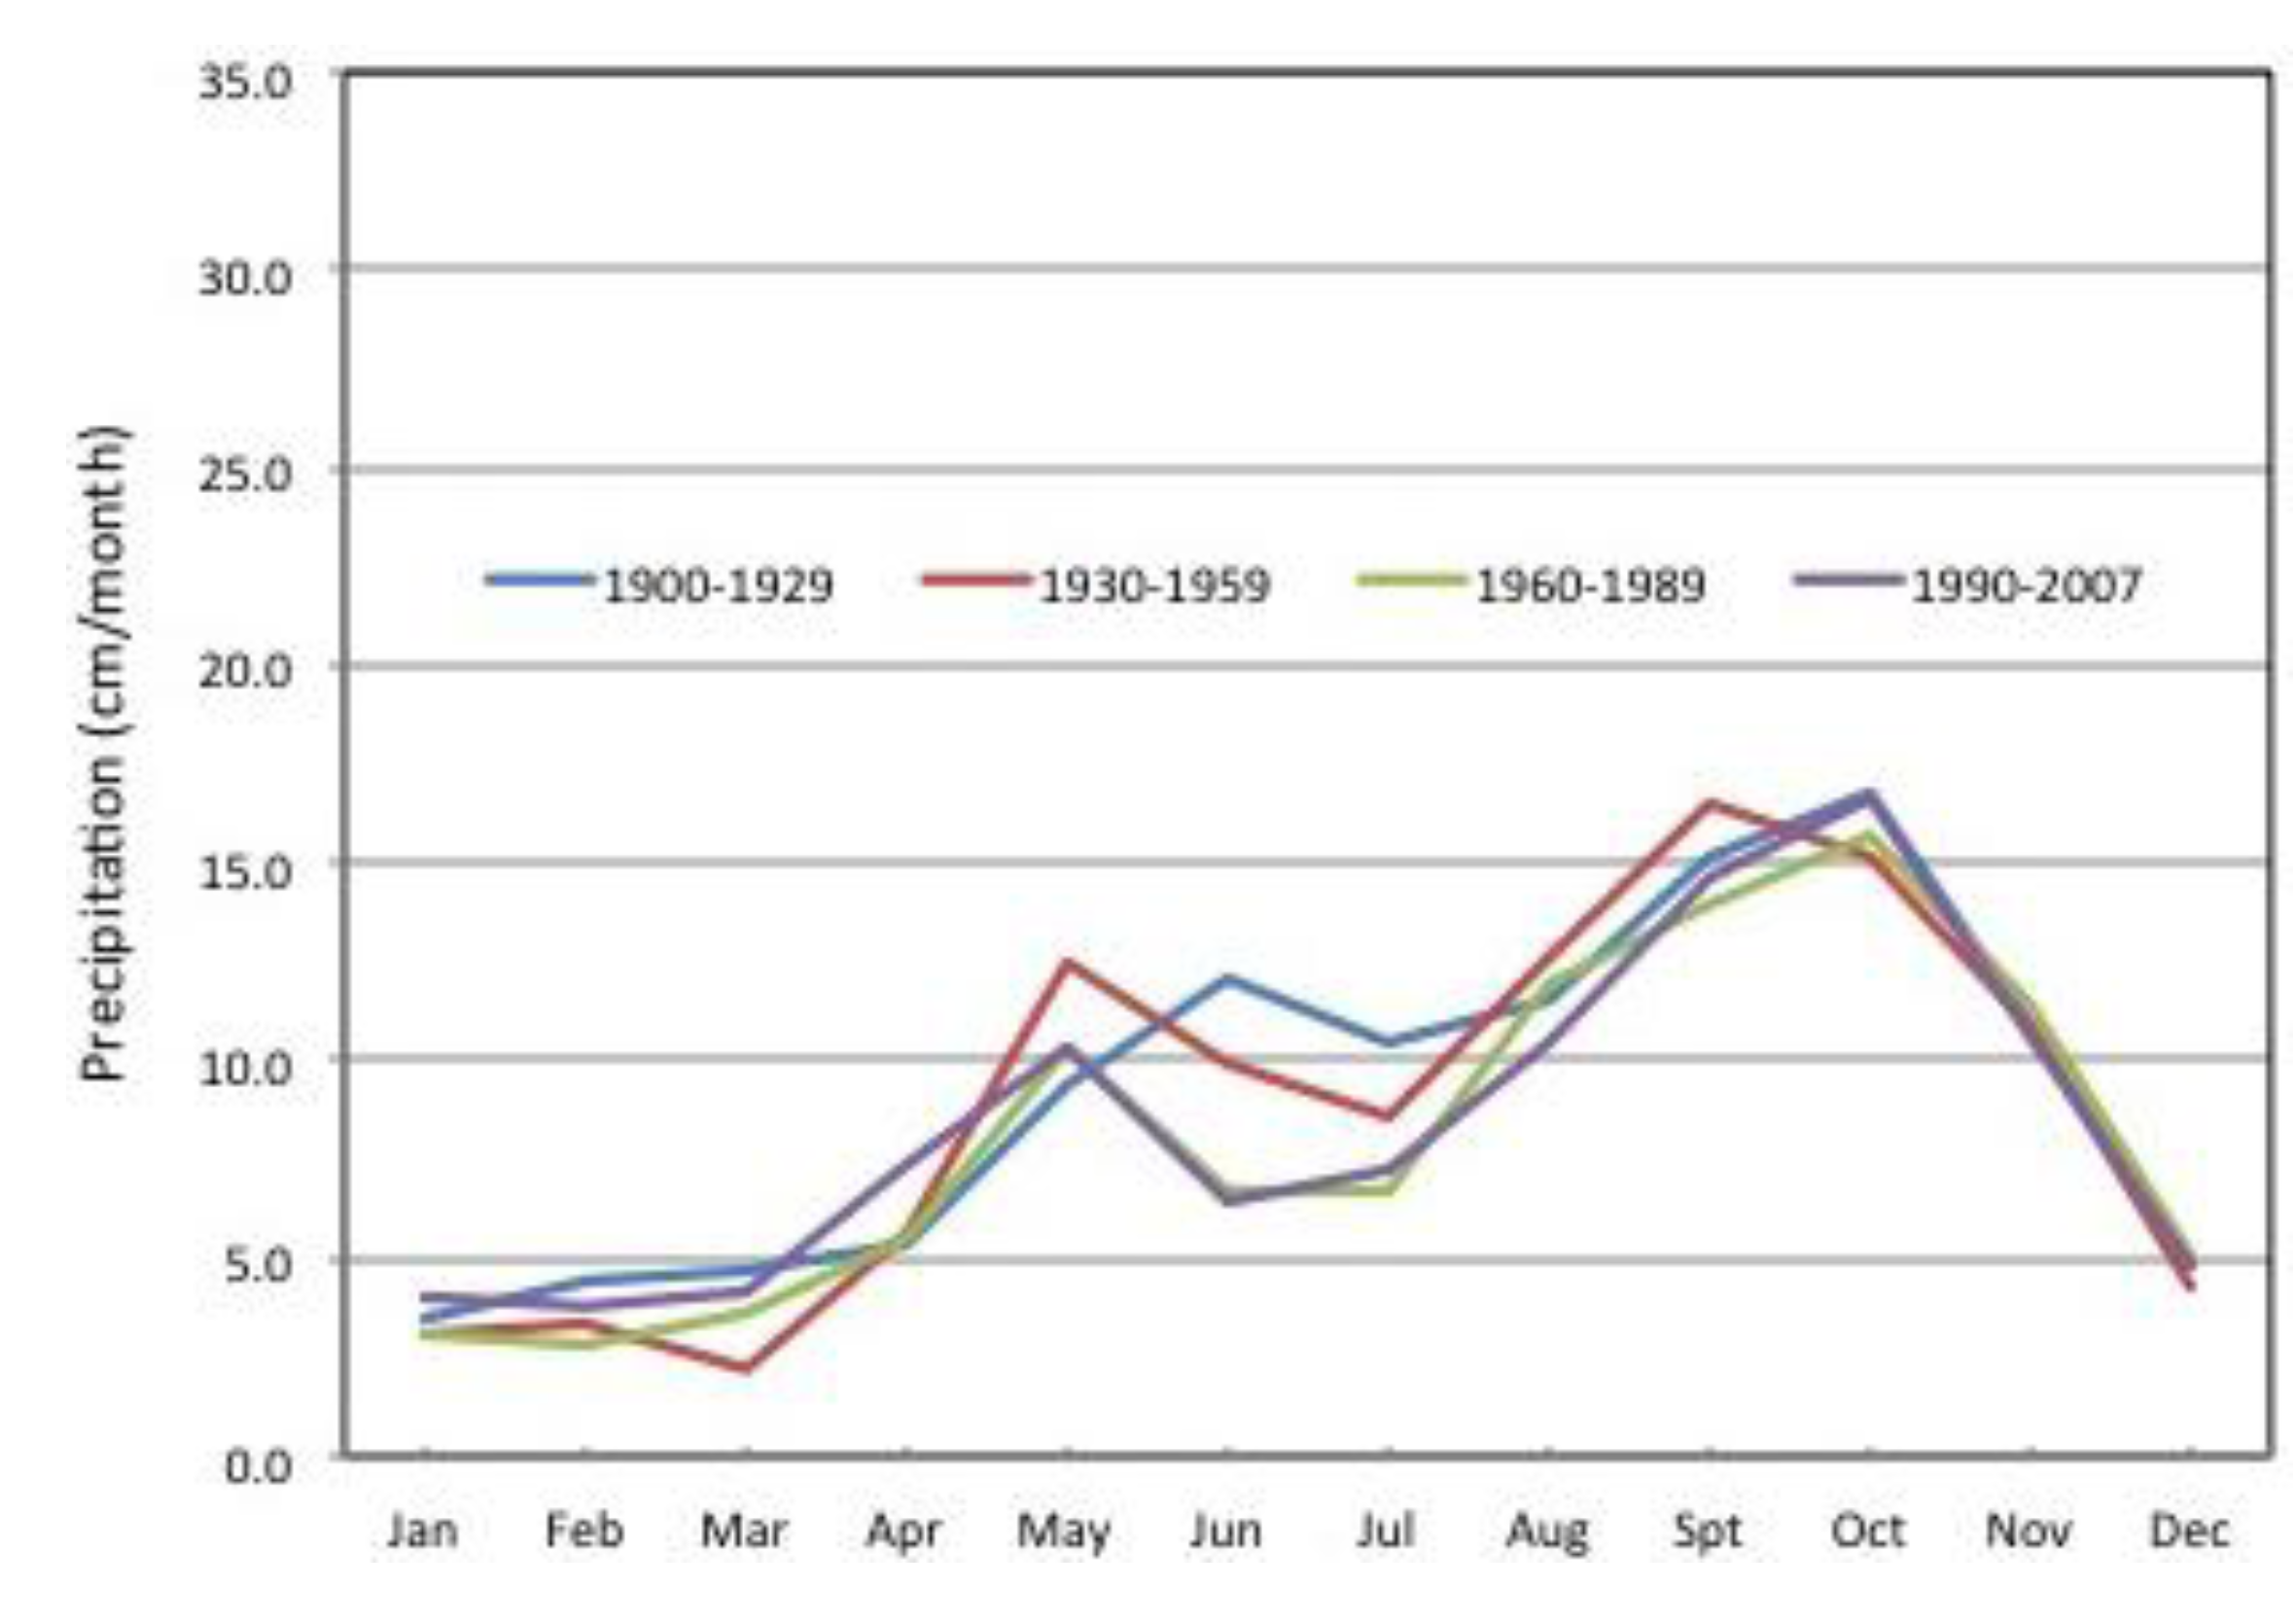
Historical monthly cycle graphs show the highest rainfall variability occurs either at the beginning of the Wet Season or at during driest months (June and July) where most of the precipitation deficits are evident in all HELZs and across climatological periods (
Figure 14,
Figure 15,
Figure 16 and
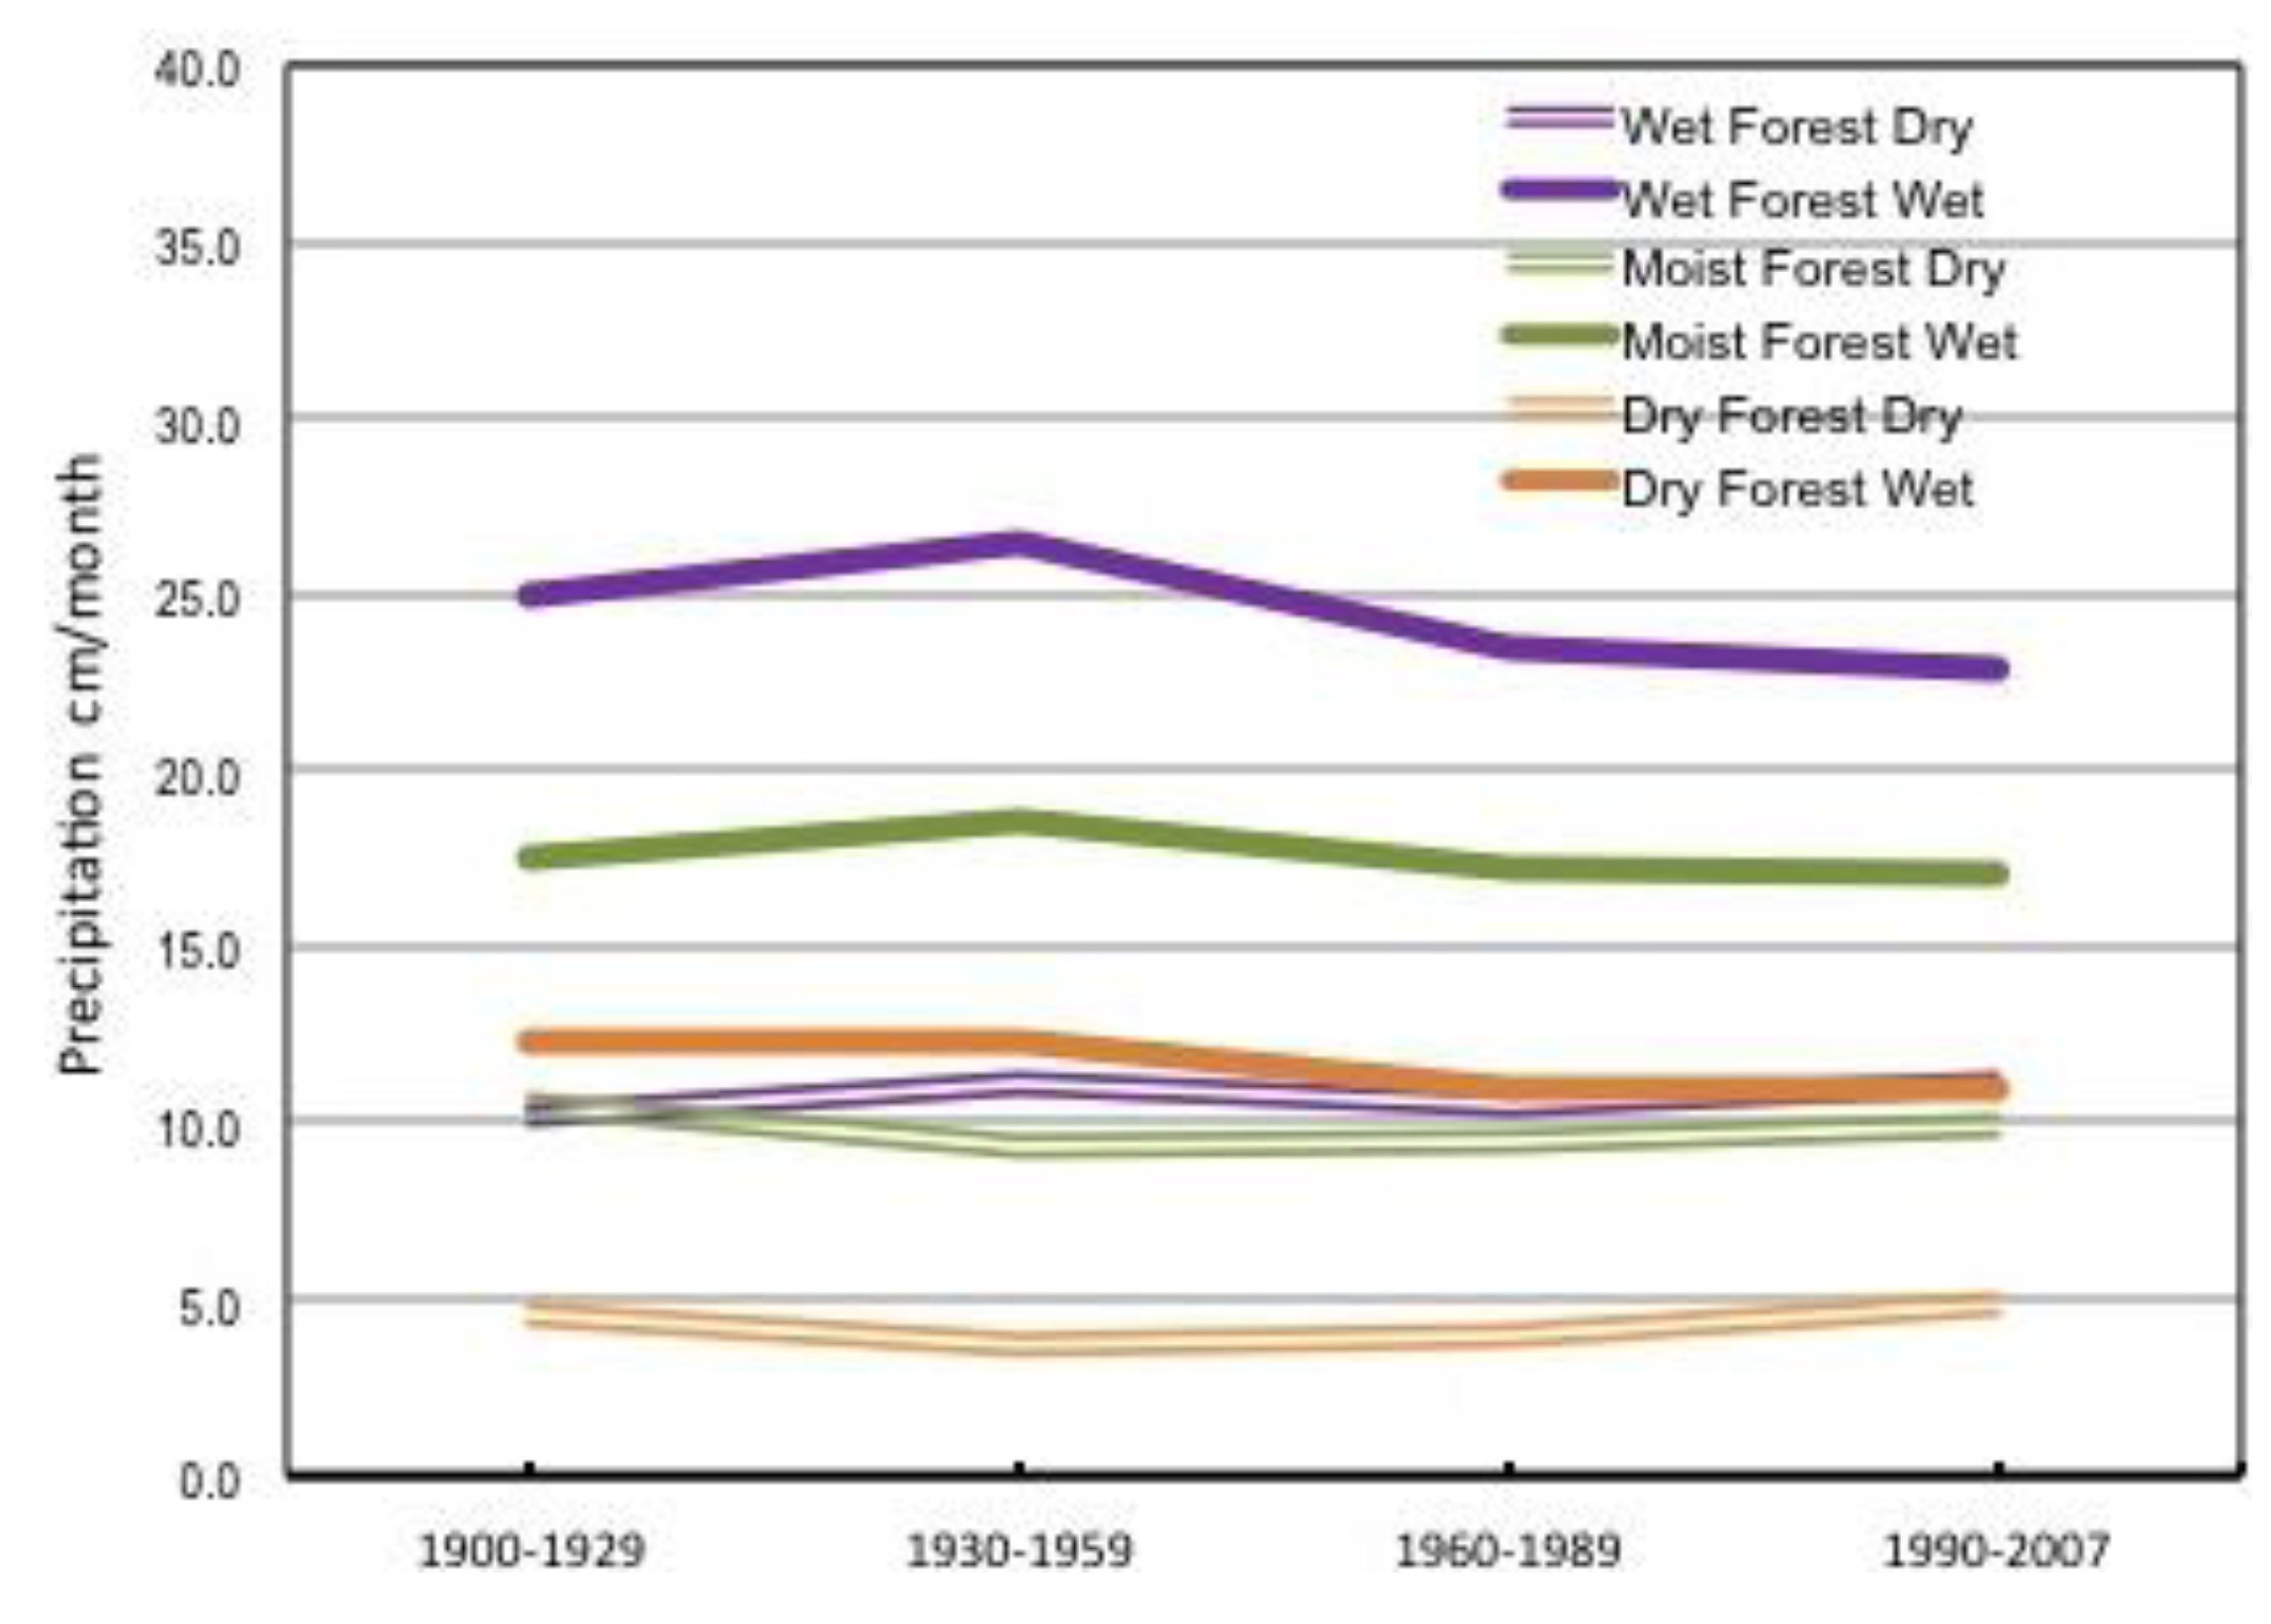
Figure 17). The peak months of the Wet Season are more consistent showing the least variability over time. Wet Season Precipitation has been decreasing in all HELZ through the century while Dry Season precipitation showed slight increases in the Moist Forest and Dry Forest, but the Dry Forest have been the HELZ with the highest and most notable increase (
Figure 18).
Figure 6.
Average and median monthly precipitation for urban stations by HELZ.
Figure 6.
Average and median monthly precipitation for urban stations by HELZ.
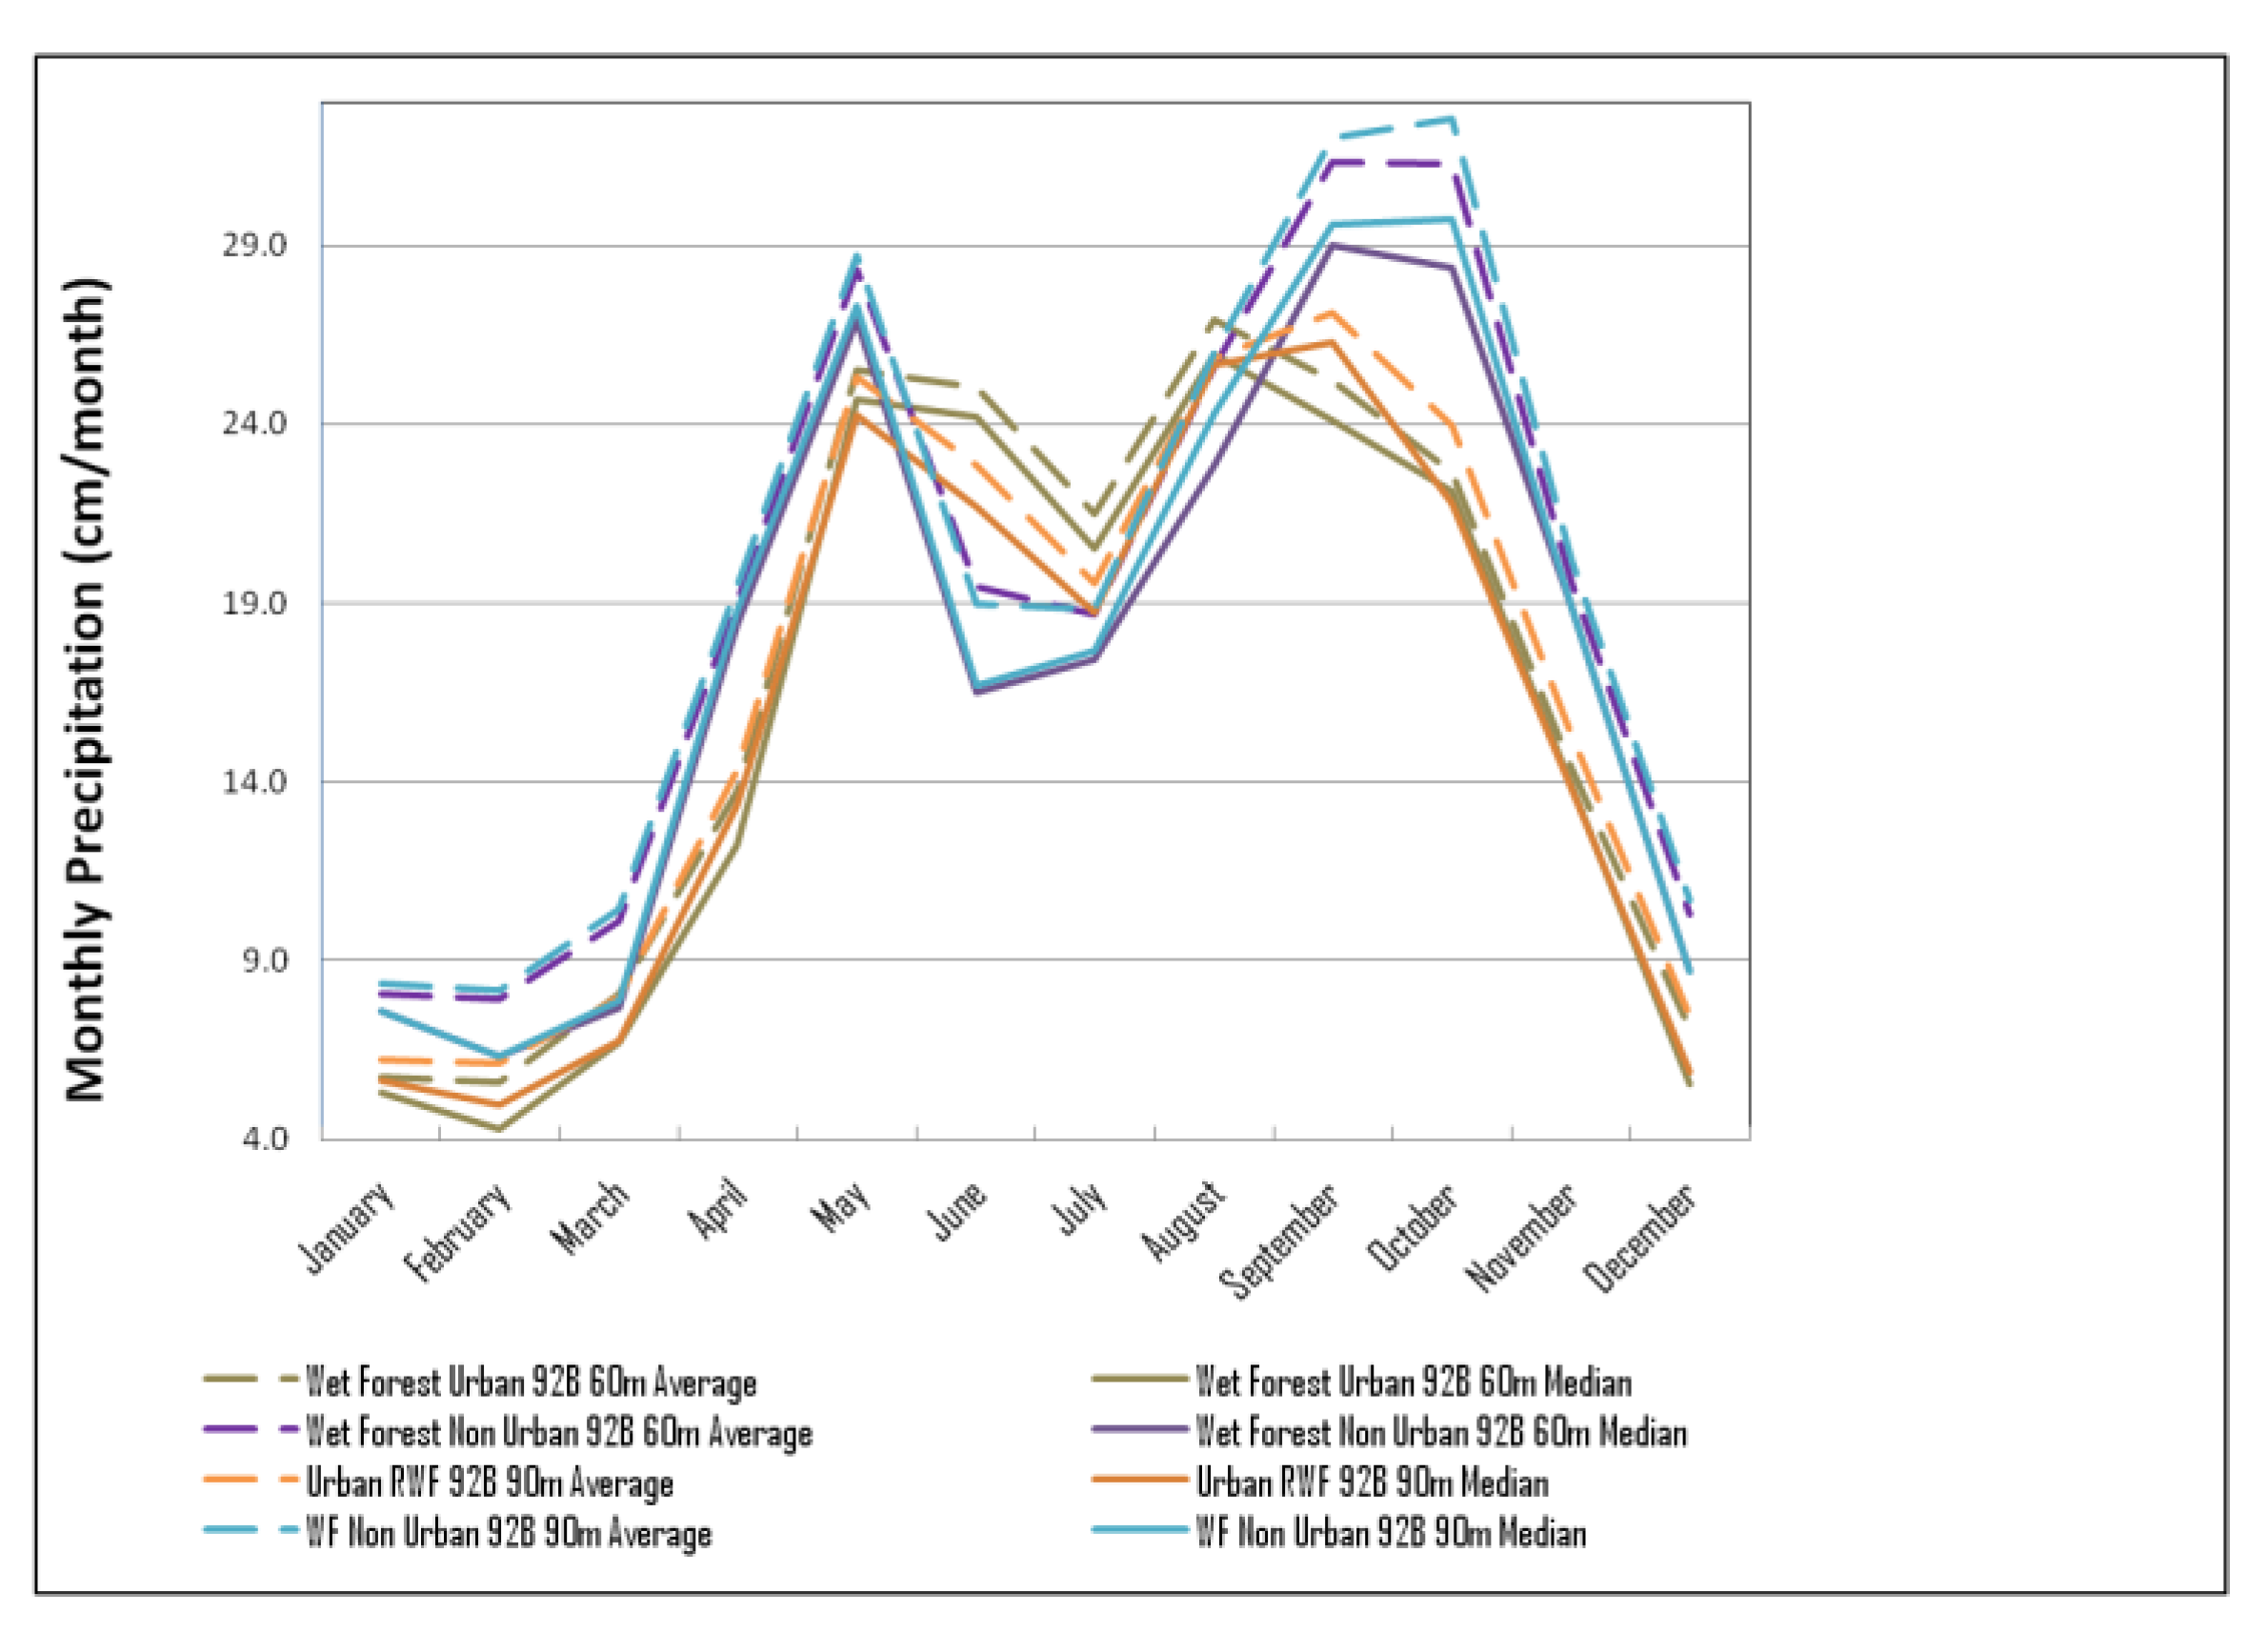
Figure 7.
Average and median urban and non-urban monthly precipitation, Wet Forest.
Figure 7.
Average and median urban and non-urban monthly precipitation, Wet Forest.
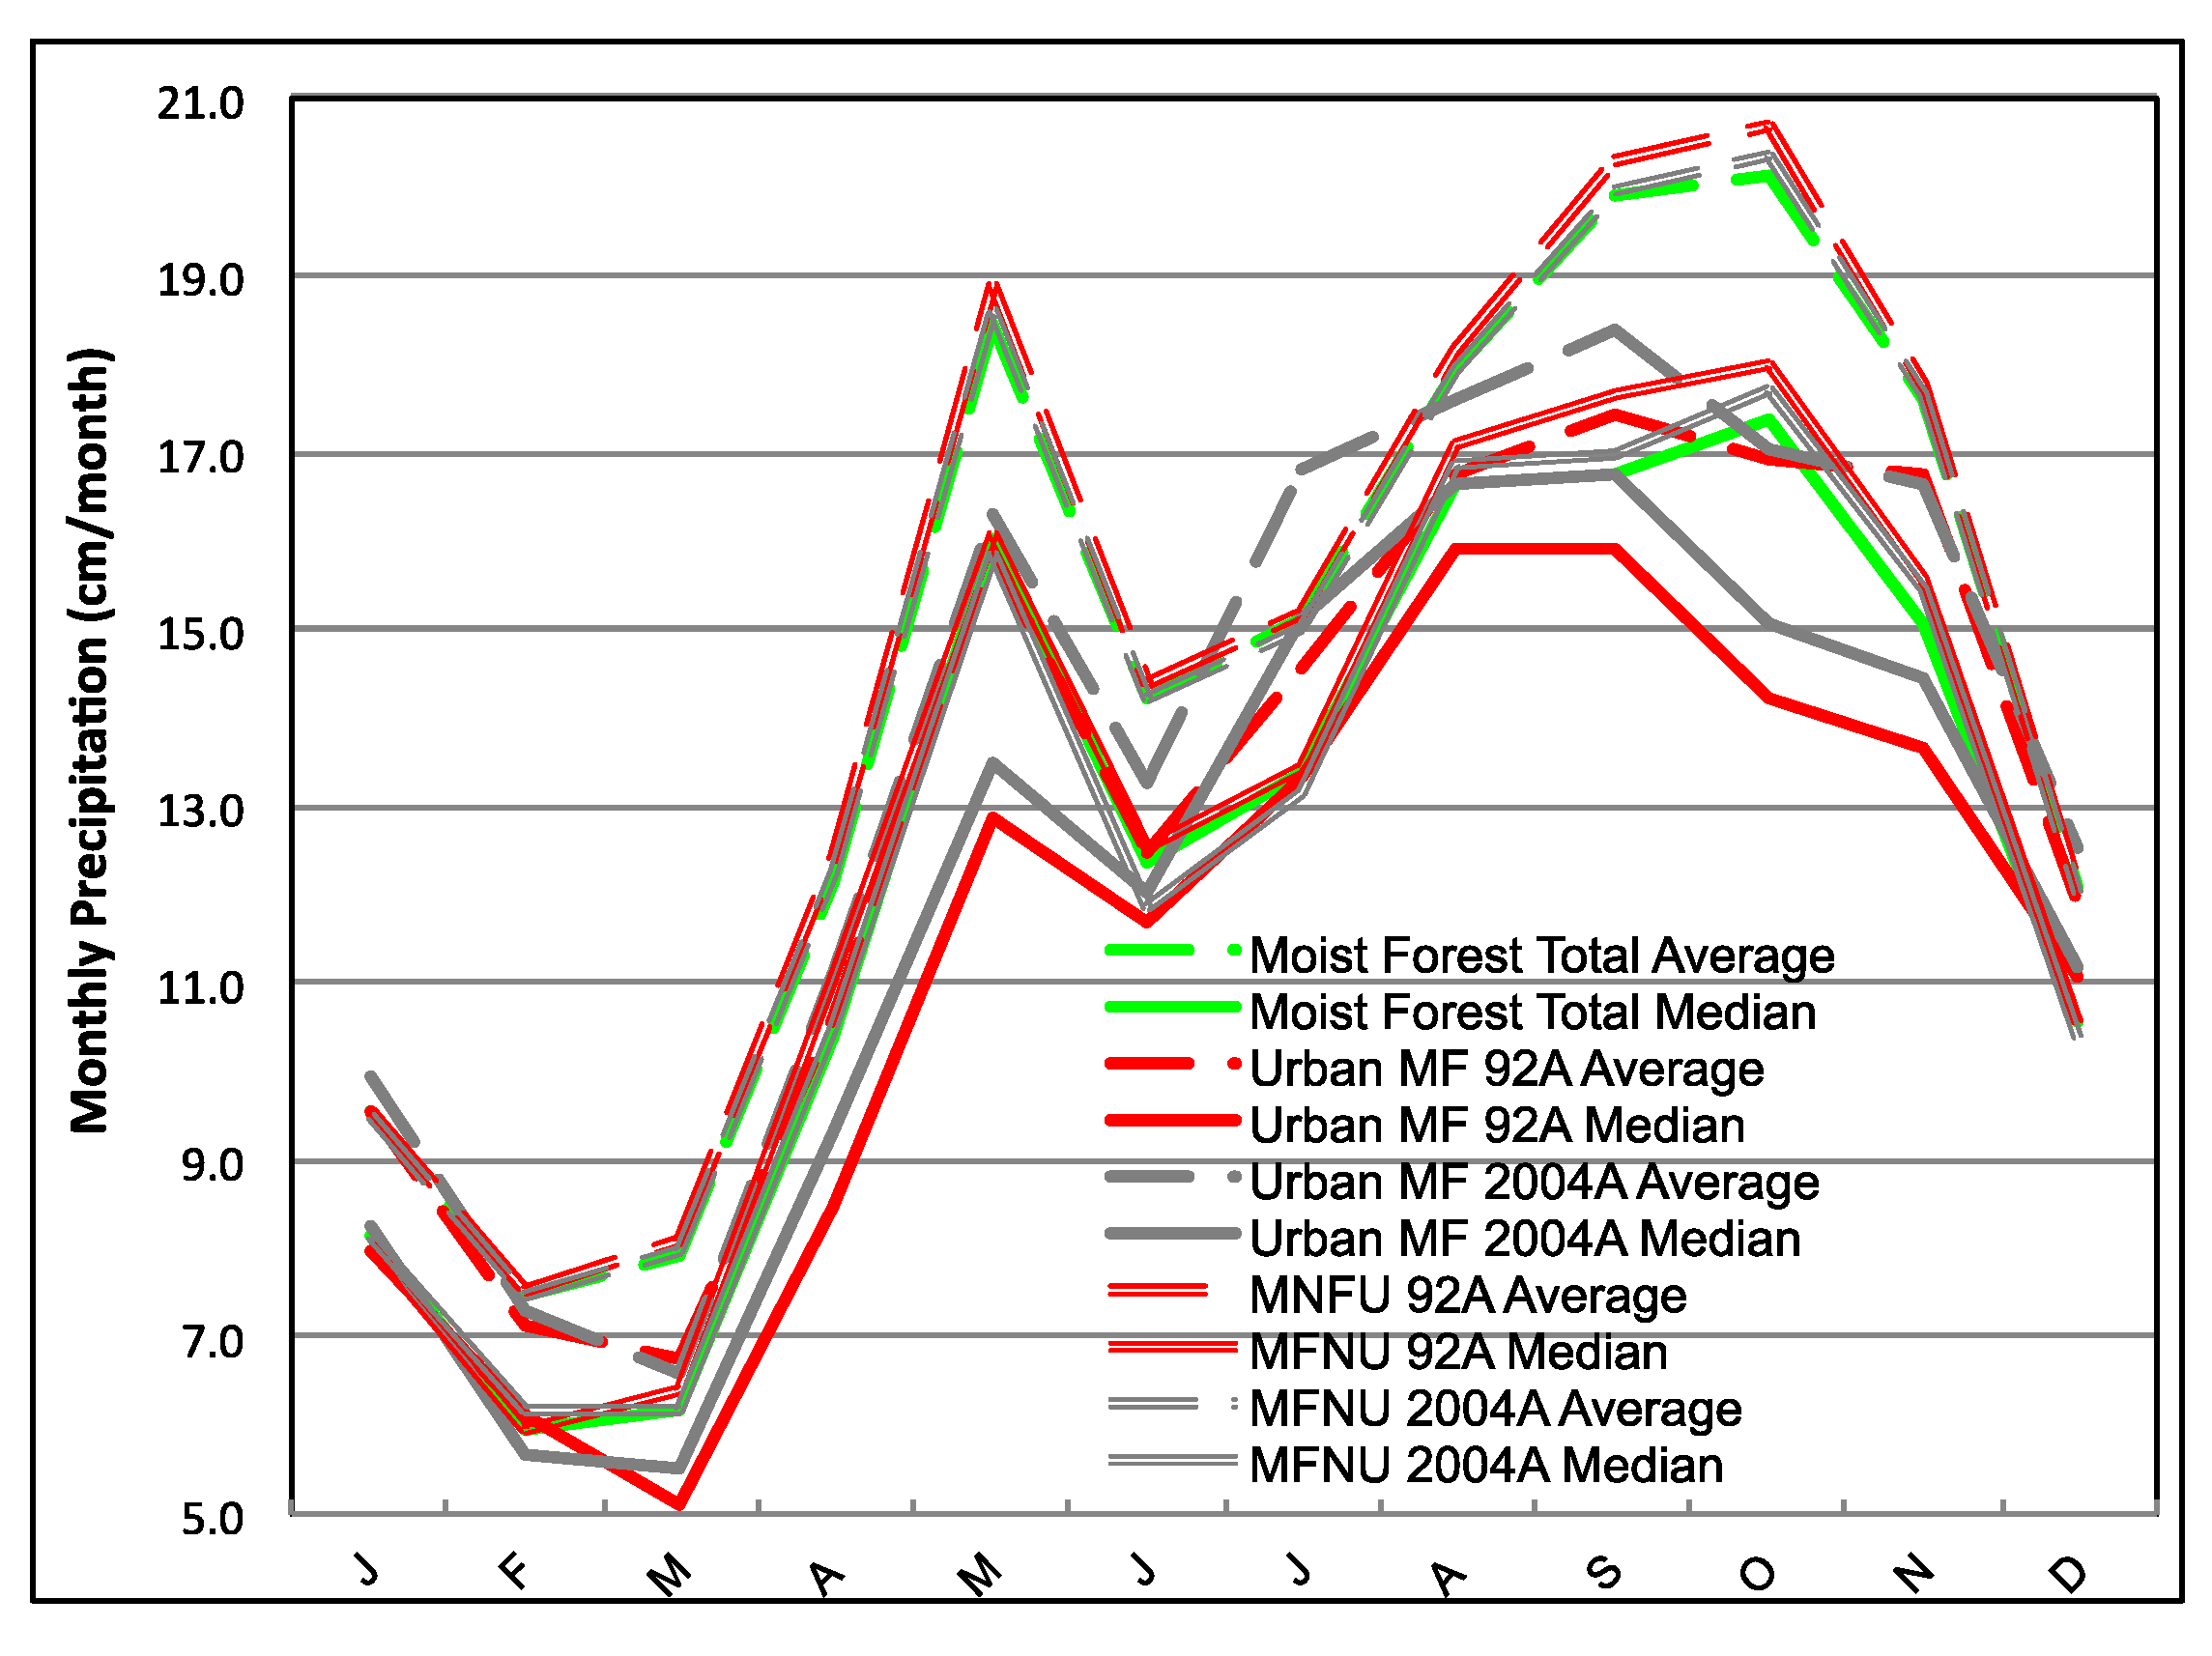
Figure 8.
Monthly average and median precipitation for the moist forest urban A and non-urban.
Figure 8.
Monthly average and median precipitation for the moist forest urban A and non-urban.
Figure 9.
Monthly average and median precipitation for the moist forest urban B and non-urban.
Figure 9.
Monthly average and median precipitation for the moist forest urban B and non-urban.
Figure 10.
Average monthly precipitation for the dry forest urban 1992 A and non-urban.
Figure 10.
Average monthly precipitation for the dry forest urban 1992 A and non-urban.
Figure 11.
Median monthly precipitation for the dry forest urban 1992 A and non-urban.
Figure 11.
Median monthly precipitation for the dry forest urban 1992 A and non-urban.
Figure 12.
Average monthly precipitation for dry forest 2004 urban and non-urban.
Figure 12.
Average monthly precipitation for dry forest 2004 urban and non-urban.
Figure 13.
Median monthly precipitation for dry forest 2004 urban vs. non-urban.
Figure 13.
Median monthly precipitation for dry forest 2004 urban vs. non-urban.
Figure 14.
Puerto Rico annual cycle monthly precipitation by period.
Figure 14.
Puerto Rico annual cycle monthly precipitation by period.
Figure 15.
Wet forest annual cycle monthly precipitation by period.
Figure 15.
Wet forest annual cycle monthly precipitation by period.
Figure 16.
Moist forest annual cycle monthly precipitation by period.
Figure 16.
Moist forest annual cycle monthly precipitation by period.
Figure 17.
Dry forest annual cycle monthly precipitation by period.
Figure 17.
Dry forest annual cycle monthly precipitation by period.
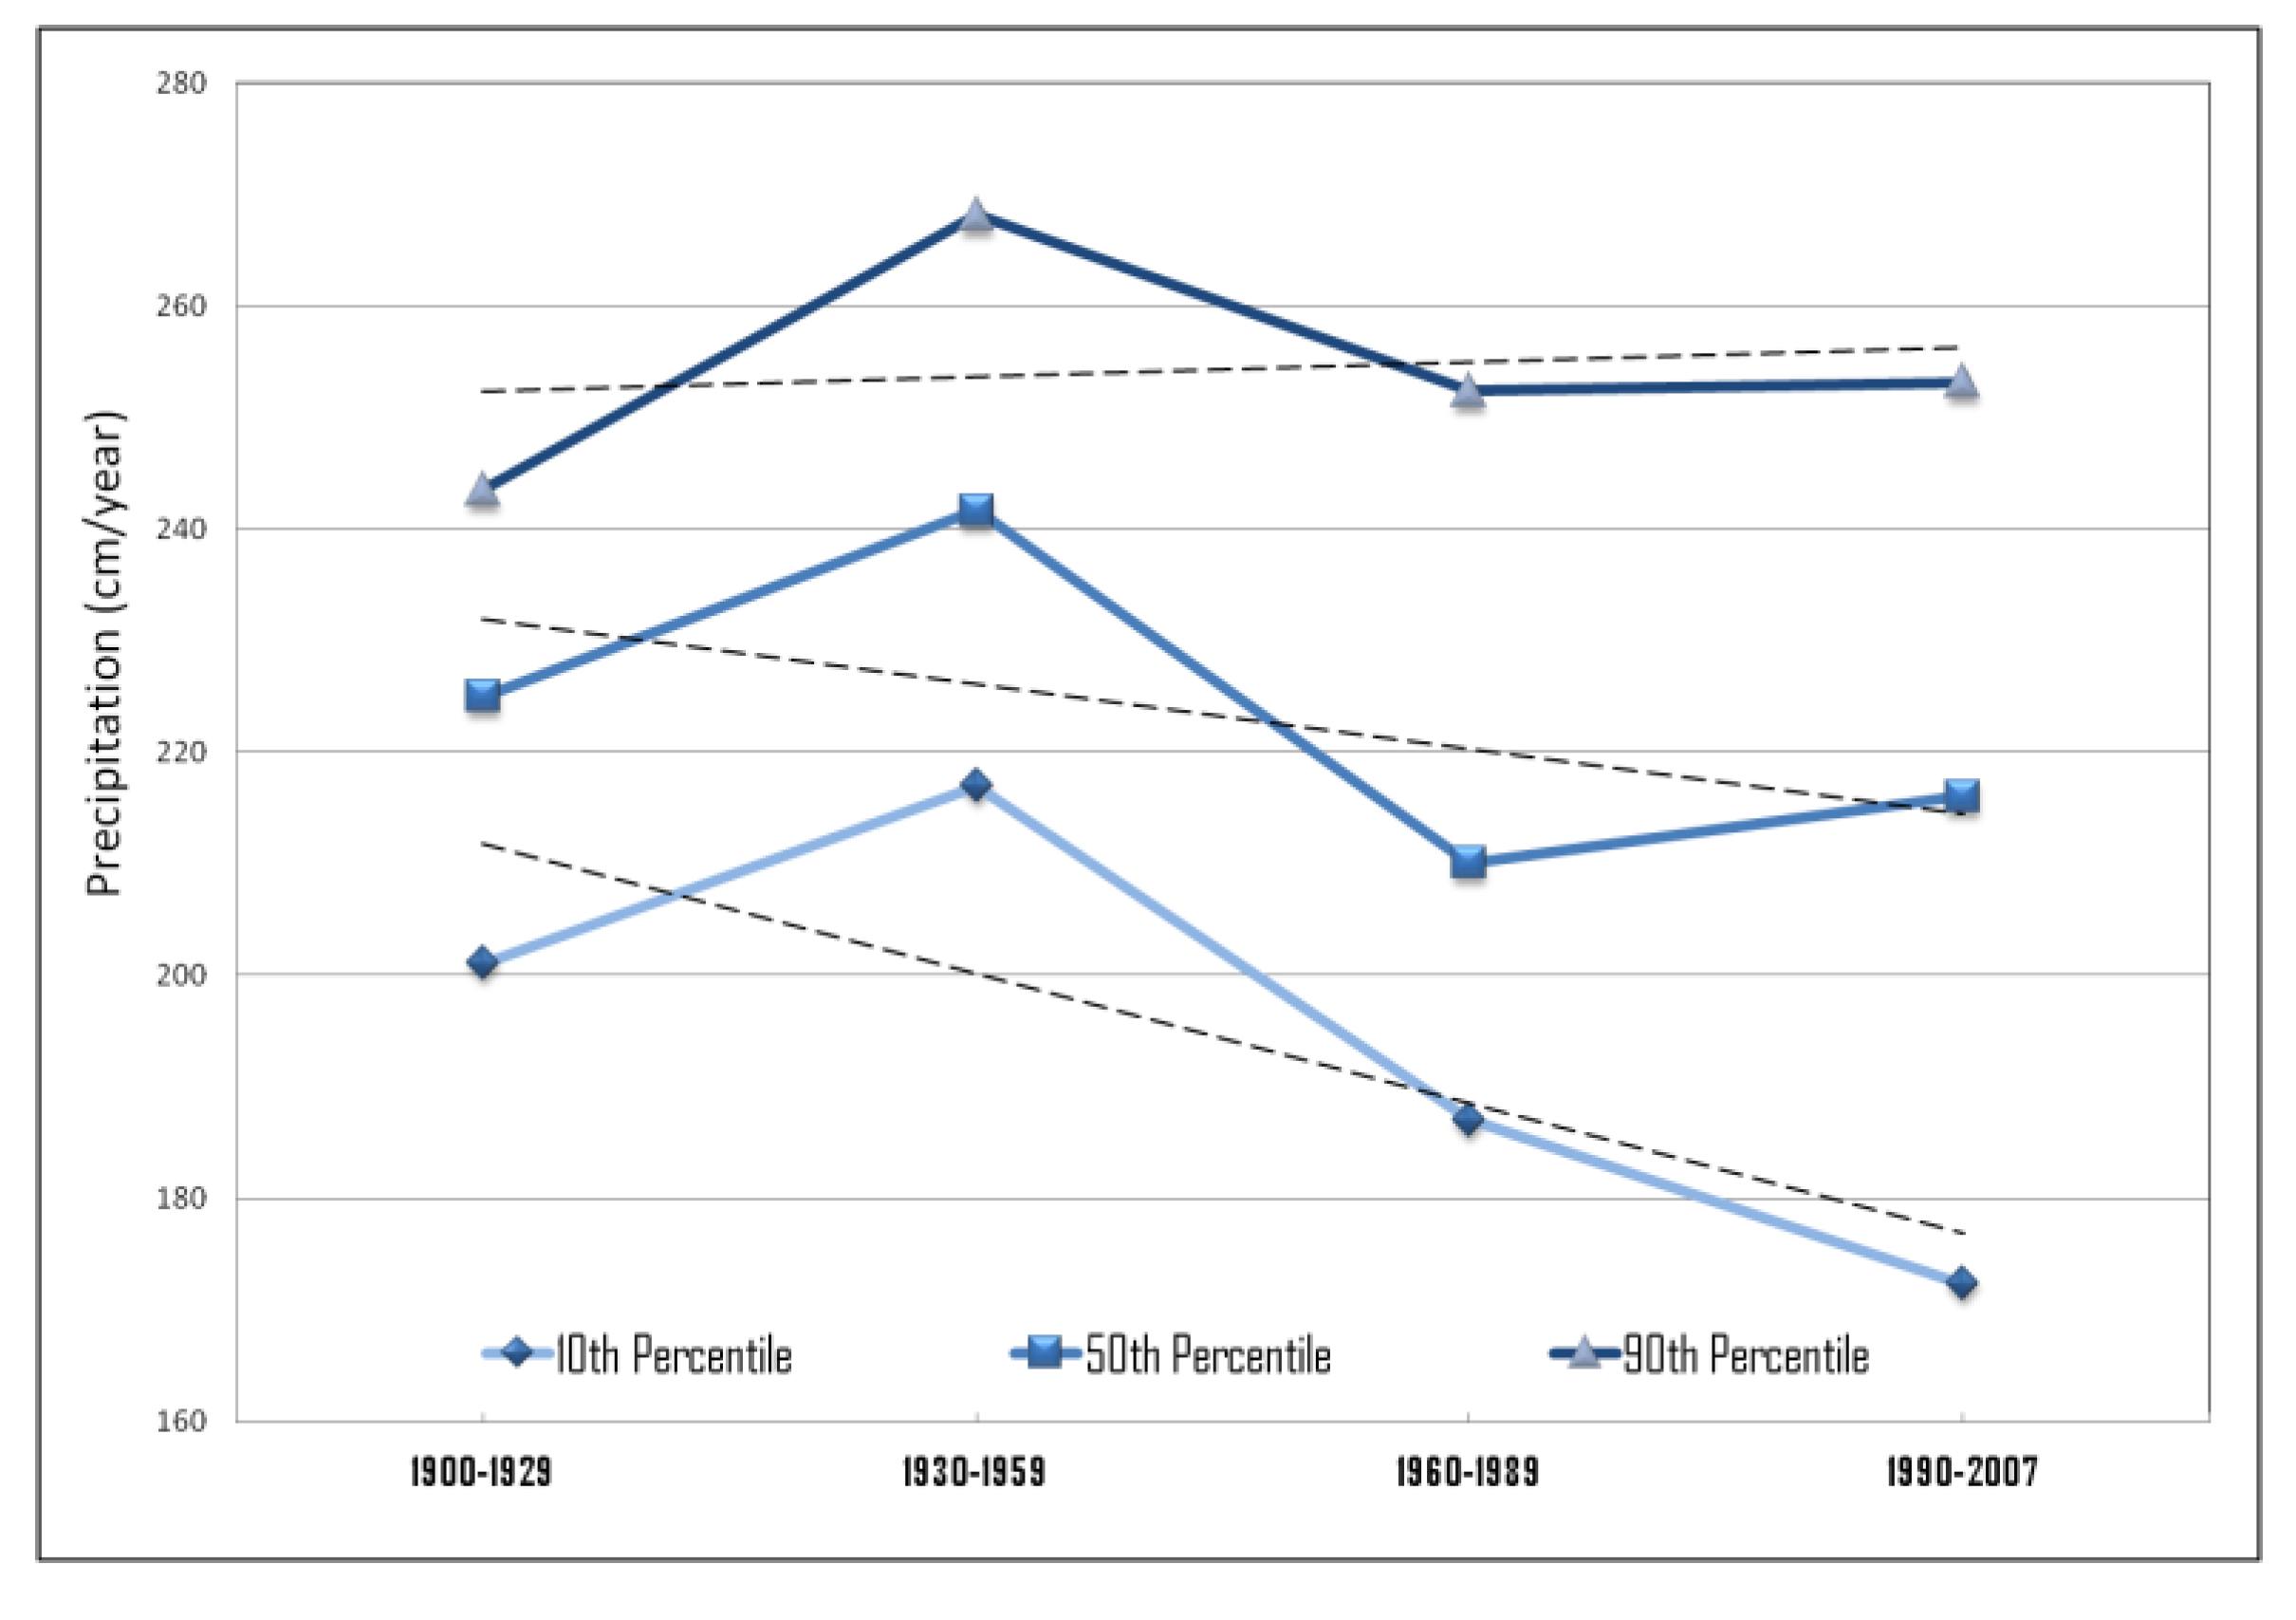
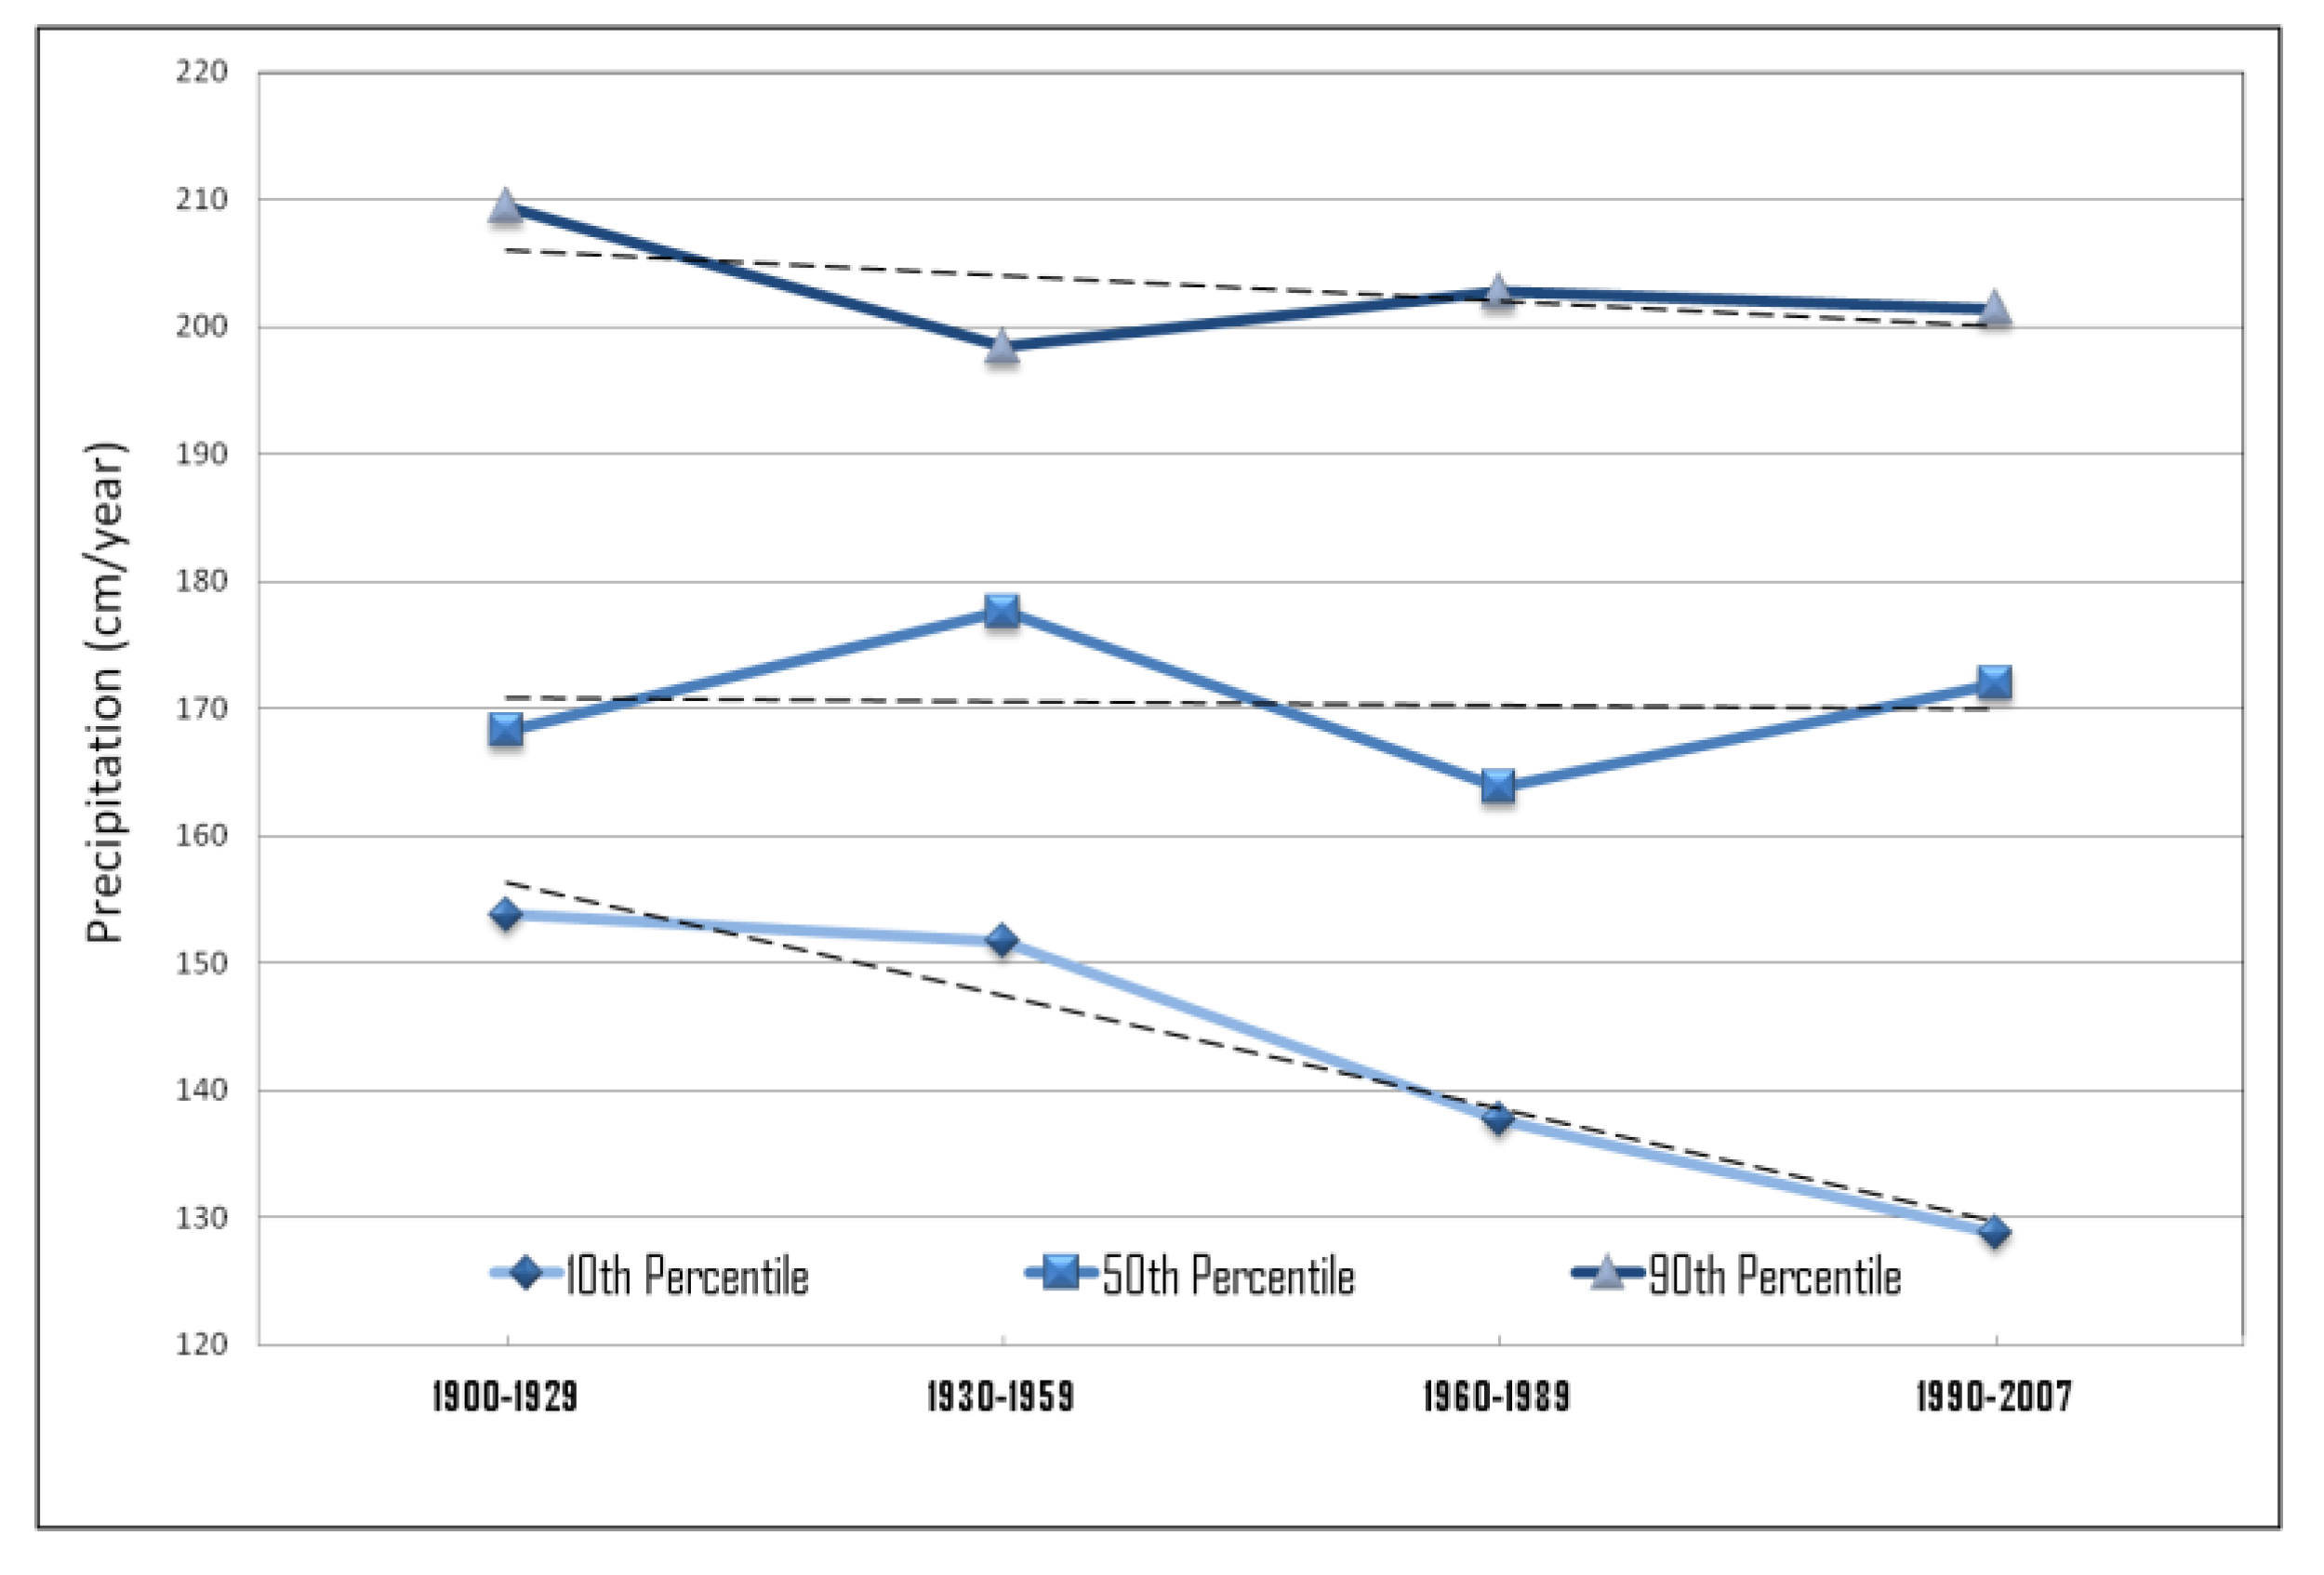
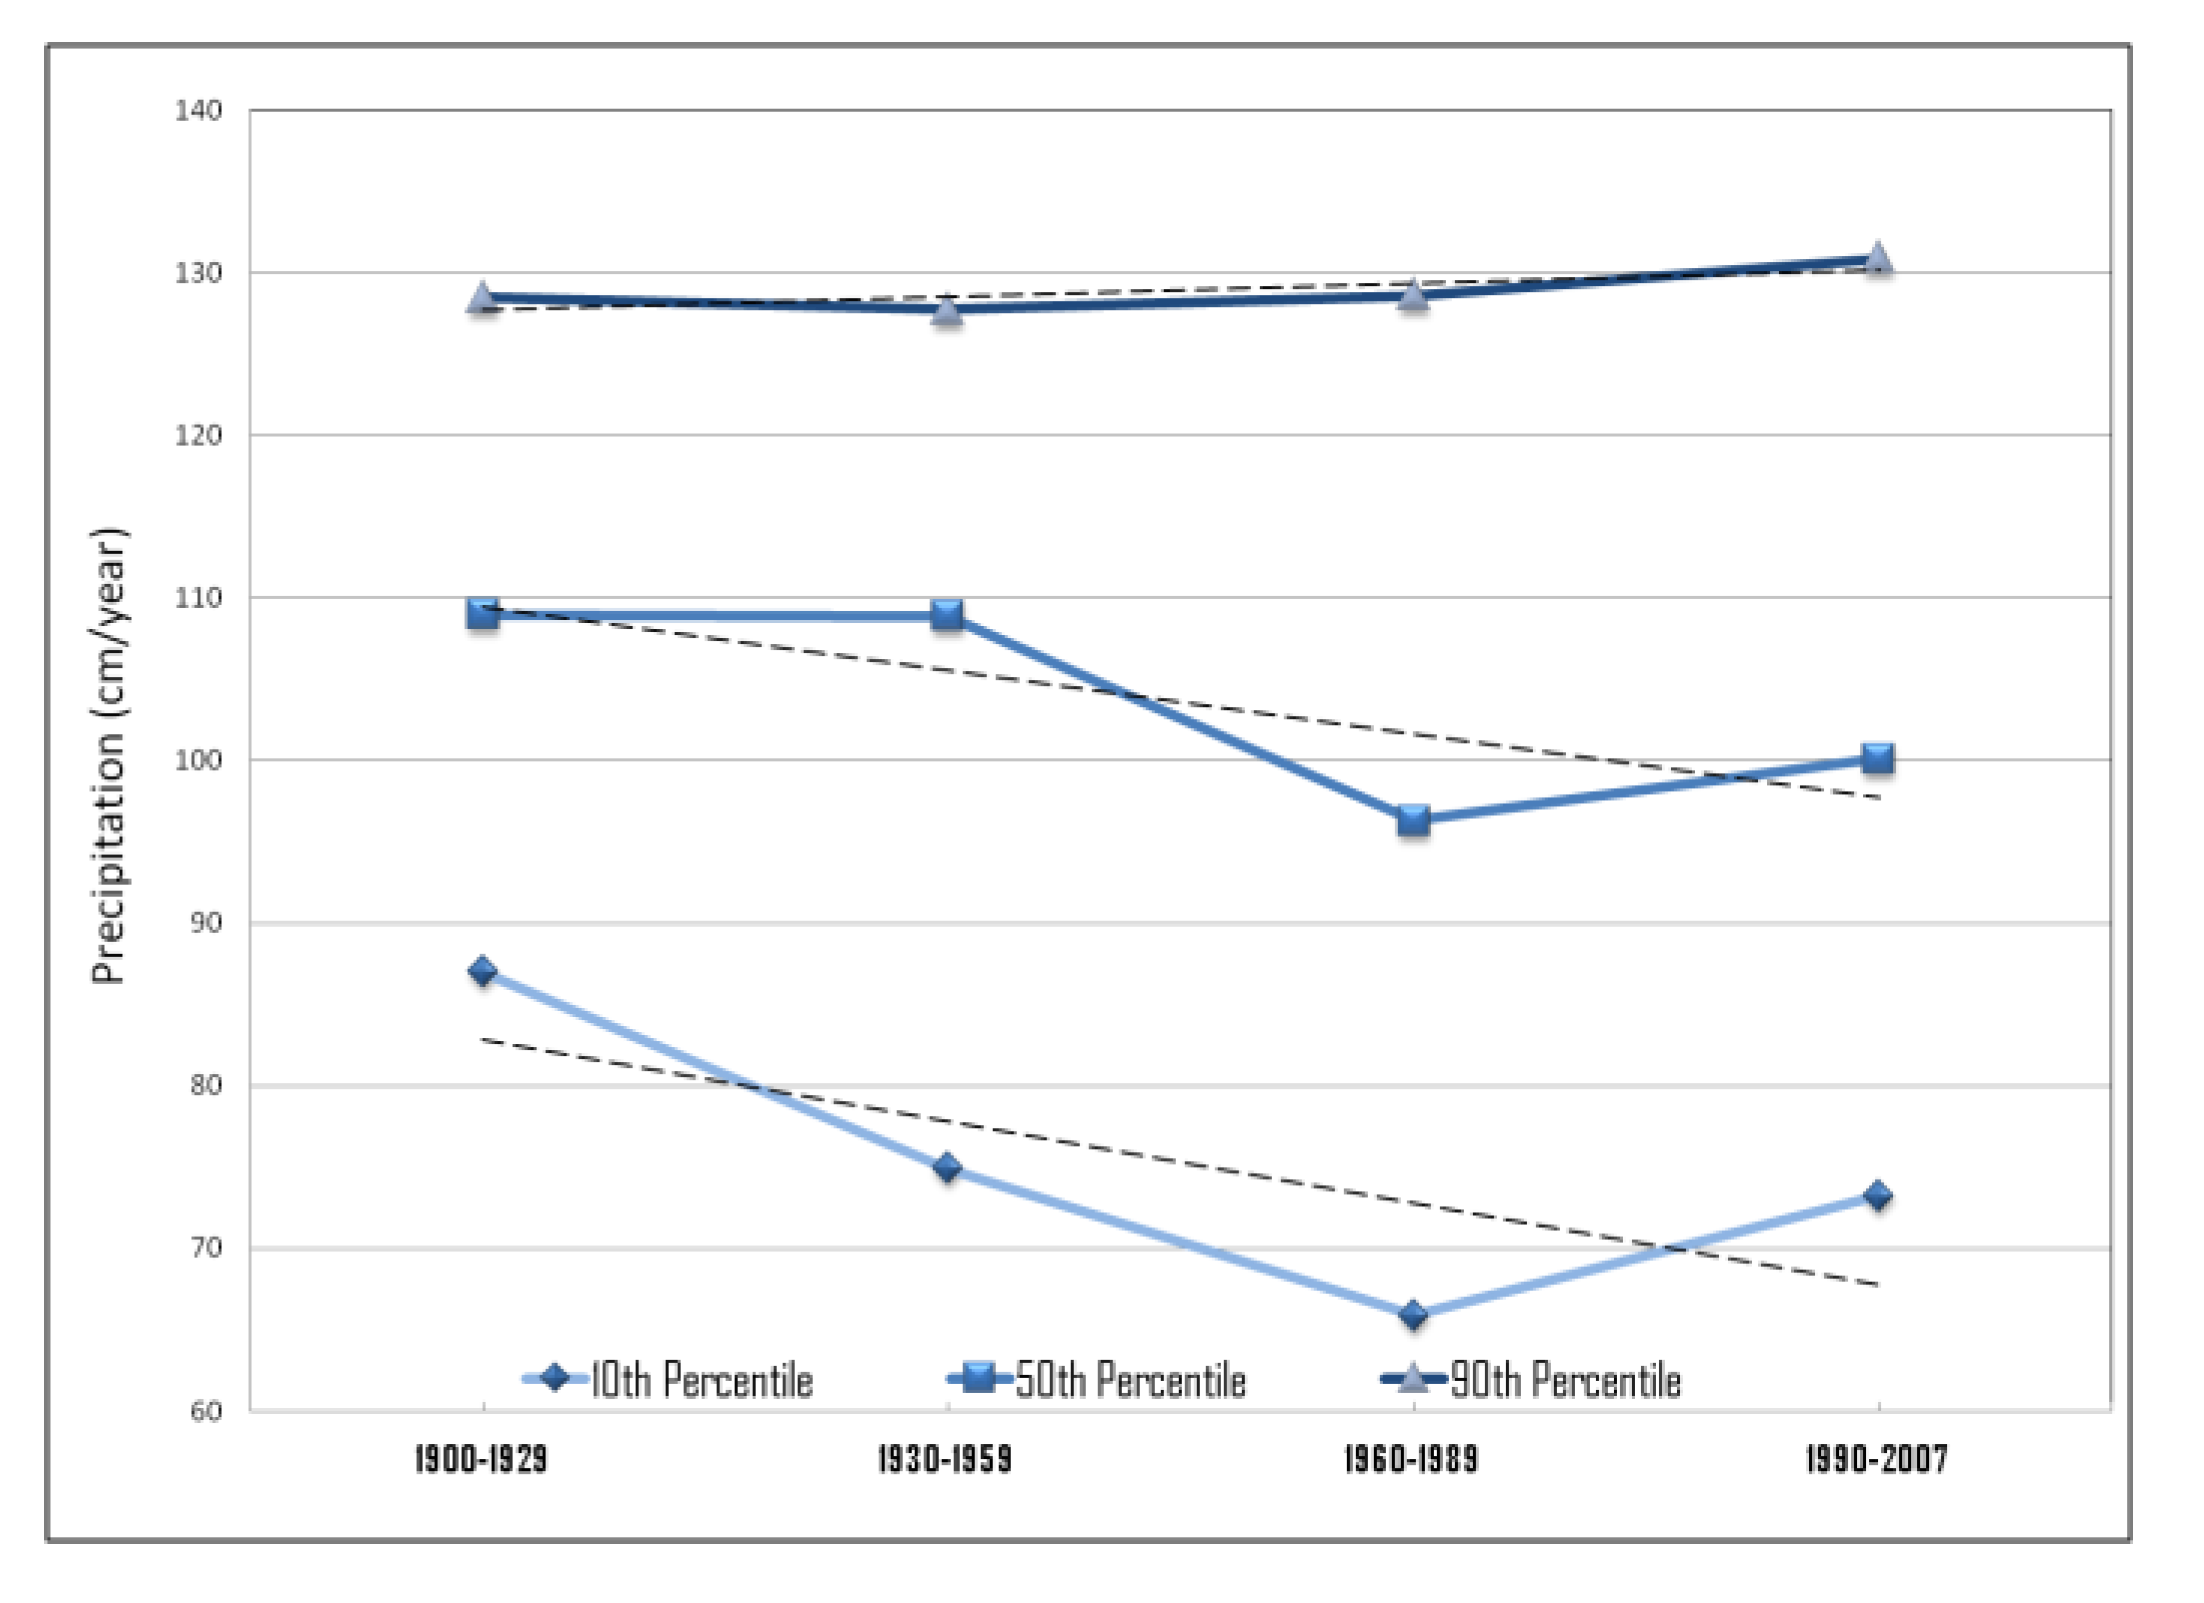
Historical trends for the 90th, 50th, and 10th percentiles of monthly precipitation for the 30-year climatological periods in each HELZ have decreased (
Figure 19,
Figure 20 and
Figure 21). Most of the trends decrease for the entire century however, the 90th percentile in the Wet Forest and the Dry Forest have an increasing trend, suggesting an increase in frequency of larger precipitation periods (months or years) in these two HELZs while smaller periods are decreasing across the entire island. Despite the dominant decreasing trend in the 50th percentile, this parameter has been increasing since 1989 in all HELZ indicating an increase in median precipitation in the last 17 years. All 10th percentiles have been decreasing rapidly for the entire century in each HELZ, indicating a strong decrease in small precipitation periods, however only in the Dry Forest has the 10th percentile been increasing in the last 17 years. The decrease in precipitation combined with an increase of heavy precipitation periods in the most recent 17 years matches projections for the Caribbean Basin under climate change scenarios [
14]. Although from the data analyzed the magnitude and intensity of precipitation events is not evident, periods of larger precipitation may occur by either low frequency of large precipitation events or high frequency of small precipitation events both yielding large amounts of total accumulations for a given period (months or years). Climate change projections for the Caribbean point at higher frequency of dry periods combined with a lower frequency of high precipitation periods [
14].
Figure 18.
Seasonal monthly total precipitation by period.
Figure 18.
Seasonal monthly total precipitation by period.
Monthly precipitation for the period 1900–2007 in most areas of Puerto Rico follows a Gaussian (Normal) distribution. However, eastern HELZ Subdivision sites precipitation record fitted the Johnson transformation distribution (
Table 5), which may suggest a different dominant synoptic or sea breeze orographic forcing rainfall origin at these locations. At all Wet Forest Subdivisions median precipitation is higher than the average (
Table 5) as they receive more rain events of higher magnitudes than other HELZ’s. Of the three HELZ studied, the most precipitation falls in the Wet Forest, as expected, followed by the Moist Forest while the Dry Forest receives the lowest precipitation and is statistically different from the Moist Forest and the Wet Forest (α = 0.05). The Moist Forest and the Wet Forest precipitation average are higher than the average precipitation for the main three HELZs.
Average annual precipitation in Puerto Rico has been decreasing for the past century (1900–1990) in all three HELZs with most stations recording negative trends (
Figure 3). However, in particular stations, zones and time periods, positive trends have also occurred (
Figure 21 and
Figure 22). Since the 1970s average annual precipitation level has increased (
Figure 3). A notable increase in median precipitation primarily in the Wet Forest from 1920s to the 1950s was followed by a dramatic drop in median precipitation in all HELZs after 1970, but all HELZs show increasing median and average precipitation in the last decade of the record (
Figure 3). Dry and wet periods in Puerto Rico seem to follow a cyclic pattern consistent in the Caribbean basin that has been associated with the North Atlantic Oscillation [
31]. Average and median decadal precipitation has greater separation since the 1970s, particularly in the Dry Forest (
Figure 3). Average and median rainfall has increased consistently in the Dry Forest since the 1970s while in the Moist and Wet Forests it began since the 1990s (
Figure 3). Greater separation between average and median curves after 1970 is consistent with global warming projections for the Caribbean of an increase in drier periods combined with larger precipitation events [
14].
Figure 19.
Annual precipitation quantiles for wet forest by period.
Figure 19.
Annual precipitation quantiles for wet forest by period.
Figure 20.
Annual precipitation quantiles for moist forest by period.
Figure 20.
Annual precipitation quantiles for moist forest by period.
Figure 21.
Annual precipitation quantiles for dry forest by period.
Figure 21.
Annual precipitation quantiles for dry forest by period.
Table 5.
Holdridge ecological life zones distributions and descriptive statistics.
Table 5.
Holdridge ecological life zones distributions and descriptive statistics.
| HELZ | Data Distribution | Mean (cm/month) | Standard Deviation | Median (cm/month) | Maximum (cm/month) | Remarks |
|---|
| WFR | Johnson Transformation | 21.89 | 6.198 | 24.95 | 29.12 | Rain Forest Reservation. Wettest region in Puerto Rico, different to most of Puerto Rico. Median above Average |
| WF | Gaussian | 18.29 | 8.165 | 17.76 | 30.27 | Center Mountains. Highest rainfall variation and maximum |
| UnWF | Johnson Transformation | 19.79 | 6.733 | 23.10 | 27.32 | Eastern Mountain, Median above Average |
| RWF | Gaussian | 18.52 | 8.484 | 18.88 | 30.19 | Regenerated Wet Forest, Median Above Average |
| MF | Gaussian | 14.20 | 4.773 | 14.34 | 20.18 | Most of Puerto Rico. Mean and median very similar |
| DF | Gaussian | 8.19 | 4.447 | 7.80 | 15.33 | Driest region in Puerto Rico. Significantly different to ALL others in every test |
Figure 22.
1900–2007 precipitation trends by station.
Figure 22.
1900–2007 precipitation trends by station.
Table 6.
1992 land use and land cover (LULC) average monthly precipitation ratio 1900–2007.
Table 6.
1992 land use and land cover (LULC) average monthly precipitation ratio 1900–2007.
| 1992 | Total | HELZ/PR | Selection A | Selection B 30 m | Selection B 60 m | Remarks |
|---|
| cm/month | cm/month | Urban | Non Urban | Urban | Non Urban | Urban | Non Urban |
|---|
| WF | 18.29 | 1.32 | N/A | N/A | 1.07 | 0.99 | 0.91 | 1.01 | Urban B 30 More precipitation over urban |
| MF | 14.20 | 1.02 | 0.90 | 1.01 | 0.91 | 1.02 | 0.91 | 1.02 | Less precipitation over urban areas vs. no urban |
| DF | 7.80 | 0.56 | 0.97 | 1.06 | 1.02 | 1.06 | 1.02 | 1.08 | Less precipitation over urban areas vs. no urban. Smaller difference |
| PR | 13.88 | 1.00 | 0.87 | 1.02 | 0.89 | 1.00 | 0.85 | 1.03 | Less precipitation over urban areas vs. no urban |
In general, urban areas received slighter less average precipitation than the non-urban areas in each HELZ, with the exception of the 1992 map B selection 30-meter buffer.
Table 6 shows urban
vs. non-urban average monthly precipitation differences expressed using a ratio in every HELZ and for every selection method. Ratio values > 1 indicate average monthly precipitation that is above the average for Puerto Rico as a whole or the HELZ, values < 1 indicate the contrary. The 2004 map station selections consistently showed more rainfall over urban areas than over non-urban in the Dry Forest in all selections (
Table 7).
Table 7.
2004 LULC average monthly precipitation ratio 1900–2007.
Table 7.
2004 LULC average monthly precipitation ratio 1900–2007.
| 2004 | Total cm/month | HELZ/PR cm/month | Selection A | Selection B 30 m | Selection B 60 m | Remarks |
|---|
| Urban | Non Urban | Urban | Non Urban | Urban | Non Urban |
|---|
| WF | 18.29 | 1.32 | N/A | N/A | N/A | N/A | N/A | N/A | Less precipitation over urban areas vs. no urban |
| MF | 14.20 | 1.02 | 0.96 | 0.99 | 0.94 | 1.00 | 0.95 | 1.00 | Less precipitation over urban areas vs. no urban |
| DF | 7.80 | 0.56 | 1.26 | 1.02 | 1.17 | 1.03 | 1.08 | 1.05 | More precipitation over urban areas vs. no urban |
| PR | 13.88 | 1.00 | 0.901 | 0.910 | 0.882 | 0.914 | 0.877 | 0.917 | Less precipitation over urban areas vs. no urban |
5.1. ANOVA Results
Urban regions may induce precipitation because of increased convection and/or convergence over the city and the presence of favorable aerosols for cloud formation. On the other hand precipitation may decrease because of the presence of particular unfavorable aerosols for cloud formation, air pollution, a decrease in the mixing ratio or less available moisture. If urban areas in Puerto Rico are affecting local precipitation then there should be differences between urban and non-urban regions. However, no statistically significant differences were found in average monthly precipitation between urban areas and non-urban areas in each HELZ in any selection type or buffer size based on One Way ANOVA (α = 0.05). Thus we reject the null hypothesis that there are significant differences in average monthly precipitation between urban and non-urban areas. In addition, our results are independent of the selection method used to categorize stations between urban and non-urban. In other words, urban and non-urban areas receive statistically the same amounts of monthly average precipitation and, based on the data and methods used, the development of urban landscapes has not significantly changed the amounts of rainfall compared to the average and variability of the corresponding HELZ. This result contrasts with effects observed in larger continental cities, and may reflect the overwhelming dominance of maritime or synoptic conditions in controlling precipitation across Puerto Rico, little contrast between urban and non-urban areas or the small size of urban areas in the island. These results are in agreement with results presented by Comarazamy and Gonzalez [
40] that suggested that large historical precipitation changes were associated to global and regional-scale climate changes, but little change was found due to historical LUCC
5.2. Precipitation Trends
In general, decreasing trends dominate average rainfall over Puerto Rico for the last century regardless of HELZ (
Figure 22), which is consistent with reports of decreasing Caribbean precipitation [
31]. However, the most recent 17 years show a different pattern, with most stations having positive trends (
Figure 23 and
Figure 24). In the Dry Forest a different pattern than the other HELZ occurred, with increasing precipitation trends in the urban area for most time periods that were analyzed (century, PRISM, NARR), consistently contradicting the long term pattern of decreasing trends that dominate the island. Thus, even on a small island in the Tropics the scale of Puerto Rico, there are noticeable intraregional climatic differences. HELZs are important to account for when comparing urban and rural climate stations because detectable differences may be because of natural differences in microclimates.
Figure 23.
1900–2007 station precipitation trends by period.
Figure 23.
1900–2007 station precipitation trends by period.
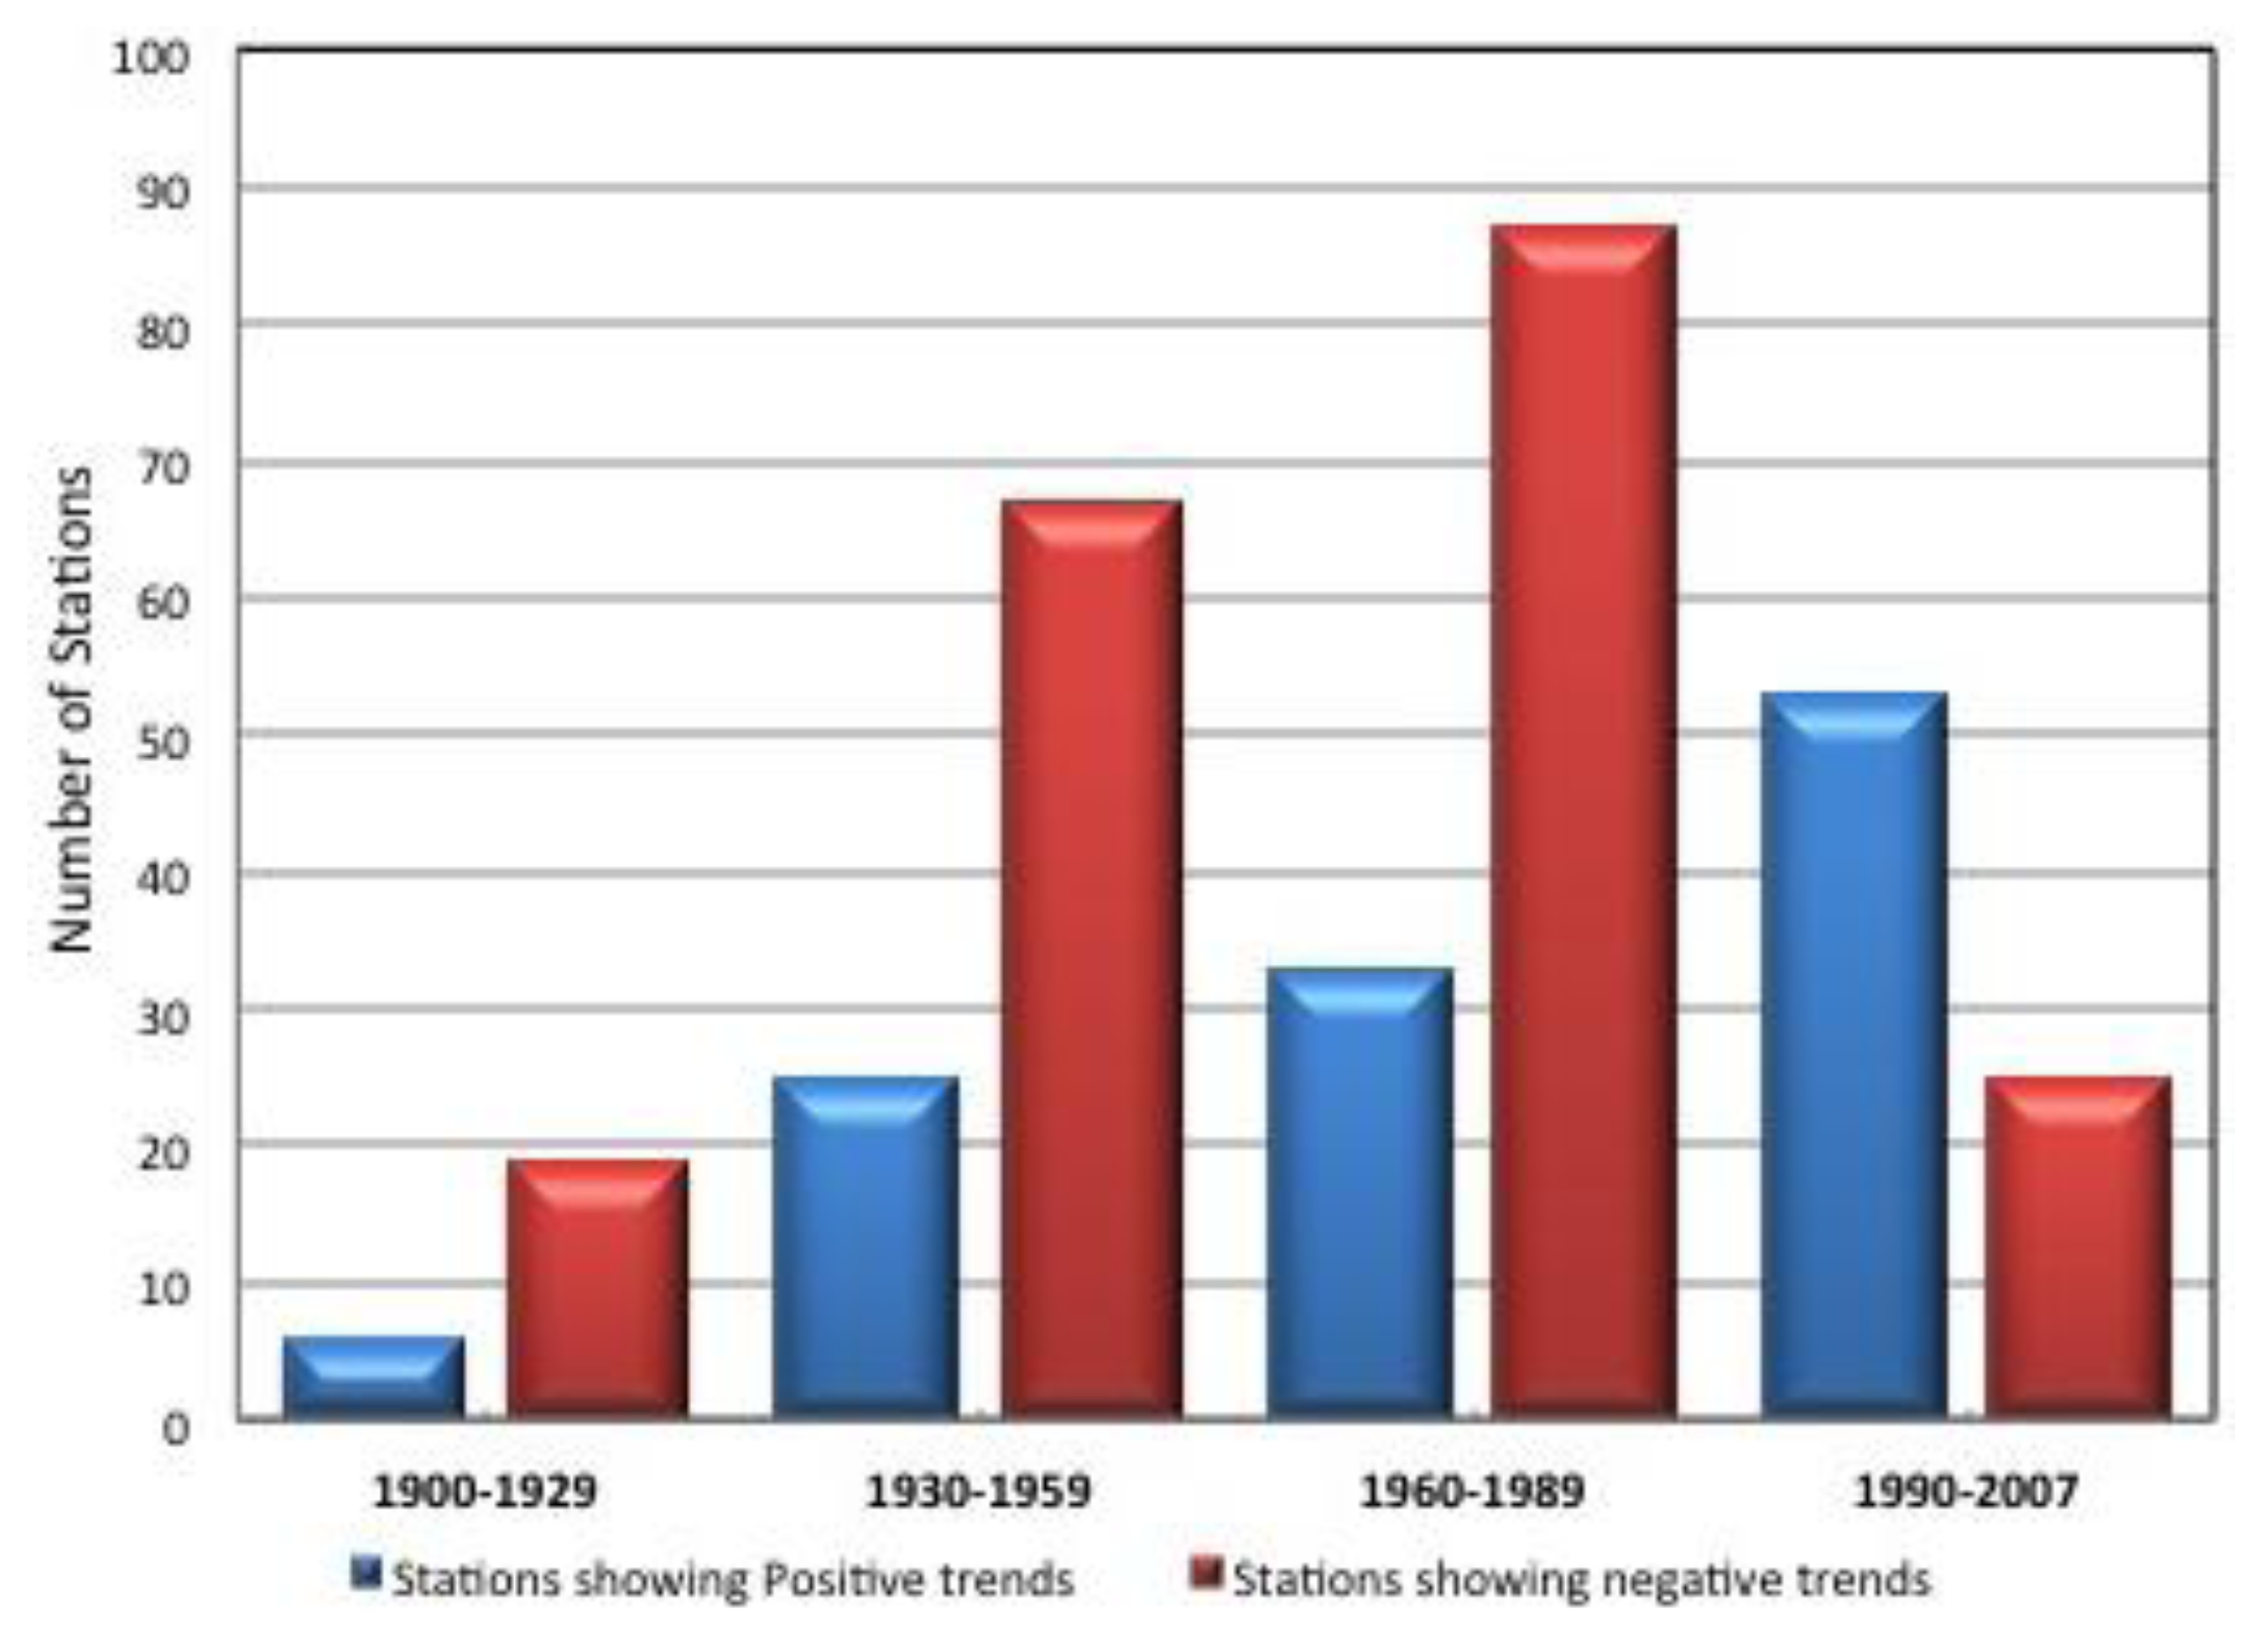
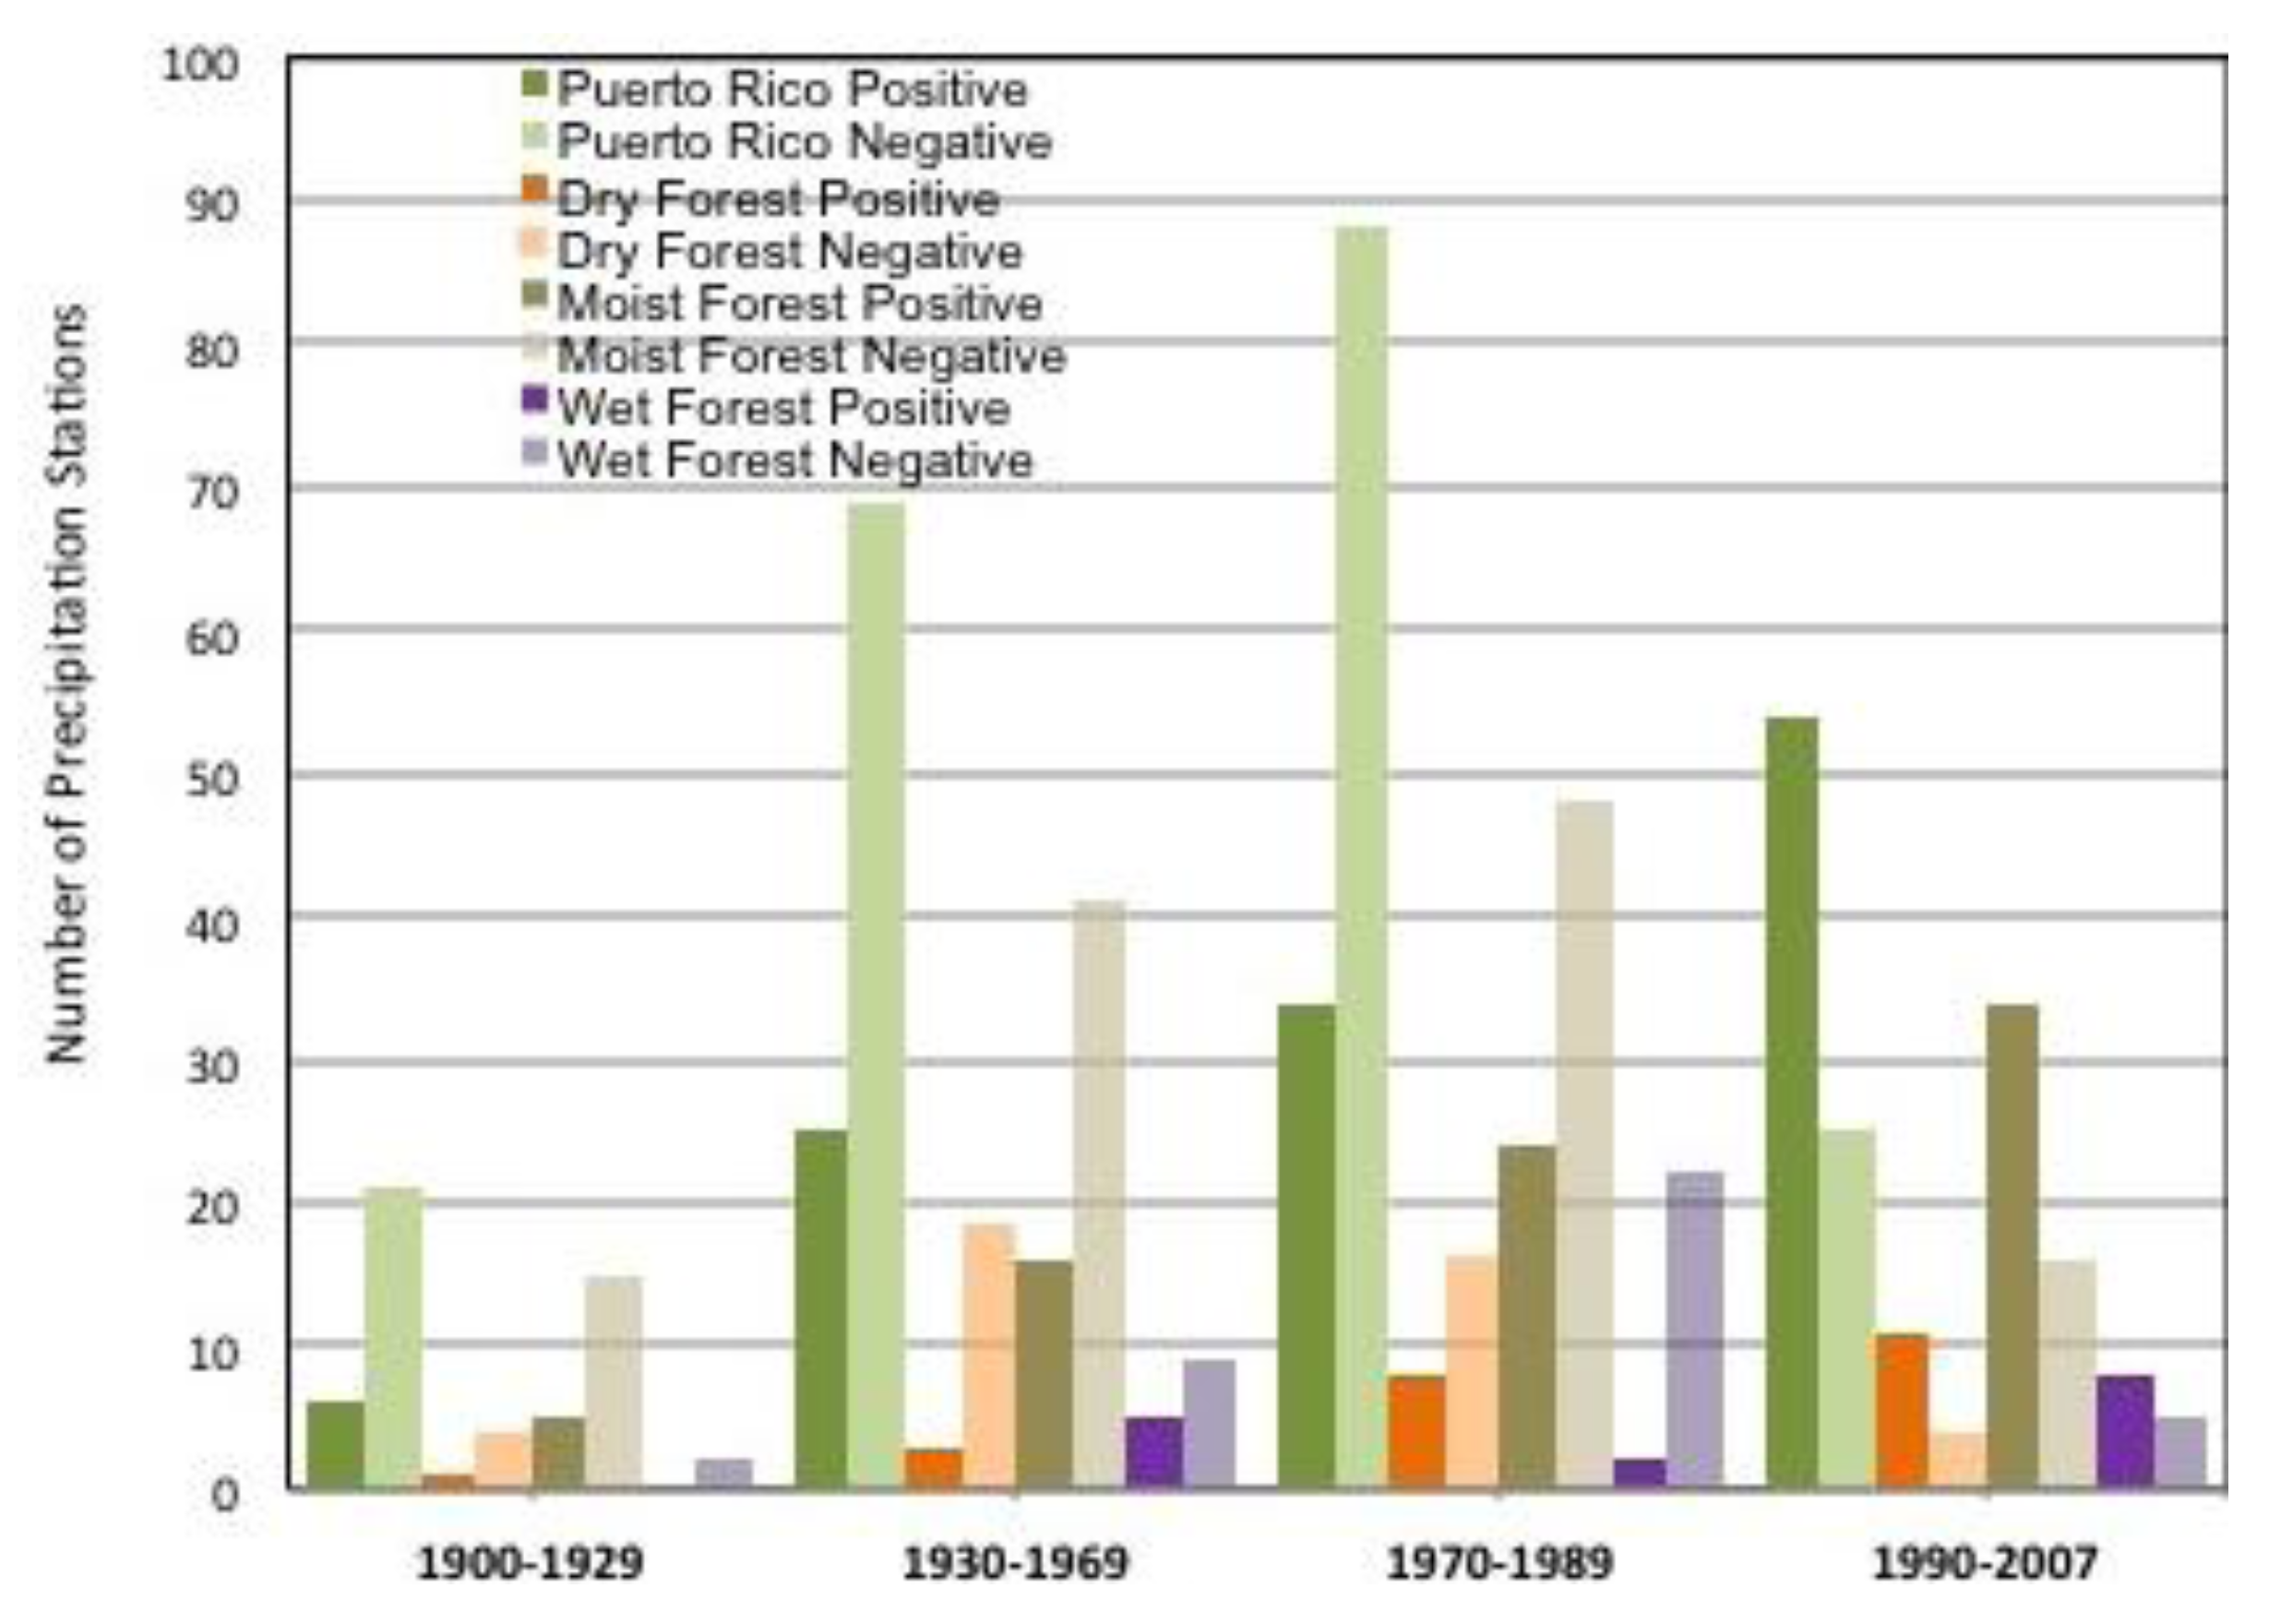
Figure 24.
Number of stations with positive vs. negative trends by HELZ and period.
Figure 24.
Number of stations with positive vs. negative trends by HELZ and period.
5.3. GIS Interpolated Maps Analysis
Yearly average total precipitation and its corresponding trends from surface stations were interpolated with GIS ARC MAP 10.1 to further investigate precipitation patterns and changes related to urban and non-urban areas at each HELZ. The data were divided into the study periods previously mentioned and average values were interpolated applying the IDW method commonly used for precipitation point data. Statistical analysis was performed on GIS generated grid cells to evaluate urban vs. non-urban magnitudes.
We found statistical differences between urban and non-urban yearly average total precipitation in most time periods and HELZs (
Table 8 and
Table 9). These findings were consistent with GIS analysis of PRISM maps generation by a different method not considering any land covers, using different spatial resolution and time period. However, some findings were counter-intuitive as there is no clear correlation between urban and non-urban precipitation with direction, time, quantity and location (
Figure 25 and
Figure 26). We expected that any urban impacts on precipitation would be evident or limited to the later periods when urban development and buildup has been notably intense. Statistical differences between urban and non urban areas from the beginning of the century would suggest that urban impacts have always existed locally or that rainfall naturally splits statistically differently at urban and non urban locations.
Table 8.
Yearly Average Total Precipitation for each period and its corresponding Urban vs. Non urban T-test significance values: 270 m grid size.
Table 8.
Yearly Average Total Precipitation for each period and its corresponding Urban vs. Non urban T-test significance values: 270 m grid size.
| | 1900–1929 cm/year | 1930–1959 cm/year | 1960–1989 cm/year | 1990–2007 cm/year | 1963–1995 cm/year | 1979–2005 cm/year | PRISM cm/year |
|---|
| | U | NU | Sig. | U | NU | Sig. | U | NU | Sig. | U | NU | Sig. | U | NU | Sig. | U | NU | Sig. | U | NU | Sig. |
|---|
| WF | 375.16 | 341.81 | 0.000 | 429.40 | 398.76 | 0.000 | 470.76 | 406.70 | 0.000 | 202.75 | 214.86 | 0.000 | 504.77 | 433.56 | 0.000 | 361.72 | 319.98 | 0.000 | 165.62 | 172.84 | 0.000 |
| MF | 347.26 | 340.77 | 0.000 | 279.59 | 338.75 | 0.000 | 364.01 | 362.77 | 0.027 | 170.64 | 183.18 | 0.000 | 386.65 | 385.55 | 0.057 | 297.06 | 299.43 | 0.000 | 99.45 | 104.12 | 0.000 |
| DF | 226.24 | 220.29 | 0.000 | 266.67 | 240.35 | 0.000 | 244.45 | 255.27 | 0.000 | 151.52 | 153.16 | 0.001 | 267.08 | 273.51 | 0.000 | 232.89 | 233.05 | 0.802 | 207.74 | 216.95 | 0.000 |
Table 9.
Yearly average total precipitation for each period and its corresponding urban vs. non urban T-test significance values: 100 m grid size.
Table 9.
Yearly average total precipitation for each period and its corresponding urban vs. non urban T-test significance values: 100 m grid size.
| | 1900–1929 cm/year | 1930–1959 cm/year | 1960–1989 cm/year | 1990–2007 cm/year | 1963–1995 cm/year | 1979–2005 cm/year | PRISM cm/year |
|---|
| | U | NU | Sig. | U | NU | Sig. | U | NU | Sig. | U | NU | Sig. | U | NU | Sig. | U | NU | Sig. | U | NU | Sig. |
|---|
| WF | 375.33 | 342.11 | 0.000 | 434.80 | 398.95 | 0.000 | 479.00 | 407.02 | 0.000 | 199.31 | 214.37 | 0.000 | 513.57 | 434.07 | 0.000 | 362.57 | 320.32 | 0.000 | 165.62 | 172.84 | 0.000 |
| MF | 347.45 | 341.00 | 0.000 | 260.05 | 341.21 | 0.000 | 364.02 | 362.77 | 0.000 | 169.90 | 183.31 | 0.000 | 387.81 | 385.43 | 0.000 | 298.75 | 299.43 | 0.000 | 99.45 | 104.12 | 0.000 |
| DF | 225.54 | 219.91 | 0.000 | 271.75 | 238.65 | 0.000 | 240.31 | 255.44 | 0.000 | 149.74 | 153.06 | 0.000 | 263.21 | 273.52 | 0.000 | 229.67 | 233.04 | 0.000 | 207.74 | 216.95 | 0.000 |
Figure 25.
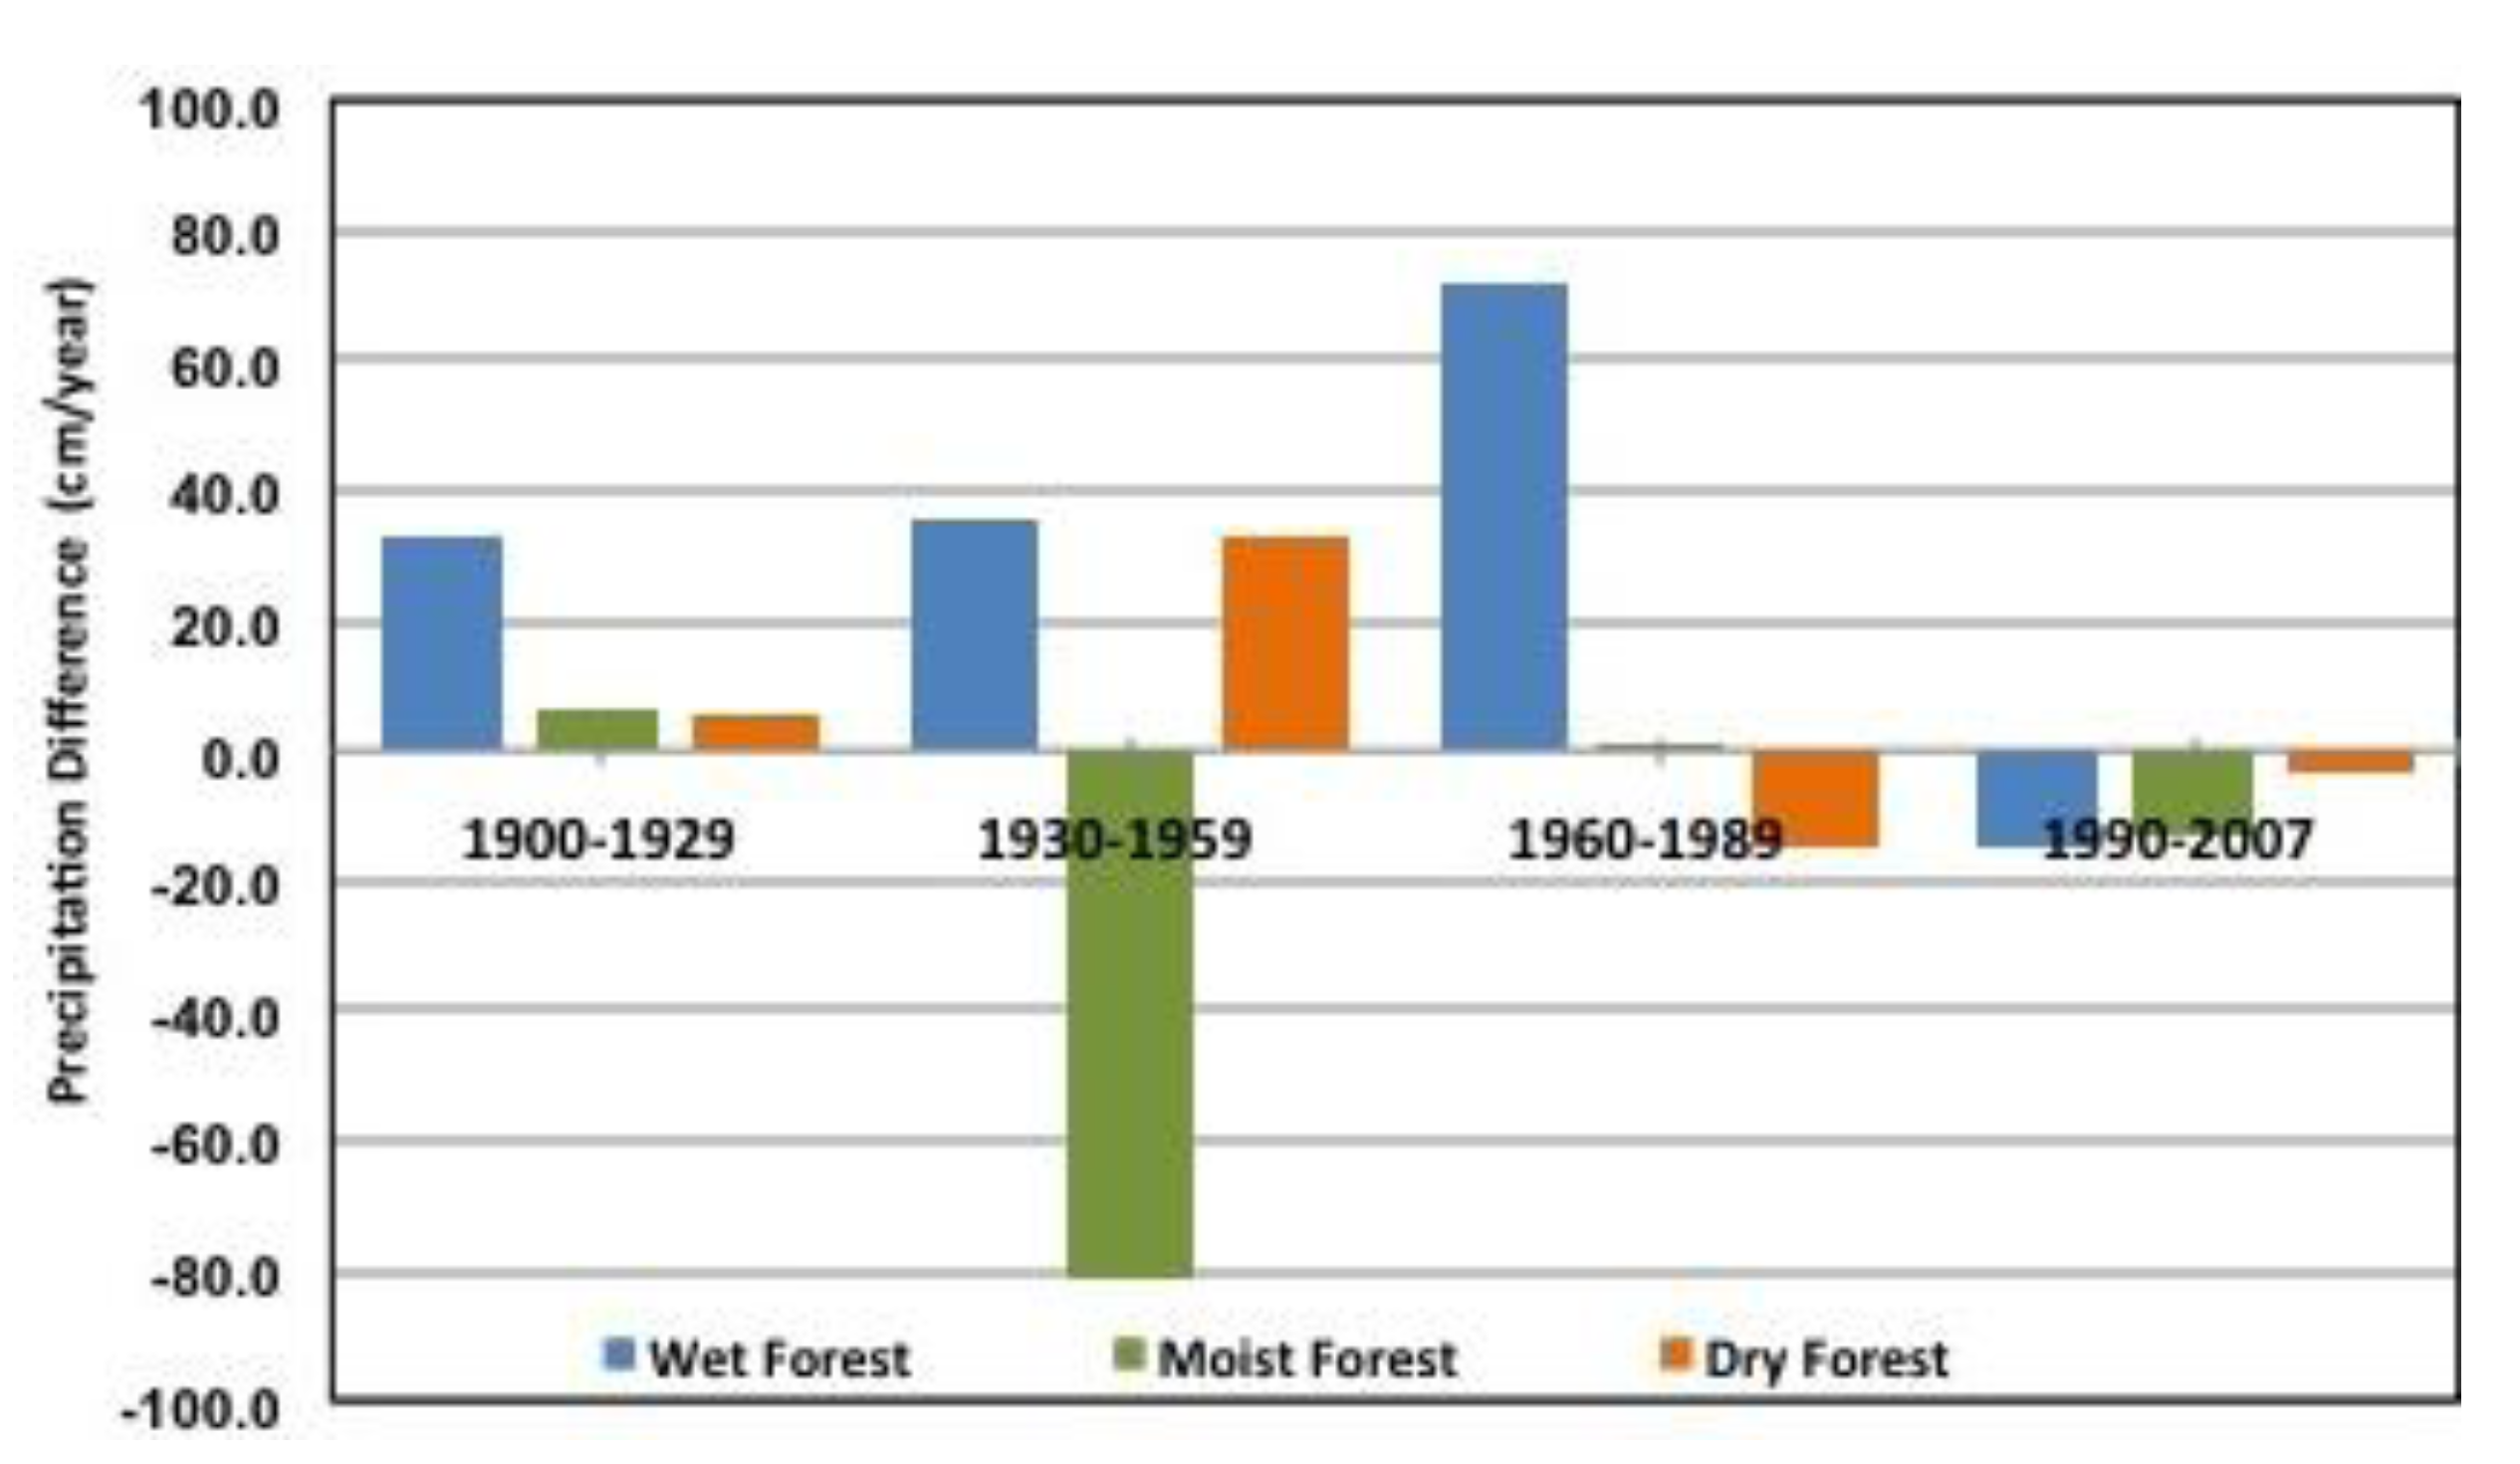
Yearly average total precipitation urban vs. non-urban difference.
Figure 25.
Yearly average total precipitation urban vs. non-urban difference.
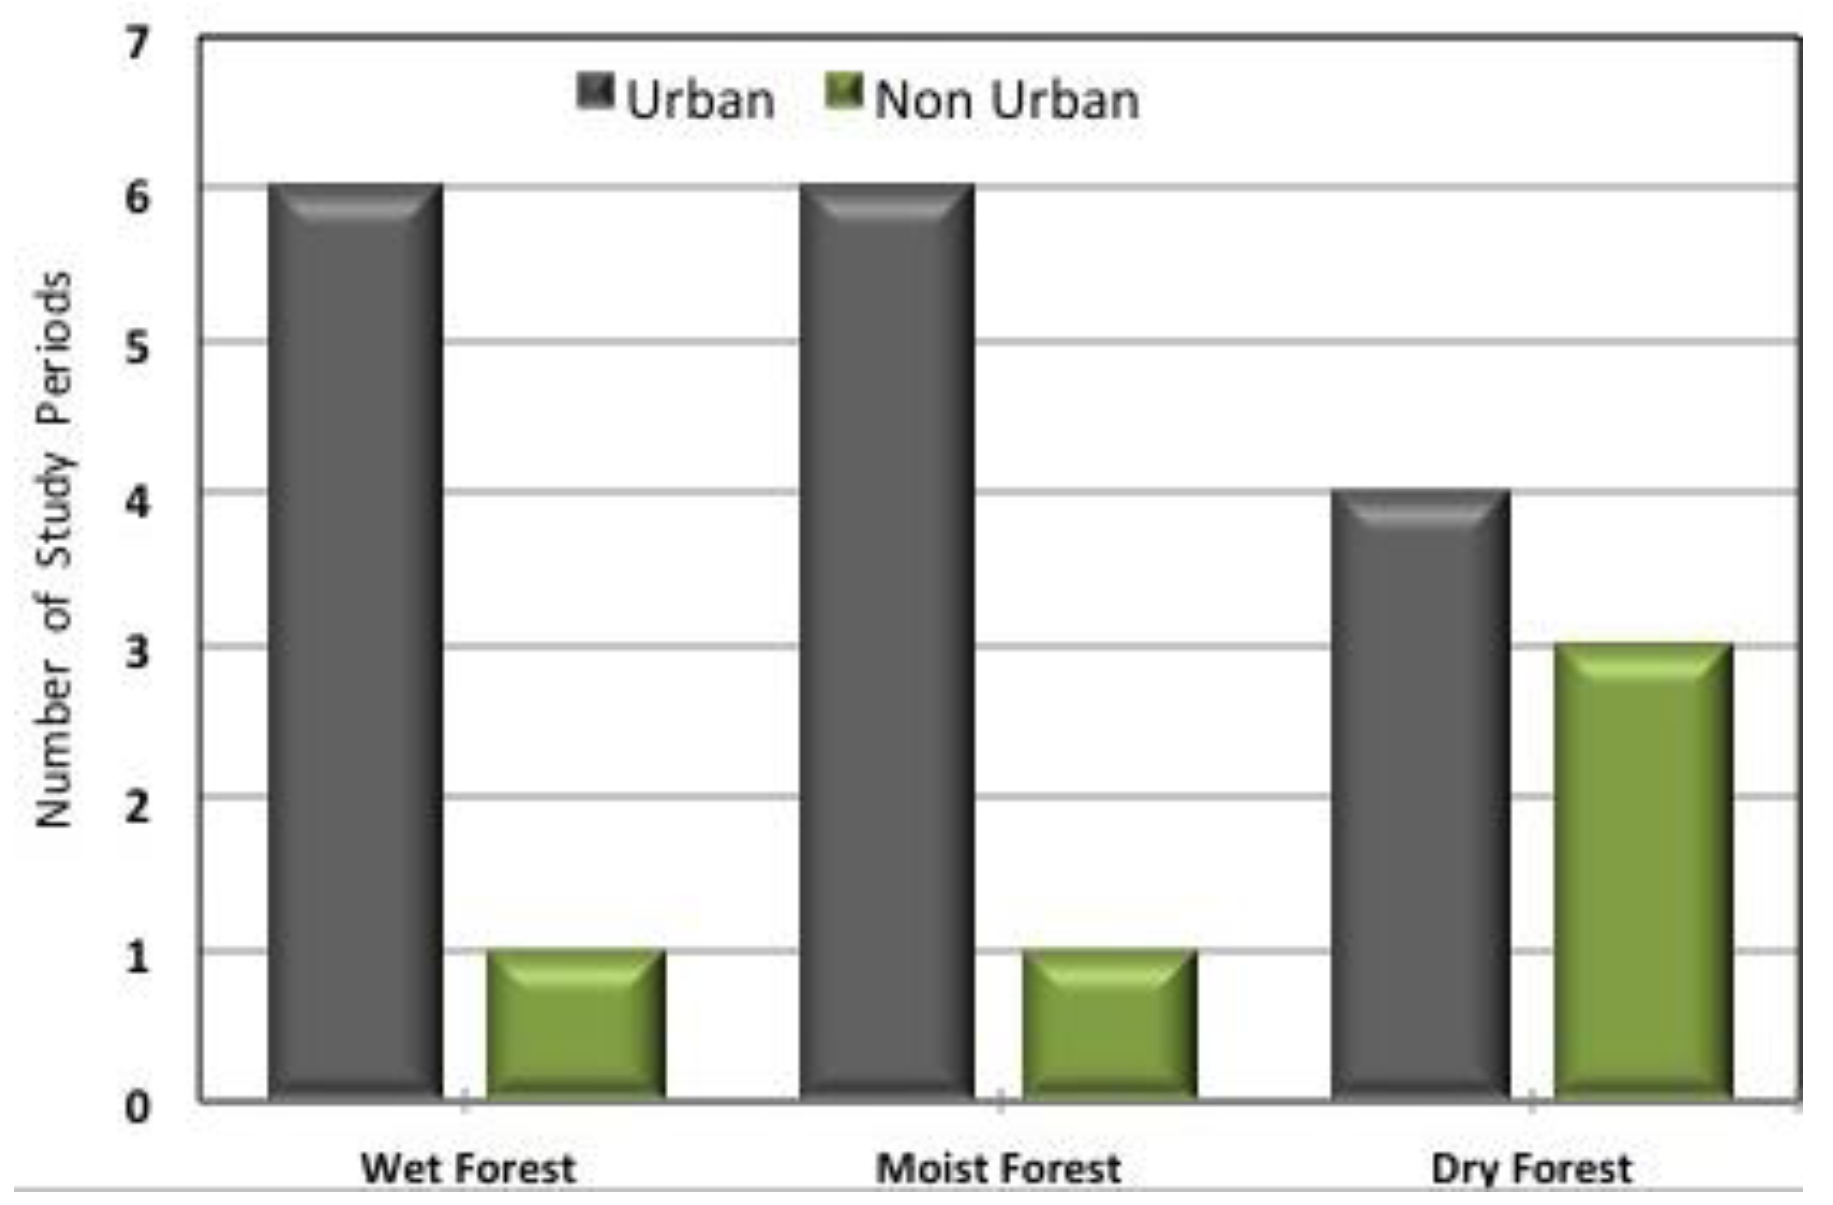
Figure 26.
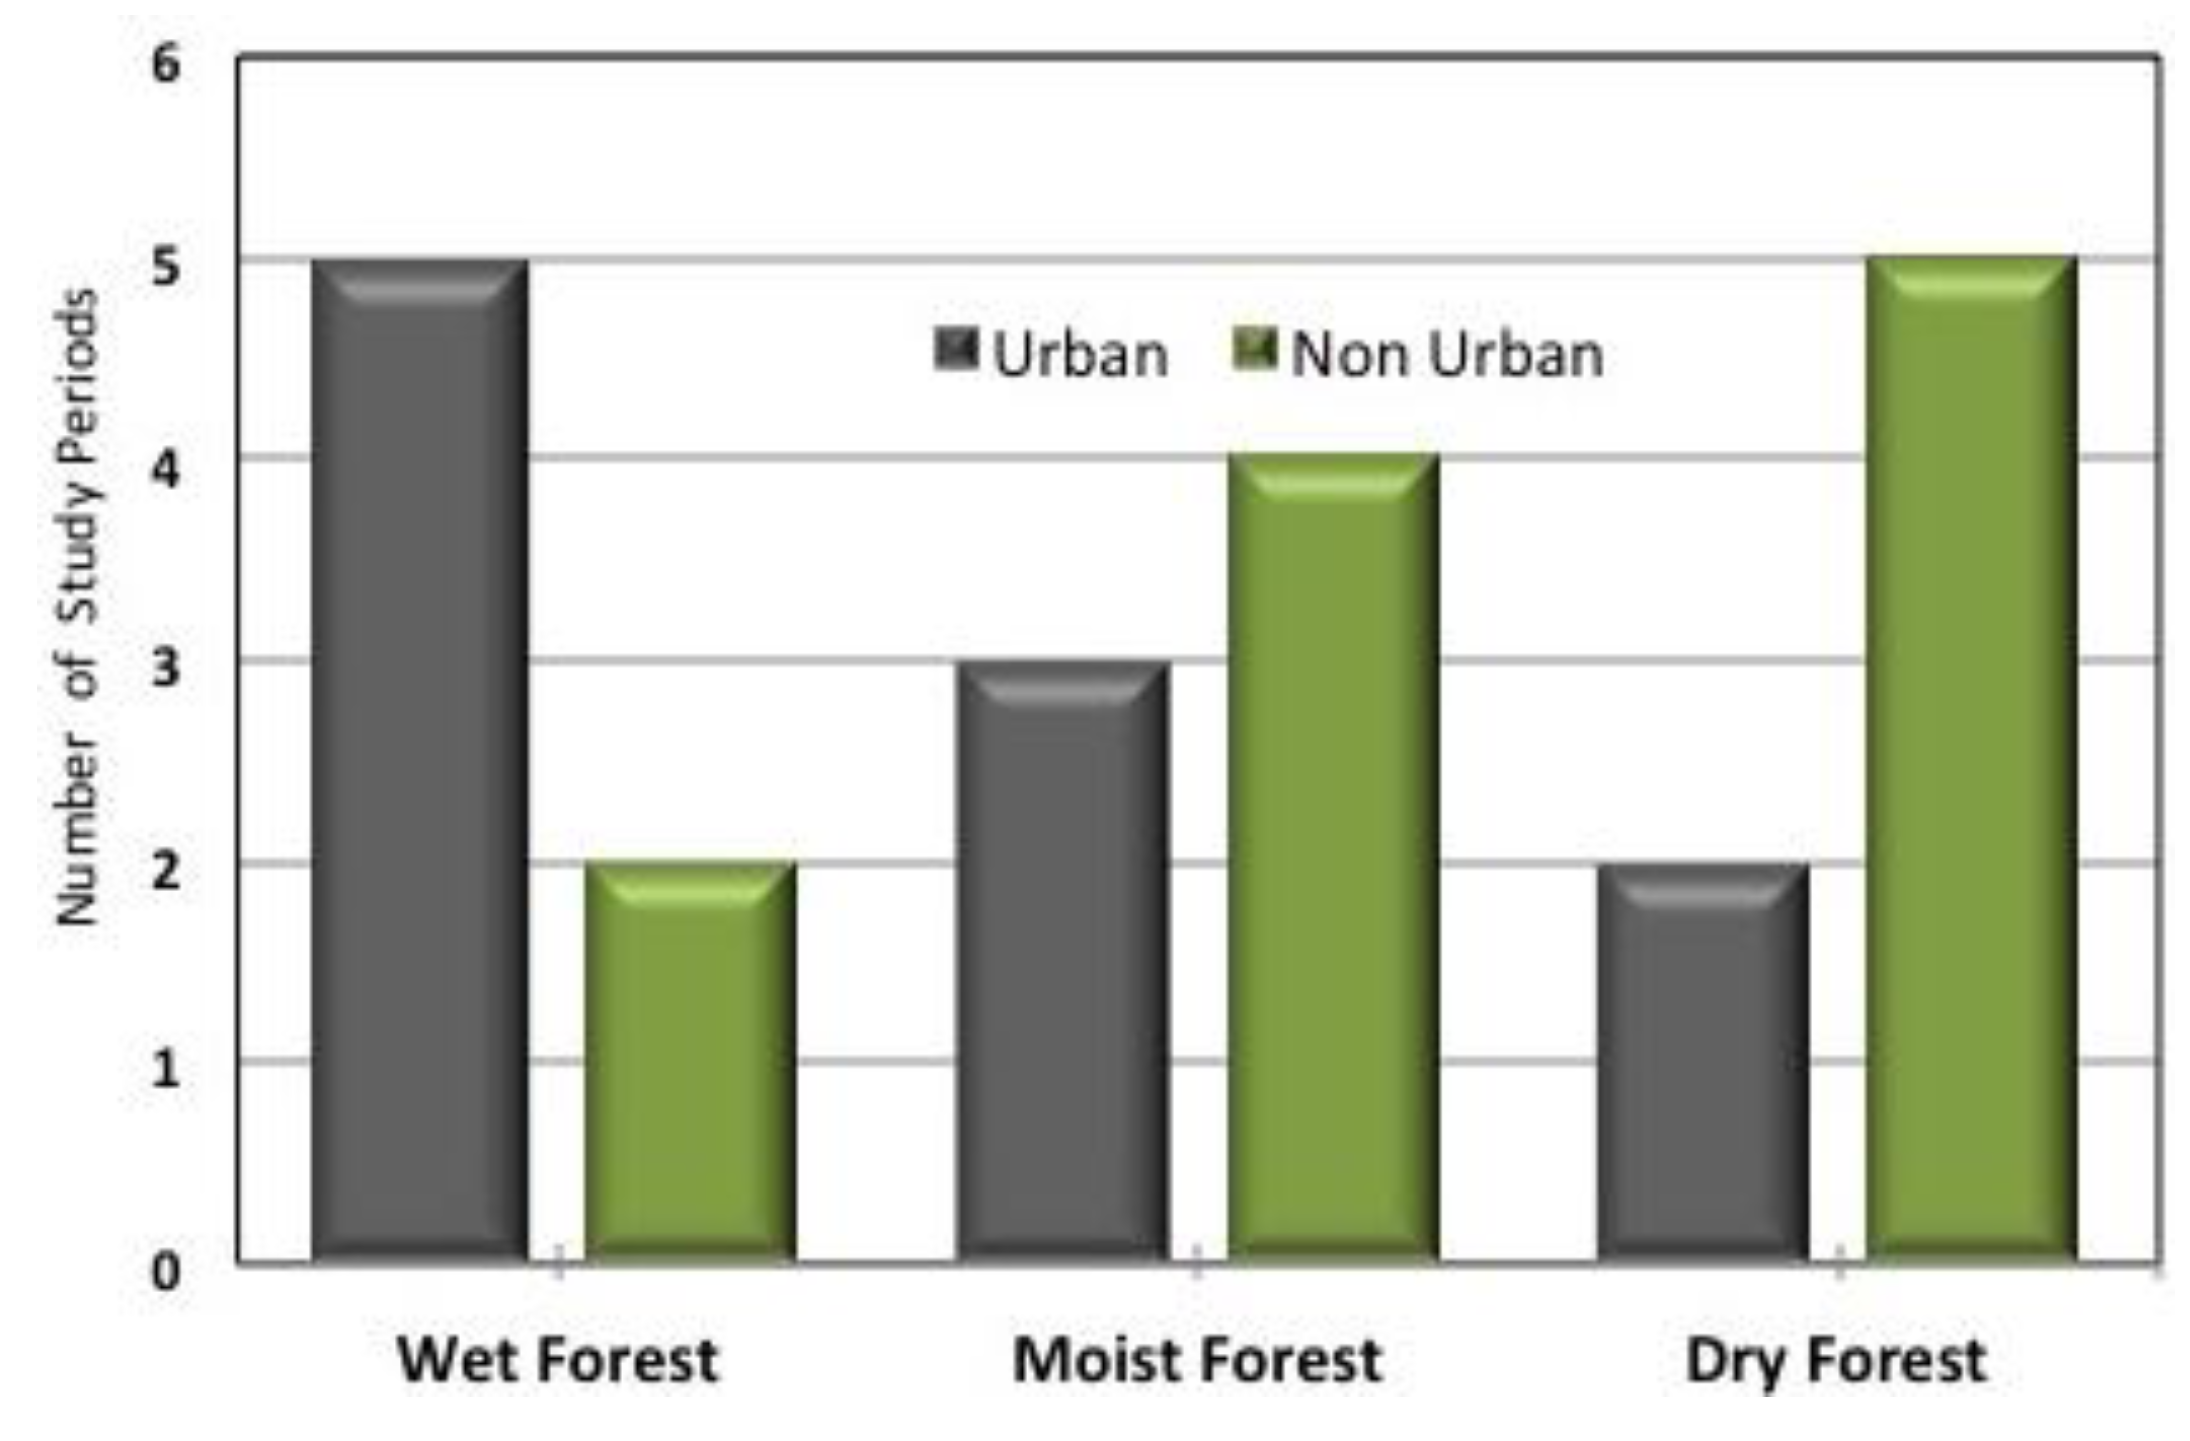
Number of study periods receiving higher yearly average urban vs. non-urban total precipitation.
Figure 26.
Number of study periods receiving higher yearly average urban vs. non-urban total precipitation.
We also found statistical differences between urban
vs. non-urban yearly average total precipitation trends but this relationship does not remain constant across periods and occurs in both directions in all HELZs (
Table 10 and
Table 11). Higher urban trends prevail in most periods in the Wet Forest and Moist Forest HELZs (
Figure 27). Higher urban trends in the Wet Forest had a direct relationship consistent with this HELZ receiving more average total rain than its non urban counterpart as earlier discussed and may indicate the higher sensibility of this HELZ to urban development. Meanwhile the dominance of higher urban trends in the Moist Forest contrasts urban
vs. non-urban average totals findings that showed more even split across study periods (
Figure 26 and
Figure 27). The Dry Forest also contrasts average totals findings by showing a more even urban
vs. non-urban trends split in the opposite case (
Figure 26 and
Figure 27). The relationships found in the Moist Forest and Dry Forest urban and non-urban trends by periods, may be indicative of a future shift related to urban development in both regions as they are the two most urbanized HELZs in the island.
Table 10.
The 270 m grid cell yearly average total precipitation trends for each period and its corresponding urban vs. non urban T test significance values.
Table 10.
The 270 m grid cell yearly average total precipitation trends for each period and its corresponding urban vs. non urban T test significance values.
| | 1900–1929 cm/year | 1930–1959 cm/year | 1960–1989 cm/year | 1990–2007 cm/year | 1963–1995 cm/year | 1979–2005 cm/year | Century cm/year |
|---|
| | U | NU | Sig. | U | NU | Sig. | U | NU | Sig. | U | NU | Sig. | U | NU | Sig. | U | NU | Sig. | U | NU | Sig. |
|---|
| WF | −0.008 | −0.015 | 0.000 | 0.133 | 0.026 | 0.000 | −0.132 | −0.195 | 0.000 | −0.710 | −0.451 | 0.000 | −0.104 | −0.135 | 0.000 | −0.139 | −0.664 | 0.000 | −0.041 | −0.043 | 0.000 |
| MF | −0.013 | −0.018 | 0.000 | 0.005 | 0.006 | 0.413 | −0.009 | −0.090 | 0.000 | −0.120 | −0.163 | 0.000 | −0.048 | −0.115 | 0.000 | −0.109 | −0.187 | 0.000 | −0.044 | −0.050 | 0.000 |
| DF | −0.007 | −0.016 | 0.000 | −0.040 | −0.052 | 0.000 | −0.274 | −0.270 | 0.389 | 0.025 | −0.002 | 0.000 | −0.182 | −0.162 | 0.000 | −0.066 | −0.064 | 0.467 | −0.042 | −0.069 | 0.000 |
Table 11.
The 100 m Grid Cell Yearly Average Total Precipitation Trends for each period and its corresponding Urban vs. Non urban T test significance values.
Table 11.
The 100 m Grid Cell Yearly Average Total Precipitation Trends for each period and its corresponding Urban vs. Non urban T test significance values.
| | 1900–1929 cm/year | 1930–1959 cm/year | 1960–1989 cm/year | 1990–2007 cm/year | 1963–1995 cm/year | 1979–2005 cm/year | Century cm/year |
|---|
| | U | NU | Sig. | U | NU | Sig. | U | NU | Sig. | U | NU | Sig. | U | NU | Sig. | U | NU | Sig. | U | NU | Sig. |
|---|
| WF | −0.008 | −0.019 | 0.000 | 0.134 | 0.029 | 0.000 | −0.133 | −0.198 | 0.000 | −0.762 | −0.464 | 0.000 | −0.100 | −0.136 | 0.000 | −0.142 | −0.675 | 0.000 | −0.039 | −0.071 | 0.000 |
| MF | −0.015 | −0.023 | 0.000 | −0.003 | 0.009 | 0.000 | 0.011 | −0.094 | 0.000 | −0.120 | −0.166 | 0.000 | −0.030 | −0.121 | 0.000 | −0.098 | −0.191 | 0.000 | −0.040 | −0.045 | 0.000 |
| DF | −0.011 | −0.023 | 0.000 | −0.038 | −0.053 | 0.000 | −0.287 | −0.273 | 0.000 | 0.019 | −0.003 | 0.000 | −0.194 | −0.163 | 0.000 | −0.072 | −0.069 | 0.052 | −0.045 | −0.052 | 0.000 |
Figure 27.
Number of study periods recording higher urban vs. non-urban precipitation trends.
Figure 27.
Number of study periods recording higher urban vs. non-urban precipitation trends.
6. Conclusions
Precipitation has been decreasing in Puerto Rico for most of the century and in all HELZs, particularly before 1970, a period in which monthly average and median curves are relatively consistent (
Figure 3). Seasonally, Wet Season Precipitation amounts have been decreasing in all HELZ through the century but the Dry Forest have been the HELZ with the highest and most notable Dry Season precipitation increase (
Figure 18). However, a different pattern emerged after 1970 with average monthly and median precipitation curves showing more separation, particularly in the Dry Forest HELZ. The Dry Forest is the only HELZ where urban precipitation has been increasing recently (
Figure 24). This new pattern could well be the effects of new climate or just the first half of the 30-year period receiving higher precipitation that precedes the second half of the period of decreasing similar to the one that dominates all 30-year periods of the analysis.
We found evidence that urban development has impacted local precipitation based on an urban effect on local precipitation detected by GIS generated data analysis. However, this impact was not detected directly from station data analysis. Finding some urban impacts from the beginning of the century was unexpected. Some HELZs receive more precipitation over urban areas than over non-urban areas while others behave opposite to this. Further, this relationship is not constant and is reversed in some periods (
Table 8 and
Table 9). Precipitation over urban areas dominates in the Wet Forest while precipitation over non-urban areas dominates in the Dry Forest (
Figure 24). These findings were also unexpected. The Wet Forest is mostly forested and urban development is virtually nonexistent, however it may reveal a higher sensitivity or response to urban impacts than other HELZs. On the other hand, the Dry Forest is the driest, warmest and most lightly forested region of the island where urban development is not as intensive and widespread as in the Moist Forest. This condition could increase urban precipitation because of increased surface roughness and convection.
In addition, this work has provided an effective new approach that could be used by small islands to assess LULCC impacts on the local climate. This method could be applied to any climate variable and any land use or land cover type using station dada, GIS tools and analysis of variance.
Future research should consider rainfall intensity variation across landscapes as well as the distinction between types or sources of rainfall. Comparison of long-term climatological changes with insight provided by modeling the impacts of LULCC on individual events may also provide insight into the causes for changes in long-term climatology, but such work is its early stages [
48]. Such comparisons may also provide a basis for examining the impacts of urbanization on adjacent downwind areas. Radar and satellite studies would also be helpful to examine the scattered nature of rainfall and to address the limitation inherent in working with station data that may not accurately capture the widespread nature of precipitation. In addition, we recommend the use of adjusted and filtered data to isolate locally generated events from synoptic events and standardized land cover vegetation classification for climate and ecological research. Finally, as a next stage in this research, we recommend use of earlier Land Cover maps that have recently come available in digitized form [
14]. This would extend the analysis since in the absence of these maps this study assumed that the current urban developed area was unchanged throughout the entire century, resulting in an overestimation of the amount of urban area or pixels that existed at the beginning of the century that may in turn explain some unexpected results for the periods early in the century.

